Abstract
Decarbonization of ship power plants and reduction of harmful emissions has become a priority in the technological development of maritime transport, including ships operating in seaports. Engines fueled by diesel without using secondary emission reduction technologies cannot meet MARPOL 73/78 Tier III regulations. The MEPC.203 (62) EEDI directive of the IMO also stipulates a standard for CO2 emissions. This study presents the results of research on ecological parameters when a CAT 3516C diesel engine is replaced by a dual-fuel (diesel-liquefied natural gas) powered Wartsila 9L20DF engine on an existing seaport tugboat. CO2, SO2 and NOx emission reductions were estimated using data from the actual engine load cycle, the fuel consumption of the KLASCO-3 tugboat, and engine-prototype experimental data. Emission analysis was performed to verify the efficiency of the dual-fuel engine in reducing CO2, SO2 and NOx emissions of seaport tugboats. The study found that replacing a diesel engine with a dual-fuel-powered engine led to a reduction in annual emissions of 10% for CO2, 91% for SO2, and 65% for NOx. Based on today’s fuel price market data an economic impact assessment was conducted based on the estimated annual fuel consumption of the existing KLASCO-3 seaport tugboat when a diesel-powered engine is replaced by a dual-fuel (diesel-natural gas)-powered engine. The study showed that a 33% fuel costs savings can be achieved each year. Based on the approved methodology, an ecological impact assessment was conducted for the entire fleet of tugboats operating in the Baltic Sea ports if the fuel type was changed from diesel to natural gas. The results of the assessment showed that replacing diesel fuel with natural gas achieved 78% environmental impact in terms of NOx emissions according to MARPOL 73/78 Tier III regulations. The research concludes that new-generation engines on the market powered by environmentally friendly fuels such as LNG can modernise a large number of existing seaport tugboats, significantly reducing their emissions in ECA regions such as the Baltic Sea.
1. Introduction
Modern environmental standards in transport have brought about technologies that reduce emissions of toxic components and greenhouse gases such as CO2 and increase the energy efficiency indicators of power plants. The problem of decarbonization is as relevant for the maritime sector as for land transport, which accounts for up to 80% of all harmful emissions into the atmosphere. Despite the increased energy efficiency of maritime transport, shipping is still responsible for approximately 940 million tons of CO2 annually. The future environmental impact of ships will increase due to an increase in global fleet size and the associated consumption of almost exclusively fossil fuels (90–95%). In this regard, along with the existing restrictions on emissions of the most toxic components, NOx and SO2, the IMO adopted amendments to MARPOL Annex VI (Resolution MEPC.203 (62)) that introduced the CO2 emission limitation indicator known as the energy efficiency design index [1]. According to the IMO MEPC.203 (62) resolution, the EEDI CO2 reduction level for the first phase was set to 10%, to be increased every five years to keep pace with technological developments in efficiency and reduction measures. Reduction rates have been established for 2025 and onwards, when a 30% reduction is mandated for applicable ship types from a reference line representing the average efficiency of ships built between 2000 and 2010 [2].
Air pollution in ports of the Baltic Sea and adjacent urban areas is most affected by emissions from ships arriving in port and the ships permanently operating in the port area [3]. One of the most successful measures to improve ecology and energy efficiency in heavy transport, including maritime transport is the use of low-carbon fuels (natural gas (NG), biogas (BD) with hydrogen, and Brown’s gas impurities) and secondary energy sources in the cogeneration cycle. Replacement diesel-powered engines to natural gas-powered engines reduces NOx by 85–90% CO2 emissions by 10–20%, and removes particulate matter PM and sulphur oxides SO2 from exhaust gases almost completely [4]. Compared to petroleum-derived fuels, the carbon-to-hydrogen (C/H) ratio in the chemical composition of NG is theoretically 25% more favourable in terms of reducing CO2 emissions [5,6]. The MARPOL 73/79 VI annex standard Tier III norms were achieved in a Wärtsilä company average revolution 20DF ship engine when the engine operated with an NG fuel feed, without using secondary emission reduction technologies (such as selective catalytic reduction technology). Multi-purpose vessels (non-gas carriers) operated by the global fleet, passenger ships, tankers, multipurpose vessels, and short sea vessels are increasingly equipped with dual-fuel and NG-fueled power plants [7].
The energy efficiency of new dual-fuel engines from market-leading companies (Wärtsilä, MAN Diesel & Turbo, Caterpillar, etc.) is not inferior to the efficiency of diesel-powered engines and reduced harmful emissions [8,9,10], which meets the requirements of environmental standards without the use of expensive secondary technologies [11,12,13,14].
Most experimental and mathematical modeling research on the use of natural gas in internal combustion engines, is based on complex experimental studies and mathematical modelling of the internal processes of cylinders, considering the influence of the injection phase on the combustion dynamics of the working mixture [15]. investigated the physical mechanism, the factors that determine the chemical kinetics of diesel, gas, and ambient air in an engine cylinder, and the dynamics of processes in the cylinder.
A distinctive feature of most of the earlier experimental studies mentioned above is their use of laboratory conditions. Investigation of the engine parameters corresponds to the reference characteristics of the load, which undergo significant changes in actual operating conditions. In addition, research that evaluates diesel reading changes under operational conditions uses passive properties as a rule, without conducting experiments. Little research has been done on environmental impact studies according real engine load data, when marine diesel engines are converted to run on dual-fuel or only natural gas. Including studies evaluating the reduction of emissions of harmful components regulated by IMO standards of ships operating in seaports when diesel-powered engines are converted to run on dual fuel (diesel-natural gas).
The results of previous studies when diesel-powered engines of ships are converted to run on natural gas are similar. The main differences between the studies carried out are that the assessment of the ecological impact was carried out for short-voyage high-power passenger ships. The ecological impact assessment was not based on actual engine load data, but on Environmental Protection Agency (EPA)-regulated methodology. The environmental and the economic benefits of using natural gas as an alternative to diesel oil on board one of the high-speed passenger ships operating in the Red Sea area between Egypt and the Kingdom of Saudi Arabia. The study illustrated that NOx, SOx, particulate matter, and CO2 emissions were reduced by 72%, 91%, 85%, and 10%, respectively. In addition, the cost of both fuel consumption and maintenance operation demonstrated reductions by 39% and 40%, respectively [16].
Numerical analysis of environmental and economic benefits of the dual-fuel (diesel-natural gas) engine was performed for a container ship of class A7 owned by Hapag-Lloyd. The results show that the proposed dual-fuel engine achieves environmental benefits for reducing carbon dioxide CO2, nitrogenoxides NOx, sulfur oxides SOx, particulate matter PM, and carbon monoxide CO emissions by 20.1%, 85.5%, 98%, 99%, and 55.7% with cost effectiveness of 109, 840, 9864, 27761, and 4307 US$/ton, respectively [17].
Scientific publications pay little attention to research into the environmental impact of LNG use at the scale of ships’ regions or seaports, which would be particularly important in IMO-regulated SECAs and NECAs.
Conditions are currently favourable for using NG as an eco-fuel for ships especially for those operating in seaport area. Liquefied natural gas (LNG) infrastructure is developing rapidly [18]. LNG storage facilities are being built and operated in the Baltic Sea region, one of which is in the port of Klaipėda [19]. As mentioned above well-known engine manufacturers such as Wartsila have started to produce engines fueled by LNG [20]. According to European seaport statistics, seaport tugboats are responsible for an average of 8–14% of the annual air pollution, including the seaport of Klaipėda, the annual air pollution from tugboats accounts for 7.7% of SO2 emissions, 19% of CO2 emissions, and 14% of NOx emissions from all ships [21]. These are significant air pollution indicators that must be reduced.
The aim of this study is to assess the environmental impact using actual seaport tugboat engine load data when a diesel engine is converted to run on natural gas by perform experimental-mathematical modelling. Based on the results of fuel consumption the economic impact of using different type of fuels (diesel, natural gas) on tugboat operating fuel consumption costs was also assessed.
Based on the analysis of the literature, a widespread type of tugboats operating in seaports was selected as the object of research. The environmental impact assessment region consists of the ports of the Baltic Sea where tugboats operate.
2. Methodological Aspects of Research
The first stage of research is the determination of the ecological effect when a CAT 3516C diesel-powered engine is replaced by a dual-fuel (diesel-natural gas)-powered engine Wartsila 9L20DF in a typical KLASCO-3 seaport tugboat. Actual engine load cycle and marine fuel consumption data were used for these calculations. The energy and ecological parameters of the engines were determined from the experimental data of the CAT 3512 engine prototype and the results of mathematical modelling to ensure a level playing field with the comparative propulsion characteristics of the Wartsila 9L20DF dual-fuel engine [22].
In the second stage of the research, operating costs for fuel are estimated for the seaport tugboat KLASCO-3 when diesel fuel was replaced by natural gas and the ecological impact for the entire tugboat fleet operated in Baltic Sea ports was assessed using approved methodological solutions. To determine the changes in NOx emissions, the fleet of tugboats was classified according to displacement, engine power parameters, and year of manufacture in accordance with MARPOL 73/78 ANNEX VI for Tier I, II, and III NOx restriction standards.
2.1. Research Objects
In the first phase of the research the statistical analysis of tugs was performed in order to identify the typical seaport tugboat, which would be the most common in the Baltic Sea region in terms of power and geometric characteristics.
Following the statistical analysis of tugboats in the Baltic seaport region, 217 tugboats were identified. The analysis included the Stockholm, Rostock, Klaipėda, Kiel, Gdansk, Venspils, Turku, Riga, and Hamina seaports, and other ports in the Baltic Sea region. Figure 1 presents the distribution of the tugboats according to their length, beam, and draft of the hull.
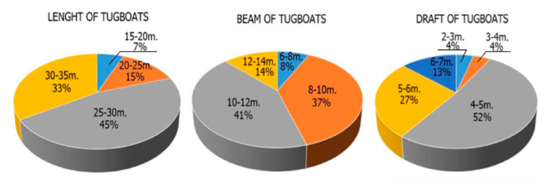
Figure 1.
The distribution of main geometrical characteristics of tugboats in the region of Baltic Sea.
Type of seaport tugboats as KLASCO-3 that operating in seaport of Klaipėda is a typical tugboat operating in the ports of the Baltic Sea region [23]. Hence, the outcomes of this research can be applied to a number of other sea port tugboats in the region of Baltic Sea. One of these type of tugboats KLASCO-3 are shown in Figure 2.
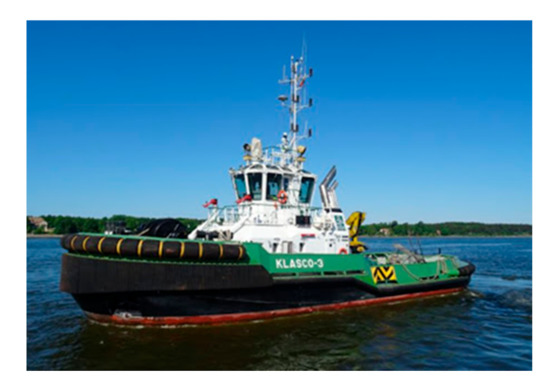
Figure 2.
Tugboat in seaport of Klaipėda KLASCO-3.
Based on the statistical data, most of the fleet were within the following specifications: length: 25–30 m (45%); beam: 10–12 m (41%); draft: 4–5 m (52%). Seaport tugboat KLASCO-3 falls into these categories. The main specifications of the KLASCO-3 seaport tugboat are given in Table 1.

Table 1.
The main specifications of seaport tugboat “KLASCO-3” [24].
Seaport tugboats must ensure safe towing of ships, firefighting operations, mooring, and operation in stormy weather conditions. Thus, tugboats must have powerful, dynamic and reliable engines [25,26]. High power density diesel engines with frequent and large load changes result in high specific emissions of harmful species such as CO2, SO2, NOx, and particles into the atmosphere. Thus, emissions reduction from tugboat engines is of significant importance in seaports and adjacent areas. One option for reducing diesel engine emissions is replacing conventional diesel fuel with a more environmentally friendly type of fuel such as natural gas.
The diesel-powered CAT 3516C engine [27] installed in a KLASCO-3 tugboat and a market-leading Wartsila 9L20DF dual-fuel engine were selected as the research objects for the comparative environmental parameter assessment.
The CAT 3516C on KLASCO-3 is to be replaced with a dual-fuel, Wartsila 9L20DF. Both engines are shown in Figure 3.
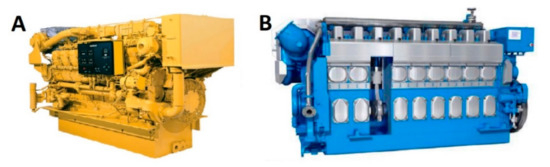
Figure 3.
(A) Existing engine, CAT 3516C. (B) New engine, Wartsila 9L20DF.
Table 2 presents the main parameters of the engines.
Table 2.
The main characteristics of the engines CAT 3516C and Wartsila 9L20DF.
The Wartsila 9L20DF engine was chosen because it is powered by diesel and natural gas and complying with Tier III requirements [28]. The Wartsila 9L20DF is most similar to the CAT 3516C engine in terms of power density, dimension and performance characteristics.
2.2. Tools of Mathematical Modeling
A wide range of engine loads and speeds based on propeller performance were determined by mathematical modelling. Manufacturer data define the engine load from a maximum power of 100% to 50% or limited by the combination of revolutions, power and specific effective diesel consumption [26,29]. The IMPULS program was used for mathematical modelling of tugboat engines. The IMPULS program, developed at the Central Diesel Research Institute in St. Petersburg it has been successfully used in the development and modification of high-speed transport engines (15/15, 15/18, 16.5/18, other) [30,31]. The program realizes a closed model of a diesel engine with and without inflated work process, based on quasi-static equations of thermodynamics and gas dynamics, considering the parameters of the exhaust system design, variable gas turbine, compressor efficiency coefficient, heat losses to the engine cooling system, and ambient air parameters. The single-phase mathematical model was used in the research of engine energy parameter simulations was implemented with software “IMPULS”. The structure of this software is constantly improving and supplemented by sub-models of the working fuel mixture in the cylinder formation and combustion, assessing the dynamics of fuel injection, evaporation, flame spread; use of fuels with different chemical elemental composition, etc. Most of the phenomenological sub-models implemented in the program are similar with other the widely used software AVL BOOST: heat isolation is realized by the Wiebe model with additions by G. Woschni, which are widely used in the ICE work-process modelling study [32,33,34,35]. The mathematical model was supplemented and modified for the modelling of a dual- fuel engine. A software block was added to calculate the energy mix of the work mixture (specific heat, enthalpy, internal energy, and lower calorific value) according to the actual elemental composition of the dual fuel.
The operating modes calculated from the tugboat load cycle data range from 100% to 2% (when the tugboat is in “hot reserve”) of maximum power. The data used for the mathematical modelling of the 9L20DF motor function range from 100% to 50% of the maximum power.
According to experimental data, the CAT 3516C engine is analogous to the CAT 3512. Two simulations of the 9L20DF engine were conducted: dual-fuel, when the ratio of gaseous fuel to diesel was 97% (Tier 3), and diesel fuel only (Tier 2).
The experimental and mathematical model data showing the correspondence of mathematical models by the diesel engine prototype CAT 3512 whose experimental data were used as a prototype for engine CAT 3516C [36]. Correspondence of mathematical models when the engines works according propulsive characteristic are presented in Table 3.
Table 3.
Mathematical model of the CAT 3516C diesel engine.
To ensure a level playing field for the engines, a data propeller performance diagram of the modelled tugboat was used. The diesel engine CAT 3516C is calculated as a 9L20DF model with a maximum power of 1665 kW.
Emissions of harmful components NOx, SO2 and CO2 were determined on the basis of fuel consumption data. Validation of comparable engines for fuel consumption used in the calculations was performed using experimental data.
The results of simulating the dual-fuel 9L20DF engine energy parameters with diesel fuel (Tier 2 mode) and gas fuel (Tier 3 mode) comparisons with Wartsila company data are presented in Table 4 and Table 5.
Table 4.
Wartsila 9L20DF energy parameters in diesel (Tier2) mode.
Table 5.
Wartsila 9L20DF energy parameters in diesel and gas (Tier 3) mode.
The difference between the basic energy parameters of the diesel engine, determined by the experiment and the mathematical modeling method, does not exceed 2 ÷ 3 %.
2.3. Calculation of Harmful Emission Components CO2, SO2 and NOx
2.3.1. Assessment of CO2 Emission
CO2 emissions in a power plant’s exhaust are determined by the elemental composition of the fuel used and the fuel consumption. The carbon content in the marine gas oil (MGO) was taken as 0.87. The oxygen–carbon fusion theory is used to calculate the annual CO2 emissions of CAT 3516C engines, as shown in Equation (1).
where, -fuel consumption per year, kg.
Equation (2) shows the CO2 emission factor of the KLASCO-3 tugboat when the main engine is replaced by a Wartsila 9L20DF fueled by LNG with a carbon concentration of 0.75:
2.3.2. Assessment of SO2 Emission
SO2 emissions in engine exhaust depend on the sulfur content of the fuel and fuel consumption. SO2 is formed from the reaction of sulphur contained in the fuel with oxygen in the engine combustion chamber as shown in Equation (3).
where, -sulphur content in percentage, for MGO, = 0.1% [37], -fuel consumption per year, kg.
2.3.3. Assessment of NOx Emission
NOx emissions from the engine are primarily determined by fuel combustion parameters, temperature, temperature field uniformity, and cylinder air supply.
The assessment of NOx emissions from engines is regulated in Annex VI of MARPOL 73/78; Equation (4) from the MARPOL 73/78 Annex VI was used to determine NOx emissions from both Wartsila 9L20DF and CAT 3516C engines [38].
where:
- -specific NOx emission of g/kWh
- -specific NOx emission of g/kgfuel.
- Gf-fuel consumption, kg/h
- Pei-engine power under load
- wi-Weighting factor
The final formula for NOx emissions in g/h is expressed Equation (4) as:
3. Research Results and Their Discussion
3.1. Determination of Structure of Seaport Tugboat Operating Engine Load Cycle Structure
The amounts of harmful CO2, SO2, and particle emissions depend on the chemical composition of the fuel and the amount of fuel consumed [39]. NOx emissions depend on the organization of the combustion process in the engine cylinder [40]. NOx is formed in the high-temperature zone by a chain mechanism of chemical reactions. The main conditions for the formation of NOx in internal combustion engines are: a mixture of nitrogen and oxygen (with sufficient oxygen as the oxidizer), a high combustion temperature, sufficient time for the reaction to occur, and the necessary cooling intensity of the engine [41]. All of these conditions depend directly on the engine load cycle. Modern marine diesel engines contain an engine control unit (ECU) that captures different operational parameters of the engine over time, including engine loads. Figure 4 shows a comparison of the annual operational time against load for KLASCO-3 and Wartsila engines. The data for KLASCO-3 was captured by the ECU of the engine; the data for the Wartsila engine was taken from the seaport tugboat statistics.
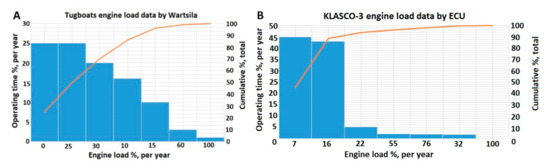
Figure 4.
(A) Tugboats engine load data by Wartsila. (B) KLASCO-3 engine load data by ECU.
At first glance, the difference between the load diagrams (which are based on a Pareto diagram) of tugboats is determined by two main factors: the principle of forming diagrams—the arrangement of load classes in ascending/descending order of relative time and the different values of comparative load classes of statistical and real data of KLASCO-3 tugboat (e.g., according Wartsila load data: 0%, 10%, 15%, 25%, 30% and actual KLASCO-3 load data: 7%, 16%, 22%, 32%, etc.). The real difference is minimized if the load classes (rather than the relative time classes) are arranged in descending/ascending order with the calculated time intervals. According to statistics, the working time of the tugboats from 0% to 10% load is 41%, and the KLASCO-3 tugboat (up to 7% of the load) is 45%. Loads up to 30% according to statistics was 96%, and for KLASCO-3 (up to 32% of load) was 94%. According to statistics, up to 60% of the load is 98% and load of KLASCO-3 96%, respectively. The time of operation of tugboats at rated power does not exceed 1%. According to the statistical and actual seaport tugboat engine load data, it is observed that the main loads are in the range from idle mode to 30% engine load. The difference between the static tugboat engine load factor (18%) and the load factor of the KLASCO-3 tugboat (14.5%) is acceptable. It is acceptable to assume the correspondence between the statistical and the actual engine load data of the seaport tugboat KLASCO-3.
Differences in load result from different operating conditions including weather conditions, size of the port area, size of vessels operated by tugboats, number of vessels operated by tugboats, and type of operations. For the other most common engine load modes, the difference is not large (see Figure 4). Therefore, we can state that the annual engine load data for the KLASCO-3 are in line with the general trend of tugboat engine load statistical data. Annual KLASCO-3 engine load data are valid for use in assessing the environmental performance parameters and the prospects for emissions reduction in the Baltic Sea region from replacing diesel fuel engines with new dual-fuel engines.
3.2. Evaluation of Environment Perforamcne Parameters for the Seaport Tugboat KLASCO-3
For comparison with the performance of the dual-fuel Wartsila 9L20DF engine, the propulsive characteristics of the CAT 3516C diesel engine have been recalculated to a nominal power of 1665 kW. The obtained results are presented in Table 6.
Table 6.
CAT 3516C diesel engine maximum power modeling parameters of 1665 kW.
The data presented in Table 6 provides the basis for accurately determining the diesel consumption by the operating profile of tugboat compared to a duel-fuel Wartsilla 9L20DF engine, already operating under the Tier 3 and Tier 2 modes (see Table 4 and Table 5).
The modeling of the energy performance of the dual fuel engine Wartsila 9L20DF was performed based on the data of the engine specification. The errors of the obtained modeling results when the engine is running on diesel fuel (meeting Tier 2 requirements) and dual fuel (diesel-natural gas) (meeting Tier 3 requirements) do not exceed 2–3%.
For the condition of equal engine loads in tow (Pe), the main comparable indicators of the engines were fuel consumption (Gf) used to determine CO2 emissions and emissions of toxic components NOx and SOx. Figure 5 shows a comparison of the fuel consumption of the Wartsila 9L20DF and CAT 3516C engines. It is observed that the Wartsila 9L20DF engine is more economical, except at loads close to idling operation. The Wartsila 9L20DF engine is more environmentally friendly than the CAT 3516C engine in terms of the type of fuel used and lower fuel consumption.
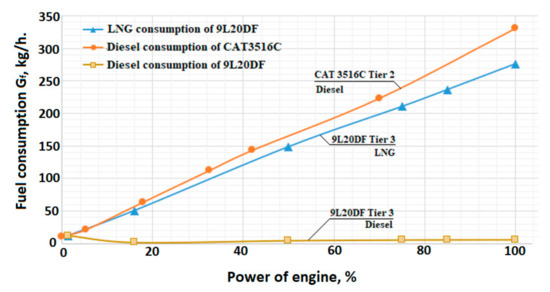
Figure 5.
A comparison of the fuel consumption according engine load of CAT 3516C and Wartsila 9L20DF engines.
To accurately estimate the annual emissions of CO2, SO2, and NOx, the actual annual engine load profile must be obtained to clearly identify the load modes in which a tugboat engine has been operating most often. The KLASCO-3 tugboat has two main engines, both are model CAT 3516C. The data from the ECU show an even distribution of the load between the two engines over a year. The load data from the port side engine is used for further emissions assessment. Table 7 shows the annual load profile data from the port side engine, recorded by the ECU of KLASCO-3.
Table 7.
Actual annual hourly load data of the port side engine on KLASCO-3 seaport tugboat.
The marked cells in Table 7 show the annual hours of the nine engine load modes used for the most hours during the year (engine mode (1) was running 741 h per year). The engine operating fields were generated (see Figure 6) according to the KLASCO-3 tugboat engine load modes recorded by the ECU (see Table 7).
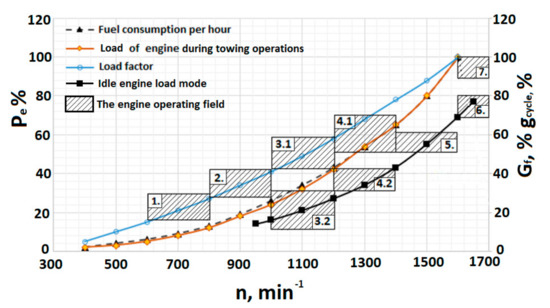
Figure 6.
Seaport tugboat KLASCO-3 engine load fields.
The data of Figure 6 were used to calculate the exact fuel consumption when the engine operates over a wide load range (from rated power to idle). The curve of power Pe and the curve of fuel consumption Gf are presented together in one graph because Gf is determined from the power and the power of engine is recorded by ECU unit.
Hourly fuel consumption (Gf) was used to calculate the cyclic portion of fuel injection (gcycle). The cyclic portion of fuel injection is interpreted as the load recorded by the engine ECU (see Figure 6). For convenience, the results obtained are expressed in relative terms at 100% of gcycle, effective power (Pe), and Gf corresponding to the rated power (see Table 6). The engine loads are shown separately in the dashed fields when the engine runs in towing mode and in idling engine load mode.
Based on the actual engine load data and operating fields (see Figure 6), the annual fuel consumption and weighting factor wi were determined for each load mode. For comparison, the annual engine load profile and operating conditions of CAT 3516C were used for the Wartsila 9L20DF engine.
3.2.1. KLASCO-3 Tugboat Engine Annual CO2 and SO2 Emission Assessment
CAT 3516C CO2 emissions per year are:
Hence, the Wartsila 9L20DF CO2 emissions per year are:
CAT 3516C SO2 emissions per year are:
As there is no sulphur in natural gas, SO2 emission from the Wartsila 9L20DF is from the pilot fuel. Wartsila 9L20DF SO2 annual emissions:
3.2.2. Wartsila 9L20DF and CAT 3516C NOx Emission Calculations According to KLASCO-3 Engine Load Modes
For CAT 3516C NOx emissions calculations, experimental engine power data under load from the CAT 3512B prototype engine was used, when the engine was operating under load conditions similar to the CAT 3516C engine [36]. The NOx emissions of the Wartsila 9L20DF engine were calculated based on the requirements of ISO 8178 E3 standards (ISO 8178). Data for specific NOx emissions , fuel consumption , and weighting factor according to the engine load modes of both engines are presented in Table 8.
Table 8.
Data of specific NOx emission, fuel consumption and weighting factor of CAT 3516C and Wartsila 9L20DF engines according engine load mode.
CAT 3516C NOx emission calculation according KLASCO-3 engine load profiles:
where (1)–(7) engine load modes according KLASCO-3 ECU data.
According to Table 7, it is evident how many hours a tugboat worked in different load modes (1–7) per year. For example, load mode (1) was used 741 h per year. To obtain the annual NOx emissions, the time for each load mode per year is multiplied by the result obtained using Equation (9) (NOx CAT 3516C = 4300 g/h, NOx Wartsila 9L20DF = 1500 g/h)
3.3. Assessment of NOx Emissions from Tugboats of Seaports in the Baltic Sea
This section presents an estimation of NOx emissions from tugboats in seaports in the Baltic Sea when diesel engines are replaced by dual-fuel engines.
More than 217 seaport tugboats operate in Baltic Sea ports. Owing to the large number of tugboats and the different performance characteristics and profiles, it is difficult to estimate the NOx emissions for each tugboat when diesel fueled engines are replaced by dual-fuel engines. To assess the reduction in NOx emissions, a method based on the MARPOL requirements for NOx emissions from ships was chosen.
Owing to the year of manufacture and engine parameters, tugboats are subject to different NOx emission requirements under the Annex VI Regulations for the Prevention of Air Pollution from ships (see Table 9).
Table 9.
Tier I-III NOx emission limits for ship engines.
According to the statistical data from tugboats operating in the Baltic Sea, tugboats were divided into three groups according to the year of manufacture (see Table 9). NOx emissions were assessed for each tugboat in the group in accordance with MARPOL requirements.
The first group consisted of tugboats that were built before 1 January 2000. There are currently 99 tugboats in this group. The total power of the tugboat fleet in this group was 216,900 kW. NOx emissions were not limited for ships built before 2000 under the MARPOL convention regulations; thus, the assessment of NOx emissions from tugboats according to the MARPOL requirements of this convention cannot be performed. Based on data from “EMEP/EEA air pollutant emission inventory guidebook 2019”, it can be assumed that the specific NOx emissions from tugboats built before 2000 is approximately 11.8 g/kWh [42].
The second group includes tugboats built between 1 January 2000 and 1 January 2011. This fleet consists of 58 tugboats. The total power of the fleet in this group was 213,300 kW. The specific NOx emission assessment for tugboats in this group can be conducted in accordance with the requirements of the Tier I convention (see Table 9).
The third group includes tugboats built from 1 January 2011 to 1 January 2016, consisting of 28 tugboats with a total power of 107,900 kW. The specific NOx emissions estimation for the third group of tugboats is conducted in accordance with the requirements of the Tier II convention (see Table 9).
The NOx emissions of Wartsila 20DF series engines at a rated speed of 1200 rpm according to Tier III convention regulations is used as a reference to compare with NOx emissions from diesel-fueled tugboats.
Based on the data, the NOx emission changes for all tugs in seaports in the Baltic Sea region were calculated as follows:
where:
- Pei-power of individual tugboat engine, kW
- ΣPei-sum of all tugboats engine power, kW
- -specific NOx emission of individual tugboat, g/kWh
- -specific NOx emission of “Wartsila 20DF” engines, g/kWh
3.4. Discussion of Research Results
3.4.1. Fuel Consumption Evaluation Results for Engines 9L20DF and CAT3516C
The annual fuel consumption and weighting factors of the engines for each load mode are presented in Table 10.
Table 10.
Wartsila 9L20DF and CAT 3516C engines annual fuel consumption and weight factor according to load.
Based on the fuel consumption estimation data, two installed CAT 3516C engines consumed 148,800 kg of diesel fuel (MGO) per year. The two Wartsila 9L20DF engines consumed 138,800 kg of NG and 13,600 kg of MGO as the pilot fuel. The CAT 3516C engine fuel consumption was compared with the statistical data by the additive principle, and a 2.6% error was found. These data are the basis for determining the environmental impact of further engine replacement.
3.4.2. Results of CO2 Emission Assessment
The CO2 emissions of engines CAT3516C and Wartsila 9L20DF is calculated using Equations (1), (2), (6) and (7). The CO2 emissions of both engines in different load modes are presented in Table 11.
Table 11.
Annual CO2 emission of KLASCO-3 tugboat at different engine load modes.
The results show that the annual CO2 emissions are reduced from 474,300 kg/year to 424,800 kg/year when CAT 3516C is replaced by Wartsila 9L20DF, a reduction of approximately 10%. The Wartsila 9L20DF engine consumes less fuel per year, and LNG has a low carbon content compared to diesel fuel. Figure 7 presents the distribution of annual CO2 emissions of CAT 3516C and Wartsila 9L20DF according to the actual engine operation profile of KLASCO-3.
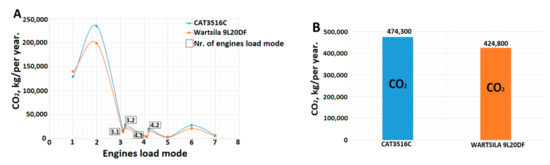
Figure 7.
(A) Disaggregated data of annual CO2 emission of CAT 3516C and Wartsila 9L20DF. (B) Annual SO2 emission of CAT 3516C and Wartsila 9L20DF.
3.4.3. Results of SO2 Emission Assessment
The SO2 emissions of engines CAT3516C and Wartsila 9L20DF is calculated using Equations (3), (8) and (9).
Table 12 presents the SO2 emissions of the two engines at different loads.
Table 12.
Annual SO2 emission of KLASCO-3 tugboat.
The annual SO2 emission of the KLASCO-3 tugboat was reduced by approximately 91% from 300 kg (SO2)/year to 30 kg (SO2)/year when the CAT 3516C engine was replaced by the Wartsila 9L20DF engine. The reduction results mainly from the use of LNG with no sulphur content. Figure 8 shows the distribution of SO2 emissions for both engines at different load modes.
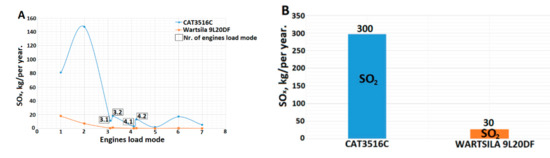
Figure 8.
(A) Disaggregated data of annual SO2 emission of CAT 3516C and Wartsila 9L20DF. (B) Annual SO2 emission of CAT 3516C and Wartsila 9L20DF.
3.4.4. Results of NOx Emission Assessment
The NOx emissions of engines CAT3516C and Wartsila 9L20DF is calculated using Equation (9).
The NOx emissions in kg calculated for each engine load mode are given separately in Table 13.
Table 13.
Wartsila 9L20DF and CAT 3516C annual NOx emission according engine load modes.
The results of the NOx emission calculations show that the Wartsila 9L20DF engine emits 65% less NOx than the CAT 3516C engine under the KLASCO-3 annual load profiles.
Disaggregated annual NOx emissions data for CAT 3516C and Wartsila 9L20DF according to the actual KLASCO-3 load modes are shown in Figure 9.
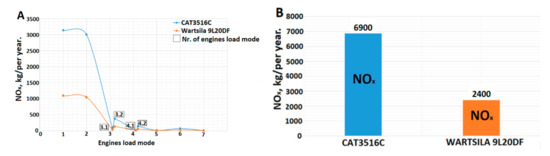
Figure 9.
(A) Disaggregated data of annual NOx emission of CAT 3516C and Wartsila 9L20DF. (B) Annual NOx emission of CAT 3516C and Wartsila 9L20DF.
The results of emissions calculations indicate that the use of a new generation of DF engines contributes to a significant reduction in CO2, SO2, and NOx emissions for tugboats. For the KLASCO-3 tugboat, CO2 emissions were reduced by 10% per year, SO2 emissions were reduced by 91% per year, and NOx emissions were reduced by 65% per year.
An interesting result was obtained based on the emission requirements and real engine load data. Comparison of specific emissions according to Marpol 73/78 Annex VI structure of standardized ISO 8178 engine load cycle E3 [43] and according to the actual load cycle of seaport tugboat engine (see Table 8). Based on experimental data the engine of the CAT3516C operating according to the E3 cycle results is 6.87 g/kWh with an error of 5%. This result meets the standards for the Trier II engine with a speed of n = 1600 min−1. The result obtained using real engine load data is 8.69 g/kWh, which is approximately 25% percent more.
The lower ecological performance obtained compared to the regulatory requirements is related to significant structural differences between E3 and the actual engine load cycle. The structure of E3 cycle provides for low load mode up to 25% of the rated engine load only for 25% of the engine operating time, 75% of the operating time is devoted to the average and rated engine power. The low-load mode (characterized by higher values) affects both the specific fuel consumption be (see Table 3, Table 4, Table 6) and the NOx specific values (gNOx/kgfuel). It is these two factors that lead to the expected 25% increase in when the tugboat engines are running in actual load modes. It is obvious that analogous results are expected for dual-fuel engines. It is expedient to assess this circumstance by optimizing the structure of the engine load cycle by technological means to determine the environmental effect under real operating conditions.
3.4.5. Assessment of NOx Emissions from Tugboats of Seaports in the Baltic Sea
According to the results obtained from the calculation, it is observed that the replacement of diesel-powered engines with Wartsila 20DF dual-fuel engines on tugboats operating in the Baltic Sea region offers a total NOx emissions reduction of 78%.
The reduction in CO2 and SO2 emissions is due to the elemental composition of petroleum-derived marine fuels, liquefied natural gas and the fuel consumption of seaport tugboats. Therefore, in the first approach, the environmental effect can be assumed according to the obtained KLASCO-3 tugboat emission data: CO2 emissions will be reduced by ~10% and SO2 emissions will be reduced by ~90%. For a more accurate assessment of CO2 and SO2 emissions, it is necessary to have data on the exact fuel consumption in the region of Baltic Sea. For a more accurate assessment of CO2 and SO2 emissions, it is necessary to have data on the real fuel consumption of all tugboats in the region, as well as the energy efficiency parameters of the engines in operation compared to 20DF type engines.
3.4.6. Economic Impact Assessment When Diesel Fuel Is Replaced by Natural
Based on today’s fuel price market data [44], an economic impact assessment was performed based on the estimated annual fuel consumption of the KLASCO-3 seaport tugboat. The economic effect of fuel prices is presented in Table 14.
Table 14.
The assessment of the economic effect of fuel prices.
Based on the economic evaluation data, the cost of fuel consumed by the CAT 3516C engines installed in the KLASCO-3 seaport tugboat is 55,500 USD per year. The results also that replacing the CAT 3516C diesel engines with Wartsila 9L20DF dual-fuel (diesel-natural gas) engines reduces the cost of fuel consumed to 37,400 USD per year—a 33% fuel cost savings.
4. Conclusions
The study of the environmental impact of shipping became a little-studied fleet of tugboats in the Baltic Sea region. The ecological impact of CO2, SO2, and NOx emissions assessment. was performed in two cases when diesel engines were replaced by natural gas-powered engines: using actual engine load data of typical tugboat KLASCO-3 and all the tugboats in the region of Baltic Sea based on statistical data of tugboat engine power.
A comparison of the statistical annual engine load data of the seaport tugboat and the actual annual engine load data of seaport tugboat KLASCO-3 showed that the load data for engines in different load modes may vary. These differences can be influenced by operating conditions such as weather, size of seaport, number and size of vessels serviced. For the engine load modes that seaport tugboats operate in for the most time per year, the data are arranged in a regular manner with 10%, 25% and 30% of engine load modes. A comparison of the data confirms the accuracy of the KLASCO-3 tugboat engine load data used to calculate CO2, SO2, and NOx emissions.
Calculations of annual CO2, SO2, and NOx emissions according to the KLASCO-3 annual engine load data, when the existing diesel-powered engine CAT 3516C is replaced by a Wartsila 9L20DF showed that:
- CO2 emissions are reduced from 474,300 kg per year to 424,800 kg per year (by 10%)
- SO2 emissions are reduced from 300 kg per year to 30 kg per year (by 91%).
- NOx emissions are reduced from 6900 kg per year to 2400 kg per year (by 65%).
- Based on actual KLASCO-3 and statistical of engine load data it was found that specific emissions under real operating conditions is about 25% higher than the regulatory requirements for liner shipping engine models. It is expedient to assess this circumstance by optimizing the structure of the engine load cycle by technological means to determine the environmental effect under real operating conditions.
- An extended study indicates that the total NOx emissions from tugboats in the Baltic Sea are reduced by 78% when existing diesel engines are replaced by Wartsila 20DF dual-fuel engines.
- Based on the economic evaluation data, the CAT 3516C engines installed in the KLASCO-3 seaport tugboat consume fuel costing 55,500 USD per year. Replacing the CAT 3516C diesel engines with the Wartsila 9L20DF dual-fuel (diesel-natural gas) engines reduces the cost of fuel consumed to 37,400 USD per year. A 33% fuel cost savings can be achieved per year.
The results of the research indicate that the use of LNG as an alternative fuel for seaport tugboats can produce a significant reduction in CO2, SO2, and NOx emissions. LNG and the new generation of dual-fuel engines are environmentally friendly alternatives to reduce harmful emissions, allowing a large number of existing seaport tugboats to continue operating in the emission control area (ECA) while complying with IMO Tier III regulations. Methodological solutions were used for estimating NOx emissions from tugs operating in the Baltic Sea region has helped to provide an overall assessment of the potential ecological impact when diesel fuel is replaced by natural gas. To accurately determine the ecological and economic effects of replacing diesel fuel with natural gas, the exact fuel consumption and engine load modes of each tugboat in the Baltic Sea region must be determined.
Author Contributions
Conceptualization, S.L. and L.N.; Methodology, S.L.; Software, L.N. and S.L.; Validation, S.L.; Formal analysis, P.Z.; Investigation, S.L. and L.N.; Resources, S.L. and L.N.; Data curation, S.L. and L.N.; Writing—original draft preparation, L.N. and P.Z.; Writing—review and editing; S.L. and L.N.; Visualization, L.N.; Supervision, S.L.; Project administration, L.N.; Funding acquisition, P.Z. All authors have read and agreed to the published version of the manuscript.
Funding
This research received no external funding.
Institutional Review Board Statement
Not applicable.
Informed Consent Statement
Not applicable.
Data Availability Statement
The data presented in this study are available on request from the corresponding author. The data are not publicly available due to privacy policy.
Conflicts of Interest
The authors declare no conflict of interest.
References
- IMO EEDI. Available online: http://www.imo.org/en/OurWork/Environment/PollutionPrevention/AirPollution/Pages/Technical-and-Operational-Measures.aspx (accessed on 23 October 2020).
- EEDI, SEEMP, MARPOL ANNEX VI. Available online: https://www.marpol-annex-vi.com/eedi-seemp/ (accessed on 26 October 2020).
- Kågeson, P. Reducing Emissions from Ships in the Baltic Sea Area. In The Feasibility of Introducing a Distance-Related en-Route Charge; European Federation for Transport and Environment and Svenska Naturskyddsföreningen: Brussels, Belgium; Sweden, Stockholm, 2005. [Google Scholar]
- Sahoo, B.B.; Sahoo, N.; Saha, U.K. Effect of engine parameters and type of gaseous fuel on the performance of dual-fuel gas diesel engines—A critical review. Renew. Sustain. Energy Rev. 2009, 13, 1151–1184. [Google Scholar] [CrossRef]
- Banapurmath, N.; Tewari, P.; Yaliwal, V.; Kambalimath, S.; Basavarajappa, Y. Combustion Characteristics of A 4-Stroke CI Engine Operated on Honge Oil, Neem and Rice Bran Oils When Directly Injected and Dual Fuelled with Producer Gas In-duction. Renew. Energy 2009, 34, 1877–1884. [Google Scholar] [CrossRef]
- Papagiannakis, R.; Rakopoulos, C.; Hountalas, D.; Rakopoulos, D. Emission Characteristics of High Speed, Dual Fuel, Compression Ignition Engine Operating in a Wide Range of Natural Gas/Diesel Fuel Proportions. Fuel 2010, 89, 1397–1406. [Google Scholar] [CrossRef]
- Wuersig, G.M.; Chiotopoulos, A.; Adams, S. LNG as Marine Fuel; No. 01; DNV GL: Hamburg, Germany, 2014. [Google Scholar]
- Gatts, T.; Liu, S.; Liew, C.; Ralston, B.; Bell, C.; Li, H. An experimental investigation of incomplete combustion of gaseous fuels of a heavy-duty diesel engine supplemented with hydrogen and natural gas. Int. J. Hydrog. Energy 2012, 37, 7848–7859. [Google Scholar] [CrossRef]
- Yang, B.; Xi, C.; Wei, X.; Zeng, K.; Lai, M.C. Parametric investigation of natural gas port injection and diesel pilot injection on the combustion and emissions of a turbocharged common rail dual-fuel engine at low load. Appl. Energy 2015, 143, 130–137. [Google Scholar] [CrossRef]
- Kakaee, A.-H.; Rahnama, P.; Paykani, A. Influence of fuel composition on combustion and emissions characteristics of natural gas/diesel RCCI engine. J. Nat. Gas Sci. Eng. 2015, 25, 58–65. [Google Scholar] [CrossRef]
- IMO ECAs. Emission Control Areas (ECAs) Designated under MARPOL Annex VI. Available online: http://www.imo.org/en/OurWork/Environment/PollutionPrevention/AirPollution/Pages/Emission-Control-Areas-(ECAs)-designated-under-regulation-13-of-MARPOL-Annex-VI-(NOx-emission-control).aspx (accessed on 12 November 2020).
- Park, C.; Kim, C.; Choi, Y.; Lee, J. Operating strategy for exhaust gas reduction and performance improvement in a heavy-duty hydrogen-natural gas blend engine. Energy 2013, 50, 262–269. [Google Scholar] [CrossRef]
- Resitoglu, I.A.; Altinisik, K.; Keskin, A. The pollutant emissions from diesel-engine vehicles and exhaust aftertreatment systems. Clean Technol. Environ. Policy 2015, 17, 15–27. [Google Scholar] [CrossRef]
- Zagala, M.; Abdelaal, H. Flue Gas Cleaning Systems—A Review Paper. In Proceedings of the 5th Conference on Contemporary Problems of Power Engineering and Environmental Protection, Gliwice, Poland, 25–27 October 2017; pp. 75–82. [Google Scholar]
- Maurya, R.; Mishra, P. Parametric Investigation on Combustion and Emissions Characteristics of a Dual Fuel (Natural Gas Port Injection and Diesel Pilot Injection) Engine Using 0-D SRM and 3D CFD Approach. Fuel 2017, 210, 900–913. [Google Scholar] [CrossRef]
- Banawan, A.; Seediek, I.; Elgohary, M. Environmental and economical benefits of changing from marine diesel oil to natu-ral-gas fuel for short-voyage high-power passenger ships. Eng. Marit. Environ. 2010, 224, 103–113. [Google Scholar]
- Elkafas, G.; Elgohary, M.; Shouman, R. Numerical analysis of economic and environmental benefits of marine fuel conversion from diesel oil to natural gas for containerships. Environ. Sci. Pollut. Res. 2020. [Google Scholar] [CrossRef]
- DNV GL. The LNG Era Takes Shape. 2019. Available online: https://industryoutlook.dnvgl.com/2019/the-LNG-era-takes-shape.html (accessed on 26 October 2020).
- Blue Baltics. LNG Infrastructure Facility Deployment in the Baltic Sea Region. Available online: https://ec.europa.eu/inea/sites/inea/files/cefpub/3_-_panel_1-2_-_snioliene.pdf (accessed on 30 November 2021).
- Wartsila Tugboats. Available online: https://www.wartsila.com/twentyfour7/in-detail/new-lng-tug-opens-a-market (accessed on 18 October 2020).
- Europien Commission. Study on Differentiated Port Infrastructure Charges to Promote Environmentally Friendly Maritime Transport Activities and Sustainable Transportation; Final Report; Europien Commission: Brussels, Belgium, 2017. [Google Scholar]
- Lebedev, S.V.; Nechayev, L.V. Sovershenstvovaniye Pokazateley Vysokooborotnykh Dizeley Unifitsirovannogo Tiporazmera; Akademiya transporta RF: Barnaul, Russian, 1999; p. 112. [Google Scholar]
- Towage-Klasco. 2020. Available online: http://www.towage-klasco.lt/apiemus (accessed on 28 September 2020).
- KLASCO-3, Damen ASD TUG 2810 ICE. Available online: https://www.damen.com/es-es/news/2015/08/damen_delivers_asd_tug_2810_ice_to_klasco_lithuania? (accessed on 14 October 2020).
- EU Tugowners Association. Guidelines for Safe Harbour Towage Operations, 1st ed.; EU Tugowners Association: Bruxelles, Belgium, 2015. [Google Scholar]
- Nitonye, S.; Adumene, S.; Howells, U. Numerical Design and Performance Analysis of a Tug Boat Propulsion System. J. Power Energy Eng. 2017, a5, 80–98. [Google Scholar] [CrossRef]
- CAT 3516C. Available online: https://www.cat.com/en_US/products/new/power-systems/marine-power-systems/commercial-propulsion-engines/18408926.html (accessed on 14 October 2020).
- Wartsila 20DF, Product Guide. Available online: https://www.wartsila.com/docs/default-source/product-files/engines/df-engine/product-guide-o-e-w20df.pdf?utm_source=engines&utm_medium=dfengines&utm_term=w20df&utm_content=productguide&utm_campaign=msleadscoring (accessed on 20 October 2020).
- Vaasa, Wärtsilä 20DF Product Guide 9L20DF Vaasa. 2018. Available online: https://www.wartsila.com/marine/build/engines-and-generating-sets/dual-fuel-engines (accessed on 17 October 2020).
- Krasovskij, O.; Bergman, A.; Matvejev, V. Preminenje Programi Chislenovo Modelirovonie Rabochevo Procesa Dyzelei, Trud CNIDI, ZVM v Isledovinije I Projektirovinii Dvigatelei Vnutrenevo Sgoranie, L. CNIDI, 1986; 100–111.
- Lebedev, S.; Lebedeva, G.; Matievskij, D.; Reshetov, V. Formirovanie Konstruktivnogo Rjada Porshnej Dlja Tipaža Vysokooborotnyh Forsirovannyh Dizelej; Akademija Transporta RF: Barnaul, Russia, 2003; p. 89. [Google Scholar]
- Grabowski, L.; Wendeker, M.; Pietrykowski, K. AVL Simulation Tools Practical Applications, Monografie–Politechnika Lubelska; Politechnika Lubelska: Lublin, Poland, 2012. [Google Scholar]
- Wiebe, I. Brennverlauf Und Kreisprozesse Vonverbrennungsmotoren; VEB Verlag Technik: Berlin, Germany, 1970; p. 280. [Google Scholar]
- Woschni, G. Die Berechnung der Wandverluste und der thermischen Belastung von Dieselmotoren. MTZ 1970, 31, S-491. [Google Scholar]
- Woschni, G.; Anists, F. Eine Methode zur Vorausberechnung der Änderung des Brenverlaufs mittelschnellaufender Dieselmotoren bei geanderten Betriebsbedigungen. MTZ. N4 1973, 34, 106–115. [Google Scholar]
- Lebedevas, S.; Dailydka, S.; Jastremskas, V.; Rapalis, P. The Influence of Locomotive Diesel Engine Transient Operating Modes on Energy Usage//Transportation Research. Part D: Transport and Environment; Elsevier Science Ltd.: Oxford, UK, 2015; Volume 34, pp. 219–229. ISSN 1361-9209. [Google Scholar]
- European Martime Safety Agency. The 0.1% Sulphur in Fuel Requirement as from 1 January 2015 in SECAs; Technical Report; European Martime Safety Agency: Lisboa, Portugal, 2010. [Google Scholar]
- IMO. 2008. Available online: http://www.imo.org/en/OurWork/Environment/PollutionPrevention/AirPollution/Pages/Nitrogen-oxides-(NOx)-%E2%80%93-Regulation-13.aspx (accessed on 7 November 2020).
- Trozzi, C. Emission Estimate Methodology for Marine Navigation. Available online: http://www.epa.gov/ttnchie1/conference/ei19/session10/trozzi.pdf (accessed on 6 October 2020).
- Khair, K.; Jaaskelainen, H. Emission Formation in Diesel Engines. Available online: https://dieselnet.com/tech/diesel_emiform.php (accessed on 14 November 2020).
- Hebbar, G.S. NOx from diesel engine emission and control strategies—A review. Int. J. Mech. Eng. Robot. Res. 2014, 3, 471. [Google Scholar]
- EMEP/EEA Air Pollutant Emission Inventory Guidebook; EEA: Copenhagen, Denmark, 2019.
- Emission Standards, International: IMO Marine Engine Regulations >> DieselNet. Available online: https://www.dieselnet.com/standards/inter/imo.php (accessed on 25 October 2020).
- Current Price Development Oil and Gas. DNV GL. Available online: https://www.dnvgl.com/maritime/lng/current-price-development-oil-and-gas.html (accessed on 26 October 2020).
Publisher’s Note: MDPI stays neutral with regard to jurisdictional claims in published maps and institutional affiliations. |
© 2021 by the authors. Licensee MDPI, Basel, Switzerland. This article is an open access article distributed under the terms and conditions of the Creative Commons Attribution (CC BY) license (http://creativecommons.org/licenses/by/4.0/).