Article

Microplastics in Combined Sewer Overflows: An Experimental Study

1
Department of Civil and Mechanical Engineering (DICEM), University of Cassino and Southern Lazio, Via Di Biasio, 43, 03043 Cassino, Italy
2
Department of Industrial Engineering, University of Trento, Via Sommarive 9, 38123 Trento, Italy
*
Author to whom correspondence should be addressed.
J. Mar. Sci. Eng. 2021, 9(12), 1415; https://doi.org/10.3390/jmse9121415
Submission received: 18 November 2021 / Revised: 6 December 2021 / Accepted: 9 December 2021 / Published: 11 December 2021

Abstract

:
One of the main sources of microplastics inside surface waters is represented by combined sewer overflows (CSOs), involving severe risks for the environment. The entry of microplastics into water bodies also depends on the characteristics of sewer diversion structures used as flow control devices. In this work, an experimental investigation was carried out to evaluate the outflow of microplastic particles, consisting of different types of nylon fibers, from a side weir located on a channel with a rectangular section. A specific methodology was developed for the fiber sampling and outflow assessment after the tests were performed. For the tested configurations, an increase in fibers discharged up to 196.15% was measured as the water flow rate increased by 62.75%, combined with an increase in the side weir length up to 40% and a decrease in the crest height up to 20%. The size and weight of the different fibers showed a low impact due to their low inertia, and their motion was governed by the water flow. An empirical equation to evaluate the fiber outflow as a function of water flow rate and side weir geometric characteristics was also proposed and calibrated for the experimentally tested ranges of the dimensionless lateral water outflow Q* = 0.51–0.83 and of the dimensionless geometric parameter S* = 0.114–0.200. These first experimental results make it possible to carry out a preliminary assessment of the impact of CSOs in terms of microplastics spilled into water bodies.

Graphical Abstract

1. Introduction

Synthetic polymers, usually referred to as “plastics”, are manmade polymers synthesized from petroleum with a wide range of applications. One of the main reasons for the great versatility and use of synthetic polymers is related to the high resistance to environmental factors. However, this results in extremely long degradation times when released into the environment, leading to a far-ranging environmental impact. The degradation may occur as a combination of both physical [1] and biological [2,3] processes, leading first to the formation of small plastic particles, usually referred to as “microplastics”, and gradually to even smaller particles called “nanoplastics” [4].
Despite the several studies in the literature aimed at providing information on the size and shape of plastic particles, there is not a universally acknowledged range of sizes for nanoplastics and microplastics [5]. Nanoplastics are usually defined as particles with a size lower than 0.1 μm [6,7] while microplastics are usually defined as particles with a size between 0.1 μm and 5000 μm [8,9]. Furthermore, for the shape of the microplastics, there are different classifications in literature, which basically divide them as follows: sheet, film, fiber, fragment, granule, and foam [10,11,12]. This information can be used to understand the origins of the microplastic particles. For example, it was observed that, in surface waters in densely populated areas, fibers occur to a greater extent than other forms [13].
Microplastics may enter into superficial water bodies in different ways. One of the main sources is represented by combined sewer overflows (CSOs) [14,15,16], defined as the discharge from a combined sewer systems (CSS) at a point prior to the treatment plant [17], as a consequence of heavy rain events, allowing the entry of untreated raw sewage into superficial water bodies [18]. The outflow volume depends on the sewer diversion structure type, such as relief siphons, orifices, and side weirs, used as flow control devices.
CSOs can have a high impact on the environment. For example, CSO discharges in the Paris sewage system are about 21 million m3/year, which corresponds to a potential introduction into freshwater of about 4 − 5 × 10¹² fibers/year [19]. Polanco et al. (2020) also evaluated high concentrations of plastic particles in the Lower Hudson River Estuary (Manhattan), close to a network of 30 CSO pipes, equal to a median of 198,000 particles/km2 computed for a period of 4 years [20]. Furthermore, Rowley et al. (2020) found a strong relationship between the mean number of microplastic particles with diameter in the range 32 μm–5 mm and the sewage discharged into the water column from the Hammersmith pumping station CSO (Thames River) [21]. Chen et al. (2020) reported even more severe values for the Megacity of Shanghai, with 8.50 × 10¹⁴ particles/year discharged by the drainage system overflow, which was about six times higher than that discharged via effluent from the wastewater treatment plant, equal to 1.43 × 10¹⁴ particles/year [22]. Wagner et al. (2019) showed the difference from the rural to the urban subcatchment, in terms of plastic particle concentration, with an increase of 0.8 g every 1000 m3 of water [23]. Different values were provided by Baresel and Olshammar (2019) which estimated, for the Baltic Sea basin, a microplastic discharge of about 120 tons/year (particles with diameter >20 μm), according to reported data which considered the microplastic discharge as a relevant fraction of the total wastewater inflow to the treatment plant [24]. Schernewski et al. (2021a) reported that 6.7 × 10¹³ microplastic particles per year enter from urban pathways into the Baltic Sea. Of these, a higher percentage was related to stormwater runoff including sewer overflow, equal to 62%, while wastewater treatment plants (WWTPs) and untreated wastewater featured a lower contribution, equal to 25% and 13%, respectively [25]. These results are in agreement with Chen et al. (2020) [22], confirming the great impact of the CSOs in comparison with the wastewater treatment plants. They also performed 3D model simulations, in order to evaluate the transport, behavior, and deposition of microplastics in the Baltic Sea, using the modeling approach proposed by Osinsky et al. (2020) and Osinski and Radtke (2020) [26,27]. Further developments were reported in Schernewski et al. (2021b) where the monitoring of estuaries, which represent hotspots for plastic accumulation, was integrated into the 3D modeling [28]. Bollmann et al. (2019) provided measurements of microplastic concentration for urban areas with 63% coming from untreated wastewater, 1% coming from WWTPs, and 36% coming from stormwater runoff and CSOs [29]. These results, although obtained in different scenarios, were at odds with those reported by Schernewski et al. (2021a) [25]. Moreover, focusing only on the amount of microplastics discharged from WWTPs, a wide range of several orders of magnitude was observed from previous studies. In particular, from 19 studies performed from 2016 to 2020, the microplastic concentrations in 79 WWTP effluents ranged between 4 × 100 and 4.5 × 10⁵ items/m3 [30].
Overall, these studies clearly show how providing an accurate estimation of the quantity of fibers discharged in freshwater bodies is a challenging task.
Moreover, despite the high impact of the CSOs in terms of microplastic pollution, the microplastic dynamics along sewer side weirs is a topic not yet discussed in the literature, while the hydraulics of side weirs were also widely investigated in recent years [31,32,33,34,35,36].
In this study, an experimental investigation was performed to evaluate the microplastic particle outflow, consisting of different types of nylon fibers, along a side weir located on a channel with a rectangular section. So far, it is not possible to find any experimental study in the literature that addresses the microplastic discharge problem in CSOs. A specific procedure was developed for the collection of the microplastics and the measurement of the fiber outflow. The reliability of the measurements was validated by means of the attenuated total reflection Fourier-transform infrared spectroscopy (ATR-FTIR), which allowed detecting any impurities that could affect the quality of the measurements. A dimensional analysis was performed to evaluate the dimensionless parameters that affect the microplastic discharge in a side weir. This led to the introduction of parameters related to the size and weight of the microplastic particles, in addition to the geometric and hydraulic parameters usually considered for the weir analysis.
The main objective of the study is to provide initial empirical evidence on the concentration of particles discharged through the side weir, in relation to the different water flows and geometric characteristics of the side weir, in order to provide a tool to assess the impact caused by these devices on water bodies in terms of microplastic pollution. Furthermore, the efficiency of the side weir in terms of microplastic discharge was assessed for the investigated range of discharges and geometry of the side weir.
From a practical point of view, the developed methodology can be used in future studies to optimize the design of side weirs in CSOs, with the implementation of solutions aimed at ensuring maximum efficiency while reducing the introduction of microplastic particles into the bodies receiving water.

2. Materials and Methods

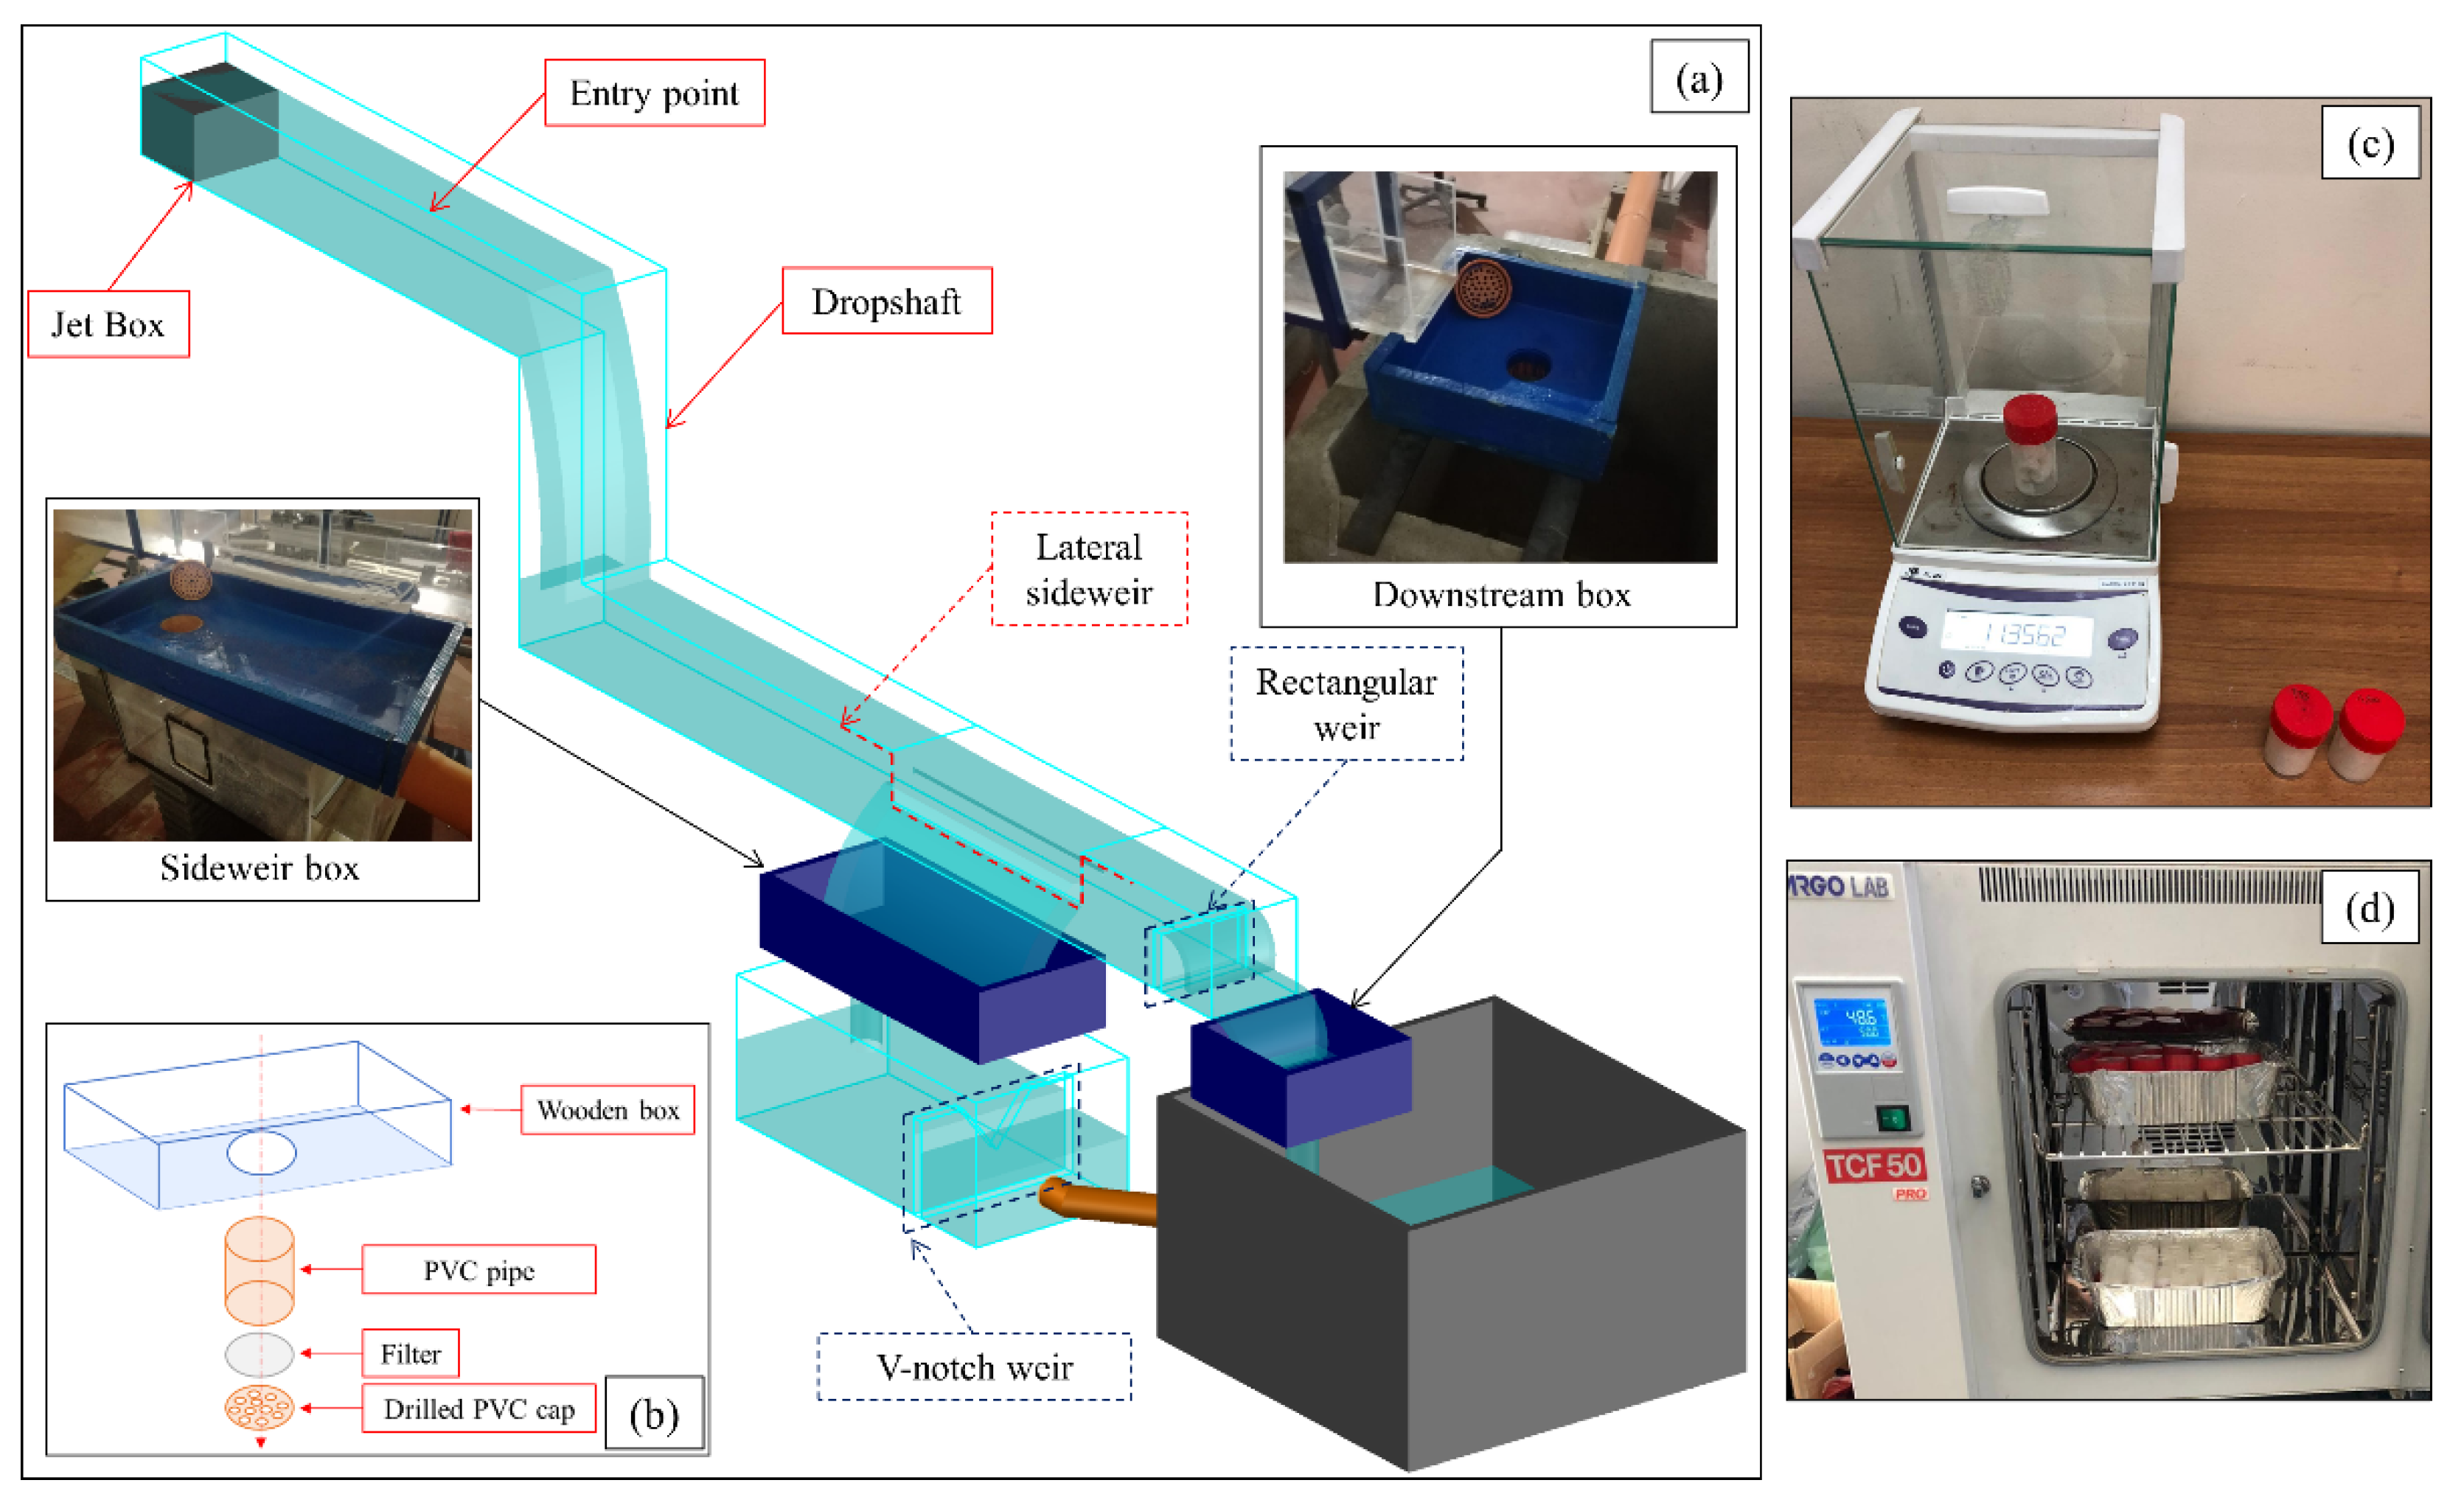
2.1. Experimental Setup

Experimental tests were carried out at the Laboratorio di Ingegneria delle Acque (LIA) of the University of Cassino and Southern Lazio. The experimental setup (Figure 1a) consisted of a rectangular channel of width B = 200 mm and length of 15B (3000 mm), with a side weir of variable dimensions. It was made of Plexiglas® for optical access (wall thickness equal to 10 mm) and supplied by a recirculation system. The water used for the tests was suitably filtered by means of a four-stage reverse osmosis deionization (RODI) filtration system (produced by Aquatic Life). The first stage was represented by the filter (aperture 5 μm) for the removal of coarser sediments. The second consisted of an activated carbon filter (aperture 2 μm), able to remove chlorine and/or chloramines. The third was represented by a reverse osmosis membrane (aperture 2 μm), able to remove organic and inorganic compounds and reduce total dissolved solids (TDS) from the water down to 1/10,000 of a micron. The fourth stage consisted of a resin deionization filter (aperture 2 μm), used to remove the remaining total dissolved solids (TDS) from membrane filtered water. Therefore, the filtration system allowed removing the impurities which, with their weight and motion, could, on the one hand, lead to weighing errors and, on the other hand, disturb the dynamics of the microplastics discharged along the side weir. However, measurements were validated by means of the ATR-FTIR analysis described in Section 3. The recirculation system included a supply tank, in which a submerged centrifugal pump (produced by Caprari, model KCM100HL+002241N1, flow rate of 30 L/s with head of 4.5 m) was located, along with two collecting tanks, one for the lateral outflows and the other one for the downstream flows. The downstream flow depth was set by means of a rectangular weir with height of 0.5B. An electromagnetic flowmeter (produced by ISOIL, model ISOMAG® MS2500, range of the water flow measurement 0–280 m3/h) was used to measure the incoming water flow rate, while the lateral outflow was measured by means of a V-notch weir located inside the corresponding collecting tank.
Three different incoming water flow rates Qupstream were tested: 2.5 L/s, 3.0 L/s, and 3.5 L/s. Nine different configurations of the side weir were investigated, with three different lengths Lsideweir, equal to 500 mm, 600 mm, and 700 mm, and three different heights of the weir crest w, equal to 80 mm, 90 mm, and 100 mm.
Microplastic particles consisted of white nylon fibers (polyamide 6.6, density 1.14 g/cm3, produced by Swissflock AG) of three different sizes and weights: length 2 mm, diameter around 0.1 mm, and weight 22 decitex (2–22); length 4 mm, diameter around 0.1 mm, and weight 22 decitex (4–22); length 4 mm, diameter around 0.15 mm, and weight 40 decitex (4–40), with 1 decitex equal to 1 g every 10 km of yarn.

2.2. Measurement Methodology

The fiber collecting system consisted of two rectangular boxes, placed above the two collecting tanks. Each box had a central hole under which a PVC pipe, with length 100 mm and diameter 63 mm, was placed. Filters were placed on the bottom of the PVC pipes and clamped by means of drilled PVC caps, allowing water flow (Figure 1b). Filters consisted of polypropylene blankets with weight equal to 17 g/m2 and a 20 μm mesh, able to intercept the different tested nylon fibers. The test procedure was as follows:
  • First, 3 g of nylon fibers were collected inside transparent plastic samplers and weighed (Wtot) with a laboratory balance (XS Balance model BL224, with weight range 0.1 mg–220 g, repeatability 0.1 mg, Figure 1c). In addition, for each sample of nylon fibers, two filters were weighed, one for the side weir box and the other for the downstream box;
  • The fibers were then mixed in a plastic graduated cup containing 350 mL of water, in order to separate them and allow them to follow the water flow without affecting each other;
  • The water–fiber mix was introduced at a distance of 5B upstream of the dropshaft (“entry point” in Figure 1a). The presence of the dropshaft allowed a better dispersion of the fibers in the water flow. Then, the fibers followed the water flow and were collected by means of the two filters after the outflows;
  • The wet filters containing the fibers were placed in the plastic samplers and dried for 72 h at 50 °C in a laboratory oven (Argo Lab model TCF 50 Pro, with temperature range 10–300 °C and temperature uniformity in the space at 150 °C ± 2%, Figure 1d);
  • The dried samples were then weighed allowing an evaluation of the weights of the fibers discharged from the side weir Wsideweir and of the fibers that followed the flow downstream.

3. Results and Discussion

According to the Buckingham theorem, nondimensional parameters were introduced to develop an empirical relationship for the prediction of the fibers outflow. In particular, the weight of fibers discharged from the side weir Wsideweir can be expressed as a function of
Wsideweir = f (Qsideweir, Qupstream, Wtot, Lsideweir, w, B, ρwater, μwater, ρfiber, lfiber, dfiber, g),
where Qsideweir is the lateral water outflow, Qupstream is the incoming water flow rate, Wtot is the total weight of fibers introduced upstream of the dropshaft, Lsideweir is the length of the side weir, w is the height of the weir crest, B is the channel width, ρwater and μwater are the water density and viscosity, and ρfiber, lfiber, and dfiber are the fiber density, length, and diameter, respectively. From the combination of the parameters reported in Equation (1), the following dimensionless parameters were obtained:
W* = f (Q*, S*, D*, ρ*, w*, L*, Re, Fr, St),
where Re, Fr, and St are respectively the Reynolds, Froude, and Stokes numbers, W* indicates the dimensionless weight of outflowing fibers, Q* indicates the dimensionless lateral water outflow, S* is the dimensionless geometric parameter, D* is the dimensionless fiber size, and ρ* is the dimensionless density. More precisely, the dimensionless parameters were expressed as follows:
W* = Wsideweir/Wtot,
Q* = Qsideweir/Qupstream,
S* = w/Lsideweir,
D* = dfiber/lfiber,
ρ* = ρfiber/ρwater,
w* = w/B,
L* = Lsideweir/B.
With water and fiber density being constant for all tested configurations, ρ* was neglected from the dimensional analysis. In order to select the parameters that had a greater impact on the weight of fibers discharged from the side weir, a correlation matrix was evaluated taking into account all dimensionless parameters (Figure 2). In particular, W*D* = 0.0250, W*D* = 0.0375, and W*D* = 0.0500 were the dimensionless weights of outflowing fibers of type 4–22, 4–40, and 2–22, respectively. The dimensionless parameters that showed a higher correlation with W* were Q*, which showed a positive correlation between 0.8 and 0.9 (W* increased with Q*), and S*, with a negative correlation between −0.8 and −0.9 (W* decreased with S*).
The parameters w* and L* showed a lower correlation with W* in comparison with Q* and S*. Furthermore, both w* and L* took into account the channel width B, which was constant in the present experimental investigation. The Reynolds, Froude, and Stokes numbers highlighted correlations with W* in line with w* and L* and lower than both Q* and S*. In particular, the Stokes number, which was computed for the different types of fibers and configurations tested, showed a negative correlation with W*, with values always lower than 1, highlighting that the fibers faithfully followed the flow. In addition, Re, Fr, and St all presented a short range of variability for the tested configurations. Details on the Stokes number evaluation were reported in Di Nunno et al. (2019) [37].
On the basis of these results, in order to simplify the analysis of the fibers outflow process, Equation (2) was rewritten as
W* = f (Q*, S*).
It should be noted that, although w* and L* were neglected, both w and Lsideweir were included in the dimensionless geometric parameter S*.
A review of the dimensional analysis and stage–discharge relationship for weirs was provided by Bijankhan and Ferro (2017) [38]. However, the dimensional analysis performed for the present study differs from that in the literature due to the inclusion of parameters relating to the microplastic particles.
Detailed results, including standard deviations (σ D* = 0.0250, σ D* = 0.0375, σ D* = 0.0500), are provided in Table 1. Furthermore, Figure 3 reports the dimensionless weight of outflowing fibers W* versus the dimensionless lateral water outflow Q* and the dimensionless geometric parameter S*.
As the incoming water flow rate Qupstream increased, an increase in Q* was obviously measured; as a consequence, W* also increased with Qupstream. The evaluation of W* as a function of the water outflow Q* is an essential task. For each assigned value of S*, an increase in W* with Q* was observed. It should be noted that the increase in S* was related to an increase in the weir height or to a decrease in the weir length; both factors affect the flow field on the weir so as to hinder the fiber outflow [39,40], since a backwater profile with a flow depth slightly higher than the weir crest is established on the side weir. For a lower value of S*, equal to 0.114, passing from Q* = 0.79 to Q* = 0.83, increases in W* equal to 25.42%, 26.32%, and 16.67% were observed for the fibers with D* equal to 0.0250, 0.0375, and 0.500, respectively. For an intermediate S*, equal to 0.143, passing from Q* = 0.64 to Q* = 0.68, greater increases in W* were computed, equal to 51.11%, 32.61%, and 53.85%, respectively, for the same fiber type. Overall, passing from Q* = 0.51 (with S* = 0.200) to Q* = 0.83 (with S* = 0.114), increases in W* equal to 151.61%, 150.00%, and 196.15% were computed for the fibers with D* equal to 0.0250, 0.0375, and 0.500, respectively. Furthermore, with the same Q*, a reduction in W* with S* was observed. For example, passing from S* = 0.150 to S* = 0.143, reductions in W* equal to 25.81, 35.71%, and 36.07% were observed for the fibers with D* equal to 0.0250, 0.0375, and 0.500, respectively. The dimensionless weight standard deviations σ (Table 1) also showed an increasing trend with the reduction in Q*, with values passing from a range of 0.01–0.03 for Q* = 0.83 to a range of 0.05–0.13 for Q* = 0.51, without being particularly affected by the fiber type. The low impact of the different fiber sizes and weights can be explained by the low inertia of the fibers (Stokes number <1), whose motion was consequently governed by the water flow.
Results were also in line with those reported by Schernewski et al. (2021a) for the Baltic Sea region [25], which revealed that 62% of microplastic particles discharged in rivers were linked to stormwater runoff and sewer overflow. In the present study, a mean value W*, computed for all S* values and fiber types, equal to 0.56 (56% in percentage) was computed. Moreover, passing from S* = 0.200 to S* = 0.114, mean W* increased from 38% to 71%. Therefore, for S* = 0.200 (Lsideweir = 500 mm, w = 100 mm), results were close to those obtained by Bollmann et al. (2019) for urban areas [29], which revealed a microplastic concentration equal to 36% related to stormwater runoff and CSOs. In addition, a mean W* = 62% was obtained, equal to that measured by Schernewski et al. (2021a) [25], for S* = 0.133 (Lsideweir = 600 mm, w = 80 mm).
Overall, the efficiency of the side weir in terms of microplastic discharge was quantified on the basis of the dimensionless weight of outflowing fibers W*. Since the efficiency reduced as the number of fibers discharged by the side weir increased, across all types of fibers, there was a reduction in the efficiency of the side weir as the dimensionless lateral water outflow Q* increased (Figure 3a). Furthermore, an increase in efficiency as the dimensionless geometric parameter S* (Figure 3b) increased was observed. These results show a greater efficiency of side weirs with high crest and short length.
In order to validate the experimental results represented in Figure 3 and reported in Table 1, an ATR-FTIR analysis of the fibers, prior to and after the experimental tests, was performed in the 4000–550 cm−1 wavenumber range (64 scans, resolution 4 cm−1), using a Varian 4100 Excalibur spectrometer equipped with a diamond ATR crystal. FTIR spectra of nylon fibers prior to and after the runs are reported in Figure 4. The characteristic vibration modes of the nylon samples can be found at 3290 (N–H stretching), 2930 (CH2 stretching), 1630 (C = O stretching), 1530 (N–H bending), and 680 cm−1 (N–H bending) [41]. No remarkable qualitative differences between the spectra recorded on samples prior to and after the experimental runs were evident. These results indicate that no significant variations of the chemical composition of the fibers or adsorption of organic impurities were detected during the runs, indicating a change in the reliability of the measured W*.
On the basis of the experimental results, an empirical equation that allows evaluating the dimensionless weight of the fiber outflow W* as a function of the dimensionless water discharge Q* and side weir geometry S* was also obtained. It is expressed as follows (Figure 5):
W* = a − (b × S*) − (c/Q*),
where the coefficients a, b, and c are equal to 1.4, 1.5, and 0.4, respectively, evaluated for the experimentally tested ranges of Q* = 0.51–0.83 and S* = 0.114–0.200. It should be noted that Equation (11) is an original regression-based equation [42], with the aim of providing the best fit with a simple and an easy-to-apply equation. Furthermore, equation coefficients can be easily recalibrated for side weir analyses characterized by different geometries and water discharges and/or for different plastic particles.
As a consequence, Equation (11) highlights a greater influence of the side weir geometric parameters, in comparison with the water discharge, on the number of fibers discharged. The reduction in W* as S* increases is well represented by the contour curves in Figure 5, with the lower number of fibers discharged from the side weir represented by the curve with S* = 0.200 (red dashed curve) and a higher number for the curve with S* = 0.114 (red solid curve). The goodness of fit was evaluated by means of the coefficient of determination R2, which assess how well the model replicates observed outcomes and predicts future outcomes, and the root-mean-squared error (RMSE), which provides the square root of the average squared errors for the predicted values [43]. They are defined as follows:
R 2 = 1 i = 1 m ( f i y i ) 2 i = 1 m ( y a y i ) 2 ,
R M S E = i = 1 m ( f i y i ) 2 m ,
where m is the total number of measured data, fi is the predicted value for the i-th data, yi is the experimental value for the i-th data, and ya is the averaged value of the measured data. The fitting of Equation (11) to the measured data provides R2 = 0.712, which is higher than 0.7, usually considered as the minimum value for a proper prediction [44], and RMSE = 0.065.
Overall, investigating the microplastic discharge along the side weirs using an experimental approach allowed measurements to be conducted on reduced-scale models under controlled conditions. In particular, a large-scale evaluation of the concentration of microplastic particles in receiving water bodies may present a high degree of uncertainty, as stated in the literature [19,20,21,22,23,24,25,26,27,28,29,30], linked to the several factors related to, among others, the sewer network, the environment, and the rate of industrialization of the investigated area.
Therefore, the measurement methodology developed in this study can lead to simple and more accurate relationships between the geometric and hydraulic parameters that affect the dynamics of the microplastic particles. This may simplify future sewer side weir design, in order to reduce the introduction of microplastic particles into receiving water bodies while ensuring a high efficiency.

4. Conclusions

This experimental study evaluated the concentration of microplastic particles, consisting of different types of nylon fibers, discharged along a side weir in a rectangular channel, in order to address the microplastic discharge problem in the CSOs. A specific methodology was proposed for the fiber sampling and weighing, including a validation of the results based on the ATR-FTIR analysis of the fibers, prior to and after the experimental tests.
The performed dimensional analysis led to the introduction of parameters related to the size and weight of the microplastic particles, in addition to the geometric and hydraulic parameters usually considered for the weir analysis. This allowed evaluating the efficiency of the side weir in terms of microplastic discharge.
Overall, the increase in water flow, combined with the increase in side weir length and/or the decrease in crest height, has a great impact on the fiber outflow process, without being particularly affected by the different fiber size. Moreover, the percentages of microplastics discharged from the side weir were in line with literature studies reporting large-scale measurements, further validating the reliability of the results.
An empirical equation to evaluate the dimensionless weight of the fibers discharged as a function of a dimensionless water flow rate and side weir size was established, showing good agreement between measured and predicted values. The empirical equation also highlights the greater influence of the water flow rate, in comparison with the side weir geometric parameters, on the quantity of fibers discharged.
The originality of the experimental study enables only comparisons with measurements made on large scales. However, significant improvements are possible by carrying out further tests in the future on side weirs with different sizes and for different fibers. Future experiments may investigate the implementation of devices designed, on the one hand, to prevent microplastic particles from reaching water bodies and, on the other hand, to maximize the efficiency of side weirs in CSOs.

Author Contributions

Conceptualization, F.G. and F.D.N.; methodology, F.G. and F.D.N.; validation, F.P. and G.d.M.; investigation, F.D.N., F.G., F.P., R.G. and G.d.M.; writing—original draft preparation, F.D.N.; writing—review and editing, R.G., G.d.M., F.P., F.D.N. and F.G. All authors read and agreed to the published version of the manuscript.

Funding

This work was conducted with the financial support of the Italian Ministry of Education, University and Research 2017 PRIN Project ACE, Grant No. 2017RSH3JY.

Institutional Review Board Statement

Not applicable.

Informed Consent Statement

Not applicable.

Acknowledgments

Authors thank Mario Fionda for the technical support during the experimental activity.

Conflicts of Interest

The authors declare no conflict of interest.

References

  1. Kamal, M.R.; Huang, B. Natural and artificial weathering of polymers. In Handbook of Polymer Degradation; Hamid, S.H., Ami, M.B., Maadhan, A.G., Eds.; Marcel Dekker: New York, NY, USA, 1992; pp. 127–168. [Google Scholar]
  2. Ali Shah, A.; Hasan, F.; Hameed, A.; Ahmed, S. Biological degradation of plastics: A comprehensive review. Biotechnol. Adv. 2007, 26, 246–265. [Google Scholar] [CrossRef]
  3. Eubeler, J.P.; Zok, S.; Bernhard, M.; Knepper, T.P. Environmental biodegradation of synthetic polymers I. Test methodologies and procedures. TrAC Trends Anal. Chem. 2009, 28, 1057–1072. [Google Scholar] [CrossRef]
  4. Klein, S.; Dimzon, I.K.; Eubeler, J.; Knepper, T.P. Analysis, Occurrence, and Degradation of Microplastics in the Aqueous Environment. In Freshwater Microplastics; Wagner, M., Lambert, S., Eds.; Springer: Cham, Switzerland, 2018; pp. 51–67. [Google Scholar]
  5. Kooi, M.; Besseling, E.; Kroeze, C.; van Wezel, A.P.; Koelmans, A.A. Modeling the Fate and Transport of Plastic Debris in Freshwaters: Review and Guidance. In Freshwater Microplastics; Wagner, M., Lambert, S., Eds.; Springer: Cham, Switzerland, 2018; pp. 125–152. [Google Scholar]
  6. Koelmans, A.A.; Besseling, E.; Shim, W.J. Nanoplastics in the aquatic environment. Critical review. In Marine anthropogenic Litter; Bergmann, M., Gutow, L., Klages, M., Eds.; Springer: Berlin, Germany, 2015; pp. 325–340. [Google Scholar]
  7. Mattsson, K.; Hansson, L.A.; Cedervall, T. Nano-plastics in the aquatic environment. Environ. Sci. Process. Impacts 2015, 17, 1712–1721. [Google Scholar] [CrossRef] [PubMed]
  8. Arthur, C.; Baker, J.; Bamford, H. Proceedings of the International Research Workshop on the Occurrence, Effects and Fate of Microplastic Marine Debris; NOAA Technical Memorandum: Tacoma, WA, USA, 2008; Volume NOAA Technical Memorandum NOS-OR&R-30; p. 528. [Google Scholar]
  9. Hidalgo-Ruz, V.; Gutow, L.; Thompson, R.C.; Thiel, M. Microplastics in the marine environment: A review of the methods used for identification and quantification. Environ. Sci. Technol. 2012, 46, 3060–3075. [Google Scholar] [CrossRef] [PubMed]
  10. Sanchez, W.; Bender, C.; Porcher, J.M. Wild gudgeons (Gobio gobio) from French rivers are contaminated by microplastics: Preliminary study and first evidence. Environ. Res. 2014, 128, 98–100. [Google Scholar] [CrossRef] [PubMed]
  11. Faure, F.; Demars, C.; and Wieser, O.; Kunz, M.; de Alencastro, L.F. Plastic pollution in Swiss surface waters: Nature and concentrations, interaction with pollutants. Environ. Chem. 2015, 12, 582–591. [Google Scholar] [CrossRef]
  12. Kooi, M.; Koelmans, A.A. Simplifying Microplastic via Continuous Probability Distributions for Size, Shape, and Density. Environ. Sci. Technol. Lett. 2019, 6, 551–557. [Google Scholar] [CrossRef] [Green Version]
  13. Wu, C.; Zhang, K.; Xiong, X. Microplastic Pollution in Inland Waters Focusing on Asia. In Freshwater Microplastics; Wagner, M., Lambert, S., Eds.; Springer: Cham, Switzerland, 2018; pp. 85–99. [Google Scholar]
  14. Dikareva, N.; Simon, K.S. Microplastic pollution in streams spanning an urbanization gradient. Environ. Pollut. 2019, 250, 292–299. [Google Scholar] [CrossRef] [PubMed]
  15. Unice, K.M.; Weeber, M.P.; Abramson, M.M.; Reid, R.C.D.; van Gils, J.A.G.; Markus, A.A.; Vethaak, A.D.; Panko, J.M. Characterizing export of land-based microplastics to the estuary—Part I: Application of integrated geospatial microplastic transport models to assess tire and road wear particles in the Seine watershed. Sci. Total Environ. 2019, 646, 1639–1649. [Google Scholar] [CrossRef]
  16. Kawecki, D.; Nowack, B. A proxy-based approach to predict spatially resolved emissions of macro- and microplastic to the environment. Sci. Total Environ. 2020, 748, 141137. [Google Scholar] [CrossRef]
  17. EPA. Report to Congress: Combined Sewer Overflows to the Lake Michigan Basin EPA-833-R-07-007. Available online: https://www.epa.gov/sites/default/files/2015-10/documents/cso_reporttocongress_lakemichigan.pdf (accessed on 9 December 2007).
  18. Eriksen, M.; Mason, S.; Wilson, S.; Box, C.; Zellers, A.; Edwards, W.; Farley, H.; Amato, S. Microplastic pollution in the surface waters of the Laurentian Great Lakes. Mar. Pollut. Bull. 2013, 77, 177–182. [Google Scholar] [CrossRef] [PubMed]
  19. Dris, R.; Gasperi, J.; Tassin, B. Sources and Fate of Microplastics in Urban Areas: A Focus on Paris Megacity. In Freshwater Microplastics; Wagner, M., Lambert, S., Eds.; Springer: Cham, Switzerland, 2018; pp. 69–83. [Google Scholar]
  20. Polanco, H.; Hayes, S.; Roble, C.; Krupitsky, M.; Branco, B. The presence and significance of microplastics in surface water in the Lower Hudson River Estuary 2016–2019: A research note. Mar. Pollut. Bull. 2020, 161, 111702. [Google Scholar] [CrossRef] [PubMed]
  21. Rowley, K.H.; Cucknell, A.C.; Smith, B.D.; Clark, P.F.; Morritt, D. London’s river of plastic: High levels of microplastics in the Thames water column. Sci. Total Environ. 2020, 740, 140018. [Google Scholar] [CrossRef] [PubMed]
  22. Chen, H.; Jia, Q.; Zhao, X.; Li, L.; Nie, Y.; Liu, H.; Ye, J. The occurrence of microplastics in water bodies in urban agglomerations: Impacts of drainage system overflow in wet weather, catchment land-uses, and environmental management practices. Water Res. 2020, 183. [Google Scholar] [CrossRef] [PubMed]
  23. Wagner, S.; Klöckner, P.; Stier, B.; Römer, M.; Seiwert, B.; Reemtsma, T.; Schmidt, C. Relationship between Discharge and River Plastic Concentrations in a Rural and an Urban Catchment. Environ. Sci. Technol. 2019, 53, 10082–10091. [Google Scholar] [CrossRef] [PubMed]
  24. Baresel, C.; Olshammar, M. On the Importance of Sanitary Sewer Overflow on the Total Discharge of Microplastics from Sewage Water. J. Environ. Prot. 2019, 10, 1105–1118. [Google Scholar] [CrossRef] [Green Version]
  25. Schernewski, G.; Radtke, H.; Hauk, R.; Baresel, C.; Olshammar, M.; Oberbeckmann, S. Urban Microplastics Emissions: Effectiveness of Retention Measures and Consequences for the Baltic Sea. Front. Mar. Sci. 2021, 8, 594415. [Google Scholar] [CrossRef]
  26. Osinski, R.D.; Enders, K.; Gräwe, U.; Klingbeil, K.; Radtke, H. Model uncertainties of a storm and their influence on microplastics/sediment transport in the Baltic Sea. Ocean. Sci. 2020, 16, 1491–1507. [Google Scholar] [CrossRef]
  27. Osinski, R.D.; Radtke, H. Ensemble hindcasting of wind and wave conditions with WRF and Wavewatch III R driven by ERA5. Ocean. Sci. 2020, 16, 355–371. [Google Scholar] [CrossRef] [Green Version]
  28. Schernewski, G.; Radtke, H.; Robbe, E.; Haseler, M.; Hauk, R.; Meyer, L.; Piehl, S.; Riedel, J.; Labrenz, M. Emission, Transport, and Deposition of visible Plastics in an Estuary and the Baltic Sea—a Monitoring and Modeling Approach. Environ. Manage. 2021, 68, 860–881. [Google Scholar] [CrossRef]
  29. Bollmann, U.E.; Simon, M.; Vollertsen, J.; Bester, K. Assessment of input of organic micropollutants and microplastics into the Baltic Sea by urban waters. Mar. Pollut. Bull. 2019, 148, 149–155. [Google Scholar] [CrossRef]
  30. Schmidt, C.; Kumar, R.; Yang, S.; Büttner, O. Microplastic particle emission from wastewater treatment plant effluents into river networks in Germany: Loads, spatial patterns of concentrations and potential toxicity. Sci. Total Environ. 2020, 737, 139544. [Google Scholar] [CrossRef] [PubMed]
  31. Castro-Orgaz, O.; Hager, W.H. Subcritical side-weir flow at high lateral discharge. J. Hydraul. Eng. 2012, 138, 777–787. [Google Scholar] [CrossRef] [Green Version]
  32. Granata, F.; de Marinis, G.; Gargano, R.; Tricarico, C. Novel approach for side weirs in supercritical flow. J. Irrig. Drain. Eng. 2013, 139, 672–679. [Google Scholar] [CrossRef]
  33. Azamathulla, H.M.; Haghiabi, A.H.; Parsaie, A. Prediction of side weir discharge coefficient by support vector machine technique. Water Supply 2016, 16, 1002–1016. [Google Scholar] [CrossRef] [Green Version]
  34. Granata, F.; de Marinis, G. Machine learning methods for wastewater hydraulics. Flow. Meas. Instrum. 2017, 57, 1–9. [Google Scholar] [CrossRef]
  35. Ghaderi, A.; Dasineh, M.; Abbasi, S.; Abraham, J. Investigation of trapezoidal sharp-crested side weir discharge coefficients under subcritical flow regimes using CFD. Appl. Water Sci. 2020, 10, 1–12. [Google Scholar] [CrossRef] [Green Version]
  36. Saffar, S.; Babarsad, M.S.; Shooshtari, M.M.; Hosein Poormohammadi, M.; Riazi, R. Prediction of the discharge of side weir in the converge channels using artificial neural networks. Flow Meas. Instrum. 2021, 78, 101889. [Google Scholar] [CrossRef]
  37. Di Nunno, F.; Alves, F.P.; de Marinis, G.; Di Felice, F.; Gargano, R.; Granata, F.; Miozzi, M. Two-Phase PIV-LIF Measurements in a Submerged Bubbly Water Jet. J. Hydraul. Eng. 2019, 145, 04019030. [Google Scholar] [CrossRef]
  38. Bijankhan, M.; Ferro, V. Dimensional analysis and stage-discharge relationship for weirs: A review. J. Agric. Eng. 2017, 48, 1–11. [Google Scholar] [CrossRef]
  39. Granata, F.; Gargano, R.; Santopietro, S. A flow field characterization in a circular channel along a side weir. Flow. Meas. Instrum. 2016, 52, 92–100. [Google Scholar] [CrossRef]
  40. Granata, F.; Di Nunno, F.; Gargano, R.; de Marinis, G. Equivalent Discharge Coefficient of Side Weirs in Circular Channel-A Lazy Machine Learning Approach. Water 2019, 11, 2406. [Google Scholar] [CrossRef] [Green Version]
  41. Cheval, N.; Gindy, N.; Flowkes, C.; Fahmi, A. Polyamide 66 microspheres metallised with in situ synthesised gold nanoparticles for a catalytic application. Nanoscale Res. Lett. 2012, 7, 182. [Google Scholar] [CrossRef] [PubMed] [Green Version]
  42. Mahmoudi-Rad, M.; Najafzadeh, M. Air Entrainment Mechanism in the Vortex Structure: Experimental Study. J. Irrig. Drain. Eng. 2021, 147, 04021007. [Google Scholar] [CrossRef]
  43. Amiri-Ardakani, Y.; Najafzadeh, M. Pipe Break Rate Assessment While Considering Physical and Operational Factors: A Methodology based on Global Positioning System and Data-Driven Techniques. Water Resour. Manage. 2021, 35, 3703–3720. [Google Scholar] [CrossRef]
  44. Moore, D.S.; Notz, W.I.; Flinger, M.A. The Basic Practice of Statistics, 8th ed.; W.H. Freeman and Company: New York, NY, USA, 2018; p. 654. [Google Scholar]
Figure 1. Laboratory model (a); sketch of the fiber collecting system (b); sampling and weighing of the nylon fibers (c); oven-drying process (d).
Jmse 09 01415 g001
Figure 2. Correlation matrix.
Jmse 09 01415 g002
Figure 3. Dimensionless weight of outflowing fibers W* versus dimensionless lateral water outflow Q* (a), and dimensionless geometric parameter S* (b).
Jmse 09 01415 g003
Figure 4. FTIR spectra of nylon fibers prior to and after the runs.
Jmse 09 01415 g004
Figure 5. Dimensionless weight W* expressed as a function of the dimensionless water discharge Q* and side weir size S* in comparison with the surface computed with Equation (11) and the contour lines with the same S*: 3D scatter plot (a); Q*-W* scatter plot (b).
Jmse 09 01415 g005
Table 1. Mean and standard deviation of the dimensionless weight.
S*Q*W*D* = 0.0250± σD* = 0.0250W*D* = 0.0375± σD* = 0.0375W*D* = 0.0500± σD* = 0.0500
0.1140.790.67 ± 0.010.60 ± 0.010.66 ± 0.01
0.80.75 ± 0.020.73 ± 0.010.72 ± 0.02
0.830.78 ± 0.030.75 ± 0.020.77 ± 0.03
0.1290.730.59 ± 0.010.57 ± 0.010.60 ± 0.02
0.750.67 ± 0.030.69 ± 0.020.64 ± 0.04
0.780.74 ± 0.050.72 ± 0.040.70 ± 0.06
0.1330.630.49 ± 0.020.58 ± 0.010.59 ± 0.02
0.650.53 ± 0.050.64 ± 0.010.65 ± 0.02
0.680.69 ± 0.070.70 ± 0.020.70 ± 0.03
0.1430.640.46 ± 0.040.45 ± 0.030.39 ± 0.01
0.660.53 ± 0.050.50 ± 0.040.53 ± 0.04
0.680.61 ± 0.060.68 ± 0.060.60 ± 0.05
0.1500.590.46 ± 0.010.50 ± 0.030.44 ± 0.03
0.610.51 ± 0.030.55 ± 0.020.58 ± 0.08
0.640.62 ± 0.050.70 ± 0.080.61 ± 0.10
0.1600.60.46 ± 0.020.49 ± 0.030.42 ± 0.02
0.620.57 ± 0.040.57 ± 0.050.62 ± 0.05
0.650.67 ± 0.060.64 ± 0.100.64 ± 0.07
0.1670.530.35 ± 0.040.34 ± 0.040.37 ± 0.02
0.550.50 ± 0.050.49 ± 0.070.51 ± 0.03
0.570.58 ± 0.080.61 ± 0.110.59 ± 0.06
0.1800.570.42 ± 0.050.47 ± 0.080.40 ± 0.08
0.580.51 ± 0.100.52 ± 0.070.51 ± 0.11
0.610.61 ± 0.050.62 ± 0.110.59 ± 0.12
0.2000.510.31 ± 0.060.30 ± 0.050.26 ± 0.08
0.530.45 ± 0.100.38 ± 0.080.36 ± 0.06
0.540.51 ± 0.070.42 ± 0.110.45 ± 0.13
Publisher’s Note: MDPI stays neutral with regard to jurisdictional claims in published maps and institutional affiliations.

