
An Analysis of the 8.85- and 4.42-Year Cycles in the Gulf of Maine

 ,
, 
Abstract
:1. Introduction
2. Data and Methodology
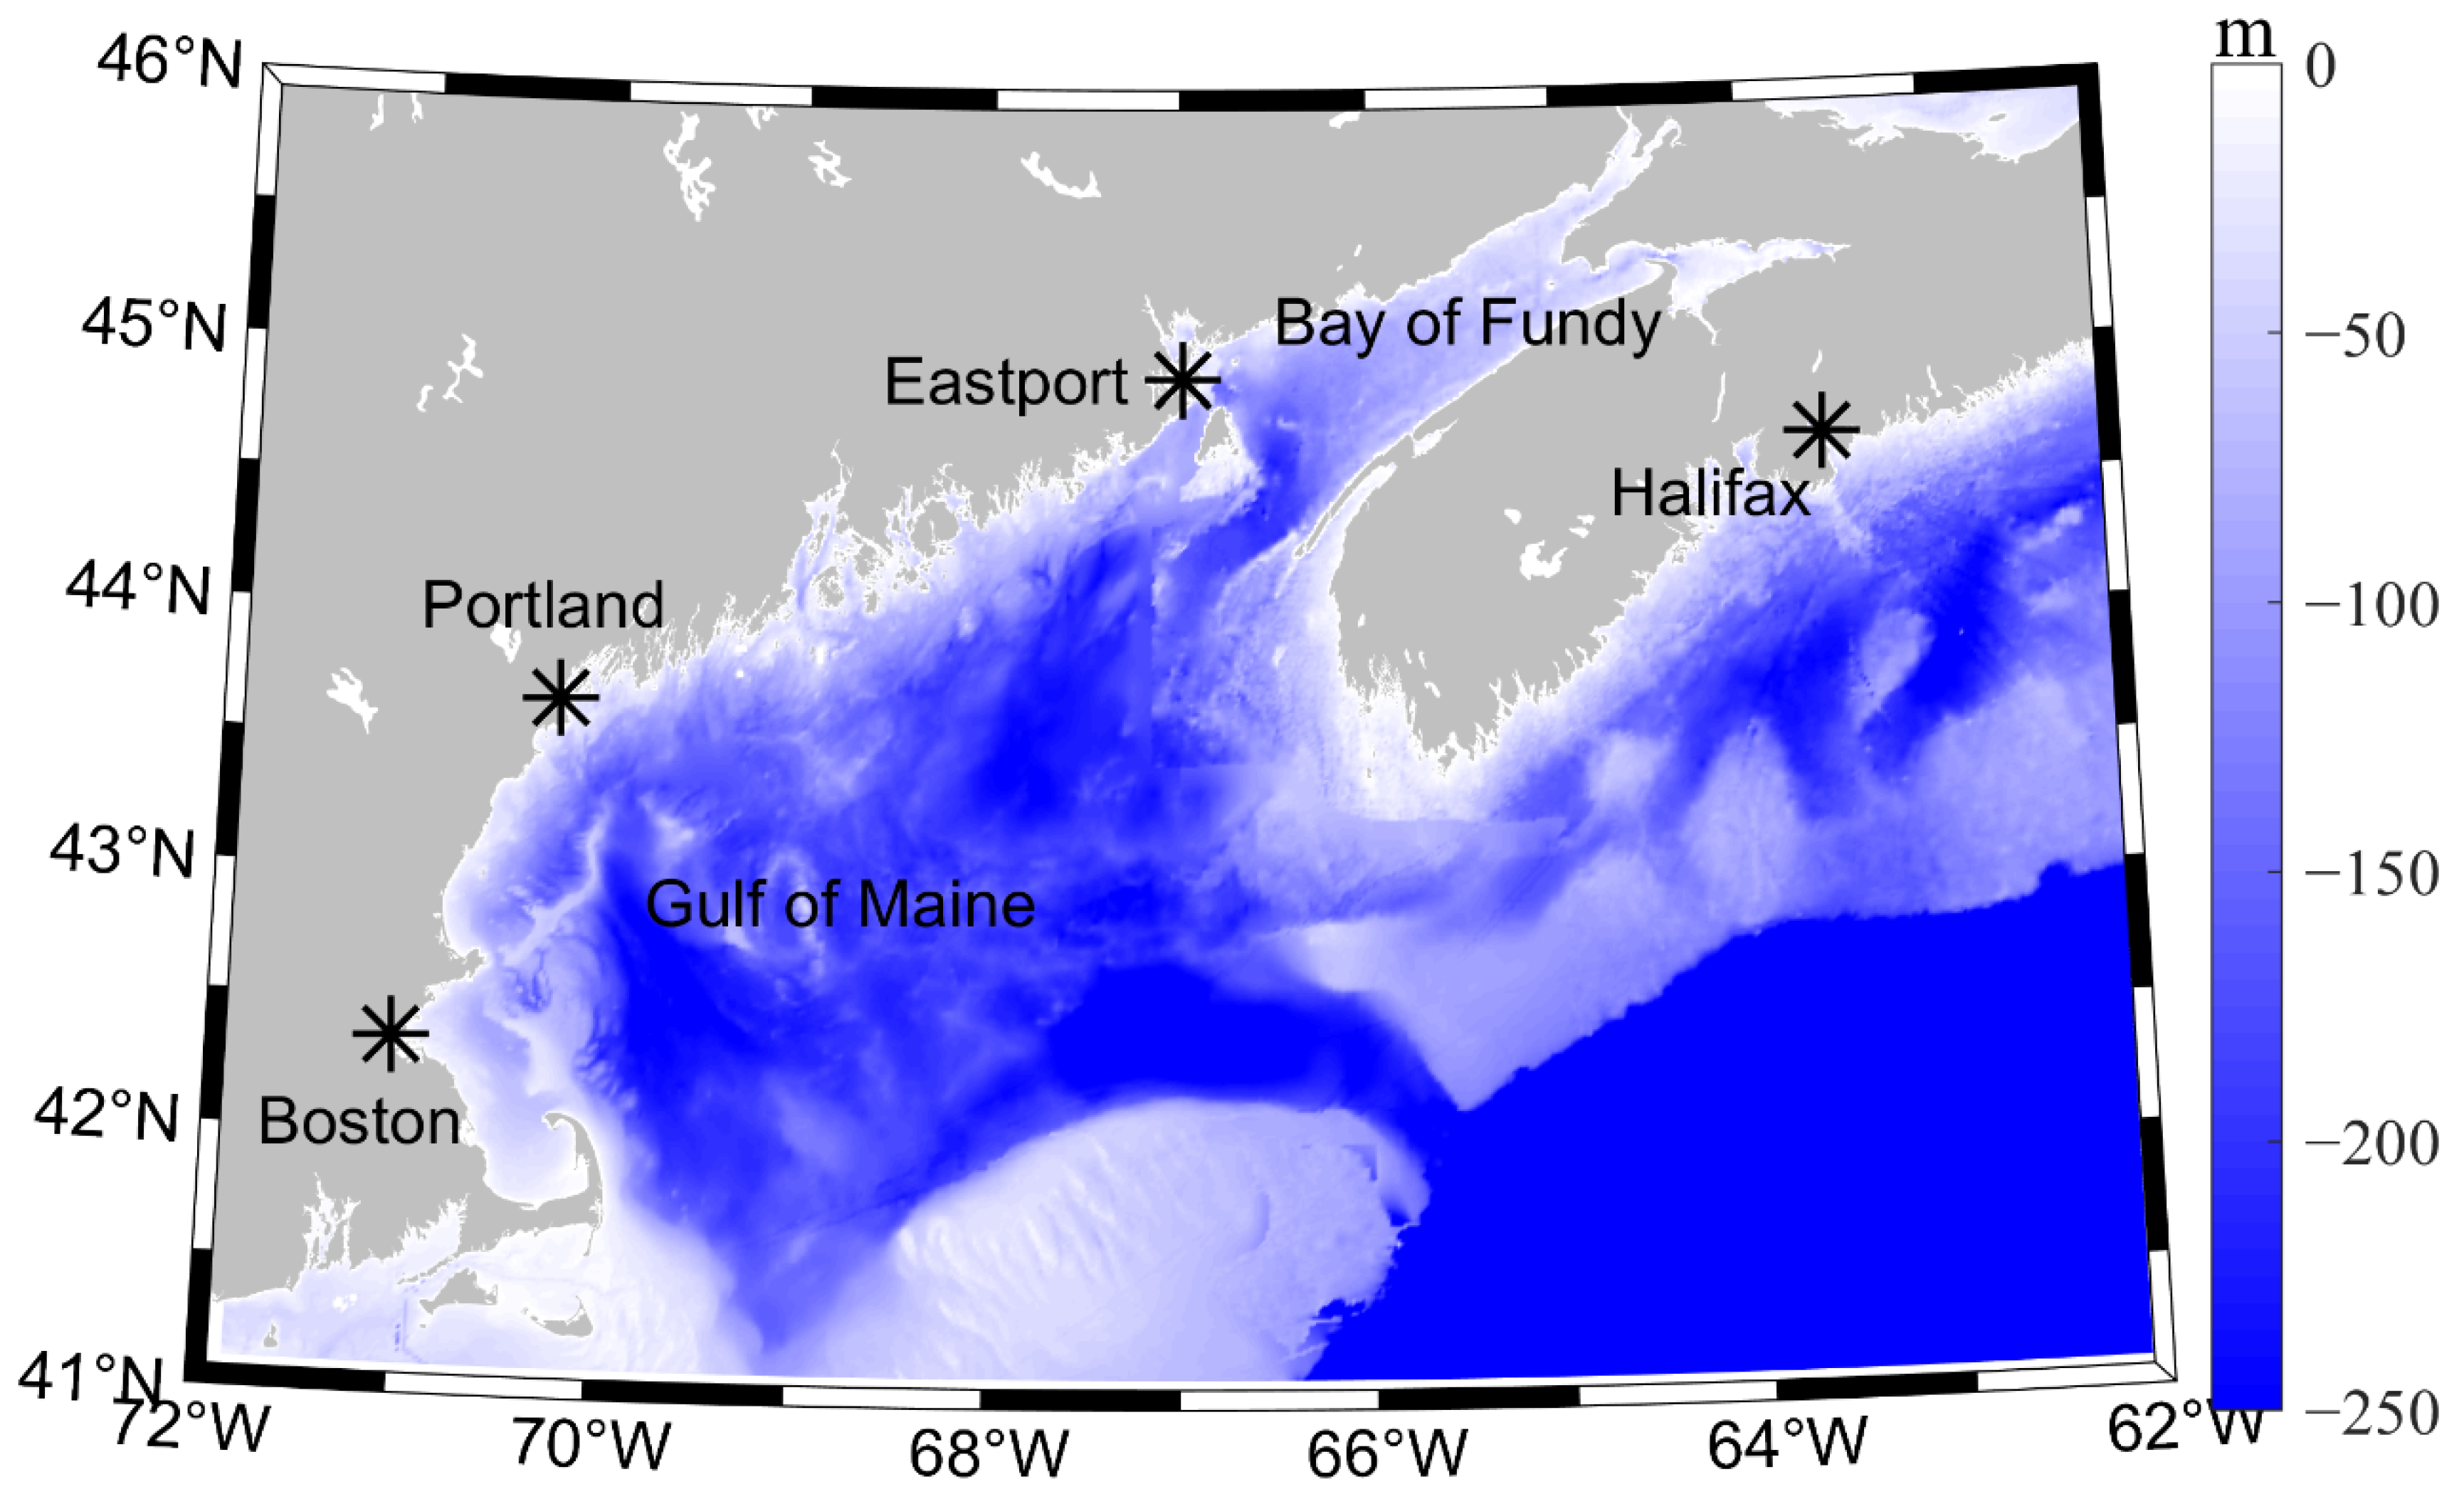
2.1. Data
2.2. Methodology
3. Results
3.1. Determine the Numbers of IPs
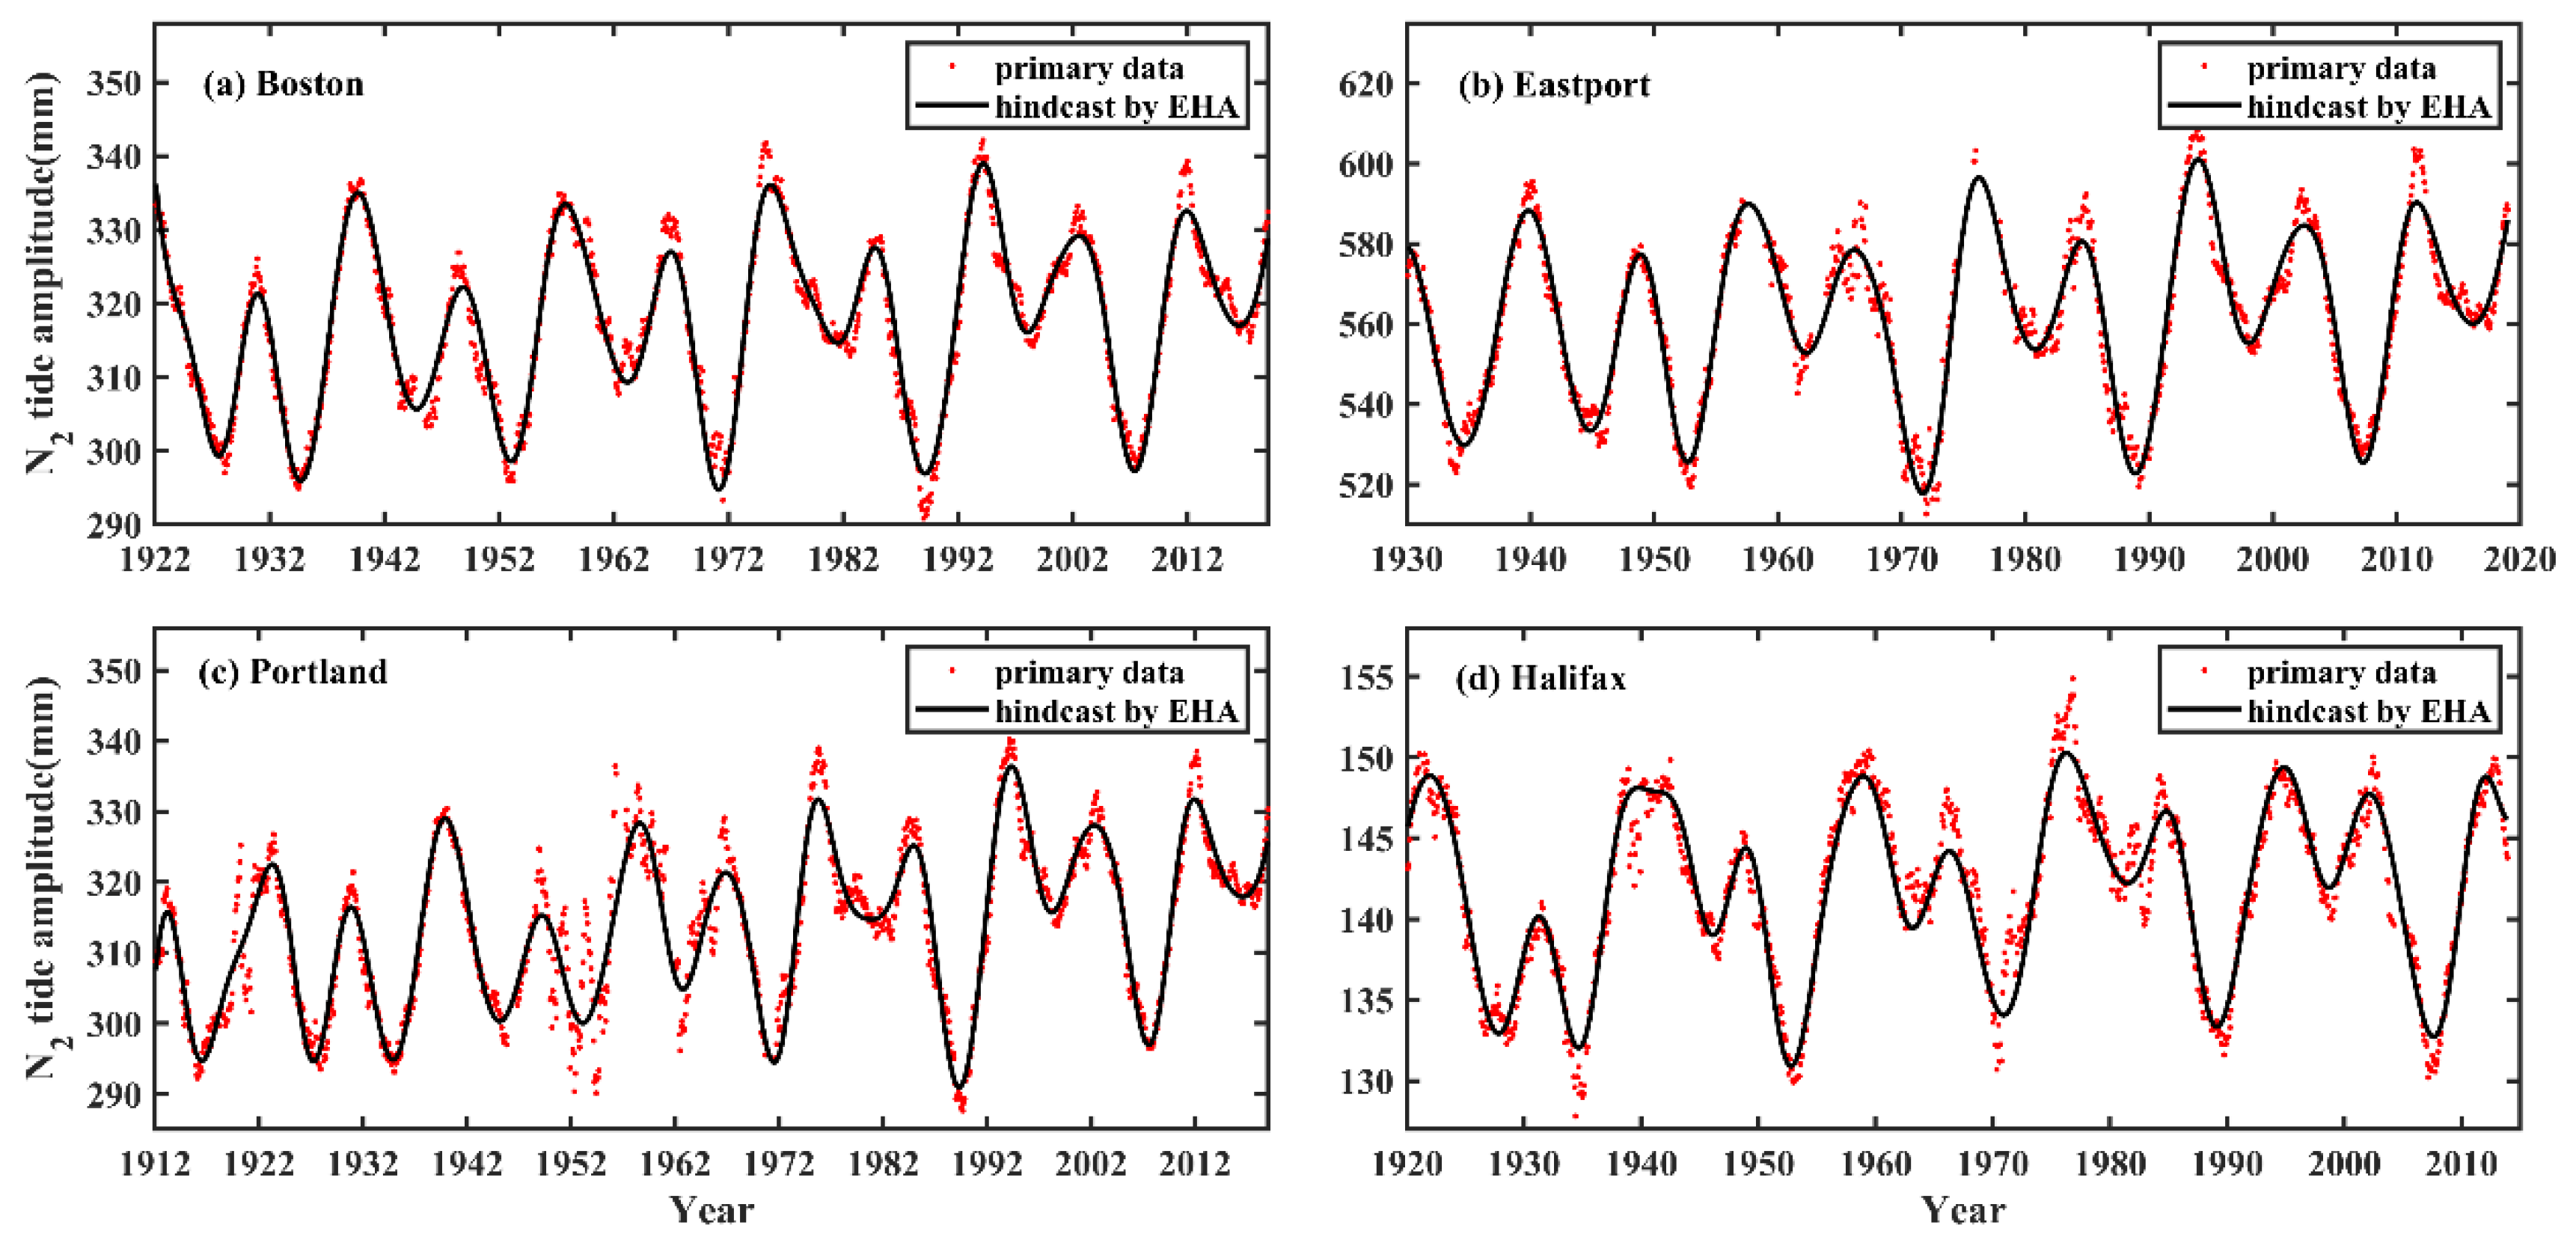
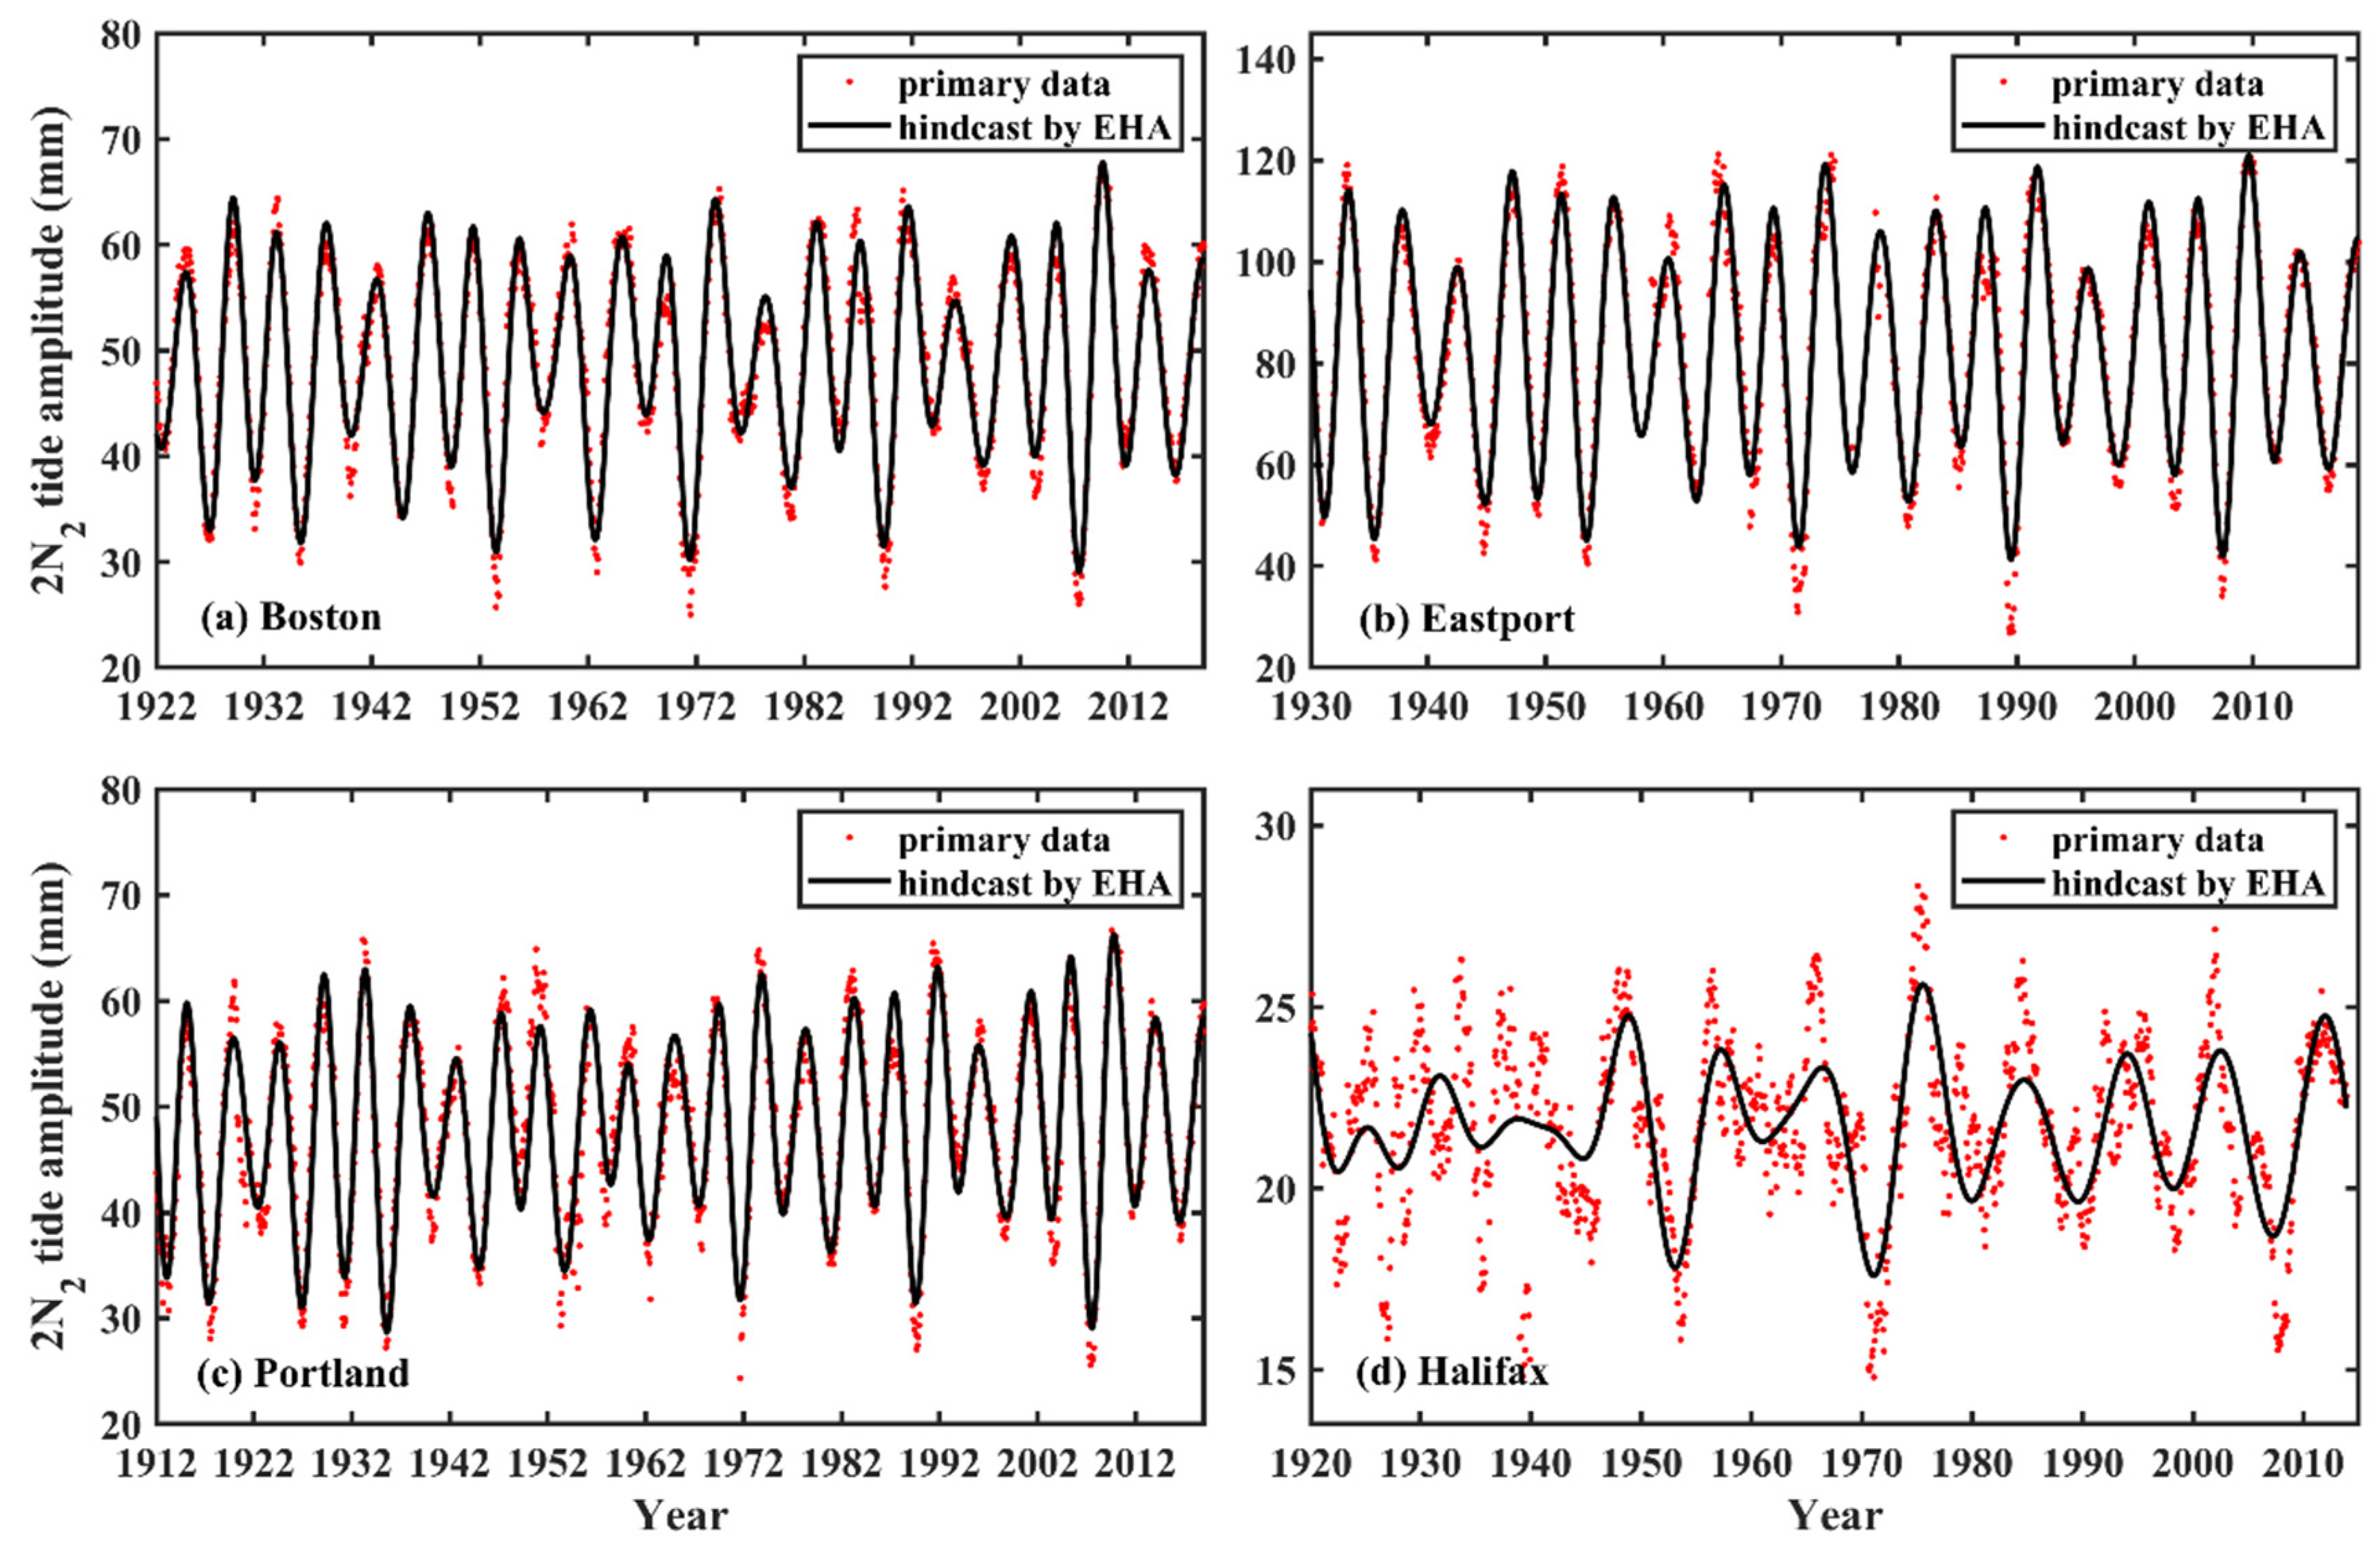
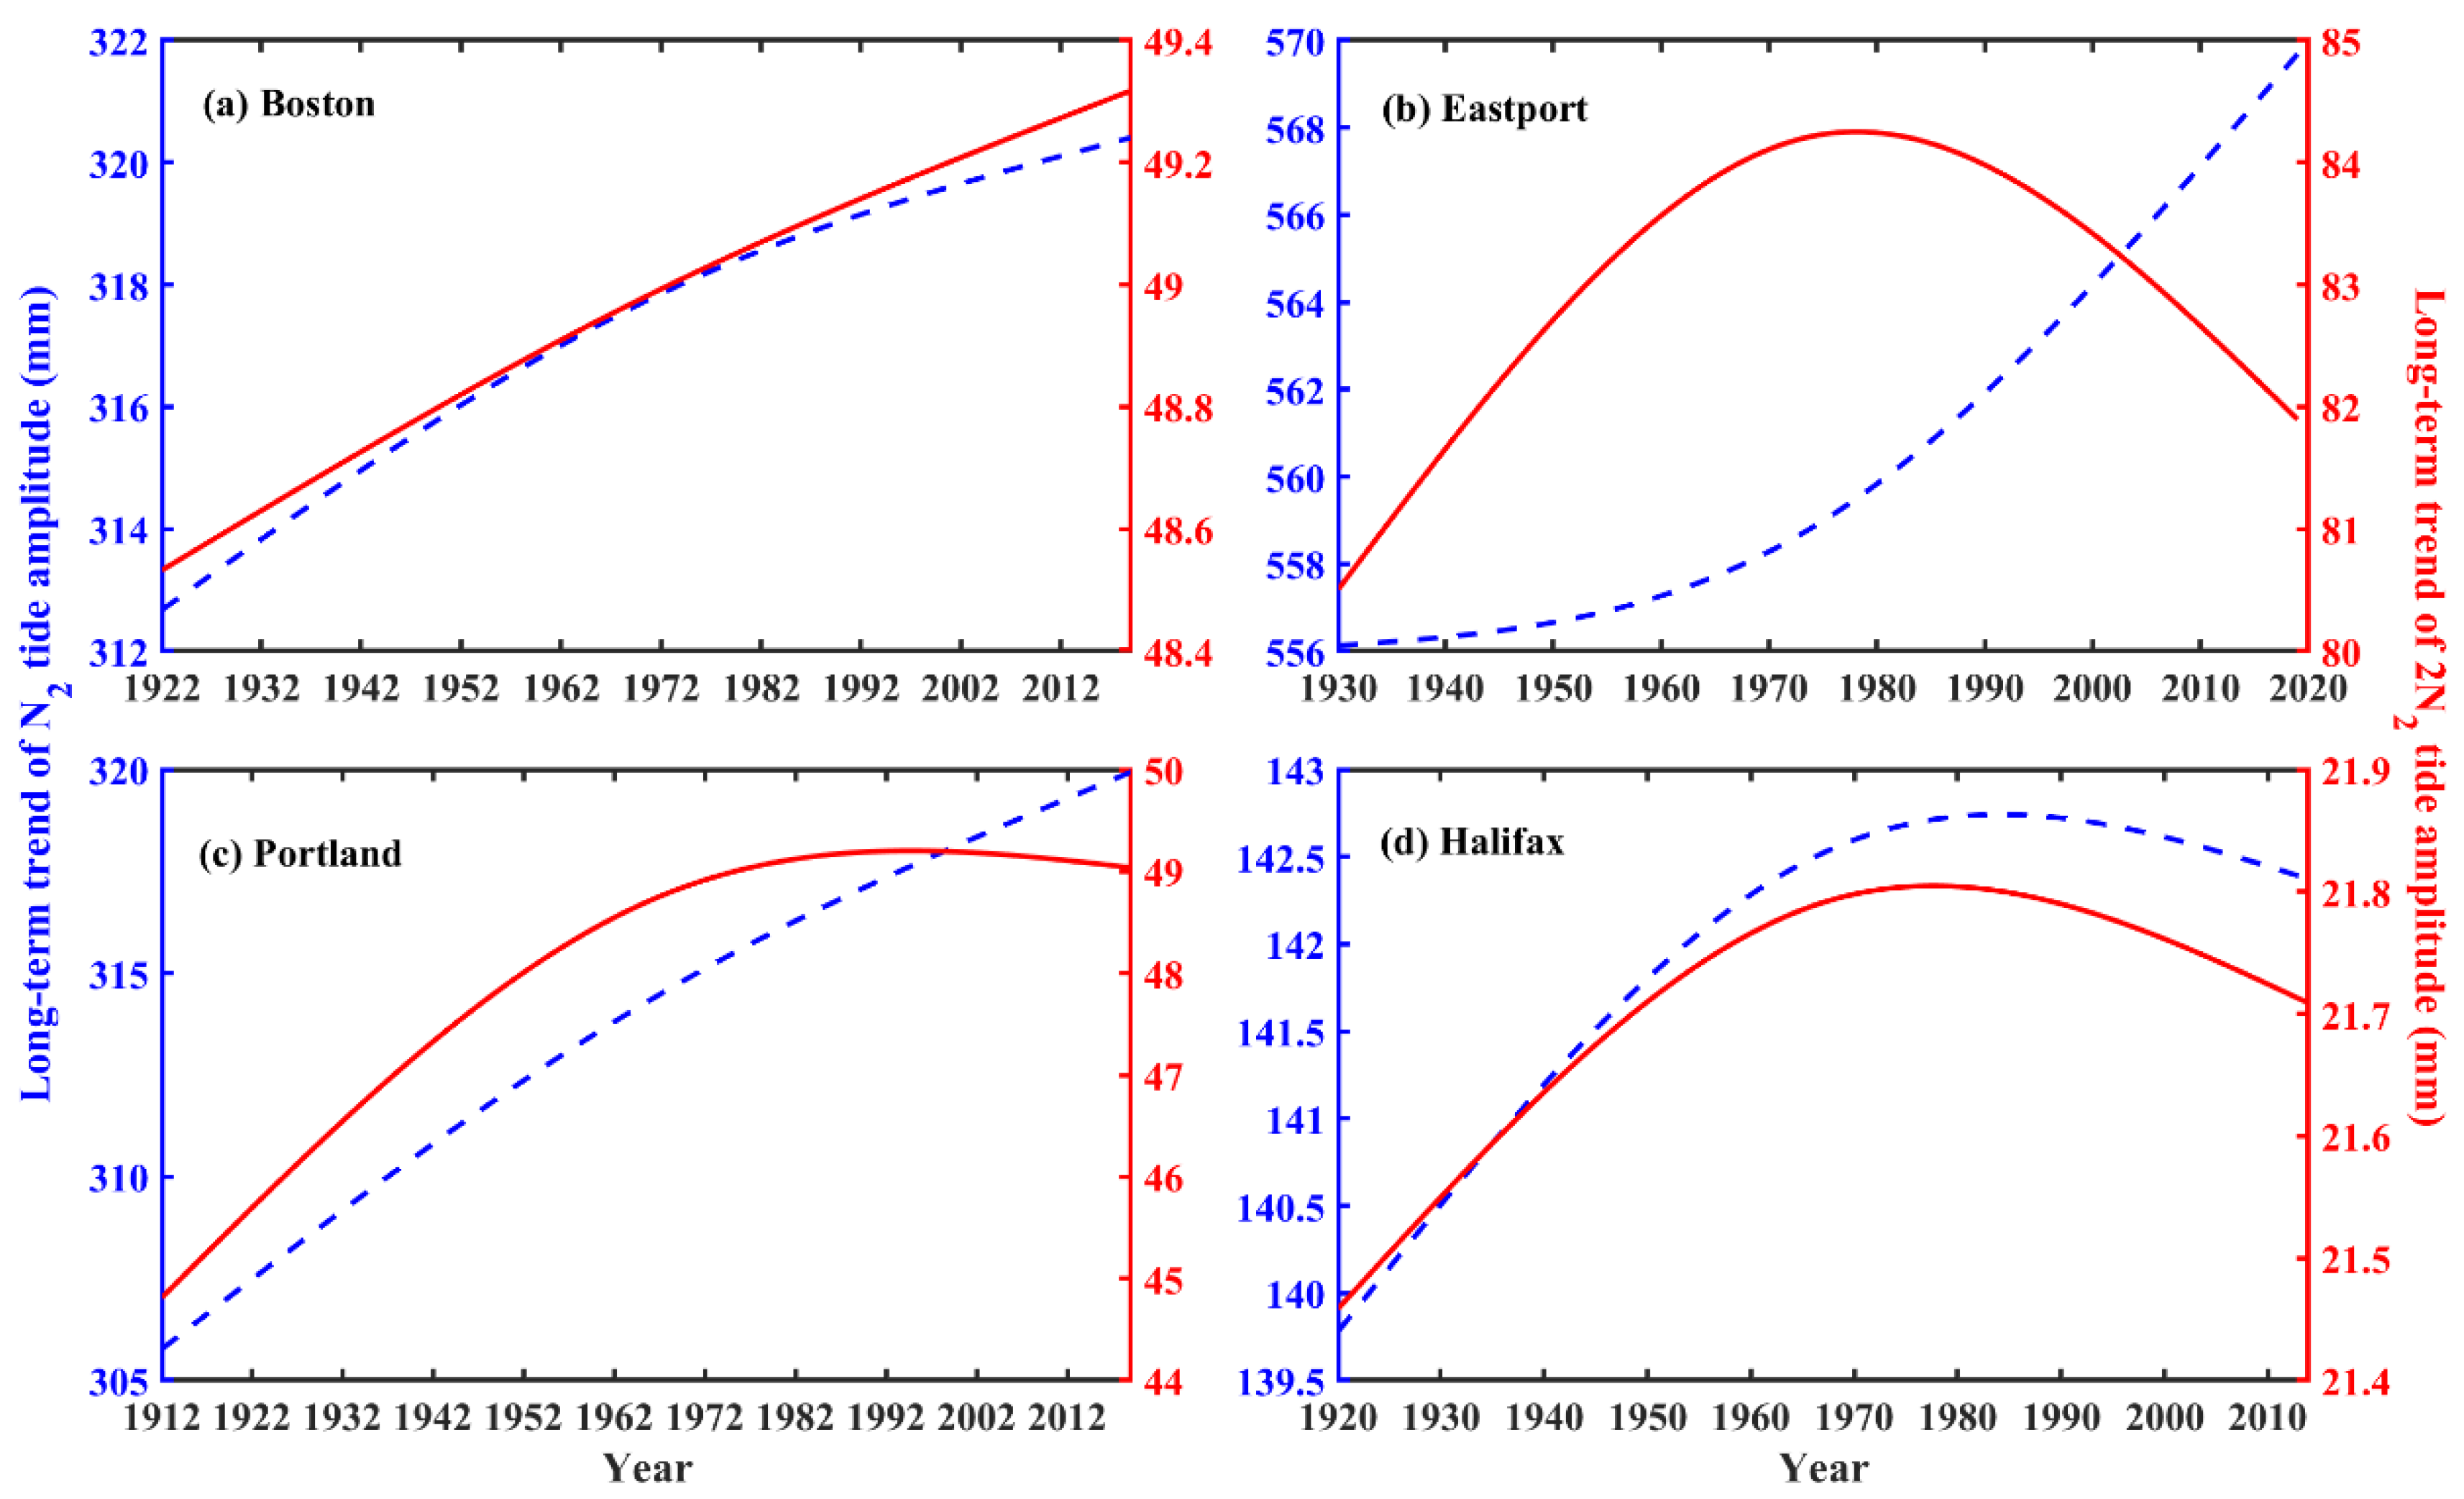
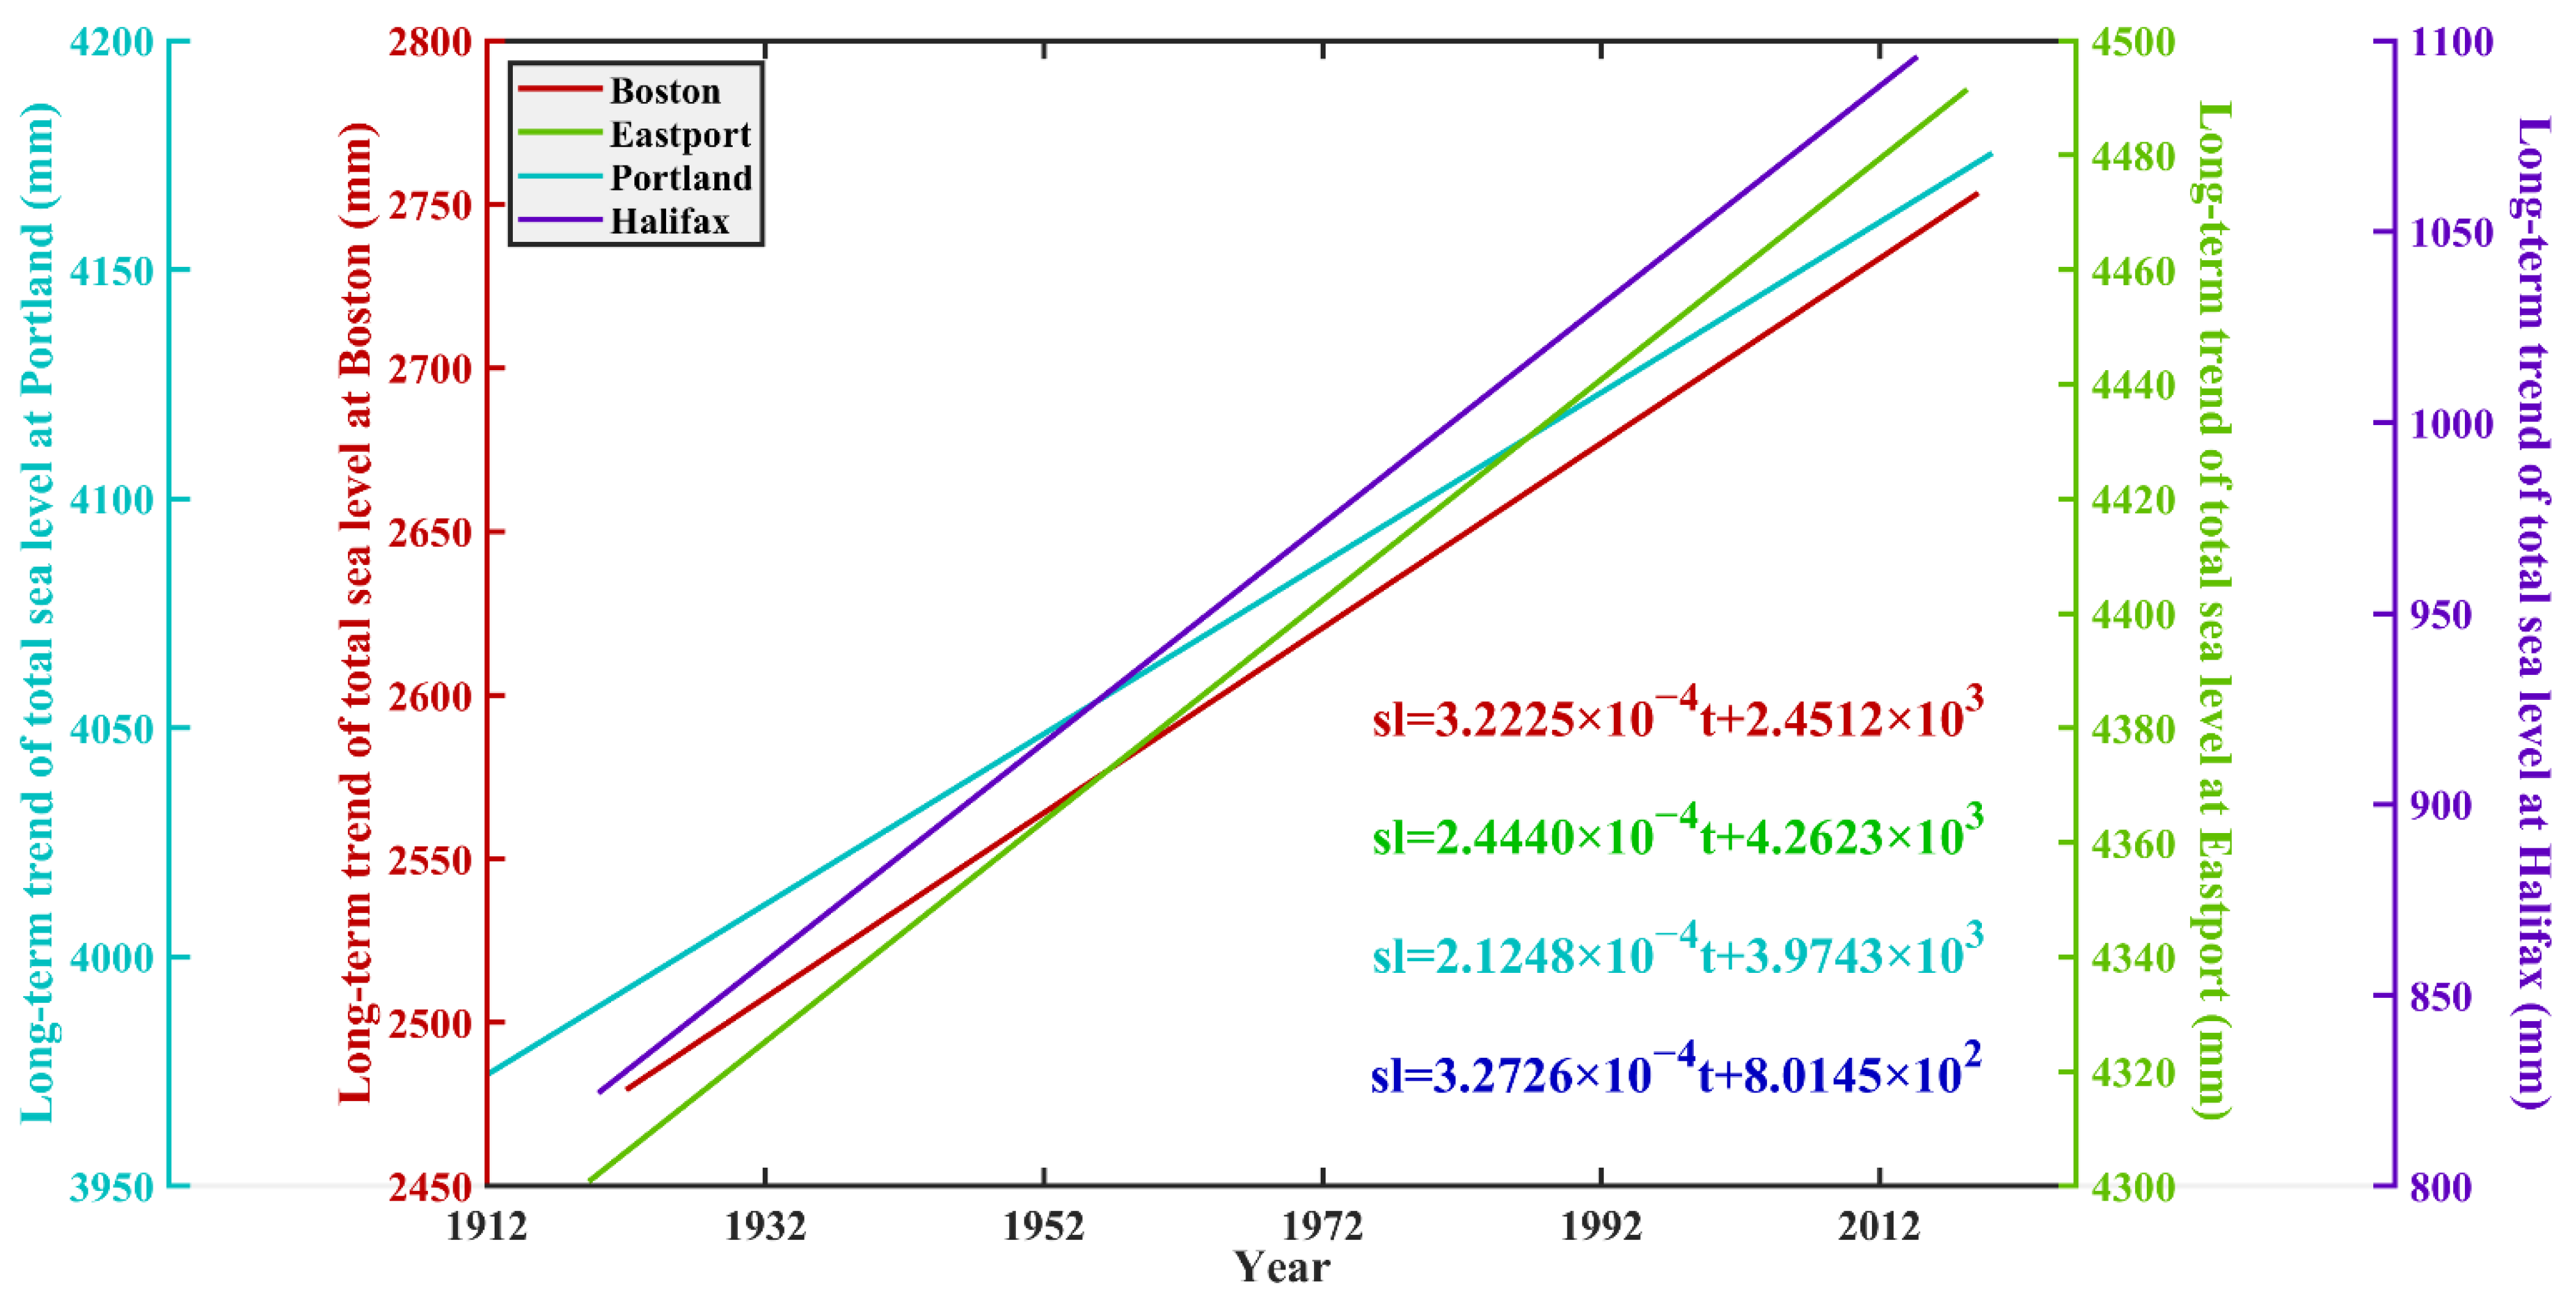
3.2. Long-Term Trend of N2 and 2N2 Tidal Amplitudes
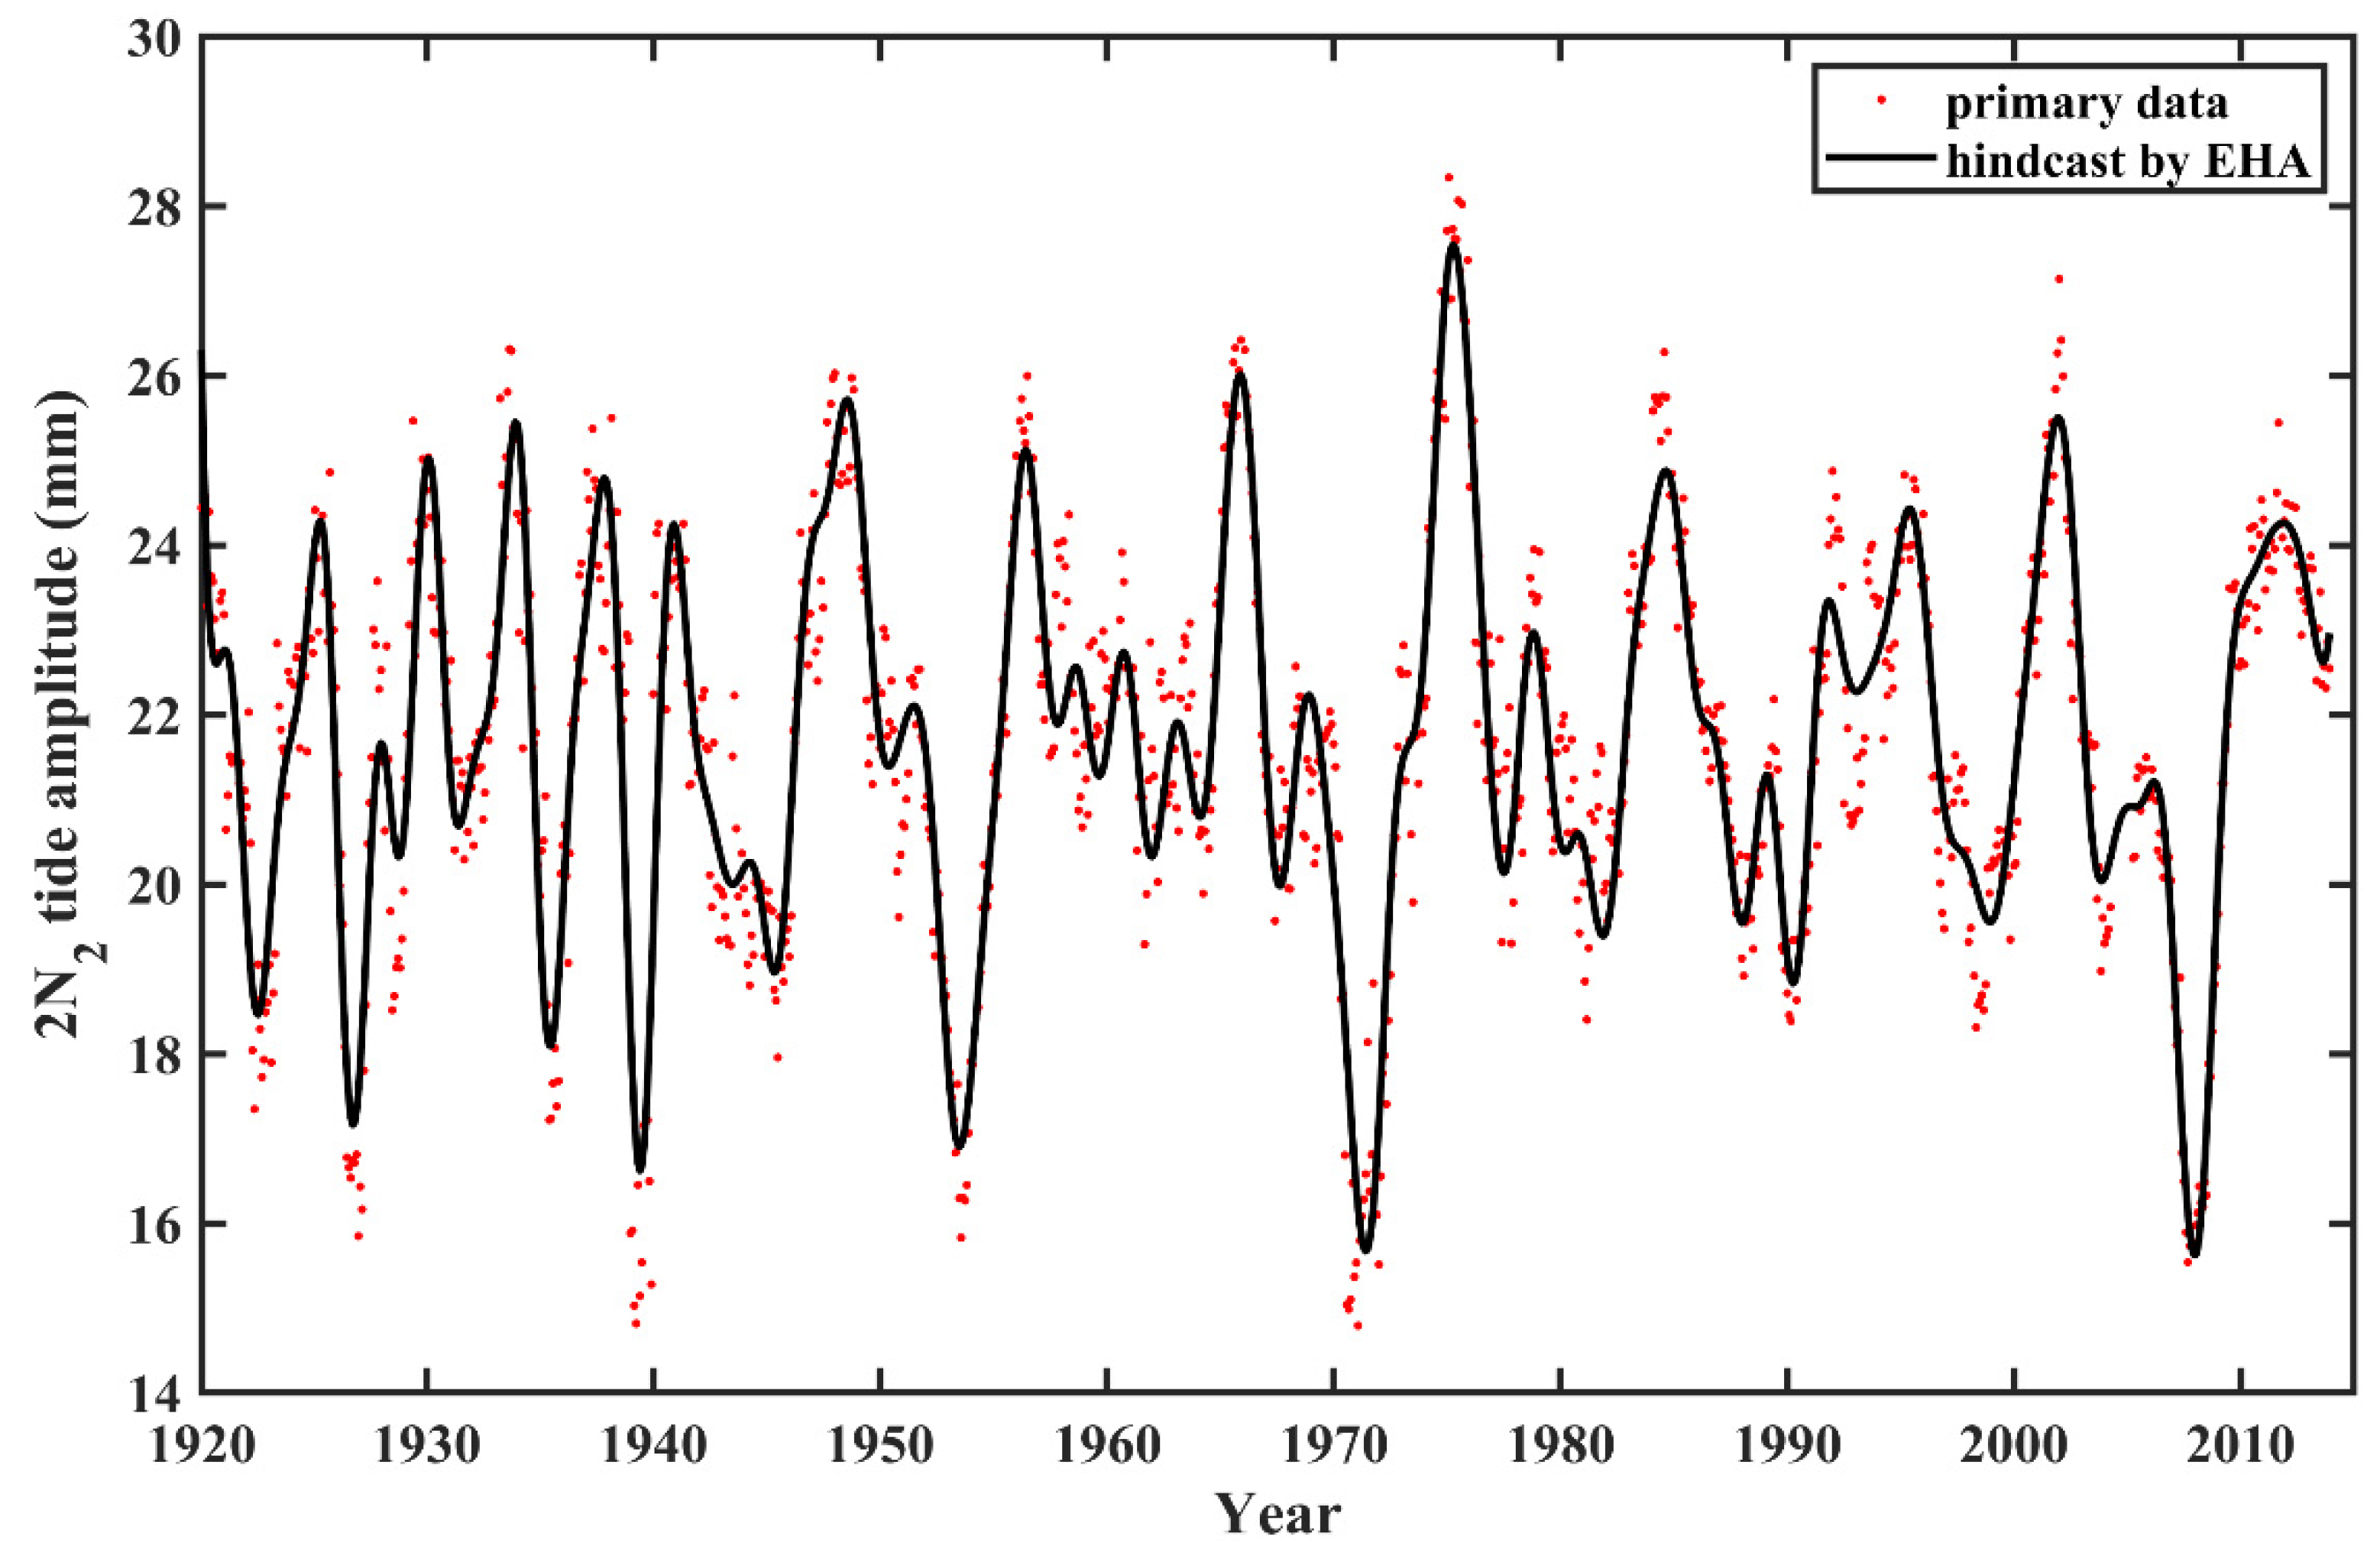
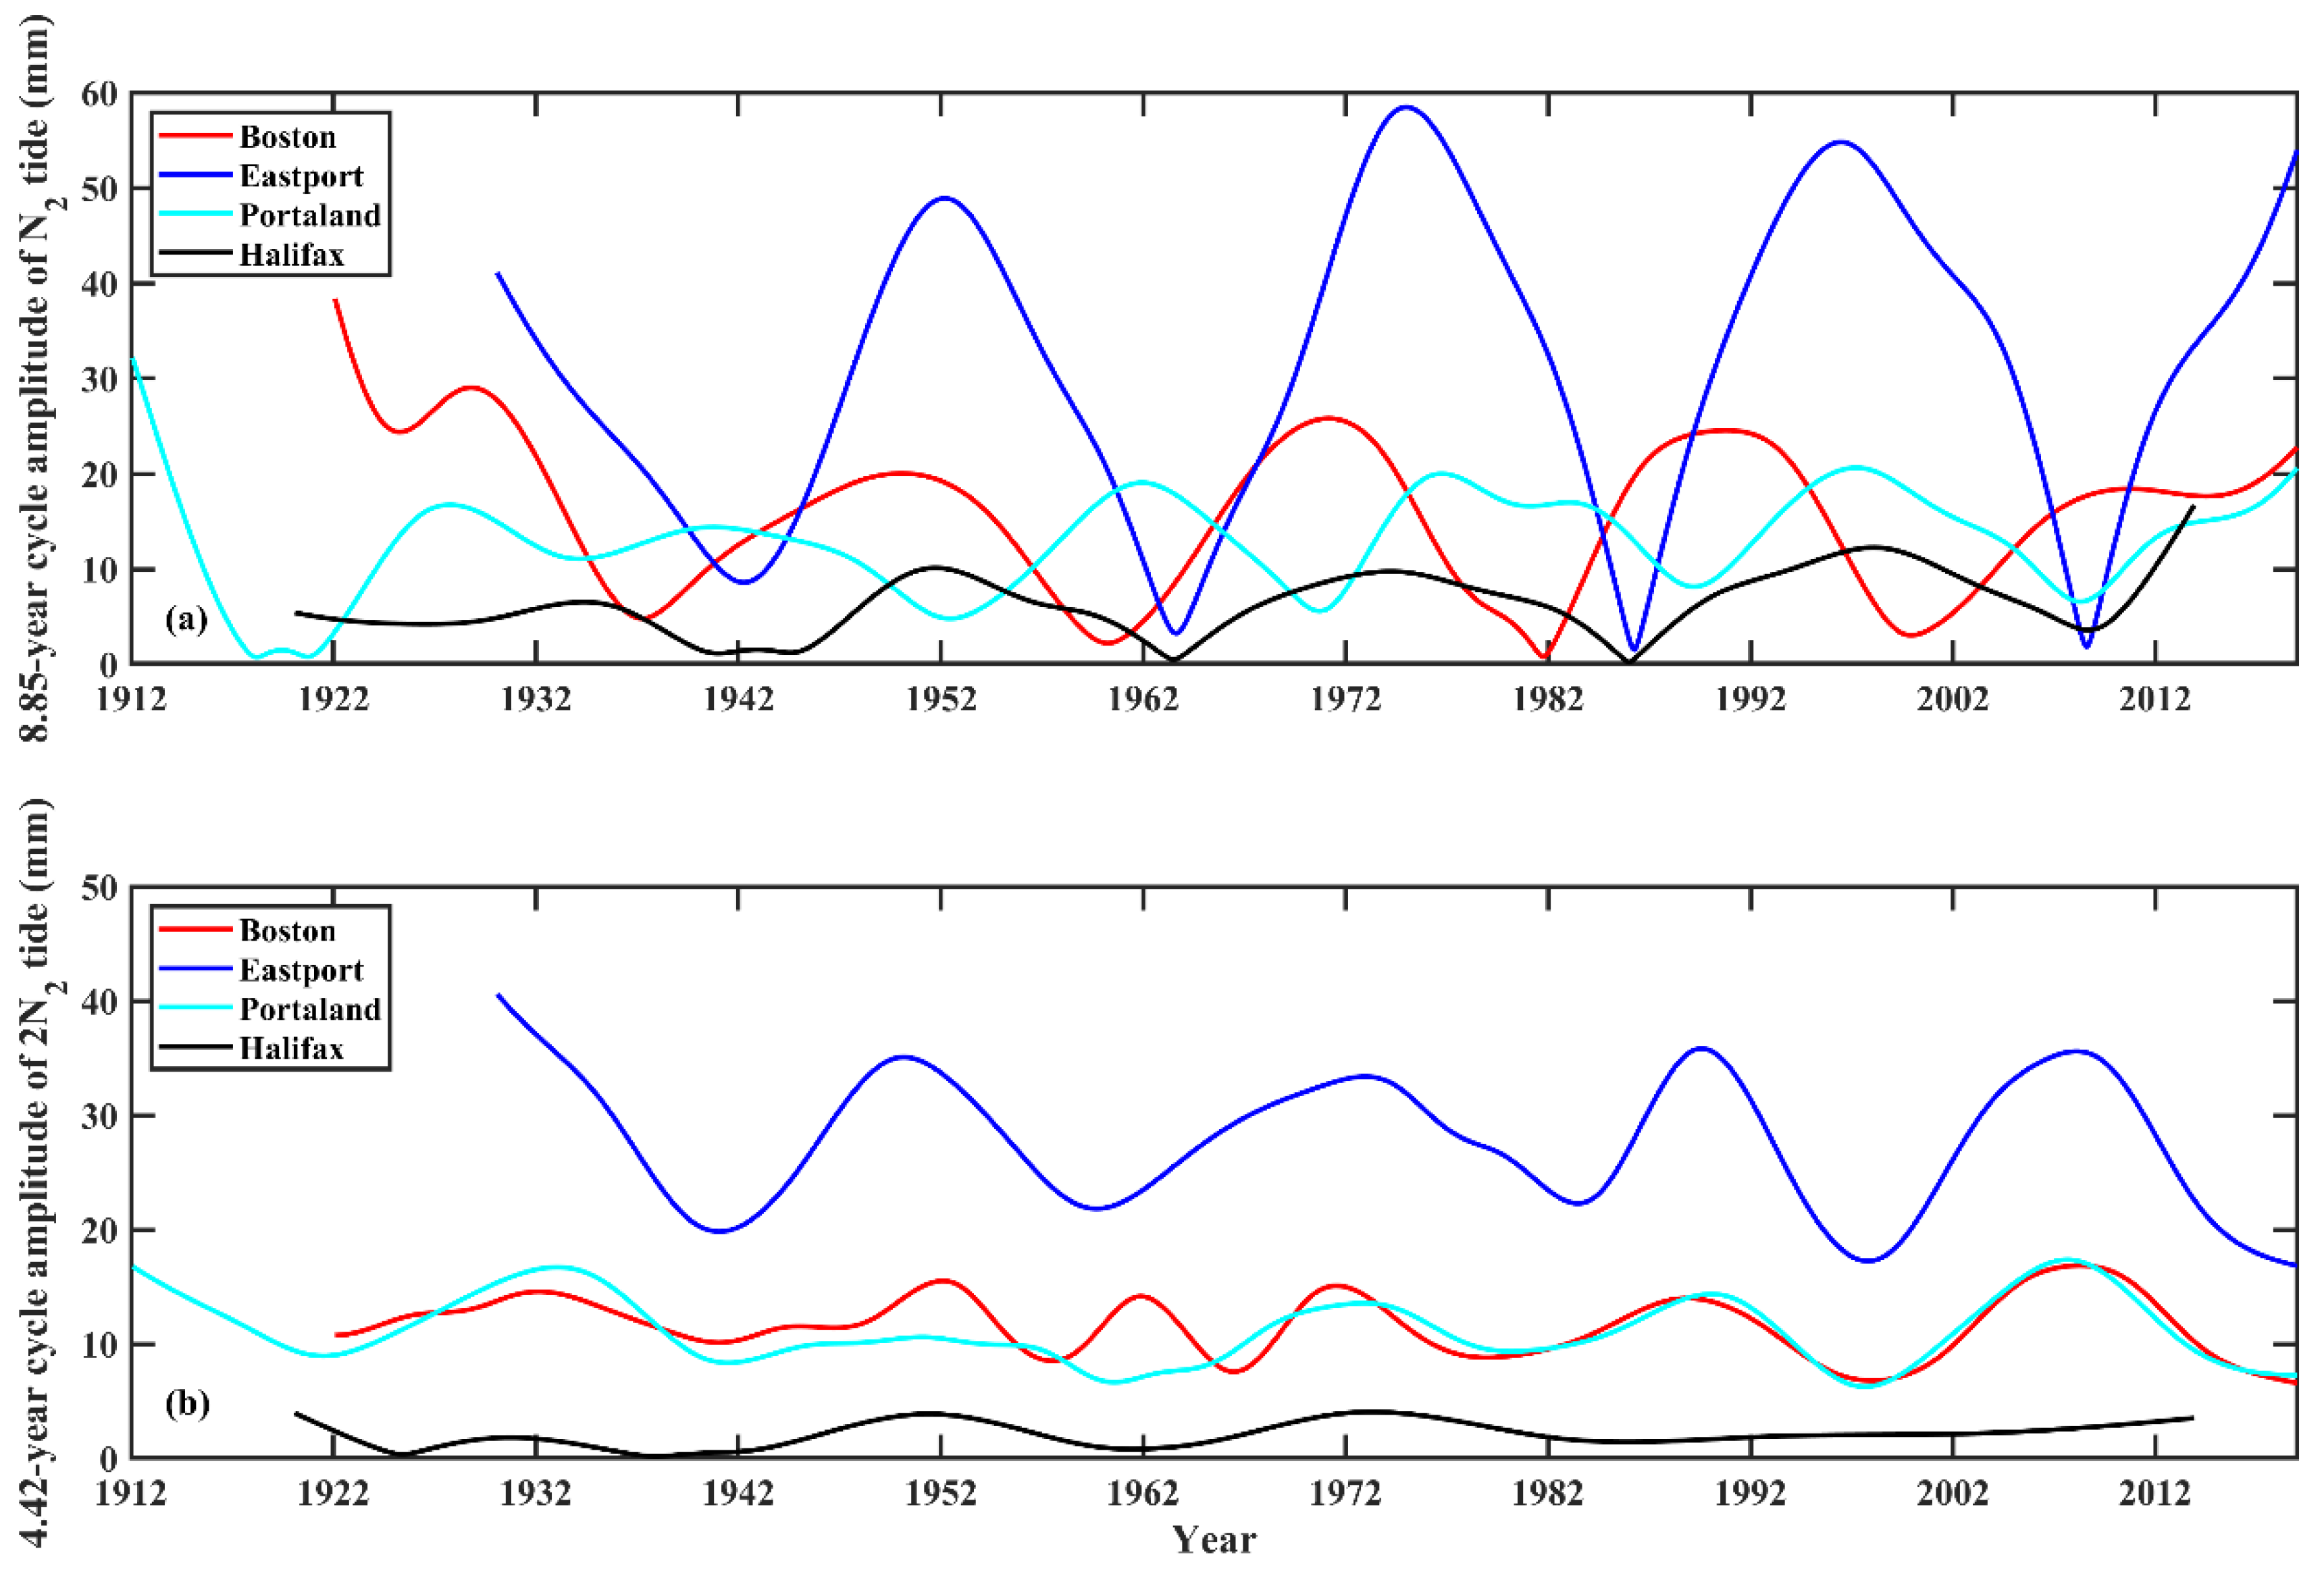
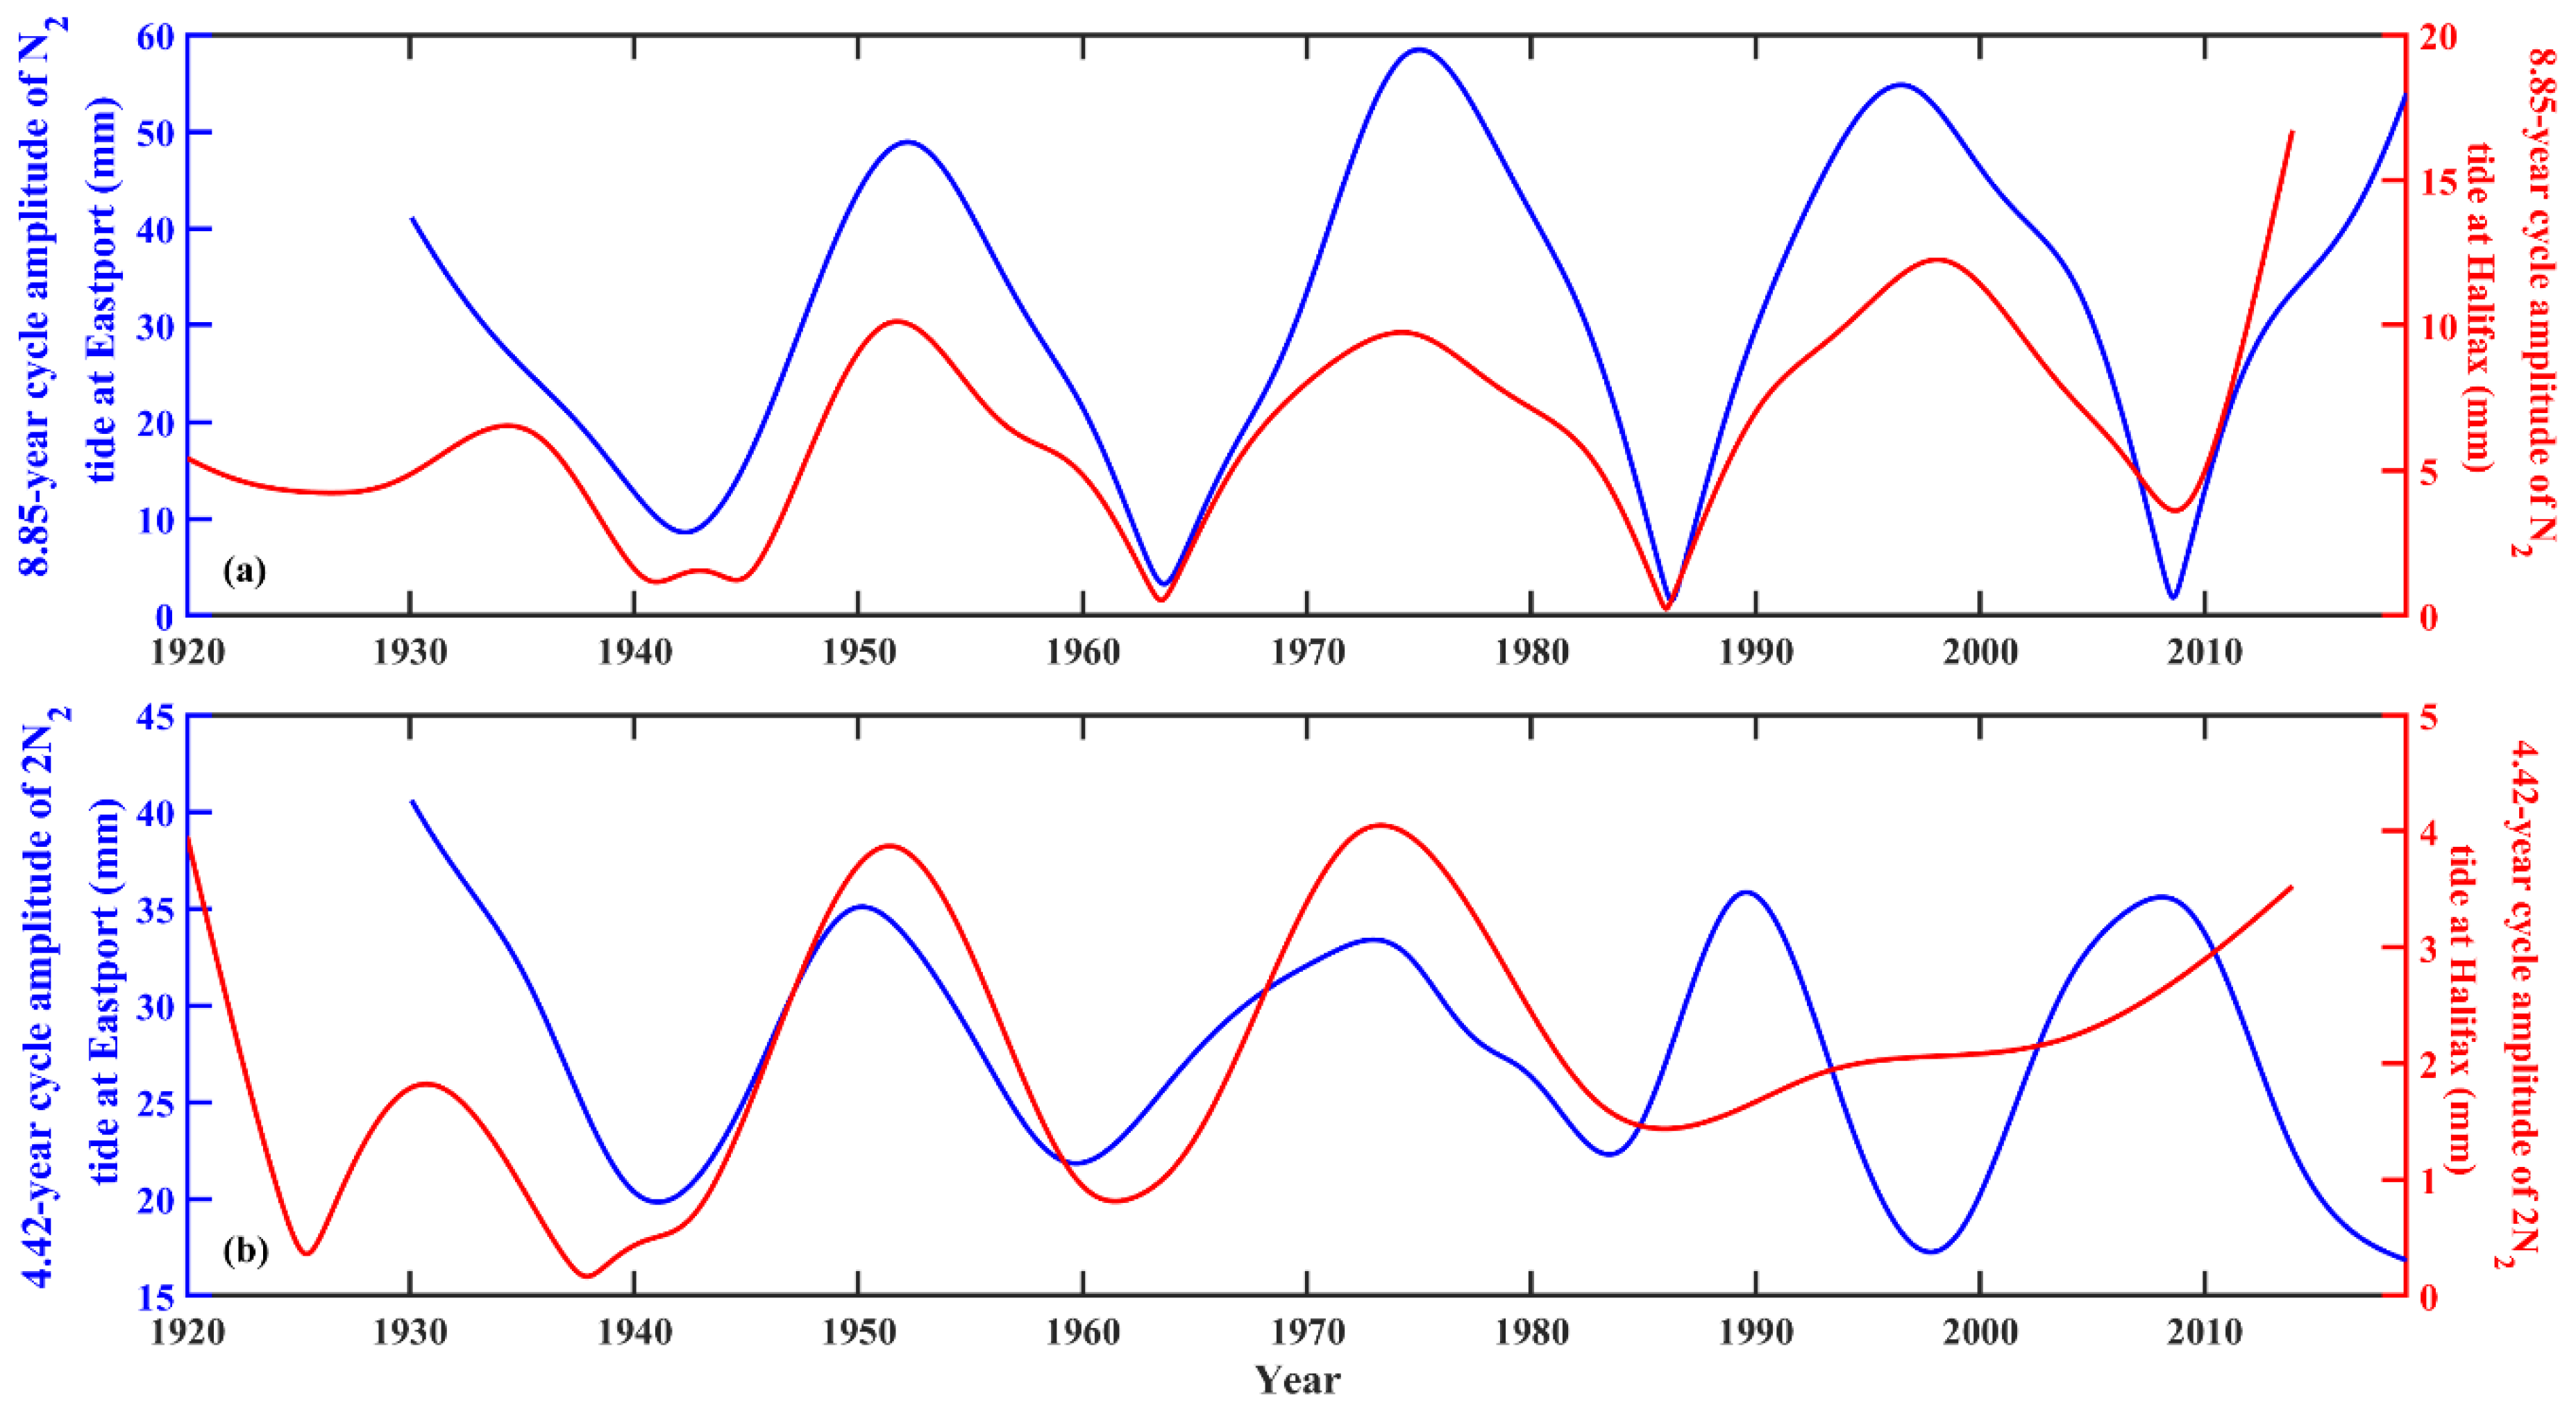
3.3. The 8.85- and 4.42-Year Cycles
4. Discussion
5. Conclusions
Author Contributions
Funding
Institutional Review Board Statement
Informed Consent Statement
Data Availability Statement
Acknowledgments
Conflicts of Interest
References
- Wahl, T.; Haigh, I.D.; Nicholls, R.J.; Arns, A.; Dangendorf, S.; Hinkel, J.; Slangen, A.B.A. Understanding Extreme Sea Levels for Broad-Scale Coastal Impact and Adaptation Analysis. Nat. Commun. 2017, 8, 16075. [Google Scholar] [CrossRef]
- Hinkel, J.; Lincke, D.; Vafeidis, A.T.; Perrette, M.; Nicholls, R.J.; Tol, R.S.J.; Marzeion, B.; Fettweis, X.; Ionescu, C.; Levermann, A. Coastal Flood Damage and Adaptation Costs under 21st Century Sea-Level Rise. Proc. Natl. Acad. Sci. USA 2014, 111, 3292–3297. [Google Scholar] [CrossRef] [Green Version]
- Rashid, M.M.; Wahl, T.; Chambers, D.P.; Calafat, F.M.; Sweet, W.V. An extreme sea level indicator for the contiguous United States coastline. Sci. Data 2019, 326, 326. [Google Scholar] [CrossRef] [PubMed] [Green Version]
- Weisse, R.; von Storch, H.; Niemeyer, H.D.; Knaack, H. Changing North Sea Storm Surge Climate: An Increasing Hazard? Ocean Coast. Manag. 2012, 68, 58–68. [Google Scholar] [CrossRef]
- Hay, C.C.; Morrow, E.; Kopp, R.E.; Mitrovica, J.X. Probabilistic Reanalysis of Twentieth-Century Sea-Level Rise. Nature 2015, 517, 481–484, Erratum in 2017, 552, 278. [Google Scholar] [CrossRef] [PubMed]
- Chambers, D.P.; Merrifield, M.A.; Nerem, R.S. Is There a 60-Year Oscillation in Global Mean Sea Level? Geophys. Res. Lett. 2012, 39. [Google Scholar] [CrossRef] [Green Version]
- Frederikse, T.; Landerer, F.; Caron, L.; Adhikari, S.; Parkes, D.; Humphrey, V.W.; Dangendorf, S.; Hogarth, P.; Zanna, L.; Cheng, L.; et al. The Causes of Sea-Level Rise since 1900. Nature 2020, 584, 393–397. [Google Scholar] [CrossRef]
- Zhang, H.; Sheng, J. Examination of Extreme Sea Levels Due to Storm Surges and Tides over the Northwest Pacific Ocean. Cont. Shelf Res. 2015, 93, 81–97. [Google Scholar] [CrossRef]
- Park, Y.H.; Suh, K.D. Variations of Storm Surge Caused by Shallow Water Depths and Extreme Tidal Ranges. Ocean Eng. 2012, 55, 44–51. [Google Scholar] [CrossRef]
- Feng, X.; Tsimplis, M.N. Sea Level Extremes at the Coasts of China. J. Geophys. Res. Oceans 2014, 119, 1593–1608. [Google Scholar] [CrossRef] [Green Version]
- Peng, D.; Hill, E.M.; Meltzner, A.J.; Switzer, A.D. Tide Gauge Records Show That the 18.61-Year Nodal Tidal Cycle Can Change High Water Levels by up to 30 cm. J. Geophys. Res. Oceans 2019, 124, 736–749. [Google Scholar] [CrossRef] [Green Version]
- Eliot, M. Influence of interannual tidal modulation on coastal flooding along the Western Australian coast. J. Geophys. Res. Oceans 2010, 115, 1–11. [Google Scholar] [CrossRef] [Green Version]
- Ray, R.D.; Merrifield, M.A. The Semiannual and 4.4-Year Modulations of Extreme High Tides. J. Geophys. Res. Oceans 2019, 124, 5907–5922. [Google Scholar] [CrossRef]
- Stocker, T.F.; Qin, D.; Plattner, G.K.; Tignor, M.M.B.; Allen, S.K.; Boschung, J.; Nauels, A.; Xia, Y.; Bex, V.; Midgley, P.M. Climate Change 2013: The Physical Science Basis: Working Group I Contribution to the Fifth Assessment Report of the Intergovernmental Panel on Climate Change; Cambridge University Press: New York, NY, USA, 2013; ISBN 9781107415324. [Google Scholar]
- Baart, F.; Van Gelder, P.H.; De Ronde, J.; Van Koningsveld, M.; Wouters, B. The effect of the 18.6-year lunar nodal cycle on regional sea-level rise estimates. J. Coast. Res. 2012, 28, 511–516. [Google Scholar] [CrossRef]
- Torres, R.R.; Tsimplis, M.N. Tides and long-term modulations in the Caribbean Sea. J. Geophys. Res. 2011, 116, C10022. [Google Scholar] [CrossRef] [Green Version]
- Haigh, I.D.; Eliot, M.; Pattiaratchi, C. Global Influences of the 18.61 Year Nodal Cycle and 8.85 Year Cycle of Lunar Perigee on High Tidal Levels. J. Geophys. Res. Oceans 2011, 116, 1–16. [Google Scholar] [CrossRef] [Green Version]
- Baranes, H.E.; Woodruff, J.D.; Talke, S.A.; Kopp, R.E.; Ray, R.D.; DeConto, R.M. Tidally Driven Interannual Variation in Extreme Sea Level Frequencies in the Gulf of Maine. J. Geophys. Res. Oceans 2020, 125. [Google Scholar] [CrossRef]
- Wang, Z.A.; Lawson, G.L.; Pilskaln, C.H.; Maas, A.E. Seasonal controls of aragonite saturation states in the Gulf of Maine. J. Geophys. Res. Oceans 2017, 122, 372–389. [Google Scholar] [CrossRef] [Green Version]
- Ku, L.F.; Greenberg, D.A.; Garrett, C.J.R.; Dobson, F.W. Nodal modulation of the lunar semidiurnal tide in the Bay of Fundy and Gulf of Maine. Science 1985, 230, 69–71. [Google Scholar] [CrossRef]
- Greenberg, D.A.; Blanchard, W.; Smith, B.; Barrow, E. Climate change, mean sea level and high tides in the Bay of Fundy. Atmos.-Ocean 2012, 50, 261–276. [Google Scholar] [CrossRef]
- Ray, R.D.; Foster, G. Future Nuisance Flooding at Boston Caused by Astronomical Tides Alone. Earth Future 2016, 4, 578–587. [Google Scholar] [CrossRef]
- Feng, X.; Tsimplis, M.N.; Woodworth, P.L. Nodal Variations and Long-Term Changes in the Main Tides on the Coasts of China. J. Geophys. Res. Oceans 2015, 120, 1215–1232. [Google Scholar] [CrossRef] [Green Version]
- Devlin, A.T.; Pan, J.; Lin, H. Tidal Variability in the Hong Kong Region. Ocean Sci. 2019, 15, 853–864. [Google Scholar] [CrossRef] [Green Version]
- Ray, R.D. Secular Changes of the M2 Tide in the Gulf of Maine. Cont. Shelf Res. 2006, 26, 422–427. [Google Scholar] [CrossRef] [Green Version]
- Capuano, P.; De Lauro, E.; De Martino, S.; Falanga, M. Observations of the 18.6-Year Cycle Effects on the Sea-Level Oscillations in the North Atlantic Ocean. EPL-Europhys. Lett. 2012, 100, 39003. [Google Scholar] [CrossRef]
- Pan, H.; Zheng, Q.; Lv, X. Temporal Changes in the Response of the Nodal Modulation of the M2 Tide in the Gulf of Maine. Cont. Shelf Res. 2019, 186, 13–20. [Google Scholar] [CrossRef]
- Pawlowicz, R.; Beardsley, B.; Lentz, S. Classical tidal harmonic analysis including error estimates in MATLAB using T_TIDE. Comput. Geosci. 2002, 28, 929–937. [Google Scholar] [CrossRef]
- Jin, G.; Pan, H.; Zhang, Q.; Lv, X.; Zhao, W.; Gao, Y. Determination of Harmonic Parameters with Temporal Variations: An Enhanced Harmonic Analysis Algorithm and Application to Internal Tidal Currents in the South China Sea. J. Atmos. Ocean. Tech. 2018, 35, 1375–1398. [Google Scholar] [CrossRef]
- Pan, H.; Lv, X.; Wang, Y.; Matte, P.; Chen, H.; Jin, G. Exploration of Tidal-Fluvial Interaction in the Columbia River Estuary Using S_TIDE. J. Geophys. Res. Oceans 2018, 123, 6598–6619. [Google Scholar] [CrossRef]
- Zong, X.; Xu, M.; Xu, J.; Lv, X. Improvement of the Ocean Pollutant Transport Model by Using the Surface Spline Interpolation. Tellus A Dyn. Meteorol. Oceanogr. 2018, 70, 1–13. [Google Scholar] [CrossRef] [Green Version]
- Zong, X.; Pan, H.; Liu, Y.; Lv, X. Improved Estimation of Pollutant Emission Rate in an Ocean Pollutant Diffusion Model by the Application of Spline Interpolation with the Adjoint Method. J. Atmos. Ocean. Tech. 2018, 35, 1961–1975. [Google Scholar] [CrossRef]
- Matte, P.; Jay, D.A.; Zaron, E.D. Adaptation of classical tidal harmonic analysis to nonstationary tides, with application to river tides. J. Atmos. Ocean. Tech. 2013, 30, 569–589. [Google Scholar] [CrossRef] [Green Version]
- Idier, D.; Paris, F.; Cozannet, G.L.; Boulahya, F.; Dumas, F. Sea-Level Rise Impacts on the Tides of the European Shelf. Cont. Shelf Res. 2017, 137, 56–71. [Google Scholar] [CrossRef]
- Rasquin, C.; Seiffert, R.; Wachler, B.; Winkel, N. The Significance of Coastal Bathymetry Representation for Modelling the Tidal Response to Mean Sea Level Rise in the German Bight. Ocean Sci. 2020, 16, 31–44. [Google Scholar] [CrossRef] [Green Version]
- Jiang, L.; Gerkema, T.; Idier, D.; Slangen, A.B.A.; Soetaert, K. Effects of Sea-Level Rise on Tides and Sediment Dynamics in a Dutch Tidal Bay. Ocean Sci. 2020, 16, 307–321. [Google Scholar] [CrossRef] [Green Version]
- Idier, D.; Bertin, X.; Thompson, P.; Pickering, M.D. Interactions Between Mean Sea Level, Tide, Surge, Waves and Flooding: Mechanisms and Contributions to Sea Level Variations at the Coast. Surv. Geophys. 2019, 40, 1603–1630. [Google Scholar] [CrossRef] [Green Version]
- Harker, A.; Green, J.A.M.; Schindelegger, M.; Wilmes, S.B. The Impact of Sea-Level Rise on Tidal Characteristics around Australia. Ocean Sci. 2019, 15, 147–159. [Google Scholar] [CrossRef] [Green Version]
- Khan, M.J.U.; Durand, F.; Testut, L.; Krien, Y.; Islam, A.K.M.S. Sea Level Rise Inducing Tidal Modulation along the Coasts of Bengal Delta. Cont. Shelf Res. 2020, 211, 104–289. [Google Scholar] [CrossRef]
- Jay, D.A. Evolution of Tidal Amplitudes in the Eastern Pacific Ocean. Geophys. Res. Lett. 2009, 36. [Google Scholar] [CrossRef] [Green Version]
- Frankcombe, L.M.; von der Heydt, A.; Dijkstra, H.A. North Atlantic Multidecadal Climate Variability: An Investigation of Dominant Time Scales and Processes. J. Clim. 2010, 23, 3626–3638. [Google Scholar] [CrossRef] [Green Version]
- Escudier, R.; Mignot, J.; Swingedouw, D. A 20-Year Coupled Ocean-Sea Ice-Atmosphere Variability Mode in the North Atlantic in an AOGCM. Clim. Dyn. 2013, 40, 619–636. [Google Scholar] [CrossRef]
- Painemal, D.; Corral, A.F.; Sorooshian, A.; Brunke, M.A.; Chellappan, S.; Afzali Gorooh, V.; Ham, S.H.; O’Neill, L.; Smith, W.L.; Tselioudis, G.; et al. An Overview of Atmospheric Features Over the Western North Atlantic Ocean and North American East Coast—Part 2: Circulation, Boundary Layer, and Clouds. J. Geophys. Res. Atmos. 2021, 126, e2020JD032592. [Google Scholar] [CrossRef]


| Stations | Location (°) | Timespan | Abandoned Length (Month) |
|---|---|---|---|
| Boston | 71.052 W 42.355 N | 1922.1–2018.12 | 10 |
| Portland | 70.247 W 43.657 N | 1912.1–2019.12 | 41 |
| Eastport | 66.985 W 44.903 N | 1930.1–2018.12 | 76 |
| Halifax | 63.583 W 44.667 N | 1920.1–2013.11 | 11 |
| Stations | Average Amplitudes of the Main Tidal Constituents (mm) | ||||||
|---|---|---|---|---|---|---|---|
| M2 | S2 | K1 | O1 | N2 | P1 | 2N2 | |
| Boston | 1417.6156 | 216.0642 | 127.3863 | 97.3080 | 317.3052 | 46.1088 | 48.9618 |
| Portland | 1402.9259 | 212.5526 | 127.3061 | 95.3873 | 313.7494 | 47.2963 | 48.0155 |
| Eastport | 2731.3364 | 424.3224 | 137.6934 | 100.0676 | 560.5657 | 50.3625 | 83.0219 |
| Halifax | 647.3143 | 136.3971 | 92.2879 | 39.6253 | 141.9741 | 31.5911 | 21.7130 |
| IP1 | 2 | 3 | 4 | 5 | 6 | 7 | 8 | |
|---|---|---|---|---|---|---|---|---|
| IP2 | ||||||||
| 2 | 23.2225 | 23.1012 | 23.3426 | 23.3216 | 23.5806 | 23.3785 | 23.1794 | |
| 3 | 22.6275 | 22.4060 | 22.6739 | 22.6046 | 22.7632 | 22.5254 | 22.1606 | |
| 4 | 19.8498 | 19.6343 | 19.8346 | 19.6963 | 19.8570 | 19.4745 | 18.7069 | |
| 5 | 18.1165 | 17.9114 | 18.0141 | 17.9123 | 17.9093 | 17.3278 | 16.0265 | |
| 6 | 16.7779 | 16.5425 | 16.6224 | 16.4130 | 16.2579 | 14.8371 | 11.5837 | |
| 7 | 15.8195 | 15.5820 | 15.6082 | 15.2695 | 14.2283 | 12.5677 | 7.3566 | |
| 8 | 14.9992 | 14.6815 | 14.6307 | 13.5472 | 11.9632 | 9.8050 | 5.0835 | |
| 9 | 14.4358 | 13.9934 | 13.2250 | 11.7553 | 9.7189 | 8.6205 | 6.8627 | |
| 10 | 13.3066 | 12.5020 | 11.8157 | 10.2397 | 10.2445 | 6.9318 | 3.2387 | |
| 11 | 13.1382 | 13.0375 | 10.6766 | 8.5351 | 8.0320 | 4.4010 | 4.0707 | |
| 12 | 12.4500 | 11.0762 | 8.5995 | 6.9054 | 6.7062 | 4.1674 | 1.8203 | |
| 13 | 10.2453 | 9.0901 | 6.7958 | 5.6823 | 5.4219 | 2.7921 | 3.1461 | |
| 14 | 9.1637 | 7.1608 | 5.5500 | 5.3660 | 3.8567 | 2.4194 | 5.1636 | |
| 15 | 7.3926 | 5.6647 | 4.4138 | 3.6056 | 3.3863 | 6.8116 | 4.9889 | |
| 16 | 5.3810 | 4.0575 | 3.6089 | 8.0465 | 7.4223 | 4.2485 | 2.3126 | |
| 17 | 7.3060 | 7.1236 | 6.6072 | 4.8216 | 3.8864 | 2.5421 | 5.5489 | |
| 18 | 4.6209 | 4.3813 | 3.9984 | 3.2114 | 4.2031 | 4.7120 | 1.9262 | |
| IP1 | 2 | 3 | 4 | 5 | 6 | 7 | 8 | |
|---|---|---|---|---|---|---|---|---|
| IP2 | ||||||||
| 2 | 3.3359 | 3.3341 | 3.2552 | 3.2321 | 3.1785 | 3.1604 | 3.1214 | |
| 3 | 3.3302 | 3.3289 | 3.2421 | 3.2201 | 3.1727 | 3.1547 | 3.1138 | |
| 4 | 3.3223 | 3.3209 | 3.2396 | 3.2154 | 3.1614 | 3.1451 | 3.1072 | |
| 5 | 3.3061 | 3.3029 | 3.2230 | 3.1942 | 3.1459 | 3.1366 | 3.0362 | |
| 6 | 3.2828 | 3.2789 | 3.2018 | 3.1702 | 3.1172 | 3.1019 | 2.9477 | |
| 7 | 3.2342 | 3.2283 | 3.1371 | 3.0981 | 3.0955 | 2.9568 | 2.9265 | |
| 8 | 3.2002 | 3.1975 | 3.0923 | 3.0885 | 3.0406 | 2.9623 | 2.8368 | |
| 9 | 3.1355 | 3.1354 | 3.0686 | 3.0020 | 2.9317 | 2.6615 | 2.4439 | |
| 10 | 3.1810 | 3.1724 | 2.8931 | 2.8304 | 2.5353 | 2.4764 | 2.4489 | |
| 11 | 2.9026 | 2.7249 | 2.7240 | 2.6951 | 2.4951 | 2.4691 | 2.3922 | |
| 12 | 2.7733 | 2.7151 | 2.7090 | 2.6489 | 2.4398 | 2.4060 | 2.3887 | |
| 13 | 2.8498 | 2.6828 | 2.6858 | 2.5932 | 2.3997 | 2.3976 | 2.3643 | |
| 14 | 2.6627 | 2.6345 | 2.6284 | 2.4941 | 2.4089 | 2.3854 | 2.2535 | |
| 15 | 2.6722 | 2.6354 | 2.6257 | 2.5558 | 2.3532 | 2.1691 | 2.0378 | |
| 16 | 2.6064 | 2.5800 | 2.5528 | 2.2606 | 2.1106 | 2.0456 | 2.0212 | |
| 17 | 2.3849 | 2.2988 | 2.2432 | 2.1953 | 2.0705 | 2.0193 | 1.9361 | |
| 18 | 2.3686 | 2.3171 | 2.2357 | 2.1789 | 1.9889 | 1.9444 | 1.9329 | |
| (IP1, IP2) | RMSE (mm) | length of 95% Confidence Interval |
|---|---|---|
| (3, 2) | 3.3341 | 0.5573 |
| (3, 10) | 3.1724 | 1.0292 |
| (3, 16) | 2.5800 | 3.3806 |
| Stations | The 8.85-Year Cycle of N2 Tide | The 4.42-Year Cycle of 2N2 Tide |
|---|---|---|
| Boston | IP1 = 4, IP2 = 16 | IP3 = 1, IP4 = 23 |
| Portland | IP1 = 5, IP2 = 13 | IP3 = 1, IP4 = 19 |
| Eastport | IP1 = 5, IP2 = 16 | IP3 = 1, IP4 = 20 |
| Halifax | IP1 = 5, IP2 = 13 | IP3 = 1, IP4 = 10 |
Publisher’s Note: MDPI stays neutral with regard to jurisdictional claims in published maps and institutional affiliations. |
© 2021 by the authors. Licensee MDPI, Basel, Switzerland. This article is an open access article distributed under the terms and conditions of the Creative Commons Attribution (CC BY) license (https://creativecommons.org/licenses/by/4.0/).
Share and Cite
Zong, X.; Zhang, R.; Zhang, S.; Deng, F.; Zhou, W.; Chen, Z. An Analysis of the 8.85- and 4.42-Year Cycles in the Gulf of Maine. J. Mar. Sci. Eng. 2021, 9, 1362. https://doi.org/10.3390/jmse9121362
Zong X, Zhang R, Zhang S, Deng F, Zhou W, Chen Z. An Analysis of the 8.85- and 4.42-Year Cycles in the Gulf of Maine. Journal of Marine Science and Engineering. 2021; 9(12):1362. https://doi.org/10.3390/jmse9121362
Chicago/Turabian StyleZong, Xiaolong, Ruzhen Zhang, Shuwen Zhang, Fangjing Deng, Wei Zhou, and Zhaoyun Chen. 2021. "An Analysis of the 8.85- and 4.42-Year Cycles in the Gulf of Maine" Journal of Marine Science and Engineering 9, no. 12: 1362. https://doi.org/10.3390/jmse9121362
APA StyleZong, X., Zhang, R., Zhang, S., Deng, F., Zhou, W., & Chen, Z. (2021). An Analysis of the 8.85- and 4.42-Year Cycles in the Gulf of Maine. Journal of Marine Science and Engineering, 9(12), 1362. https://doi.org/10.3390/jmse9121362