1. Introduction
Around 80% of Earth’s coastlines are classified as coastal cliffs [
1], and thus the recession of the cliffs is a significant coast environmental problem worldwide that may affect 30% of the world’s population (those living within 60 km of the coast) [
2]. Catastrophic collapses of coastal cliffs occur during the recession process, and they create significant difficulties for land-use planning in coastal areas and the conduction of coastal engineering.
To get insight into the mechanism of the collapses and reliably mitigate their hazards, many studies (e.g., [
3,
4,
5]) have been carried out. The evolution of the cliff towards instability has to do with the development of cracks and the deterioration of the rock, which can be strongly promoted by external environmental factors (such as rainwater, wind, and sea waves) resulting in chemical alteration, wetting and drying, and salt effects [
6]. The effects of the various external factors are quite complex; however, to reveal the instability mechanism, it is important to first clarify the key factor that controls the evolution.
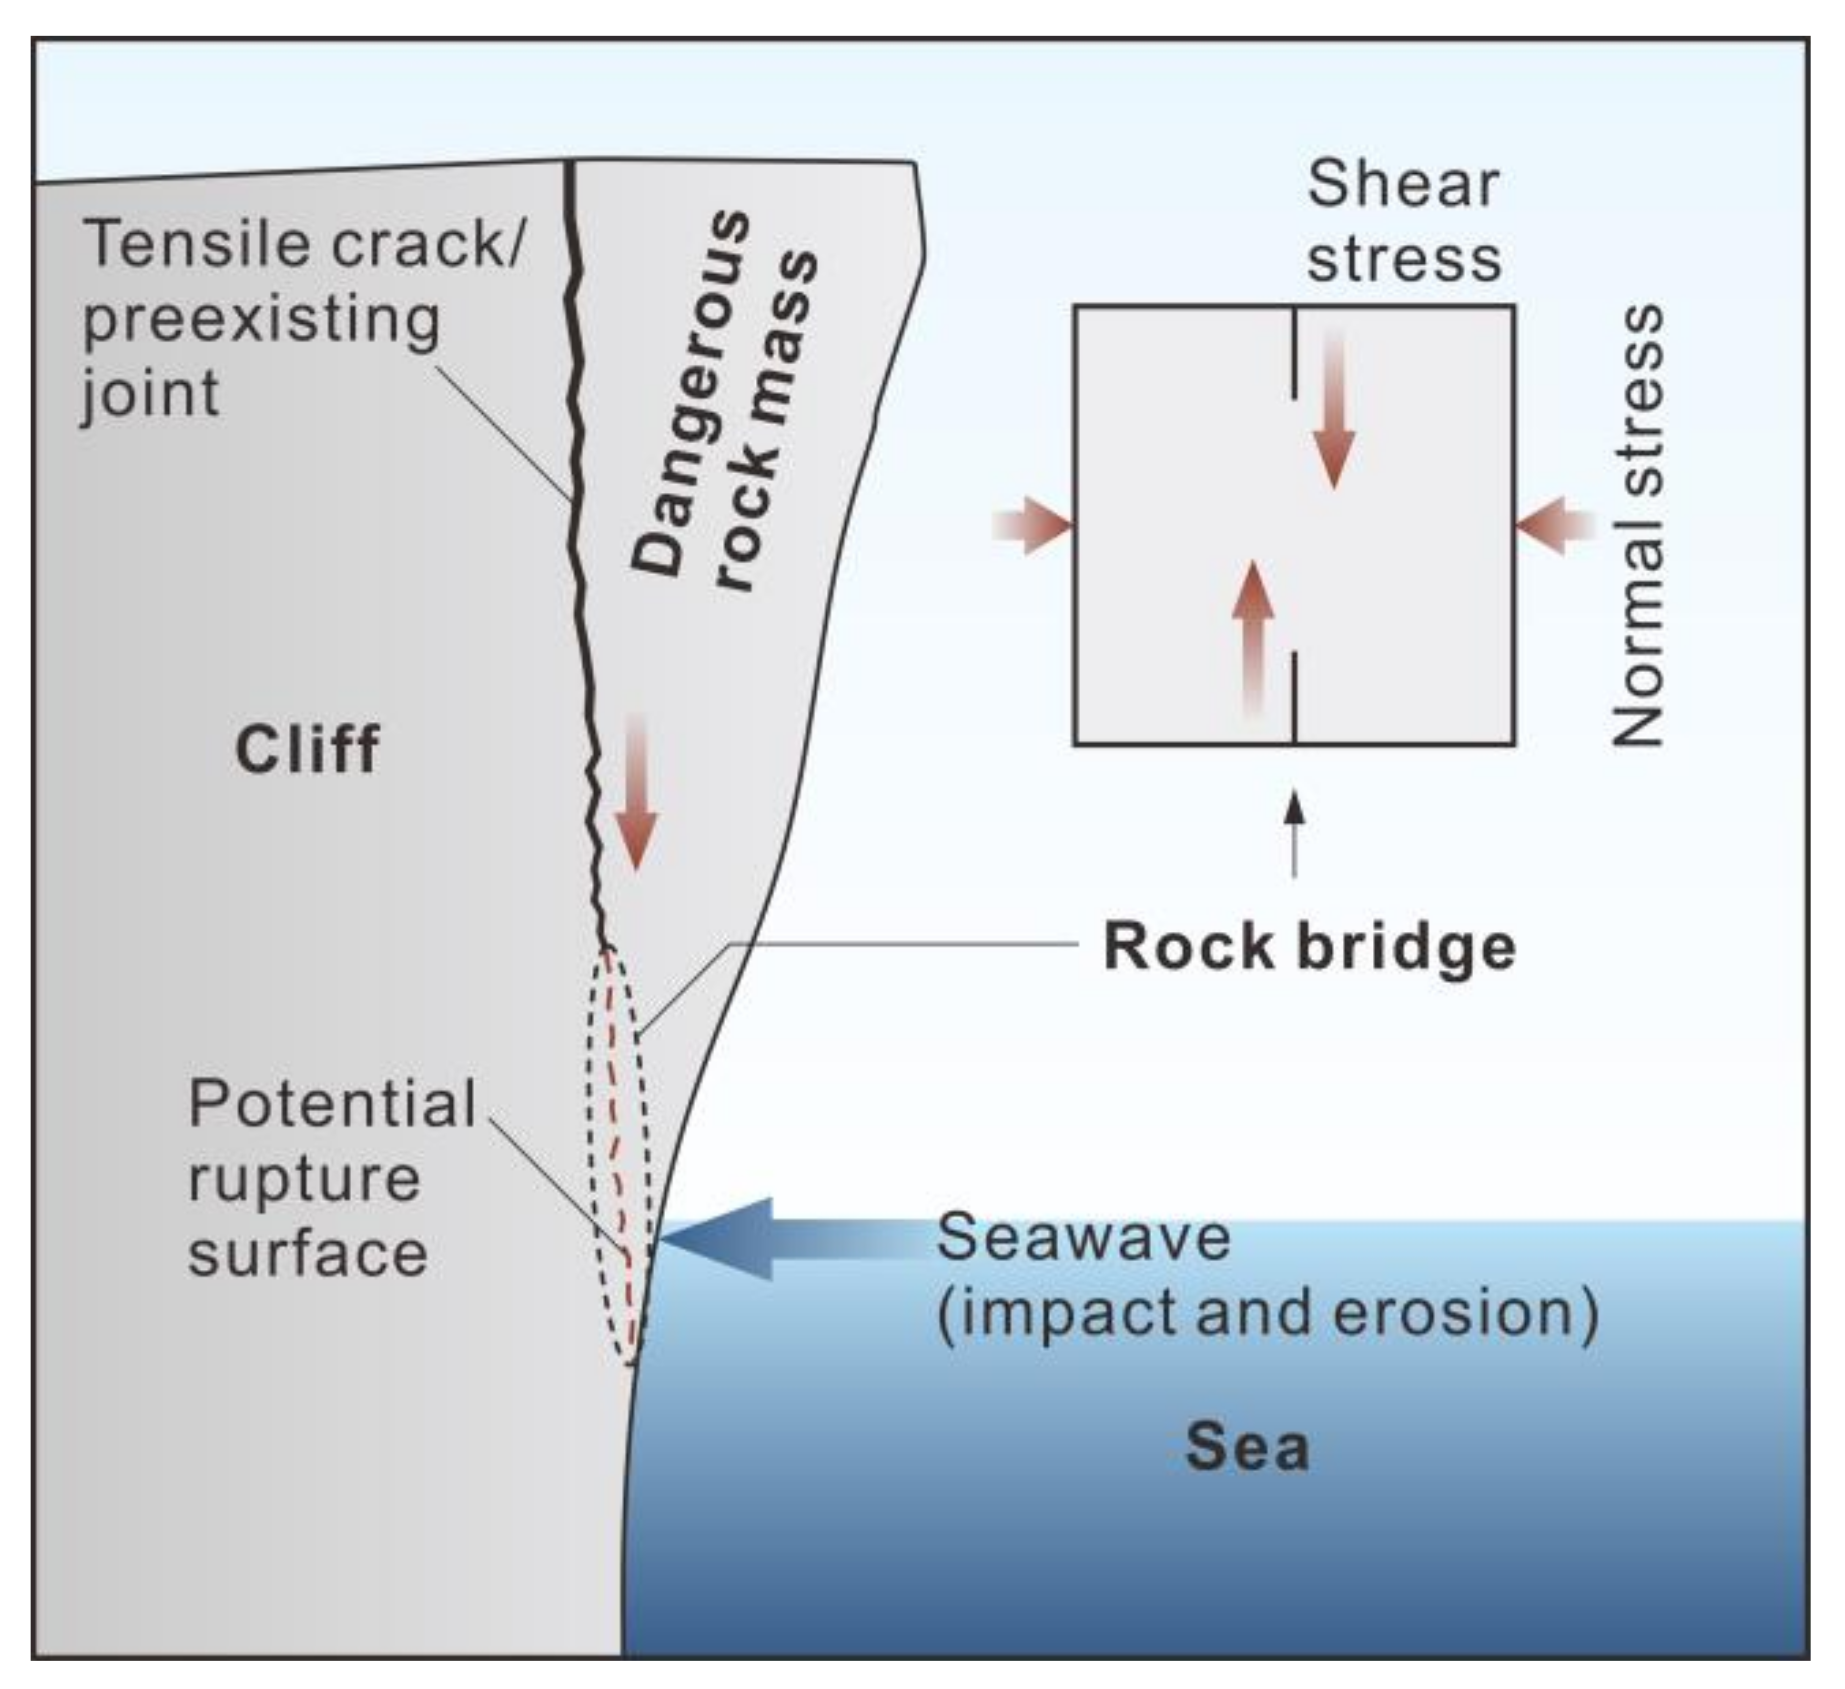
Owing to the impact and erosion effect of sea waves, a coastal cliff can be gradually undercut [
7]. Under this circumstance, the stress state of the upper segment of the cliff is similar in nature to that of a cantilever beam; thus, vertical tensile cracks can generate (or initiate from pre-existing joints) and propagate downward (
Figure 1). A dangerous rock mass defined by the cracks (joints) connects with the cliff through an unbroken segment at its bottom, i.e., a rock bridge. The rock bridge is subjected to a shear load along the vertical crack and its strength is gradually undermined (
Figure 1). Once the rock bridge ruptures, the dangerous rock mass will separate away from the cliff rapidly, causing a catastrophic collapse as well as the recession of the coastline. That is, the rock bridge is the key internal factor controlling the evolution of cliffs, and cliff collapses cannot be directly triggered by certain external factors before rock bridges rupture. Hence, we concentrate on the damage process of rock bridges, which is the groundwork for uncovering the evolutionary mechanism of collapses.
Laboratory direct shear tests with constant normal stress [
9] are usually used to investigate the mechanical behavior during progressive damage of such rock bridges. The progressive damage of a rock bridge subjected to a shear load comprises four stages [
10,
11]: (i) pre-crack-initiation, (ii) stable crack growth, (iii) unstable crack growth, and (iv) post-peak. When a rock bridge is damaged enough to reach the volume-expansion point (the onset of stage (iii)), the growth of cracks cannot be restrained until the rock bridge ruptures, even if the imposed load remains unchanged [
12]; the shear stress corresponding to the volume-expansion point (
σc) is equivalent to the long-term shear strength of rock bridges [
13]. Therefore, identifying the volume-expansion point is very important to assess the damage state of rock bridges and the long-term stability of coastal cliffs. Though great efforts [
14,
15] have been made, thus far no widely accepted identifying methods of the volume-expansion point of rock bridges under direct shear have been proposed.
Essentially, volume expansion is attributed to the rapid growth and coalescence of a large number of cracks in rocks [
16,
17], which can generate abundant acoustic emissions (AEs) in laboratory tests [
18]. Moradian et al. [
19] divided the damage process of rock bridges under compression-shear load into several stages according to the burst of cumulative AE number and the macroscopic failure pattern captured by high-speed photography; their results indicate that it is feasible to identify the volume-expansion point using AE characteristics. AE and micro-seismic techniques have been increasingly applied to monitor the stability of rock masses (including coastal cliffs) in recent years [
5,
20,
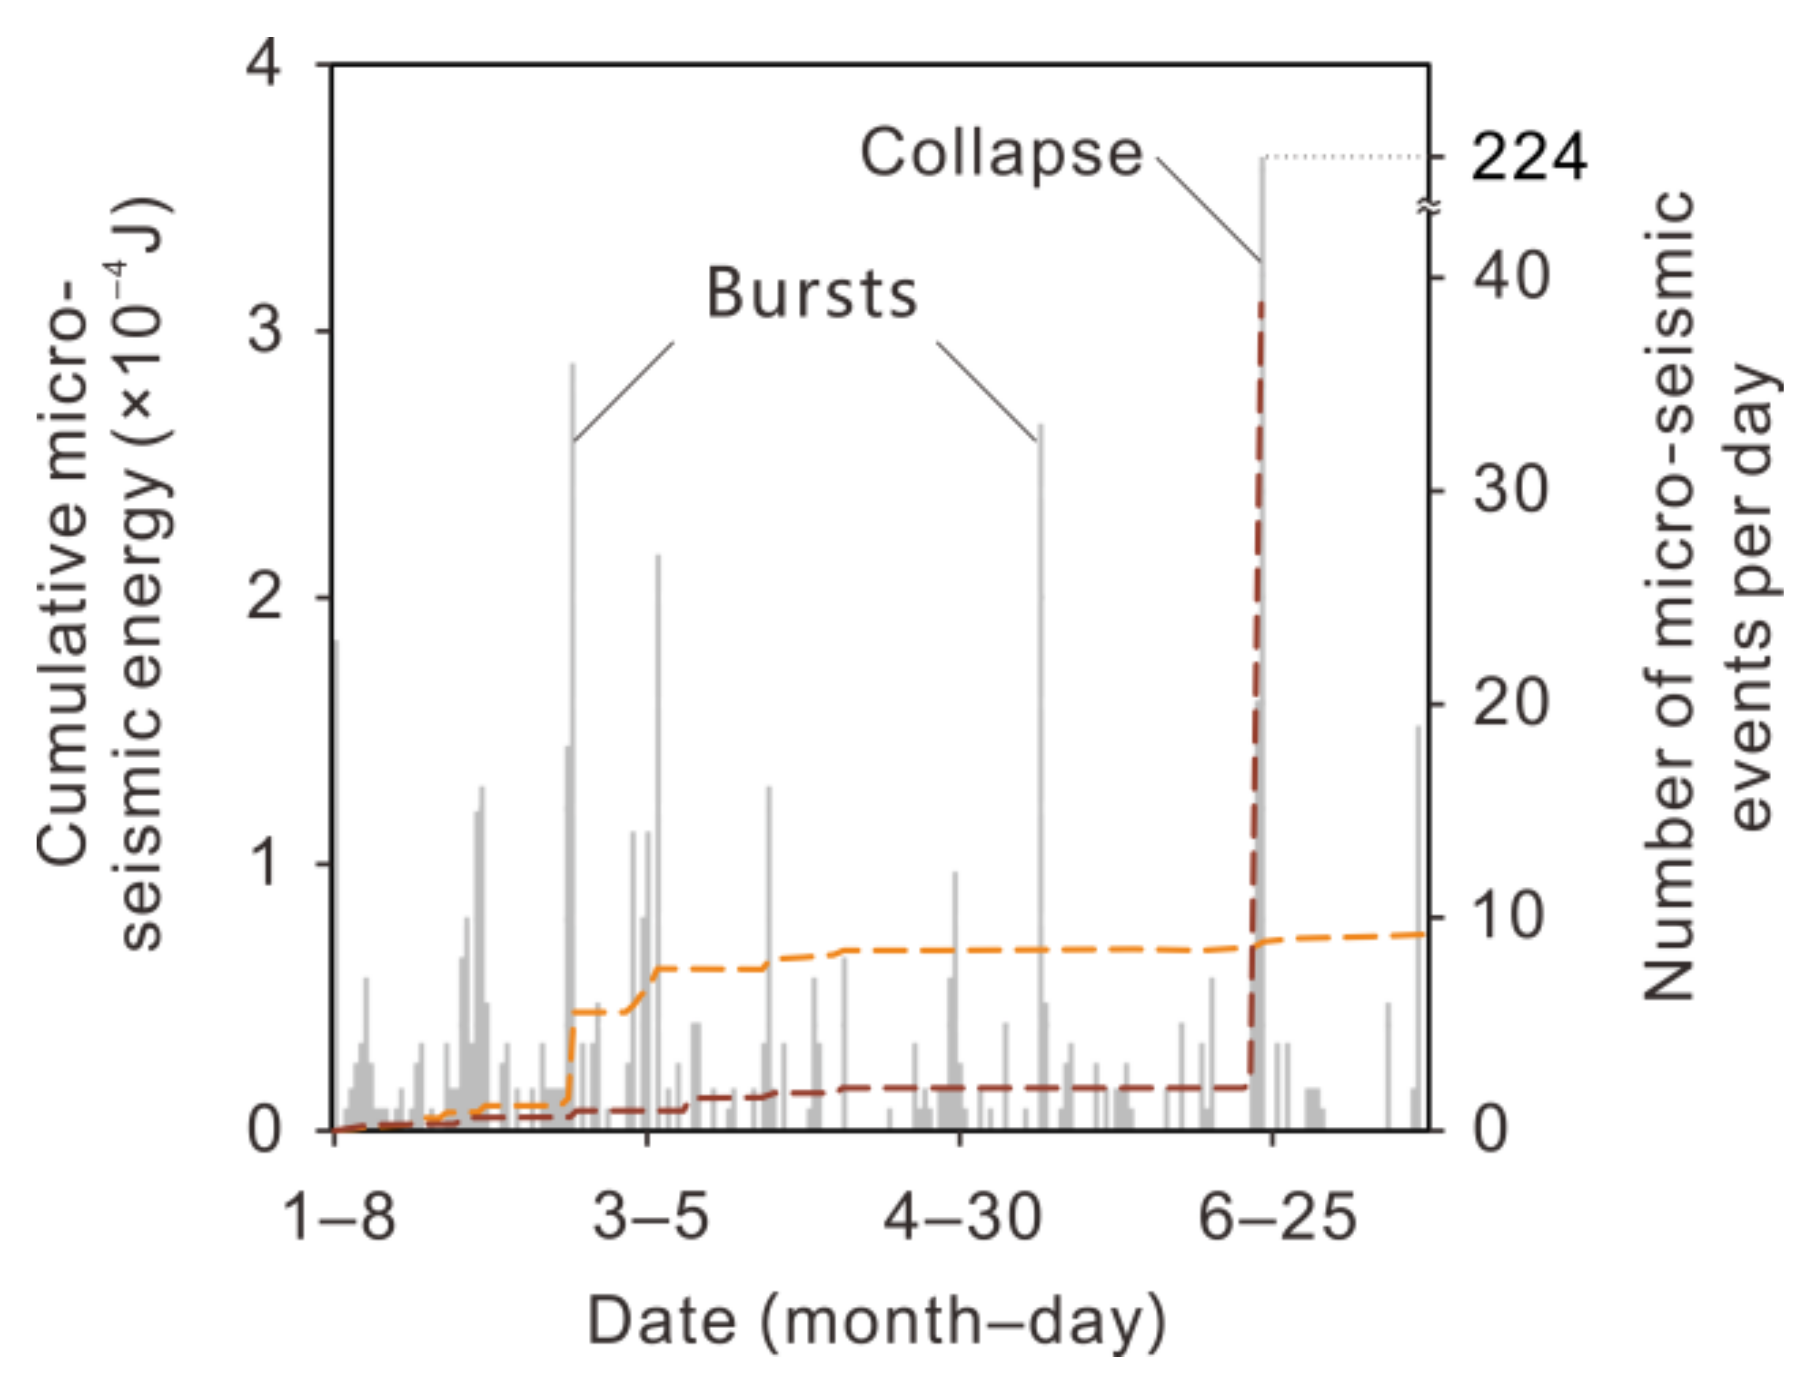
21]; however, due to the heterogeneity of rocks, the local coalescences of cracks and the corresponding bursts of cumulative number of AEs or micro-seismic events can arise several times during the damage processes of rocks. For example, Senfaute et al. [
21] reported that such bursts of micro-seismic events arose before the coastal collapse on 23 June 2002 at Mesnil-Val, NW France (
Figure 2). Thus, volume-expansion points cannot be reliably identified only by relying on the burst of cracking event number; the energy characteristics (e.g., energy level) in distinct stages of the damage process of a rock bridge should also be taken into account.
Several researchers [
22,
23] observed that one or more AE events with a high energy level arise at around the volume-expansion point of rock specimens, which suggests that it is possible to identify this point of rock bridges based on the energy characteristic of AEs (or micro-seismicity). However, though several direct shear tests [
24,
25] have been conducted with AE monitoring, the characteristics of high energy level events at volume-expansion points were not revealed. How to identify the volume-expansion points of rock bridges based on AE (or micro-seismic) characteristics is still elusive.
Herein, we analyze the characteristics of AE events, especially those with a high energy level in the damage process of rock bridges, and then propose a method to identify the volume-expansion point of rock bridges under direct shear load. The present work can be helpful to better understand the damage mechanism of rock bridges and can provide guidelines for monitoring the evolutionary process of coastal cliff collapses.
2. Methods
2.1. Numerical Analytical Tool
Numerous experimental investigations in the damage process of rock bridges have been conducted [
10,
24,
26,
27] and improved the recognition of the failure patterns of rock bridges under various loading conditions. Nevertheless, the experimental results can be easily influenced by the inherent properties of materials and the manufacture quality of specimens. Furthermore, the conventional non-transparent rigid shear box makes it difficult to observe failure patterns and monitor AE activity in real time.
Numerical simulation is one of the most important investigation methods of rock mechanics, and it can overcome the aforementioned limitations of physical experiments: (1) the simulation is repeatable, which can avoid abnormal results due to unexpected changes of loading conditions and manufacture errors; (2) the mechanical parameters of materials are adjustable as required; (3) the values of stress and strain and the failure pattern anywhere in a numerical model can be monitored in real time. Considering that there have been many experimental results qualified to serve as the samples for numerical simulation, we mainly use the numerical method to detail and extend previous experimental results and analyze the damage process of rock bridges.
Rock fracture process analysis (RFPA) is a well-known numerical analysis tool which has succeeded in simulating the failure process of rocks in various scales [
28,
29,
30]. Models in RFPA are discretized into a certain number of mesoscopic elements, and the physical and mechanical properties of the elements, such as the Young’s modulus and uniaxial compressive strength (UCS), are randomly distributed in a Weibull distribution. The mesoscopic heterogeneity of rock characterized by the Weibull shape parameter
m is taken into account, which is the most significant advantage of RFPA compared with conventional finite element modeling (FEM) tools.
While the stress state of an element satisfies the tensile cut-off criterion or Mohr–Coulomb criterion, the element ruptures in tensile or shear mode, and the stiffness and strength of the element declines to a residual level in accordance with the elastic damage constitutive relation. The ruptured element transitions into a special one that represents a crack; its stiffness can recover to an extent when it is compressed to simulate the compaction of a crack, but it behaves as air and cannot transfer tensile stress when it is tensed. In this way, RFPA can visually display the crack propagation and strength degradation, i.e., the progressive damage to the rock.
The elastic strain energy stored in each RFPA element is assumed to release in the form of AEs when it ruptures. Tang and Kaiser [
28] calculated the energy of an AE event (
E) using
where Δ
σ is the post-peak stress drop of the ruptured element,
εf is the strain corresponding to the element’s rupture, and
V is the volume of the element. Because the residual strength of an elastic–brittle element is extremely small, the value of Δ
σ is approximately equal to that of the element’s peak strength. Referring to the relationship between energy and earthquake magnitude [
31], we can define the energy level (
M) of an AE event as
where
C is a constant that determines the lower limit of the energy level.
The mechanism of an AE event depends on which criterion (tensile cut-off or Mohr–Coulomb) is satisfied when the element ruptures. For example, an element ruptures and generates a shear-mode AE event when its shear stress satisfies the Mohr–Coulomb criterion firstly.
RFPA can provide the temporal, spatial, energy, and mechanism characteristics of AEs during the damage process of a numerical model; its functions well satisfy our requirements for studying AE characteristics at the volume-expansion points of rock bridges.
2.2. Calibration of Calculation Parameters
The numerical simulation using RFPA requires the values of several mesoscopic mechanical parameters, e.g., the Young’s modulus and UCS of the mineral grains (elements); however, their values are difficult to measure. Therefore, these values are usually determined based on the calculated results of macroscopic mechanical parameters, e.g., the UCS of specimens. If the calculated results of the macroscopic parameters using certain mesoscopic parameters agree well with the measured values of a certain material, these mesoscopic parameters can be considered reasonable and applicable for performing numerical studies. Such a calibration method is widely used in numerical simulation.
Liu et al. [
27] carried out direct shear tests on rock-like artificial specimens to investigate the progressive damage behavior of rock bridges, and observed representative failure patterns. In addition, the material they used is similar to the chalk that mainly constitutes the European coastal cliffs in heterogeneity, brittleness, and mechanical properties [
3]. Therefore, the shear test results of [
27] can serve as the examples of RFPA simulations to study the mechanical behavior of rock bridges in coastal cliffs.
For the convenience of description, a series of direct shear tests under different normal stress by Liu et al. [
27] and their corresponding numerical simulations are called LT (Liu’s tests) and NT (numerical tests), respectively.
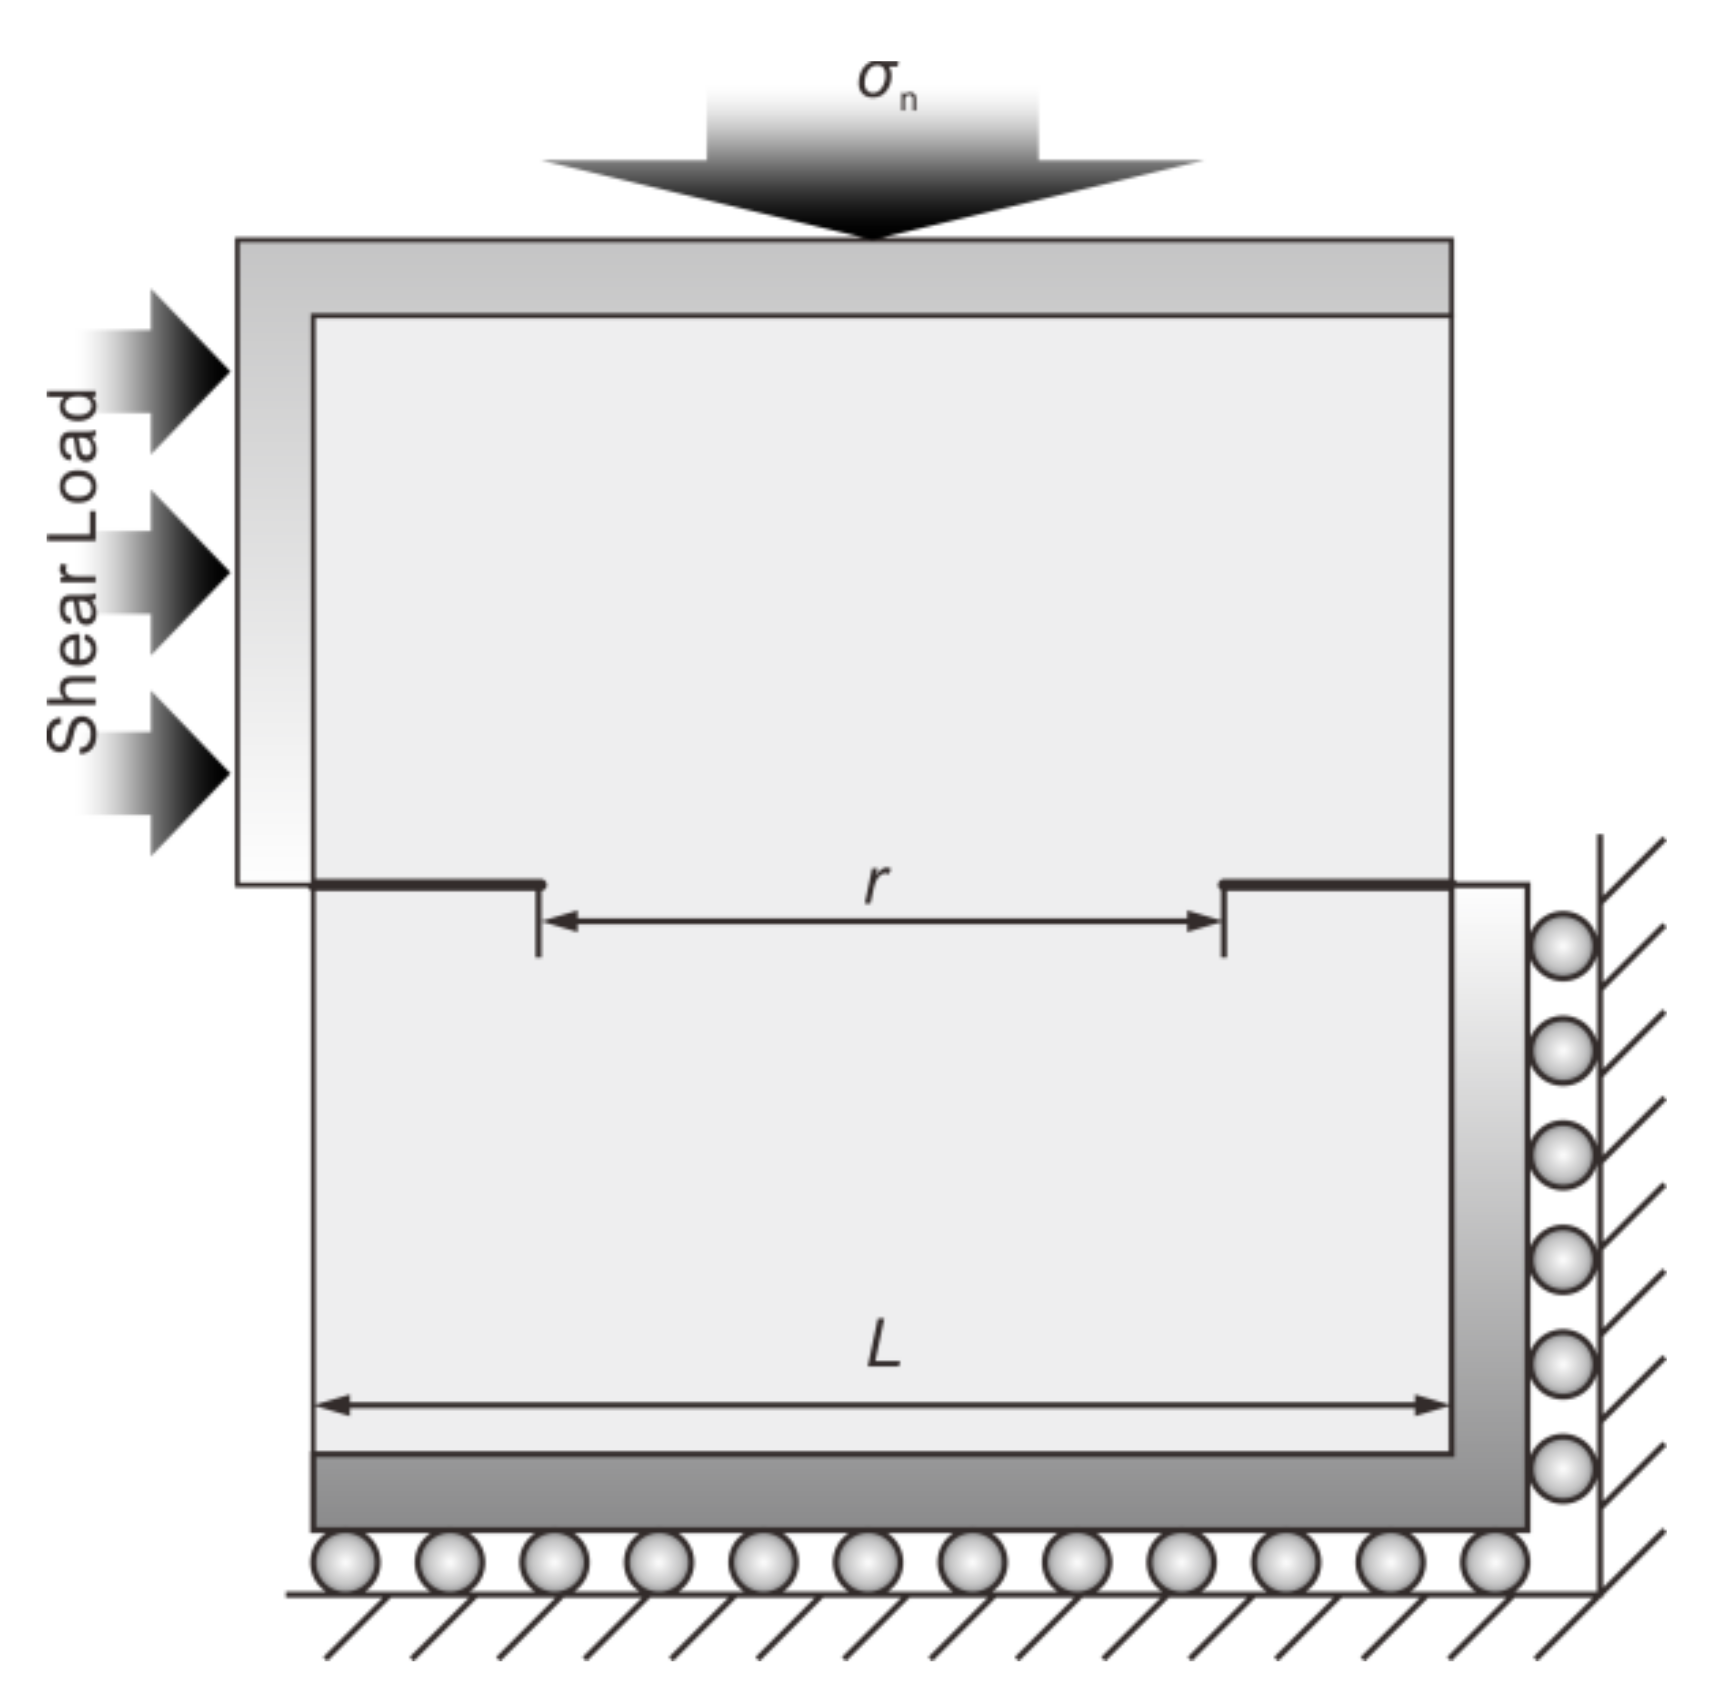
Table 1 and
Figure 3 present the dimensions and boundary conditions of the NT models. There were two collinear joints on both sides of the square specimen, and a rock bridge lay between the tips of the joints. A 10 mm thick L-shaped rigid material was set at the edge of the specimen to simulate a shear box, and thus the Young’s modulus and UCS of the rigid elements were much higher than those of the specimens. The lower right edge of the box was fixed, and shear load was applied on the upper left edge of the box. The upper and lower boundaries of the NT models were subjected to constant normal stress
σn. Each model consisted of 250 × 250 square elements with a length of 0.68 mm, and its normalized size (i.e., the ratio of the element’s length to the model’s length) of 0.004 ensured the high quality and robustness of the calculation results [
32].
We used the values of the mesoscopic mechanical parameters in
Table 2 to simulate the uniaxial compression and Brazilian splitting tests of the material, and the calculating UCS and tensile strength are approximately equal to the measured values (
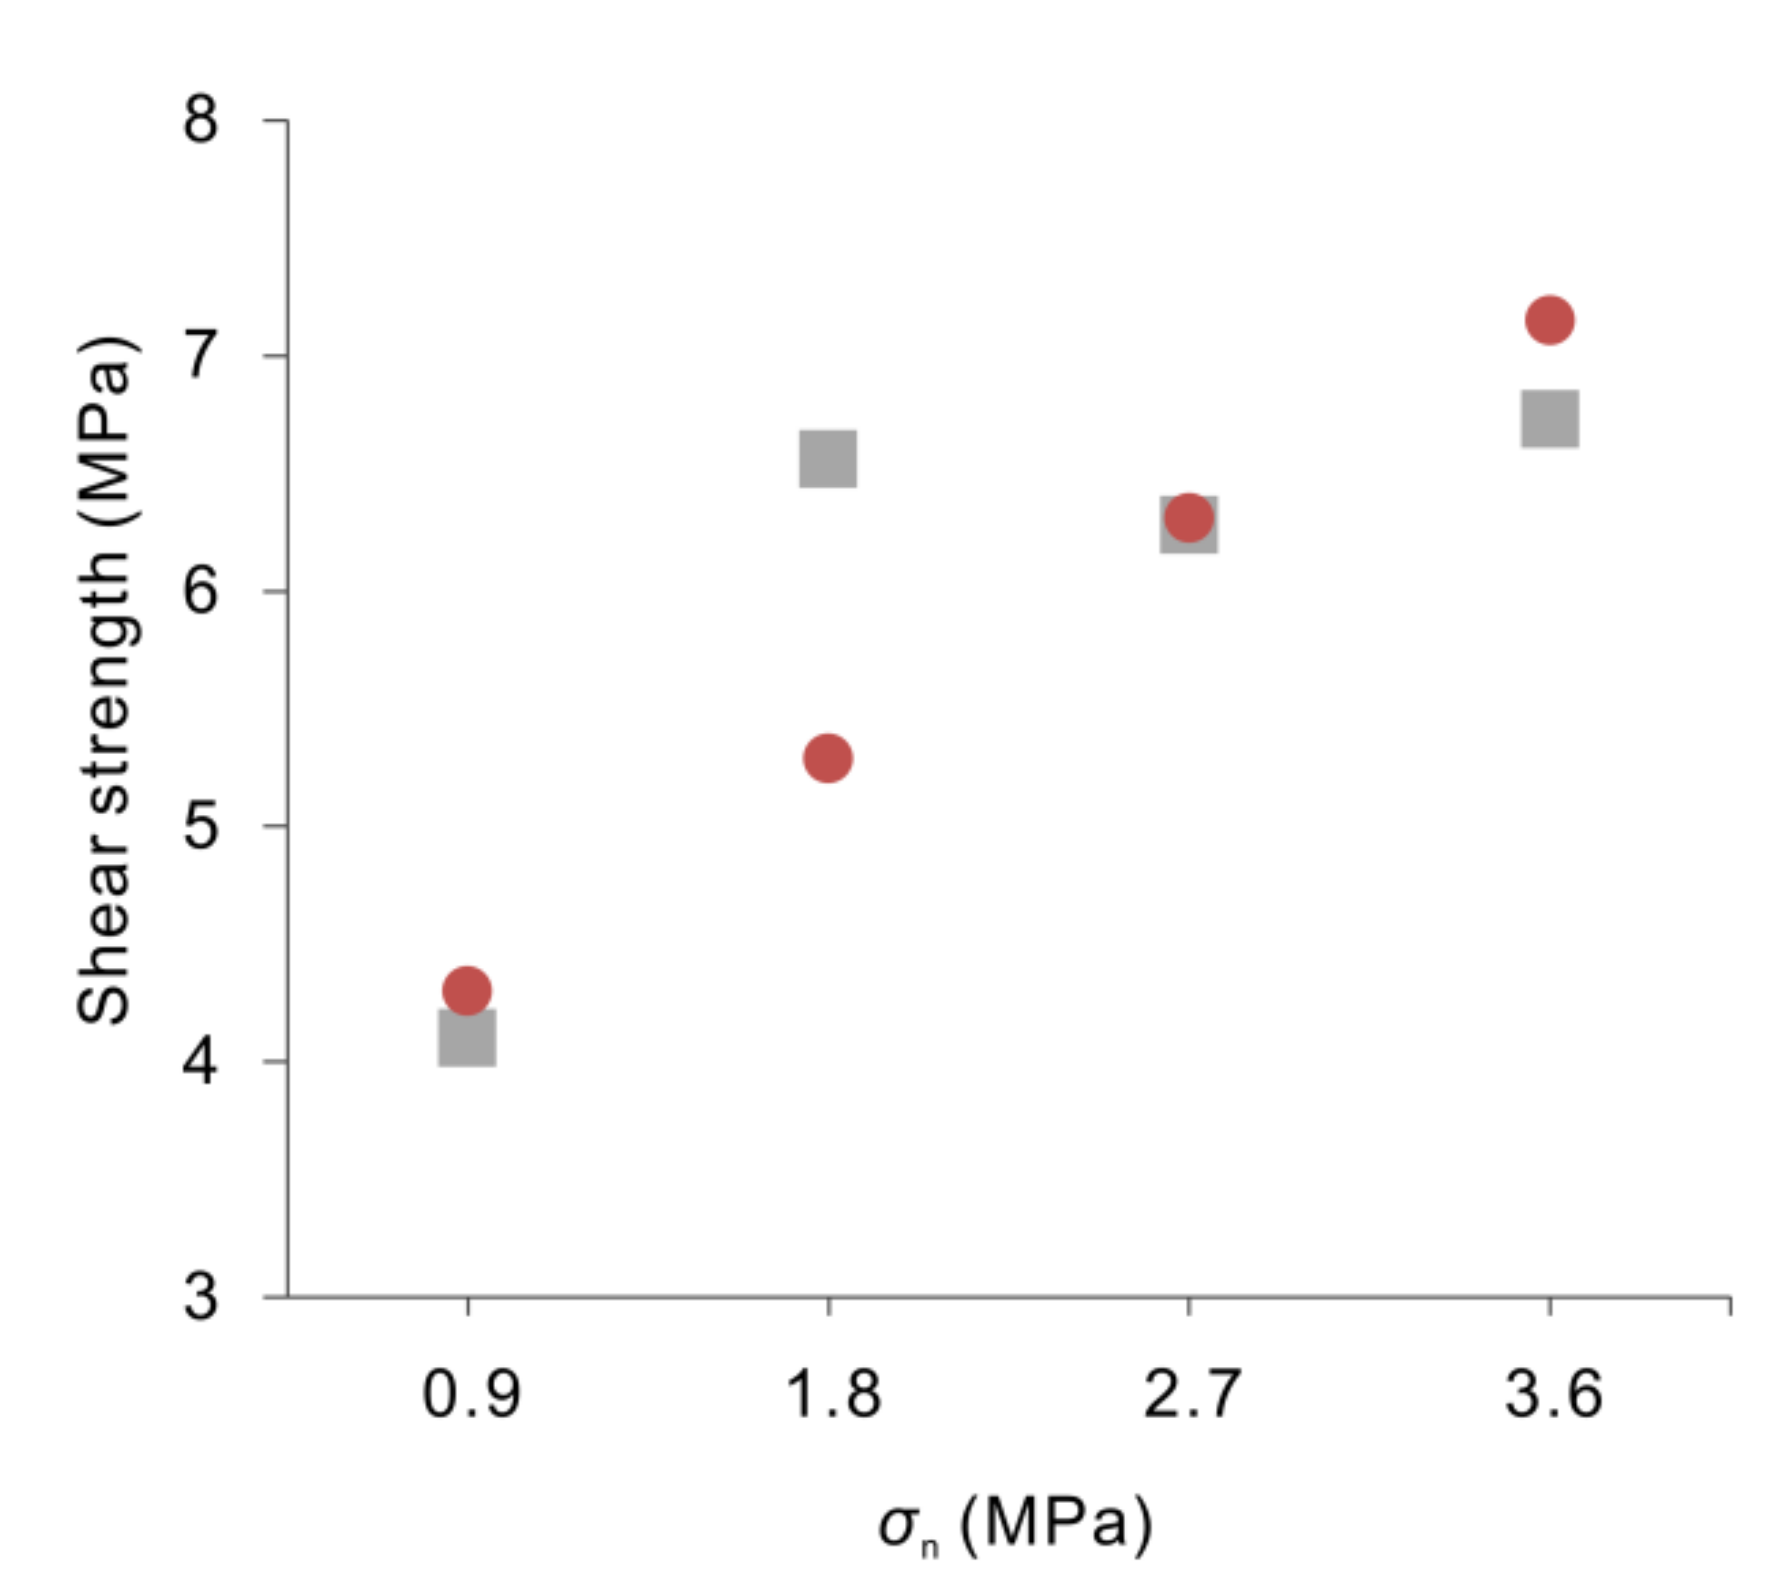
Table 3). The NT with different σ
n also gave out the satisfactory simulation results of shear strength (
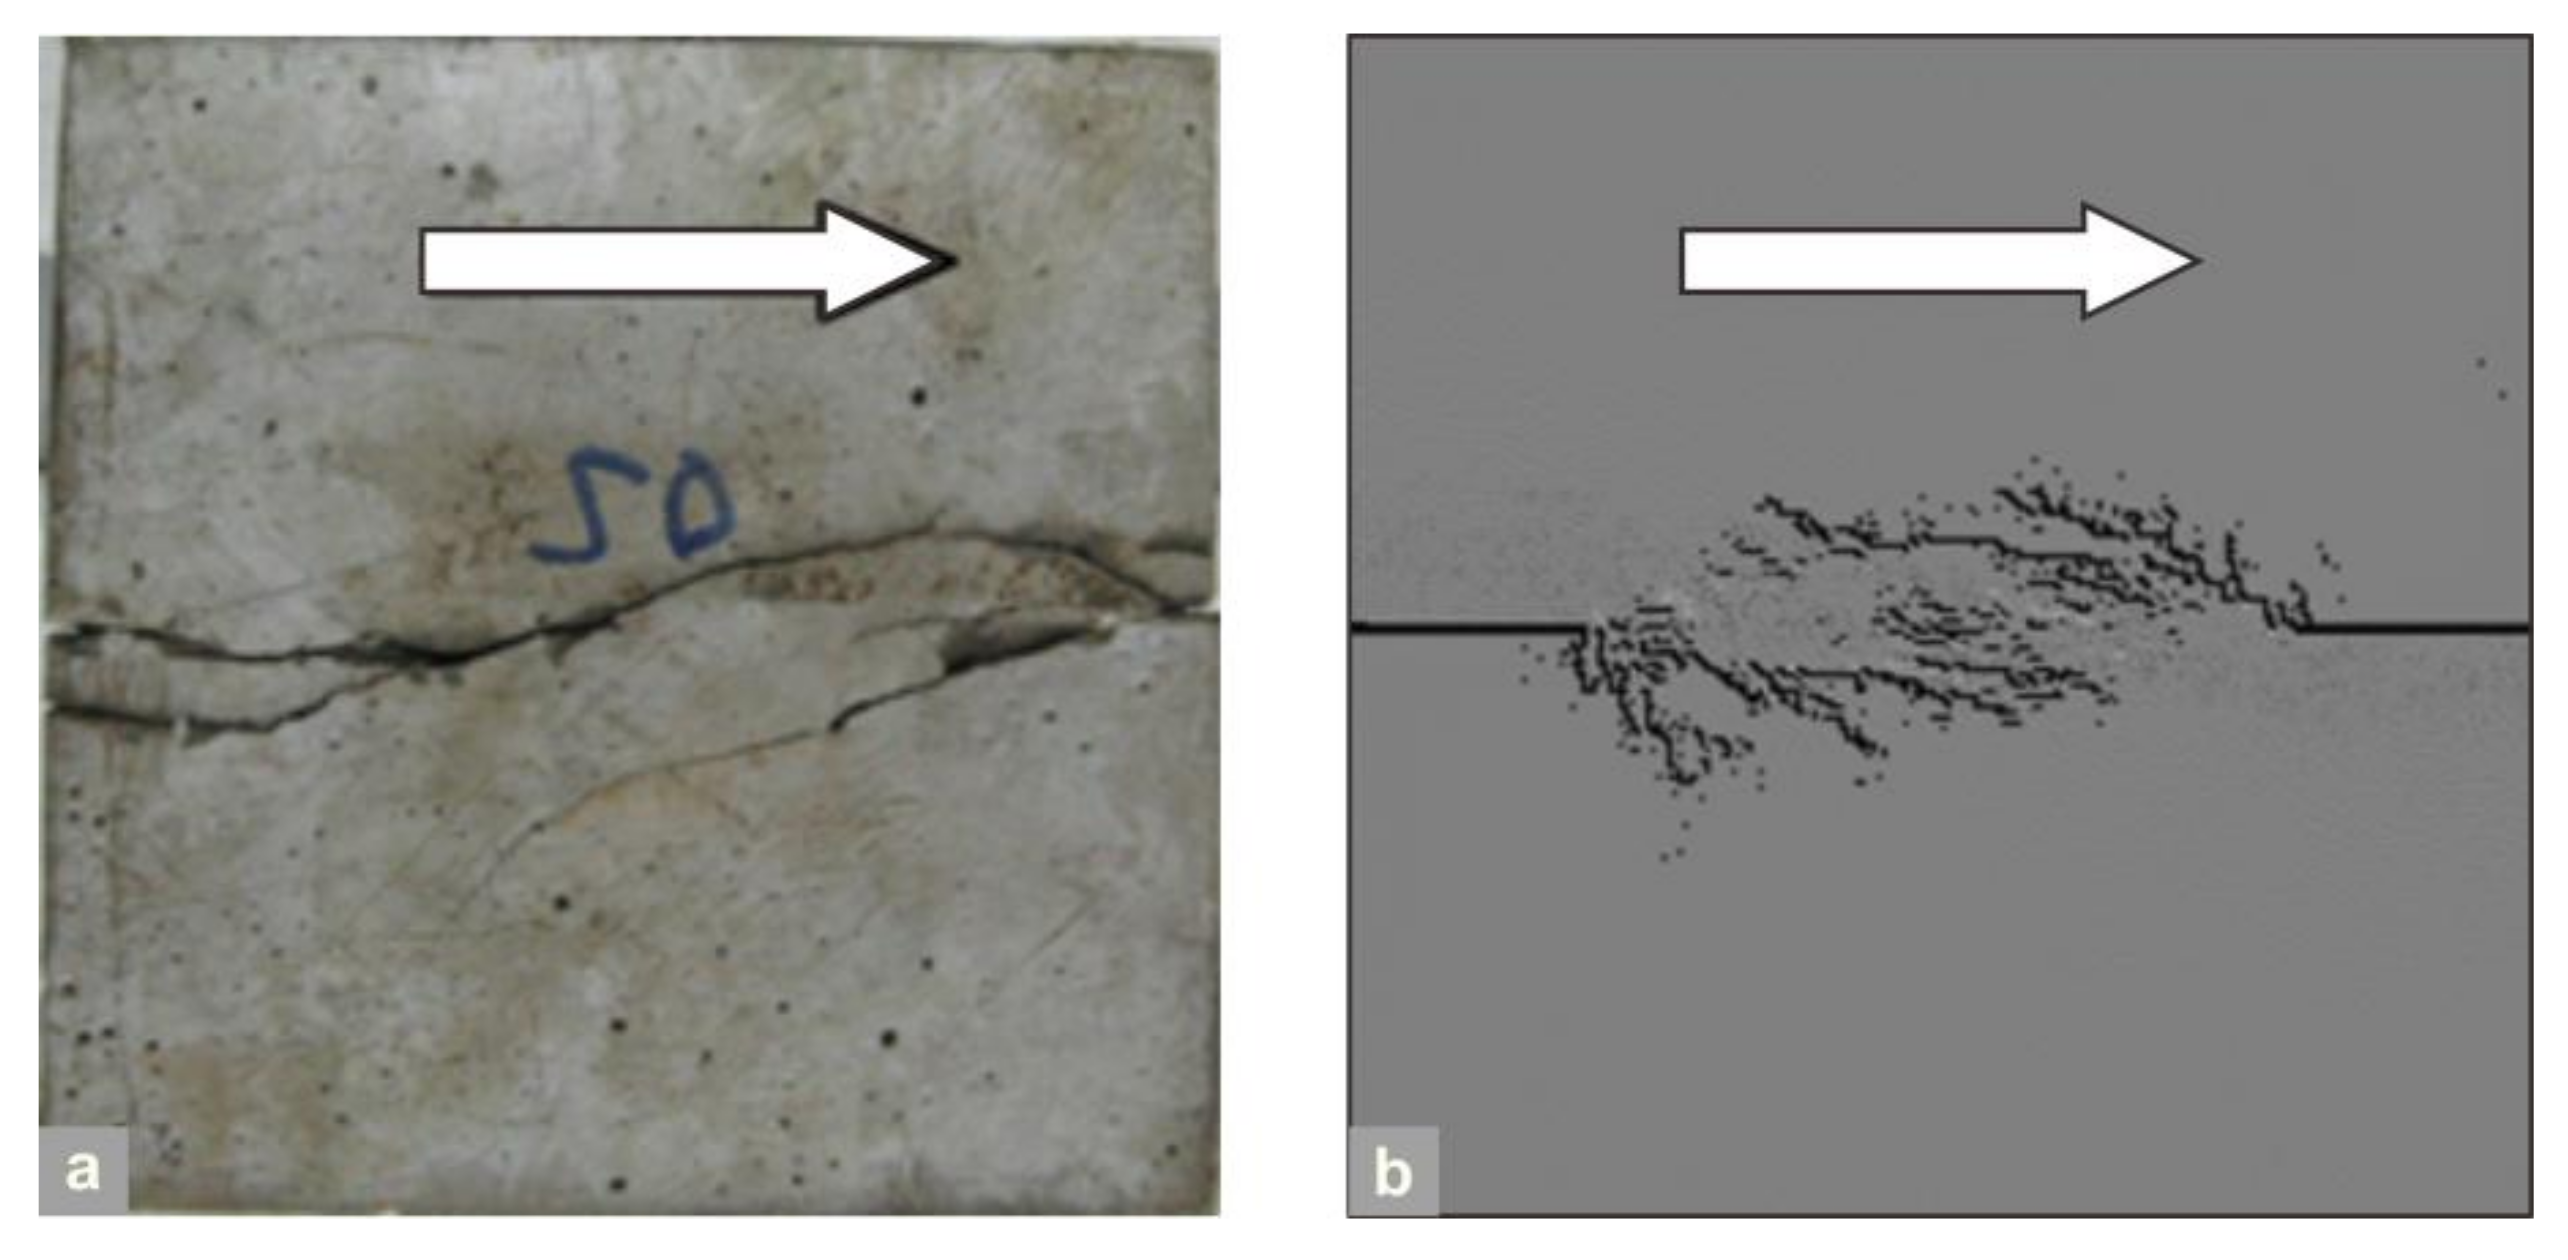
Figure 4). Furthermore, the NT and LT showed similar failure patterns (
Figure 5), i.e., several inclined shear cracks formed a waved shear zone penetrating the rock bridge. These results confirm that the values in
Table 2 are reasonable and they can well reproduce the experimental results. In view of this, we can analyze the progressive damaging behavior and AE characteristic of rock bridges by drawing on the NT results.
3. Analysis and Results
3.1. Damage Behavior and AE Characteristics of Rock Bridge
Taking the NT
2.7MPa (the subscript means the value of
σn) as an example, we analyzed the damage behaviors and AE characteristics of the rock bridge. We used Equation (2) to define the energy level
M of AE events. To ensure that the energy level of all AE events generated in the whole loading process was positive, the constant
C was equal to 3.0. The mechanical mechanism of each AE events was classified using the method mentioned in
Section 2.1.
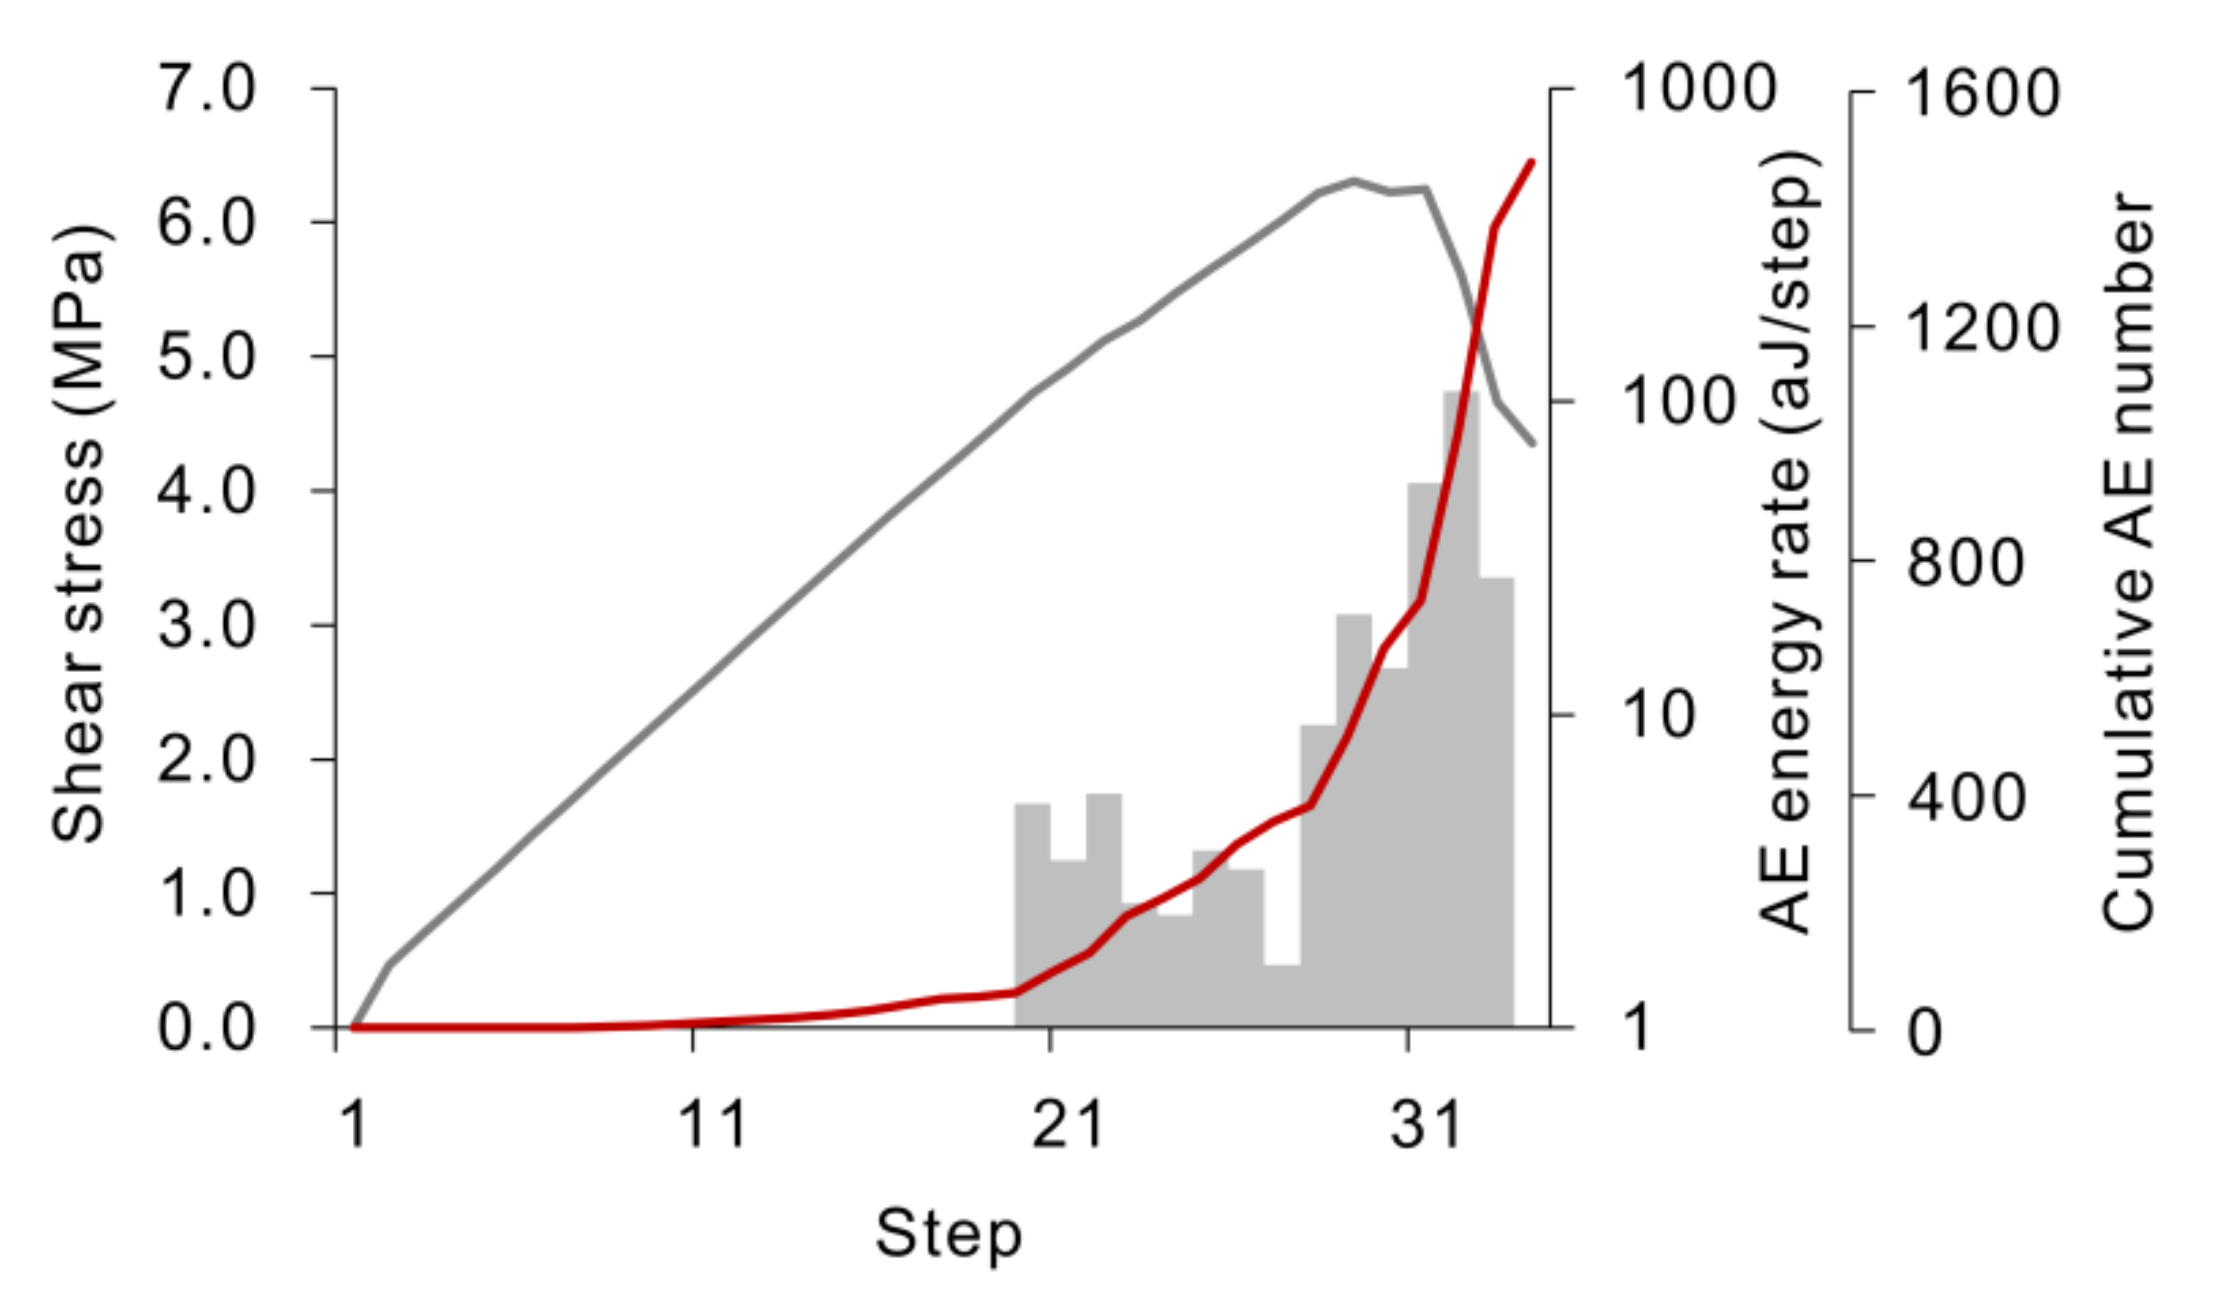
Cracking initiated in the rock bridge at the 10th step, corresponding to the onset of accumulation of AE number (
Figure 6). At the 20th step, the accumulation began to accelerate with the AE energy rate increasing sharply (
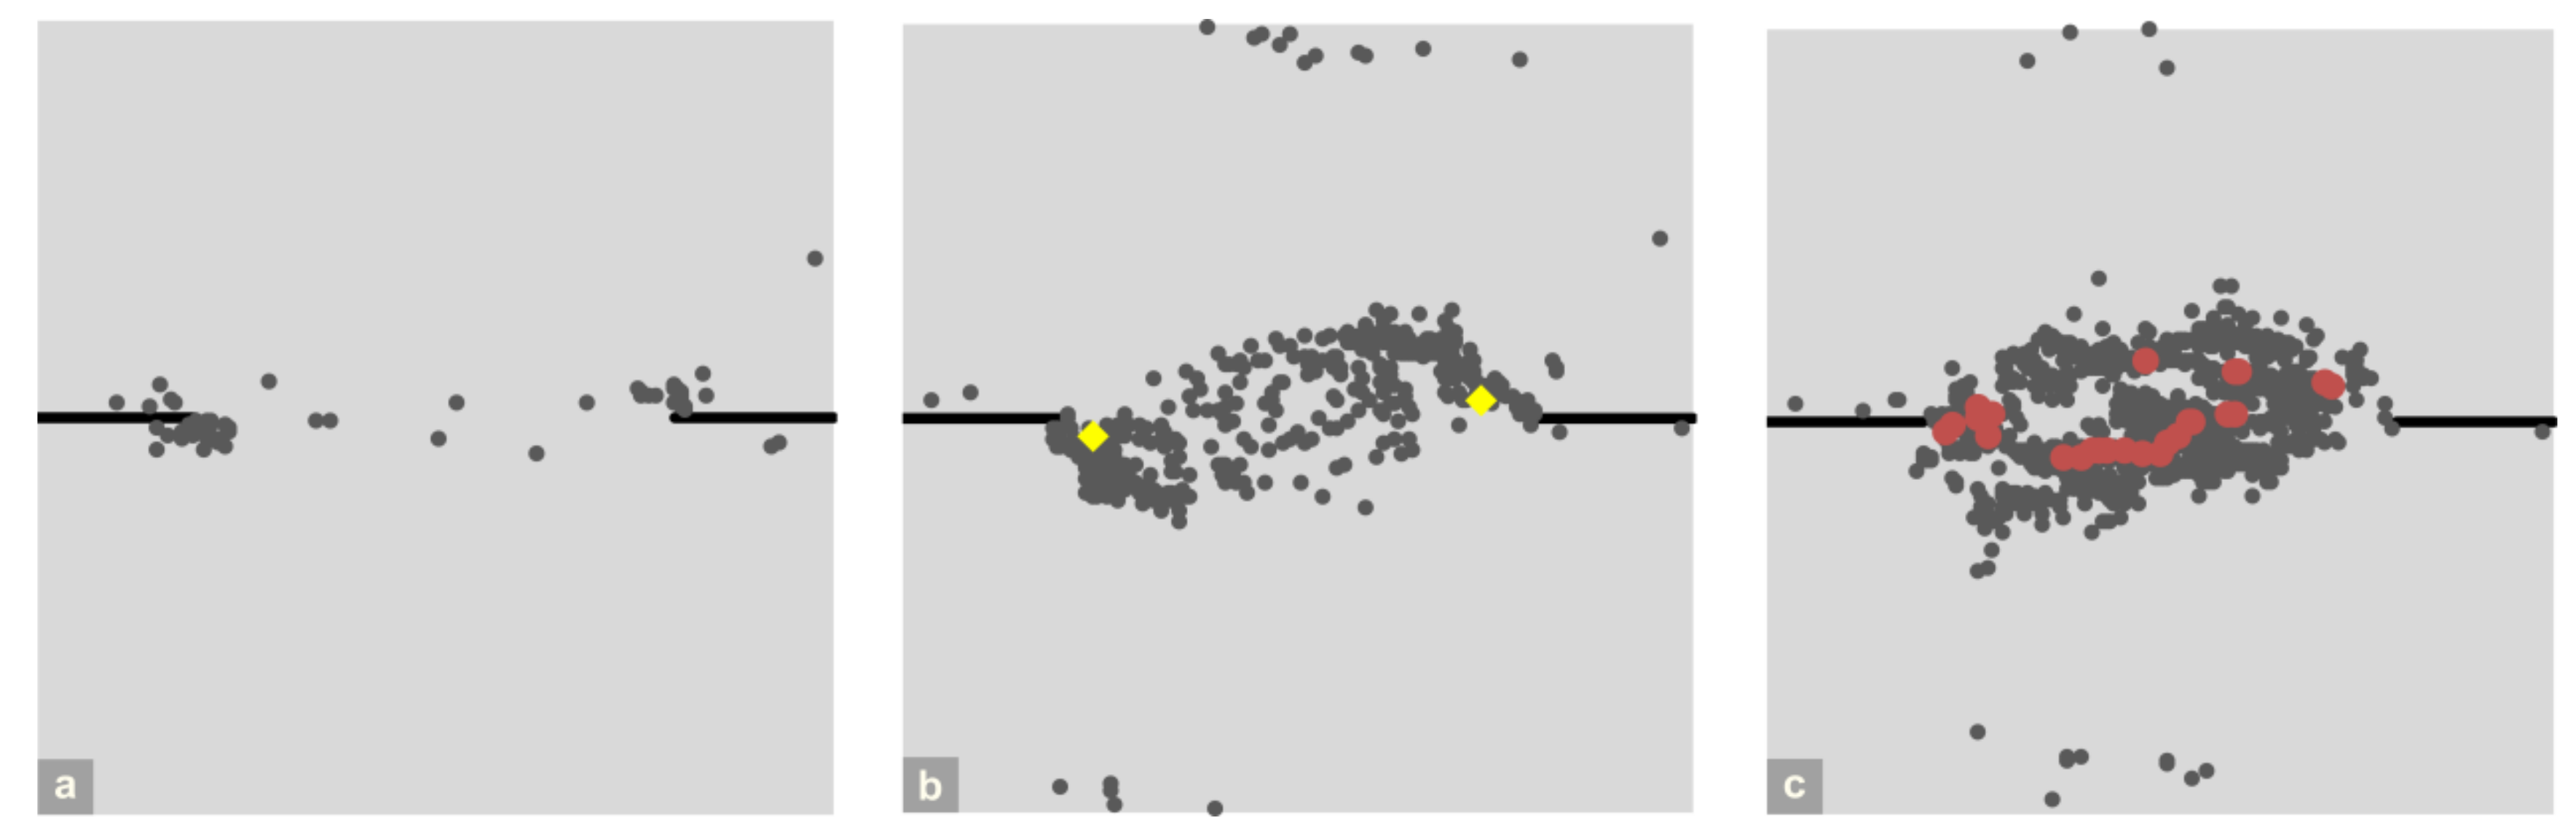
Figure 6), and two AE events of M 3.0 arose near the left and right joint tips, respectively. This pair of events was in shear mode; thus, they suggest the start of shear cracking in the front of the joint tips. We speculated that they served as the characteristic events corresponding to the volume-expansion point of the rock bridge, because they had the highest energy level in the pre-peak loading stage of the rock bridge. Along with the characteristic events, micro cracks began to grow and coalesce from the 20th step, and the cluster of micro cracks nearly spanned across the whole rock bridge at the 28th step prior to the peak-stress point of the rock bridge, as the temporal and spatial distribution of AEs showed (
Figure 7). This is the typical mechanical behavior in the unstable crack growth stage following the volume-expansion point. Additionally, the shear stress imposed on the rock bridge was about 4.7 MPa at the 20th step, which is quite close to the value (4.9 MPa) corresponding to the onset of accelerating cracking (i.e., the volume-expansion point was reached) as Liu et al. [
27] reported. Drawing on these phenomena comprehensively, we can determine that the rock bridge in NT
2.7MPa was damaged enough to reach its volume-expansion point at the 20th step. The AE characteristics corresponding to this point include the burst of AE energy rate and the occurrence of characteristic events.
The rock bridge was damaged enough to reach its peak-stress point at the 29th step; and it ruptured at the 32nd step, generating a sharp stress drop and dramatic burst of the cumulative AE number and energy rate. The greatest AE event (M 3.5) in the whole loading process, which can be referred to as the “mainshock”, occurred at this step, and it was also generated in shear mode. Considering that the rupture of a brittle rock bridge usually occurs soon after its peak-stress point, this point can roughly indicate the rupture of the rock bridge and thus mainshock approximately corresponds to this point.
In summary, the AE activity pattern during the unstable crack growth stage comprises characteristic events, a certain number of larger events (including a mainshock) at peak-stress point, and smaller events between the volume-expansion and peak-stress points. This special pattern can be helpful to identify the volume-expansion point of rock bridges.
3.2. Energy Level of Characteristic Events and Mainshocks
The energy level of characteristic events and the mainshock corresponding to the volume-expansion and peak-stress points of the rock bridge under certain conditions of the NT are M 3.0 and M 3.5, respectively. However, the geometry and loading conditions (e.g., size and normal stress) of natural rock bridges as well as the energy level of their characteristic events and mainshocks can differ across coastal cliffs owing to different structures and lithologies. To investigate the trends of the energy level of characteristic events and mainshocks changing with these parameters, we modified the normal stress (σn), mean UCS of mesoscopic elements (σ0), rock bridge length (r), and model length (L) of the NT2.7MPa, respectively, and then recalculated.
All these rock bridges generated characteristic events with a high energy level when they were damaged enough to reach volume-expansion points. Such uniformity implies that characteristic events are possibly qualified to serve as the general precursor to the rupture of rock bridges (mainshocks).
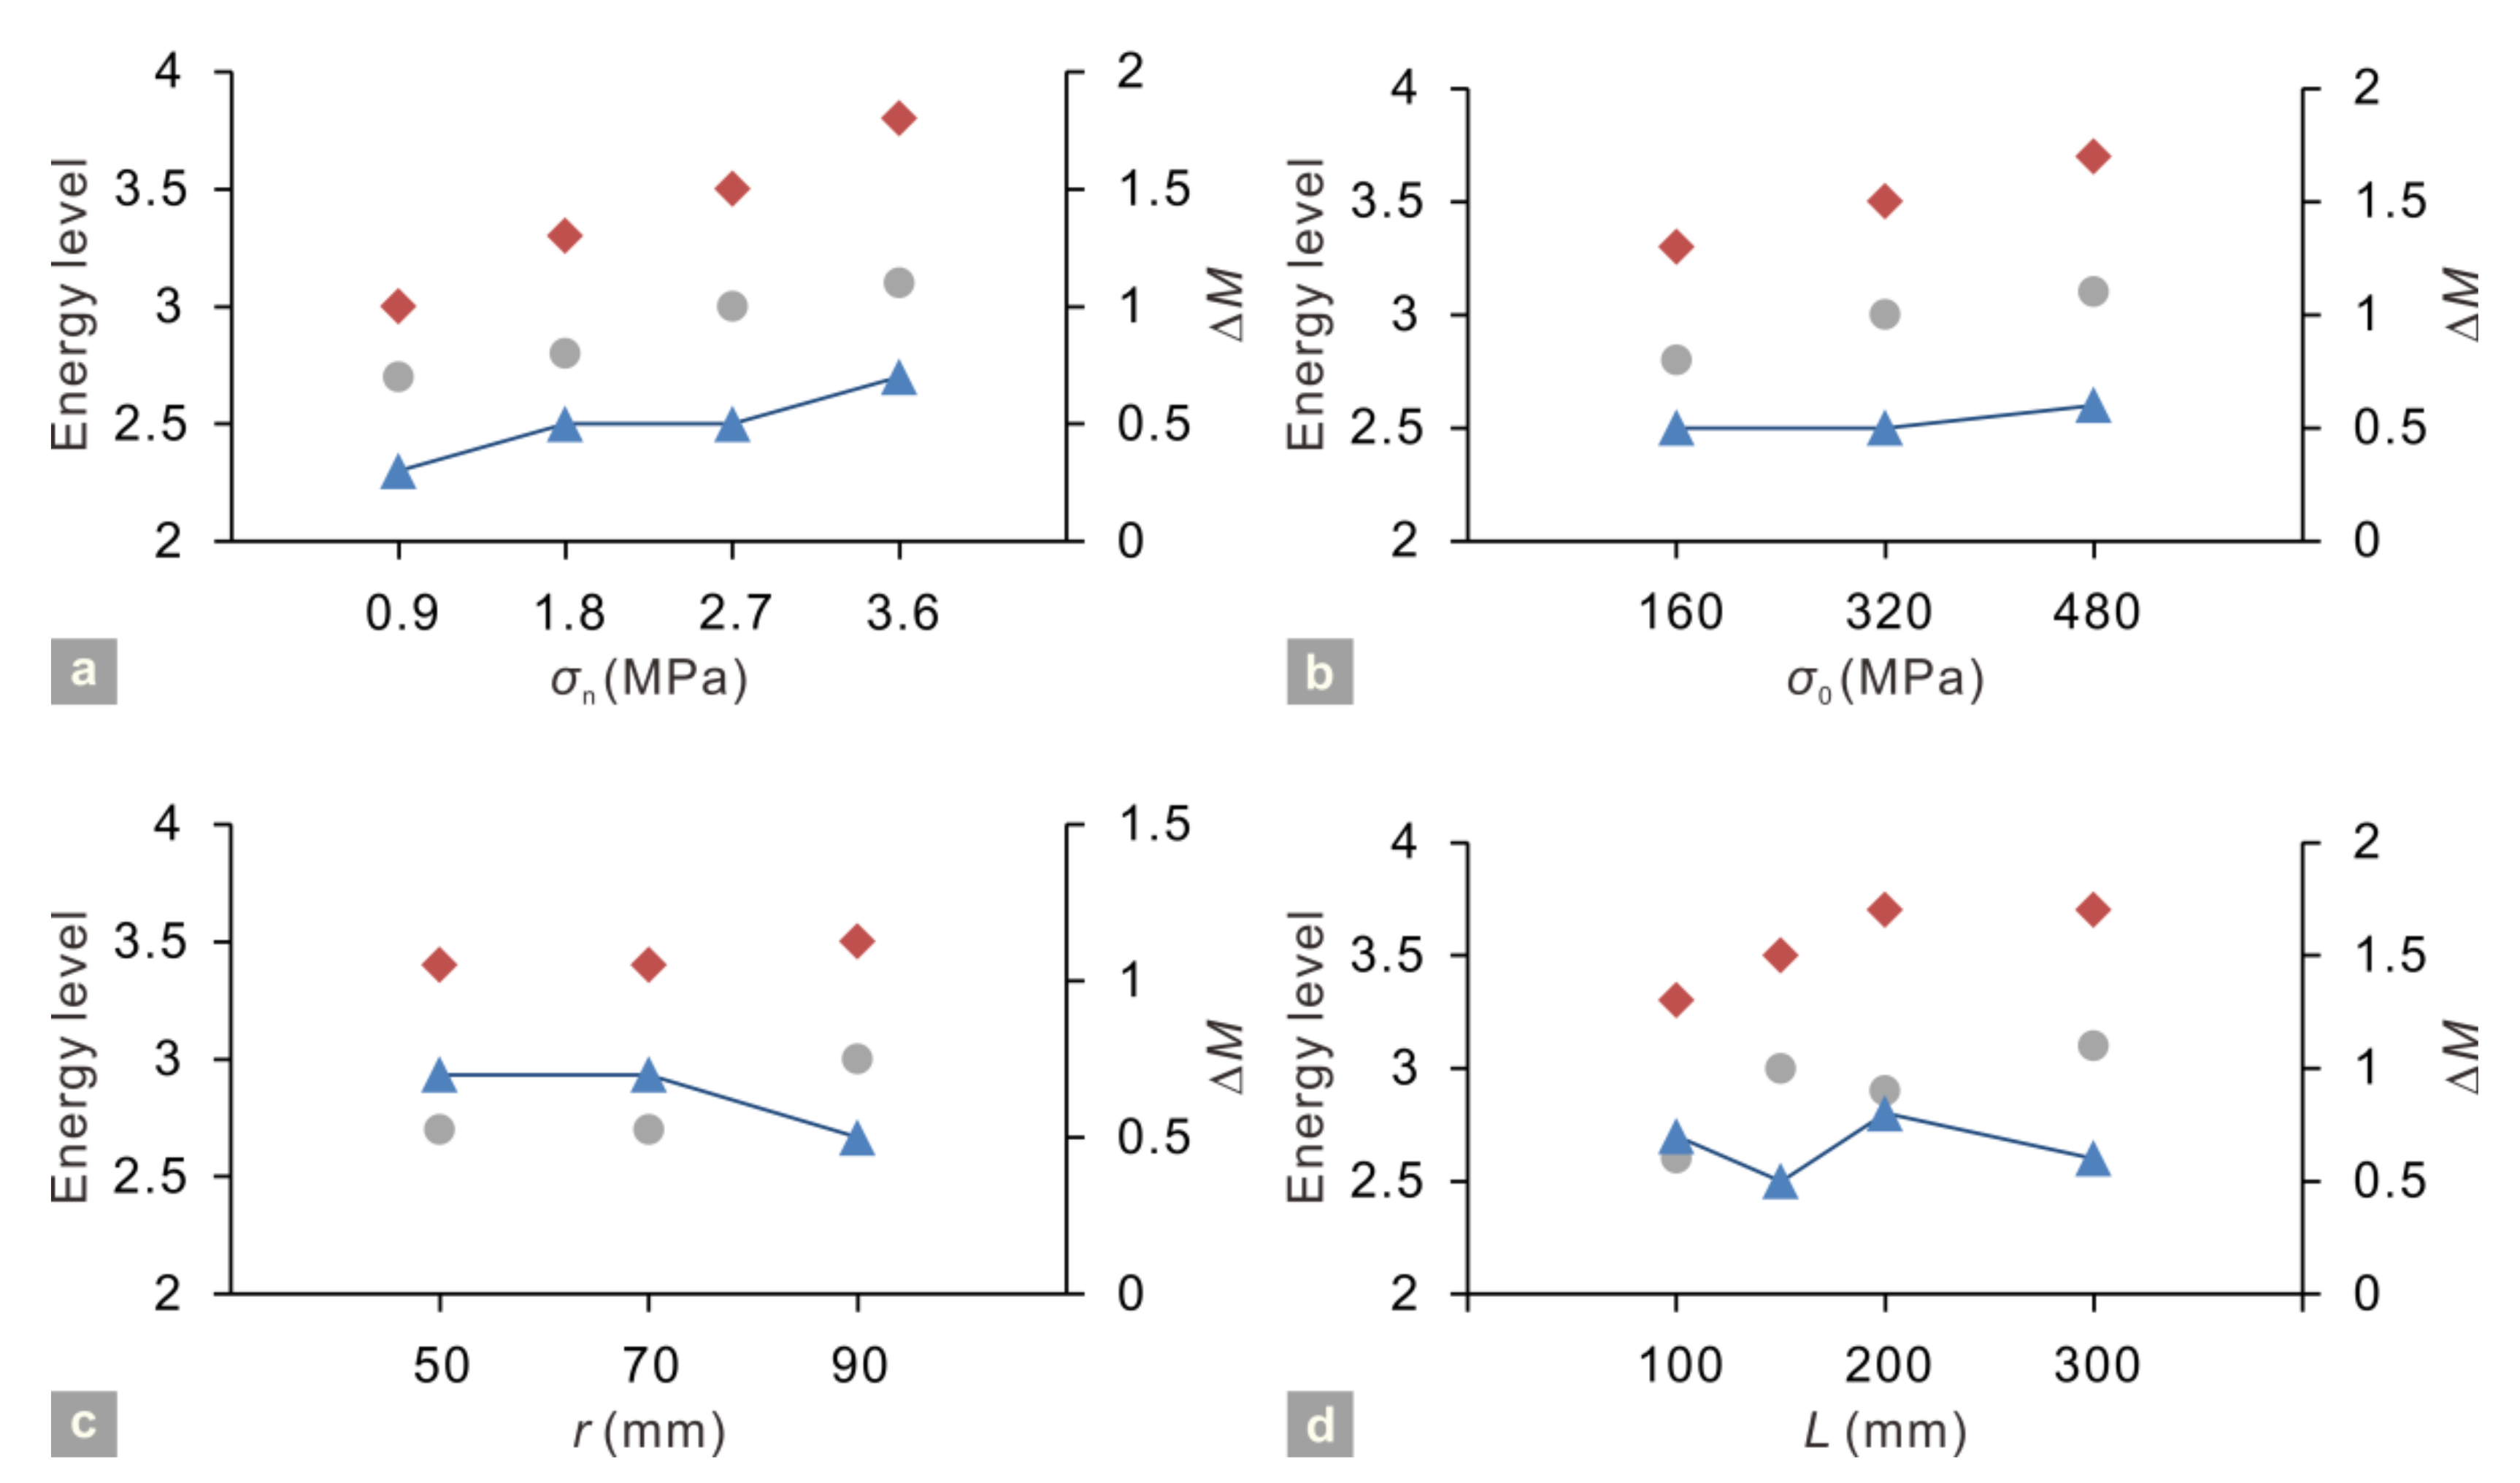
The energy level of both characteristic events and mainshocks generally rose with the increase of these parameters (
Figure 8), which can be explained according to basic rock mechanical principles. The increasing
σn and
σ0 enhance the shear strength of rock bridges, which enables the rock bridges to accumulate more elastic strain energy and thus raises the energy level of AE events. Similarly, regarding rock bridges with a larger size (or longer length), their cracking scale and the energy level of AE events are naturally larger.
Although the energy level of both characteristic events and mainshocks changes with those parameters, it is notable that the differences of their energy level, ∆
M, (i.e., the energy ratio between the peak-stress and volume-expansion points) fall into the range of 0.5–0.7 in most cases (
Figure 8); in other words, the values of ∆
M are approximately constant. We found that the average of ∆
M and its standard deviation was 0.63 ± 0.13. Similarly, the shear stress ratio
σc/
σf and shear strain ratio
εf/
εc (subscript “c” and “f” indicate volume-expansion and peak-stress points) of these cases were generally constant, and their averages and standard deviations were 0.79 ± 0.06 and 1.39 ± 0.13. These characteristics imply a specific internal mechanical relation between the volume-expansion and peak-stress points, and the difference of energy level between the characteristic events and the mainshock was less significant than expected. The AE events that can indicate the damage state at the volume-expansion point of a rock bridge should have a high energy level.
3.3. Micro-Seismicity in the Evolutionary Process of Coastal Collapse at Mesnil-Val, NW France
The coastal chalk cliffs at Mesnil-Val, NW France, have long been subjected to recession, which causes collapses frequently. Micro-seismicity monitoring of a potential unstable cliff began from January 2002 (
Figure 2; [
21]). The evolution of this cliff toward instability was attributed to the shearing along pre-existing joints and small faults [
33]. The shear cracking occurred within a rock bridge at the bottom of the cliff, because the rate of micro-seismic events was observed to increase during high tides that promoted the cracking [
33].
Before the cliff lost its stability and caused a collapse on 23 June 2002, the micro-seismic event rate burst twice, on 19 February 2002 and 14 May 2002, respectively. Although these two bursts were similar in event number, only the former one occurred with a jump of accumulated micro-seismic energy. This suggested that the micro-seismic events occurring on 19 February had the higher energy level, whereas the rate burst on 14 May mainly comprised smaller events. Referring to the AE characteristics at the volume-expansion point of rock bridges and their subsequent smaller events shown in the numerical simulations, we can speculate that the former burst probably indicated the volume-expansion point of the rock bridge. The micro-seismic energy jumped abruptly again when the collapse occurred, which can be attributable to the rupture of the rock bridge and the occurrence of the mainshock. The micro-seismicity pattern of this natural rock bridge is similar to the AE activity from the volume-expansion points of numerical rock bridges. To an extent, this case demonstrates the potential of the special pattern featured by AE (or micro-seismic) events with a high energy level in identifying volume-expansion point of rock bridges.
4. Discussion
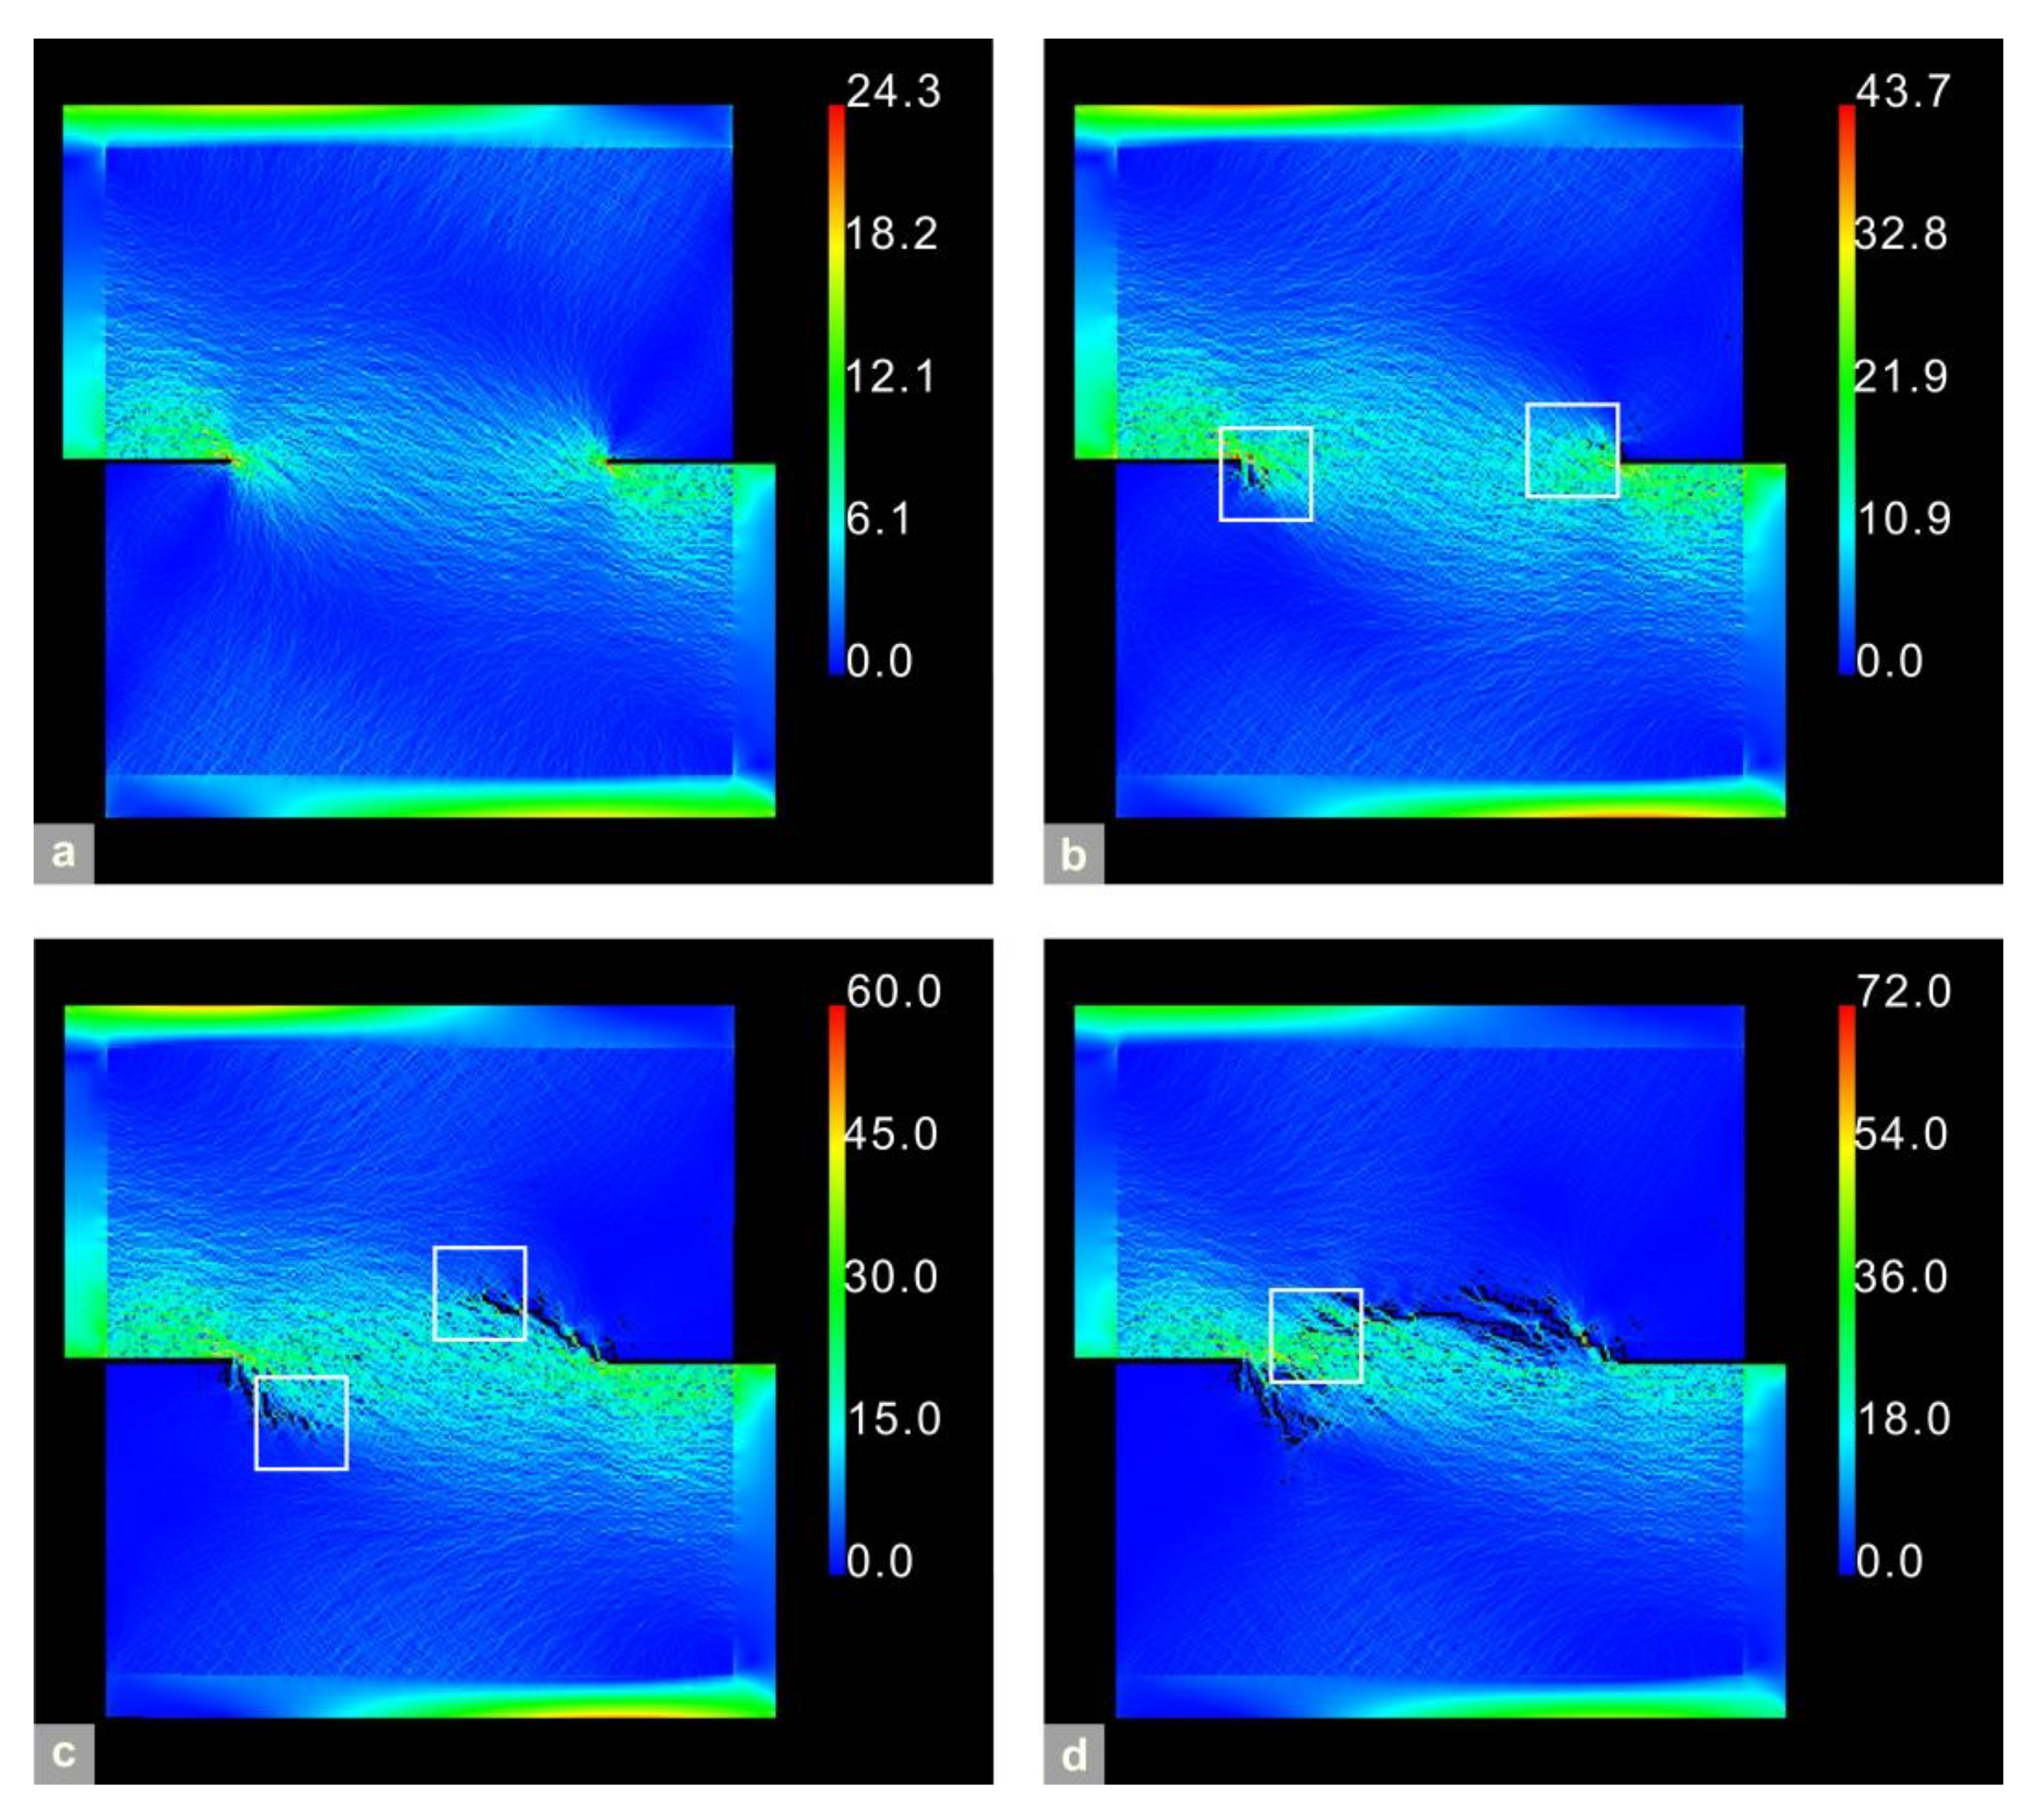
We attempted to clarify the formation mechanism of the special AE activity pattern from the volume-expansion point. Zhang et al. [
23] argued that the energy level of an AE event is dependent on the intensity of the stress concentration at the place it arises. As the shear stress field of NT
2.7MPa shows, the stress concentration was gradually enhanced at the joint tips as the shear load increased (
Figure 9a,b). The AE events generated before the volume-expansion point had a lower energy level owing to the less intensive stress concentration. When the rock bridge was damaged enough to reach its volume-expansion point, the two joint tips were the places where the shear stress concentrated intensively (~21.9 MPa;
Figure 9b) on the rock bridge, and thus the newly-generated shear crack and the corresponding shear-mode characteristic AE events appeared there. After the shear cracks formed, the level of shear stress at their tips (~15.0 MPa;
Figure 9c) was lower than that corresponding to the occurrence of the characteristic events. This is probably because the coalescence of preexisting cracks is easier than the generation of new shear cracks and therefore requires less elastic strain energy. In this context, the less intensive stress concentration corresponds to the lower energy level of AE events. The stress concentration at the rock bridge gradually enhanced again as its peak-stress point was approaching, because the load that the broken elements were burdened with was transferred to the remaining unbroken elements (local shear stress > 36.0 MPa;
Figure 9d) on the rock bridge with the accelerating growth of the shear cracks. Only when these elements fail can the rock bridge rupture. Since these elements have high strength and accumulate abundant elastic strain energy, they can generate quite a few AEs with a high energy level when the rock bridge ruptures. This is a possible explanation for why AE events with a high energy level occur at the volume-expansion and peak-stress points of a rock bridge while those events between them have a lower energy level.
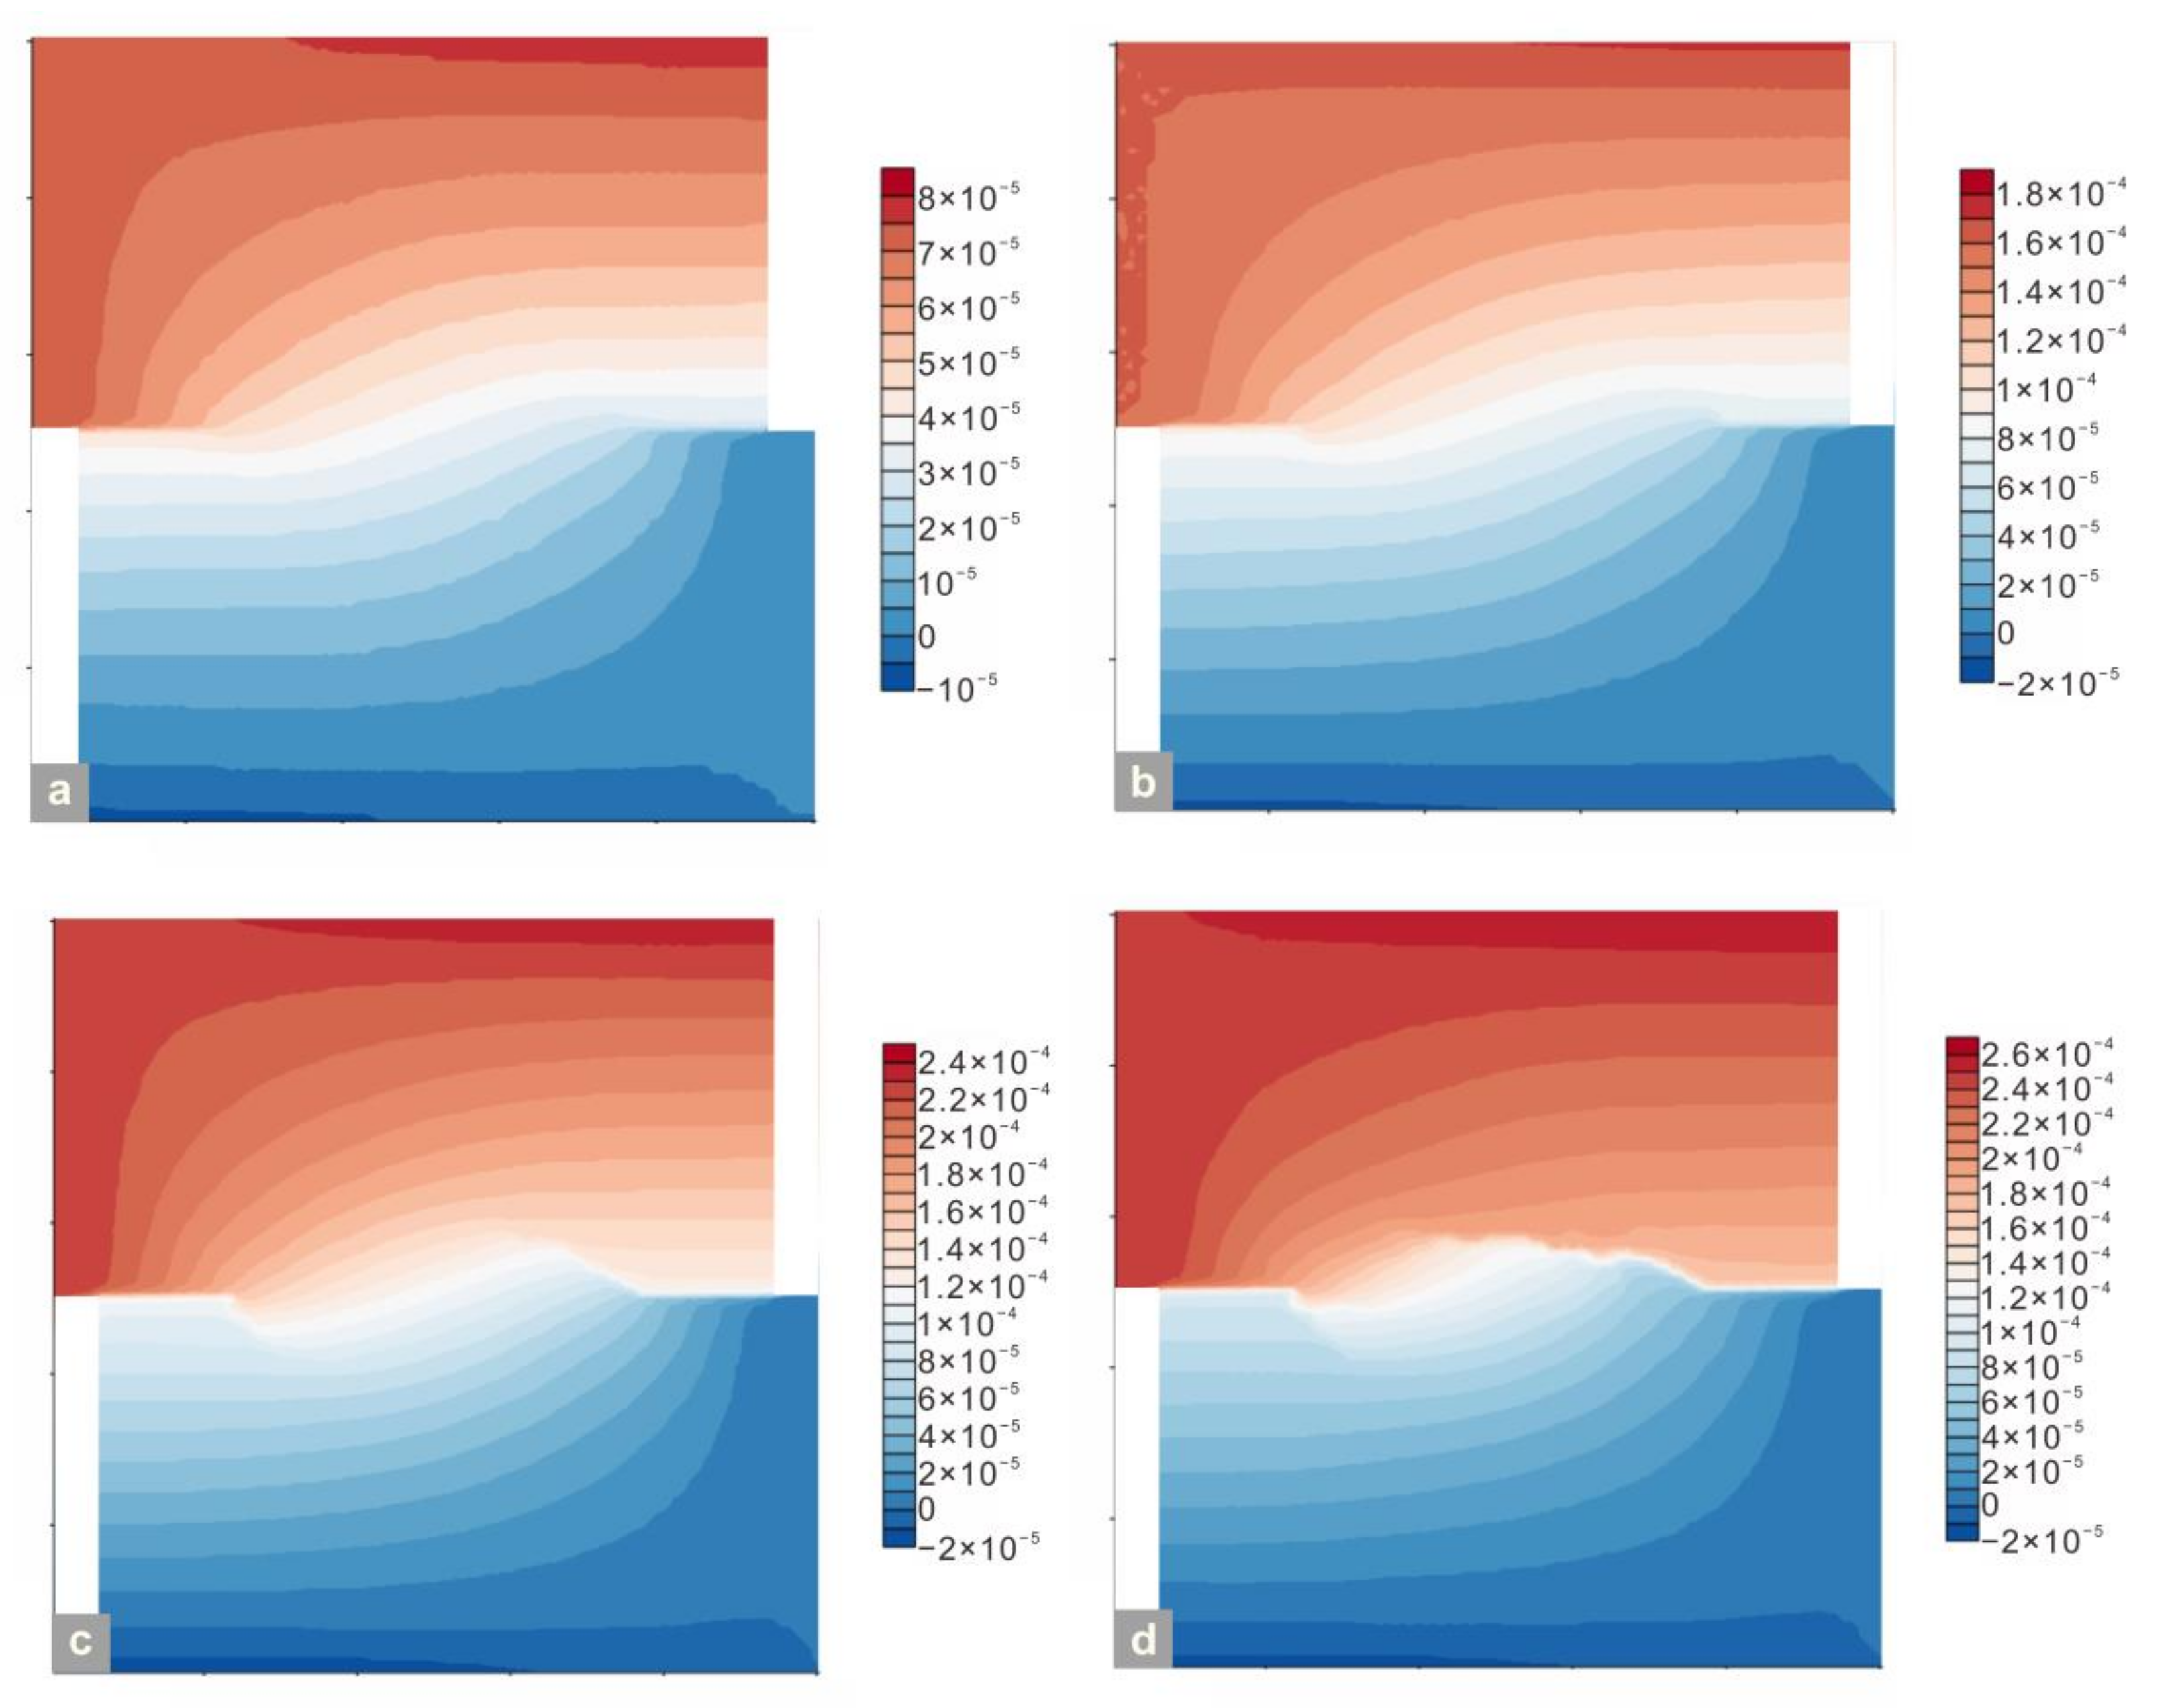
The spatial distribution of shear displacement (
Figure 10) on the rock bridge shows that the deformation of the rock bridge is much smaller than that of the hanging wall; the zone where the interval of displacement contour lines becomes smaller corresponds to the zone of intense shear stress concentration (
Figure 9). This suggests that the rock bridge strongly resisted the movement of the hanging wall.
The high-energy-level characteristic events and mainshocks of NT2.7MPa were in shear mode, though shear-mode AE events only occupied ~7% of all the events that NT2.7MPa generated. This is because shear strength is usually much higher than tensile strength, and thus it is more difficult for ruptures to occur in shear mode; for this reason, shear rupture can release more elastic strain energy, generating events with a higher energy level. This also agrees with the aforementioned intense stress concentration before shear ruptures.
Natural rock bridges usually have certain moisture contents, and they deform at extremely low strain rate with damage evolution caused by the complex combining effect of various external factors. Although a high moisture content and low strain rate lower the rock brittleness and reduce the AE event number, several rock mechanical experiments [
34,
35] show that they also enhance the AE energy jump at volume-expansion points. This suggests that these conditions are favorable to the formation of the special AE activity pattern that comprises high-energy-level characteristic events and mainshock and other events with a lower energy level between them, as the example of Mesnil-Val presented. Such a phenomenon implies the possibility of using characteristic events to serve as the indicators of mainshocks corresponding to the rupture of rock bridges.
Several researchers have reported that the stress and strain ratios between volume-expansion and peak-stress points fall within a certain range. For example, Xue [
36] and Xue et al. [
37] stated that the average ratios
σc/
σf and
εf/
εc and their standard deviations are 0.80 ± 0.10 and 1.34 ± 0.24. Our numerical results are well consistent with these statistical ones. Qin et al. [
38] and Xue et al. [
39] provided the theoretical expressions of the ratios, and revealed that they are usually insensitive to the change of lithology and loading conditions. That is, both the stress and strain ratios are approximately constant. The stress and strain values at the volume-expansion and peak-stress points are positive correlated with the stored elastic strain energy at these points of rock bridges, and a certain proportion of the stored energy releases and generates characteristic events and mainshocks; therefore, the energy ratio of the mainshocks to characteristic events (i.e., the ∆
M) is also approximately constant. Considering that the higher energy level of AE (micro-seismic) events corresponds to larger scale cracking, it is possible to estimate the cracking size and hazard of collapses of coastal cliffs in advance based on the approximate constant ∆
M and the energy level of characteristic events.
Heterogeneity is the inherent property of rock, and understanding this is important to the framework of coastal cliff collapse. The strong heterogeneity of chalk mainly includes two cases: (1) even a single facies contains many defects (e.g., micro cracks and pores) which have different mechanical properties from the rock matrix, and thus such heterogeneity is mesoscopic, and (2) each chalk formation can comprise several facies with different physical and mechanical properties, and such heterogeneity is macroscopic.
The defects can be represented by weak elements that randomly distribute in numerical models, and thus the mesoscopic heterogeneity is modeled. Because the initial spatial distribution of the mesoscopic elements’ mechanical properties and the boundary conditions of conventional direct shear tests are both centrosymmetric in theory, so is the stress field when the volume-expansion point is reached. Thus, the pair of characteristic events with similar energy levels in each numerical case arose nearly simultaneously at around the joint tips, approximately showing a centrosymmetric distribution (
Figure 11).
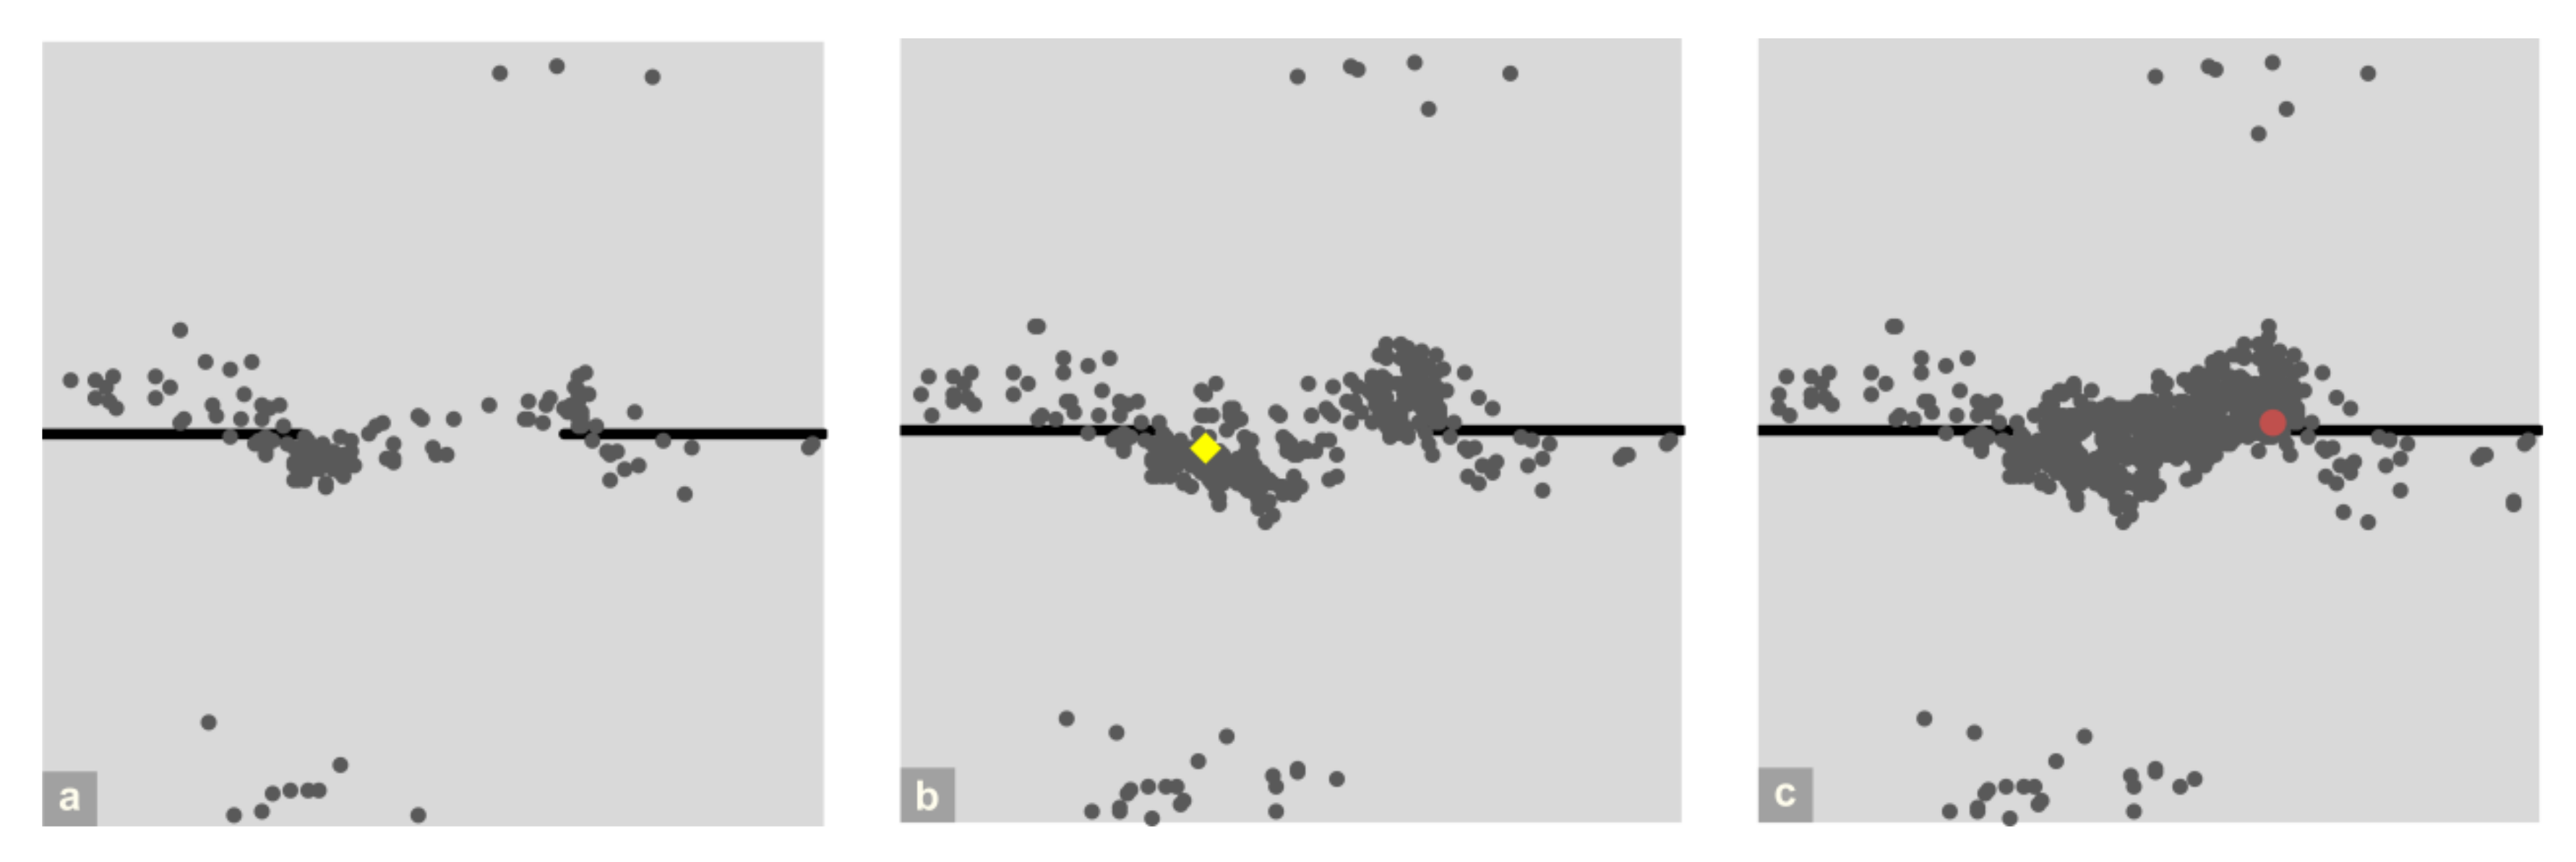
If a rock bridge consists of more than one facies, the spatial distribution of characteristic events is speculated to disappear when the aforementioned centrosymmetric conditions are no longer valid. We lowered the mean UCS of the mesoscopic elements in the left half of the NT
2.7MPa to 280 MPa, and recalculated with the other parameters unchanged to simulate the damage process of a macroscopic heterogeneous rock bridge comprising two facies. As a result, the cracks (AEs) initiated from the left half of the model and propagated toward the right half; one characteristic event and one mainshock with an energy level of
M 2.8 and
M 3.4 occurred at around the left and right joint tips, respectively (
Figure 12). Although the centrosymmetric distribution of characteristic events is unlikely to arise in natural rock bridges owing to their high heterogeneity and complex loading conditions, the occurrence of the characteristic events is still valid to identify the volume-expansion point and to determine the approximate location of rock bridges. The difference ∆
M = 0.6 still falls into the range of 0.5–0.7, suggesting that its constancy is independent of the symmetry of the model.
Many studies (e.g., [
40]) have revealed that strong heterogeneity can enhance the AE activity during the pre-peak stage of rocks. Thus, heterogeneity can provide more precursor information, and is helpful to predicting the instability of coastal cliffs.
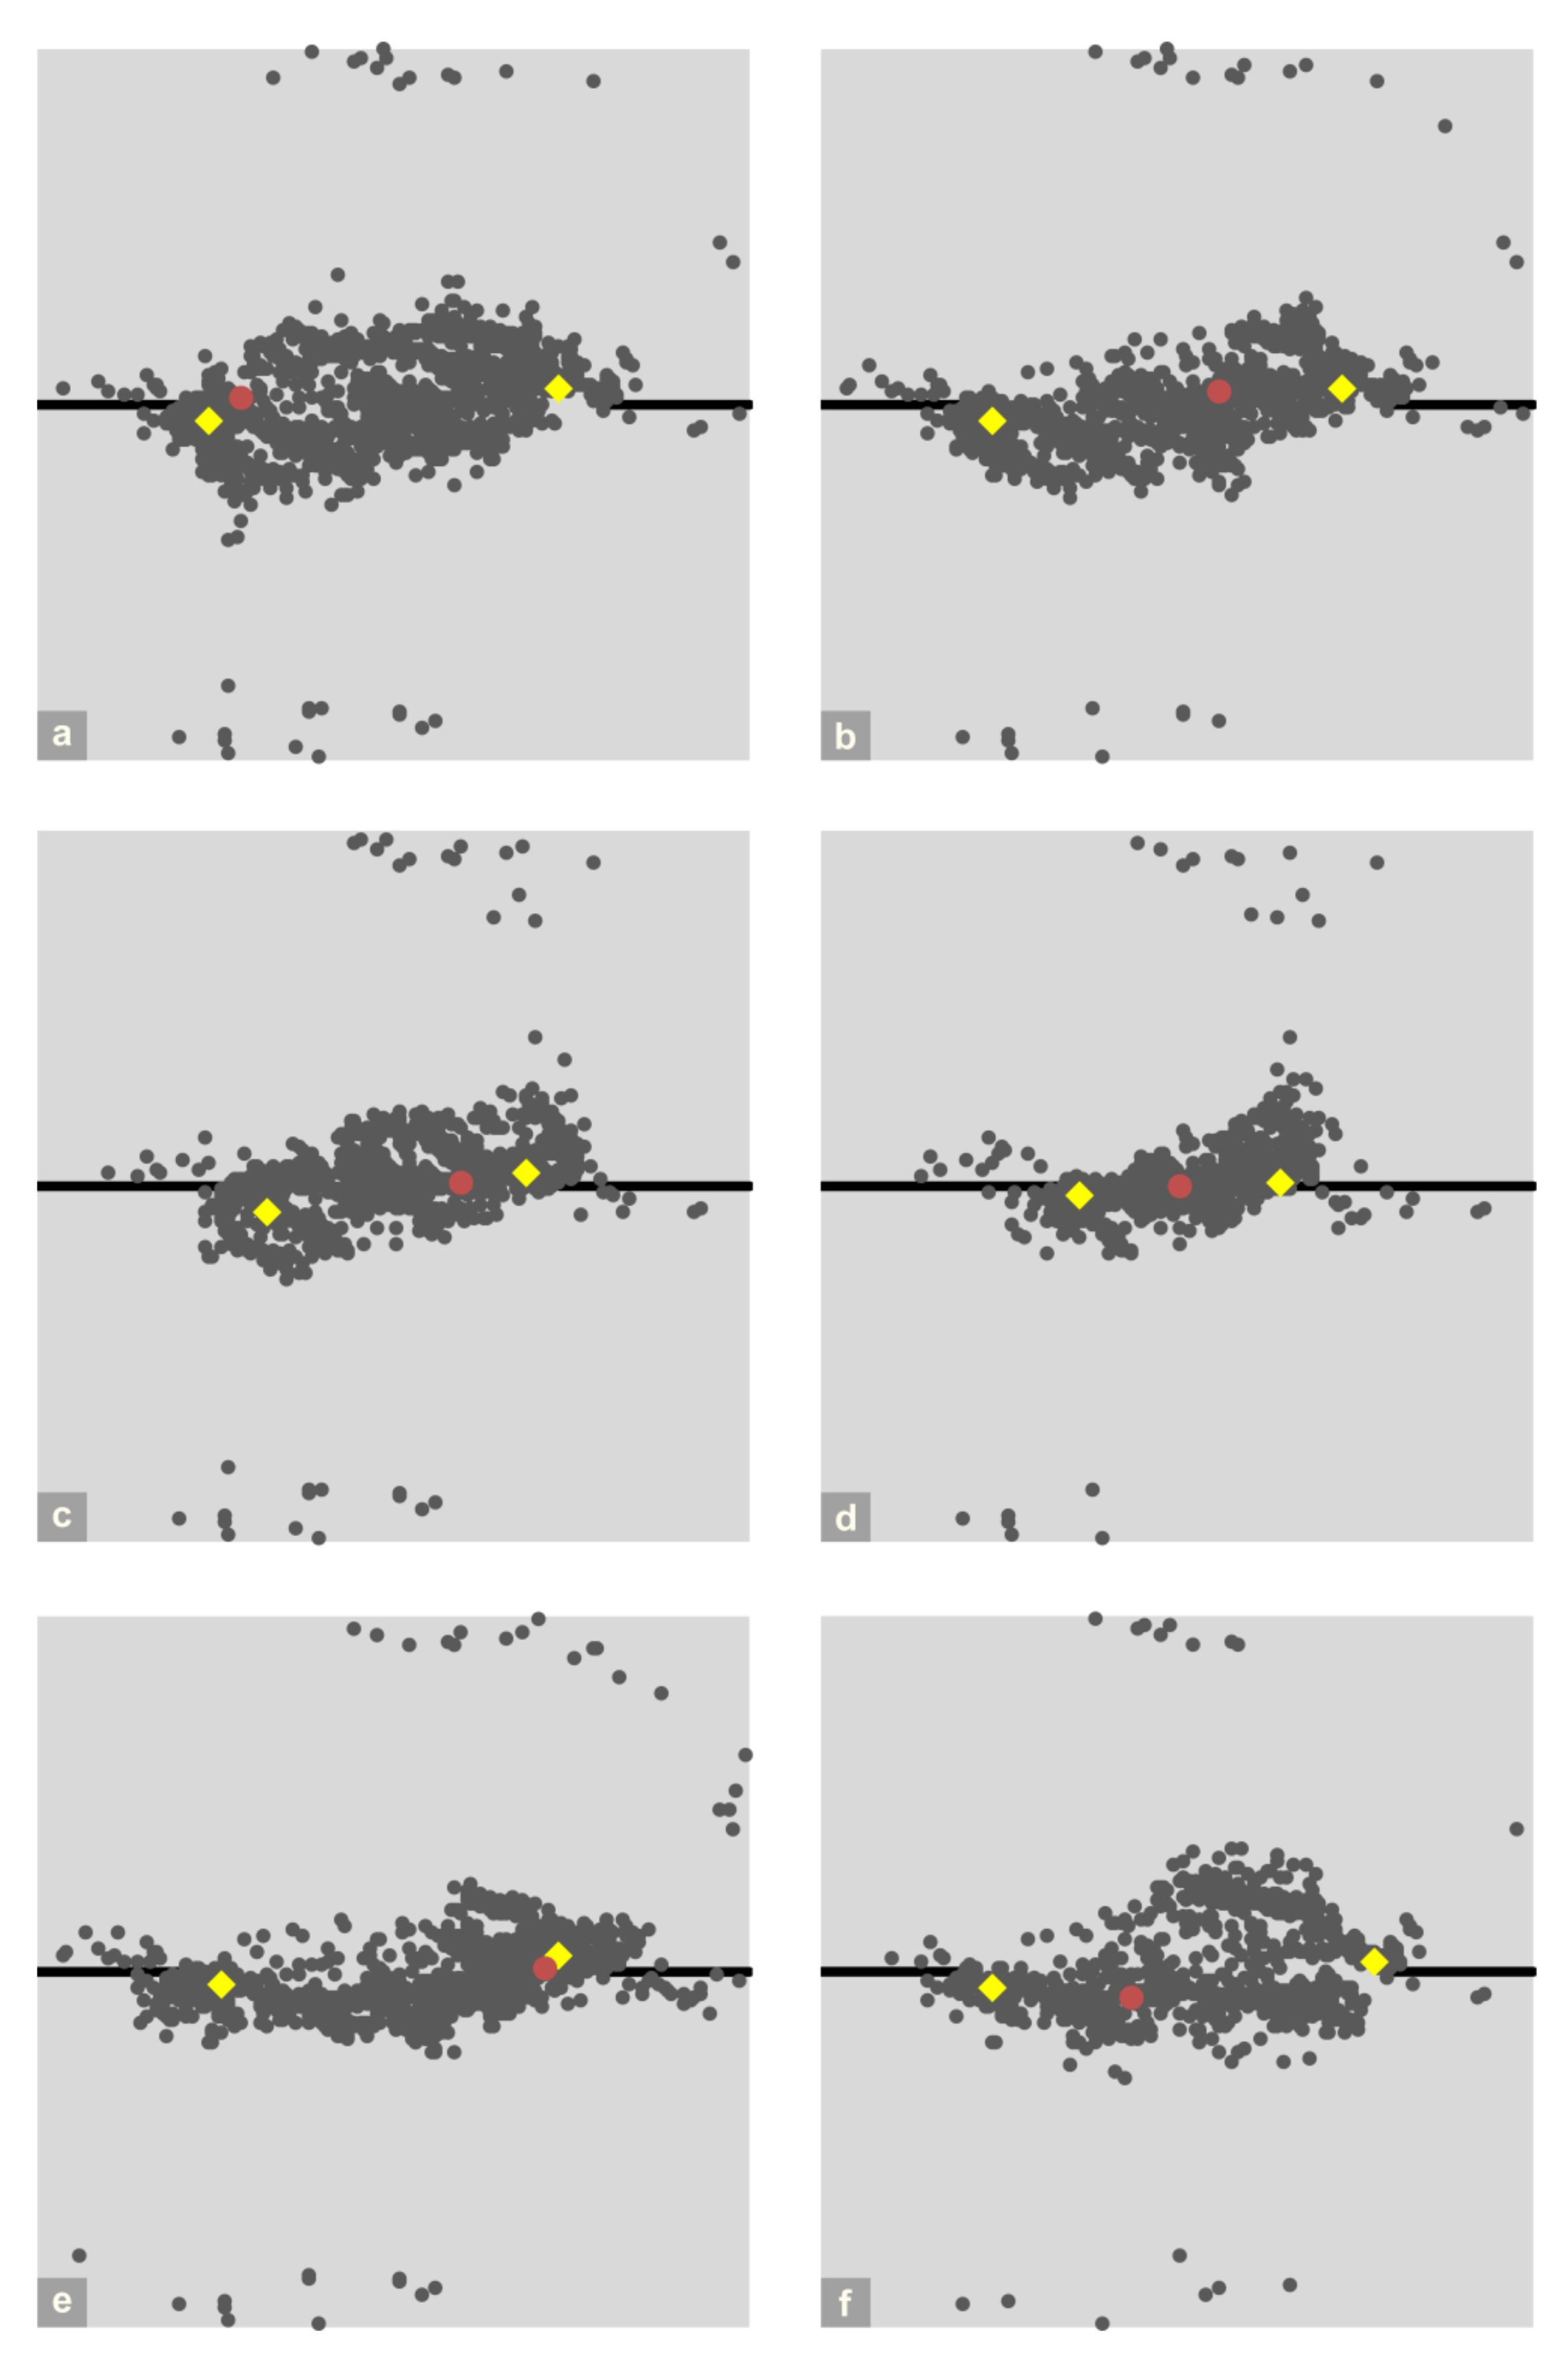
Rock bridges are the key structures that can accumulate abundant elastic strain energy, and thus mainshocks are certain to occur within rock bridges. Nevertheless, the location of the mainshocks is more random than that of the characteristic events: a mainshock can arise at the center of a rock bridge or near a joint tip (
Figure 11). This is because the local coalescence of cracks following the volume-expansion point (i.e., within the unstable crack growth stage) makes the distribution of the stress field on the rock bridge become more heterogeneous and non-linear, which results in asymmetric failure patterns [
26] as well as the random spatial distribution of the mainshocks.


