Article

Policies for Improving PM2.5 Particles and GHGs Emissions in a Maritime Port of Taiwan: Evidence Based on the INDC and GGRMA Regulations

1
Department of Transportation and Communication Management Science, National Cheng Kung University, No. 1, University Road, Tainan 70101, Taiwan
2
Research Center for Energy Technology and Strategy, National Cheng Kung University, No. 1, University Road, Tainan 70101, Taiwan
*
Author to whom correspondence should be addressed.
J. Mar. Sci. Eng. 2021, 9(12), 1315; https://doi.org/10.3390/jmse9121315
Submission received: 6 November 2021 / Revised: 19 November 2021 / Accepted: 20 November 2021 / Published: 23 November 2021
(This article belongs to the Section Marine Environmental Science)

Abstract

:
The impact of possible emission reduction policies designed to reduce port emissions in the Port of Kaohsiung in Taiwan was analyzed, focusing on ways to reduce air pollution from C O 2 , C H 4 , N 2 O , P M 10 , P M 2.5 , N O x , and S O x generated by vessels, cranes, and truck tractors in the port. This paper was set up in two stages to determine how pollution reduction policies could reach the 2030 and in 2050 goals. The results showed that emissions of C O 2 , C H 4 , N 2 O , P M 10 , P M 2.5 , N O x , and S O x could be reduced by 46%, 26%, 25%, 77%, 77%, 76%, and 68%, respectively, in the first stage (in 2030, INDC), and by 57%, 59%, 53%, 79%, 79%, 80%, and 69%, respectively, in the second stage (in 2050, GGGRMA), as compared to 2005 data. This paper concludes as follows: (1) for vessels, the use of liquid natural gas is the best way to reduce GHGs when navigating by water; (2) for bridge cranes, electrification is the better policy during operation; (3) in the case of truck tractors, the generation of battery-electric power is the best way to reduce emissions. These policy proposals for improving air quality can be applied to all ports in Taiwan.

1. Introduction

According to statistics published by the International Council on Clean Transportation [1], the international marine sector emitted 900–1000 million tons of C O 2 annually from 2007 to 2015, which accounted for 2.6% of global C O 2 emissions. Although the amount of C O 2 emissions in the marine sector is low when compared to global C O 2 emissions, a report from the International Energy Agency [2] shows that C O 2 marine emissions have increased by 77% since 1990. Increasingly prosperous seaborne trading is the reason for the rapid growth of marine C O 2 emissions. According to the Review of Maritime Transportation [3], global seaborne trading volume had reached 10.7 million tons by 2017. Between 2014 and 2019, the global seaborne trading volume increased by 4% annually, which is the fastest pace of growth in the transportation sector. This growth in seaborne trading is directly related to the growth in the pollution emissions produced by maritime shipping.
Ports are important nodes in marine transport and are a main source of C O 2 emissions. However, the gases generated in ports not only include C O 2 but also include deleterious gases such as C H 4 , N 2 O , P M 10 , P M 2.5 , N O x , and S O x . These gases pose a considerable threat to the environment and to residents living near a port. According to Corbett et al. [4], the air pollution that is generated by vessels causes approximately 60,000 deaths each year. Tian et al. [5], Xu et al. [6], and Mousavi et al. [7] also confirmed that the air pollution that is produced by a port affects the health and living quality of the residents who live in the areas surrounding the port. In other studies, several scholars [8,9,10,11,12,13] have attempted to quantify the external cost of the air pollution that is generated by ports and the economic loss that it causes.
To reduce the air pollution produced by ports, the International Maritime Organization [14] passed an Agreement that stipulates that by 2050, the C O 2 emissions of global shipping should be 50% less than it was in 2008. This is the first time that the IMO has set a clear goal for carbon reduction in the shipping industry. Additionally, numerous policies concerned with reducing air pollution in ports have been proposed. For example, López-Aparicio et al. [15] suggested that the use of low-sulfur fuels in ocean-going vessels could effectively reduce greenhouse gas emissions; Sciberras et al. [16] showed that the application of onshore power and LNG fuels could decrease the C O 2 emissions of vessels, and Chang and Jhang [17] determined that policies requiring vessel deceleration and fuel conversion could significantly reduce the C O 2 and S O 2 emissions produced by vessels.
However, most previous studies were not comprehensive in terms of assessing the air pollution that is generated by ports because most of them only considered the emissions produced by vessels [18,19,20,21] and ignored the air pollution that is generated by cranes and truck tractors in a port. This makes it impossible to accurately evaluate the overall air pollution in ports.
Evidence gathered by Corbett et al. [4] suggest that the air pollution in East Asian and Southeast Asian ports causes more deaths than anywhere else in the world, indicating that the air pollution produced by several world-class ports in Asia is quite serious. According to the World Shipping Council [22], the Taiwanese Port of Kaohsiung was the 13th biggest port in the world in 2016. Therefore, this study set the Port of Kaohsiung as an appropriate location for evaluating the extent to which air pollution is generated by vessels, truck tractors, and cranes in a port. To systematically assess the air pollution produced by the Port of Kaohsiung, the emissions survey used by the United States Environmental Protection Agency was used as a reference to establish an emissions survey specific to the Port of Kaohsiung in order to estimate the quantity of air pollution produced by this port. The emissions in this study covered seven gases, three of which ( C O 2 , C H 4 and N 2 O ) are greenhouse gases; two ( P M 10 , P M 2.5 ) comprise particulate matter, and N O x and S O x , which are deleterious gases. All of these gases pose a serious threat to the environment and to human health.
Additionally, pollution reduction policies in place in the Port of Kaohsiung related to the deceleration of vessels, the conversion of fuel, and the use of onshore power were also taken into consideration. This study also included an assessment of the impact of policies relating to fuel conversion in trucks and the electrification of cranes. In addition, this study also estimated the external cost of overall emissions caused by the Port of Kaohsiung in order to quantify the negative impacts of these gases on society and on the environment.
Two air pollution reduction policies were studied. The first study was Taiwan’s INDC (Intended Nationally Determined Contribution) policy, proposed by Taiwan in 2015, which aimed at reducing the emissions of greenhouse gases in 2030 by 20% compared to 2005 [23]. The second was Taiwan’s GGRMA (Greenhouse Gas Reduction and Management Act), which was drawn up by Taiwan in 2015. This policy aimed to reduce the emissions of greenhouse gases in 2050 by 50% compared to 2005 [24]. These two policy regulations did not establish a detailed process for the shipping sector, which is the focus of this study. Previous related studies focused on the relationship between the air pollution produced by a port and the issues of health and living quality of the residents living in the areas surrounding the port. Only a few studies have applied the IMO regulations to meet the INDC and GGRMA goals for the maritime industry. In addition, previous studies ignored the air pollution that is generated by cranes and truck tractors in a port. This study assesses which of these two policies would be most successful in terms of reducing air pollution in the context of the Port of Kaohsiung, and attempts are made to estimate the effect that each policy would have on external costs.
In this study, the reduction strategies were divided into two stages to discuss the possibility of reducing the air pollution in the Port of Kaohsiung. The polluters include cranes, truck tractors, and vessels. The first stage is before 2030 and the second one is before 2050, the regulations follow INDC and the Greenhouse Gas Reduction and Management Act, respectively. In summary, if we can achieve a thorough implementation, these reduction strategies not only effectively decrease the emissions from equipment, vehicles, and vessels, they also improve the external cost from port of Kaohsiung. Finally, this paper contributes to our government’s policies, which can further improve environmental quality and human health.

2. Materials and Methods

This chapter is divided into three parts. The first part defines the scope of the study and the research objectives. The second part explains the relevant variables and introduces an activity-based model. The final section concludes with a summary of the study findings.

2.1. Data Collection

2.1.1. Vessel’s Data

The characteristics of the various vessel types, including container ships, bulk carriers, tanks, and ferries, used in this study are presented in Table 1. This study also evaluates the emissions generated by cranes and truck tractors in the Port of Kaohsiung. According to information provided by KaoMing Container Terminal Corp., 45 bridge cranes and 150 RTG cranes operate in the port, along with 78 stackers and 360 FUSO-380 truck tractors. The type of truck tractors used in the port are s. Both the trucks and the cranes are powered by diesel fuel.

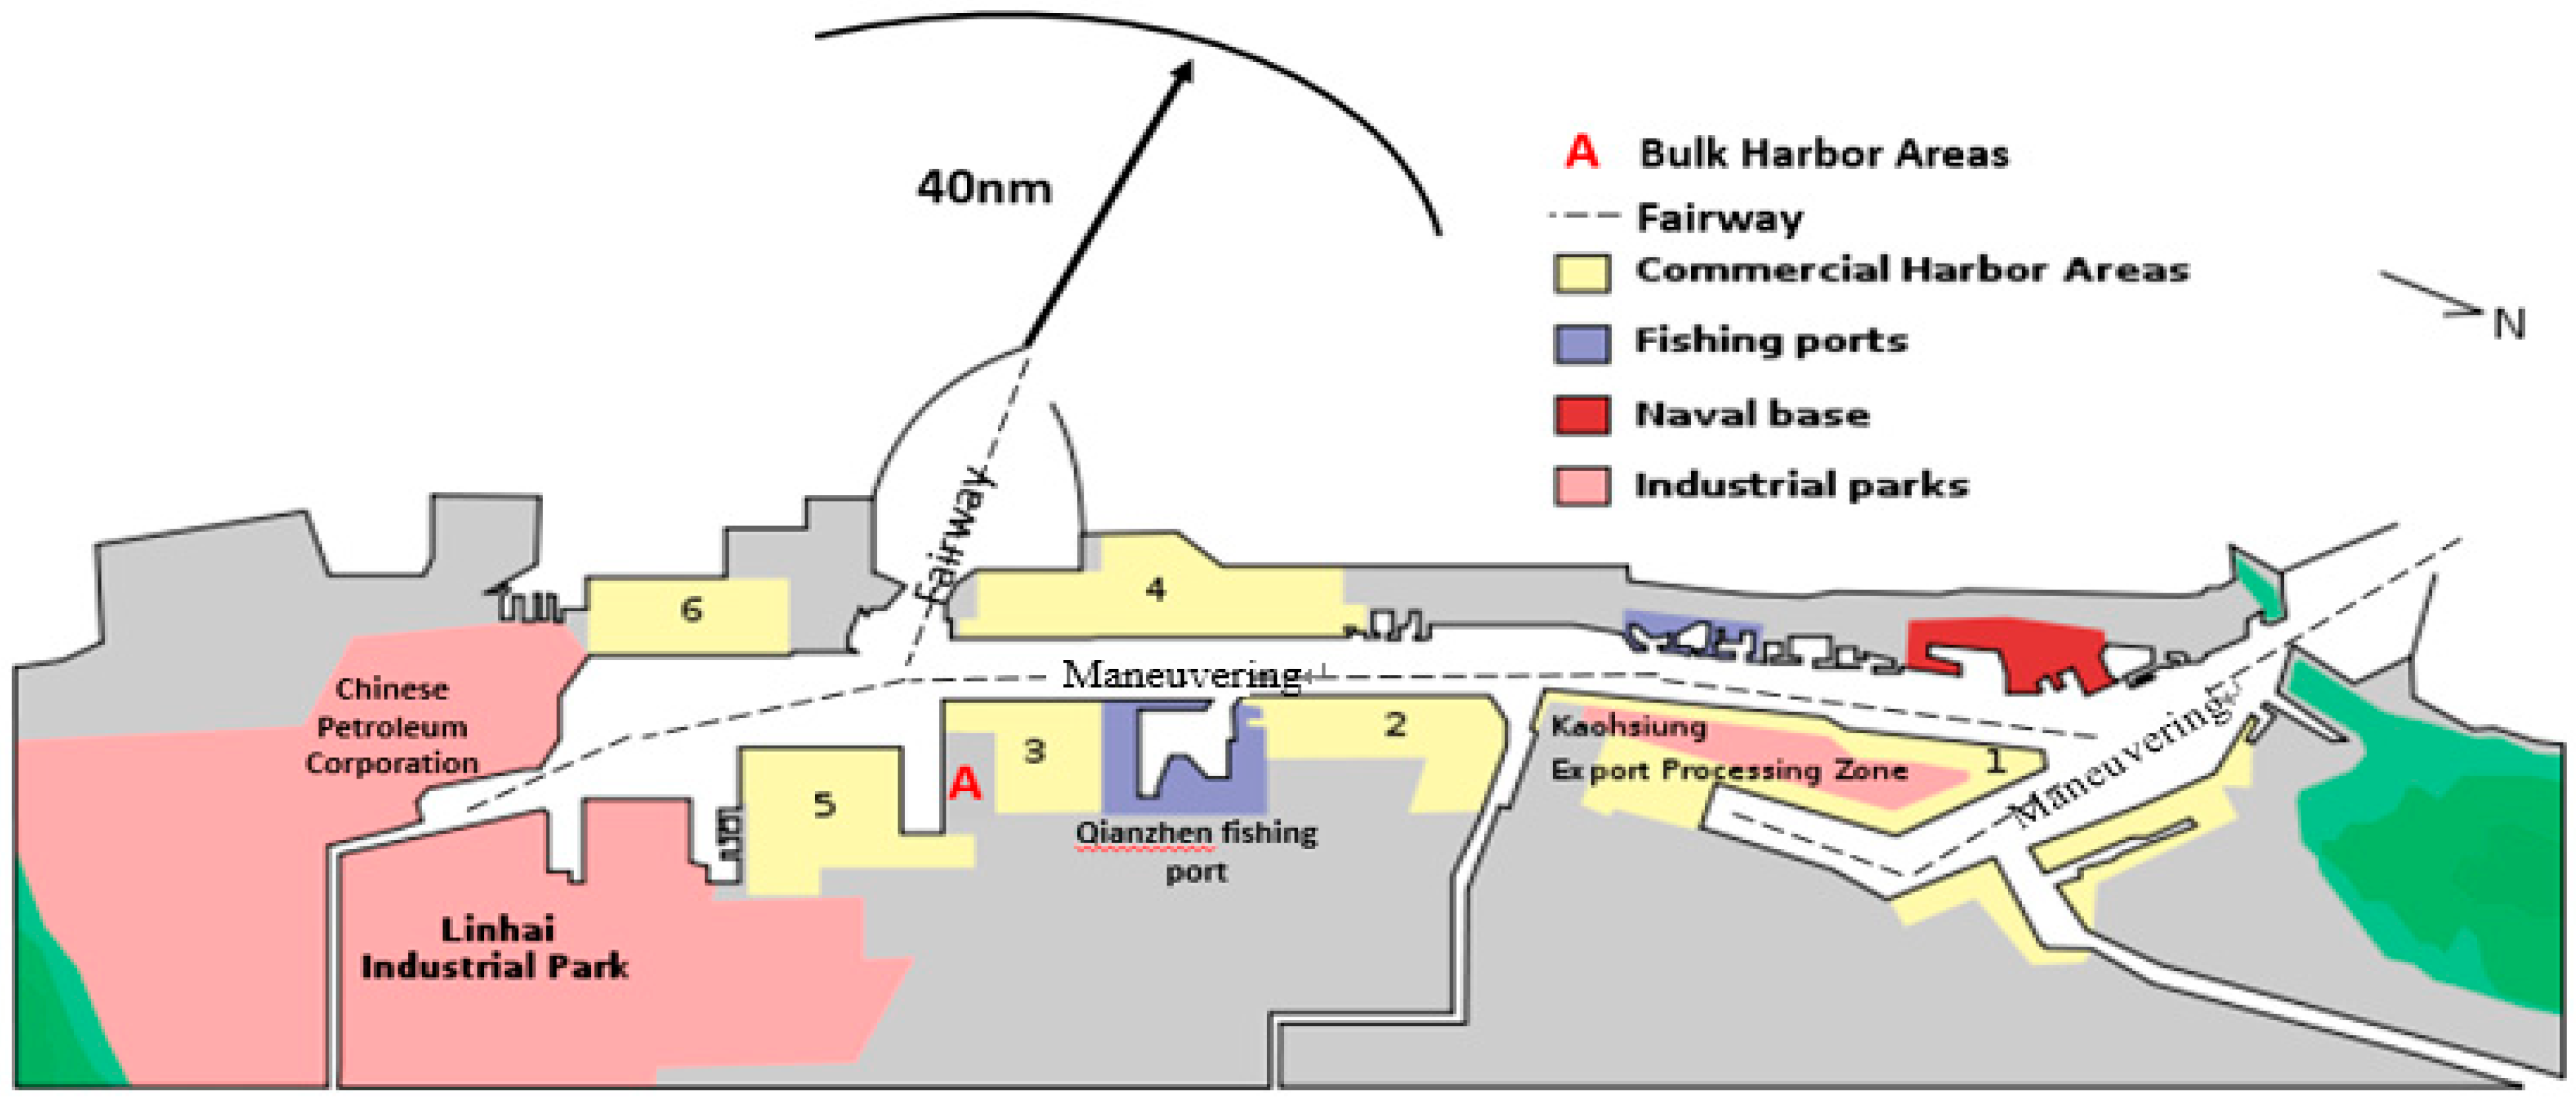
2.1.2. Research Scope

Regulations in the Green Flag Incentive Program [26] require that all vessels must decelerate when they enter the 40-nautical-mile perimeter surrounding the Port of Kaohsiung. Therefore, the scope of the research in this study not only includes the Port of Kaohsiung itself, but also the area that extends 40 nautical miles out of the port, as shown in Figure 1.

2.1.3. Activities

Three main activity areas were included in the study. These are described as the Fairway Area, the Maneuvering Area, and the Berthing Area. The Fairway area includes the area enclosed within a 40-nm perimeter surrounding the Port of Kaohsiung up to the entrance of the waterway. During the period of time when ships are navigating in this area, their main and auxiliary engines are operating, and they are moving at an average speed of about 12 knots/h. The Maneuvering Area encompasses the area between the entrance to the waterway and the terminals. While traversing this area, the ships’ main and auxiliary engines are still operating, but their speed is reduced to an average of 3.5 knots/h. The Berthing Area is the area in which ships maneuver in order to berth at their designated terminal.

2.2. Notation and Models

2.2.1. Notation

The mathematical notations for the parameters, variables, and functions in the activity-based model are shown in Table 2.

2.2.2. Model Formulation

The top-down approach and the bottom-up approach (also known as an activity-based model) are the two main methodologies for evaluating emissions. The top-down approach estimates emissions based on the usage of fuel, and the activity-based model estimates emissions based on the activity of the research target. In general, an activity-based model is usually more accurate than the top-down approach [27,28]. Thus, it is the main methodology used to evaluate emissions [10,15,19,20,29] and is used in this study to evaluate the emissions that were generated by vessels, cranes, and truck tractors in the Port of Kaohsiung. Information and methodologies relevant to this study were taken from documents published by the International Maritime Organization [14], and by the International Transport Forum Transport Outlook [30], the Virginia Offshore Wind Technology Advancement Project [31], POLB [32], the KaoMing Container Terminal Corp., and the Port of Kaohsiung Taiwan International Corporation.

Activity-Based Model for Vessels

The emissions of vessels are expressed as Equations (1) and (2).
E S = ( E i j )
      E i j = % M C R × L F j × T j × EF S × n i = % M C R × ( AS i j MS i ) 3 × D j AS i j × EF S × n i

Activity-Based Model for Truck Tractors

No common method to evaluate the emissions for truck tractors has been developed thus far. Therefore, relevant models in López-Aparicio et al. [15] were referred to as the method by which to estimate the emissions of truck tractors, as shown in Equation (3).
E T = HP T × T T × LF T × EF T × n T

Activity-Based Model for Cranes

At this point in time, no common methods for evaluating the emissions of cranes have been developed. Therefore, relevant models in López-Aparicio et al. [15] were referred to and used to estimate the emissions of cranes, as shown in Equation (4).
      E C H E = HP C H E × LF C H E × T C H E × EF C H E × n C H E

External Cost

According to definitions proposed by Tichavska and Tovar [11], external cost is the cost that occurs as a result of air pollution that threatens human health and the environment. To quantify the negative impact of the air pollution from the Port of Kaohsiung, this study followed the model developed by Tichavska and Tovar [11], as shown in Eq. (5). According to the USEPA [33], VOWTAP [31], and the IPCC [34], the external cost factors related to CO2, CH4, N2O, PM10, PM2.5, NOx, and SOx are 29 $/ton, 812 $/ton, 7461 $/ton, 76,867 $/ton, 85,771 $/ton, 10,687 $/ton, and 12,329 $/ton, respectively.
      E E C = E k × E C F

2.2.3. Forecasting Model

The Grey Theory

The grey theory mainly focuses on the construction of predicted models and the analysis of data associations in situations where there is incomplete and unclear information. This theory also uses changes in original data to predict the future development of the data. The grey theory is increasingly being used in forecasting, for example, for predicting fuel consumption and carbon emissions as well as industrial energy consumption, as demonstrated by Ding et al. [35] and Wang et al. [36], respectively. In the present study, the grey theory is used to predict the number of vessels that are predicted to call on the Port of Kaohsiung in 2030 and 2050. The model is shown as Equations (6)–(9).
Set the time series, X ( 0 ) , have n observations:
X ( 0 ) = { X ( 0 ) ( 1 ) , X ( 0 ) ( 2 ) , , X ( 0 ) ( n ) }
Generate new sequences by accumulating:
X ( 1 ) = { X ( 1 ) ( 1 ) , X ( 1 ) ( 2 ) , , X ( 1 ) ( n ) }
Establish GM (1,1) and differentiate:
d X ( 1 ) d t + a X ( 1 ) = μ
Solve the equation:
X ^ ( 1 ) ( k + 1 ) = [ X ( 0 ) ( 1 ) μ a ] e a k + b a

Mean Absolute Percentage Error (MAPE)

The Mean Absolute Percentage Error (MAPE) is the most widely used model for checking the accuracy of a prediction [37,38,39]. According to Lewis [39], if the value of the MAPE is lower than 10%, this means the prediction is highly accurate. A MAPE value between 10–20% indicates a good prediction, and a MAPE value between 20–50% is considered a reasonable prediction. The model for MAPE is shown as Equation (10).
MAPE = 1 n i = 1 n | r e a l ( i ) e s t i m a t e ( i ) r e a l ( i ) | × 100 %

3. Results

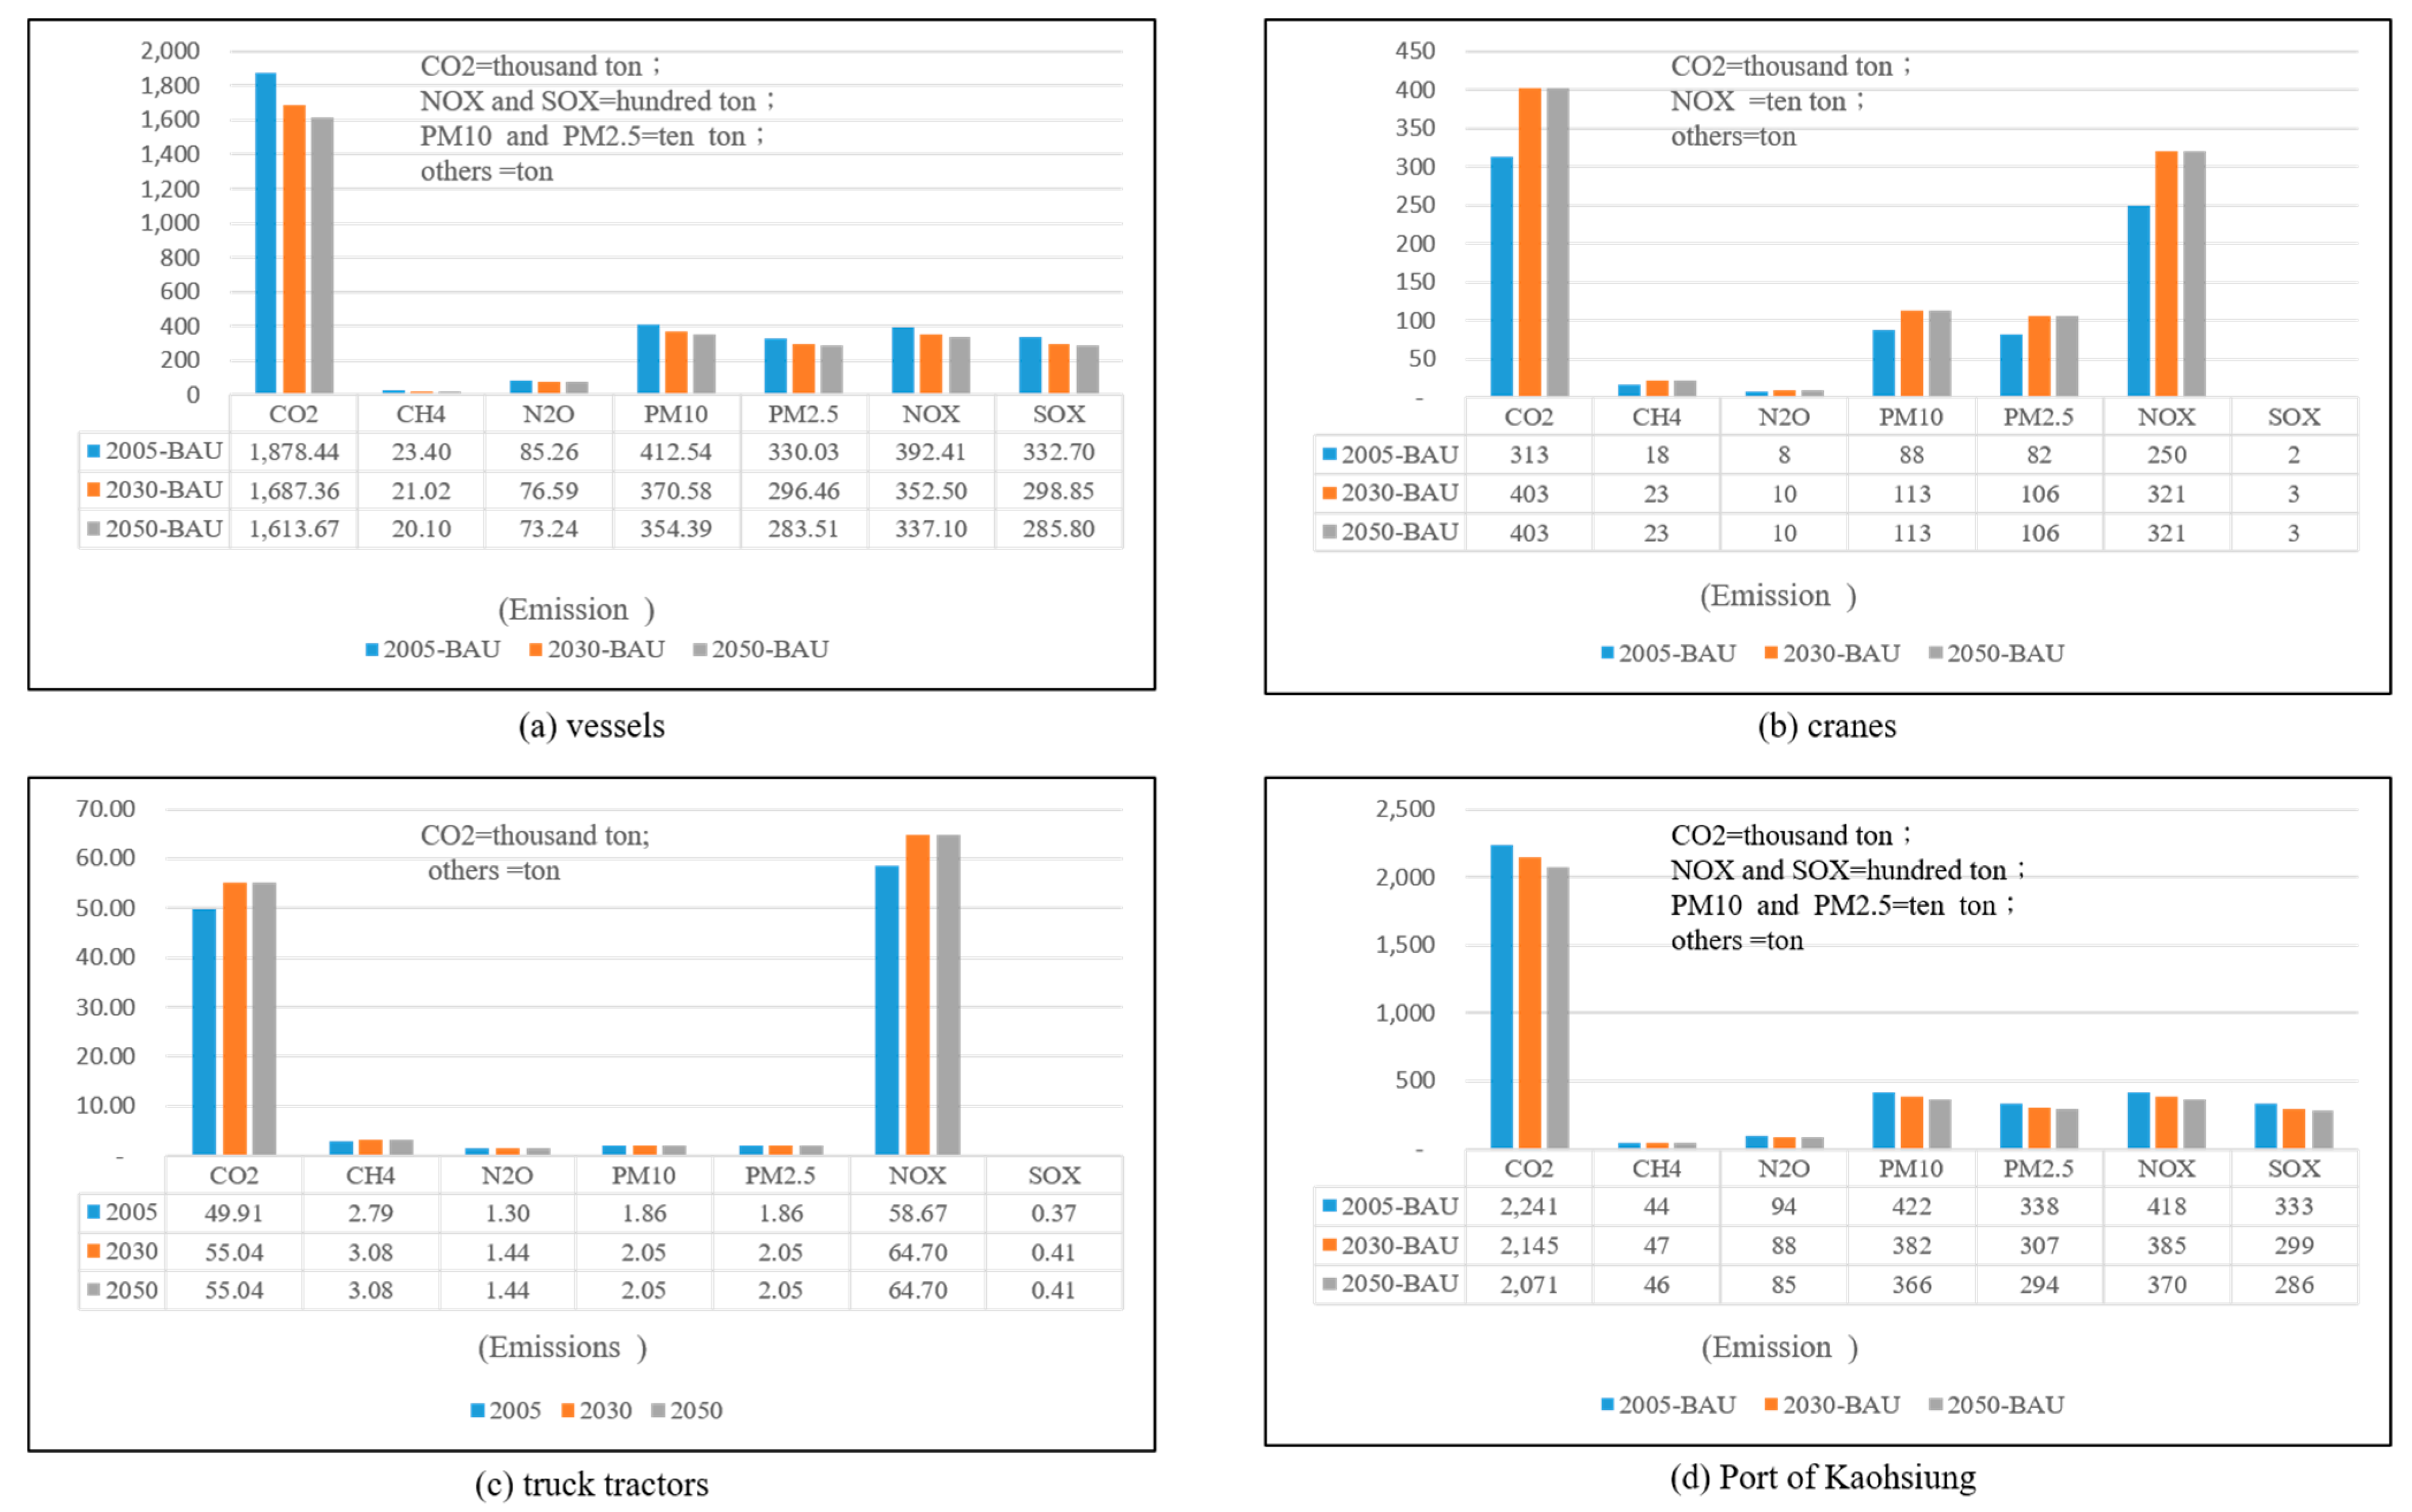
3.1. Emissions in a Business as Usual (BAU) Scenario

3.1.1. Emissions of Vessels

Based on the number of vessels that called on the Port of Kaohsiung from 2006 to 2017, this study used the grey theory to predict the number of vessels that will call on the Port of Kaohsiung in 2030 and 2050. The predicted MAPE value is 0.59%, which implies the prediction is highly accurate.
Figure 2a shows the emissions of the vessels in the BAU scenario. It is evident that the emissions of vessels fall on an annual basis. The main reason for this is that the number of vessels calling on the Port of Kaohsiung has been decreasing since 2005. In addition, applying the automatic identification system (AIS) also helps reduce emission by shortening the waiting time of vessels.

3.1.2. Emissions of Cranes

Based on the data provided by the KaoMing Container Terminal Corp, it was noted that the number of cranes in 2011 in the Port of Kaohsiung was equal to the number of cranes in 2005, so it was assumed that the number of cranes in 2030 would be the same as the number of cranes in 2017. Figure 2b provides the emissions for cranes in the BAU scenario. The emissions of cranes will hit a plateau from 2030 to 2050.

3.1.3. Emissions of Truck Tractors

The emissions of FUSO-380 truck tractors were reviewed in order to evaluate the pollution produced by FUSO-380 truck tractors when they travel the distance between the bridge cranes and the storage center. Figure 2c shows the emissions of Kaohsiung’s truck tractors in a BAU scenario.

3.1.4. Emissions of the Port of Kaohsiung

Figure 2d shows the emissions of the Port of Kaohsiung in a BAU scenario. Vessels were the largest contributors of emissions in the port, and the growth in emissions due to cranes and truck tractors was not enough to change the total decline in emissions. Although the emissions of the port decrease yearly in the BAU scenario, they still cannot reach the reduction goals targeted by the INDC and GGRMA regulations, as shown in Figure 3. Therefore, a two-stage reduction policy is proposed to help the Port of Kaohsiung reach these goals.

3.2. Emission Reduction Policies in the First Stage

The goal of the first stage of Taiwan’s emission reduction policy for the Port of Kaohsiung is to reduce emissions in 2030 to 20% of what they were in 2005. In this first stage, three strategies in the BAU scenario are proposed. First, all vessels must decelerate to 12 knots/h after entering the 40 nm boundary outside the port and use onshore power while they are moored in their terminals. Second, all the bridge cranes should be electrified. Lastly, all the truck tractors would be converted from using diesel fuel to using liquid natural gas (LNG).

3.2.1. Emissions of Vessels

Figure 4a shows the percentage of change in vessel emissions after the reduction policies in the first stage are applied. This figure shows that all the gases in vessel emissions can be reduced by 25–79% when compared to the emissions produced in 2005. The reduction effects on C O 2 , P M 10 , P M 2.5 , N O x , and S O x were more than 50%. The reason for this decrease was that the proposed reduction policies, for example, using onshore power and lower vessel speeds for vessels will significantly decrease C O 2 , particulate matter, and harmful gases generated by the vessels berthing in Kaohsiung Harbor. These results are in line with Tzannatos [8], Cariou [40], Winnes et al. [41], Sciberras et al. [16], and Chang and Jhang [17].

3.2.2. Crane Emissions

The reduction policy for cranes in the first stage was to convert all the diesel bridge cranes in the port into electrified bridge cranes. Figure 4b shows that most of the gases in the emissions of the cranes were reduced by 29–87% compared to the emissions in 2005. However, the reduction effect on C O 2 was not substantial. There are two reasons for this. Firstly, the fact that the electrification of port cranes does not reduce C O 2 emissions as much as other gasses. Studies by the Port of Savannah and Colombo International Container Terminals demonstrated that the electrification of bridge cranes reduced particulate matter emissions by 88% of and fuel consumption by 90% when compared to bridge cranes that used diesel fuel. This could be attributed to the fact that diesel vehicles produce more particulate matter than electric options [42]. However, for C O 2 , the reduction was only 29%. In addition, the number of diesel bridge cranes in Kaohsiung is estimated to increase during the first stage, so the emissions will grow. For these reasons, the level of projected reductions in C O 2 emissions was not significant.

3.2.3. Truck Tractor Emissions

The reduction policy proposed for truck tractors in the first stage was fuel conversion from diesel fuel to LNG. Figure 4c shows that using LNG instead of diesel fuel could reduce the emissions of C O 2 , C H 4 , and N 2 O , by 26%, 64%, and 81%, respectively, when compared to 2005. However, the emissions of other gases were not reduced significantly.

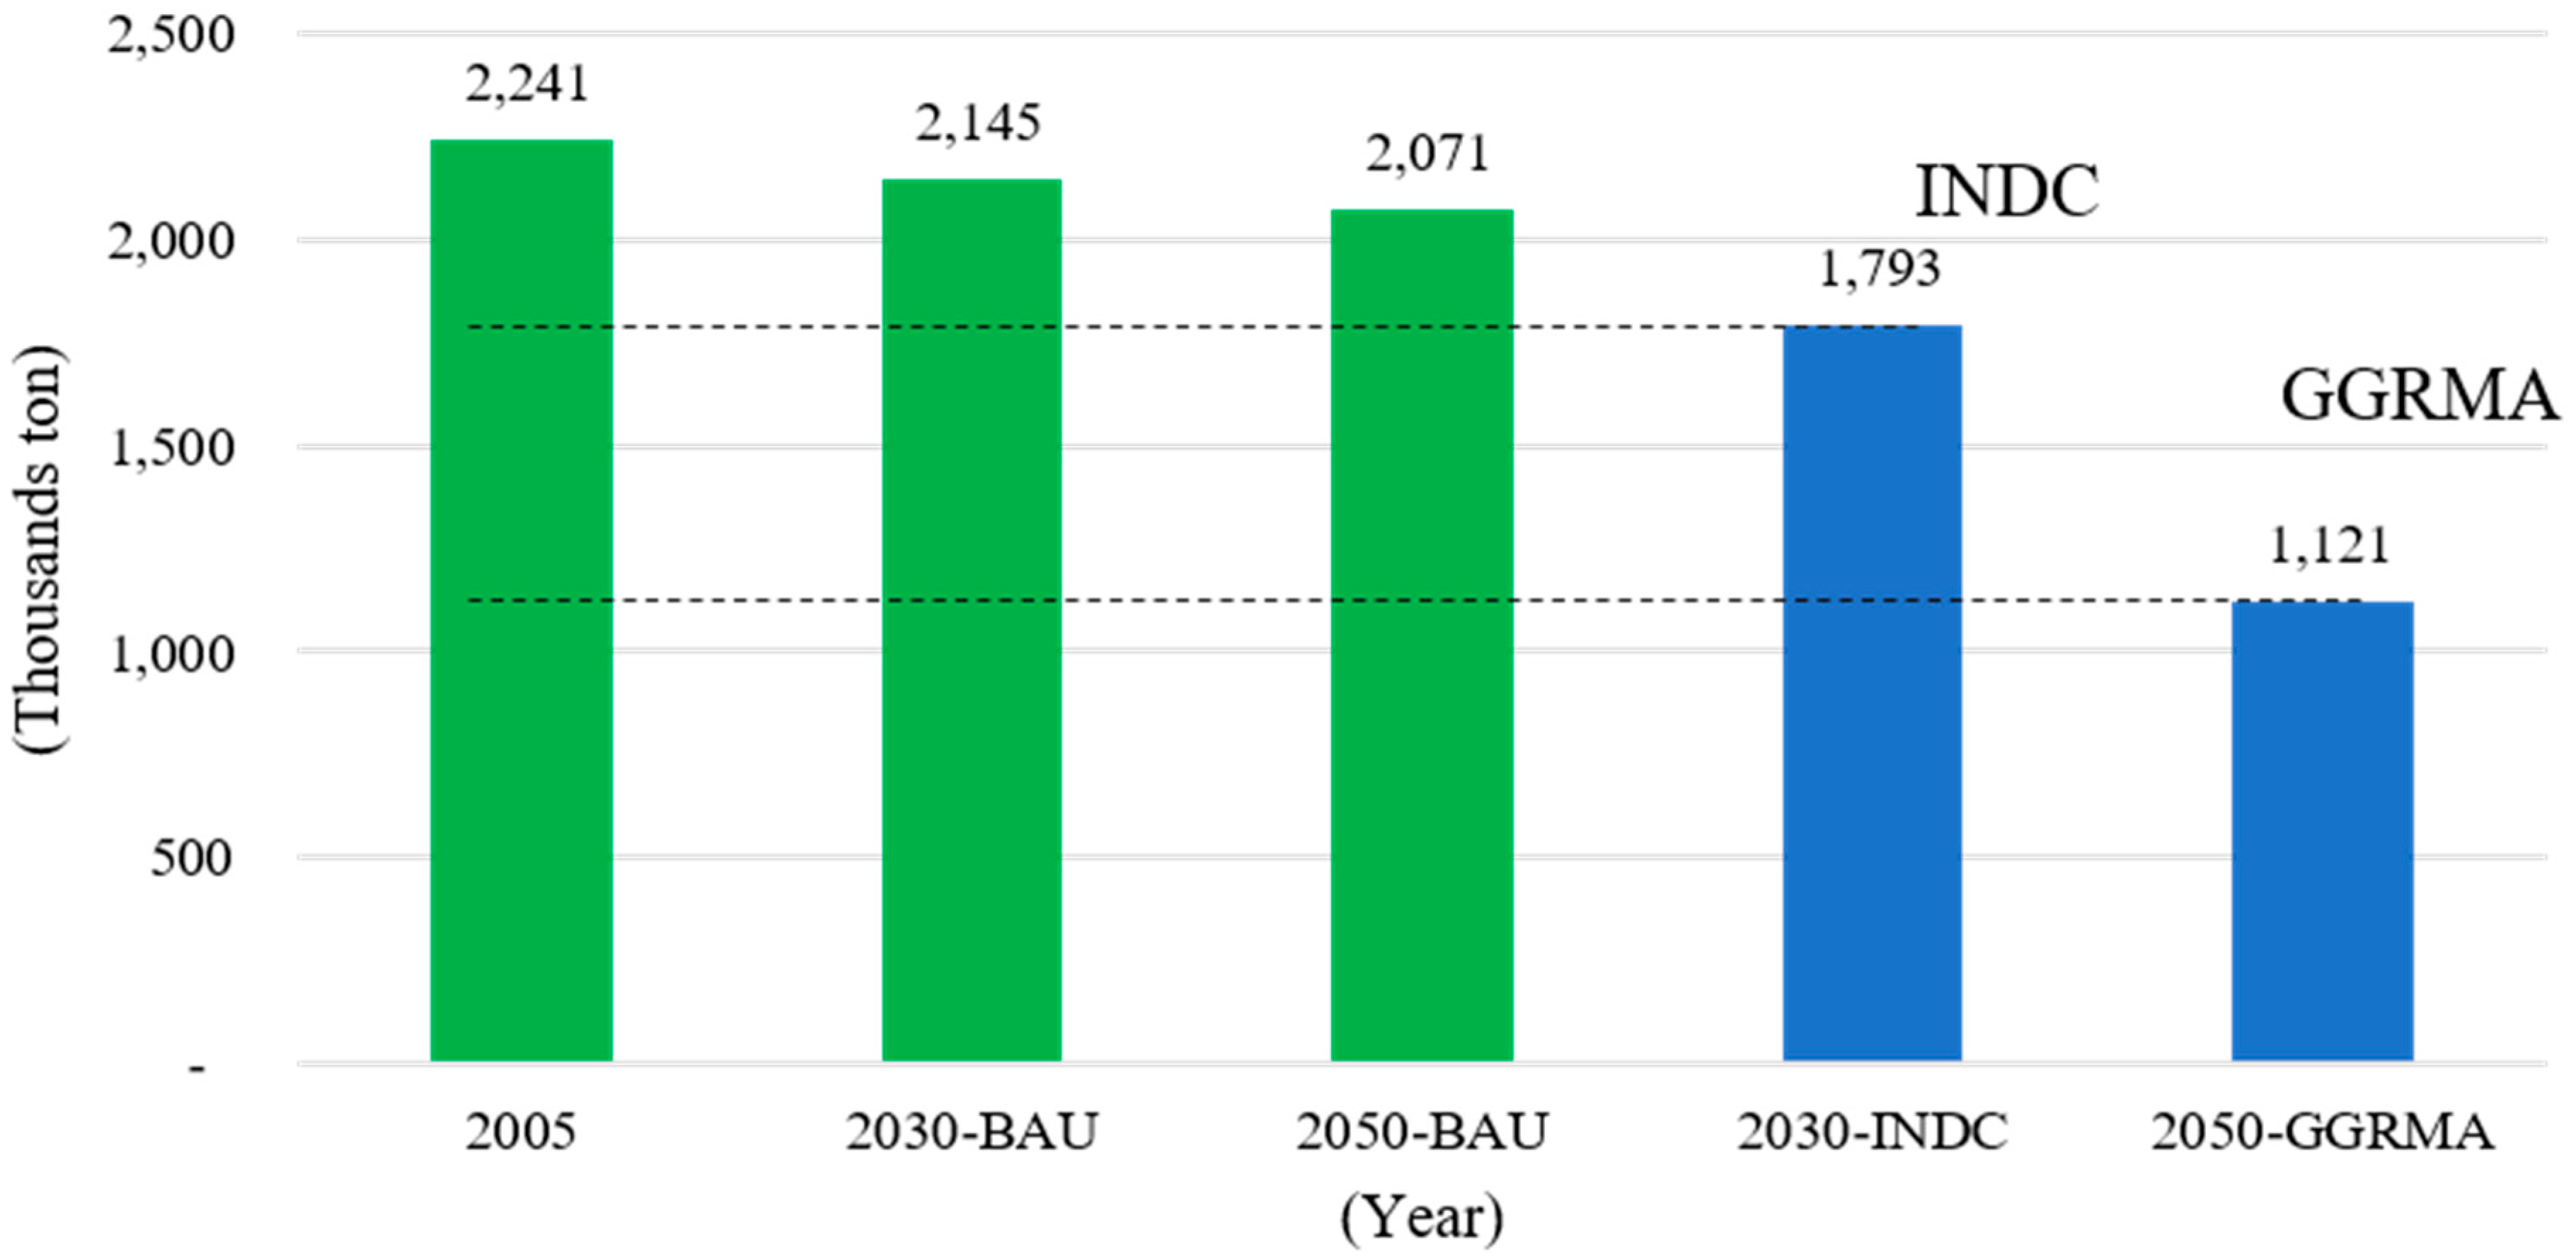
3.2.4. Emissions in the Port of Kaohsiung

Figure 4d shows that all the gases in the emissions inventory can be reduced by more than 30% compared to the emissions produced in 2005. This means that carrying out these reduction policies will help the Port of Kaohsiung reach the governments’ reduction goals in the first stage.

3.3. Emissions Due to Reduction Policies in the Second Stage

The goal of the reduction policies in the second stage is that the emissions produced in 2050 should be reduced to 50% of the emissions in 2005. This would be accomplished by using three strategies: first, it is assumed that all the vessels will be using LNG as fuel after 2030. Second, all diesel RTG cranes will be converted to use lithium-ion batteries as their power after 2030. Last, all the truck tractors will be converted from LNG to battery-electric power after 2030.

3.3.1. Vessel Emissions

Figure 5a shows that the emissions of the vessels drop more than 50% after the reduction policies are carried out. C O 2 , C H 4 , and N 2 O show a significant degree of reduction among all the gases because the conversion to LNG fuel reduces these gases effectively, which is in line with Winnes et al. [41] and Sciberras et al. [16].

3.3.2. Crane Emissions

Figure 5b shows that the emissions of C O 2 would decline significantly in the second stage because the employment of lithium-ion batteries reduced about 60% of the C O 2 produced by the RTG cranes, which is in line with Ovrum and Bergh [43].

3.3.3. Truck Tractor Emissions

Figure 5c indicates that all gases in the inventory would be reduced significantly after a conversion to battery-electric truck tractors. The reason for this is that battery-electric trucks use electricity for their power rather than fuel, so they do not produce much air pollution while operating, which is in line with Sen et al. [44].
The emissions for the Port of Kaohsiung are shown in Figure 5d, which shows that all the gases in the inventory could be reduced by more than 53% compared to the emissions produced in 2005. Among the gases,   C O 2 , C H 4 , and N 2 O show significant reductions in the second stage due to reduction policies aimed at converting diesel fuel to battery-electric power and LNG fuel. These clean sources of power generate less air pollution than diesel fuel, so the air quality in the port will be improved.

3.4. Emissions Effects on External Cost

Tichavska and Tovar [11] define external cost as the damage caused by air pollution to human health and to the environment. Table 3 shows the external cost of the air pollution produced by the Port of Kaohsiung. The external cost would drop in a BAU scenario because the predicted number of the vessels that will call on the Port of Kaohsiung is projected to decline. Although the external cost of air pollution decreases on an annual basis, reduction levels still remain above the standards set by the INDC and GGRMA. Nevertheless, the situation could be greatly improved if the reduction policies proposed in the two stages analyzed in this study were to be carried out. If the reduction policies in the first stage are implemented, the external costs of port emissions would be reduced by USD 11.1 billion, a drop of about 73%, compared to the port’s external costs in 2005. Furthermore, the implementation of the reduction policies in the second stage would reduce the external costs of the port by USD 11.6 billion, a drop of 76%, compared to 2005. This shows that the reduction policies analyzed in this study could reduce external costs produced by air pollution significantly and effectively help the port to reduce economic losses.

3.5. An Analysis of the Effect of Each Reduction Policy

Vessel speed reductions, offering onshore power system (OPS), vessel fuel conversion, bridge crane electrification, lithium-ion battery RTG, LNG truck tractors, and battery-electric truck tractors comprise the seven reduction policies studied in this work. As shown in Table 4, OPS could help vessels reduce their emission of   C O 2 , P M 10 , P M 2.5 , N O x , and S O x . Implementing fuel conversion on vessels could reduce the emissions of C O 2 , C H 4 , and N 2 O significantly. Additionally, the eletrification of bridge cranes was determined to be the best policy for reducing the emissions from cranes, and using battery-electric truck tractors was the best policy for decreasing the emissions from truck tractors.

3.6. Summary

An activity-based model estimates emission based on the activity of the research target. In general, it is typically more accurate than the top-down approach [27,28], and is the main methodology used to evaluate emissions [10,15,19,20,29]. In addition, the grey theory mainly focuses on the construction of predicted models and on analyses of data associations in situations where there is incomplete and unclear information. The grey theory is increasingly being used in forecasting, for example, predicting the fuel consumption and carbon emissions as well as industrial energy consumption, as demonstrated by Ding et al. [35] and Wang et al. [36], respectively. In essence, the activity-based model and the grey theory proposed in this paper offer an opportunity to accurately evaluate emissions and predict the number of the vessels being used in maritime transport.

4. Discussion

In this study, the proposed reduction policies were divided into two stages to analyze several possible ways to reduce the air pollution produced by the Port of Kaohsiung. There were seven reduction policies included in the first stage and the second stage in order to help the Port of Kaohsiung to achieve the reduction goals that were set by Taiwan’s INDC policy and the Greenhouse Gas Reduction and Management Act, respectively. We discuss these in the following.
(1).
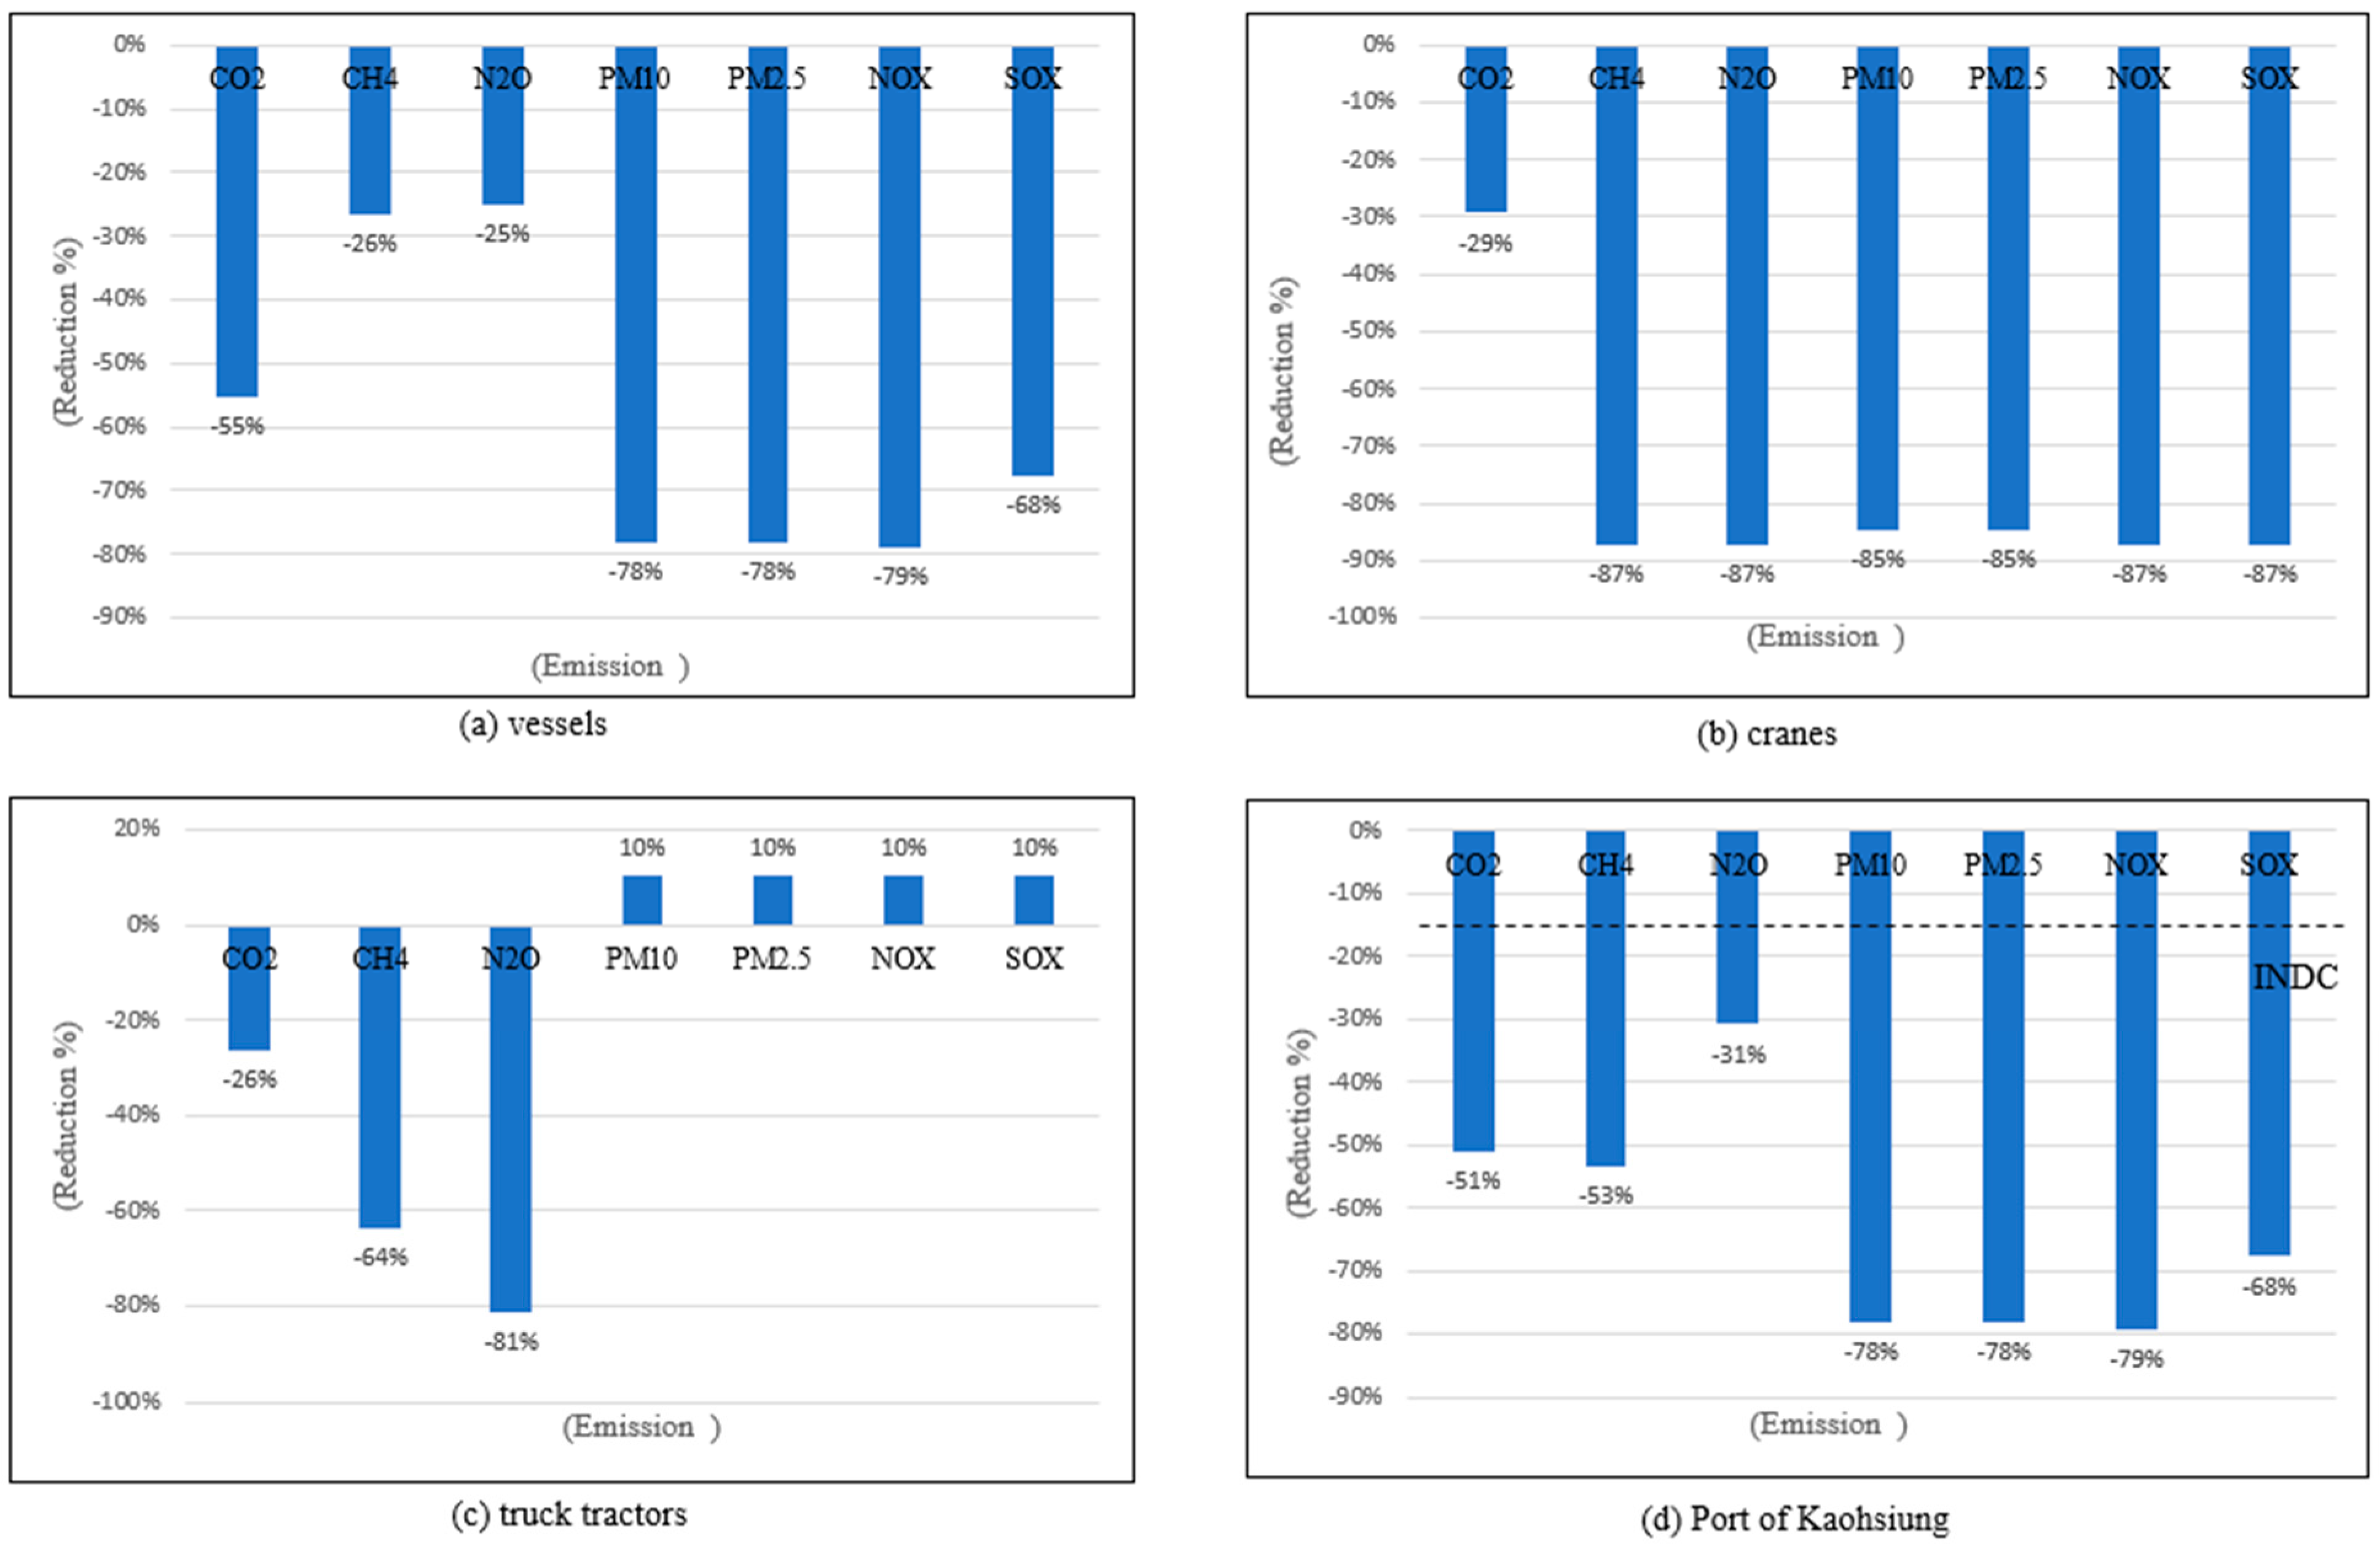
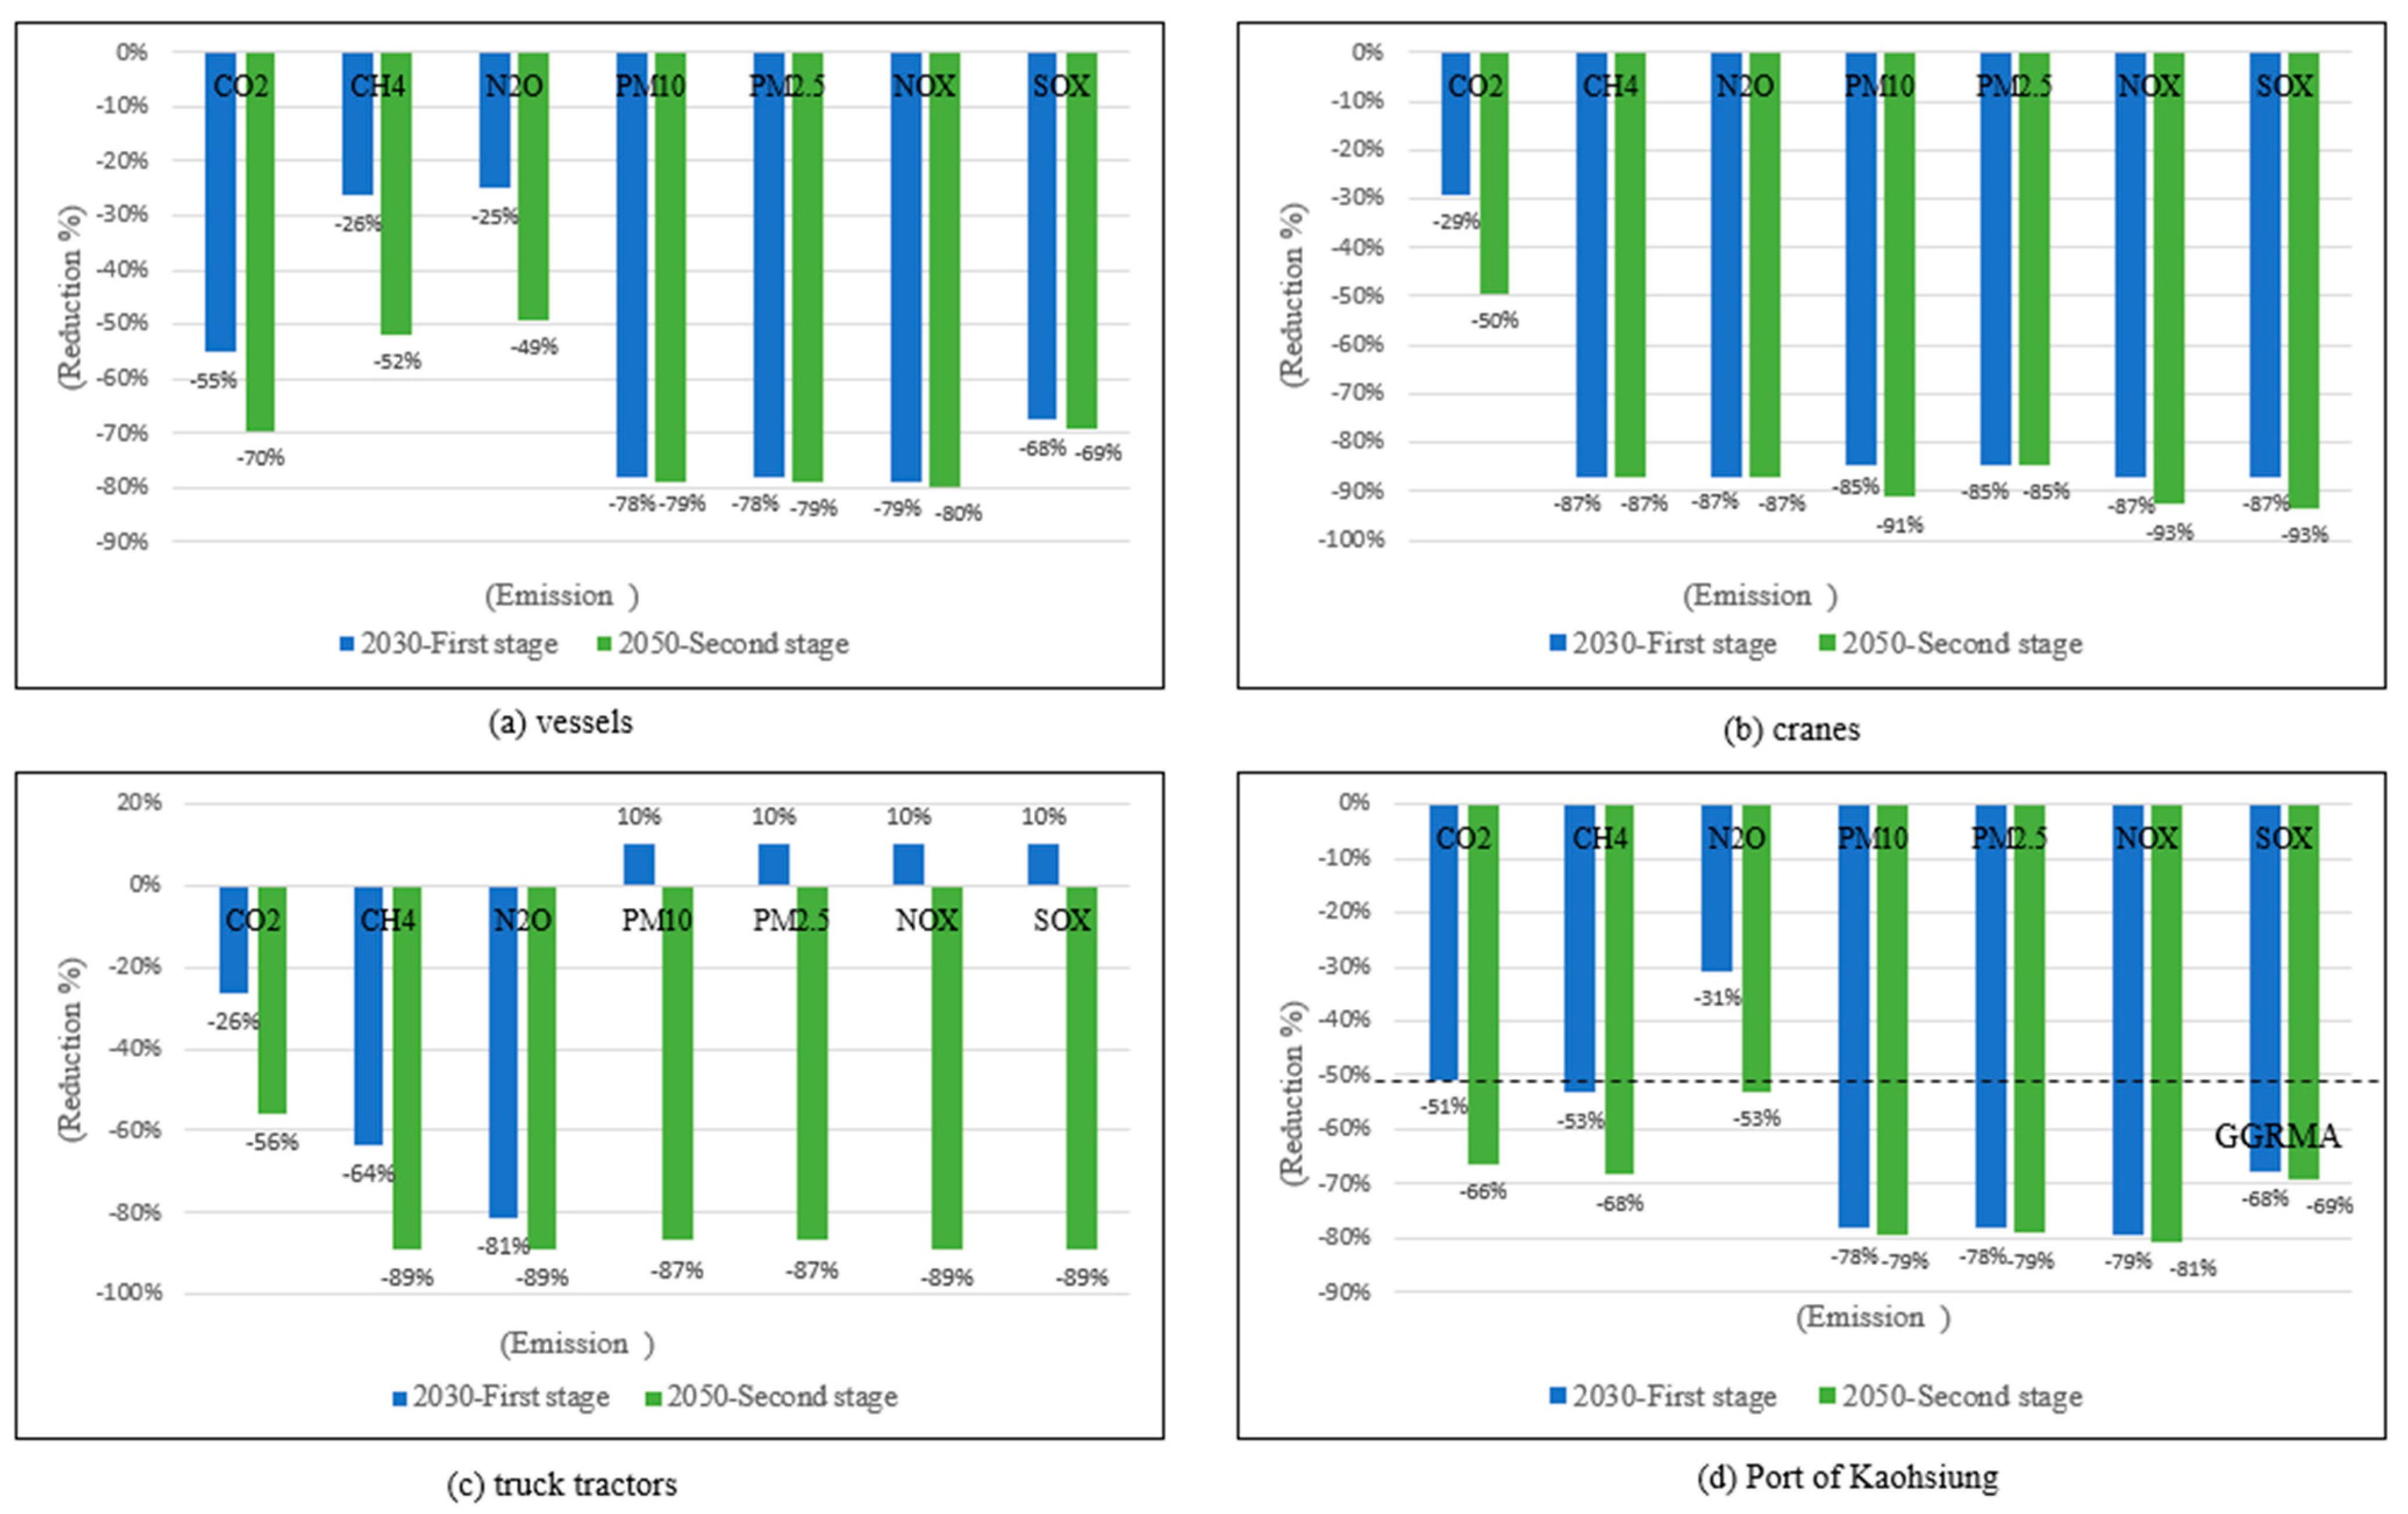
In the first stage, the reduction polices included requiring the deceleration of all vessels entering the Port of Kaohsiung, requiring vessels to use onshore power while in dock, converting all the truck tractors from diesel to LNG fuel, and electrifying all the bridge cranes in the port. The results show that CO2, CH4, N2O, PM10, PM2.5, NOx, and SOx could be reduced by 46%, 26%, 25%, 77%, 77%, 76%, and 68%, respectively.
(2).
In the second stage, the analyzed polices included the conversion of all the vessels from the use of heavy oil to LNG fuel, the conversion of all the LNG truck tractors to lithium-ion battery power, and the conversion of all the RTG cranes in the port to lithium-ion power. The results indicated that CO2, CH4, N2O, PM10, PM2.5, NOx, and SOx could be reduced by 57%, 59%, 53%, 79%, 79%, 80%, and 69%, respectively.
(3).
The analysis conducted in this study showed that these measures could reduce the external cost of air pollution in the Port of Kaohsiung by USD 1.1 billion in 2030 and USD 1.16 billion in 2050, respectively, when compared to Kaohsiung’s external costs in 2005.
(4).
An analysis of all the studied policies showed that OPS is the best way to reduce CO2, particulate matter, and harmful gases emitted by vessels berthing in the port. OPS could reduce CO2, PM10, PM2.5, NOx, and SOx by 40%, 71%, 71%, 72%, and 57%, respectively. On the other hand, requiring fuel conversion was the best policy for decreasing the greenhouse gases produced by vessels while navigating in the fairway. This policy could reduce CO2, CH4 and N2O by 32%, 35%, and 32%, respectively. Furthermore, carrying out the electrification of bridge cranes could reduce their emission inventory (CO2, CH4, N2O, PM10, PM2.5, NOx, and SOx) significantly, producing reductions of 29%, 87%, 87%, 85%, 85%, 87%, and 87%, respectively. Using battery-electric trucks was projected to decrease the emissions of truck tractors by 40%, 70%, 41%, 88%, 88%, 90%, and 90%, respectively.

5. Conclusions

In this study, the use of the following pollution reduction policies in the Port of Kaohsiung were concluded: (1) for vessels: deceleration policies, the conversion of fuel, and the use of onshore power into consideration; (2) for cranes: the electrification of cranes; and (3) for truck tractors: fuel conversion. The results shows that the emissions of C O 2 , C H 4 , N 2 O , P M 10 , P M 2.5 , N O x , and S O x could be reduced by 46%, 26%, 25%, 77%, 77%, 76%, and 68%, respectively, in the first stage (in 2030, the INDC), and by 57%, 59%, 53%, 79%, 79%, 80%, and 69%, respectively, in the second stage (in 2050, the GGRMA).
The recommended reduction policies are as follows: (1) in the case of vessels, the use of liquid natural gas is the best way to reduce GHGs when they are navigating in water [16,36]; (2) for bridge cranes, electrification is the better policy during operation [43,44,45]; (3) for truck tractors, the generation of battery-electric power is the best way to reduce their emissions [5]. Although the alternative energy of LNG is better to use on vessels; however, Sharafian, Blomerus, and Mérida [46] stated that LNG could not be shown to reduce GHG emissions in all cases, such as the medium-speed low-pressure dual-fuel (MS-LPDF) and lean burn spark ignition (LBSI) gas engines which currently used in smaller vessels (such as ferries), cannot reliably reduce GHG emissions. Finally, Iris and Lam [47] pointed out using alternative energy not only improving external cost, but significantly saving total cost. These policy proposals for improving air quality can be applied to all ports in Taiwan.
In summary, this study proposed a comprehensive plan to reduce the air pollution in the Port of Kaohsiung and proved that these policies are able to reach the goals specified in Taiwan’s INDC and GGRMA regulations. In general, this study not only provided evidence to support policies that are capable of reducing air pollution in the Port of Kaohsiung, but also provided evidence to support policies that could serve as a valuable reference in efforts to reduce air pollution in all world ports.

Author Contributions

Y.-A.T.: conceptualization, methodology, and writing—original draft preparation. C.-C.C.: formal analysis, writing—review and editing, and supervision. All authors have read and agreed to the published version of the manuscript.

Funding

This study was financially supported by the Ministry of Science and Technology, Taiwan, for providing partial funding to support this study under contract number MOST 110-2410-H-006-104.

Institutional Review Board Statement

Not applicable for this study.

Informed Consent Statement

Not applicable for this study.

Data Availability Statement

Data underlying the results presented in this paper are not publicly available at this time due to being part of ongoing work, but may be obtained from the authors later upon reasonable request.

Acknowledgments

The authors would like to express their gratitude to Po-Chien Huang for helping with reorganizing figures from the Department of Transportation and Communication Management Science, National Cheng Kung University, Taiwan.

Conflicts of Interest

The authors declare no conflict of interest.

References

  1. ICCT. Greenhouse Gas Emissions from Global Shipping, 2013–2015. 2017. Available online: https://www.theicct.org/publications/GHG-emissions-global-shipping-2013–2015 (accessed on 30 October 2018).
  2. IEA. CO2 Emissions from Fuel Combustion—Highlight. 2017. Available online: https://www.iea.org/publications/freepublications/publication/CO2EmissionsfromFuelCombustionHighlights2017.pdf (accessed on 28 December 2018).
  3. Review of Maritime Transportation. 2018. Available online: https://unctad.org/en/PublicationsLibrary/rmt2018_en.pdf (accessed on 22 October 2019).
  4. Corbett, J.J.; Winebrake, J.J.; Green, H.E.; Kasibhatla, P.; Eyring, V.; Lauer, A. Mortality from Ship Emissions: A Global Assessment. Environ. Sci. Tech. 2007, 41, 8512–8518. [Google Scholar] [CrossRef] [PubMed]
  5. Tian, L.; Ho, K.; Louie PK, K.; Qiu, H.; Pun, V.C.; Kan, H.; Yu, I.T.S.; Wang, T.W. Shipping emissions associated with increased cardiovascular hospitalizations. Atmos. Environ. 2013, 74, 320–325. [Google Scholar] [CrossRef]
  6. Xu, N.; Dang, Y.; Gong, Y. Novel grey prediction model with nonlinear optimized time response method for forecasting of electricity consumption in China. Energy 2017, 118, 473–480. [Google Scholar] [CrossRef]
  7. Mousavi, A.; Sowlat, M.H.; Hasheminassab, S.; Polidori, A.; Shafer, M.M.; Schauer, J.J.; Sioutas, C. Impact of emissions from the Ports of Los Angeles and Long Beach on the oxidative potential of ambient PM0.25 measured across the Los Angeles County. Sci. Total Environ. 2019, 651, 638–647. [Google Scholar] [CrossRef]
  8. Tzannatos, E. Cost assessment of ship emission reduction methods at berth: The case of the Port of Piraeus. Greece. Mari. Pol. Man. 2010, 37, 427–445. [Google Scholar] [CrossRef]
  9. McArthur, D.P.; Osland, L. Ships in a city harbour: An economic valuation of atmospheric emissions. Trans. Res. Part D Transp. Environ. 2013, 21, 47–52. [Google Scholar] [CrossRef]
  10. Song, S. Ship emissions, social cost and eco-efficiency in Shanghai Yangshan port. Atmos. Environ. 2014, 82, 288–297. [Google Scholar] [CrossRef]
  11. Tichavska, M.; Tovar, B. Environmental cost and eco-efficiency from vessel emissions in Las Palmas Port. Trans. Res. Part E Log. Trans. Rev. 2015, 83, 126–140. [Google Scholar] [CrossRef]
  12. Chatzinikolaou, S.D.; Oikonomou, S.D.; Ventikos, N.P. Health externalities of ship air pollution at port—Piraeus port case study. Trans. Res. Part D Trans. Environ. 2015, 40, 155–165. [Google Scholar] [CrossRef]
  13. Maragkogianni, A.; Papaefthimiou, S. Evaluating the social cost of cruise ships air emissions in major ports of Greece. Trans. Res. Part D Transp. Environ. 2015, 36, 10–17. [Google Scholar] [CrossRef]
  14. IMO. Low Carbon Shipping and Air Pollution Control. 2018. Available online: http://www.imo.org/en/MediaCentre/HotTopics/GHG/Pages/default.aspx (accessed on 18 October 2020).
  15. López-Aparicio, S.; Tonnesen, D.; Thanh, T.N.; Neilson, H. Shipping emissions in a Nordic port: Assessment of mitigation strategies. Trans. Res. Part D Transp. Environ. 2017, 53, 205–216. [Google Scholar] [CrossRef]
  16. Sciberras, E.A.; Zahawi, B.; Atkinson, D.J.; Juando, A.; Sarasquete, A. Cold ironing and onshore generation for airborne emission reductions in ports. J. Eng. Mari. Environ. 2016, 230, 67–82. [Google Scholar] [CrossRef] [Green Version]
  17. Chang, C.C.; Jhang, C.W. Reducing speed and fuel transfer of the Green Flag Incentive Program in Kaohsiung Port Taiwan. Trans. Res. Part D Trans. Environ. 2016, 46, 1–10. [Google Scholar] [CrossRef]
  18. Berechman, J.; Tseng, P.H. Estimating the environmental costs of port related emissions: The case of Kaohsiung. Trans. Res. Part D Trans. Environ. 2012, 17, 35–38. [Google Scholar] [CrossRef]
  19. Cullinane, K.; Tseng, P.H.; Wilmsmeie, G. Estimation of container ship emissions at berth in Taiwan. Intern. J. Sust. Trans. 2016, 10, 466–474. [Google Scholar] [CrossRef]
  20. Nunes, R.A.O.; Alvim-Ferraz, M.C.M.; Martins, F.G.; Sousa, S.I.V. The activity-based methodology to assess ship emissions—A review. Environ. Poll. 2017, 231, 87–103. [Google Scholar] [CrossRef]
  21. Alver, F.; AyhanSaraç, B.; Şahin, Ü. Estimating of shipping emissions in the Samsun Port from 2010 to 2015. Atmos. Poll. Res. 2018, 9, 822–828. [Google Scholar] [CrossRef]
  22. World Shipping Council. Top 50 World Container Ports. 2018. Available online: http://www.worldshipping.org/about-the-industry/global-trade/top-50-world-container-ports (accessed on 29 December 2020).
  23. EPA. Environmental Policy Monthly 2017. 2017. Available online: https://www.epa.gov.tw/DisplayFile.aspx?FileID=C6A7FFE5F42F73AB&P=306cd6a2-f843-4704-8888-1367ab0b2911 (accessed on 16 April 2021).
  24. EPA. Greenhouse Gas Reduction and Management Act 2017. 2018. Available online: https://ghgrule.epa.gov.tw/greenhouse_control/greenhouse_control (accessed on 16 April 2021).
  25. Ministry of Transportation and Communications. Marine Traffic. 2018. Available online: https://www.motc.gov.tw/en/ (accessed on 21 June 2019).
  26. POLB. Emissions Full Report 2009. 2009. Available online: http://www.polb.com/civica/filebank/blobdload.asp?BlobID=7390 (accessed on 28 June 2018).
  27. Miola, A.; Ciuffo, B. Estimating air emissions from ships: Meta-analysis of modelling approaches and available data sources. Atmos. Environ. 2011, 45, 2242–2251. [Google Scholar] [CrossRef]
  28. Bouman, E.A.; Lindstad, E.; Rialland, A.I.; Stromman, A.H. State-of-the-art technologies, measures, and potential for reducing GHG emissions from shipping—A review. Trans. Res. Part D Trans. Environ. 2017, 52, 408–421. [Google Scholar] [CrossRef]
  29. Chen, D.; Wang, X.; Nelson, P.; Li, Y.; Zhao, Y.; Lang, J.; Zhou, Y.; Guo, X. Ship emission and its impact on the PM2.5 air pollution in Qingdao Port, North China. Atmos. Environ 2017, 166 (Suppl. C), 351–361. [Google Scholar] [CrossRef]
  30. ITF. ITF Transport Outlook 2015. 2015. Available online: https://www.itf-oecd.org/sites/default/files/docs/14outlook-chapter4.pdf (accessed on 18 November 2018).
  31. VOWTAP. Virginia Offshore Wind Technology Advancement Project. 2014. Available online: https://www.osti.gov/servlets/purl/1341588 (accessed on 21 June 2018).
  32. POLB Press Releases. 2017. Available online: http://www.polb.com/news/archive/2017.asp (accessed on 22 October 2018).
  33. USEPA Annual Report. Virginia Offshore Wind Technology Advancement Power. 2010. Available online: https://www.epa.gov/sites/production/files/2013-12/documents/annual-report-2010.pdf.VOWTAP (accessed on 27 December 2017).
  34. IPCC. Climate Change 2014: Fifth Assessment Report. 2014. Available online: Http://www.ipcc.ch/report/ar5/ (accessed on 20 January 2018).
  35. Ding, S.; Dang, Y.G.; Li, X.M.; Wang, J.J.; Zhao, K. Forecasting Chinese CO2 emissions from fuel combustion using a novel grey multivariable model. J. Clea. Prod. 2017, 162, 1527–1538. [Google Scholar] [CrossRef]
  36. Wang, Z.X.; Hao, P. An improved grey multivariable model for predicting industrial energy consumption in China. App. Math. Model. 2016, 40, 5745–5758. [Google Scholar] [CrossRef]
  37. Kim, S.; Kim, H. A new metric of absolute percentage error for intermittent demand forecasts. Int. J. Forecast. 2016, 32, 669–679. [Google Scholar] [CrossRef]
  38. Nageem, R.; Jayabarathi, R. Predicting the power output of a Grid-Connected solar panel using multi-input support vector regression. Procedia Comput. Sci. 2017, 115, 723–730. [Google Scholar] [CrossRef]
  39. Lewis, E. Control of Body Segment Differentiation in Drosophila by the Bithorax Gene Complex. Prog. Clin. Biol. Res. 1982, 85, 269–288. [Google Scholar] [PubMed]
  40. Cariou, P. Is slow steaming a sustainable means of reducing CO2 emissions from container shipping? Trans. Res. Part D Trans. Environ. 2011, 16, 260–264. [Google Scholar] [CrossRef]
  41. Winnes, H.; Styhre, L.; Fridell, E. Reducing GHG emissions from ships in port areas. Res. Transp. Bus. Manag. 2015, 17, 73–82. [Google Scholar] [CrossRef] [Green Version]
  42. Mani, S.A.; Mani, F.S.; Kumar, A.; Shah, S.; Peltier, R. E Traffic related PM2. 5 air quality: Policy options for developing Pacific Island countries. Trans. Res. Part D Transp. Environ. 2020, 87, 102519. [Google Scholar] [CrossRef]
  43. Ovrum, E.; Bergh, T.F. Modelling lithium-ion battery hybrid ship crane operation. Appl. Energy 2015, 152, 162–172. [Google Scholar] [CrossRef]
  44. Iris, Ç.; Lam, J.S.L. A review of energy efficiency in ports: Operational strategies, technologies and energy management systems. Renew. Sustain. Energy Rev. 2019, 112, 170–182. [Google Scholar] [CrossRef]
  45. Sen, B.; Ercan, T.; Tatari, O. Does a battery-electric truck make a difference?—Life cycle emissions, costs, and externality analysis of alternative fuel-powered Class 8 heavy-duty trucks in the United States. J. Clean. Prod. 2017, 141, 110–121. [Google Scholar] [CrossRef]
  46. Sharafian, A.; Blomerus, P.; Mérida, W. Natural gas as a ship fuel: Assessment of greenhouse gas and air pollutant reduction potential. Energy Policy 2019, 131, 332–346. [Google Scholar] [CrossRef]
  47. Iris, Ç.; Lam, J.S.L. Optimal energy management and operations planning in seaports with smart grid while harnessing renewable energy under uncertainty. Omega 2021, 103, 102445. [Google Scholar] [CrossRef]
Figure 1. Location of the terminals in the Port of Kaohsiung.
Jmse 09 01315 g001
Figure 2. Emissions of vessels, cranes, truck tractors, and the Port of Kaohsiung in the BAU scenario.
Jmse 09 01315 g002
Figure 3. The disparity in port emissions in different scenarios.
Jmse 09 01315 g003
Figure 4. The emissions from vessels, cranes, truck tractors, and the Port of Kaohsiung using reduction policies in the first stage.
Jmse 09 01315 g004
Figure 5. The emissions from vessels, cranes, truck tractors, and the Port of Kaohsiung using reduction policies in the second stage.
Jmse 09 01315 g005
Table 1. The characteristics of the vessel types used in this study.
Vessel TypeContainer ShipBulk CarrierTankerFerry
Vessel nameEver BalmyRoadrunner BulkerBow FulingTai HWA
IMO refer number9,786,944944,4159,504,1908,811,027
Deadweight tonnage (ton)37,56357,80991562296
Design speed (knots/h)17.81413.515
The median tonnage of vessels’ type (ton)20,000–39,99940,000–69,9995000–99991000–4999
Source: Ministry of Transportation and Communications [25].
Table 2. Notations for parameters, variables and functions.
IndexDescriptionUnit
iVessel types, where i = 1~4 (1 = container ships, 2 = bulk ships, 3 = tankers, 4 = ferries)
jActivity mode, where j = 1~3 (1 = fairway, 2 = maneuvering, 3 = berth).
kEmission type, where k = 1~3 (1 = vessels, 2 = truck tractors, 3 = cranes)
VariablesDescriptionUnit
E S Total emission of vesselston
E i j Emission of i vessels in j activity modeton
% M C R Maximum continuous rating of enginekw
AS ij Vessel actual speed of i type in j activity modeknot
MS i Vessel maximum speed in i typeknot
D j Vessel traveling distance in j activity modekm
T j Time in j activity modehour
LF j Engine load factors in j activity mode%
EF S Vessel emission factors(g-kw/h)
n i Number of vessels in i type
E T Truck tractors missionston
HP T Engine horsepower of truck tractorskw
T T Truck tractor traveling timehour
LF T Truck tractor engine load factors%
EF T Truck tractor emission factors(g-kw/h)
n T Number of truck tractors
E C H E Emission of craneston
HP C H E Crane engine horsepowerkw
LF C H E Crane Engine load factors%
T C H E Crane operating timehour
EF C H E Emission factors of crane(g-kw/h)
n C H E Number of cranes
EECExternal emissions cost$USD
ECFEmission cost factors$USD/ton
aDeveloping coefficient
bGrey input
MAPEMean Absolute Percent Error
real t Real number of ship calls into the Port of Kaohsiung in year t.
estimate t Predicted number of ship calls into the Port of Kaohsiung in year t.
Table 3. External cost of emissions in the Port of Kaohsiung.
Emissions (Million USD)CO2CH4N2OPM10PM2.5NOxSOxTotal (Billion USD)
BAU scenario-200565.000.0360.70324.04290.30446.73410.211.53
BAU scenario-203062.210.0380.66293.72263.52411.71368.501.40
BAU scenario-205060.070.0370.63281.28252.42395.26352.411.34
The first stage-203035.020.0260.5375.0367.77109.15132.560.42
The second stage-205024.210.0120.3367.9360.8388.95126.750.37
Table 4. The effect of each reduction policy.
PolicyCO2CH4N2OPM10PM2.5NOxSOx
Vessel speed reduction−16%−18%−16%−16%−16%−16%−16%
OPS−40%0%0%−71%−71%−72%−57%
Vessel fuel conversion to LNG−32%−35%−32%−4%−4%−4%−4%
Bridge cranes electrification−29%−87%−87%−85%−85%−87%−87%
Lithium-ion battery RTG−29%0%0%−43%0%−43%−48%
Truck tractor fuel conversion to LNG−26%−64%−81%10%10%10%10%
Battery-electric truck conversion−40%−70%−41%−88%−88%−90%−90%
Publisher’s Note: MDPI stays neutral with regard to jurisdictional claims in published maps and institutional affiliations.

