Article

Quantitative Relationships between the Tidal Current Limit, Tidal Level Limit and River Discharge in the Changjiang River Estuary

1
Shanghai Branch of Jiangsu Taihu Planning and Design Institute of Water Resources Co., Ltd., Shanghai 200433, China
2
State Key Laboratory of Estuarine and Coastal Research, East China Normal University, Shanghai 200241, China
*
Author to whom correspondence should be addressed.
J. Mar. Sci. Eng. 2021, 9(11), 1291; https://doi.org/10.3390/jmse9111291
Submission received: 24 October 2021 / Revised: 14 November 2021 / Accepted: 17 November 2021 / Published: 19 November 2021

Abstract

:
Estuaries are areas where runoff and tide interact. Tidal waves propagate upstream from river mouths and produce tidal currents and tidal level variations along rivers. Based on the hydrological frequency analysis of river discharge in the dry season and flood season at the Datong hydrological station over the past 70 years, a three-dimensional estuary numerical model was used to produce the quantitative relationships between the tidal current limit, tidal level limit and river discharge in the Changjiang River estuary. The positions of tidal current limit and tidal level limit depend not only on river discharge but also on river topography. When river discharge varies from a hydrological frequency of 95% to 5%, the relationship between the tidal current limit and river discharge is y = 2 × 10 13 x 3 + 3   ×   10 8 x 2   0 . 0074 x + 359 . 35 in the flood season, with a variation range of 90 km, and y = 4 × 10 10 x 3 1   ×   10 5 x 2 0 . 1937 x     1232 . 9 in the dry season, with a variation range of 200 km. The relationship between the tidal level limit and river discharge is y = 6 × 10 8 x 2 0 . 0096 x + 775 . 94 in the flood season, with a variation range of 127 km, and y = 0.3428 x 2 17 . 9 x + 777 . 55 in the dry season, with a variation range of 83 km, which is located far upstream of the Datong hydrological station.

1. Introduction

Estuaries are areas where runoff and tide interact. Tidal waves propagate upstream from river mouths and produce tidal currents and tidal level variations along rivers. The estuarine tidal flood current and tidal level decrease with the increase in river discharge and distance from the river mouth. Beyond a certain position, the variations of flood current and tidal level disappear; these points are called the tidal current limit and tidal level limit, respectively. The concept of tidal level limit originated from the upper limit of an estuary proposed by the former Soviet scholar Samoylov [1]; tidal level limit refers to a section where the water level change influenced by the tidal level disappears. He believed that the location of this section was mainly determined by the tidal volume at the river mouth, river discharge and longitudinal slope of the riverbed. The tidal current limit and tidal level limit are closely related with river hydrodynamics, sediment load and sediment dynamics, etc. [2,3,4,5].
The Changjiang River, also known as the Yangtze River, is one of the largest rivers in the world, emptying 9.32 × 10¹¹ m3 of fresh water annually into the East China Sea. The Changjiang’s estuary has a 90 km wide river mouth and is characterized by multiple bifurcations (Figure 1). River discharge is recorded at the Datong hydrological station, which is located 620 km from the mouth of the Changjiang River. River discharge exhibits pronounced seasonal variations, with the lowest monthly mean value of 11,700 m3 s−1 in January and the highest monthly mean value of 49,900 m3 s−1 in July (Changjiang Water Resources Commission, based on data from 1950 to 2020). The tides in the estuary exhibit semidiurnal, diurnal and fortnightly spring–neap signals and are the most energetic source of water movement in the Changjiang’s estuary [6]. During spring tide, the amplitude of the tidal level near the river mouth is mostly greater than 4.5 m and is approximately twice that during neap tide, which has a typical value of less than 2.2 m. The strong tidal range introduces a tidal current and tidal level in the river. For a long time, the common understanding of the tidal current limit and tidal level limit in the Changjiang’s estuary was that the tidal current limit was roughly located in Jiangyin, while the tidal level limit was located near the Datong hydrological station [7]. By the analysis of historical data, Chen et al. [8] reported that the tidal level limit in the Changjiang River moved down from Jiujiang, Jiangxi Province, in the Jin Dynasty to the current position of Datong, Anhui Province, in the dry season, while the tidal current limit moved down from Yangzhou to the vicinity of Jiangyin in the flood season. Xu and Liu [9] analyzed long-term measured data from hydrological stations in the lower reaches of the Changjiang River and noted that the average position of the tidal level limit was 50 km downstream of Datong station, while the average position of the tidal current limit was located in Jiangyin. However, some researchers noted that the two limits were not fixed locations. Song [10] indicated that the location of the tidal current limit changed significantly with river discharge variation in the flood and dry seasons. Shi et al. [11] further refined the tidal level limit and showed that, when the river discharge at Jiujiang station was only 8440   m 3 / s , the tidal level limit was near Jiujiang station, while, when the river discharge at Jiujiang station reached 66,700   m 3 / s   in the flood season, the tidal level limit was located between Zongyang sluice and Chikou station.
The above studies were based on the analysis of measured water level data [7,8,9,10,11]. Although the studies have strong credibility, their conclusions have certain limitations due to the influence of various factors, such as the number of hydrological stations in the lower reaches of the Changjiang River, the length of the observation sequence of the measured data and the instantaneous changes in river discharge. Additionally, in the analysis process of measured data, these data do not enable us to calculate quantitative relationships among the tidal current limit, tidal level limit and river discharge. To a certain extent, numerical simulations can compensate for the above defects in the analysis of measured data [12,13,14,15,16,17,18]. Shen et al. [12] and Li [13] applied a two-dimensional numerical model to an ideal estuary and explained that the tidal current limit and tidal level limit were not linearly related to river discharge and tidal range. Shen et al. [14] analyzed the changes in tidal current limit and tidal level limit in the flood and dry seasons by a two-dimensional model and concluded that, when river discharge was less than 12,400   m 3 / s , the tidal level limit was located upstream of Anqing. Based on field survey data and by means of a numerical simulation and harmonic analysis, Xu et al. [19] indicated that the tidal level limit was located between Anqing and Nanjing and the tidal current limit was located between Zhenjiang and Jiangxinsha. Lu et al. [20] specified the range of the tidal current limit to be approximately 256 km between 20 km downstream of the Bagua sandbank in Nanjing and 10 km downstream of Xuliujing station and indicated that the influence of river discharge on the tidal level limit was greater than the influence of tides. In the above numerical model studies, the downstream open boundary was mostly specified at Xuliujing based on the time series of tidal levels in a period, which resulted in certain limitations to the conclusions. Furthermore, the lower tidal reaches of the Changjiang River are densely covered with shoals and have bifurcated channels, which makes it difficult to study the tidal current limit and tidal level limit by ideal topography for the Changjiang River.
To date, the quantitative relationships between the tidal current limit, tidal level limit and river discharge of the Changjiang River have not been calculated. Based on the hydrological frequency analysis of river discharge in the dry season (January) and flood season (July) at the Datong hydrological station over the past 70 years, a three-dimensional numerical model of the estuary was used to produce the quantitative relationships between the tidal current limit, tidal level limit and river discharge in the Changjiang River under different guaranteed rates of river discharge in the flood and dry seasons. Analyzing the changes in the tidal current limit and tidal level limit is helpful for clarifying the hydrodynamic process in the tidal reaches of the Changjiang River, thereby providing a scientific basis for the development and utilization of the lower reaches of Changjiang River and the analysis of the dynamic mechanism.
The remainder of the paper is organized as follows. Section 2 describes the numerical model, model validation and numerical experiments. In Section 3, the quantitative relationship between the tidal current limit and the river discharge in the Changjiang River in the flood and dry seasons is analyzed. In Section 4, the quantitative relationship between the tidal level limit and river discharge in the flood and dry seasons is analyzed. Finally, conclusions are presented in Section 4.

2. Methods

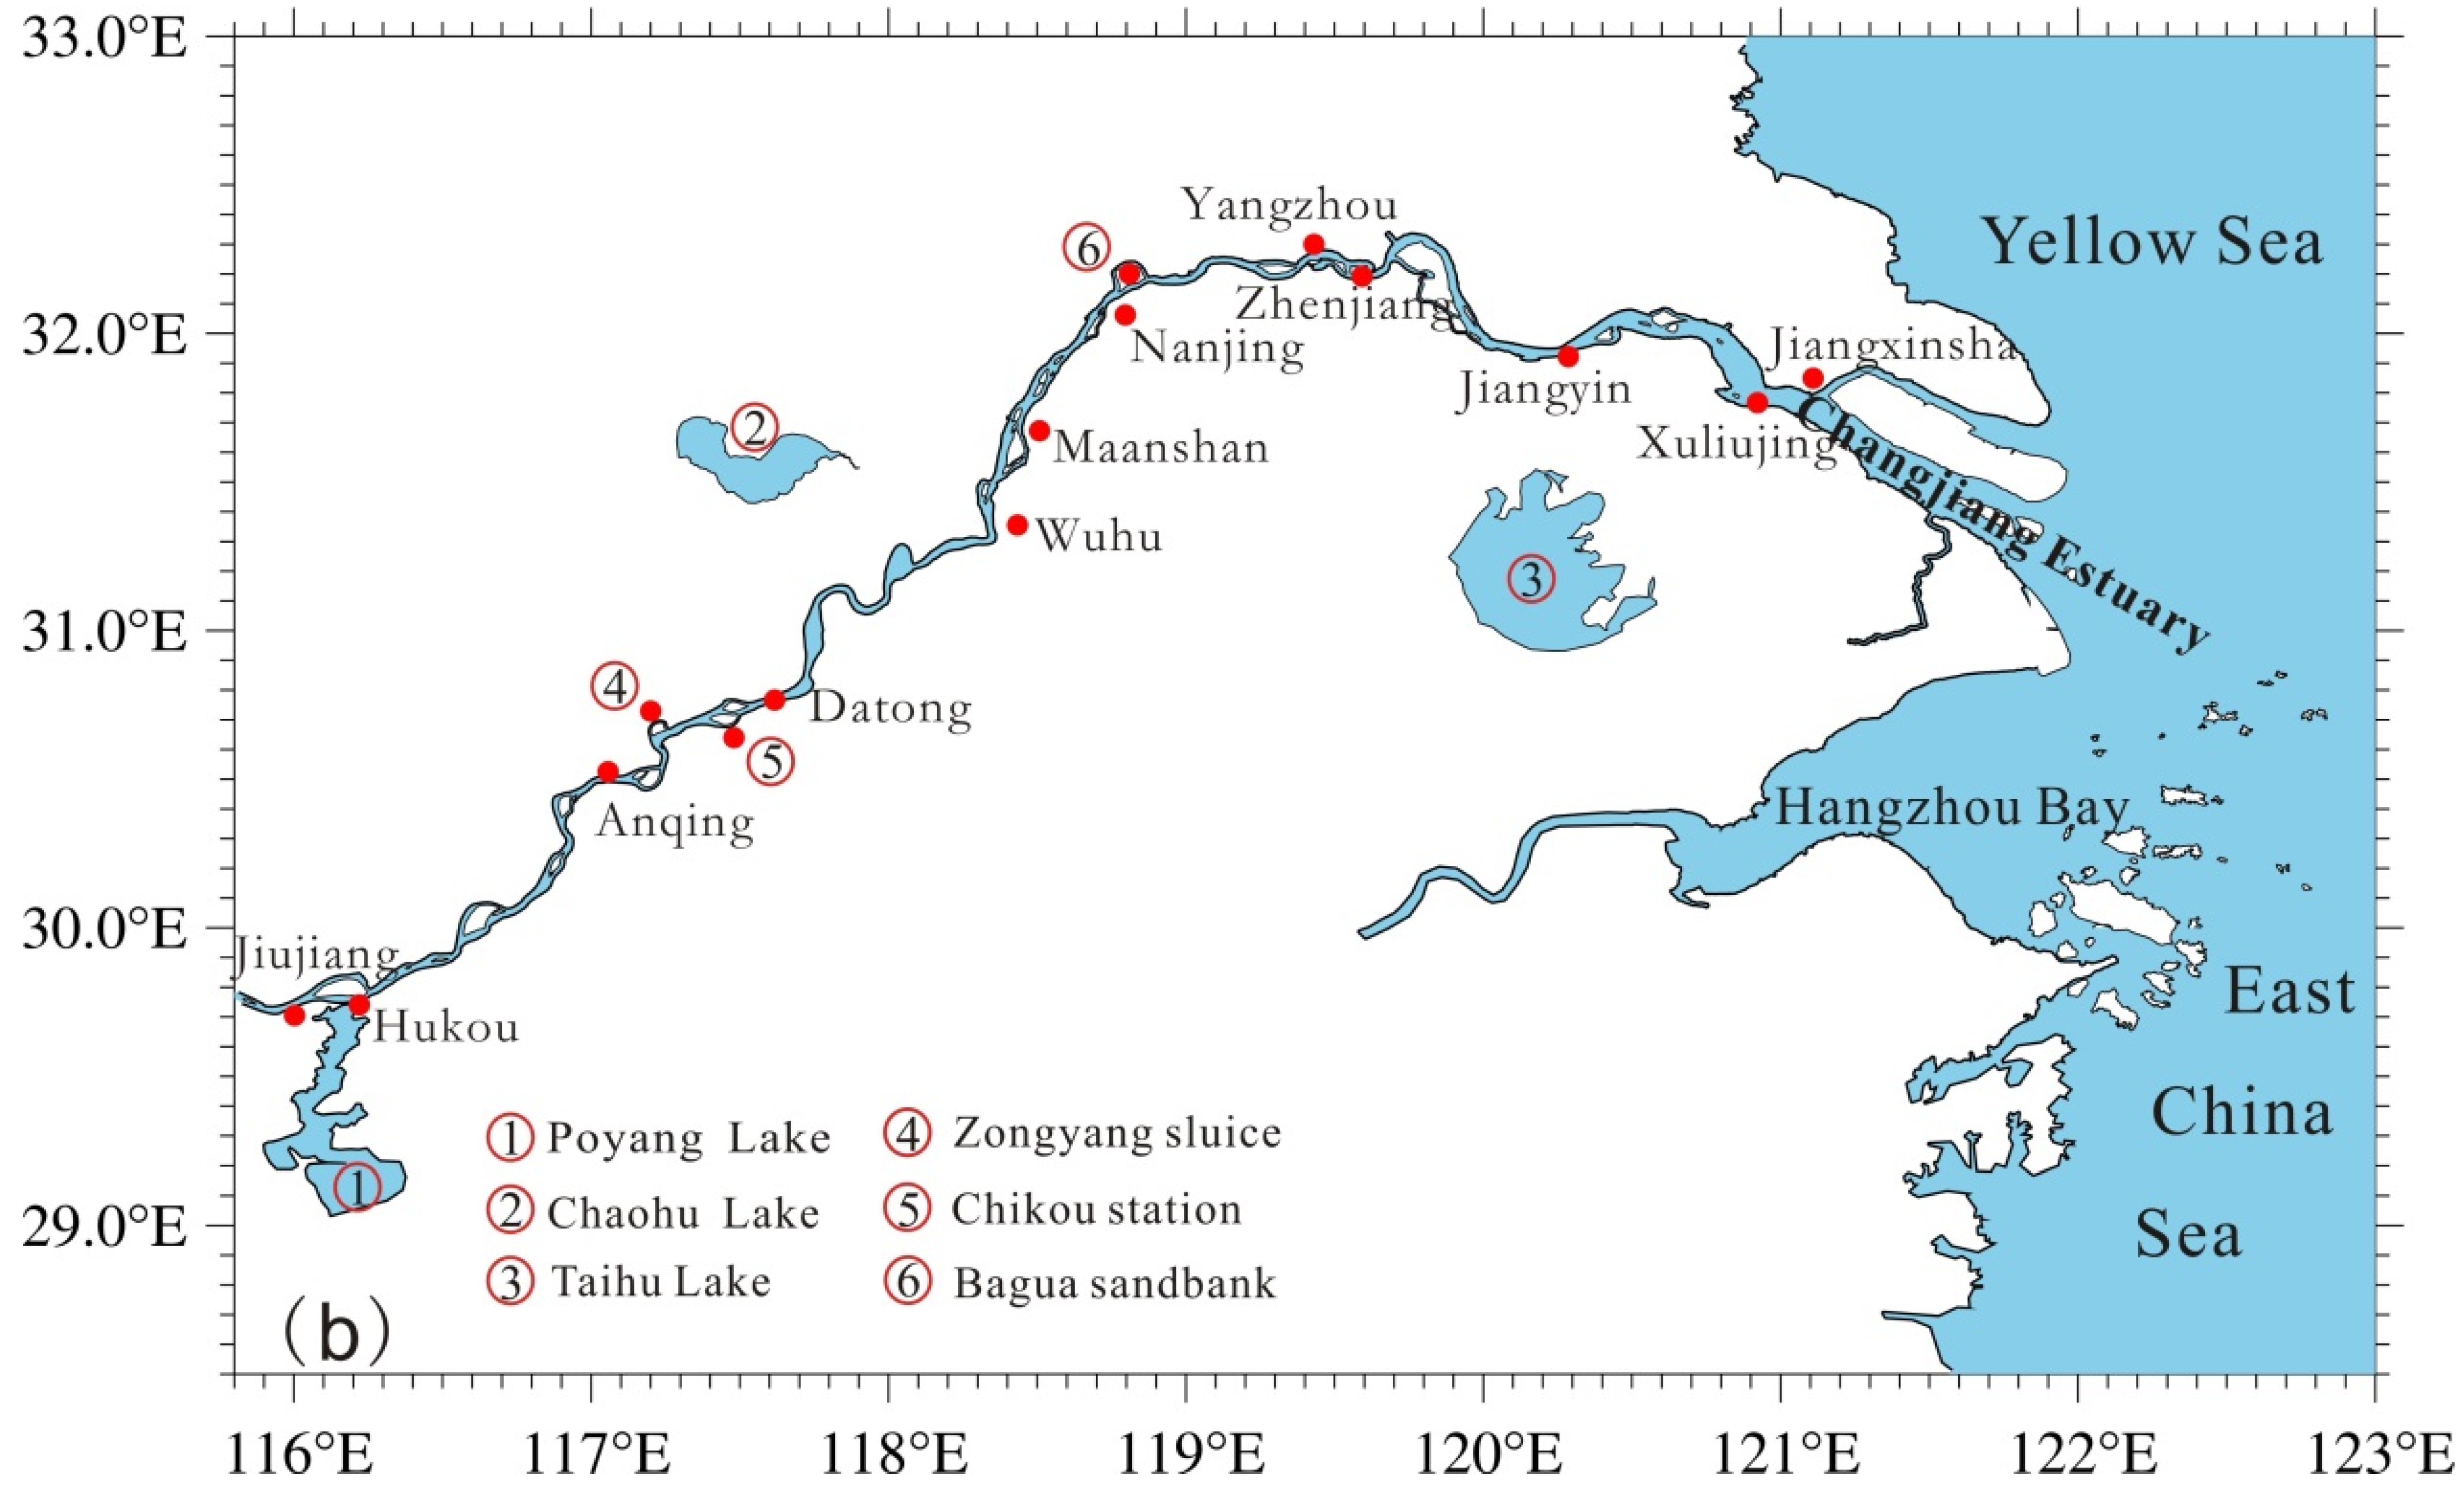
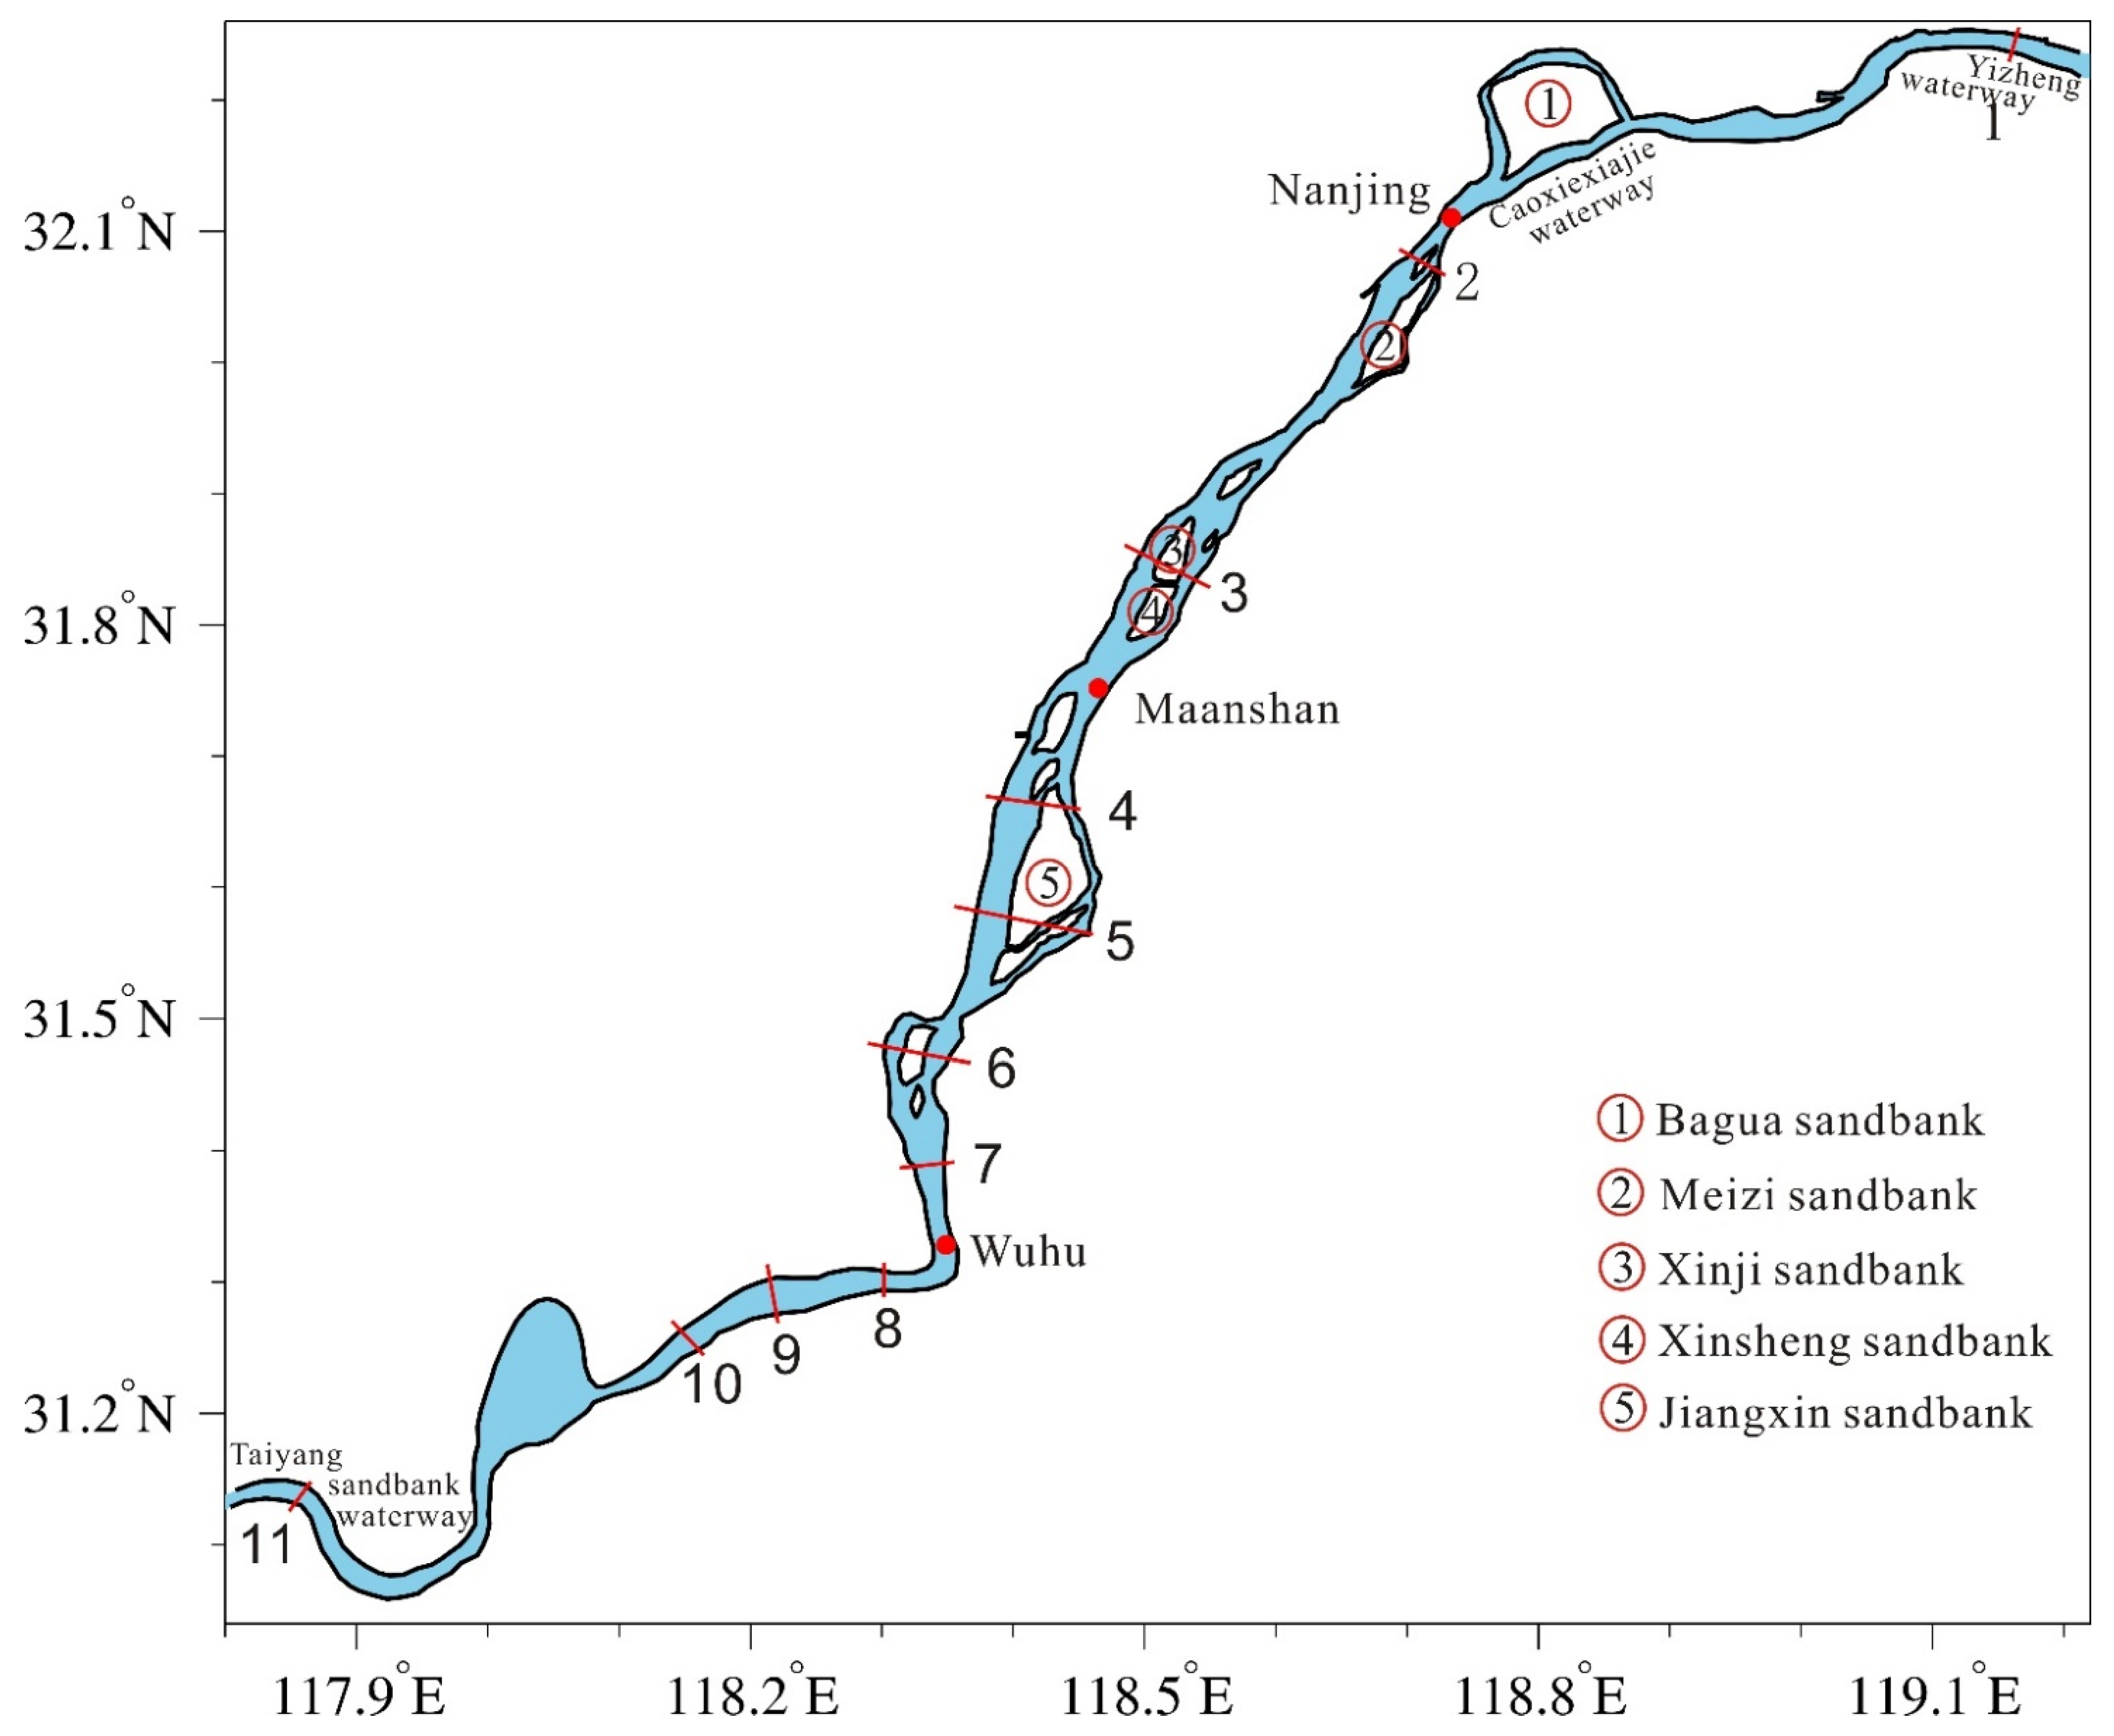
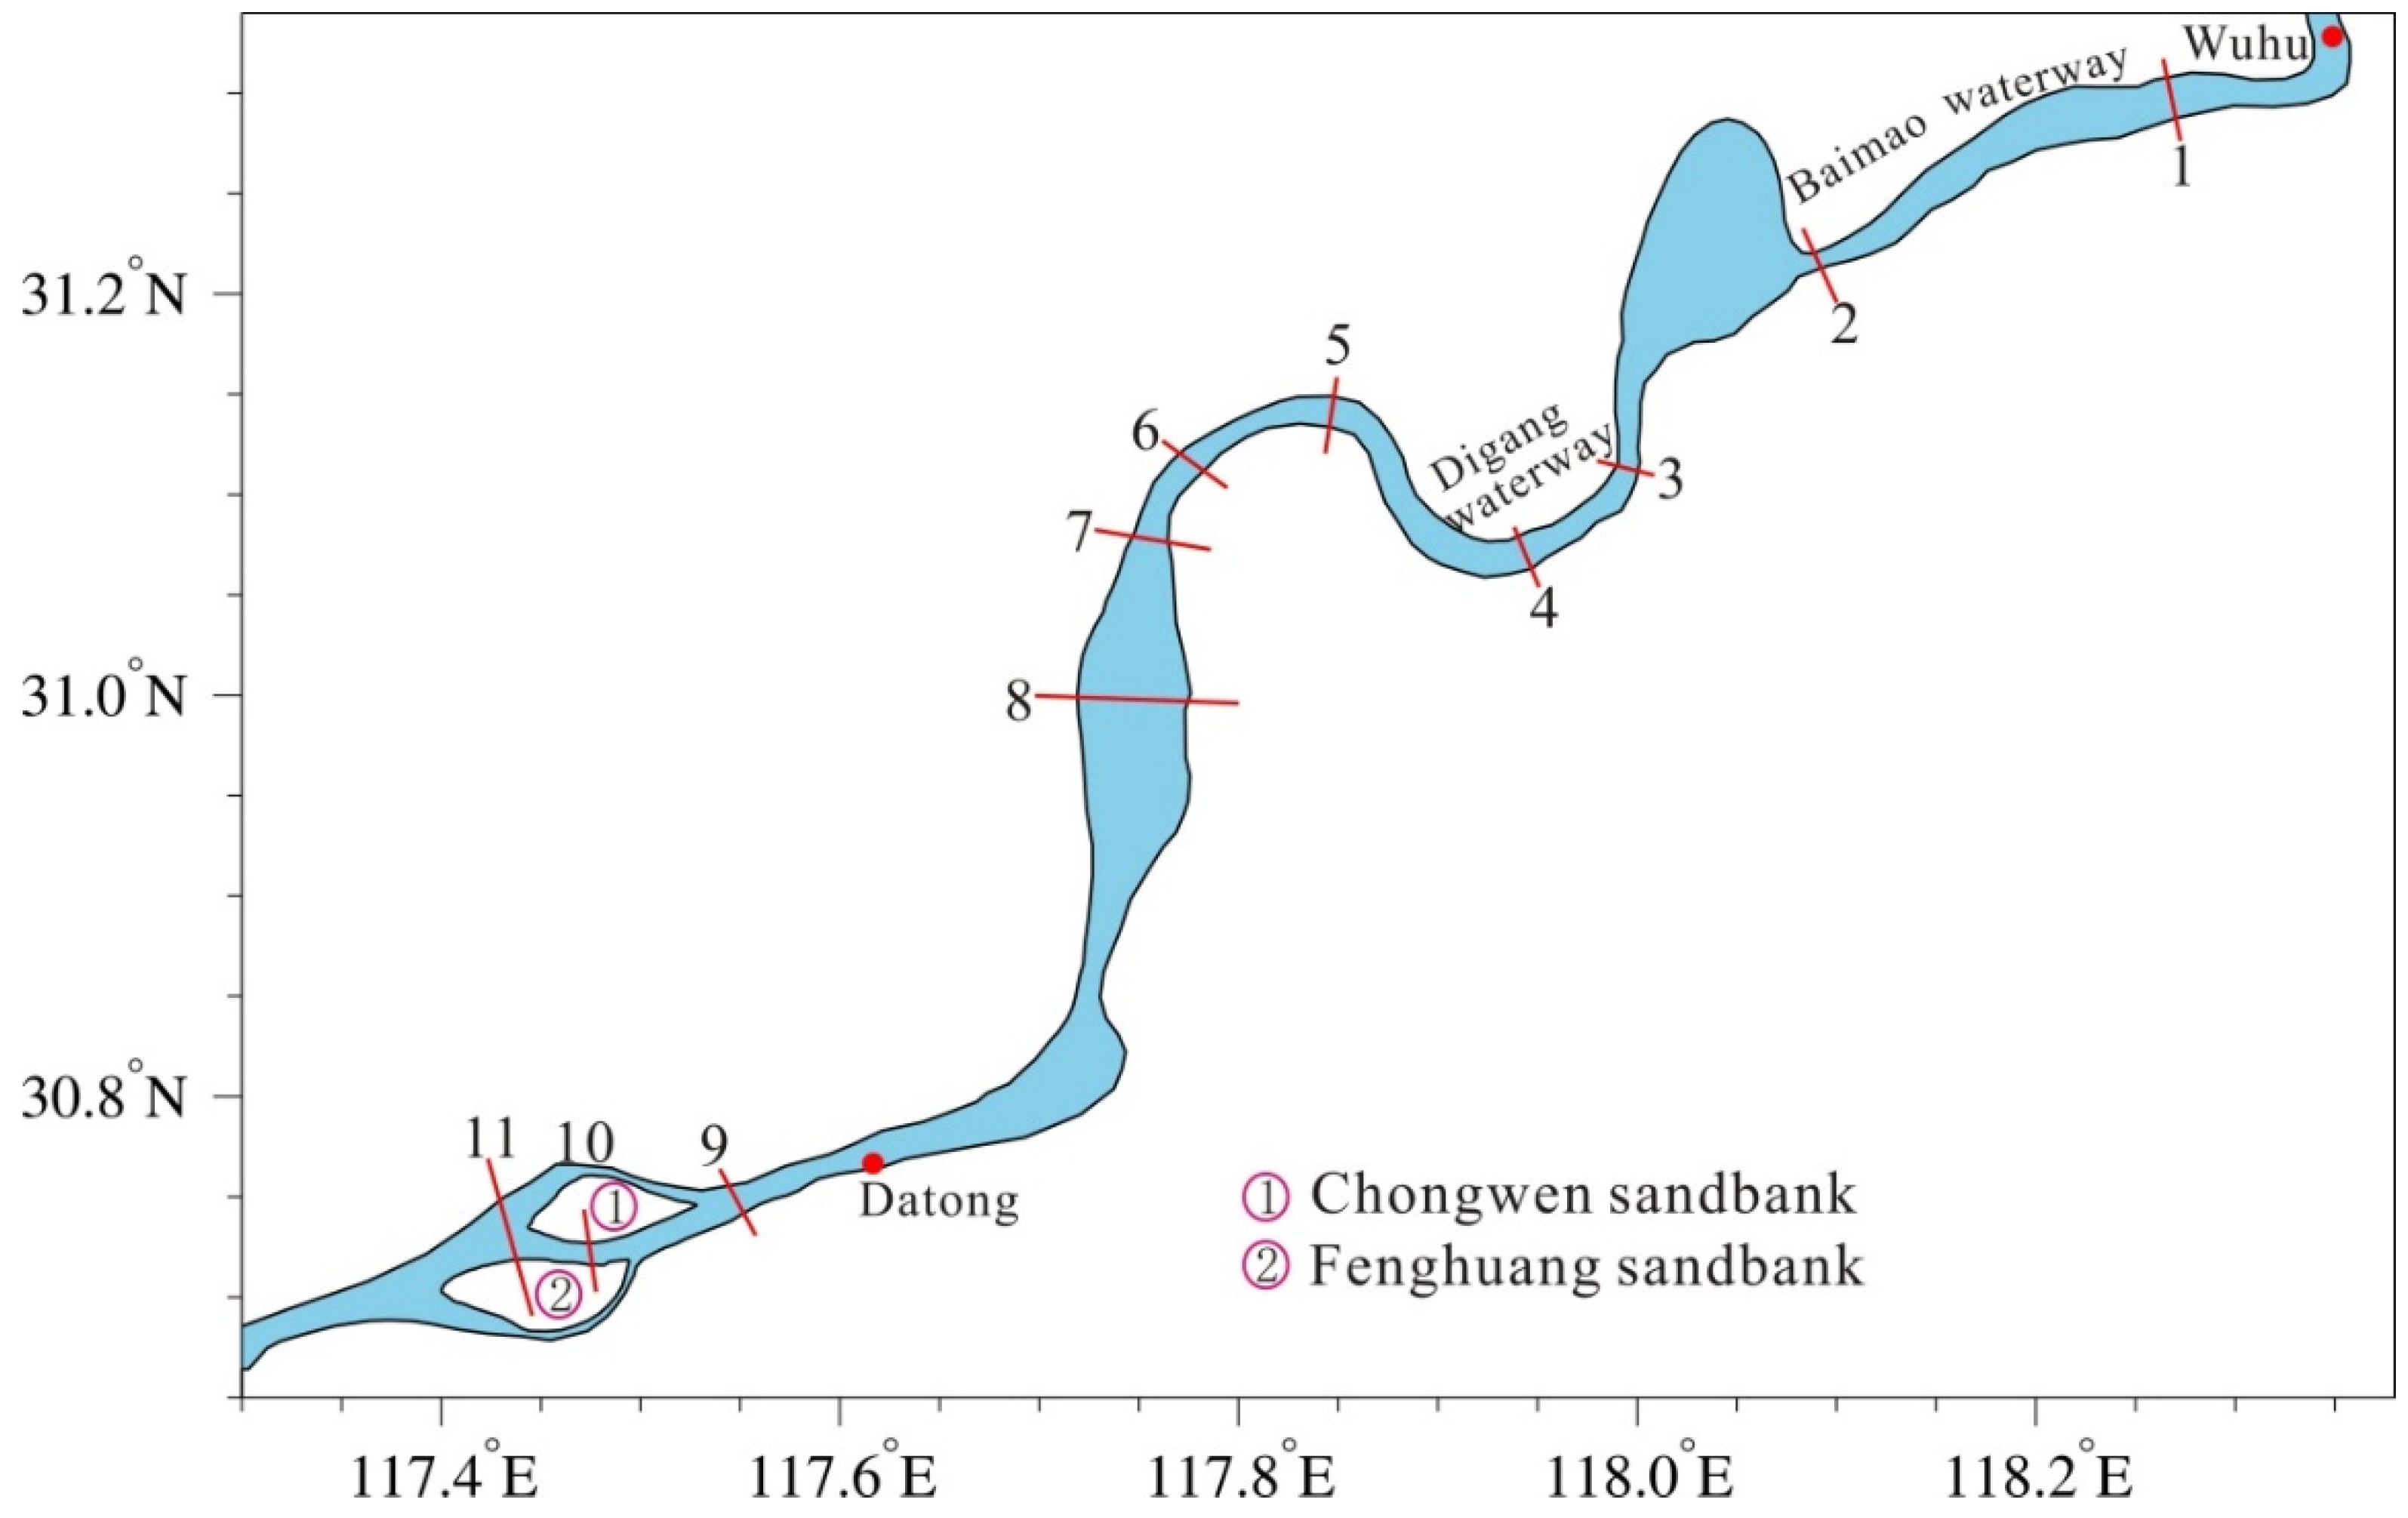
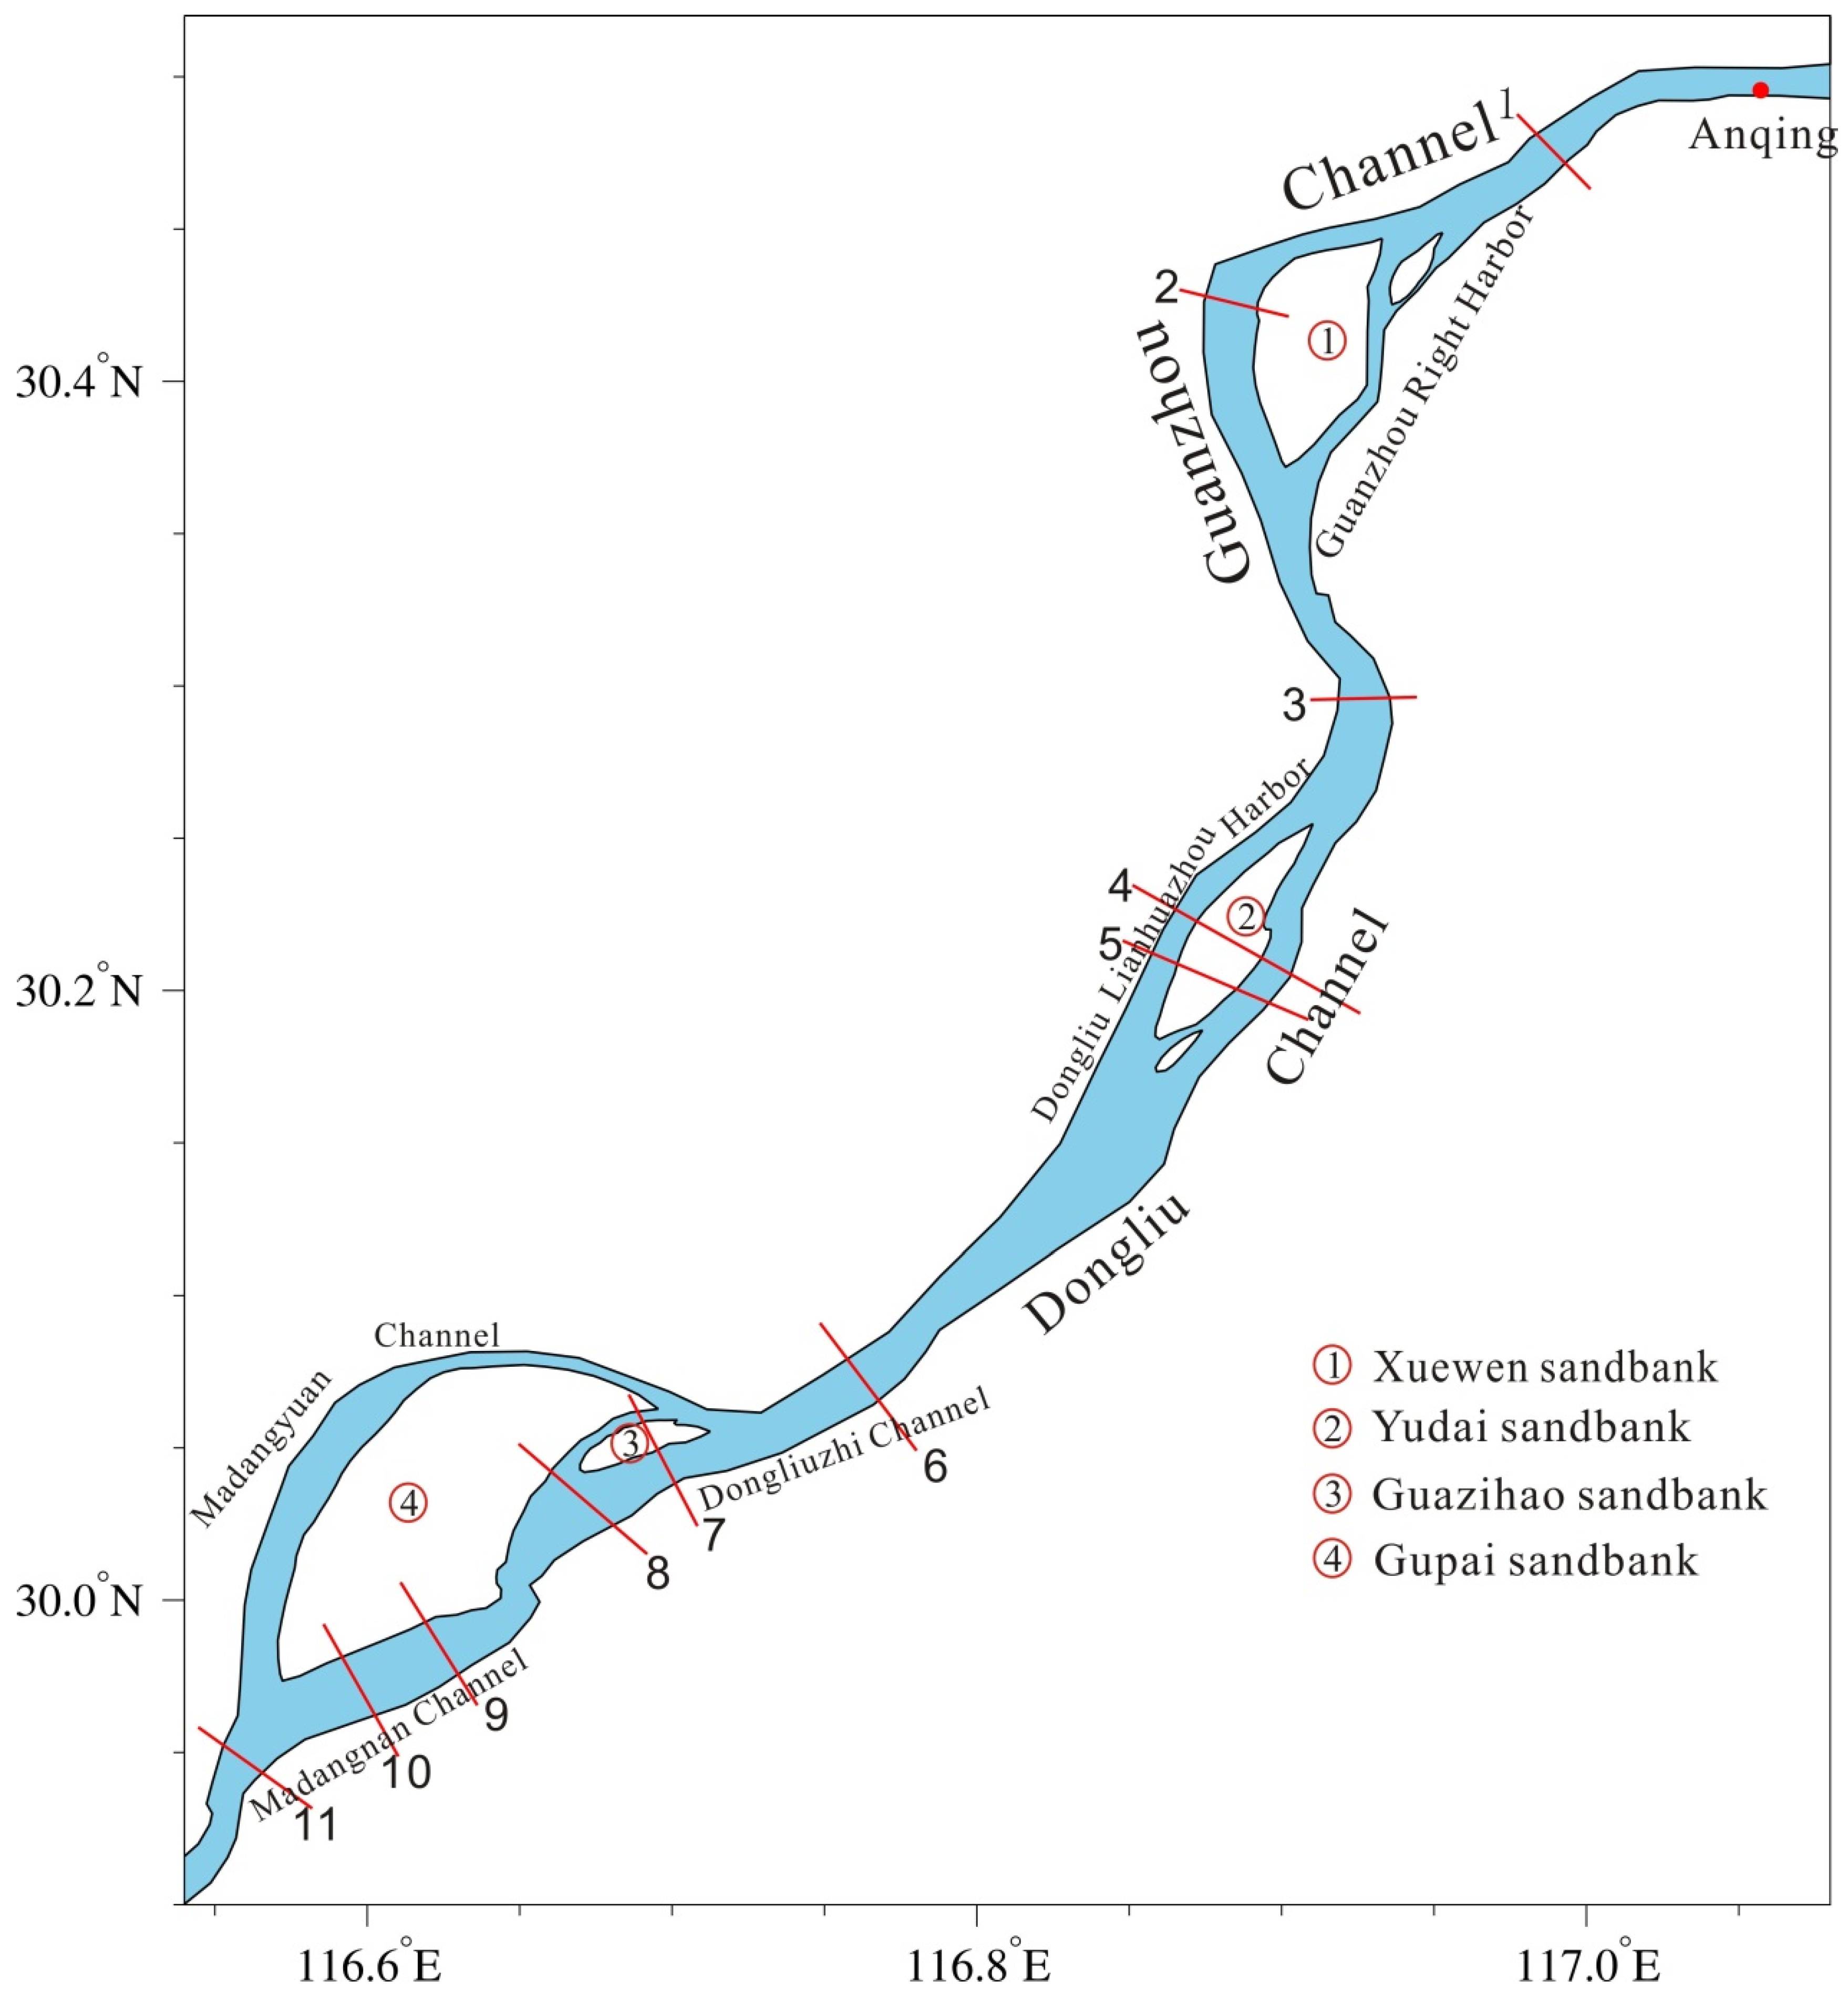
2.1. Model Configuration

The numerical model used in this paper is a long-term improved version of the author’s research group based on the ECOM-si model [21]. This model has been applied to the study of hydrodynamics and saltwater intrusion in the Changjiang’s estuary and has achieved many results [22,23,24,25,26]. The model has the following characteristics: it adopts the “Arakawa C” grid difference scheme in the horizontal direction [27] and non-orthogonal curvilinear grids; additionally, it uses the σ coordinate system in the vertical direction. In the numerical calculation method, the horizontal term that produces the slow process adopts explicit difference and the vertical term adopts implicit difference. Therefore, the model can have a high vertical resolution. Additionally, the implicit method is adopted for the treatment of the barotropic gradient force term in the momentum equations and the Casulli semi-implicit scheme is used to solve the continuous equation [28], which breaks the limitation of the time step by the CFL criterion. The model uses the Smagorinsky parameterization method to give the horizontal turbulent viscosity and diffusion coefficients [29] and a 2.5-order turbulent closed mode is embedded inside to provide the vertical turbulent viscosity and diffusion coefficient [30,31]. Wu and Zhu [32] solved the advection term in the salt transport equation by using the third-order precision HSIMT-TVD (high-order spatial interpolation at the middle temporal level coupled with a total variation diminishing scheme limiter) numerical scheme, which eliminates numerical dispersion, reduces numerical dissipation and greatly improves the accuracy of salinity calculations.
The calculation domain of the model includes the Changjiang’s estuary, Hangzhou Bay, adjacent seas and the lower reaches of the Changjing River. It reaches 125° E in the east, 33.7° N in the north, 28° N in the south and the upper boundary extends near Jiujiang (Figure 2). The grid fits the Changjiang’s estuary and the shoreline of the Changjiang River well, has a high resolution in some areas, such as the deep waterway, and has good orthogonality and smoothness. The number of grids in the calculation domain is 1380 × 224. The horizontal resolution is 100~200 m across the river, approximately 1 km along the Changjiang River and 200~600 m in the Changjiang River mouth and approximately 10 km with the coarsest resolution at the open sea boundaries. The model is divided into 5 layers evenly in the vertical direction and the time step was set to 20 s. Given that there are many shoals in the Changjiang’s estuary, a wet/dry scheme was included to describe the intertidal flat with a critical depth of 0.1 m.
The riverbed elevation data were measured from Xuliujing to the mouth of the Changjiang River in 2017 and digitized from the navigation reference map of the lower Changjiang River from Jiujiang to Xuliujing. The river discharge at the upstream open boundary was the monthly mean data recorded at the Jiujiang and Hukou hydrological stations. Derived from the NaoTide dataset (http://www.miz.nao.ac.jp/staffs/nao99/index_En.html (accessed on 20 March 2021)), the open sea boundary was driven by 16 astronomical constituents: M2, S2, N2, K2, K1, O1, P1, Q1, MU2, NU2, T2, L2, 2N2, J1, M1 and OO1. Wind fields, which were used to calculate river surface momentum, were provided by the National Center for Environmental Prediction (NCEP) reanalysis dataset with a spatial resolution of 0.5° × 0.5°. The velocity and elevation were initially set to zero. The initial salinity distribution was derived from the Ocean Atlas of the Huanghai Sea and East China Sea (Hydrology) [33] outside the Changjiang River mouth and from the measured data inside the river mouth.

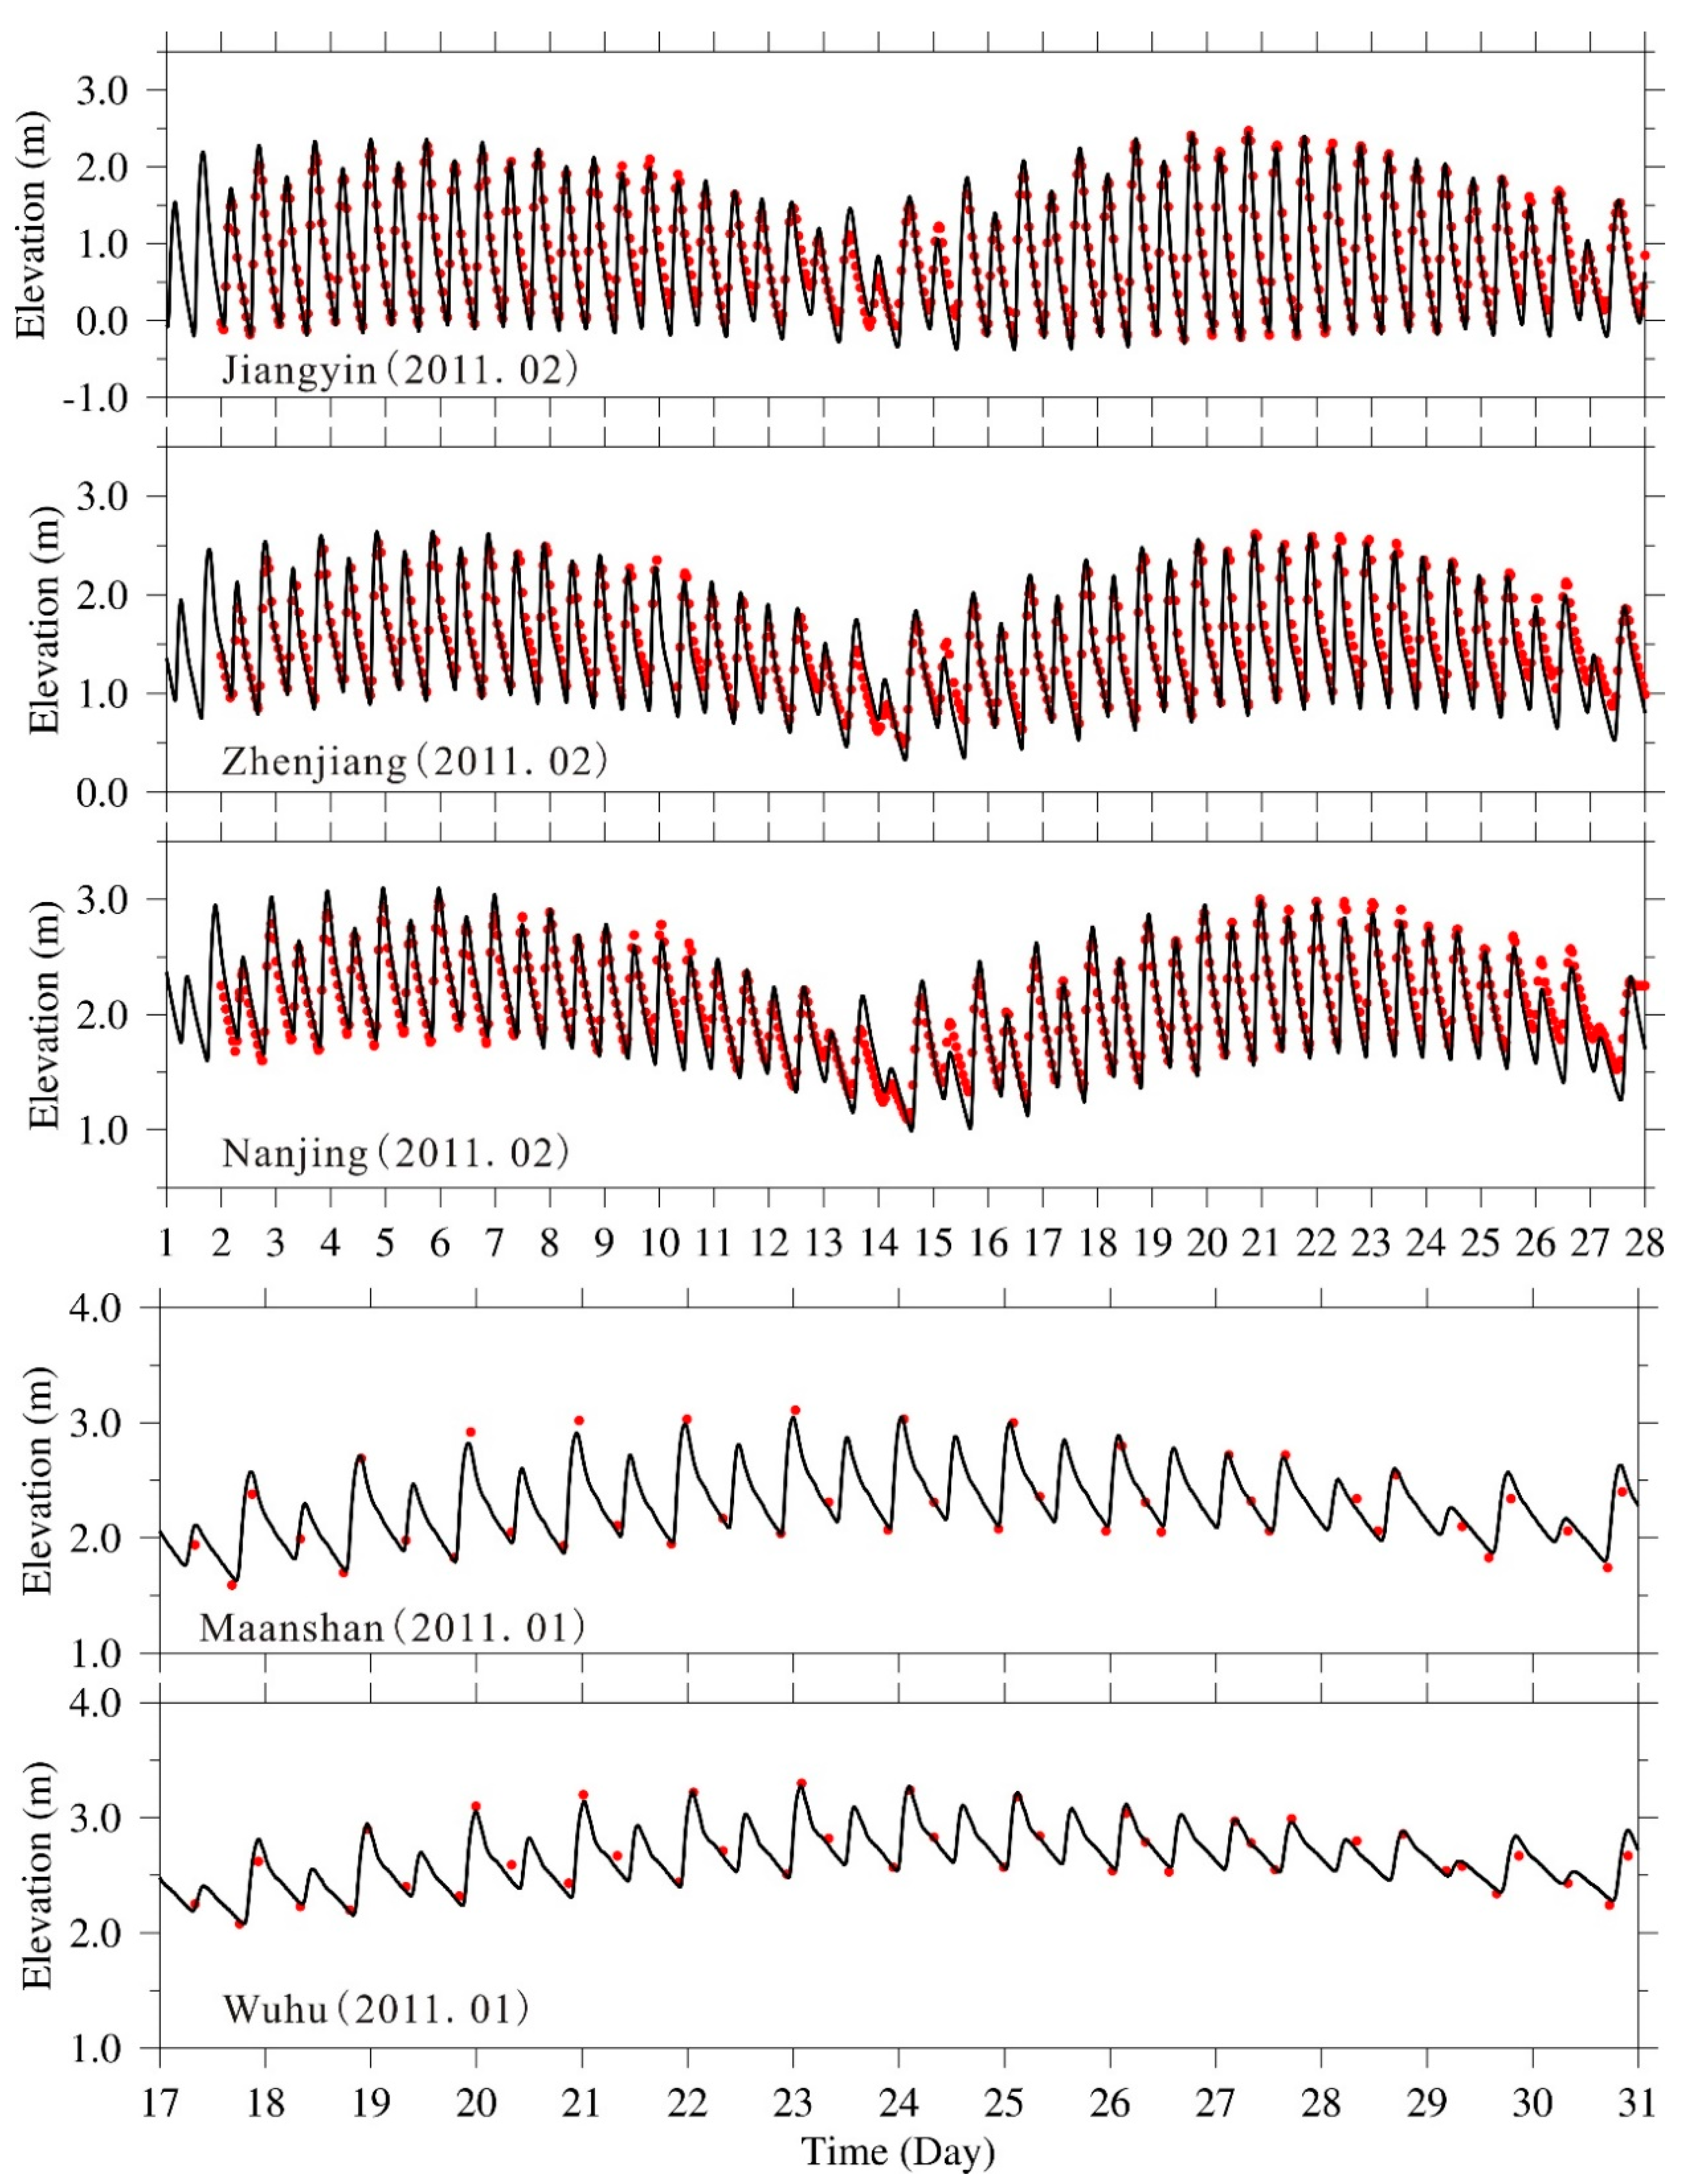
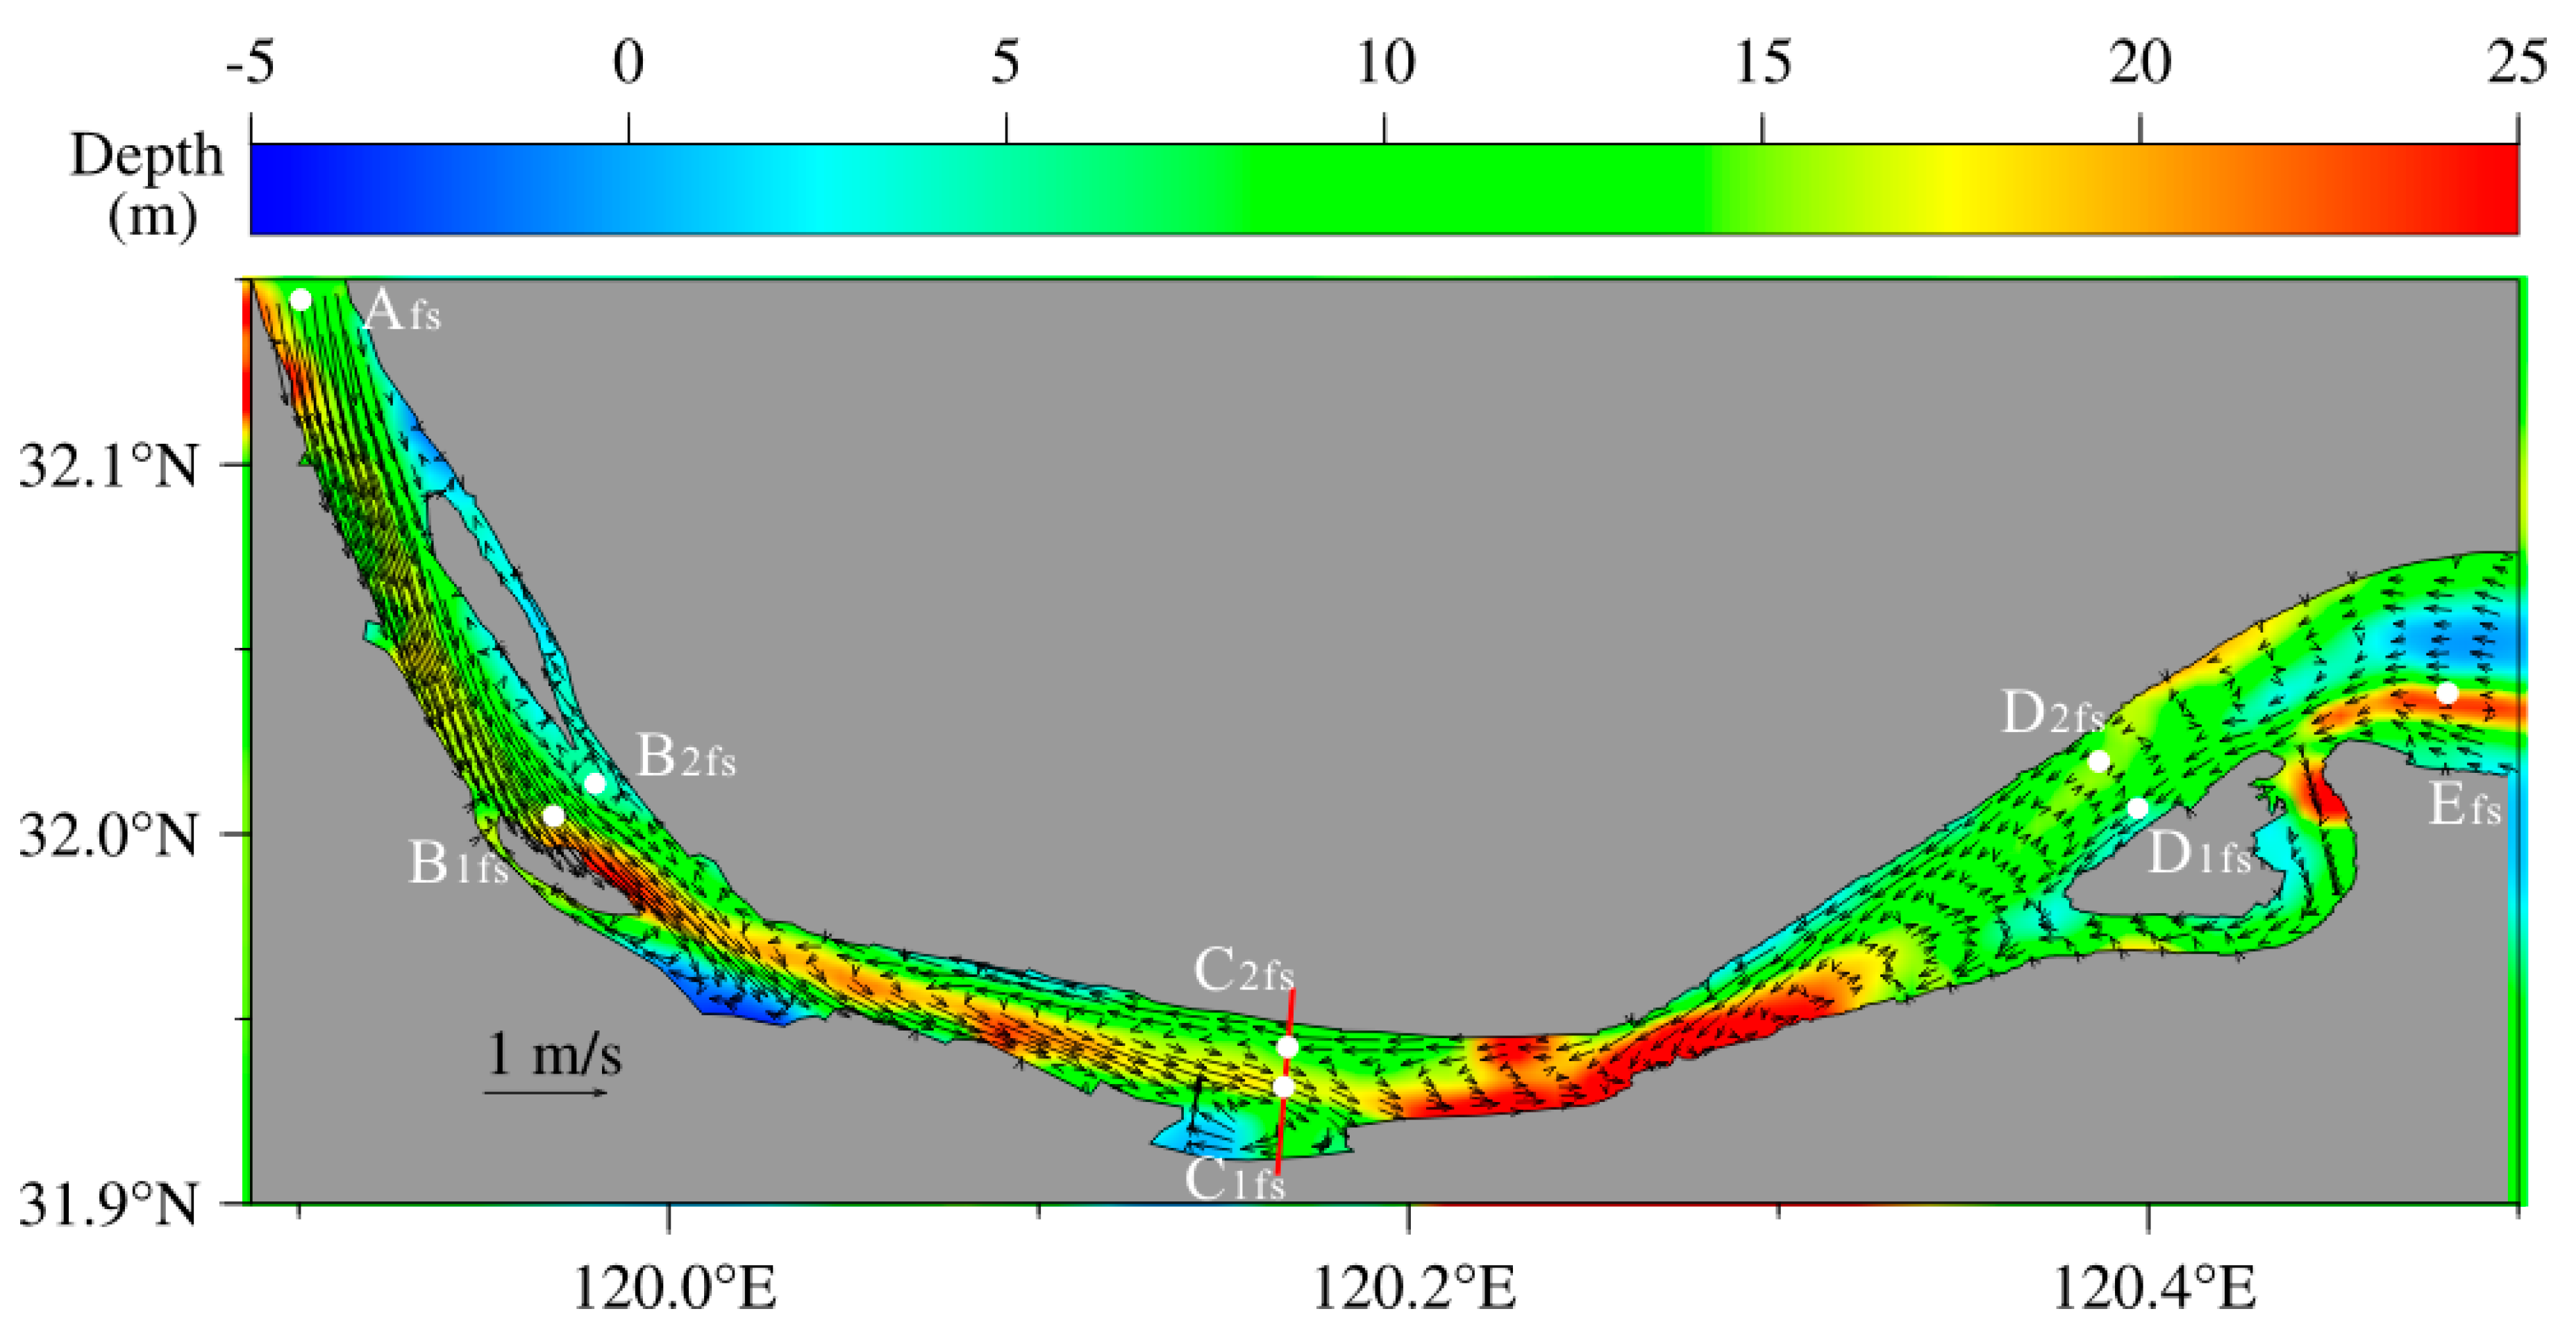
2.2. Model Validation

The numerical model described above has been validated many times in the Changjiang’s estuary and the results suggested that the model can successfully simulate the hydrodynamic processes and saltwater intrusion in the estuary [22,23,24,25,32]. Given that this research project focuses on the Changjiang River above Xuliujing, the measured water levels at the Jiangyin, Zhenjiang, Nanjing, Maanshan and Wuhu hydrological stations in 2011 were collected to validate the model. Figure 3 shows the comparison between the modeled and measured water levels at the Jiangyin, Zhenjiang and Nanjing hydrological stations in February 2011, as well as those at the Wuhu and Maanshan hydrological stations in the second half of January 2010 due to missing measured data. The variations in the water level at the hydrological stations reflected the characteristics of semidiurnal tides, diurnal inequalities and distinct spring–neap tides. The minimum and maximum water levels at the Nanjing hydrological station were higher than those at the Jiangyin hydrological station and the water level at the Wuhu hydrological station was higher than that at the Maanshan hydrological station. Overall, the numerical model could simulate the water level variation processes well and could reflect the characteristics of tidal wave propagation well in the lower reaches of the Changjiang River.

2.3. Numerical Experiment

The tidal current limit and tidal level limit are closely related to river discharge. We conducted a hydrological frequency analysis of the river discharge measured at the Datong hydrological station in January and July from 1950 to 2020 (Table 1) and obtained the corresponding river discharge at different frequencies in the dry season (January) and flood season (July). To quantitatively analyze the relationships among tidal current limit, tidal level limit and the river discharge, we set up two sets of numerical experiments in the flood and dry seasons. In each set of numerical experiments, eleven experiments were set up with different river discharges corresponding to frequencies from 5% to 95% at various guarantee rates of river discharge.

3. Results and Discussion

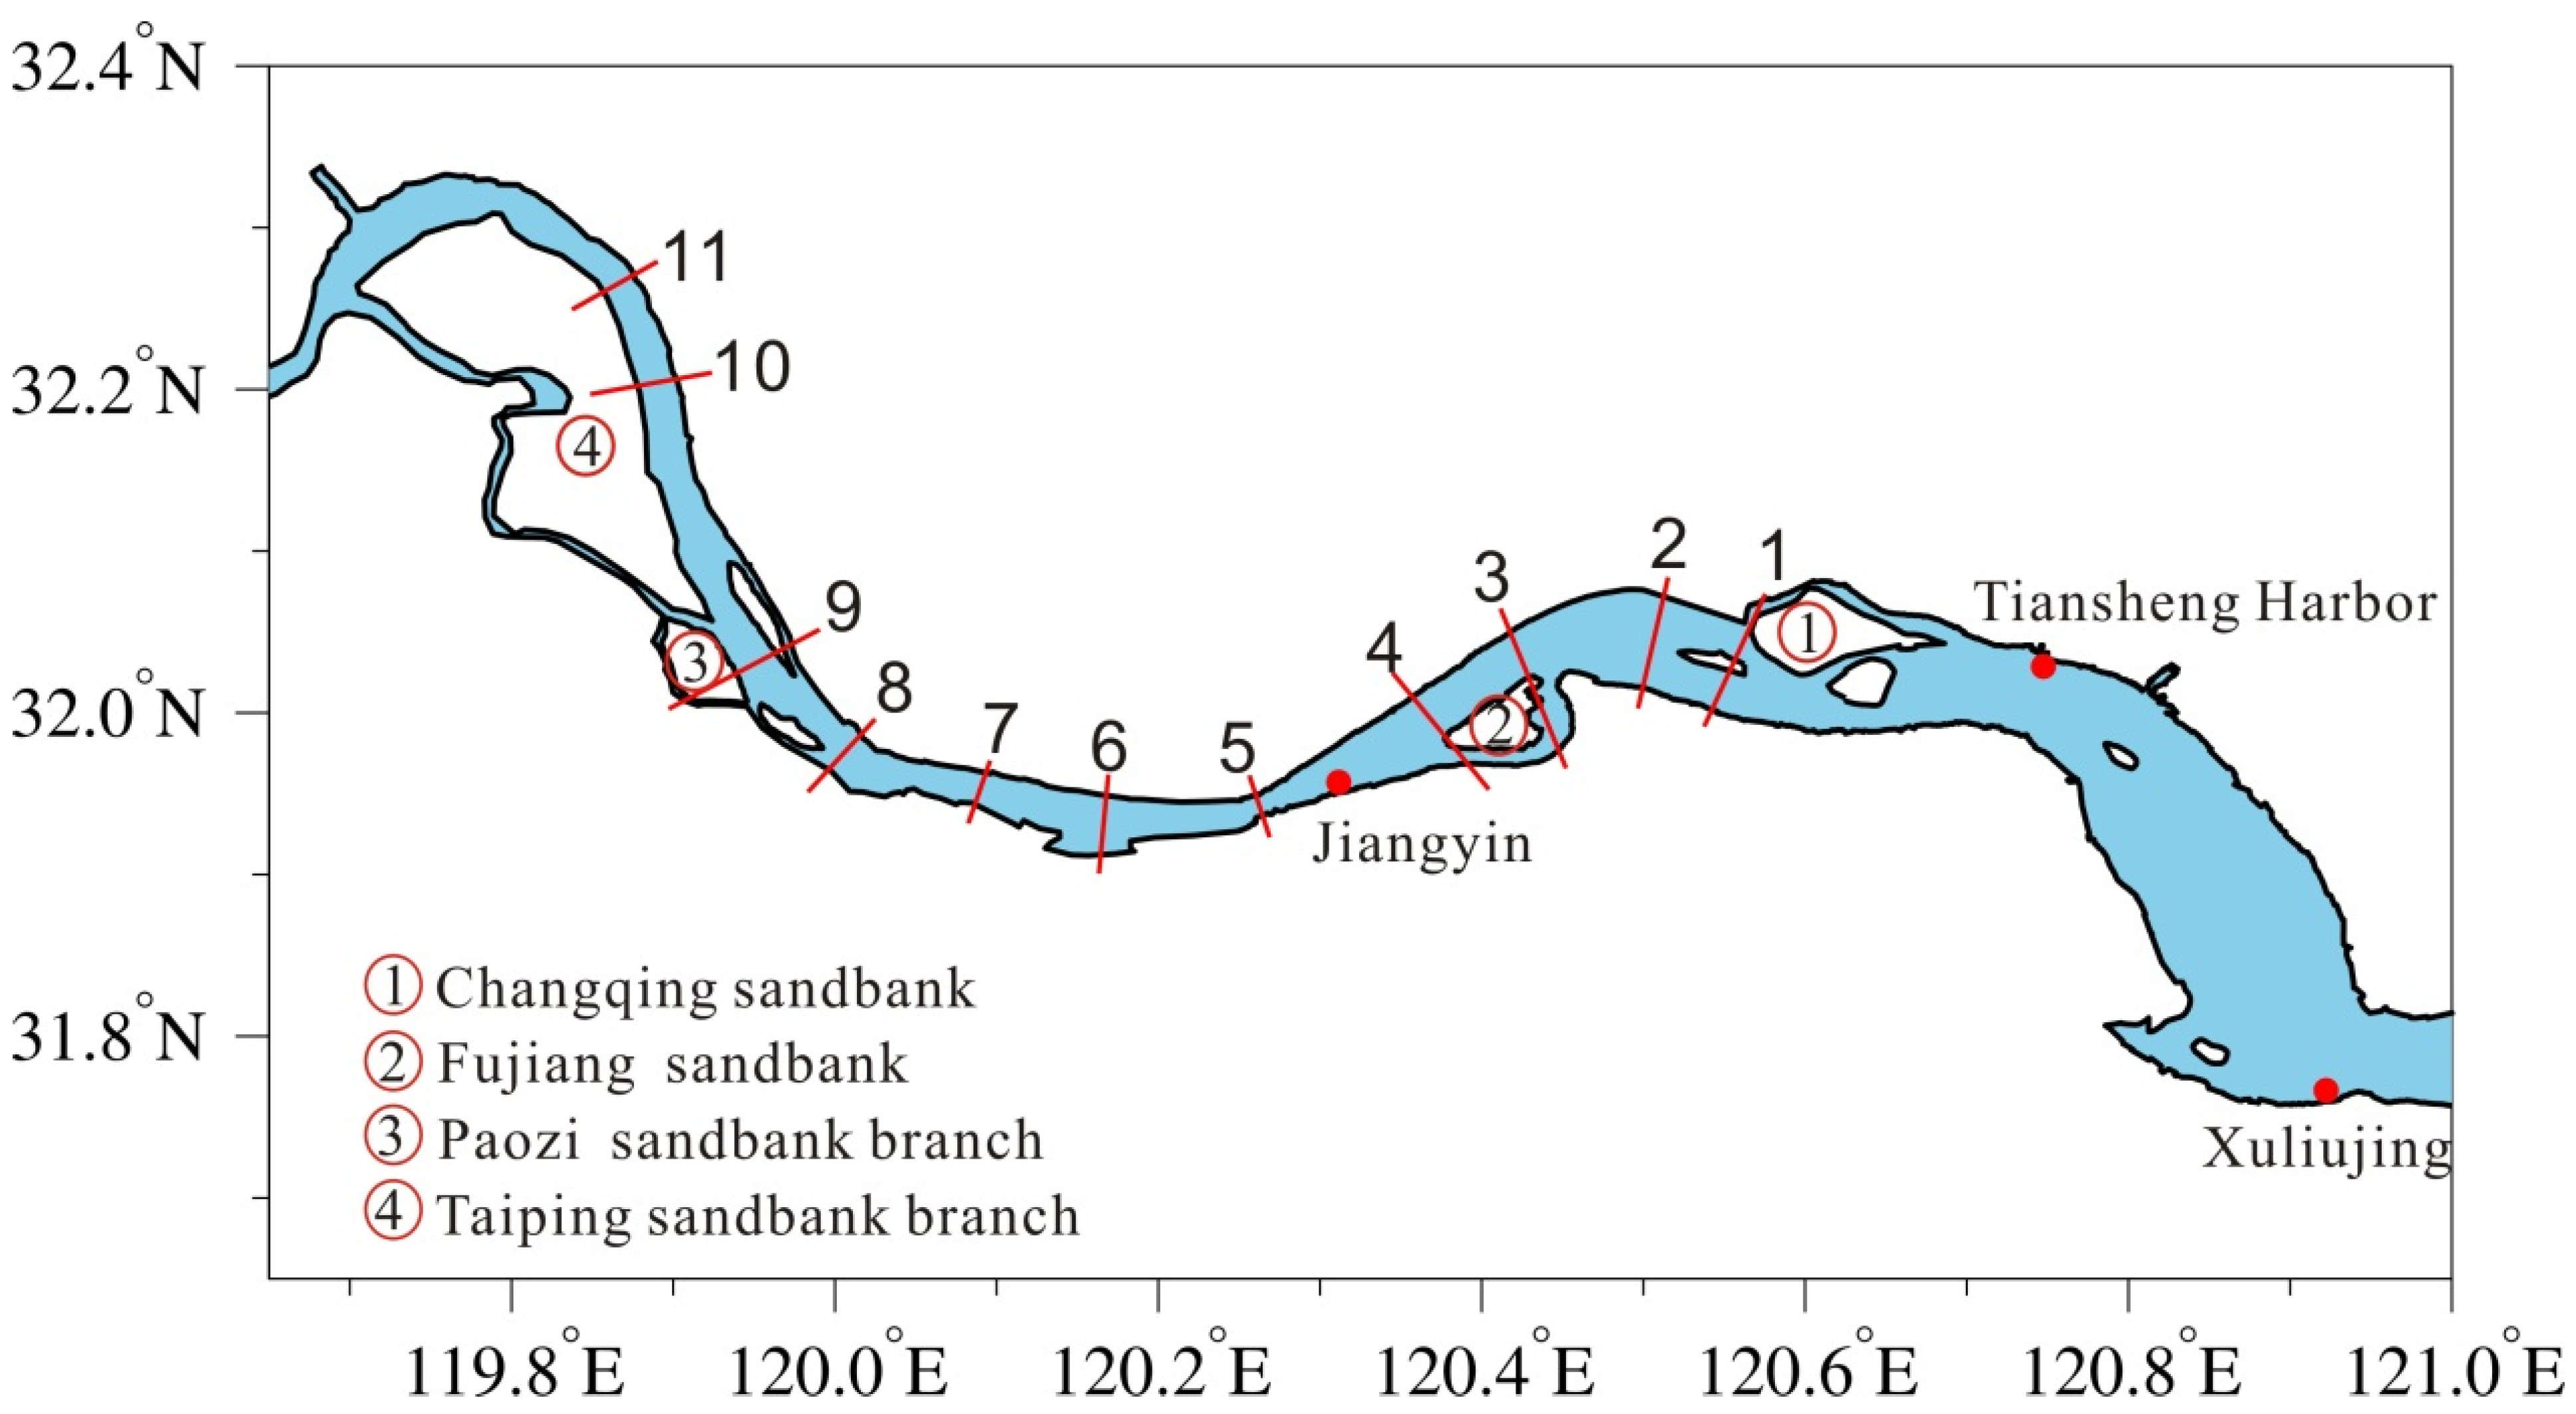
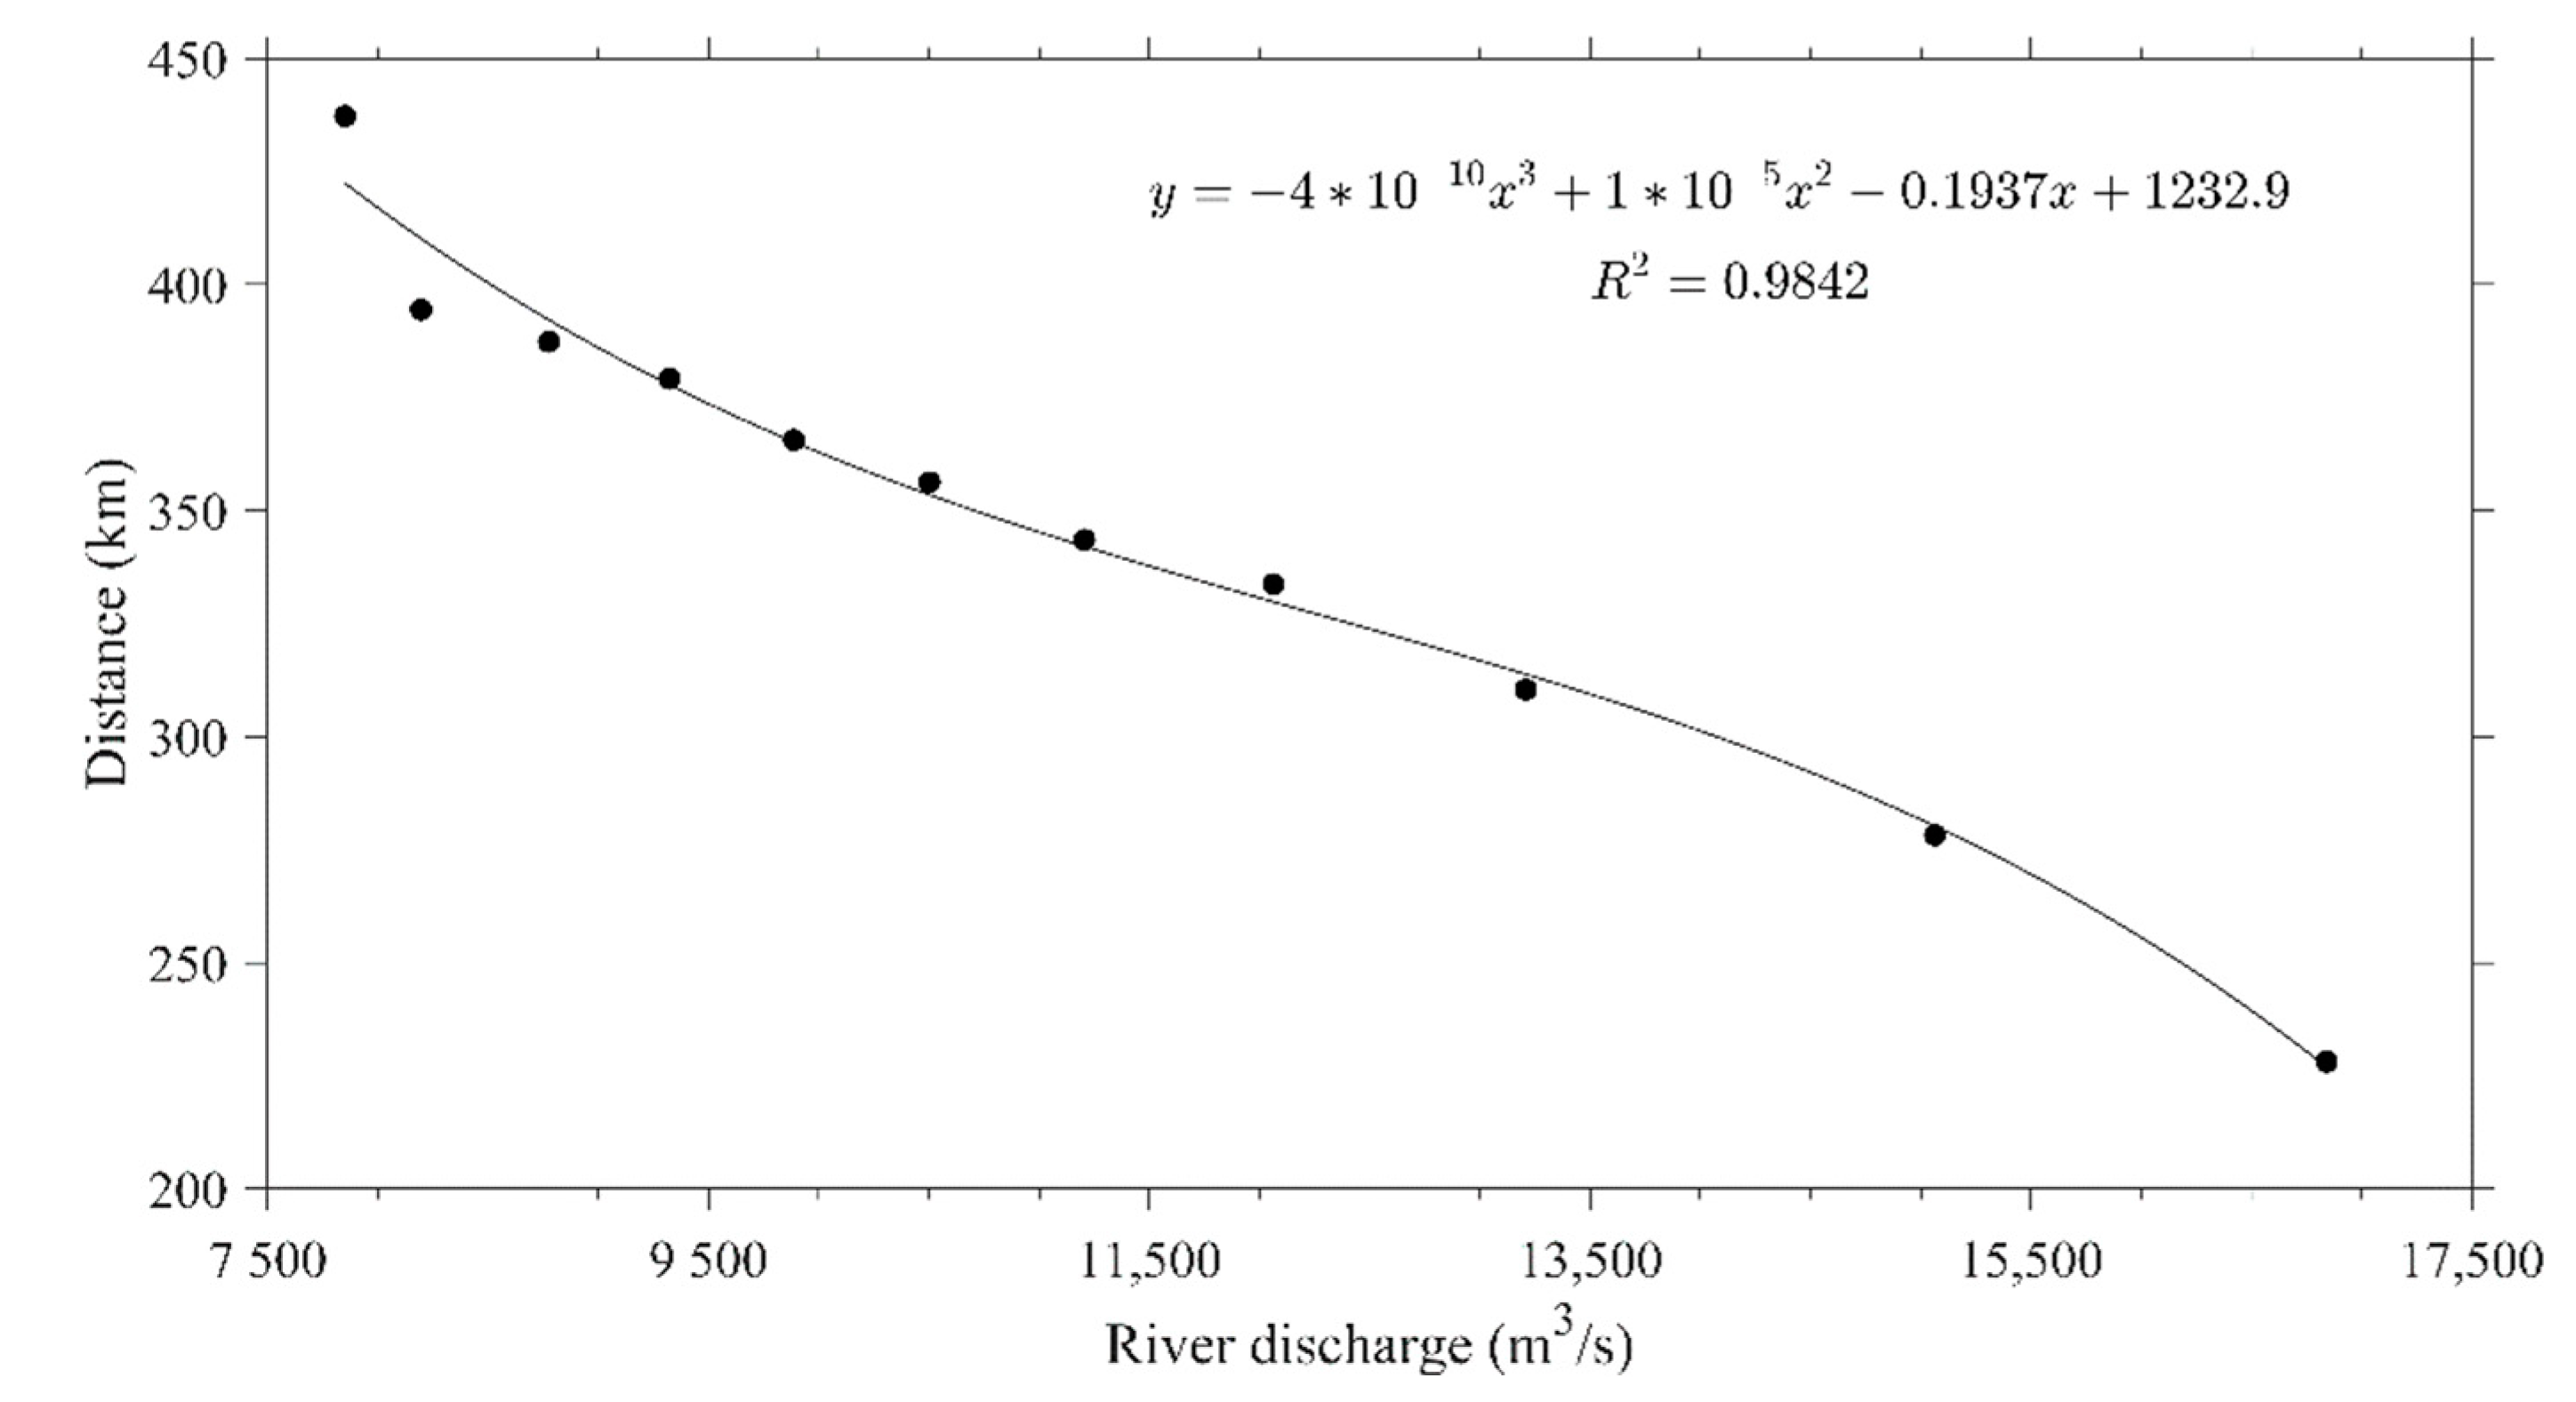
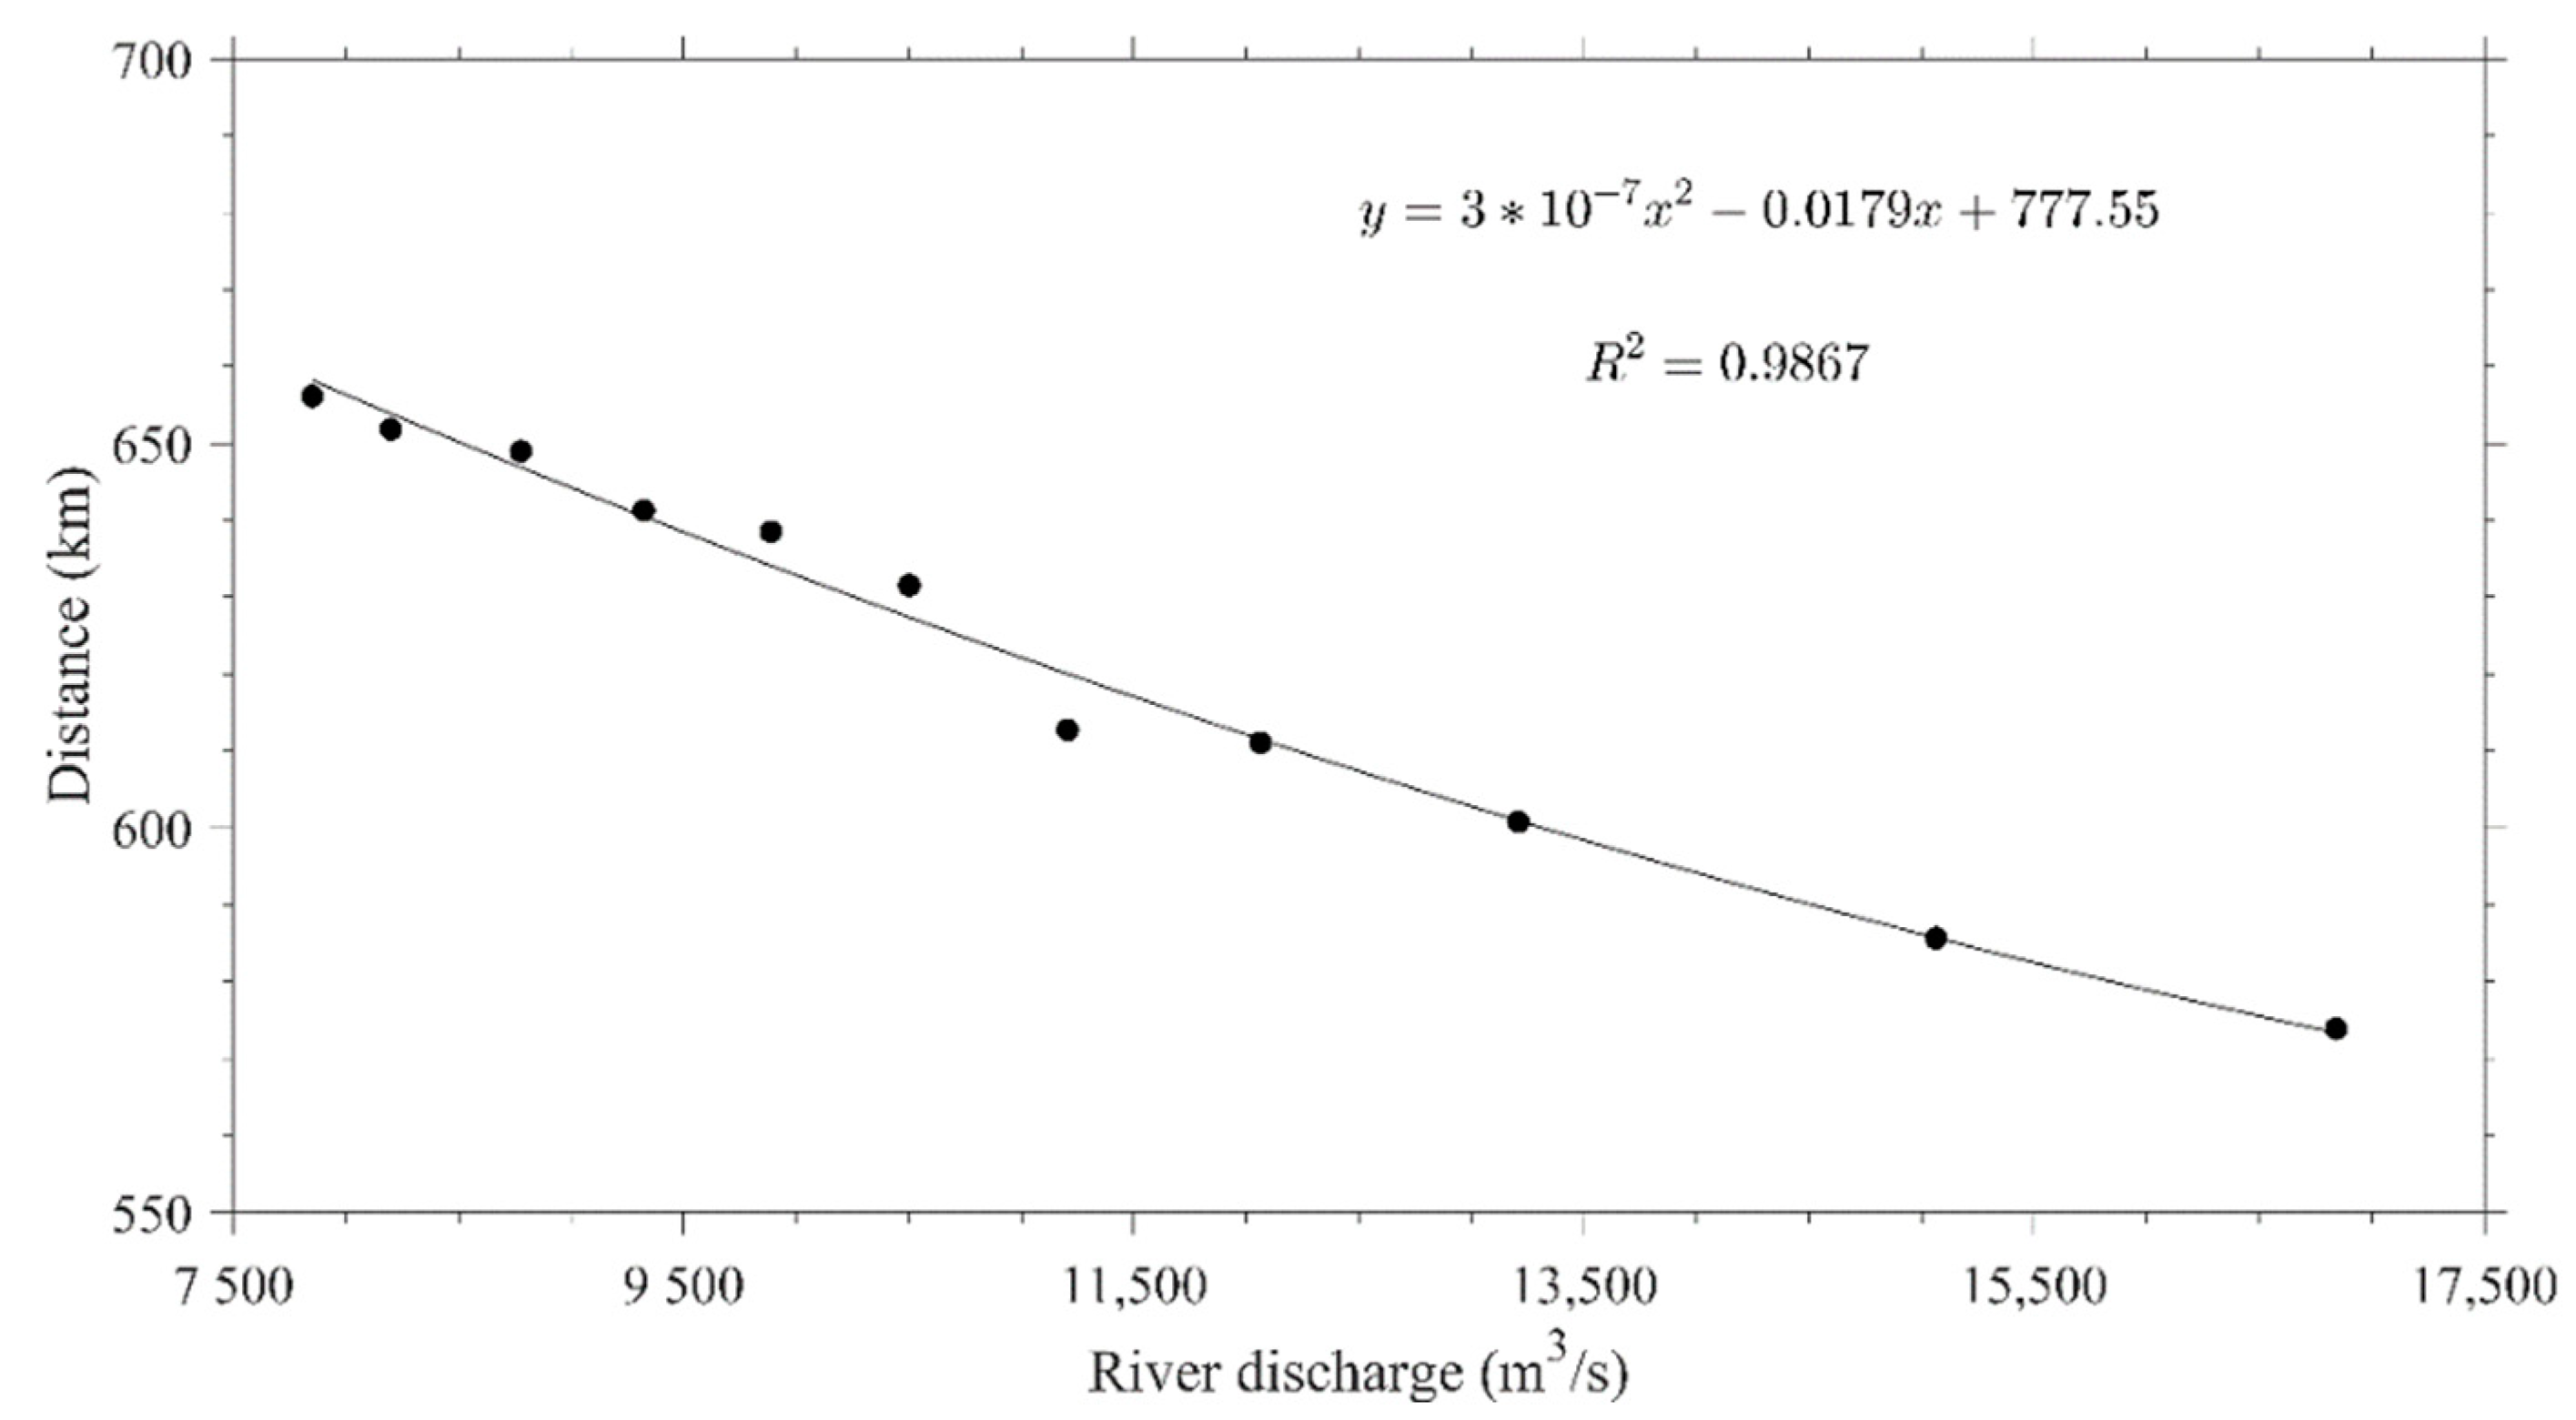
3.1. Response of Tidal Current Limit to River Discharge Change

The current in the lower reaches of the Changjiang River is determined by river discharge and tidal current. The farthest distance from the river mouth to which the tidal flood current can reach in the river is related to the tidal range; therefore, there is only one tidal current limit at a given river discharge. Our purpose is to determine the farthest distance the tidal flood current could reach, i.e., the tidal current limit. As an example, we analyzed the characteristics of the surface current in the tidal reaches of the Changjiang River with a river discharge of 48,161 m 3 / s corresponding to a guarantee rate of 50% of the hydrological frequency in the flood season (July) as the typical river discharge (Figure 4). At site Afs, the current is seaward and the flood current cannot reach there at that moment. At sites B1fs and B2fs, the current is seaward and has a larger speed in the southern deep channel than in the northern shallow channel. At sites C1fs and C2fs, there is no flood current in the southern deep channel, while a flood current appears in the northern shallow channel. At sites D1fs and D2fs, the current, called the flood current, is landward and has a larger speed in the southern shallow channel than in the northern deep channel. At site Efs in the deep channel, there is flood current. The instantaneous current distribution is obviously different between the main channel and on the shoal and between the main channel and tributary. The current is also different in the vertical direction (figure of bottom current omitted). Therefore, for simplicity, to determine the tidal current limit, we had to first determine the position where the instantaneous cross-sectional water flux at each time step was zero, which varied with tide (neap-spring tide); then, we had to determine the farthest one under a given river discharge.
Based on the various guarantee rates of river discharge in the flood season (Table 1), eleven numerical experiments were carried out to determine the tidal current limits. Figure 5 shows the relationship between the tidal current limit and the river discharge in the flood season. As the river discharge increases, the tidal current limit gradually moves downstream toward the river mouth. Its position movement is nonlinear with the change in river discharge. That is, the smaller the river discharge is, the more sensitive the change in the tidal current limit is to the river discharge. From a dynamic point of view, this result is because the farther away from the river mouth the tidal current limit is, the smaller the influence of tide and the larger the influence of the river discharge on the hydrodynamics of the river. By curve fitting the corresponding relationship between the tidal current limit and river discharge, the polynomial expression was obtained as y = 2   ×   10 13 x 3 + 3   ×   10 8 x 2 0 . 0074 x + 359 . 35 , where x is the river discharge (m3/s), y is the distance from the tidal current limit to Xuliujing (km) and the correlation coefficient reached 0.9969 (R2).
When the river discharge increases from 34,551 m3/s (frequency 95%) to 69,765 m3/s (frequency 5%), the tidal current limit moves from the upper middle section of the Taiping sandbank branch at a distance of 144.5 km from Xuliujing to the vicinity of the Changqing sandbank at a distance of 52 km from Xuliujing, with a variation range of 90 km (Figure 6). In the case of river discharge with a hydrological frequency less than 10%, the tidal current limit moves down to the lower reaches of the Fujiang sandbank and, in the case of river discharge with a hydrological frequency greater than 70%, the tidal current limit moves upwards to more than 32 km upstream of the Jiangyin hydrological station. In the case of river discharge with hydrological frequencies from 20% to 40%, the tidal current limit is generally located near Jiangyin, 16 km downstream of the river. In the case of river discharge with a hydrological frequency of 50%, the tidal current limit is located 15.5 km upstream of Jiangyin.
In the dry season, the river discharge is smaller, resulting in its blocking effect on the tidal flood current being weaker and making the tidal current limit move further upstream. Figure 7 shows the relationship between the tidal current limit and river discharge in the dry season. By curve fitting the corresponding relationship between the tidal current limit and river discharge, the polynomial expression was obtained as y = 4   ×   10 10 x 3 1   ×   10 5 x 2 0 . 1937 x 1232 . 9 , where x is the river discharge (m3/s) and y is the distance from the tidal current limit to Xuliujing (km). The R2 reached 0.9842.
The river discharge of the Changjiang River varies from 7852 m3/s (frequency 95%) to 16,840 m3/s (frequency 95%) and the tidal current limit moves downstream from the vicinity of the Taiyang sandbank waterway to the Yizheng waterway, with a variation range of 200 km, which is much larger than that in the flood season (Figure 8). In the case of river discharge with a hydrological frequency less than 20% in the dry season, the tidal current limit is located from Maanshan to Zhenjiang with a variation range of 80 km. In the case of river discharge with a hydrological frequency of 30–60%, the tidal current limit is located from Wuhu to Maanshan with a variation range of approximately 50 km. In the case of river discharge with a hydrological frequency greater than 70%, the tidal current limit is located in the upper reaches of Wuhu. When the river discharge is 7852 m3/s (frequency 95%), the tidal current limit is near the Taiyang sandbank waterway. The tidal current limit depends not only on river discharge but also on river shape. In the lower reaches of the Xinji sandbank, the river has fewer branches and the mainstream is a single channel, resulting in the tidal current limit upstream moving faster with the decrease in river discharge. The river has more branches from Nanjing to Wuhu and the tidal current limit upstream moves slower with the decrease in river discharge.

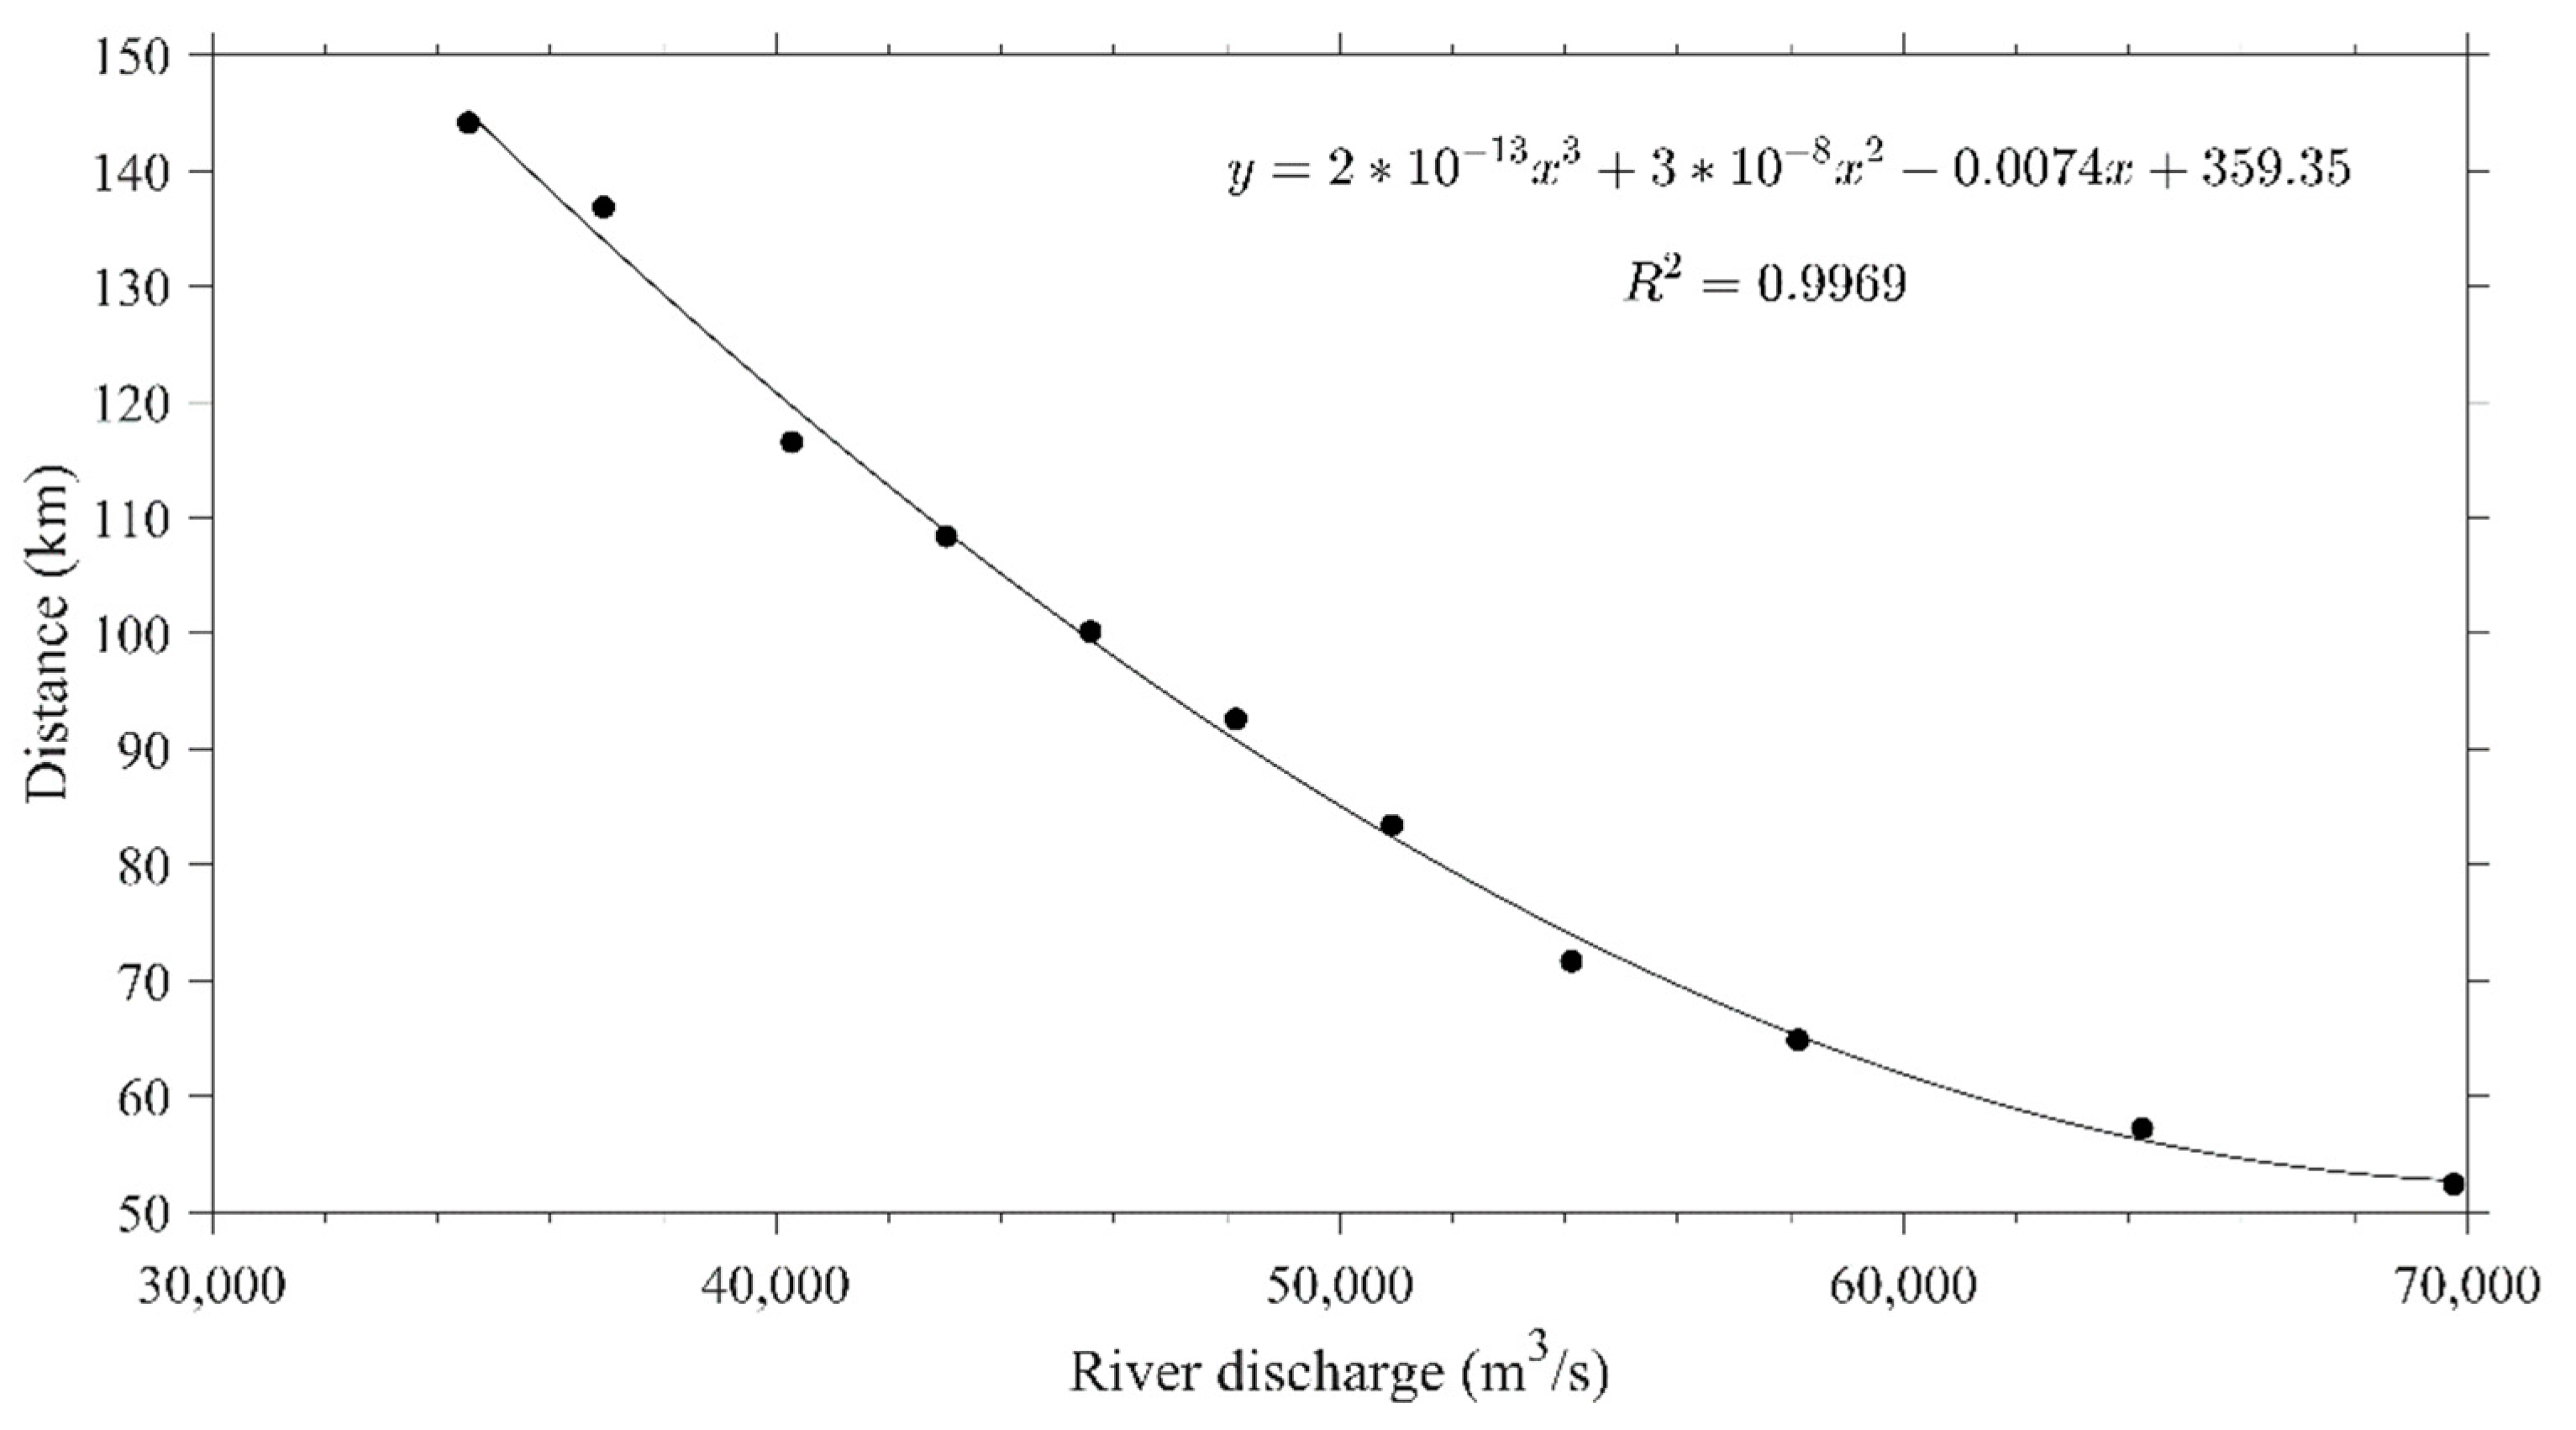
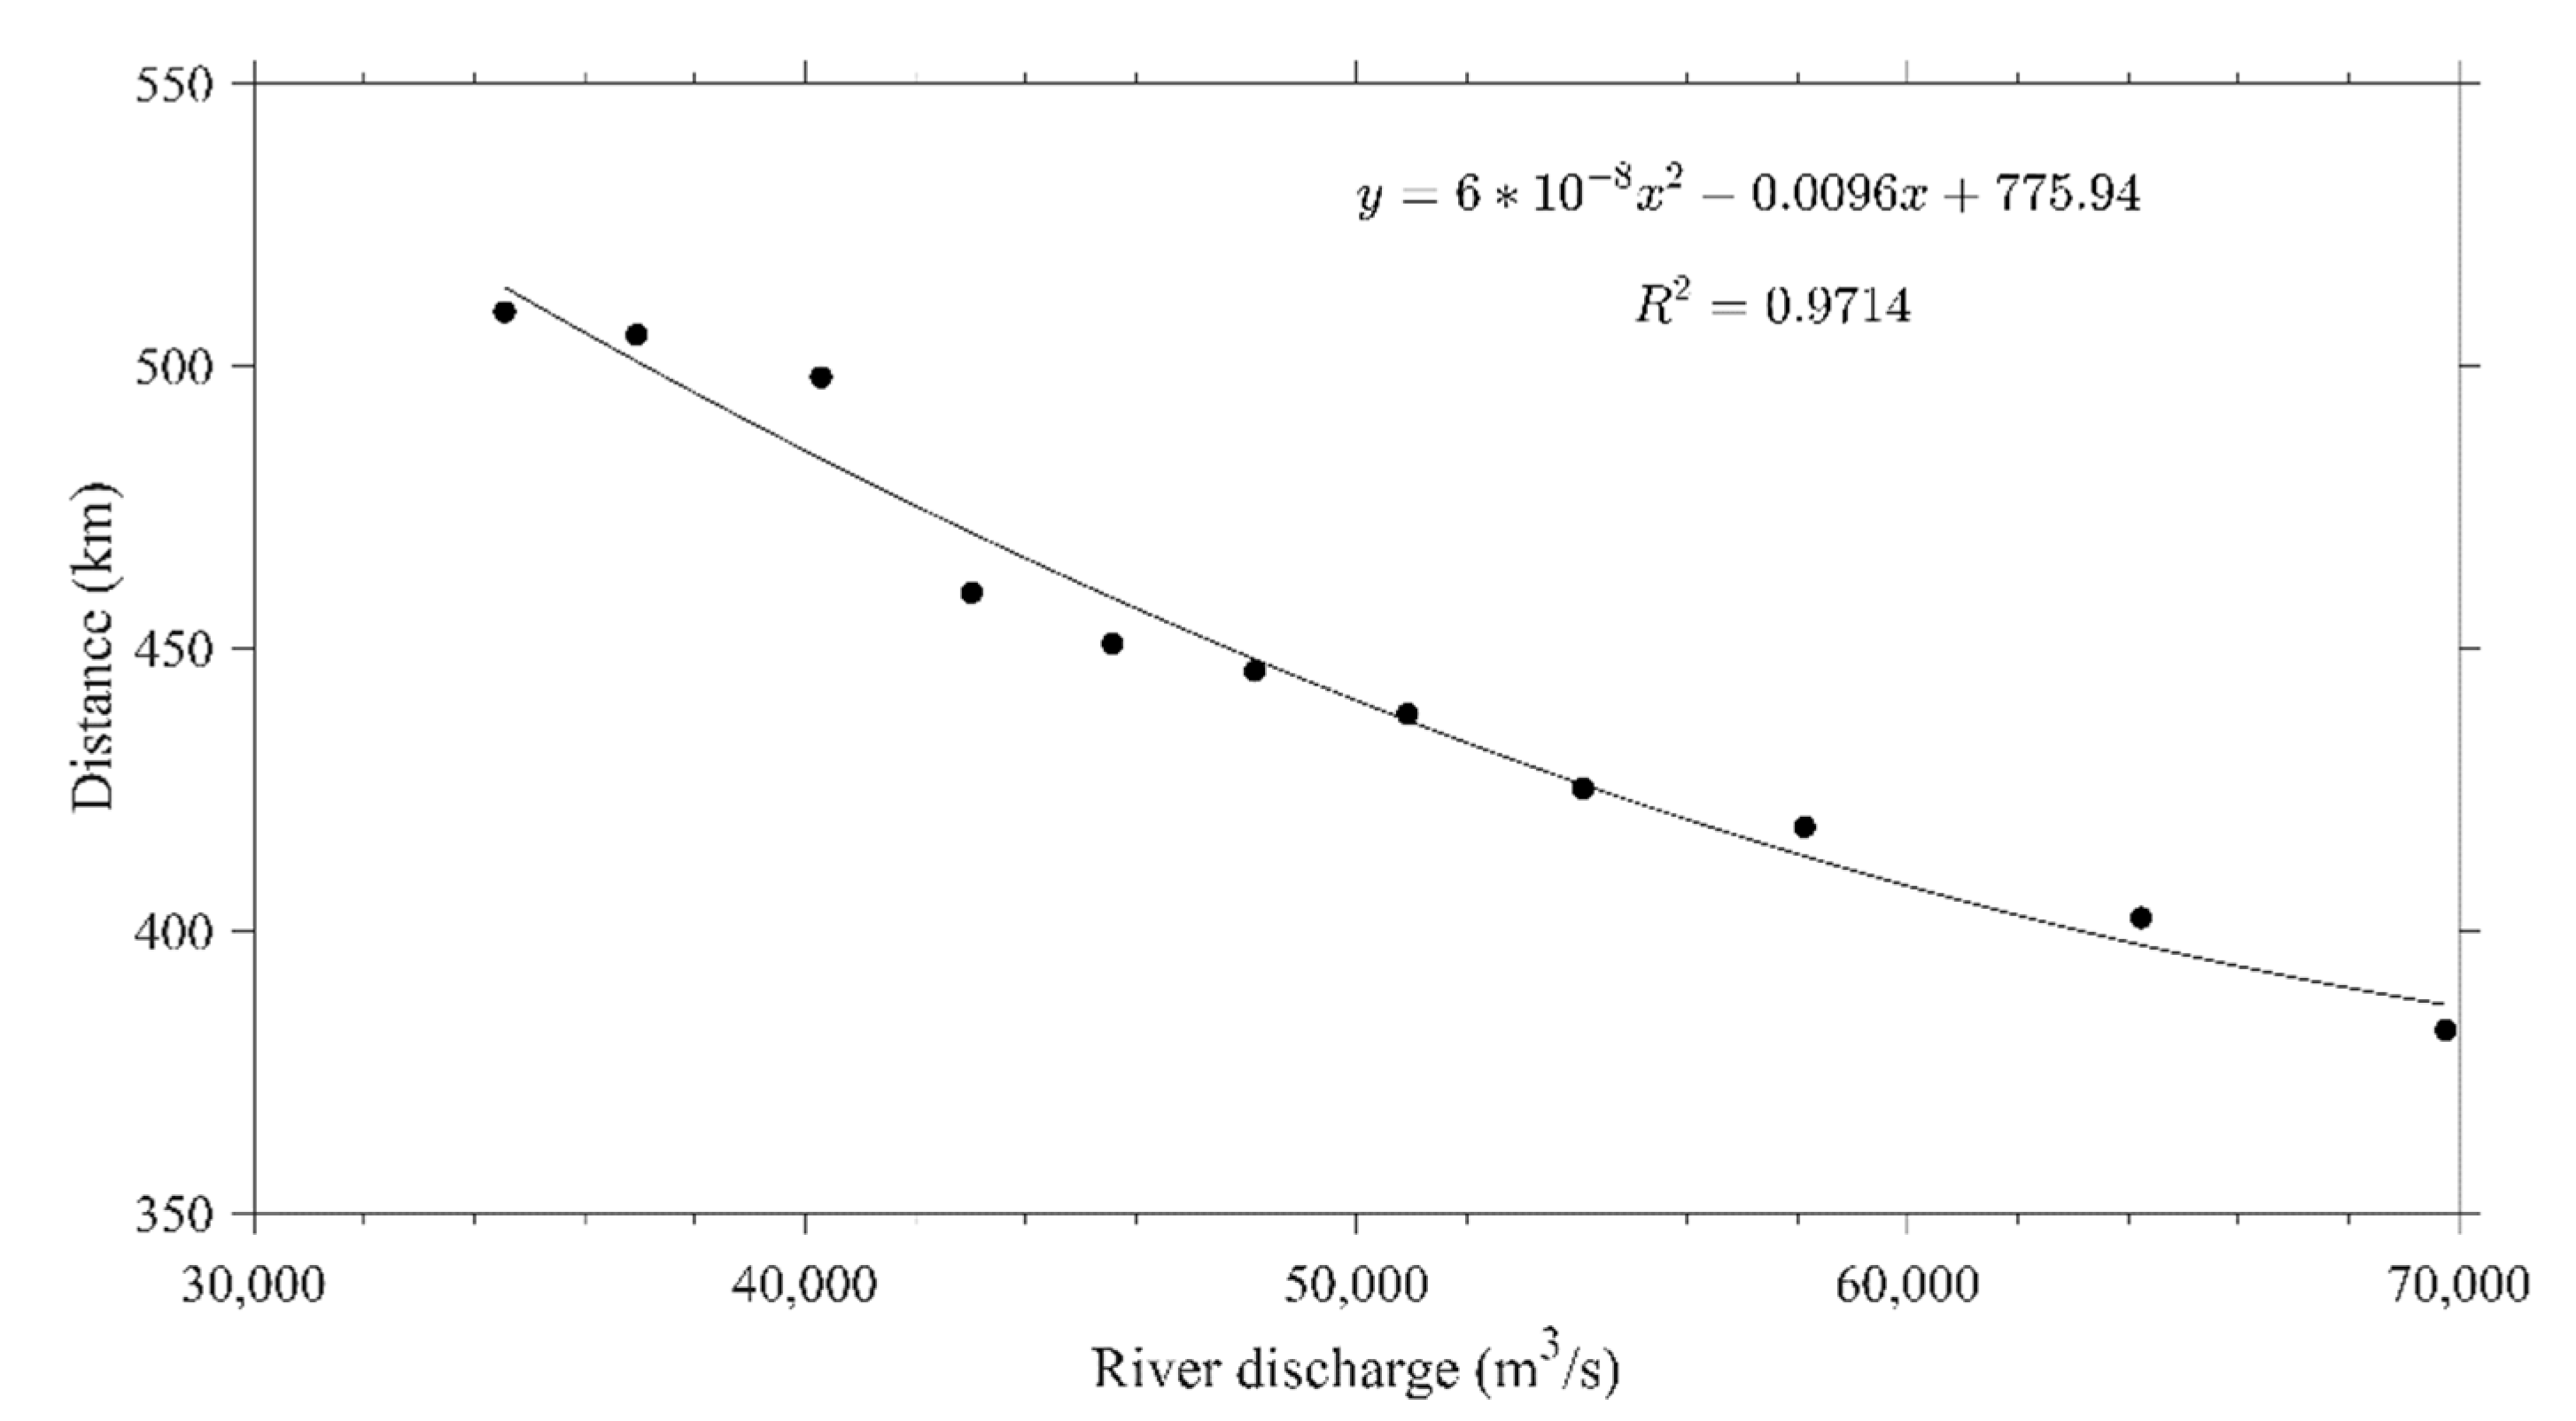
3.2. Response of the Tidal Level Limit to River Discharge Change

The tidal level limit refers to the farthest position where tidal waves can propagate, which varies with river discharge. The smaller river discharge is, the farther the tidal level limit is. The maximum tidal range along the river could be obtained from the model output of the water level during the spring and neap circles. Given the model calculation error, we defined where the maximum tidal range under a specific river discharge decayed to 0.02 m as the tidal level limit.
Figure 9 shows the quantitative relationship between the tidal level limit and the river discharge in the flood season. The tidal level limit gradually moves downstream as river discharge increases and has a nonlinear relationship with river discharge. By curve fitting the corresponding relationship between the tidal level limit and the river discharge, the quadratic function relation was obtained as y = 6   ×   10 8 x 2 0 . 0096 x + 775 . 94 , where x is river discharge (m3/s), y is the distance from the tidal level limit to Xuliujing (km) and R2 reached 0.9714.
When the river discharge changes from 34,551 m3/s (frequency 95%) to 69,765 m3/s (frequency 5%), the tidal level limit moves down from the upper reaches of the Chongwen sandbank, which is upstream of the Datong hydrological station, to the vicinity of the Wuhu hydrological station, with a variation range of 127 km (Figure 10). The change in the tidal level limit is greatly affected by the topography. Affected by the narrowing and bending of the river, the energy loss of tidal waves is relatively large, resulting in the change in the tidal level limit with the change in river discharge being small when the hydrological frequency changes of river discharge from 20% to 60%. Affected by the river bifurcation in the upper reaches of the Datong station, where the Chongwen sandbank divides the river into a narrow mainstream and a shallow branch, the energy loss of tidal waves increases. The movement range of tidal level limits there under hydrological frequencies of river discharge ranging from 80% to 95% is smaller.
In the dry season, similar to the flood season, the relationship between the tidal level limit and river discharge is nonlinear. Figure 11 shows the quantitative relationship between the tidal level limit and river discharge. By curve fitting the corresponding relationship between the tidal level limit and river discharge, the quadratic function relation was obtained as y = 0.3428 x 2 17 . 9 x + 777 . 55 , where x is the river discharge (m3/s), y is the distance from the tidal level limit to Xuliujing (km) and R2 reached 0.9867.
When the river discharge changes from 7852 m3/s (frequency 95%) to 16,842 m3/s (frequency 5%), the tidal level limit moves down from the upper reaches of the Guopai sandbank at a distance of 656 km from Xuliujing to the vicinity of the Anqing hydrological station at a distance of 573 km from Xuliujing (Figure 12). With the increase in river discharge, the tidal level limit gradually moves downward and the distance of its movement is also affected by the topography. Due to the influence of the river bifurcation at the Yudai sandbank, the shallower and narrower main branch and sub-branches, and the blockage of river discharge, the tidal wave is restrained in the process of upward propagation and the tidal level limit moves upstream slowly. In the vicinity of the Gupai sandbank, the upstream propagation of tidal waves is affected not only by the channel bend, such as the sharp bend at the lower end of the Madangnan channel, where the reflection of the bank slope on the tidal wave causes more energy loss of the tidal wave, but also by the alternate occurrence of shoals and deep channels, which are not conducive to the propagation of the tidal wave. As a result, the tidal level limits are more concentrated in the Madangnan channel on the south side of the Gupai sandbank.

4. Conclusions

Based on the hydrological frequency analysis of river discharge in the dry season and flood season based on data from the Datong hydrological station over the past 70 years, a three-dimensional estuary numerical model was used to give the quantitative relationships between the tidal current limit, tidal level limit and river discharge in the Changjiang River under different guarantee rates of river discharge in the flood and dry seasons.
The hydrological frequency analysis of river discharge in January and July from 1950 to 2020 was conducted to set up eleven numerical experiments with frequencies from 5% to 95% at various guarantee rates of river discharge. The results of the numerical experiments show that the tidal current limit and tidal level limit gradually move downstream toward the river mouth as river discharge increases and their position movements are nonlinear with the change in river discharge. The smaller river discharge is, the more sensitive the changes in the tidal current limit and tidal level limit are to river discharge. The tidal current limit and tidal level limit depend not only on river discharge but also on river topography. They move slower upstream with the decrease in river discharge in the reaches where the river is shallower and narrower and has river bifurcations and bending, which are not conducive to the propagation of tidal waves.
When the river discharge varies from guarantee rates of 95% to 5%, the relationship between the tidal current limit and river discharge is y = 2 × 10 13 x 3   + 3 × 10 8 x 2 0 . 0074 x + 359 . 35 (R2, 0.9969) in the flood season, with a variation range of 90 km from the upper middle section of the Taiping sandbank to the vicinity of the Changqing sandbank, and y = 4 × 10 10 x 3 1   ×   10 5 x 2 0 . 1937 x 1232 . 9 (R2, 0.9842) in the dry season, with a variation range of 200 km from the vicinity of the Taiyang sandbank waterway to the Yizheng waterway, which is much larger than that in the flood season.
When the river discharge varies from guarantee rates of 95% to 5%, the relationship between the tidal level limit and the river discharge is y = 6 × 10 8 x 2 0 . 0096 x + 775 . 94 (R2, 0.9714) in the flood season, with a variation range of 127 km from the upper reaches of the Chongwen sandbank to the vicinity of the Wuhu hydrological station, and y = 0.3428 x 2 17 . 9 x + 777 . 55 (R2, 0.9867) in the dry season, with a variation range of 83 km from the upper reaches of the Guopai sandbank to the vicinity of the Anqing hydrological station, which is much smaller than that in the flood season and is located far upstream of the Datong hydrological station.
The quantitative relationships among the tidal current limit, tidal level limit and river discharge are helpful for clarifying the hydrodynamic process in the tidal reaches of a river, thereby providing a scientific basis for the development and utilization of the lower reaches of a river.

Author Contributions

Conceptualization, J.Z.; methodology, J.H. and X.C.; software, J.Z.; validation, C.H. and J.H.; formal analysis, C.H. and J.H.; investigation, C.H.; resources, J.Z.; data curation, C.H.; writing—original draft preparation, C.H.; writing—review and editing, J.Z., J.H. and X.C.; visualization, X.C.; supervision, J.Z.; project administration, C.H.; funding acquisition, J.Z. All authors have read and agreed to the published version of the manuscript.

Funding

This work was supported by the National Natural Science Foundation of China (41676083, 41476077).

Institutional Review Board Statement

Not applicable.

Informed Consent Statement

Not applicable.

Data Availability Statement

Not applicable.

Acknowledgments

We acknowledge the anonymous reviewers for their valuable comments and suggestions.

Conflicts of Interest

The authors declare no conflict of interest.

References

  1. Samoilov. The Theory and Research Method of Estuarine Evolution Process; Science Press: Beijing, China, 1958; pp. 22–30, (In Chinese with English abstract). [Google Scholar]
  2. Asp, N.E.; Schettini, C.A.F.; Siegle, E.; Da Silva, M.S.; De Brito, R.N.R. The dynamics of a frictionally-dominated Amazonian estuary. Braz. J. Oceanogr. 2012, 60, 391–403. [Google Scholar] [CrossRef] [Green Version]
  3. Asp, N.E.; Gomes, V.J.C.; Ogston, A.; Borges, J.C.C.; Nittrouer, C.A. Sediment source, turbidity maximum, and implications for mud exchange between channel and mangroves in an Amazonian estuary. Ocean Dyn. 2016, 66, 285–297. [Google Scholar] [CrossRef]
  4. Asp, N.; Gomes, V.; Schettini, C.; Souza-Filho, P.; Siegle, E.; Ogston, A.; Nittrouer, C.; Silva, J.; Nascimento, W.; Souza, S.; et al. Sediment dynamics of a tropical tide-dominated estuary: Turbidity maximum, mangroves and the role of the Amazon River sediment load. Estuar. Coast. Shelf Sci. 2018, 214, 10–24. [Google Scholar] [CrossRef]
  5. Freitas, P.T.; Asp, N.E.; Souza-Filho, P.W.M.; Nittrouer, C.A.; Ogston, A.S.; da Silva, M.S. Tidal influence on the hydrodynamics and sediment entrapment in a major Amazon River tributary—Lower Tapajós River. J. South Am. Earth Sci. 2017, 79, 189–201. [Google Scholar] [CrossRef]
  6. Zhu, J.; Wu, H.; Li, L. Hydrodynamics of the Changjiang Estuary and Adjacent Seas. In Ecological Continuum from the Changjiang (Yangtze River) Watersheds to the East China Sea Continental Margin; Springer International Publishing: Berlin/Heidelberg, Germany, 2015; pp. 19–45. [Google Scholar]
  7. Shen, H.; Mao, Z.; Zhu, J. Saltwater Intrusion in the Changjiang Estuary; China Ocean: Beijing, China, 2003; (In Chinese with English abstract). [Google Scholar]
  8. Chen, J.; Yun, C.; Xu, H.; Dong, Y. The Developmental Model of the Chang Jiang River Estuary during last 2000 years. Acta Oceanolgla Sin. 1979, 1, 103–111, (In Chinese with English abstract). [Google Scholar]
  9. Xu, P.; Liu, K. Tidal level limit and Tidal Current Limit of the Changjiang River. River 1993, 2, 24–39, (In Chinese with English abstract). [Google Scholar]
  10. Song, L. Research on the Location of Tidal Current Limit of Yantze River. Hydrology 2002, 22, 25–26, (In Chinese with English abstract). [Google Scholar]
  11. Shi, S.; Cheng, H.; Xuan, X.; Hu, F.; Yuan, X.; Jiang, Y.; Zhou, Q. Fluctuations in the tidal level limit of the Yangtze River estuary in the last decade. Sci. China-Earth Sci. 2018, 61, 1136–1147. [Google Scholar] [CrossRef]
  12. Shen, H.; Li, J.; Yan, S. Study the Migration of the Tidal Level Limit and the Tidal Current Limit of the Yangtze River under Its Extreme High and Lower Runoff; Chinese-German Joint Symposium on Hydraulic and Ocean Engineering: Hannover, Germany, 2008; pp. 191–197. [Google Scholar]
  13. Li, J. Tidal Level Limit and Tidal Current Limit & Response to Major Engineering in Yangtze Estuary; East China Normal University: Shanghai, China, 2004; (In Chinese with English abstract). [Google Scholar]
  14. Shen, H.; Zhu, J.; Wu, H. Interface of the Land Ocean Interactions in the Yangtze Coastal Zone; China Ocean Press: Beijing, China, 2008; pp. 40–54, (In Chinese with English abstract). [Google Scholar]
  15. Friedrichs, C.T.; Aubrey, D.G. Tidal propagation in strongly convergent channels. J. Geophys. Res. 1994, 99, 3321–3336. [Google Scholar] [CrossRef]
  16. Unnikrishnan, A.; Shetye, S.; Gouveia, A. Tidal Propagation in the Mandovi–Zuari Estuarine Network, West Coast of India: Impact of Freshwater Influx. Estuar. Coast. Shelf Sci. 1997, 45, 737–744. [Google Scholar] [CrossRef]
  17. Godin, G. The Propagation of Tides up Rivers with Special Considerations on the Upper Saint Lawrence River. Estuar. Coast. Shelf Sci. 1999, 48, 307–324. [Google Scholar] [CrossRef]
  18. Lu, C. The Tidal Wave Dissemination in the Yangtze Estuary; Nanjing Hydraulic Research Institude: Nanjing, China, 2009; (In Chinese with English abstract). [Google Scholar]
  19. Xu, H.; Fan, L.; Gu, M. On Tidal Mark and Tidal Current Mark in the Yangtze River; Port & Waterway Engineering: Chengdu, China, 2012; pp. 15–20, (In Chinese with English abstract). [Google Scholar]
  20. Lu, C.; Luo, X.; Chen, Z. Study of current limit causing by runoff and tidal range in Yantze River. Eng. J. Wuhan Univ. 2016, 49, 201–205, (In Chinese with English abstract). [Google Scholar]
  21. Blumberg, A.F. A Primer for ECOM-si; Technical Report; HydroQual, Inc.: Mahwah, NJ, USA, 1994; p. 66. [Google Scholar]
  22. Wu, H.; Zhu, J.; Choi, B.H. Links between saltwater intrusion and subtidal circulation in the Changjiang Estuary: A model-guided study. Cont. Shelf Res. 2010, 30, 1891–1905. [Google Scholar] [CrossRef]
  23. Li, L.; Zhu, J.; Wu, H. Impacts of wind stress on saltwater intrusion in the Yangtze Estuary. Sci. China Earth Sci. 2012, 55, 1178–1192. [Google Scholar] [CrossRef]
  24. Qiu, C.; Zhu, J.; Gu, Y. Impact of seasonal tide variation on saltwater intrusion in the Changjiang River estuary. Chin. J. Oceanol. Limnol. 2012, 30, 342–351. [Google Scholar] [CrossRef]
  25. Qiu, C.; Zhu, J. Assessing the Influence of Sea Level Rise on Salt Transport Processes and Estuarine Circulation in the Changjiang River Estuary. J. Coast. Res. 2015, 313, 661–670. [Google Scholar] [CrossRef]
  26. Lyu, H.; Zhu, J. Impact of the bottom drag coefficient on saltwater intrusion in the extremely shallow estuary. J. Hydrol. 2018, 557, 838–850. [Google Scholar] [CrossRef]
  27. Arakawa, A.; Lamb, V.R. Computational Design of the Basic Dynamical Processes of the UCLA General Circulation Model. Methods Comput. Phys. Adv. Res. Appl. 1977, 17, 173–265. [Google Scholar] [CrossRef]
  28. Casulli, V. Semi-implicit finite difference methods for the two-dimensional shallow water equations. J. Comput. Phys. 1990, 86, 56–74. [Google Scholar] [CrossRef]
  29. Smagorinsky, J. General circulation experiments with the primitive equations: I. The basic experiment. Mon. Weather Rev. 1963, 91, 99–164. [Google Scholar] [CrossRef]
  30. Mellor, G.L.; Yamada, T. A hierarchy of turbulence closure models for planetary boundary layers. J. Atmos. Sci. 1974, 31, 1791–1806. [Google Scholar] [CrossRef] [Green Version]
  31. Mellor, G.L.; Yamada, T. Development of a turbulence closure model for geophysical fluid problems. Rev. Geophys. 1982, 20, 851–875. [Google Scholar] [CrossRef] [Green Version]
  32. Wu, H.; Zhu, J. Advection scheme with 3rd high-order spatial interpolation at the middle temporal level and its application to saltwater intrusion in the Changjiang Estuary. Ocean Model. 2010, 33, 33–51. [Google Scholar] [CrossRef]
  33. Editorial Board for Marine Atlas, Ocean Atlas in Huanghai Sea and East China Sea (Hydrology); China Ocean Press: Beijing, China, 1992.
Figure 1. Map of the lower reaches of the Changjiang River from Jiujiang to the river mouth.
Jmse 09 01291 g001
Figure 2. Model domain and grid (a), enlarged views of the model grid at the bifurcation between the North Branch and South Branch (b) and in the river near Wuhu (c).
Jmse 09 01291 g002
Figure 3. Temporal variation in the water level at the hydrological stations in the lower reaches of the Changjiang River. The red dots are the measured values and the black lines are the modeled values.
Jmse 09 01291 g003
Figure 4. Instantaneous surface current field near Jiangyin in the case of river discharge of 48,161 m 3 / s . The red line represents the tidal current limit.
Jmse 09 01291 g004
Figure 5. Relationship between the tidal current limit and the river discharge in the Changjiang River’s estuary in the flood season.
Jmse 09 01291 g005
Figure 6. Tidal current limits under various guarantee rates of river discharge in the Changjiang River’s estuary in the flood season. The locations of sections 1–11 are the tidal current limits corresponding to the guarantee rates of 5–95% of river discharge.
Jmse 09 01291 g006
Figure 7. Relationship between the tidal current limit and the river discharge in the Changjiang River’s estuary in the dry season.
Jmse 09 01291 g007
Figure 8. Tidal current limits under various guarantee rates of river discharge in the Changjiang River’s estuary in the dry season. The locations of sections 1–11 are the tidal current limits corresponding to the guarantee rates of 5–95% of river discharge.
Jmse 09 01291 g008
Figure 9. Relationship between the tidal level limit and river discharge in the Changjiang River’s estuary during the flood season.
Jmse 09 01291 g009
Figure 10. Tidal level limits under various guarantee rates of river discharge in the Changjiang River’s estuary in the flood season. The locations of sections 1–11 are the tidal current limits corresponding to the guarantee rates of 5–95% of river discharge.
Jmse 09 01291 g010
Figure 11. Relationship between the tidal level limit and river discharge in the Changjiang River’s estuary in the dry season.
Jmse 09 01291 g011
Figure 12. Tidal level limits under various guarantee rates of river discharge in the Changjiang River’s estuary in the dry season. The locations of sections 1–11 are the tidal level limits corresponding to the guarantee rates of 5–95% of river discharge.
Jmse 09 01291 g012
Table 1. Frequency analysis of river discharge at the Datong hydrologic station in January and July (unit of river discharge, m3/s).
Frequency (%)510203040506070809095
January16,84215,06513,20912,06311,20610,50398889323877681967852
July69,76564,23858,13154,11550,93248,16145,58043,02440,29236,94734,551
Publisher’s Note: MDPI stays neutral with regard to jurisdictional claims in published maps and institutional affiliations.

