1. Introduction
An aircraft carrier’s flight deck must be able to withstand loads caused by the repeated take-off and landing of aircraft. The deflection and the stress and strain must be considered when designing this type of deck structure. Not only must the downward loads of the aircraft be considered, but also the forces caused by the vertical acceleration of the ship. These two factors combined increase the load on the deck compared to that of aircraft landing on a stationary deck.
HMS
Queen Elizabeth is the 39th Royal Navy (RN) aircraft carrier commissioned, the first being HMS
Argus, which was converted from an ocean liner,
Conte Rosso, and commissioned in 1918. There is some dispute over which ship holds the title of the first purpose-built aircraft carrier. The first laid down was HMS
Hermes in 1919, shortly followed in 1920 by
Hōshō of the Imperial Japanese Navy (IJN), which was commissioned two years before HMS
Hermes. However, HMS
Ark Royal (91) was the first ship where the flight deck and hangars were structurally integral to the hull, rather than being added on later or making up part of the superstructure. She was commissioned in 1937 and all future aircraft carriers were based on this design [
1]. The first jet Vertical/Short Take-Off and Landing (VSTOL) operation from a ship at sea was on February 8th, 1963. Alfred William ‘Bill’ Bedford flew a Hawker P1127 ‘jump jet’ from the deck of HMS
Ark Royal (R09) [
2]. HMS
Queen Elizabeth was commissioned in 2017 and became the fleet flagship of the Royal Navy in 2021. She can carry up to 50 aircraft; at present, these are the Lockheed Martin F-35B Lightnings. Before the design was finalised, the F-35C was considered, but since it is not a VSTOL aircraft, a catapult would have been required in order to launch the planes. The ship was subsequently designed and built specifically to take the F-35B, allowing the flight deck to remain clear of catapults and arresting gear. This influenced the deck design and material choice, as a ski-jump was required in order to aid short take-off.
Jackson and Frieze [
3] carried out a significant research work with the aim of taking data from the experiments and comparing these to numerical analysis to confirm the accuracy and consistency of the methods. From this, data could be extrapolated beyond the recorded experimental results with reasonable confidence. Following on from the work of Clarkson [
4], Jackson and Frieze [
3] used similar analysis methods but studied the effects of patch loading cases rather than uniform pressure cases. They chose not to use a rectangular rubber block to represent a tyre load, as used normally in various patch load tests, because at high loads this could cause the force to be applied through the edge of the block. Instead, Jackson and Frieze [
3] used a group of semi-spheres through which to distribute the force. The results of their experimental comparisons to the true distribution of forces through a tyre onto the deck showed that the semi-spheres were a better representation than the rectangular block, particularly for ‘ultimate’ or ‘emergency’ landing cases.
A research work carried out by Mascia [
5] focused on the vertical landing of a Boeing AV-8B Harrier II fixed wing VSTOL aircraft. The paper examined three different landing modes: three-point landing with all the wheels touching down at the same time; tail down landing, where the nose wheel touches down after the main and outrigger landing gear; and tail down rolling landing, where the main and outrigger landing gear still touch down first, but out of phase due to the roll effect. Similar to the Harrier, the F-35Bs are VSTOL aircraft, meaning that they can land and take-off vertically, requiring little to no runway. This makes them perfect for the limited space on an aircraft carrier. The Harriers land by turning off their engines just before touching down, leading to a free fall from a short height above the deck. These three scenarios were assumed to have the same vertical velocity, so that the effects of the landing modes could be compared. This velocity was taken as the maximum allowable free-fall velocity for an emergency condition. This means that the forces from the jets or fans were not taken into consideration since they are not relevant at the time of touch down. However, the F-35B does not free fall; therefore, the weight of the aircraft is transferred from the jet and fan footprint to the wheel footprint as the aircraft touches down. The F-35B also differs from the Harrier as it does not have outrigger landing gear. In order to accommodate heavier payloads and to reserve fuel, the F-35Bs on the Queen Elizabeth-class (QEC) carriers utilise a short rolling take-off instead of a vertical take-off. Using the ski-jump at the bow of the ship and angling their jets and fans down to increase lift, the aircraft can take off over a very short distance at a larger maximum take-off mass (MTOM). The angle of the ski-jump is 12.5 degrees. It is worth mentioning that Mascia’s paper investigated only the landing forces of the aircraft.
HMS
Queen Elizabeth is a relatively new ship which operates unique aircraft. Studies comparable to that undertaken by Mascia for the Harrier [
5] are limited for this new pairing of aircraft and aircraft carrier. This present study aims to provide an initial investigation of the interaction between these new technological advances, and to provide recommendations for further research on this subject.
In this present work, the principles of structural mechanics and rule-based empirical formulae were applied to assess the failure behaviours of a critical region of a strength deck structure subjected to variable loads. Critical structure means a structure that involves several structural items with different physical and geometrical properties. In this study, the critical structure was the flight deck of a naval aircraft carrier. Three types of loading conditions were considered. The first was concentrated loading, for example, an aircraft landing. The second was distributed load (e.g., the weight of the aircraft resting on its fuselage). The third was variable load, for example, the aircraft rolling over the deck. Both strain and stress on the deck structure were analysed in varying loading scenarios as well as scantlings, and a failure criterion was established. Structural deflection was also analysed. The perpendicular components of the downward forces of the wheels, fan and jets were used when modelling the effects on the plate. Rectangular pressures were applied to represent the tyre for performing the finite element analysis (FEA) in this paper to comply with classification body regulations.
The classification rules determine the mass distribution between the wheels, the plate thickness, the spacings of the stiffeners, and the amplification factors for various scenarios. Projects have been undertaken to develop common class rules across classification bodies [
6]. The present study analyses the variations among classification body regulations, highlighting the differences in methodology and the resulting variance in behaviour of the designed structures.
2. Materials and Methods
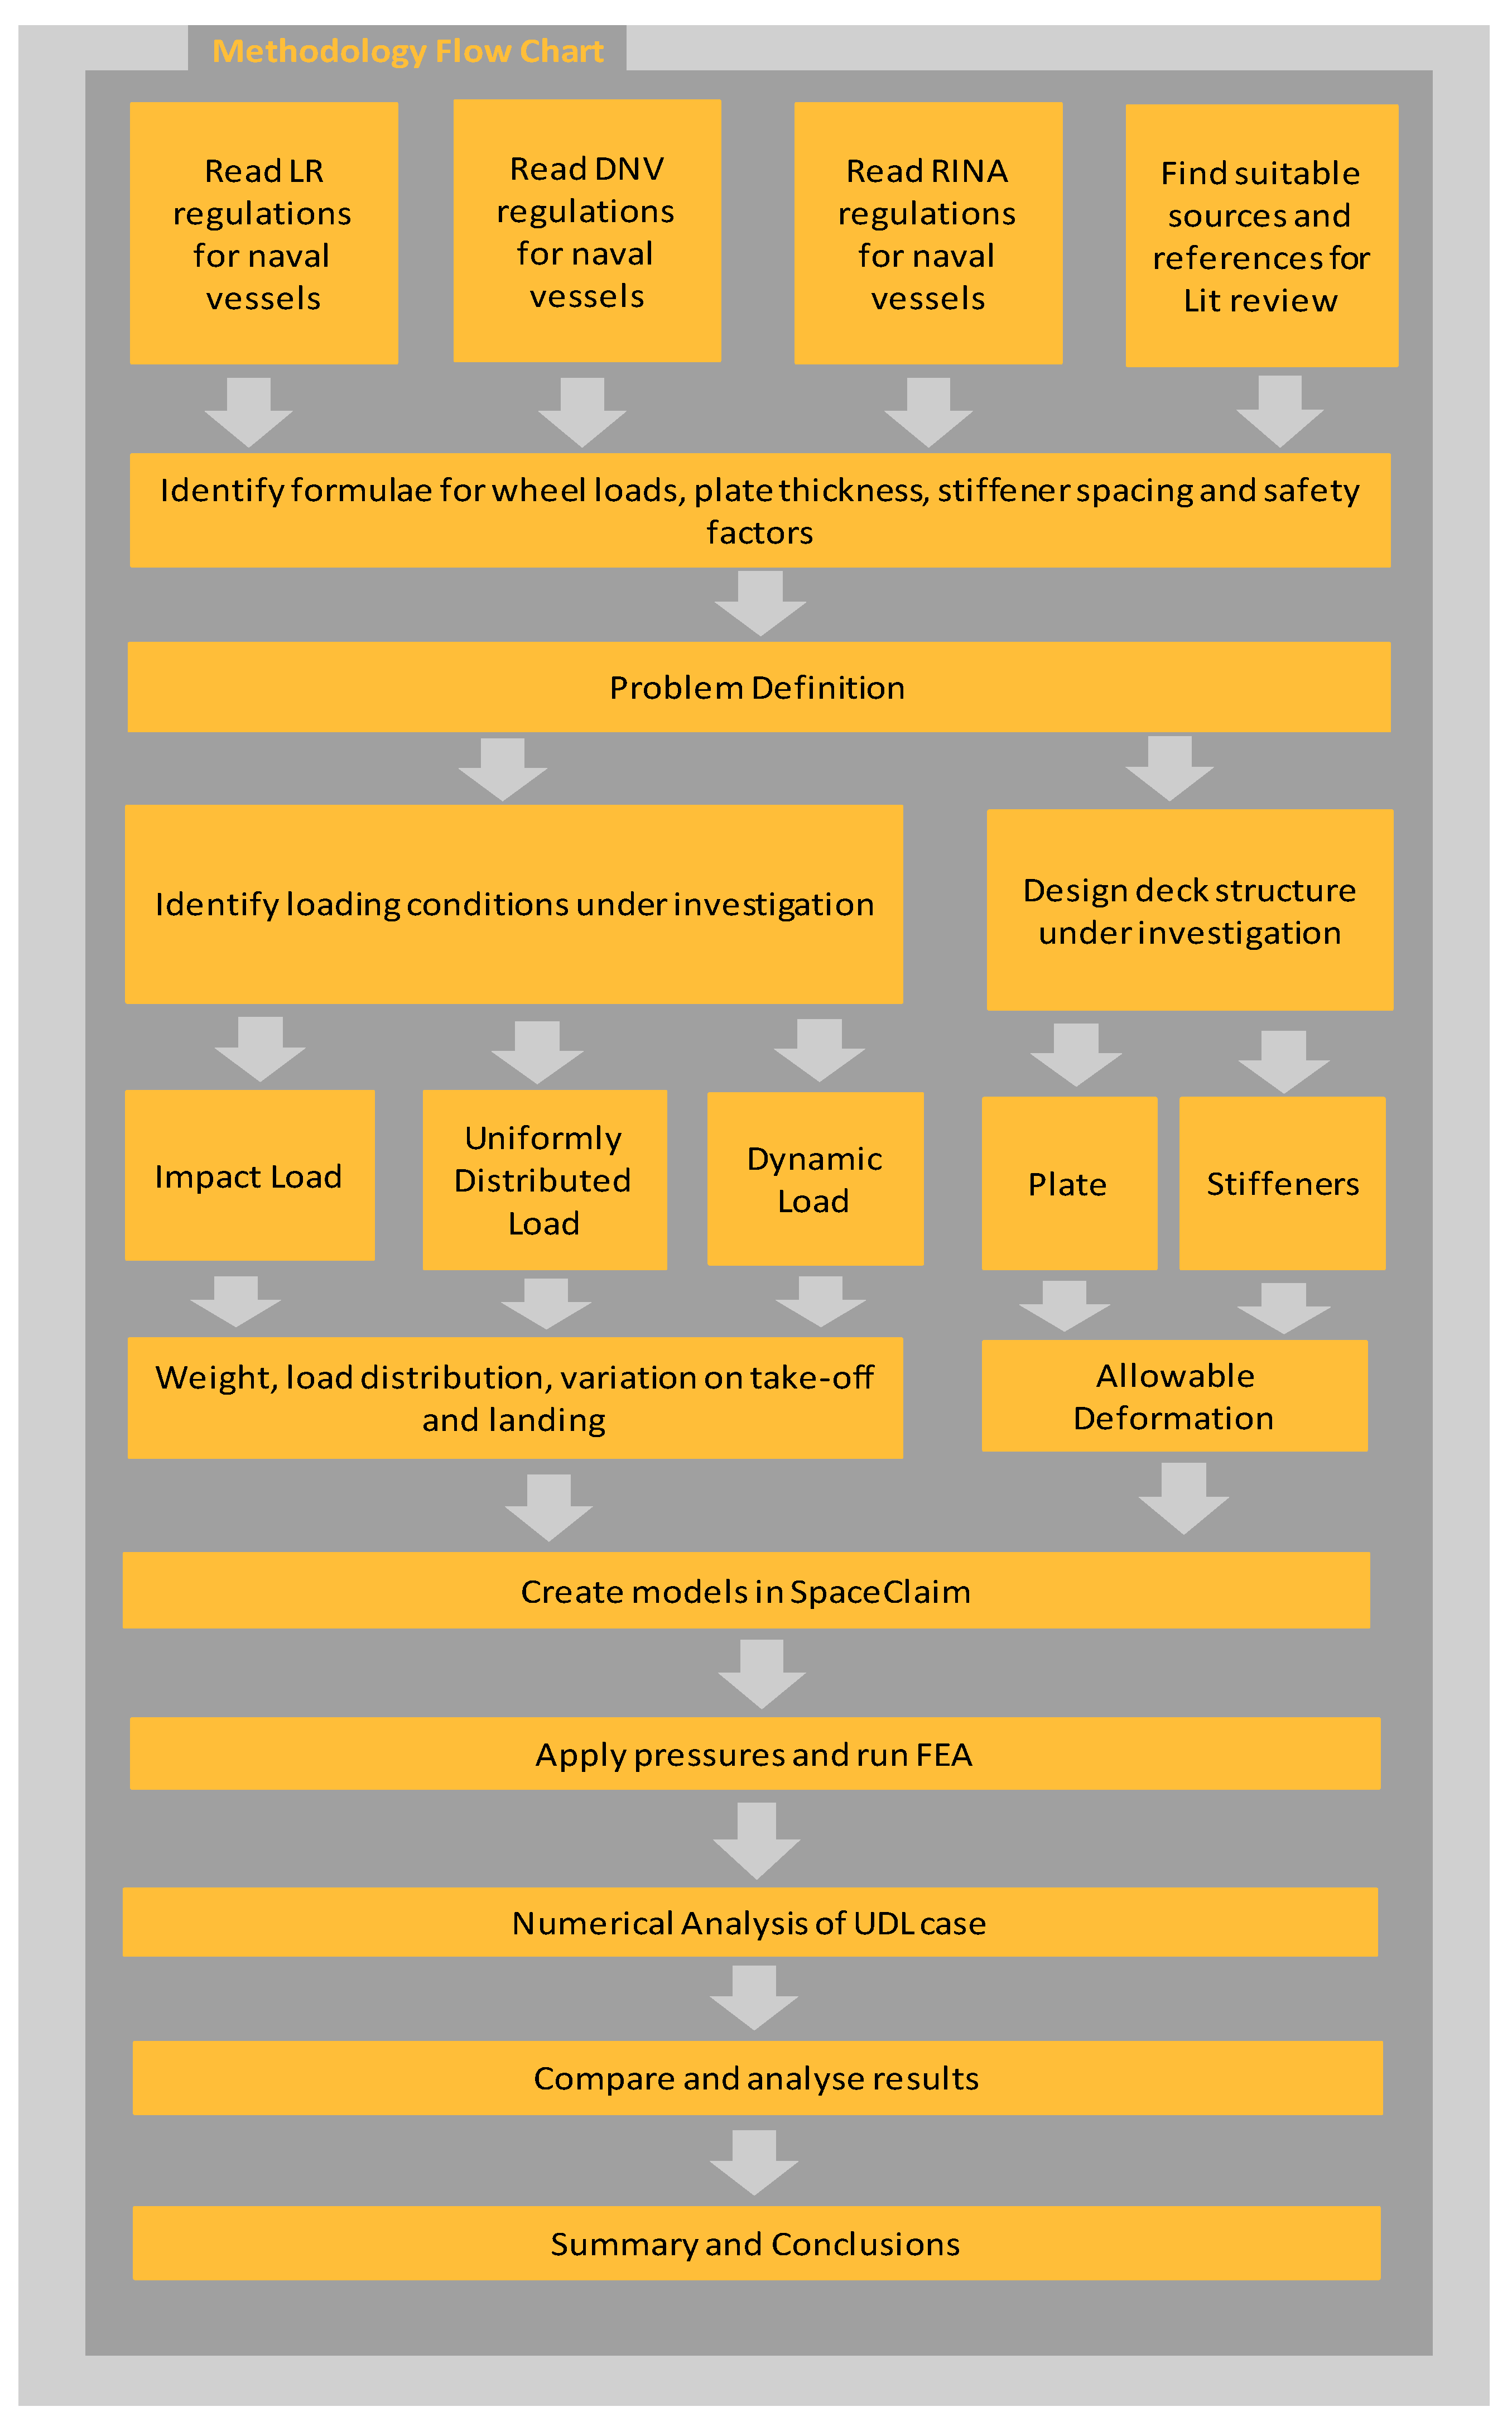
The paper investigated the behaviour of a flight deck under different loading situations, applying analytical methods and finite element analysis technique. The methodology used is shown in
Figure 1.
The loading conditions under investigation were based on the F-35B Lightning aircraft, used on United States Navy (USN) and RN aircraft carriers. The B variant of the F-35 is a VSTOL aircraft, meaning that it can take-off and land vertically by redirecting its main and auxiliary jets. Therefore, the three loading conditions investigated were: (1) vertical landing (impact load); (2) landing gear failing to deploy, which was modelled as uniformly distributed load (UDL) along the fuselage of the aircraft; and (3) rolling take-off (dynamic load). The deck loading varies during transfer from a parked position to the aircraft being fully airborne during the take-off process. Calculations were based on 50% wheel loading and 50% weight supported by jet thrust. This was assumed at the transition point from the horizontal deck to the ski-jump.
This present study built on the analysis methods of Mascia [
5]. The Harrier is a lighter aircraft, with an MTOM of approximately 9.4 tonnes to the F-35B’s 27 tonnes.
Analytical methods and numerical analysis (NA) using SpaceClaim [
7] CAD modeler and ANSYS Workbench [
8] FEA were used to model the failure behaviours of the flight deck. Minimum deck plate thickness and stiffener spacing were calculated using empirical formulae. This information was then used to create the deck geometries used in the FEA. The impact loading and dynamic loading cases were modelled using FEA alone, while the UDL cases were analysed using empirical formulae and compared with FEA results. The governing equations used in the FEA can be found in the ANSYS theory manual [
9,
10].
The total deflection of a section of plate and stiffeners was investigated for each of the loading scenarios and the results were compared to evaluate the consistency of the regulations set out by the different classification societies.
Equivalent (von Mises) stress and elastic (von Mises) strain were also analysed to determine the extent of permanent deformation in the plate and/or stiffeners (where the yield stress was exceeded). Linear elastic analysis was used in this investigation to determine the maximum stress values. A recommended area for further research would be to investigate the effects of cyclic loading in order to compare the maximum strength to the material fatigue strength. Permanent deformation in the flight deck could be extremely dangerous, not only because it compromises the structural integrity of the deck structure, but also because depressions in the deck could cause loss of control of an aircraft.
McPherson [
11] identified the various steel grades used in the construction of the QEC carriers. The majority of the body is constructed from LR DH36 grade steel, but the hangar deck and the flight deck are made of a higher strength steel, including the tee bars and offset bulb plates. In 2007, Tata Steel developed three new grades of steel [
12], including EH46, which was the chosen material for the flight and hangar decks [
11]. Lloyd’s Register-approved thermomechanically controlled processed (TMCP) steel has a yield strength of 460 MPa and an ultimate tensile strength (UTS) between 570 MPa and 720 MPa [
13]. The equivalent grades for Det Norske Veritas Germanischer Lloyd (DNV) and Registro Italiano Navale (RINA) are NV E460 and RI/E460, respectively. The material used in the present study for FEA was, therefore, annealed carbon steel 1340, which has a yield strength of 435 MPa and a UTS of 699 MPa [
14]. This falls within the range of the EH46 steel and is the most representative material.
2.1. Deck Structure
Lloyd’s Register (LR) recommends that NS1 and NS2 ships should be constructed using longitudinal framing in the bottom shell, decks and inner bottom and transverse or longitudinal framing in the side shell and longitudinal bulkheads [
15]. LR defines NS1 as a category comprising ships used for the deployment of aircraft or equipment and ships that may be used as centres of command, such as aircraft carriers, helicopter and amphibious support ships and assault ships. LR also recommends that the aircraft deck stiffening should be designed for the load cases by positioning the aircraft in such a way that the most severe loading condition for each structural member under consideration is achieved [
16]. Therefore, the deck structure considered in the present study was designed as a straight deck (i.e., no camber) with longitudinal framing according to the guidelines provided by LR. The deck section under investigation for impact and dynamic loading had dimensions of 11,500 mm × 11,500 mm based on LR regulations [
16]. The UDL deck sections had dimensions of 6696 mm × 700 mm and 6696 mm × 1200 mm based on the minimum and maximum stiffener spacings investigated.
The models studied in this paper were used as a base structure only, and did not take into consideration the reaction forces of any bulkheads which may have been in place under the deck; therefore, the results calculated were not accurately representative of a real flight deck section, but were considered suitable for comparison. The decision to use a simplified deck structure was made because the purpose of the investigation was comparison and not absolute values, and the position of bulkheads would depend predominantly on the layout of the deck below. As their positioning is subject to great variation, and more detailed plans of the QEC carriers would be required, bulkhead forces were not included in any of the models discussed in this paper. This is an area recommended for further research.
2.2. Loading Condition
The aircraft used in this study was an F-35B. Landing gear arrangement and take-off weight were given by the manufacturers, Lockheed Martin [
17]. The dimensions and positions of landing gear and jet and fan footprints were taken from a 1:72 scale model of the F-35B produced by Italeri [
18]. LR recommends that the loading distribution should be taken as 50-50 between the wheels of the main landing gear, ignoring any nose wheels or outriggers. DNV does not provide any loading information on this point. Therefore, in the present study, assumptions were made that weight was distributed equally between the three wheels. RINA suggests that the loading distribution should be taken as 40-50-10 between nose, main and outrigger landing gears respectively. The F-35B has no outriggers, so the assumption was made that the 10% was shared between the two wheels of the main landing gear, making the loading ratio 40-60 between nose and main landing gear.
2.3. Deck Plate Thickness
The thickness of the flight deck varies depending on the number of stiffeners used to construct it. The thickness of the deck plate considered in the current study was calculated based on the empirical formula given in the rules and regulations from LR [
16], DNV [
19], and RINA [
20]. According to the LR regulations, the landing reaction factor, λ, was taken as the average value for a Marinised VSTOL aircraft. Values of the thickness coefficient, α, were determined using interpolation from the chart provided in Lloyd’s rules. This also sets out the amplification factors, f, for four conditions: the first is the landing or parked aircraft, with a value of 0.6. The second and third are emergency conditions: f = 1 for general emergency conditions and f = 1.15 for emergency landings on a deck above a vulnerable space. LR categorises a vulnerable space as landing decks over magazines or permanently manned spaces, e.g., deckhouses, bridges, control rooms, etc. The fourth, for aircraft taking off, is f = 2.65. All emergency and take-off calculations were performed for 0.4L amidships with a multiplication factor of 1.18. DNV regulations [
19] give amplification factors for three conditions as 6.0 for emergency conditions, 3.0 for normal impact landing conditions and 1.5 for take-off conditions. RINA regulations [
20] do not specify amplification factors for landing loads. Based on Mascia’s work [
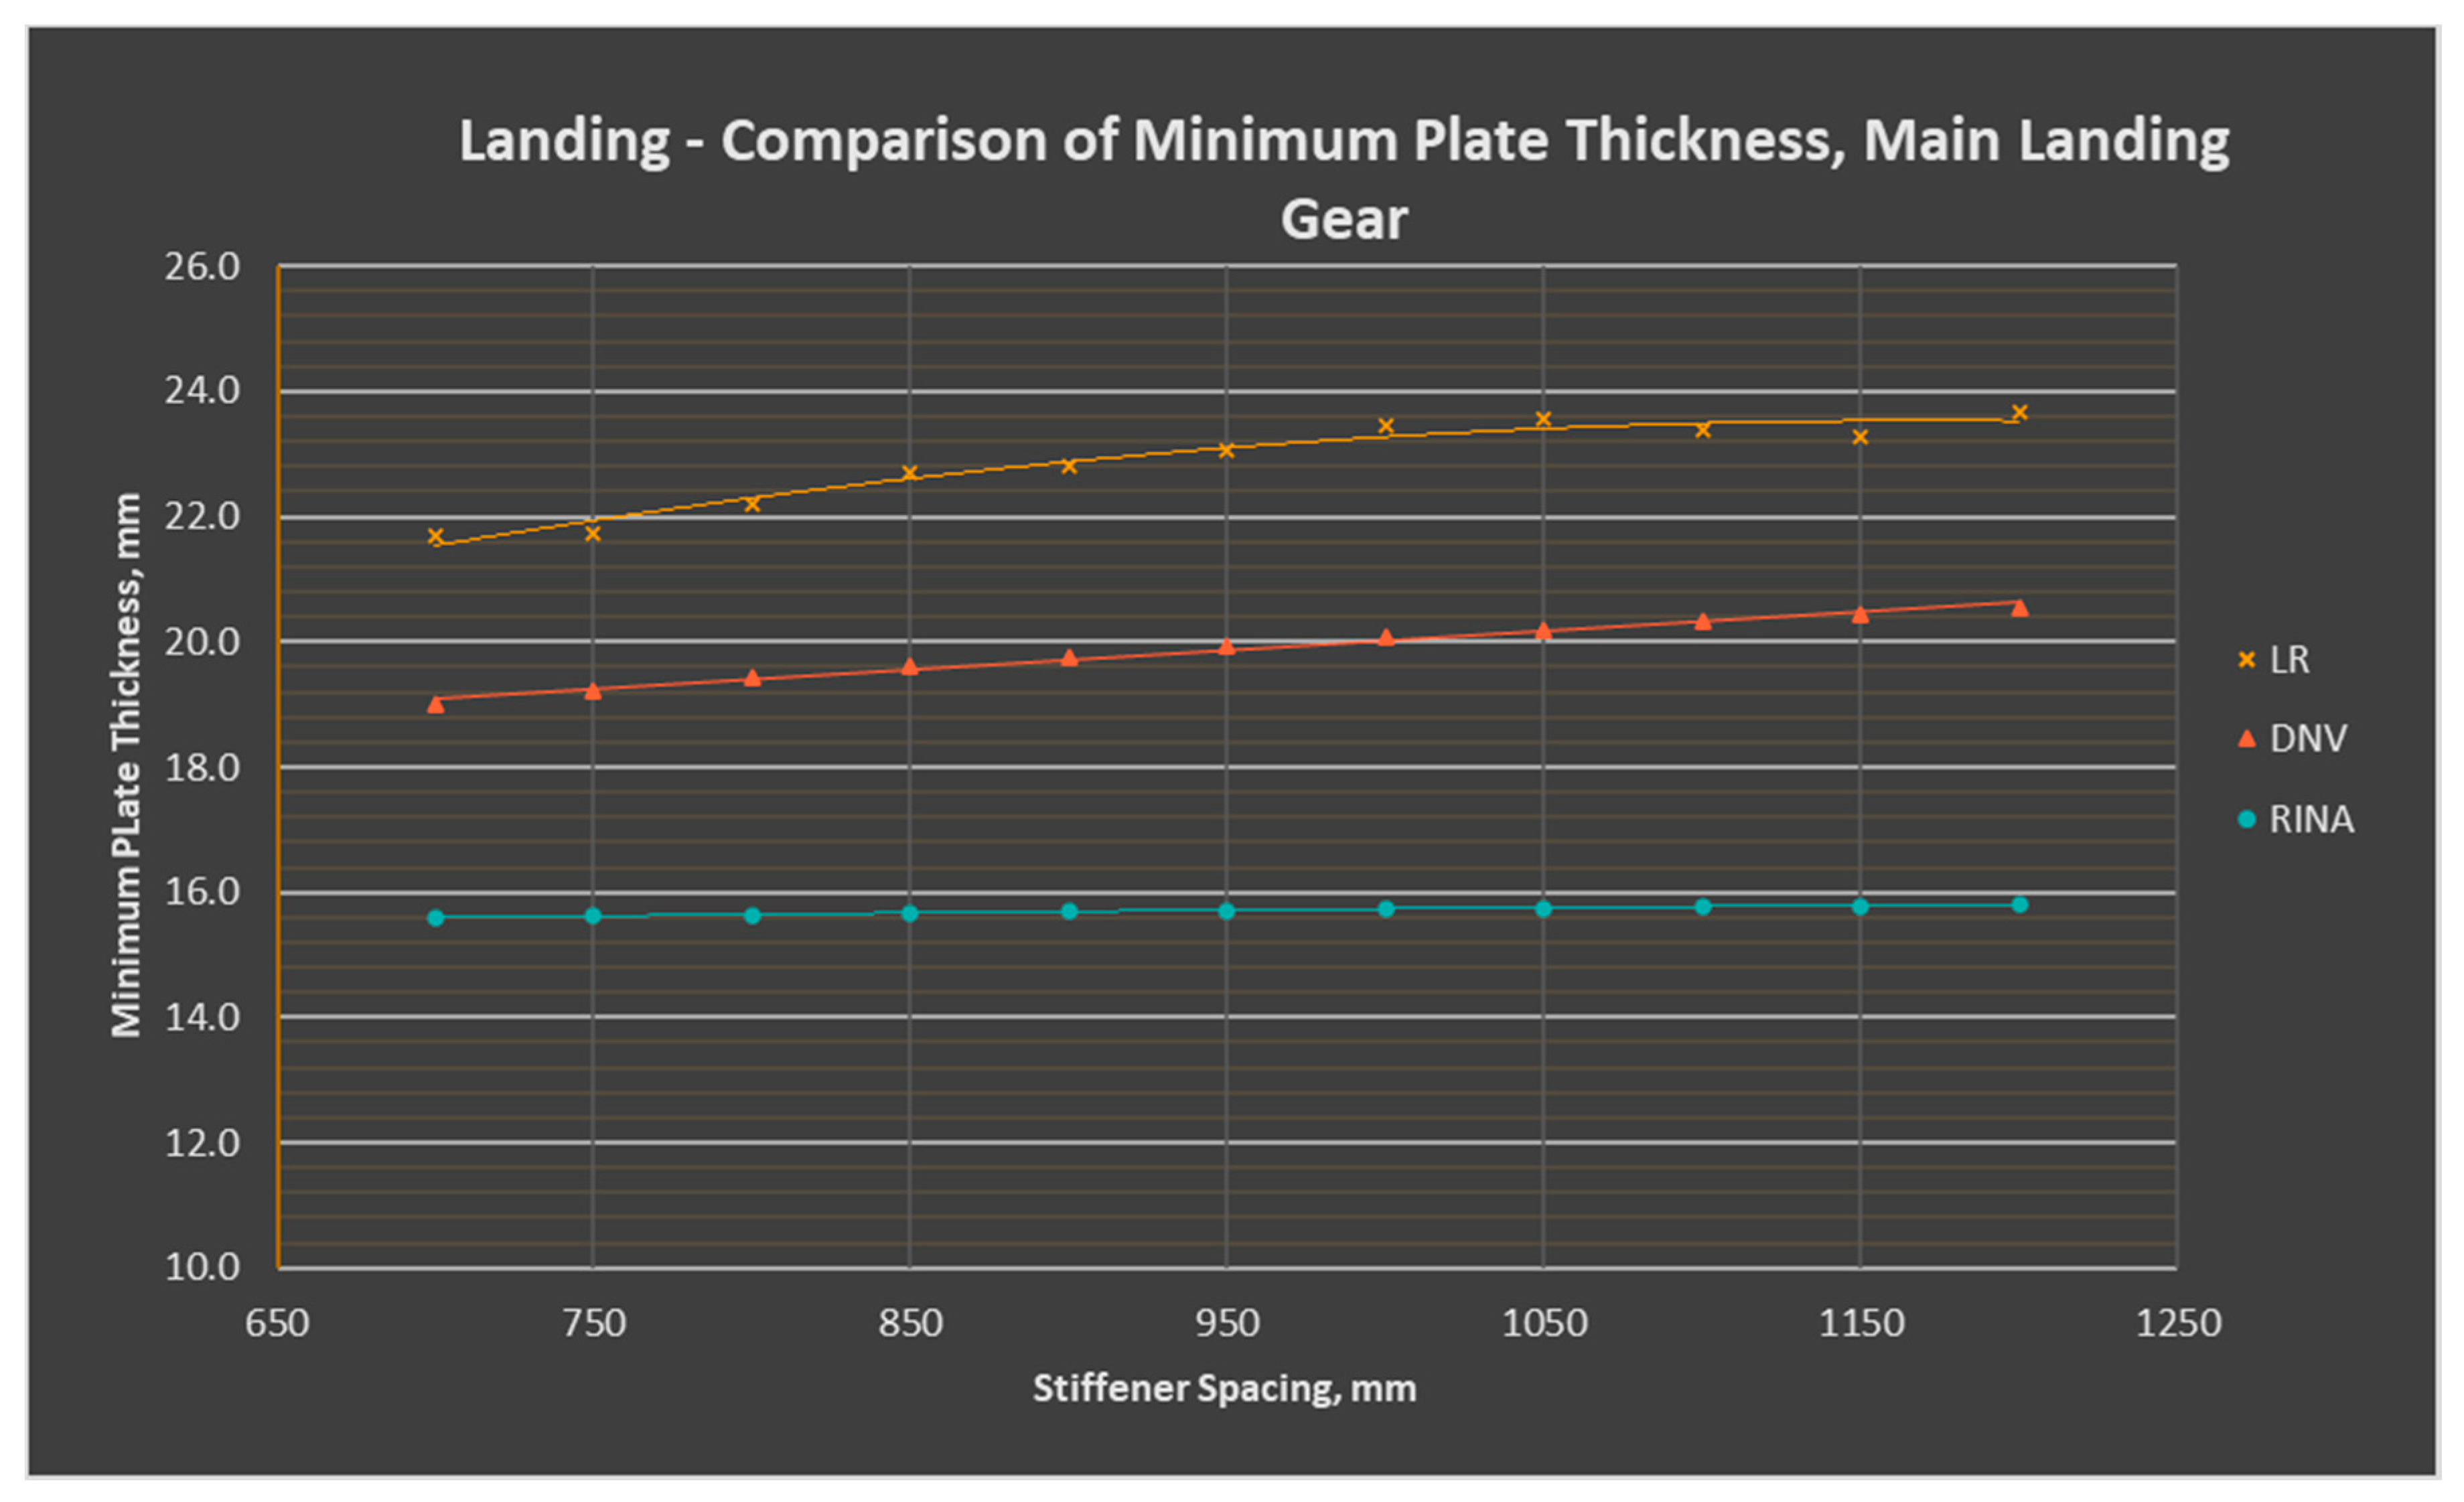
5], the amplification factors were assumed as 1.0 for normal landing conditions, 1.0 for take-off conditions and 2.4 for emergency landing conditions. It is interesting to note that LR gives the equations for calculating the vertical acceleration of the ship in certain sea states; however, this value is not used in the calculation of the required deck thickness. DNV and RINA both consider the vertical acceleration from the heave, pitch, and roll movement of the ship. This vertical acceleration increases the force on the deck as the aircraft lands.
Figure 2 shows that the LR formulae gave the highest minimum plate thickness at all stiffener spacings. However, it should be noted that the LR weight distribution ratio gives a significantly higher percentage of all up weight (W
auw) taken by each main wheel (50%) than DNV (33%) or RINA (30%). When W
auw was 50% for DNV, the minimum plate thickness increased to a range of 23.292 mm to 25.184 mm. This suggests the weight distribution figures specified by the classification bodies drove the significant variations in deck thickness.
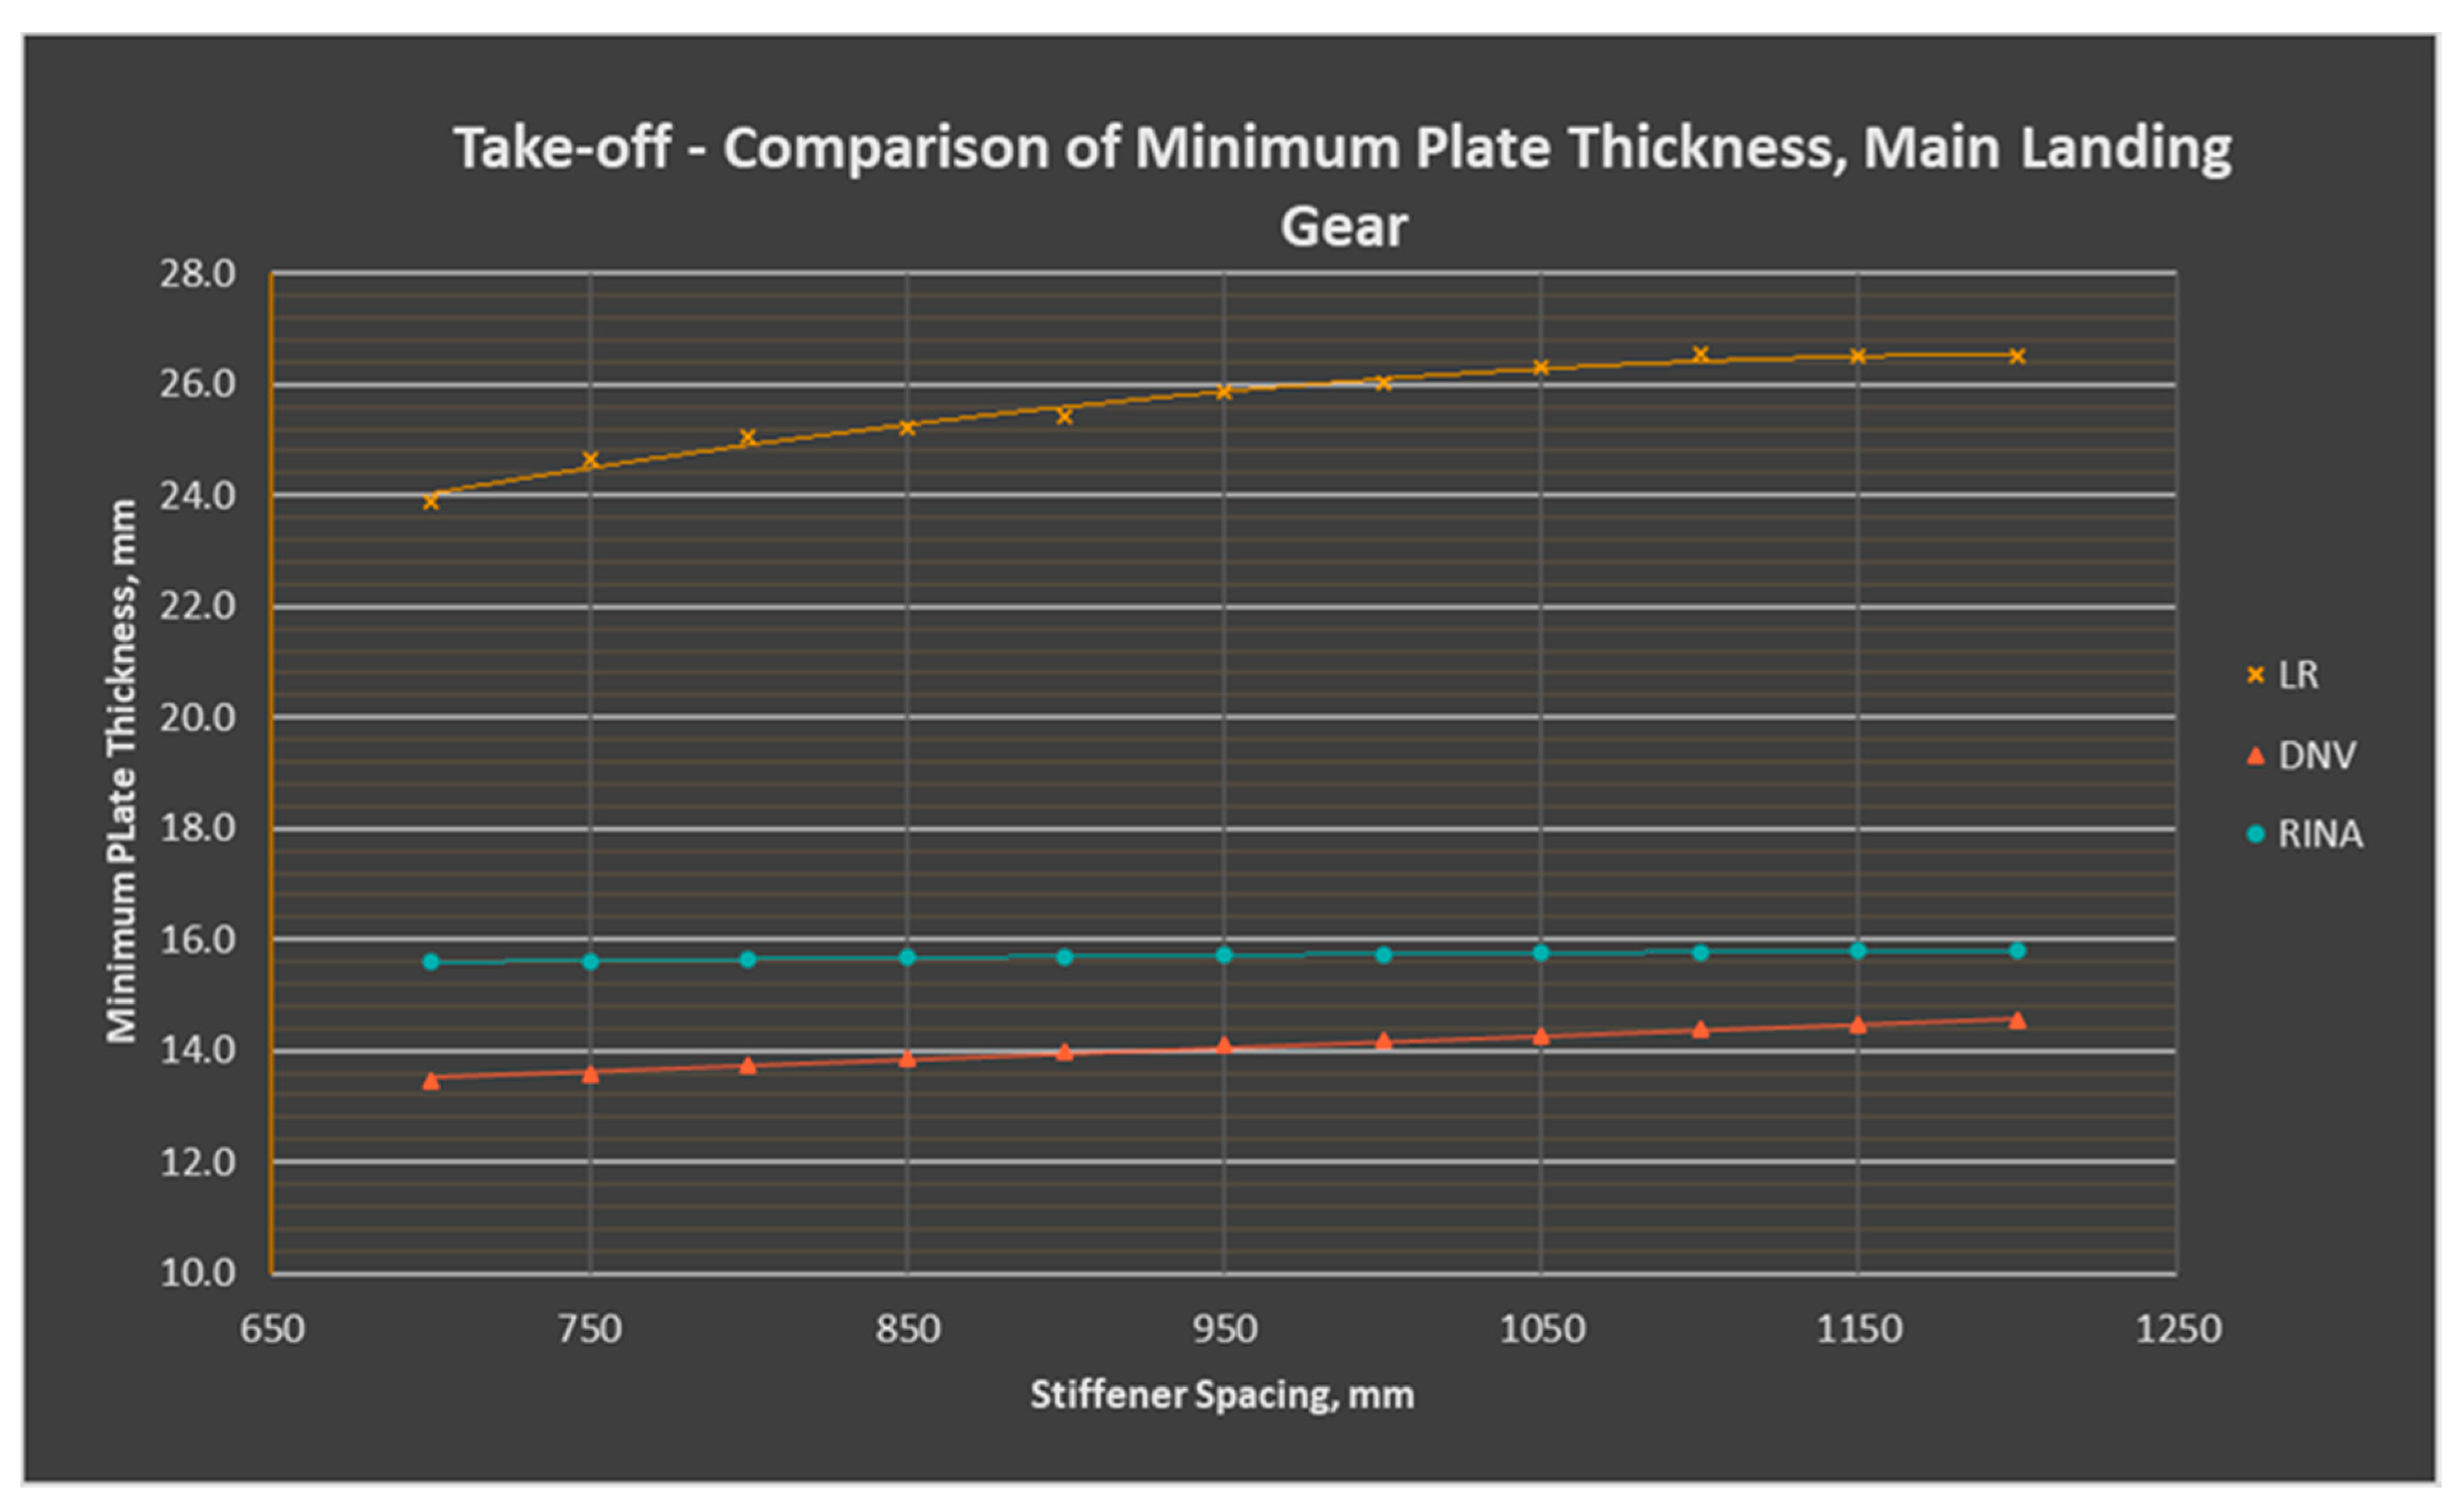
In
Figure 3, LR values were also higher than DNV or RINA. The average LR value was 182% of the mean DNV value, and 160% of the mean RINA value. Even using 50% W
auw, giving an average thickness of 17.21 mm for DNV, this still led LR to be 49% larger. This could be explained by the larger amplification force used by LR than either of the other classification bodies. LR specifies 2.65 should be used, while RINA gives 1.0 and DNV gives 1.5.
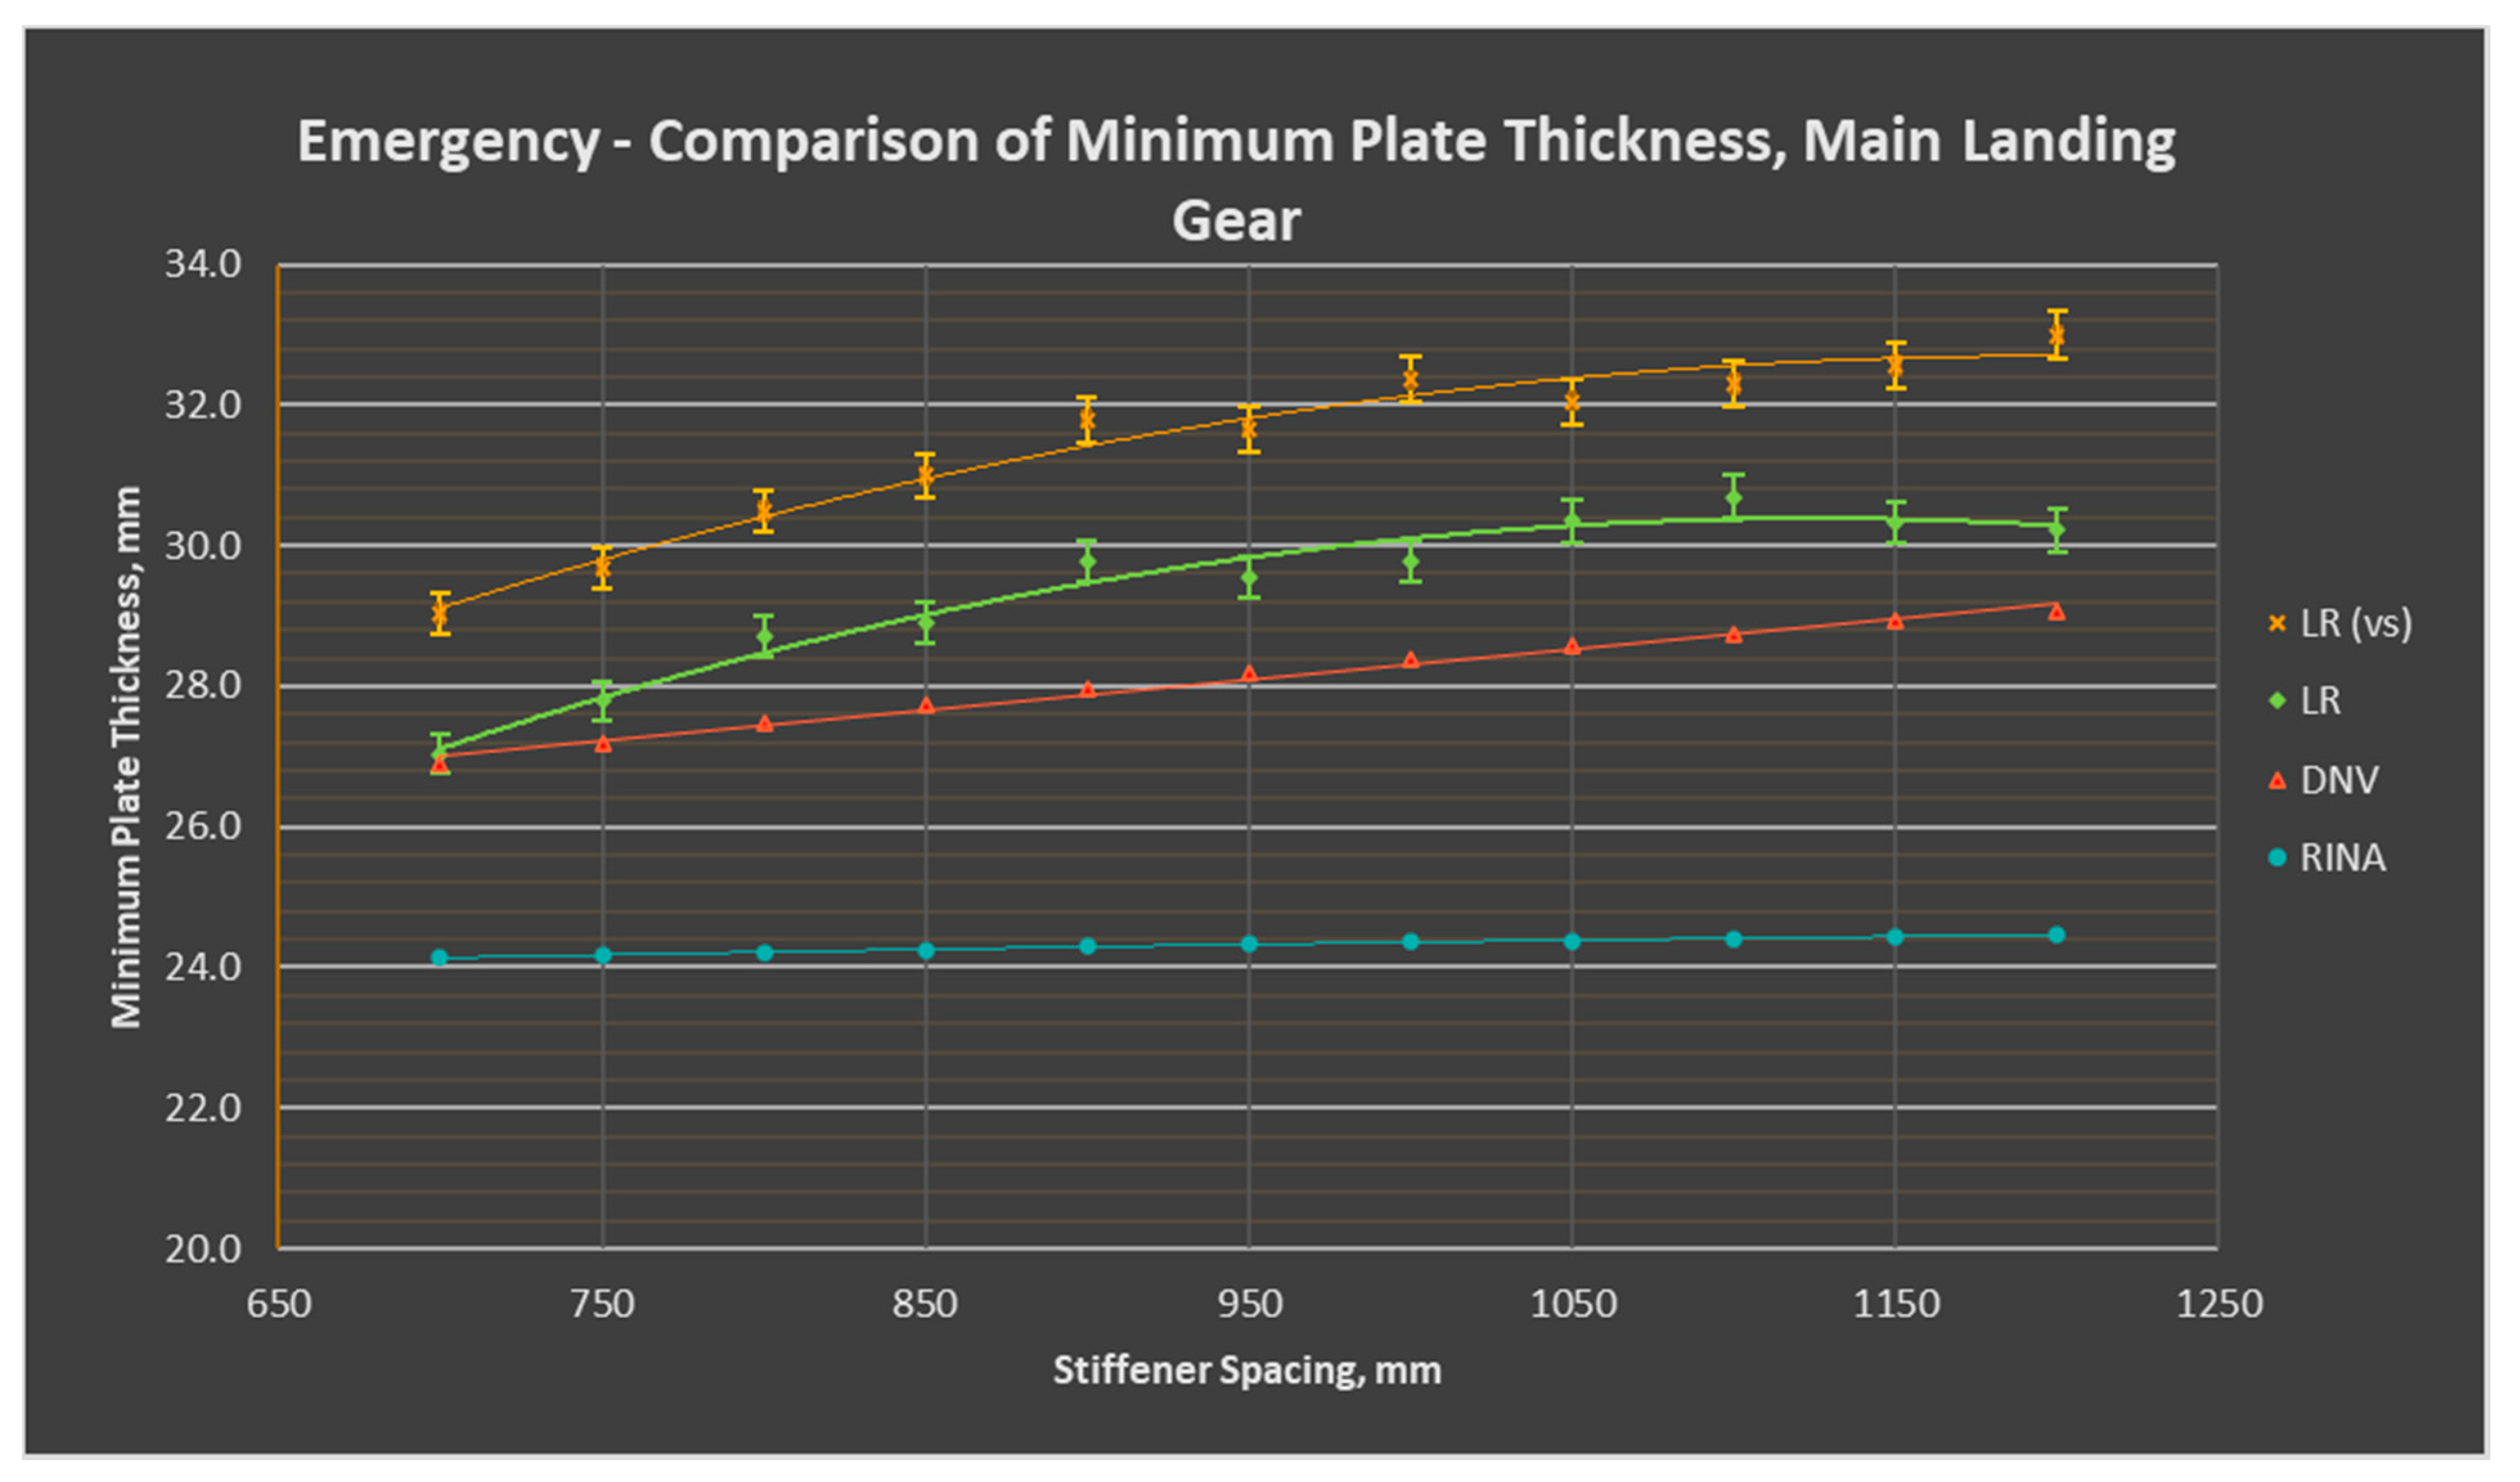
Under emergency conditions, datasets were more closely grouped than under take-off conditions. See
Figure 4. As in
Figure 2 and
Figure 3, RINA showed very little variation against stiffener spacing. In the emergency case, the range in plate thickness was only 0.264 mm. As in the take-off and landing conditions, DNV followed a squared relationship with stiffener spacing. Both LR cases showed a weaker correlation than either RINA or DNV. The gradient of the values appeared to decrease as stiffener spacing increased, but the results were too scattered to obtain a conclusive analysis. It should be noted there may be inaccuracies in the LR results due to imprecise reading of the tyre print chart provided in LR rules, as this was subject to interpretation rather than being a numerical equation. This variation was captured using error bars. It can be seen that the results follow the trendline within 1% relative error.
At larger stiffener spacings, LR cases gave the greatest plate thickness. However, as with normal landing conditions, when DNV and RINA were calculated with 50% W
auw, this changed. The new DNV values ranged from 32.940 mm to 35.616 mm, and RINA values ranged from 30.180 mm to 31.608 mm. Again, this suggests that the thickness values had less to do with the equations and were much more dependent on the weight distribution specified by the classification bodies.
Table 1 is a summary table of the maximum and minimum deck plate thicknesses, in mm. The column s:t represents the highest stiffener spacing to deck thickness ratio, which was expected to give the greatest deformation.
2.4. Deck Plate Configuration
The strength deck structure under consideration was a straight deck (i.e., no camber) which was longitudinally framed. The stiffeners were made of tee bars, as specified by McPherson [
11]. This was because tee bars have good resistance to bending and buckling, compared to flat bars, and no skew bending, unlike angle bars or offset bulb plates. The tee bars had dimensions of 30 mm × 31 mm × 6 mm.
2.5. Loading Scenarios
The impact values were calculated based on the maximum take-off weight of the aircraft distributed accordingly between the three wheels. The fan and jet values for the impact landing case had a 50-50 split of weight between the fan and the jet. The plate thicknesses examined in this loading condition were the minimum plate thicknesses identified in
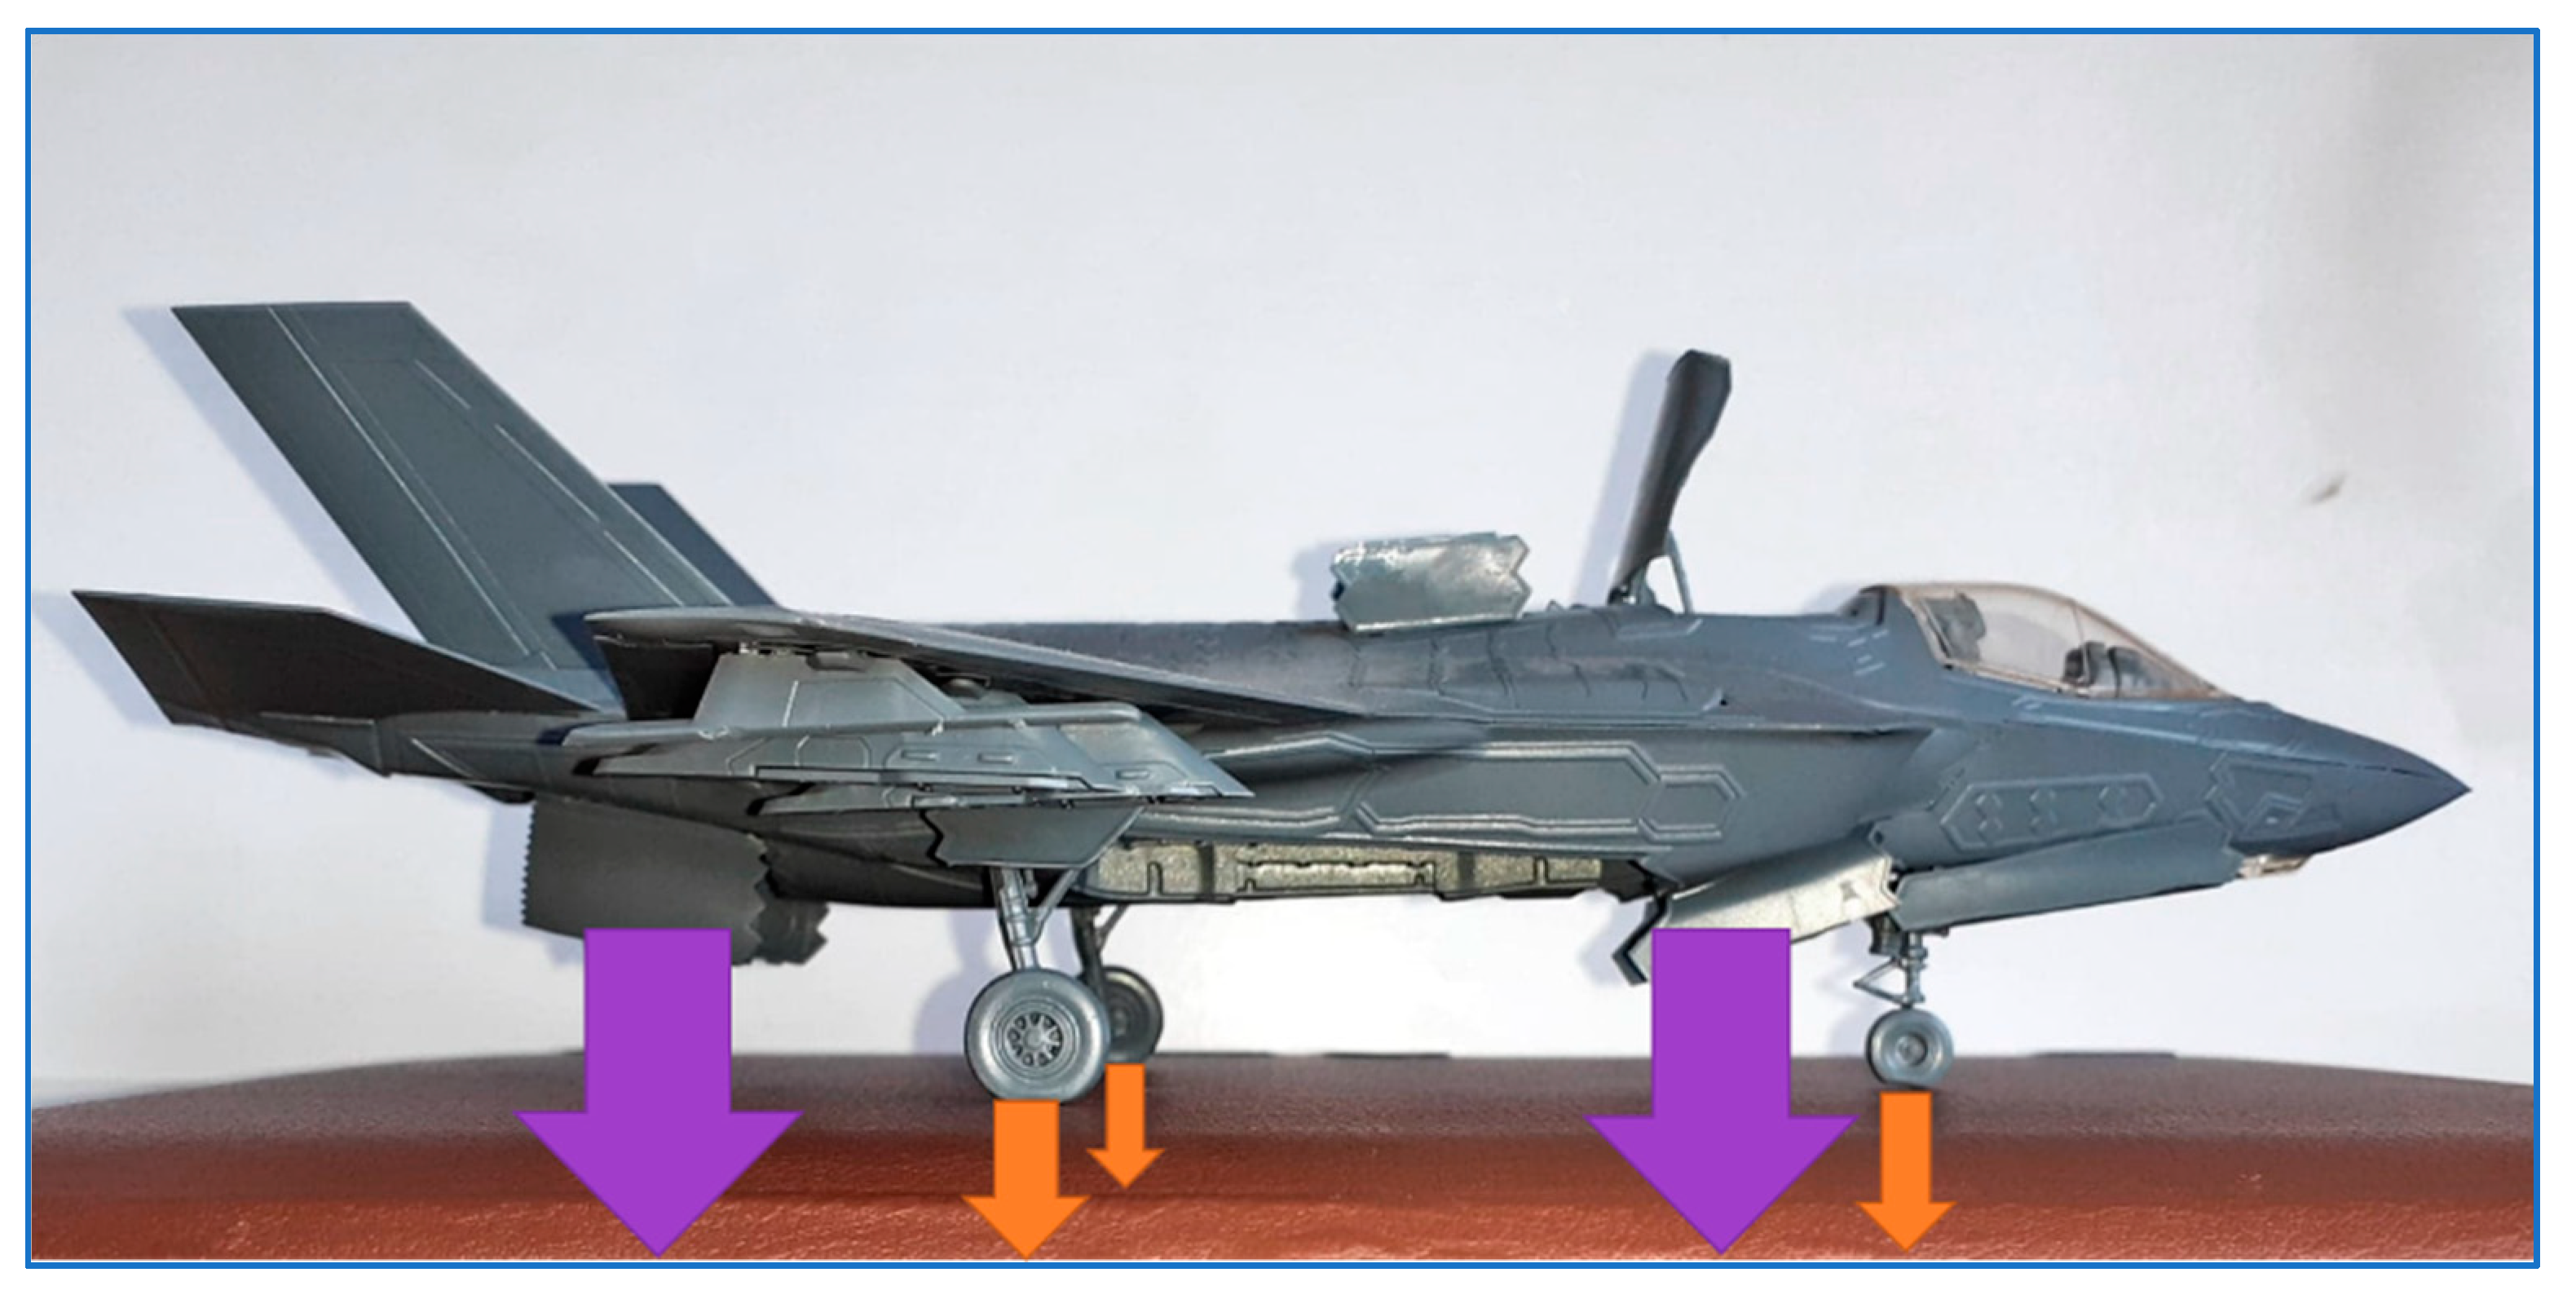
Table 1. Fixed supports were applied to all four sides of the plate, excluding the cross-section of the stiffeners. FEA mesh element size was 0.05 m. The vertical landing was modelled as pressure exerted over 0.5 s, the weight of the aircraft transferring from the jet and fan footprint to the main and nose landing gear.
Figure 5 illustrates the positions of the pressures applied to the deck during a vertical landing. The orange arrows represent increasing pressures on the wheel footprints, while the purple arrows are decreasing forces as the jets transfer weight to the wheels. The pressure values used are shown in
Table 2.
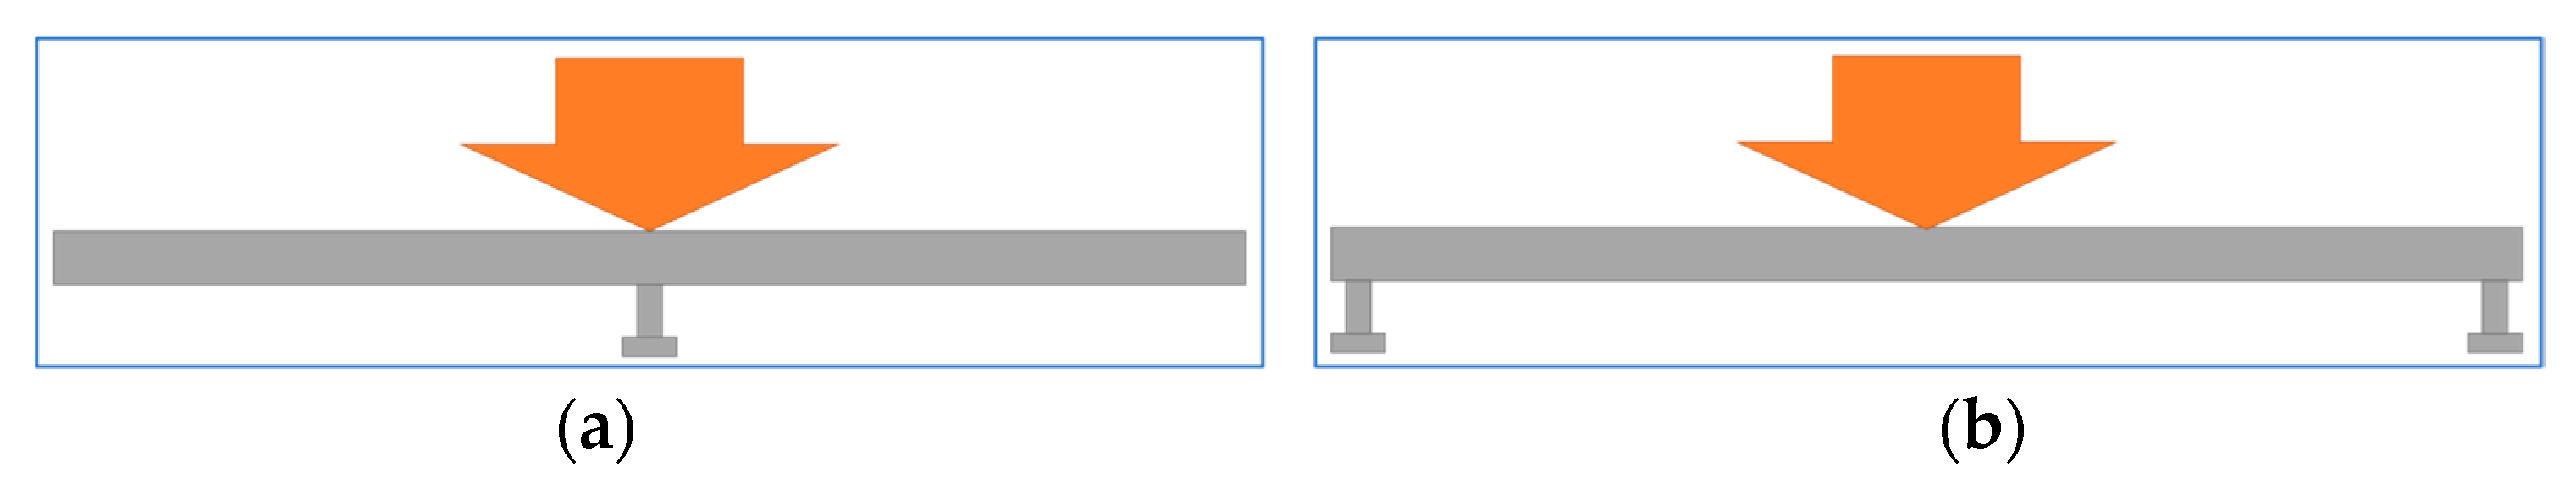
Uniformly distributed loading (UDL) was modelled across one section of the deck plating as a line pressure (no wheels deployed). The models were designed with one and two stiffeners to position the highest load on the plate, and then on the stiffeners. For the empirical calculations, the section of plate was modelled as a simply supported beam, with fixed supports at either end. FEA mesh element size was 0.03 m. The UDL condition was split into two scenarios:
One central stiffener, i.e., greatest stress on stiffener (
Figure 6a).
Two stiffeners, i.e., greatest stress on plate (
Figure 6b).
Three plate thicknesses were chosen for each set of modelling conditions: the minimum required thickness (700 mm stiffener spacings), the maximum (1200 mm stiffener spacings), and the highest stiffener spacing to plate thickness ratio (s:t), as identified in
Table 1. For the FEA simulation, fixed supports were applied to all four sides of the plate, including the cross-section of the stiffeners.
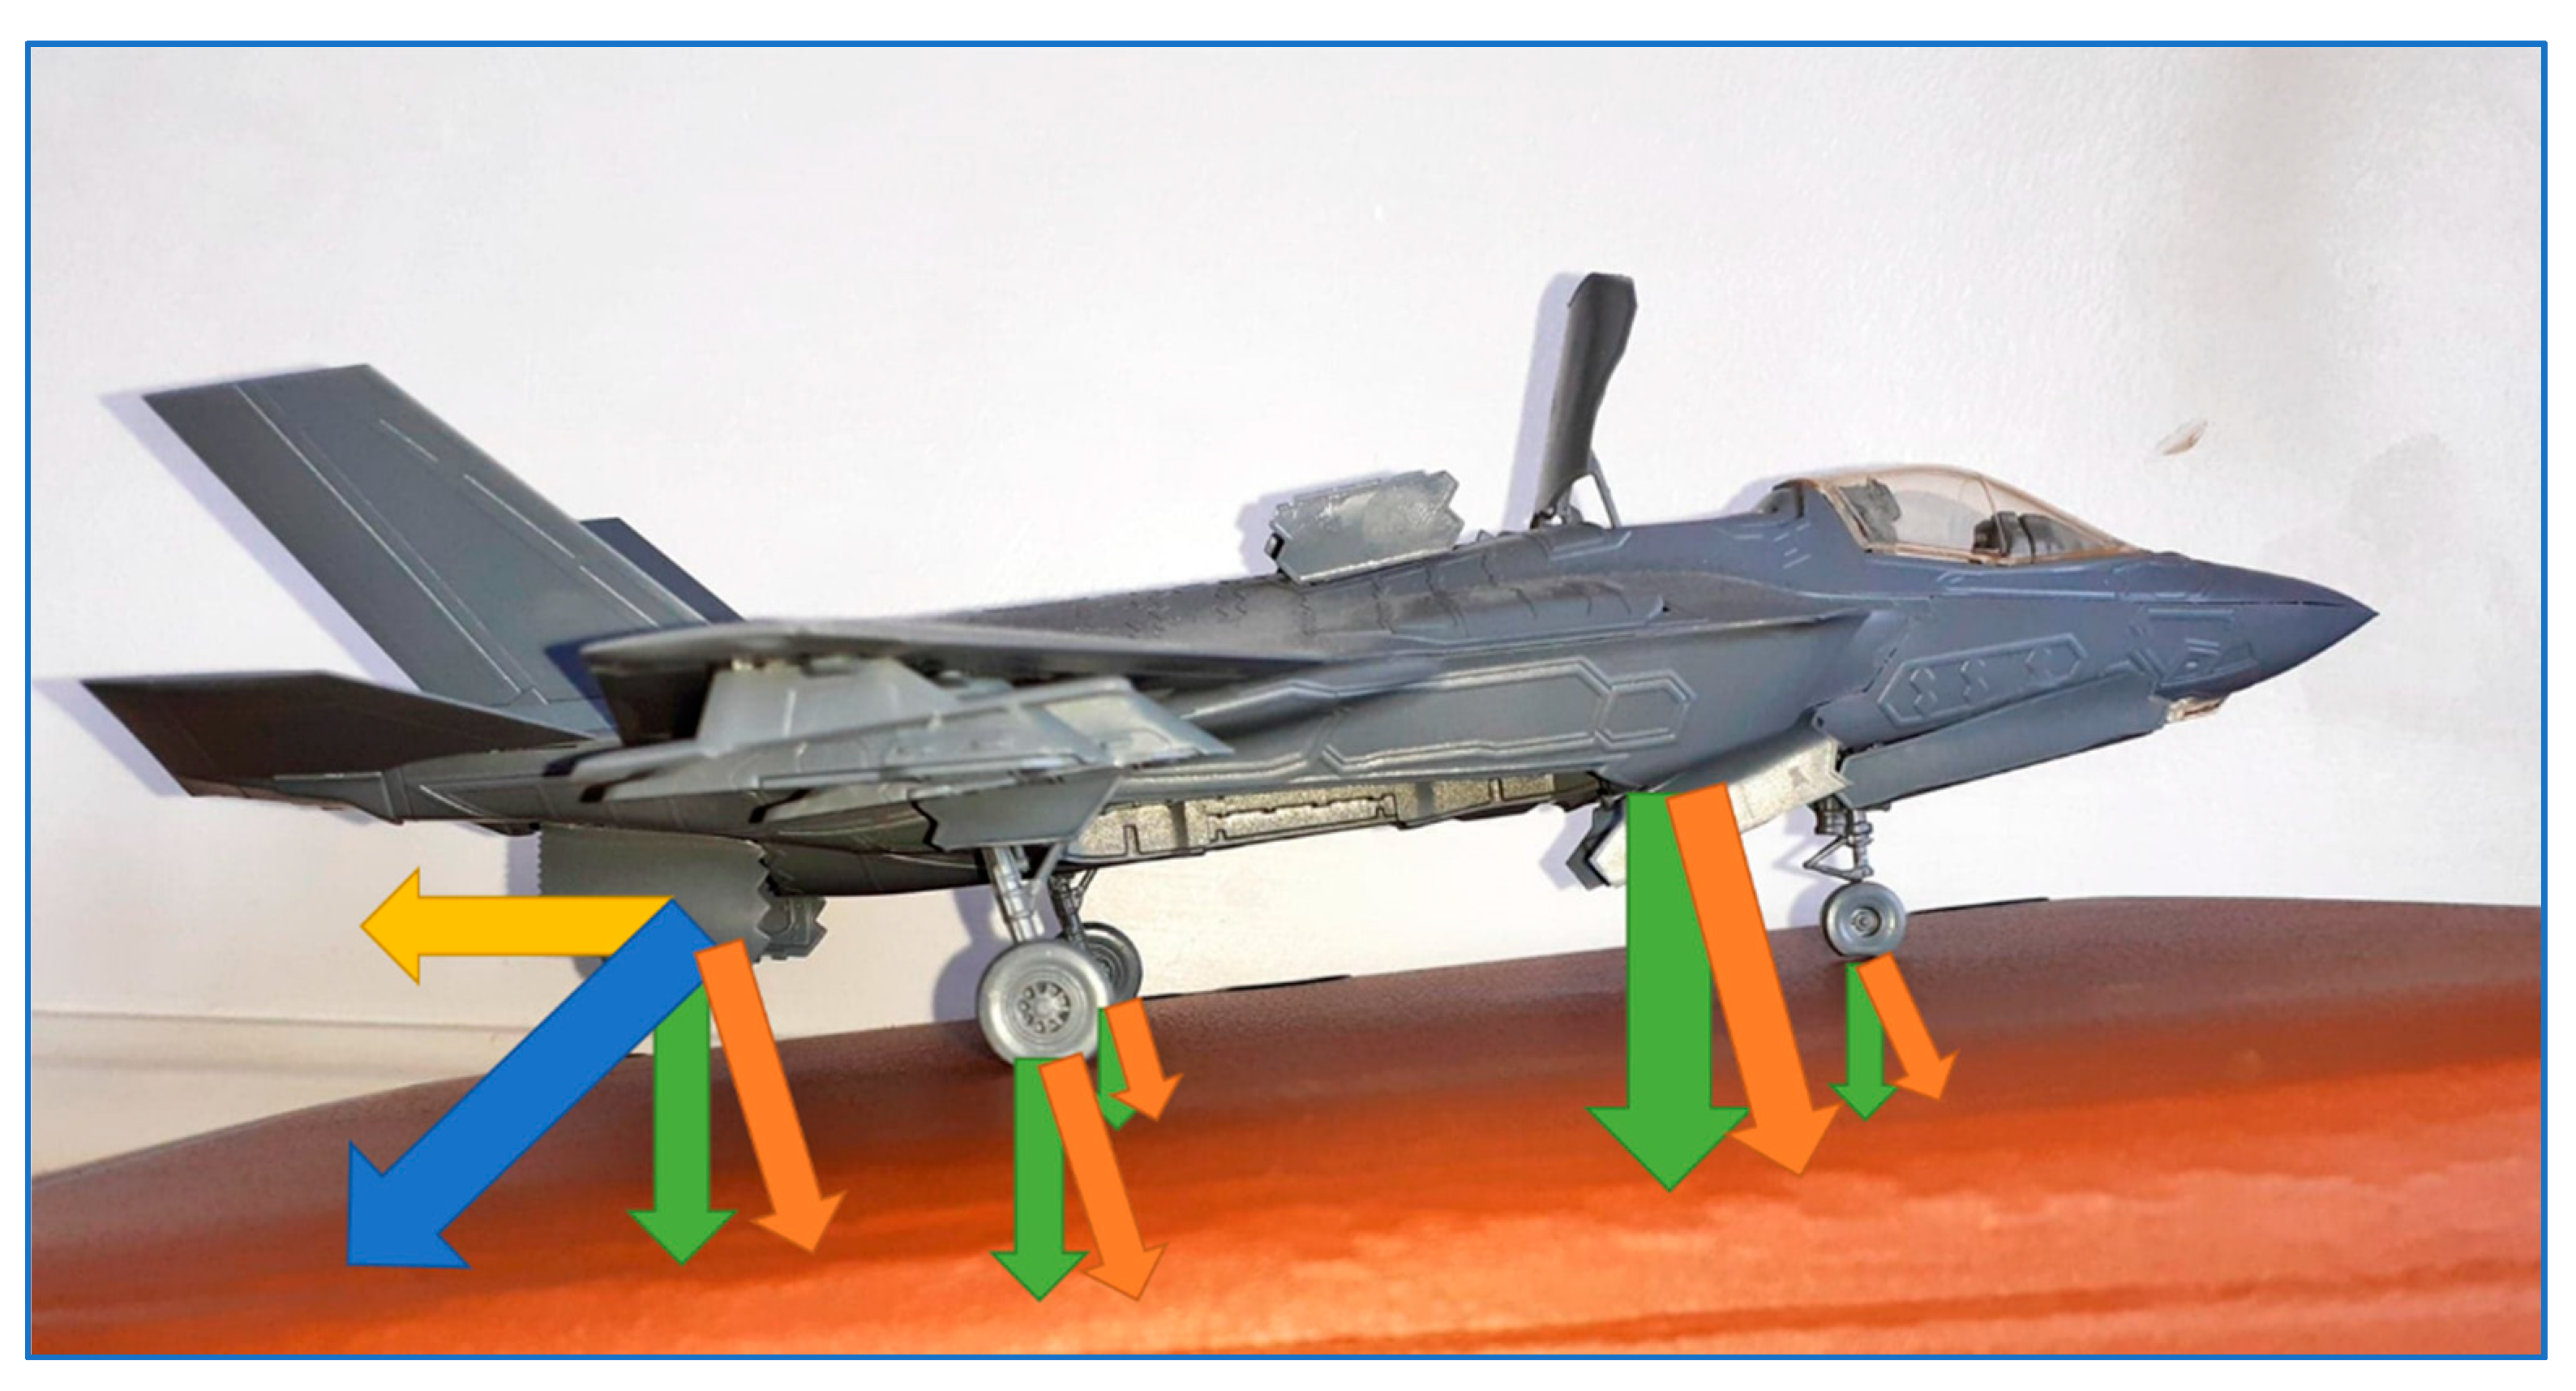
The dynamic take-off values assumed that half the weight of the aircraft was carried by the landing gear while the other half was carried by the jet and fan. The jet pressure was the vertical component of the 45-degree jet. The fan, which acts directly downwards, carried the remainder of the weight of the aircraft. The weight distribution for the wheels followed the guidelines provided by each classification body, as in impact loading. The fan at the front of the aircraft acted directly downwards, while the exhaust jet was assumed to be at 45° from vertical, as shown in
Figure 7. The yellow arrow represents the horizontal component of the jet force seen in blue. Orange arrows represent the force components used in the analysis.
The downward component for the jet was calculated as:
F
fan was then taken as:
where F
jet is the force of the jet, F
fan is the force from the forward fan, and W
auw is the all-up weight of the aircraft in kN.
The plate thicknesses examined in this section of the study were the minimum plate thicknesses identified in
Table 1. Fixed supports were applied to all four sides of the plate, excluding the cross-section of the stiffeners. FEA mesh element size was 0.05m. The plate was split into 18 sections and pressure was applied transiently to represent the aircraft travelling across the plate.
Table 3 shows the start and the end times for each of the forces crossing the plate. Given that the plate was 11.5 m long, and each section took 0.2 s to traverse, with an overlap of 0.1 s, this gave a speed of 6.389 m/s, or 14.29 mph. However, the speed of the aircraft was not relevant to the forces. The distance between the centre of each force had a much more prominent effect on the structural behaviour of the plate.
QEC carriers have a ski-jump angle of 12.5 degrees. To account for the angle of the forces on the deck plating on the ramp, the forces were resolved to find the perpendicular component, as illustrated in
Figure 8. The green arrows represent the vertical forces used in the flat deck model. The yellow arrow represents the horizontal component of the jet force seen in blue. The orange arrows represent the perpendicular forces used in the analysis.
3. Results and Discussions
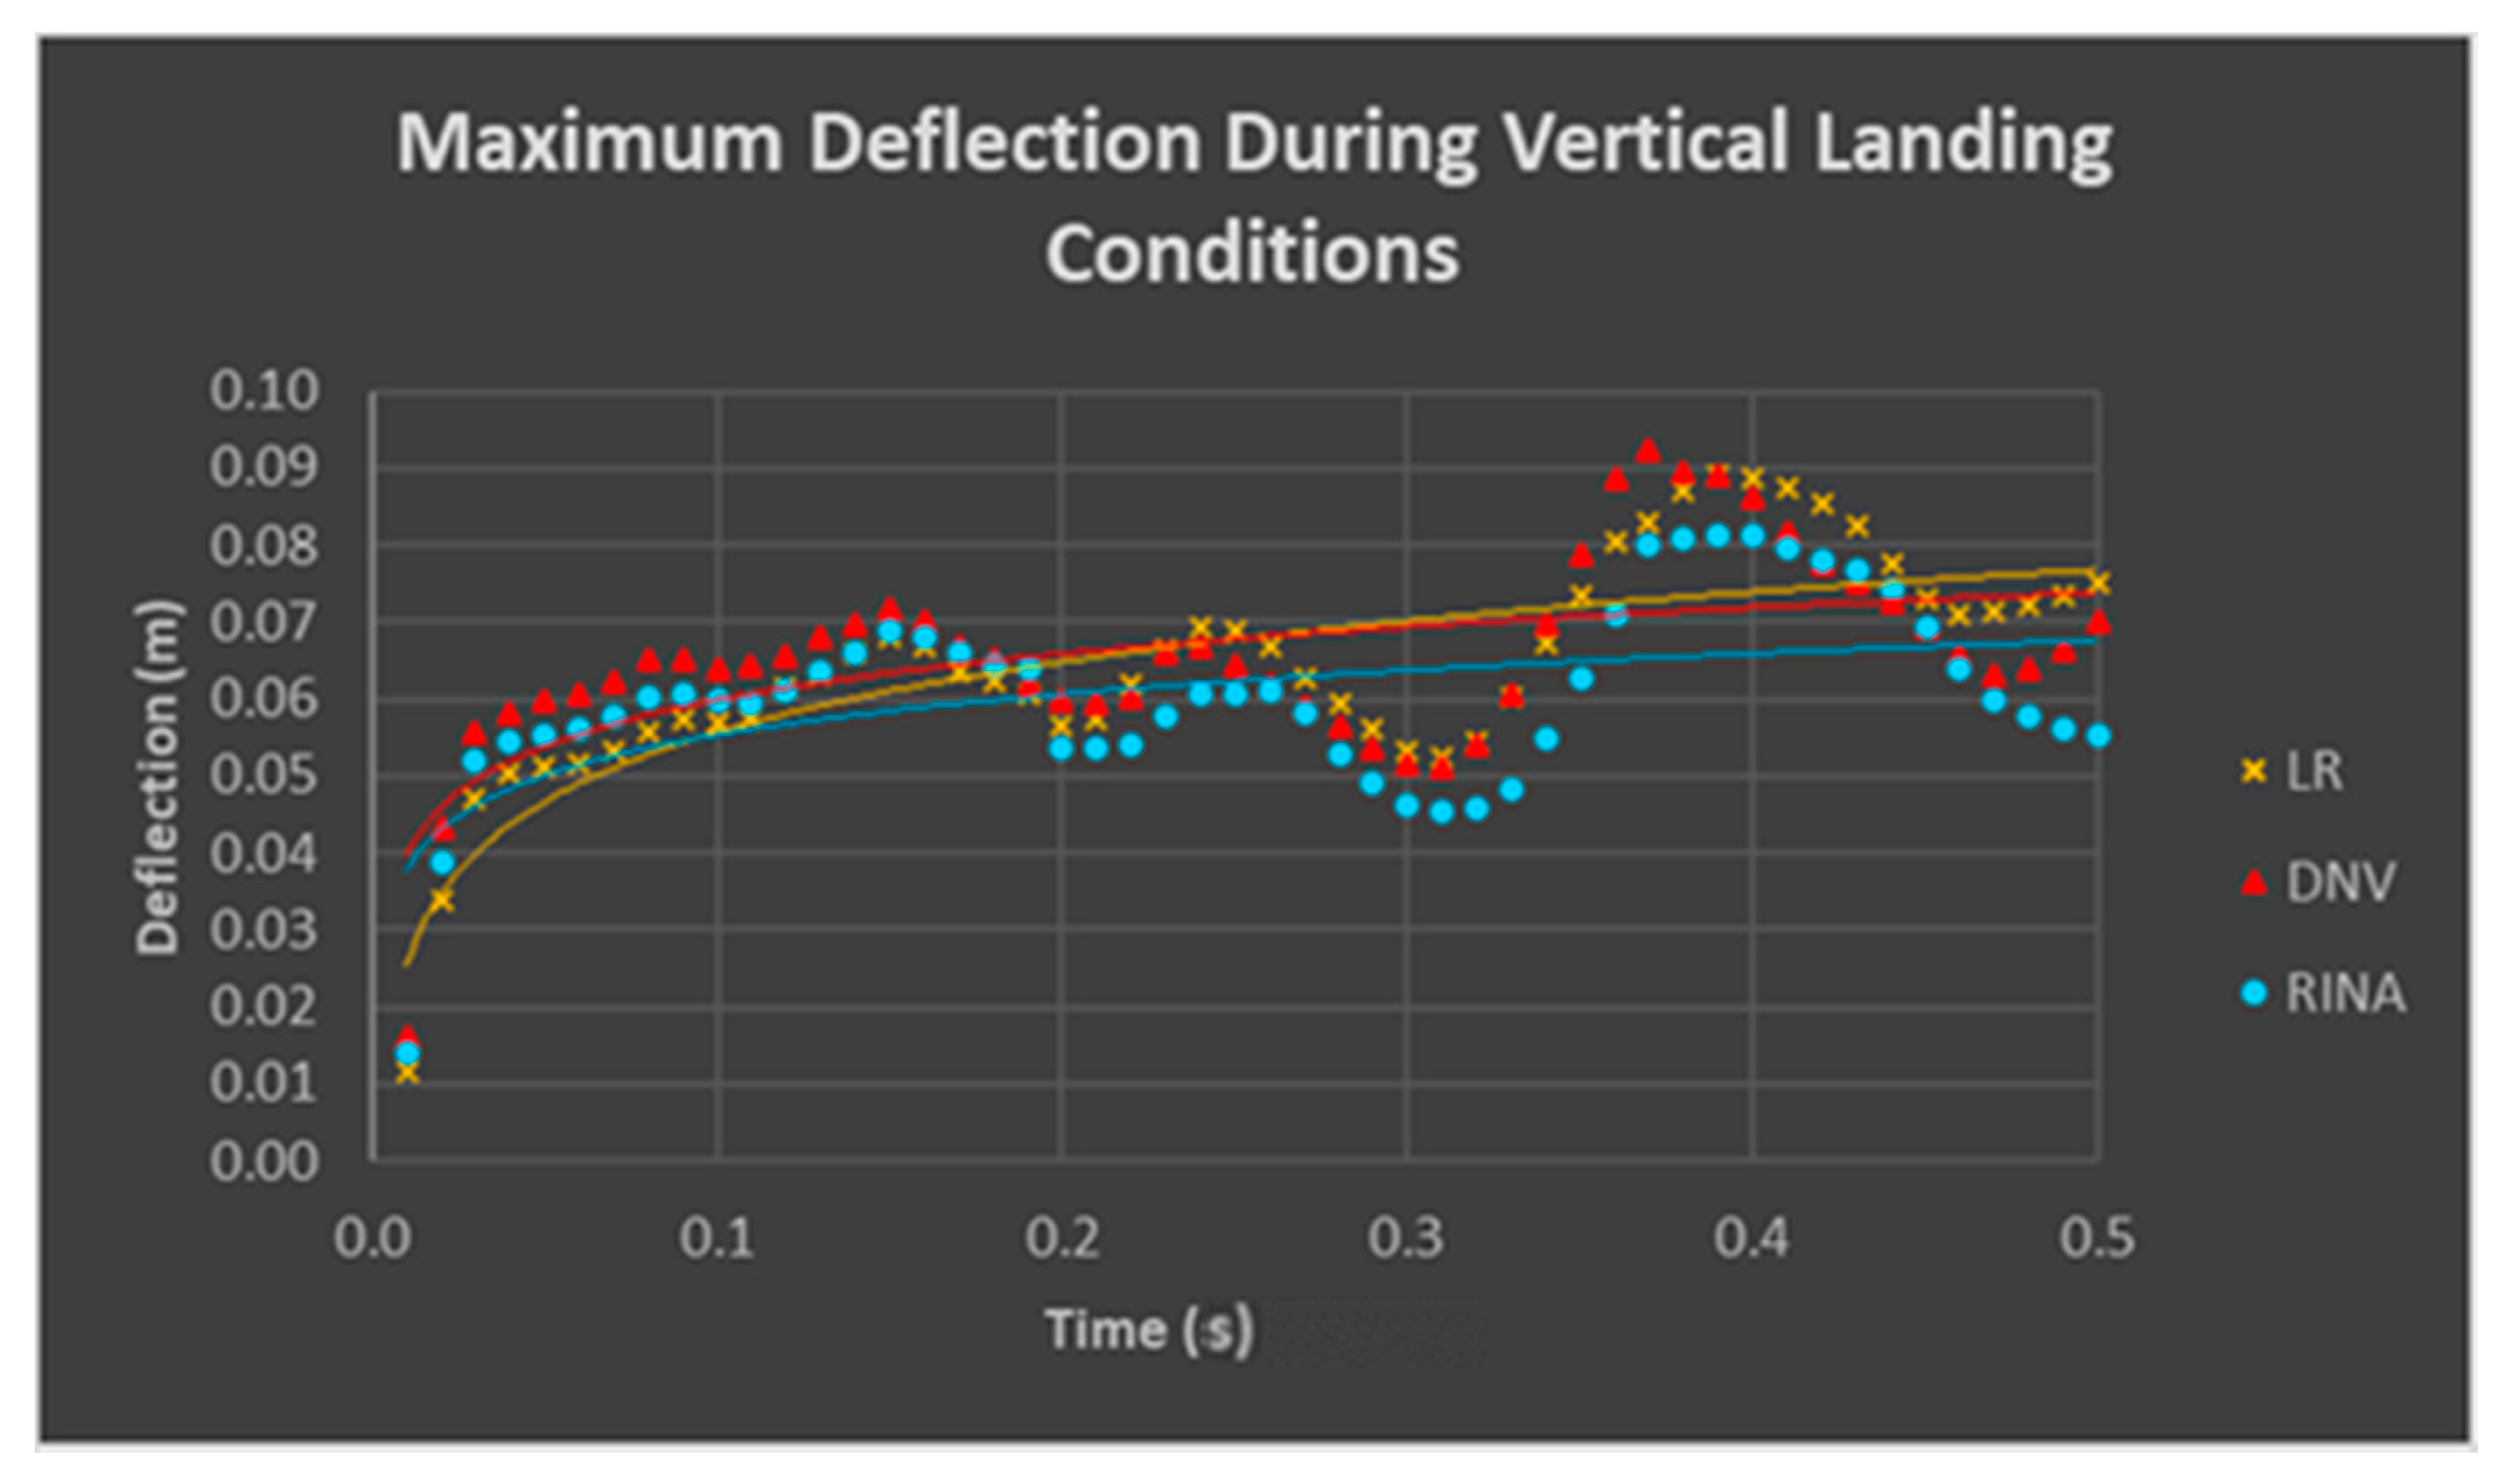
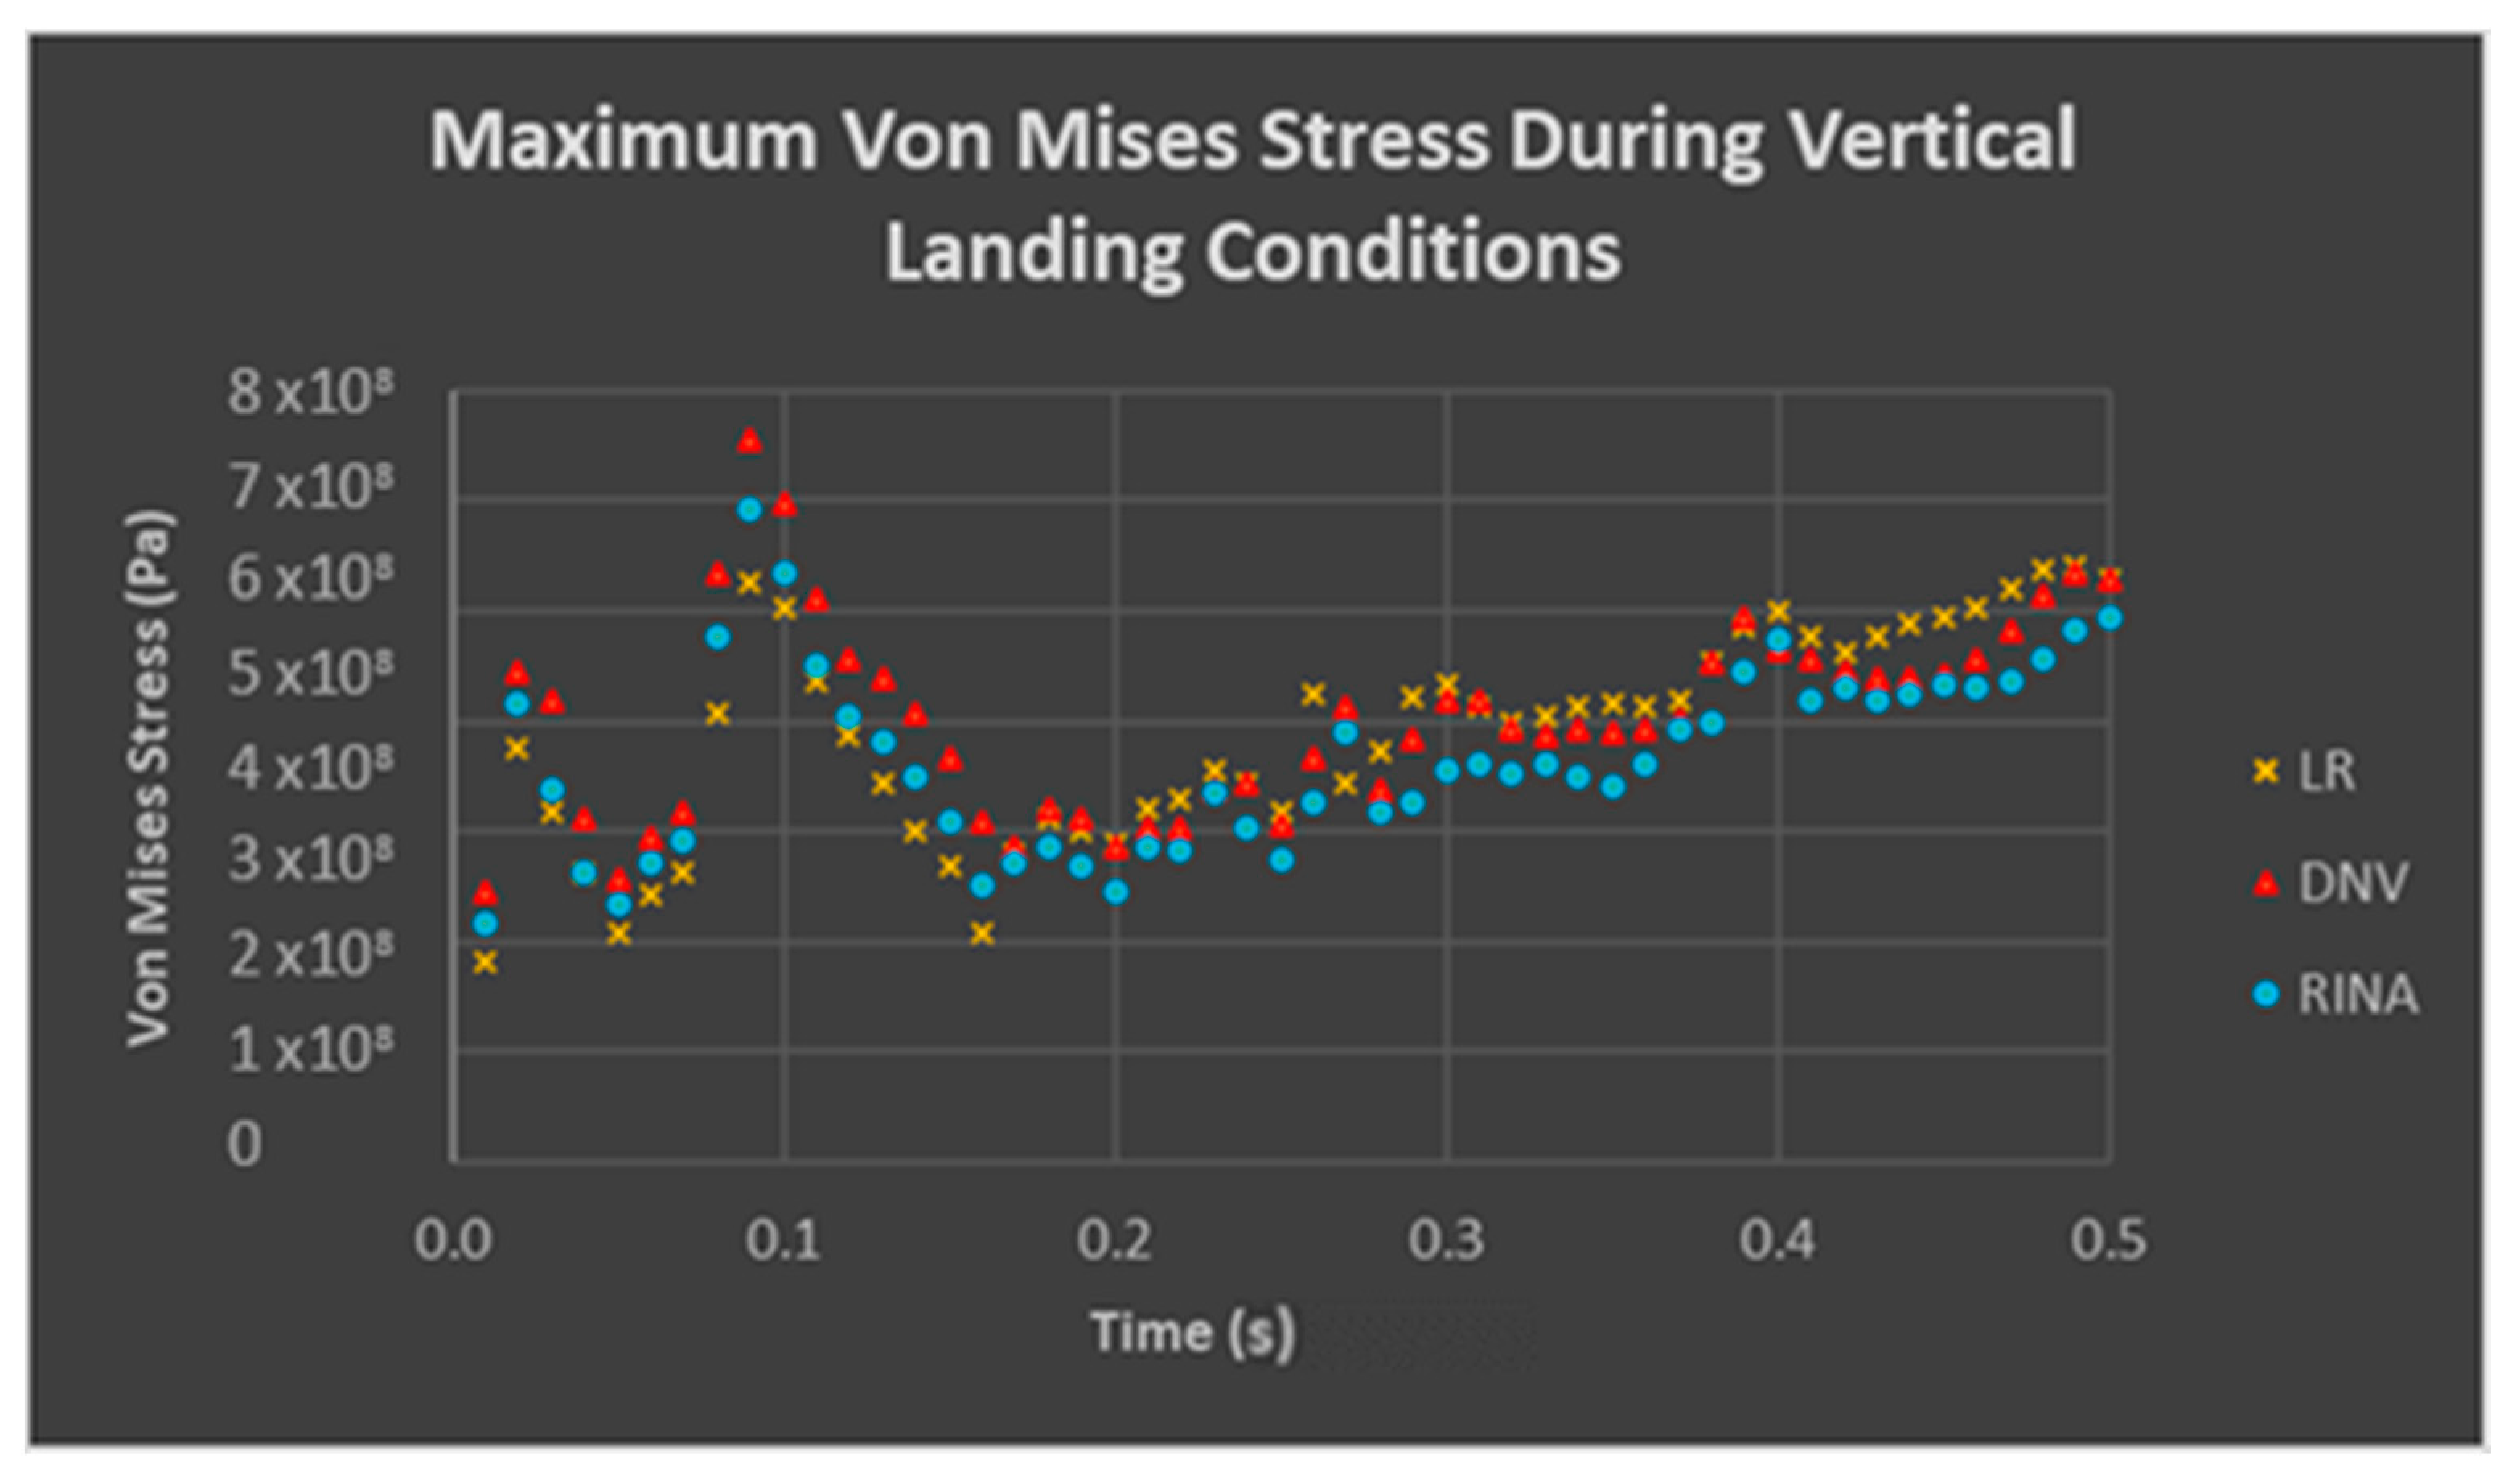
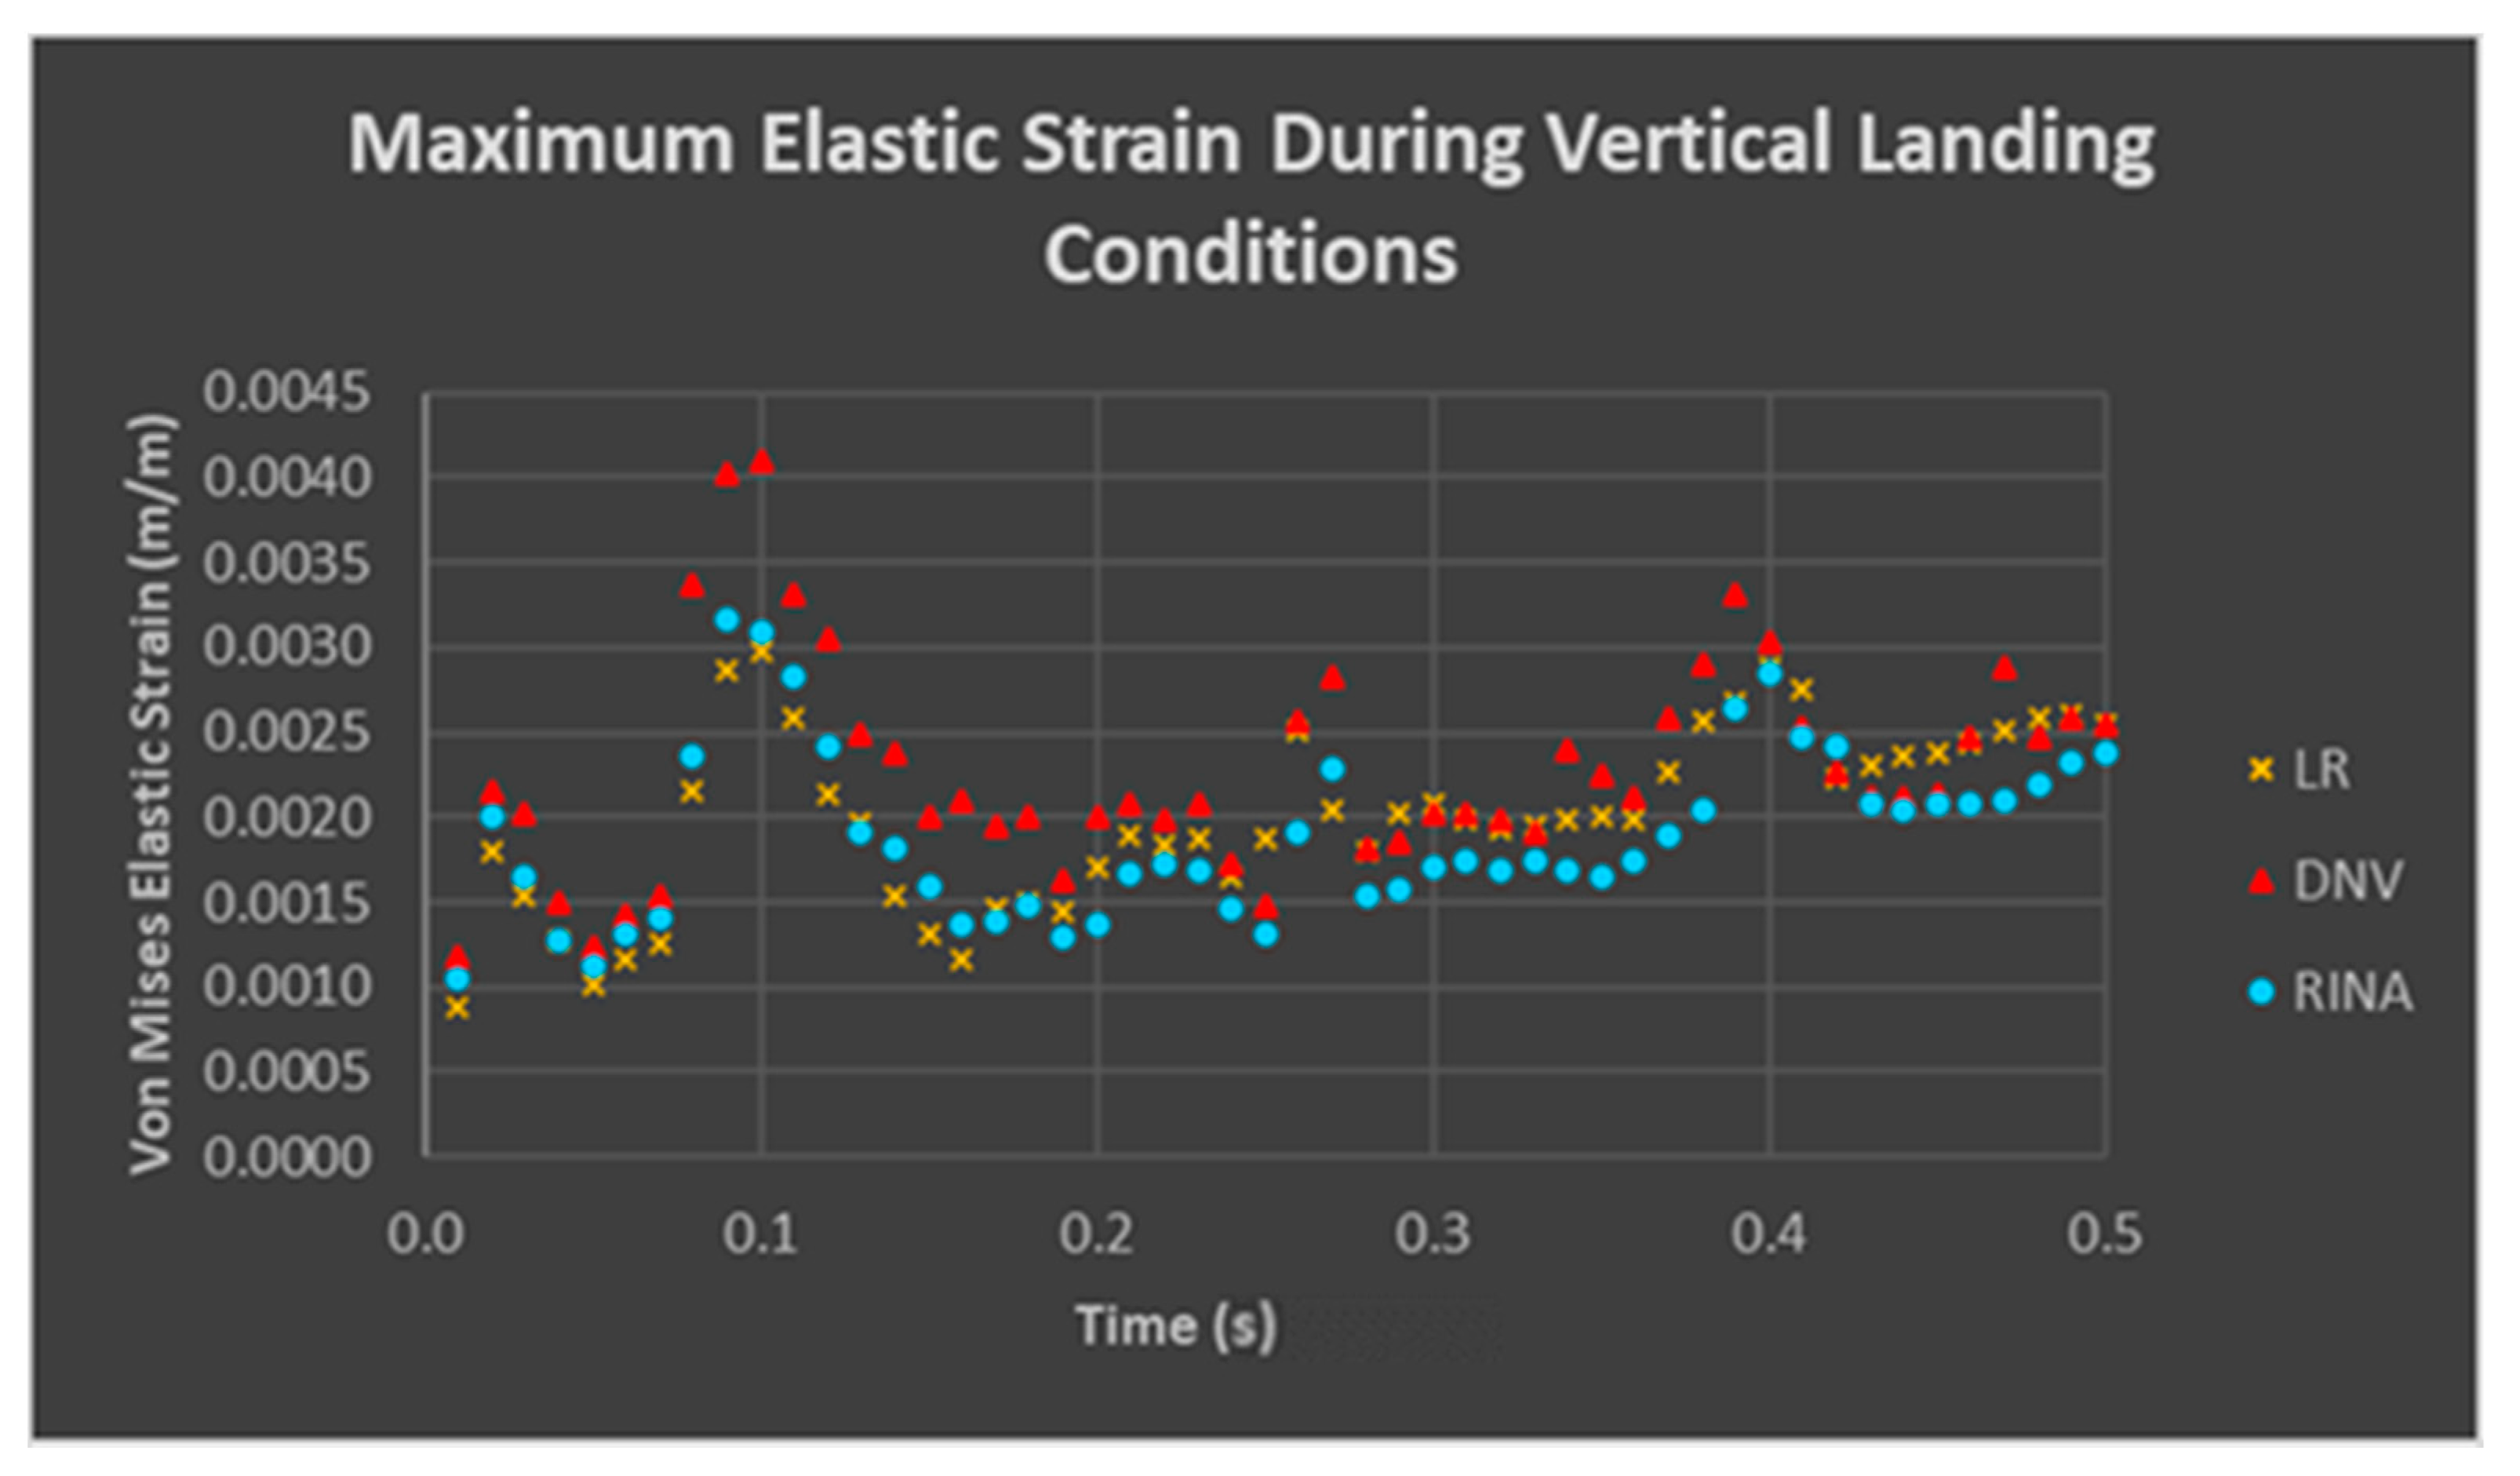
The maximum values of deflections, von Mises stresses, and elastic strain of the deck plates from the FEA during vertical landing are shown in
Figure 9,
Figure 10 and
Figure 11 respectively.
Figure 9 shows that all three deflection plots followed a similar pattern of behaviour. It is interesting to note that there was variation between which classification body gave the highest deflection values at different times. This could represent the differences in weight distribution. LR changed from showing the smallest deformation under the jets to the highest deflection once the weight was transferred to the wheels, due to the weight distribution between the landing gears. The results do not show a clear relationship of deflection over time. This could be due to the complexity of the loading condition. When the weight was transferred from the jets to the wheels, this caused interference between the pressure footprints, which could explain the varying behaviour of the maximum deflection.
As can be seen in
Figure 10, from 0.15 s to 0.5 s, all three sets of results appeared to demonstrate a positive correlation of stress to time. This would be expected, as the pressure on the wheel footprints was increasing. The decrease in stress from 0.09 s to 0.15 s also followed the expected behaviour, as the jet and fan pressures decreased before the wheel pressures became significant enough to begin increasing the stress in the plate. The yield stress of EH46 steel is 460 MPa, or 4.6 × 10
8 Pa [
13]. Between 0.08 s and 0.11 s, the yield stress was exceeded in all three cases, most severely in DNV by 195 MPa. The yield stress was exceeded again at 0.4 s and beyond 0.46 s. The UTS of 720 MPa was not exceeded. The highest stress was from the DNV dataset at 655 MPa. The exceedance of the yield value would suggest that permanent deformation occurred. These high stresses occurred in the stiffeners. It is also interesting to note that while the yield stress of normal EH46 steel is stated as 460 MPa, the steel used in the construction of the flight deck and hangar decks of the QEC carriers is TMCP. TMCP improves the yield strength of low carbon, copper bearing, ultra-high strength steels [
21]. EH46 steel is low carbon and ultra-high strength, and 20 mm plate contains 0.21 wt% copper [
11]. The exact effects of TMCP on EH46 yield strength are not expressly stated, but McPherson [
11] gave a higher yield strength than Gangsteel, at 485 MPa, for the 20 mm plate specified in their paper.
Figure 11 reveals that the maximum strain values followed the same peaks and troughs as the stress graph. DNV reached the highest strain values, 0.00411. Since the percentage elongation of EH46 steel is 17%, all three data sets were well below the maximum strain value of the material.
The results from the analyses under the UDL condition are shown in
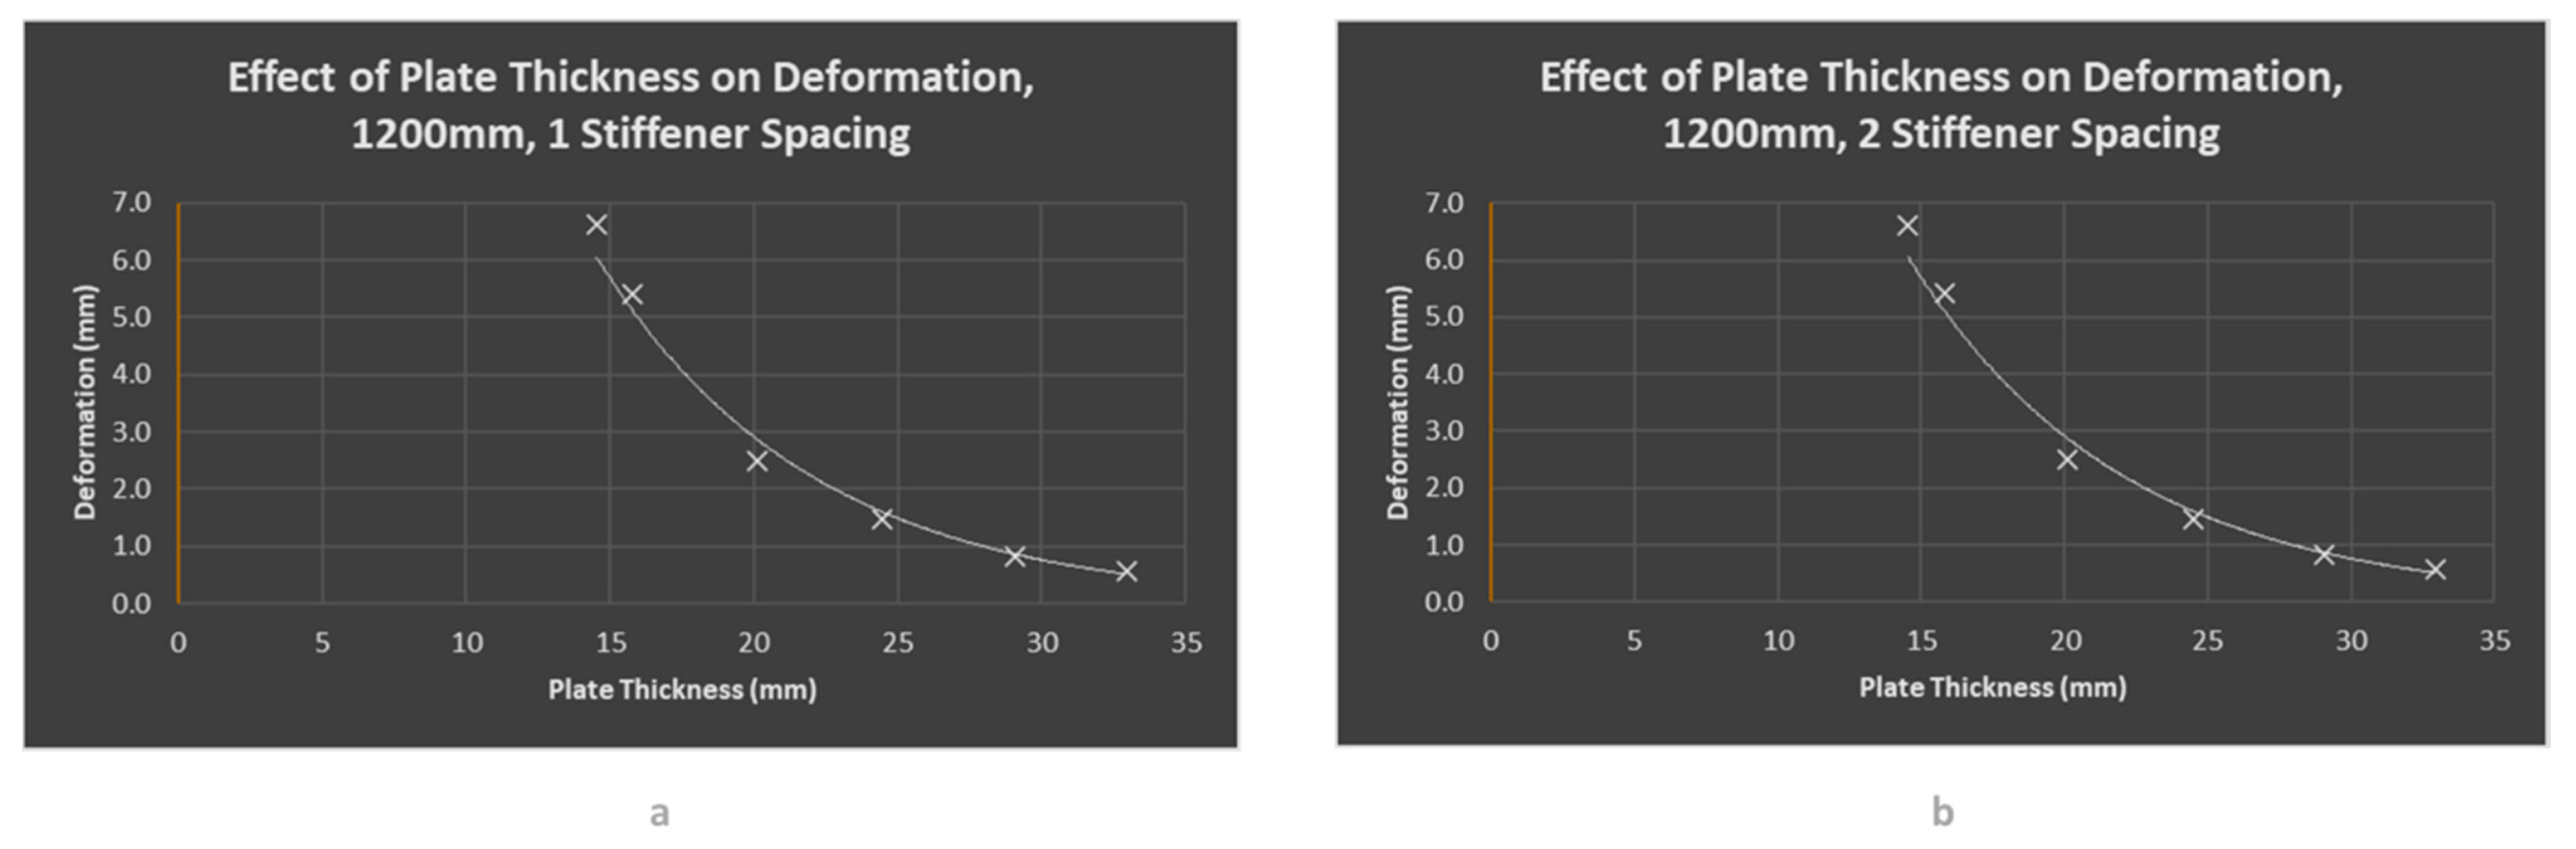
Table 4, and suggest that the position of the stiffeners did influence the maximum deflection, stress and strain experienced by the deck, with varying significance. For LR, the deflection in the plate with one stiffener was on average 0.68% higher than for the same thickness of plate with two stiffeners. For DNV, this value was 1.03% higher and for RINA, 0.81% higher. The results suggest that there was almost negligible difference between the deflection values in the plate when the force was positioned on a central stiffener, or between two stiffeners. It also implies that the thicker the plate, the less effect the position of the stiffener had on the maximum deformation. LR showed significantly less deformation than the DNV and RINA results. For example, despite the LR minimum deck plate thickness being only 17% greater than the DNV minimum, the deformation in LR was only 38% of the deformation in DNV plate. This suggests that deformation decreased non-linearly as plate thickness increased.
Figure 12 illustrates that the behaviour of deformation in the 1200 mm spaced plate was closer to exponential behaviour.
The outputs from the numerical analyses carried out based on the empirical formulae given by the classification bodies are documented in
Table 5. These values can be directly compared to the values in
Table 4 above. The negative signs in the v(x) m column indicate that the deformation occurs downwards whereas v(x) mm values are given as absolute values.
The LR maximum plate thickness model gave values of 1.210 mm and 1.085 mm for one and two stiffeners, respectively. These values were approximately double those calculated via the finite element analysis (FEA). For the minimum plate thickness, the numerical analysis (NA) values were between seven and 10 times higher than FEA values. For s:t, the NA value was less than double the FEA value. It is interesting that the increase in deflection between FEA and NA was not uniform across the plate thicknesses, nor did it follow a linear trend in relation to this variable. The NA values for the DNV were also higher than the values obtained using FEA by up to 375%. The s:t two stiffeners model gave a smaller value via NA, by approximately 17%. The NA values for RINA were between 7% smaller and 575% larger than the FEA values. The numerical analysis modelled the beam as simply supported, with an upwards reaction force at either end, but no moments. The FEA modelled the plate as having fixed supports at either end, similar to a cantilever model. This means that there was a reaction moment as well as a reaction force at either end. It also modelled fixed supports on the long edges of the plate. These supports were added after the experiment was initially run and extreme deflection was measured. This difference in end constraints could account for the difference in values between FEA and NA.
As shown in
Table 4, the number and position of the stiffeners appear to have had a much more significant effect on the equivalent stress in the deck than on deflection. LR saw the smallest average increase in stress, at 126.9%. DNV had a slightly higher increase of 134.4%, and RINA’s increase was 142.0%. The highest stress occurred in the stiffener. In the one stiffener model, the aircraft was positioned to apply the greatest stress on the stiffeners. The stress was not distributed across the plate before transferring to the stiffeners. None of the stresses exceeded the material yield stress of 460 MPa; therefore, no permanent deformation occurred. The elastic strain behaved almost identically to the stress. The single central stiffener gave a strain value 126.9% higher than that of the two stiffeners for LR, and 134.4% and 142.0% higher for DNV and RINA respectively. As expected, LR gave the lowest strain values, followed by RINA, with DNV experiencing the largest strain for the minimum and s:t cases. However, for the maximum thickness case, RINA had higher levels of strain. This was because the maximum thickness for RINA was lower than for DNV, whereas the minimum and s:t thicknesses were greater than those for DNV.
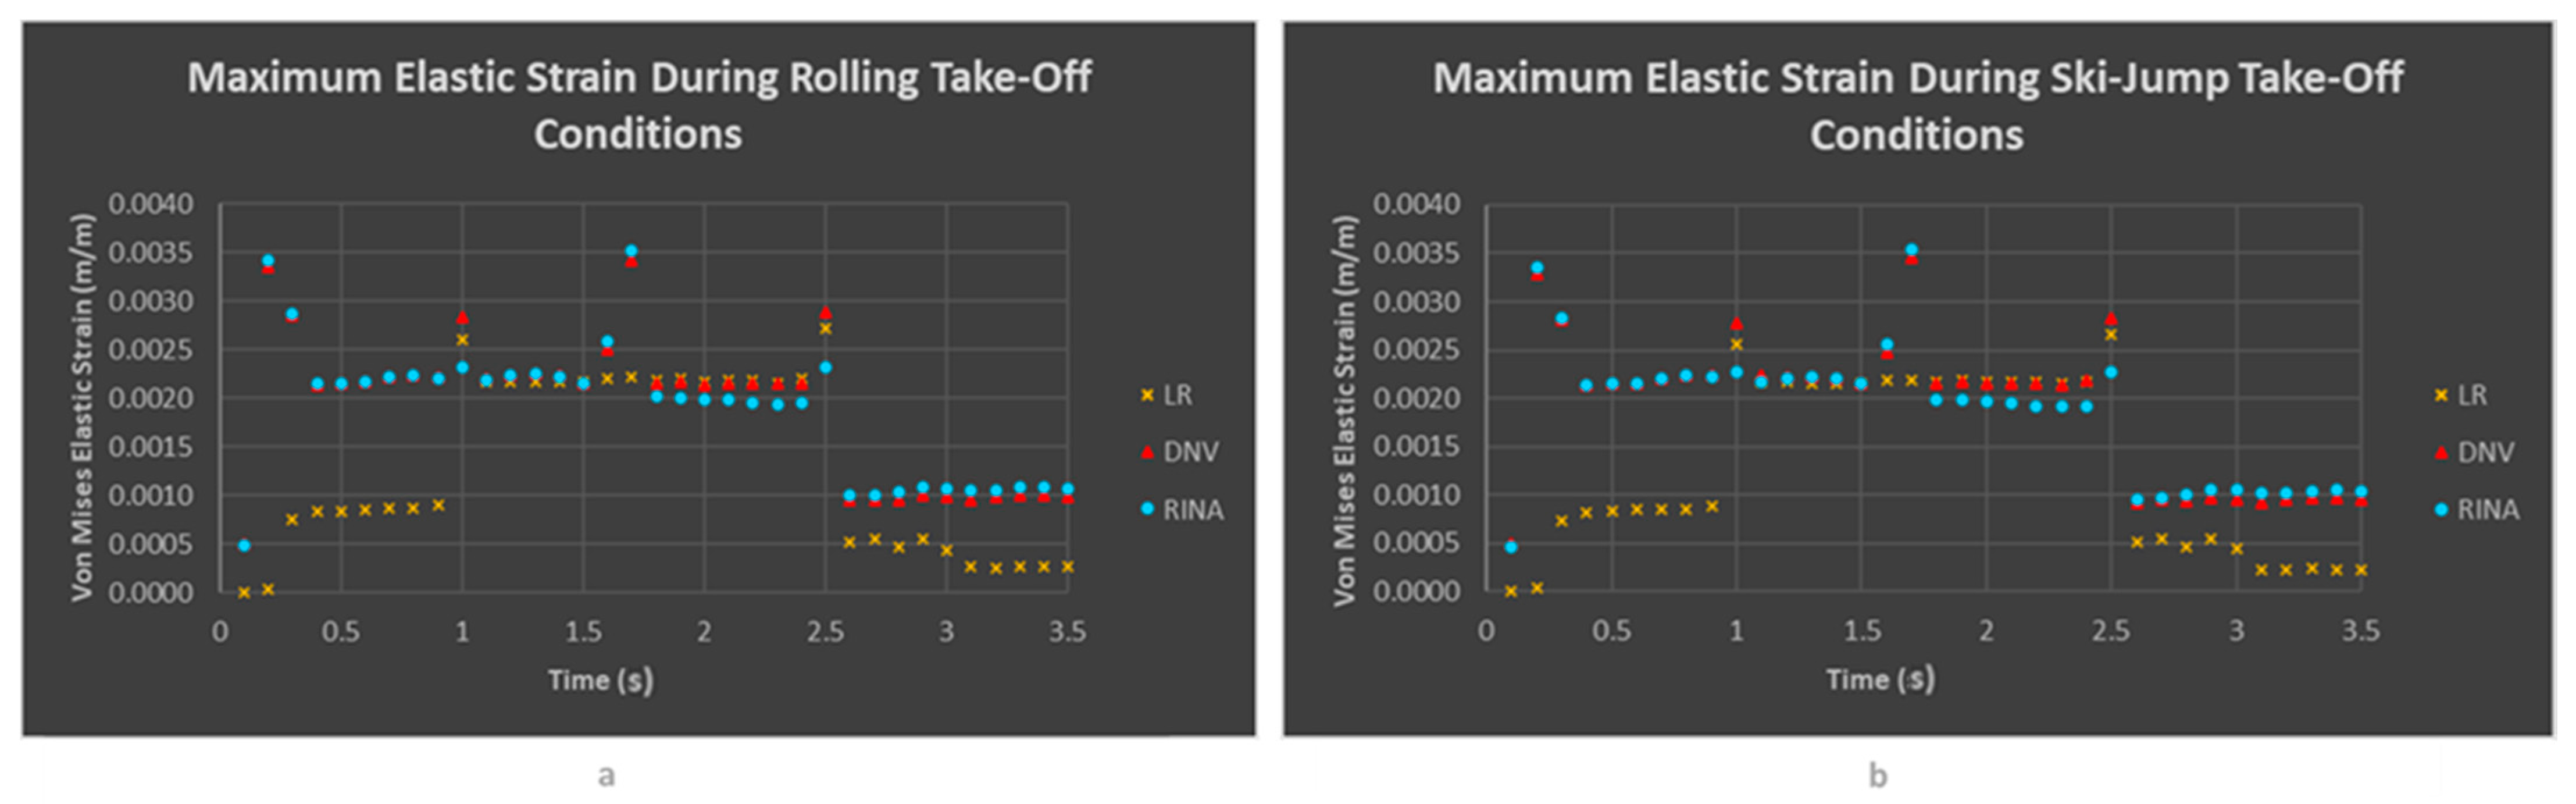
The maximum values of deflections, von Mises stresses, and elastic strain of the deck plates from the FEA during take-off conditions are shown in
Figure 13,
Figure 14 and
Figure 15 respectively.
From
Figure 13, it can be seen that DNV and RINA expressed very similar graphical behaviour, especially during the first 1.5 s of the simulation. LR deflection was notably lower for this period, only 50% during the first second. This could be explained by the fact that LR does not consider any weight to be transferred through the nose wheel of the aircraft; therefore, there was no significant deflection for a longer time. The variations between the flight deck results and the ski-jump results were very small for deflection, stress and strain. This was due to the small reduction in perpendicular force when the weight of the aircraft was resolved. Likewise, the LR values were significantly lower than the DNV and RINA stresses during the first second for both the flight deck and ski-jump locations (
Figure 14). LR was also lower during the last second, and saw a drop in stress at 3.1 s, when the last force disappeared from the end of the plate. The maximum stress experienced by the plate in both locations was 731 MPa, which exceeded the UTS of EH46 steel, which is 720 MPa. This only occurred at one data point on each graph, and only occurred in the RINA case. The material safety factors for UTS checks given by RINA are 1.02 for both plate and stiffeners [
20]. Under this ruling, any stresses exceeding 705.88 MPa would not meet the regulations. This means the stress of 710 MPa in both locations was also unacceptable. This scenario came under the LCB load case as explained by DNV [
22]. Therefore, the factor of safety used under both the static and dynamic loading conditions was 1.05. This means the highest permissible stress was 685.71 MPa, so the DNV data point at 1.7 s gave an unacceptably high value, at 710.3 MPa for the flat deck and 715.21 MPa on the ski-jump. LR gives a much larger safety factor. However, these values are for the primary hull strength of offshore units, not for deck plates. No values are specified for plate strength, so it was assumed that the amplification factors covered this allowance. It is interesting to note the spikes in stress at 0.2 s and 1.7 s specifically. These times did not coincide with any forces beginning to be applied. The drop back to a plateau at 1.8 s did match the ending of the nose wheel force. It should also be noted that these spikes were only experienced in DNV and RINA, while LR continued at a steady value. Despite the fact that the force on the plate after 3.1 s was 0 kN, there was still residual stress in all three simulations, and in both the deck and ramp locations. This suggests that the self-weight of the plate caused stresses in the region of 200 MPa in the stiffeners for DNV and RINA, and 50 MPa for LR, or that the plate was permanently deformed by the weight of the aircraft, causing stresses in the buckled stiffeners, or that the deck was still returning to its original position after the force had been removed. The cause of the residual stress would require further investigation to verify.
Figure 15 reveals that the strain values ranged from 0 to 0.00354, slightly lower than values under impact landing conditions. The highest strain measurement was from the RINA dataset. There was a drop in strain for LR at 3.1 s, when all of the forces had been removed. DNV and RINA values did not show this drop. This is likely because the weight carried on the main landing gear was more significant for LR, whereas DNV and RINA both had some of the weight of the aircraft carried by the nose wheel. Therefore, it was a larger force that was removed when the main landing gear ‘drove off the end’ of the plate for LR. There was a residual strain in the plate for all three cases after all forces had been removed, both on the deck and on the ski-jump. As with the von Mises stress, further investigation would be required to understand whether this was due to the self-weight of the plate, permanent deformation in the plate, or the result of the plate taking time to return to its original state after the effects of the forces. RINA reached the highest strain values in both deck locations, 0.00352 for the flat deck and 0.00354 for the ski-jump. Since the percentage elongation of EH46 steel is 17%, all three data sets were well below the maximum strain value of the material for both locations.
4. Conclusions
This paper compared the deck plate thickness regulations from three classification bodies for naval ships: Lloyd’s Register, Det Norske Veritas Germanischer Lloyd and Registro Italiano Navale. It also studied the structural behaviour of flight deck plates designed to meet these regulations when subjected to three loading cases representing an F-35B jet deployed on a QEC aircraft carrier. The quasi-static analysis covered vertical landing on the deck, a situation where landing gear failed resulting in the aircraft resting directly on its fuselage, and a rolling take-off using the ski-jump. Loading conditions were applied based on work by Mascia [
5].
The QEC carriers were designed to meet LR regulations. The LR values calculated in this paper agree with the deck plate thicknesses specified in McPherson [
11]. All regulations show that the yield strength was exceeded under vertical landing and rolling take-off conditions, suggesting permanent deflection occurred in all cases. However, DNV and RINA regulations appeared to be particularly unacceptable as the stress levels in the dynamic loading case were so high as to exceed the ultimate tensile strength, suggesting immediate failure. The calculated LR deck thickness was more than 160% of the RINA or DNV thickness under take-off conditions. This raises the question of why there is such a variation between the regulatory bodies. It suggests that, had the DNV or RINA regulations been followed in the design and construction of the QEC carriers, the deck would have experienced failure during rolling take-off of the F-35B, both on the flight deck and on the ski-jump.
Due to the specialised properties of the EH46 steel used in the QEC carriers, the high yield strength fell outside the range covered by the RINA regulations. RINA stated that special consideration would be required for yield strengths higher than 390 MPa. EH46 has a yield strength of 460 MPa. The aim of this project was to compare the three classification bodies, not to calculate absolute values. Therefore, the highest material properties covered by RINA were used. These material properties were then also used in the deck plate thickness calculations for LR and DNV to maintain consistency for comparison. The FEA and subsequent comparative analysis used the yield and ultimate tensile strength (UTS) given by McPherson [
11]. Due to the design of the equations, the lower values had negligible effect on the LR deck plate thickness, slightly more effect on that of the DNV, and a higher effect again on that of the RINA. This appears to support the conclusions reached at the end of the paper, despite the lower yield strength used in deck design. To take this study further, special consideration may be discussed with RINA to investigate solutions to account for the higher yield strengths and analyse the effects of this change on the conclusions drawn in this initial study.
It is recommended that analysing material fatigue strengths would be a beneficial avenue to expand the current research. Another area of further investigation is studying the effects of more complex and representative deck structure designs in order to understand how this influences comparisons between the regulatory bodies.


