1. Introduction
Tropical island beaches are struggling in the face of sea level rise, human-induced beach erosion, homes/workplaces built on sand dunes and even cyclicity in mobile quays or sand spits. Other issues include loss of coral through trampling, river muds and bleaching, which leads to reduced production of coral sands for natural beach maintenance [
1,
2,
3].
Most commonly, land protection has relied on seawalls, rock/concrete revetments and other hard measures placed on the beach. The beach is often buried under the rock wall. “End effects”, wall subsidence and toe erosion all take an additional toll [
4]. Although common globally, Black et al. [
4] concluded that seawalls are not a suitable intervention for protecting beaches from climate change. Alternative and more sensitive solutions are needed for fragile tropical beaches to protect homes and maintain these beaches’ vital tourism appeal.
Many tropical islands have fringing reefs offshore, which break and dissipate waves to protect the lagoonal beaches from direct, open-ocean wave impact; without these reefs, most tropical island beaches would not exist. Wave height in the lagoon is controlled by water depth over the offshore reef crest [
5,
6,
7,
8]. Consequently, not only does sea level rise cause flooding, but it also allows larger waves to reach the defenceless lagoonal beaches, often with dire consequences, such as uncontrolled erosion and over-topping inundation [
9].
This paper suggests that improved results arise through augmentation of natural processes rather than competing against nature using seawall barricades or other structures on the beach. Philosophically, this paper highlights the natural attributes of tropical islands that may be used most beneficially to reduce erosion and deal with the threat of climate change. In addition, the urgent need to find nourishment sources that can be extracted with minor environmental impact is considered.
While circulation around coral reefs and lagoons has been studied in detail [
10,
11,
12], few investigations have combined circulation, sediment transport and beach protection [
13,
14]. However, an unusually large number of studies with this combination have been conducted in Mauritius over the last decade by the authors of this paper. These unpublished studies include detailed bathymetry, wave/current field data and computer modelling. They deal with a wide range of environments, with large and small wave conditions, wide and narrow lagoons, single and multiple “passes” and other features.
This paper focusses on one of these projects at Le St Geran, on the north-east coast of Mauritius, which highlights many of the issues and challenges to be confronted on tropical islands. The outcomes are examined after the construction of a coastal protection reef with concomitant beach nourishment. Four years of post-construction monitoring has been undertaken at the site, and so the outcomes can be confidently presented and compared with the original computer and empirical predictions. Other important insights come from the data and computer modelling, which are applied to search for suitable nourishment sources. Innovative engineering methods that acknowledge the need for cost-effective construction and the limited availability of heavy plants in small islands are identified.
2. Site Description and the Need for Protection
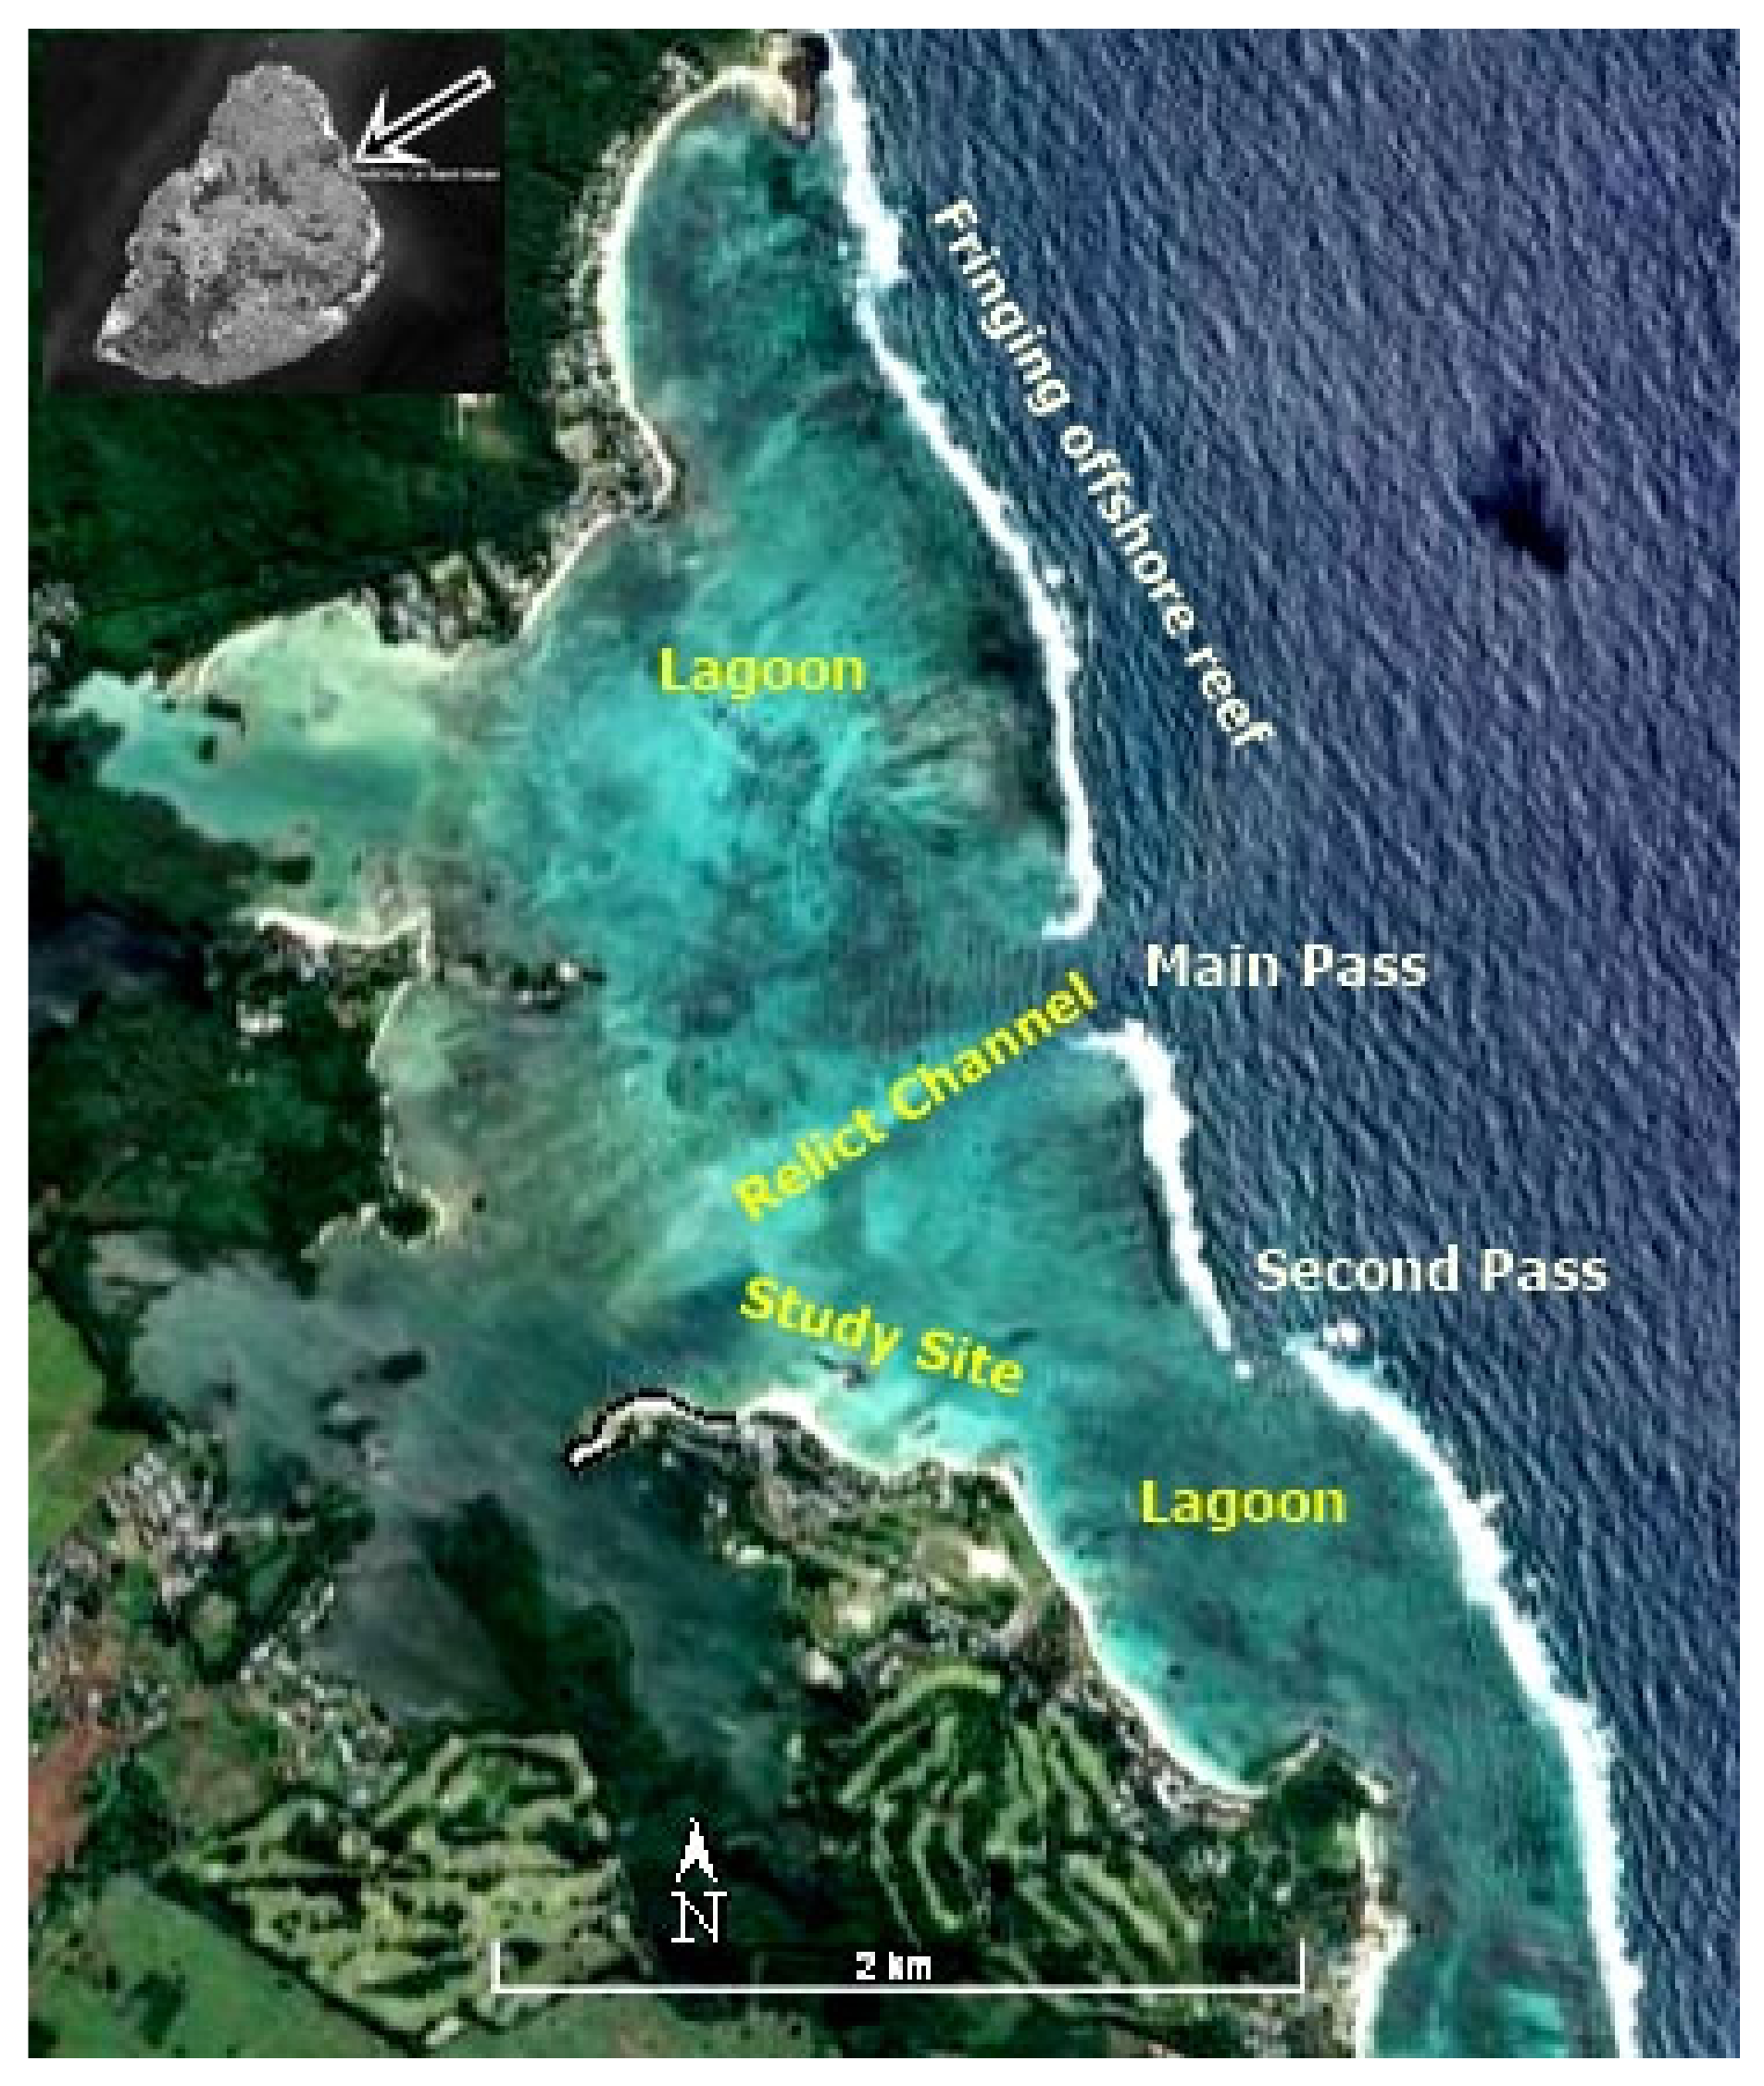
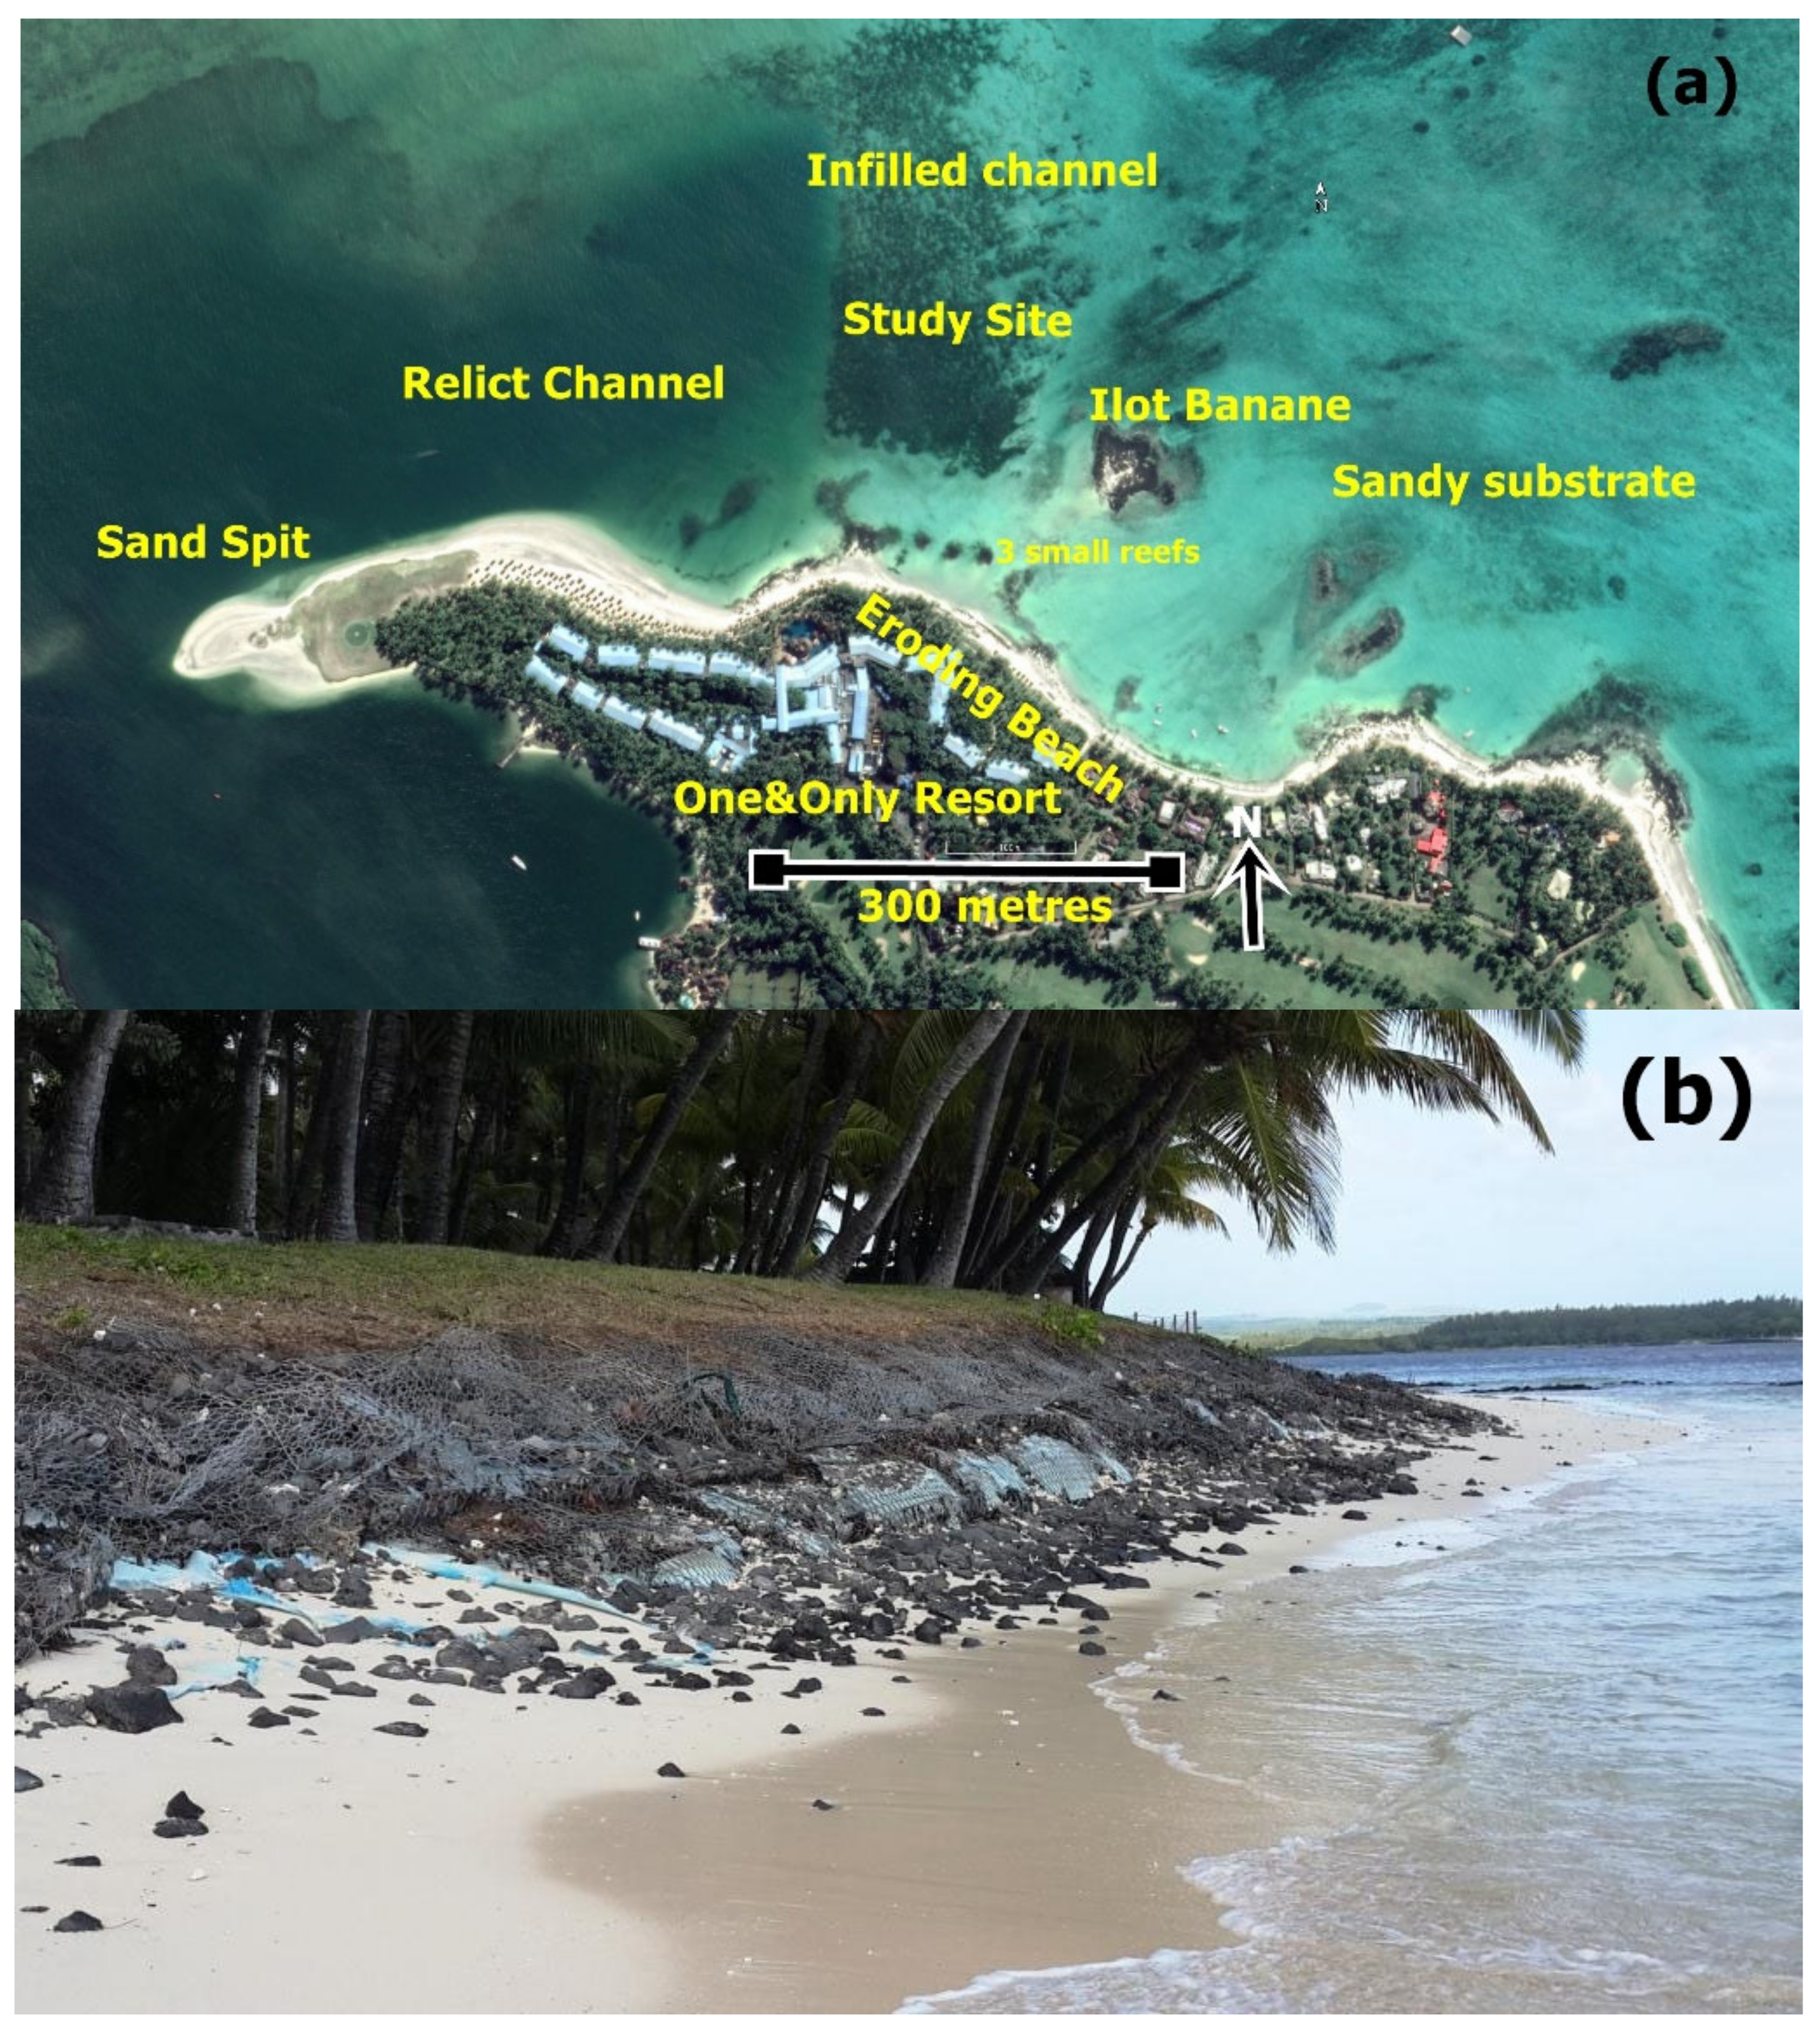
The “One&Only Resort” at Le St Geran, located on the north-east coast of Mauritius in the southern Indian Ocean (20.2° S, 57.8° E), is situated in a large coral reef lagoon. Key geomorphic features are the fringing offshore reef, relict river channels, two canyon “passes” in the fringing reef and the broad lagoon (
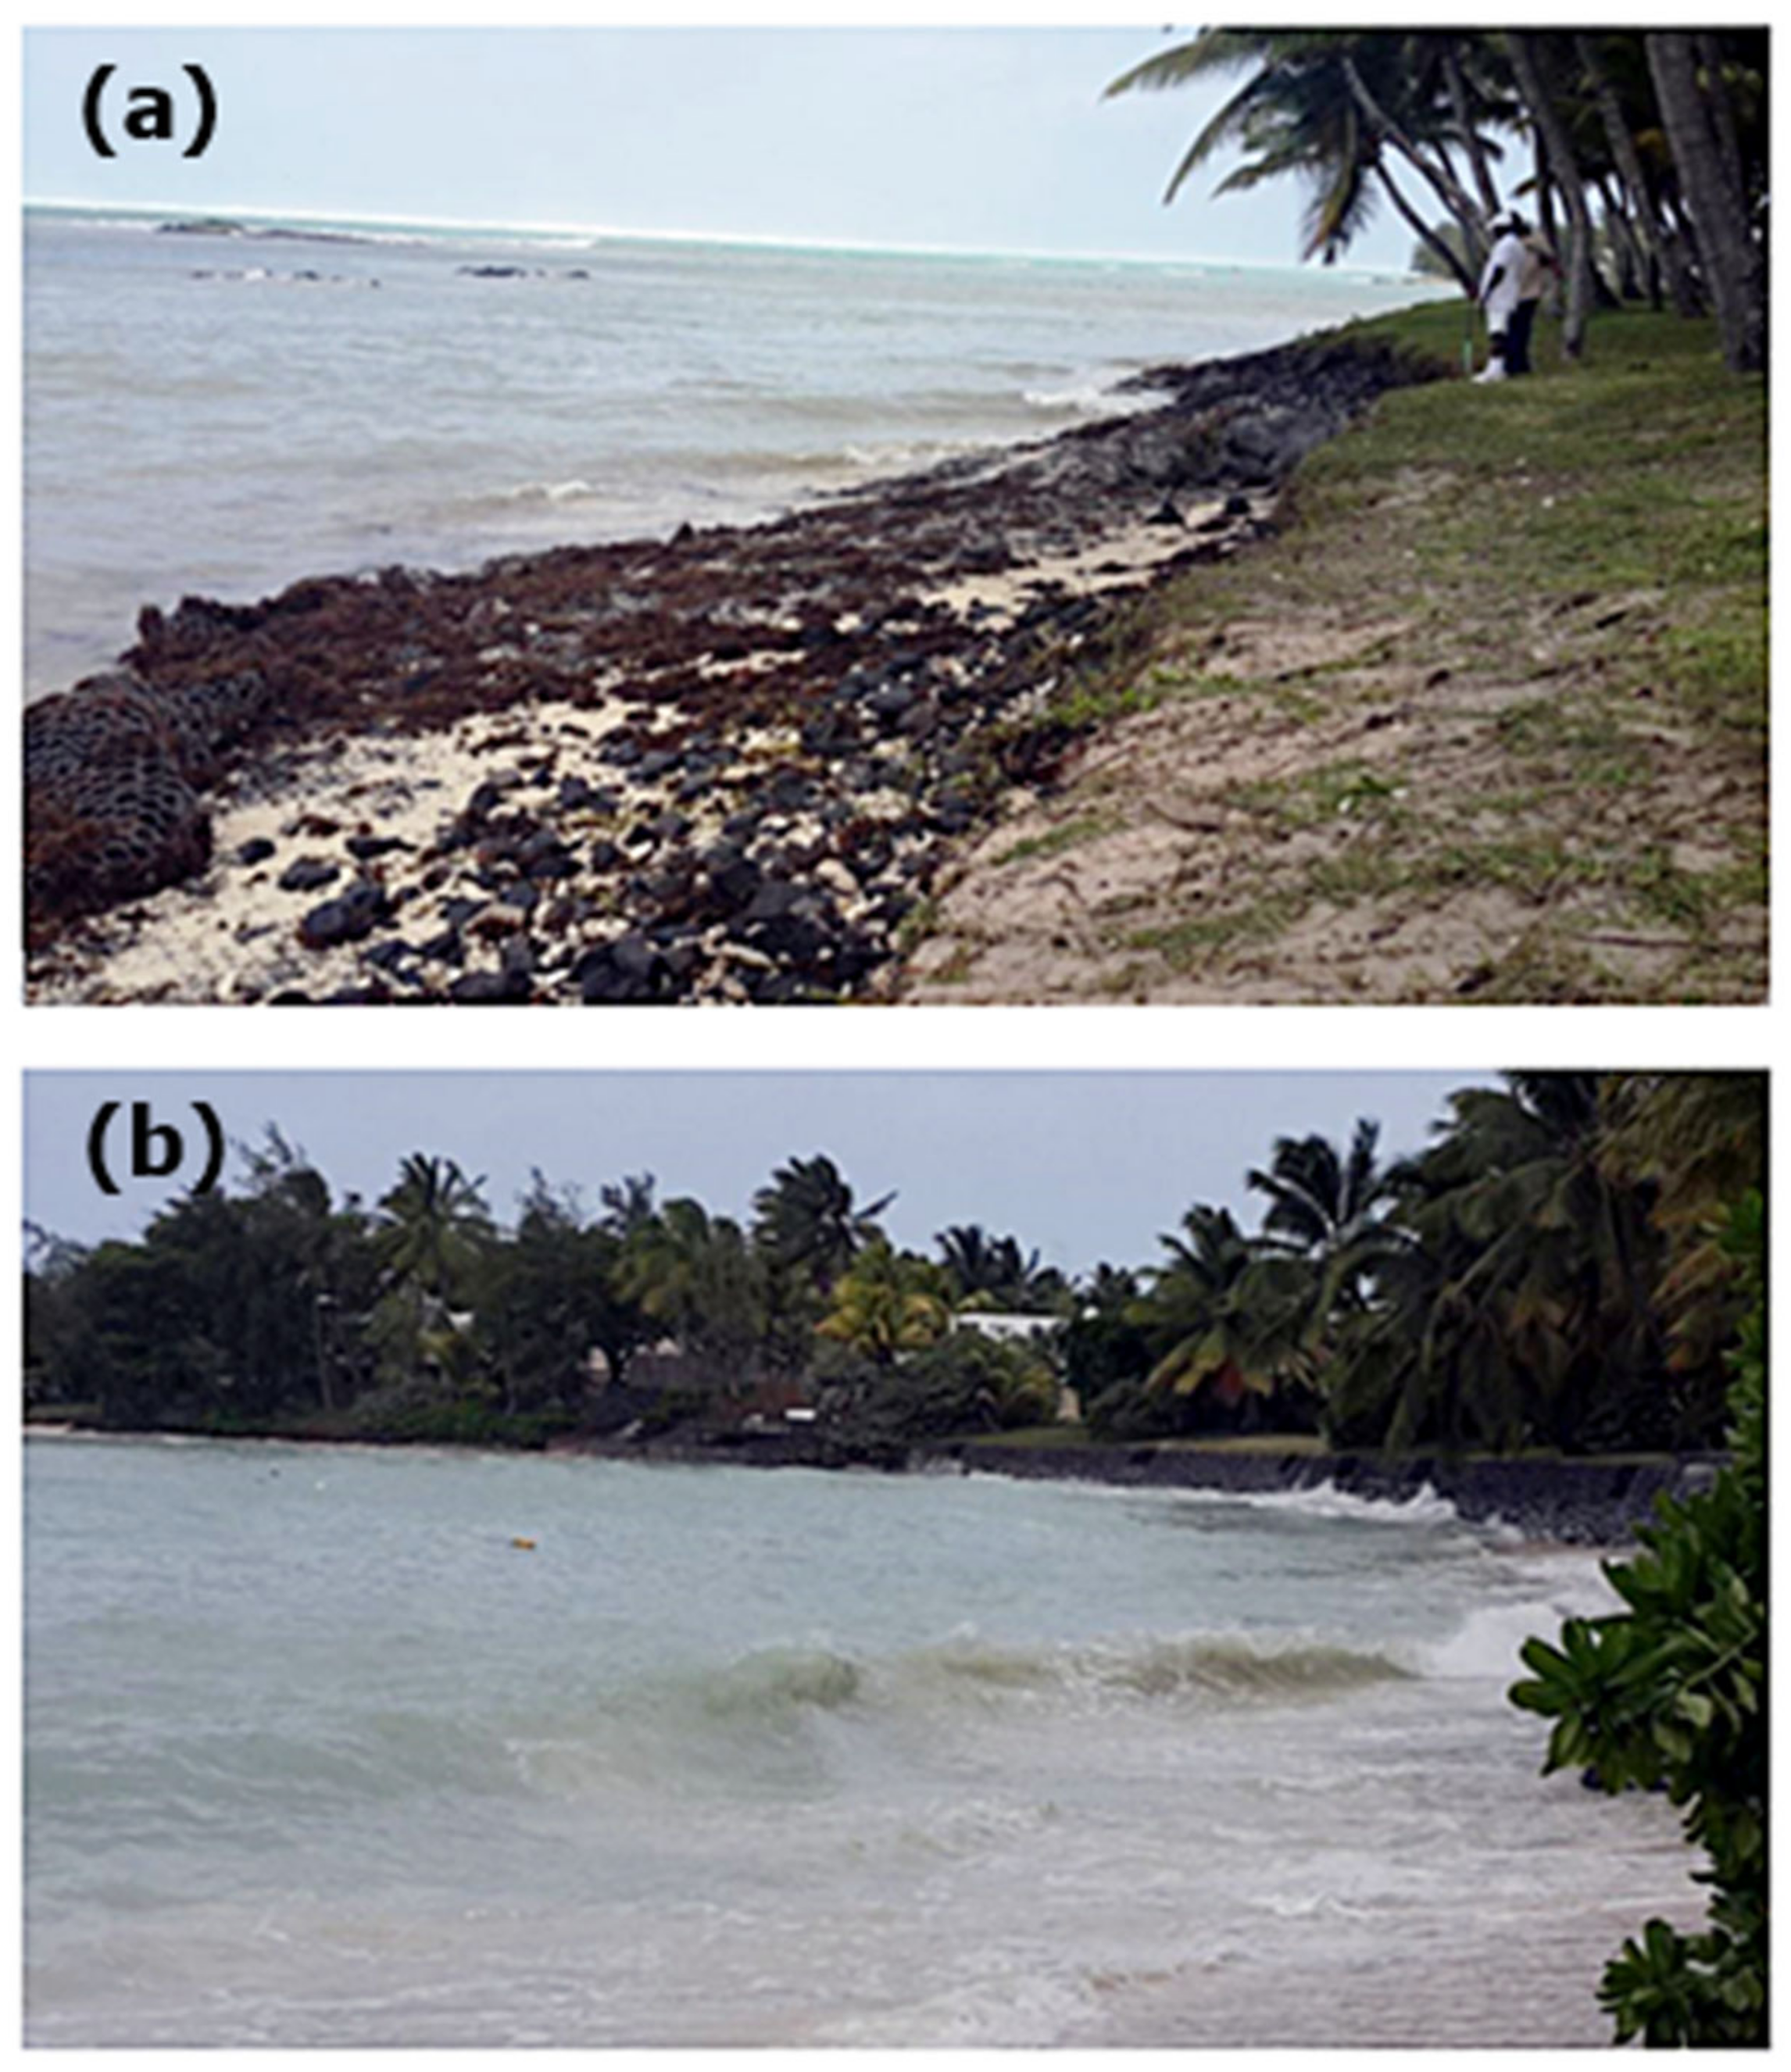
Figure 1). The resort is built on a sand spit (
Figure 2a) with underlying rock substrate. The erosion zone considered in this paper is situated in the lee of a low island (Ilot Banane) (
Figure 2b). In the year 2000, three very small circular reefs were placed nearshore, while rock-filled gabion baskets were laid along the shoreline. However, continued erosion made the beach unsuitable for resort guests by 2015 (
Figure 2b and
Figure 3). A reef with associated nourishment, constructed in October 2017 to repair the beach, is the subject of this paper.
3. Methods
A detailed boat-based bathymetry survey with GPS and vertical (wave and tide) corrections was undertaken in November 2015 over the broad region shown on
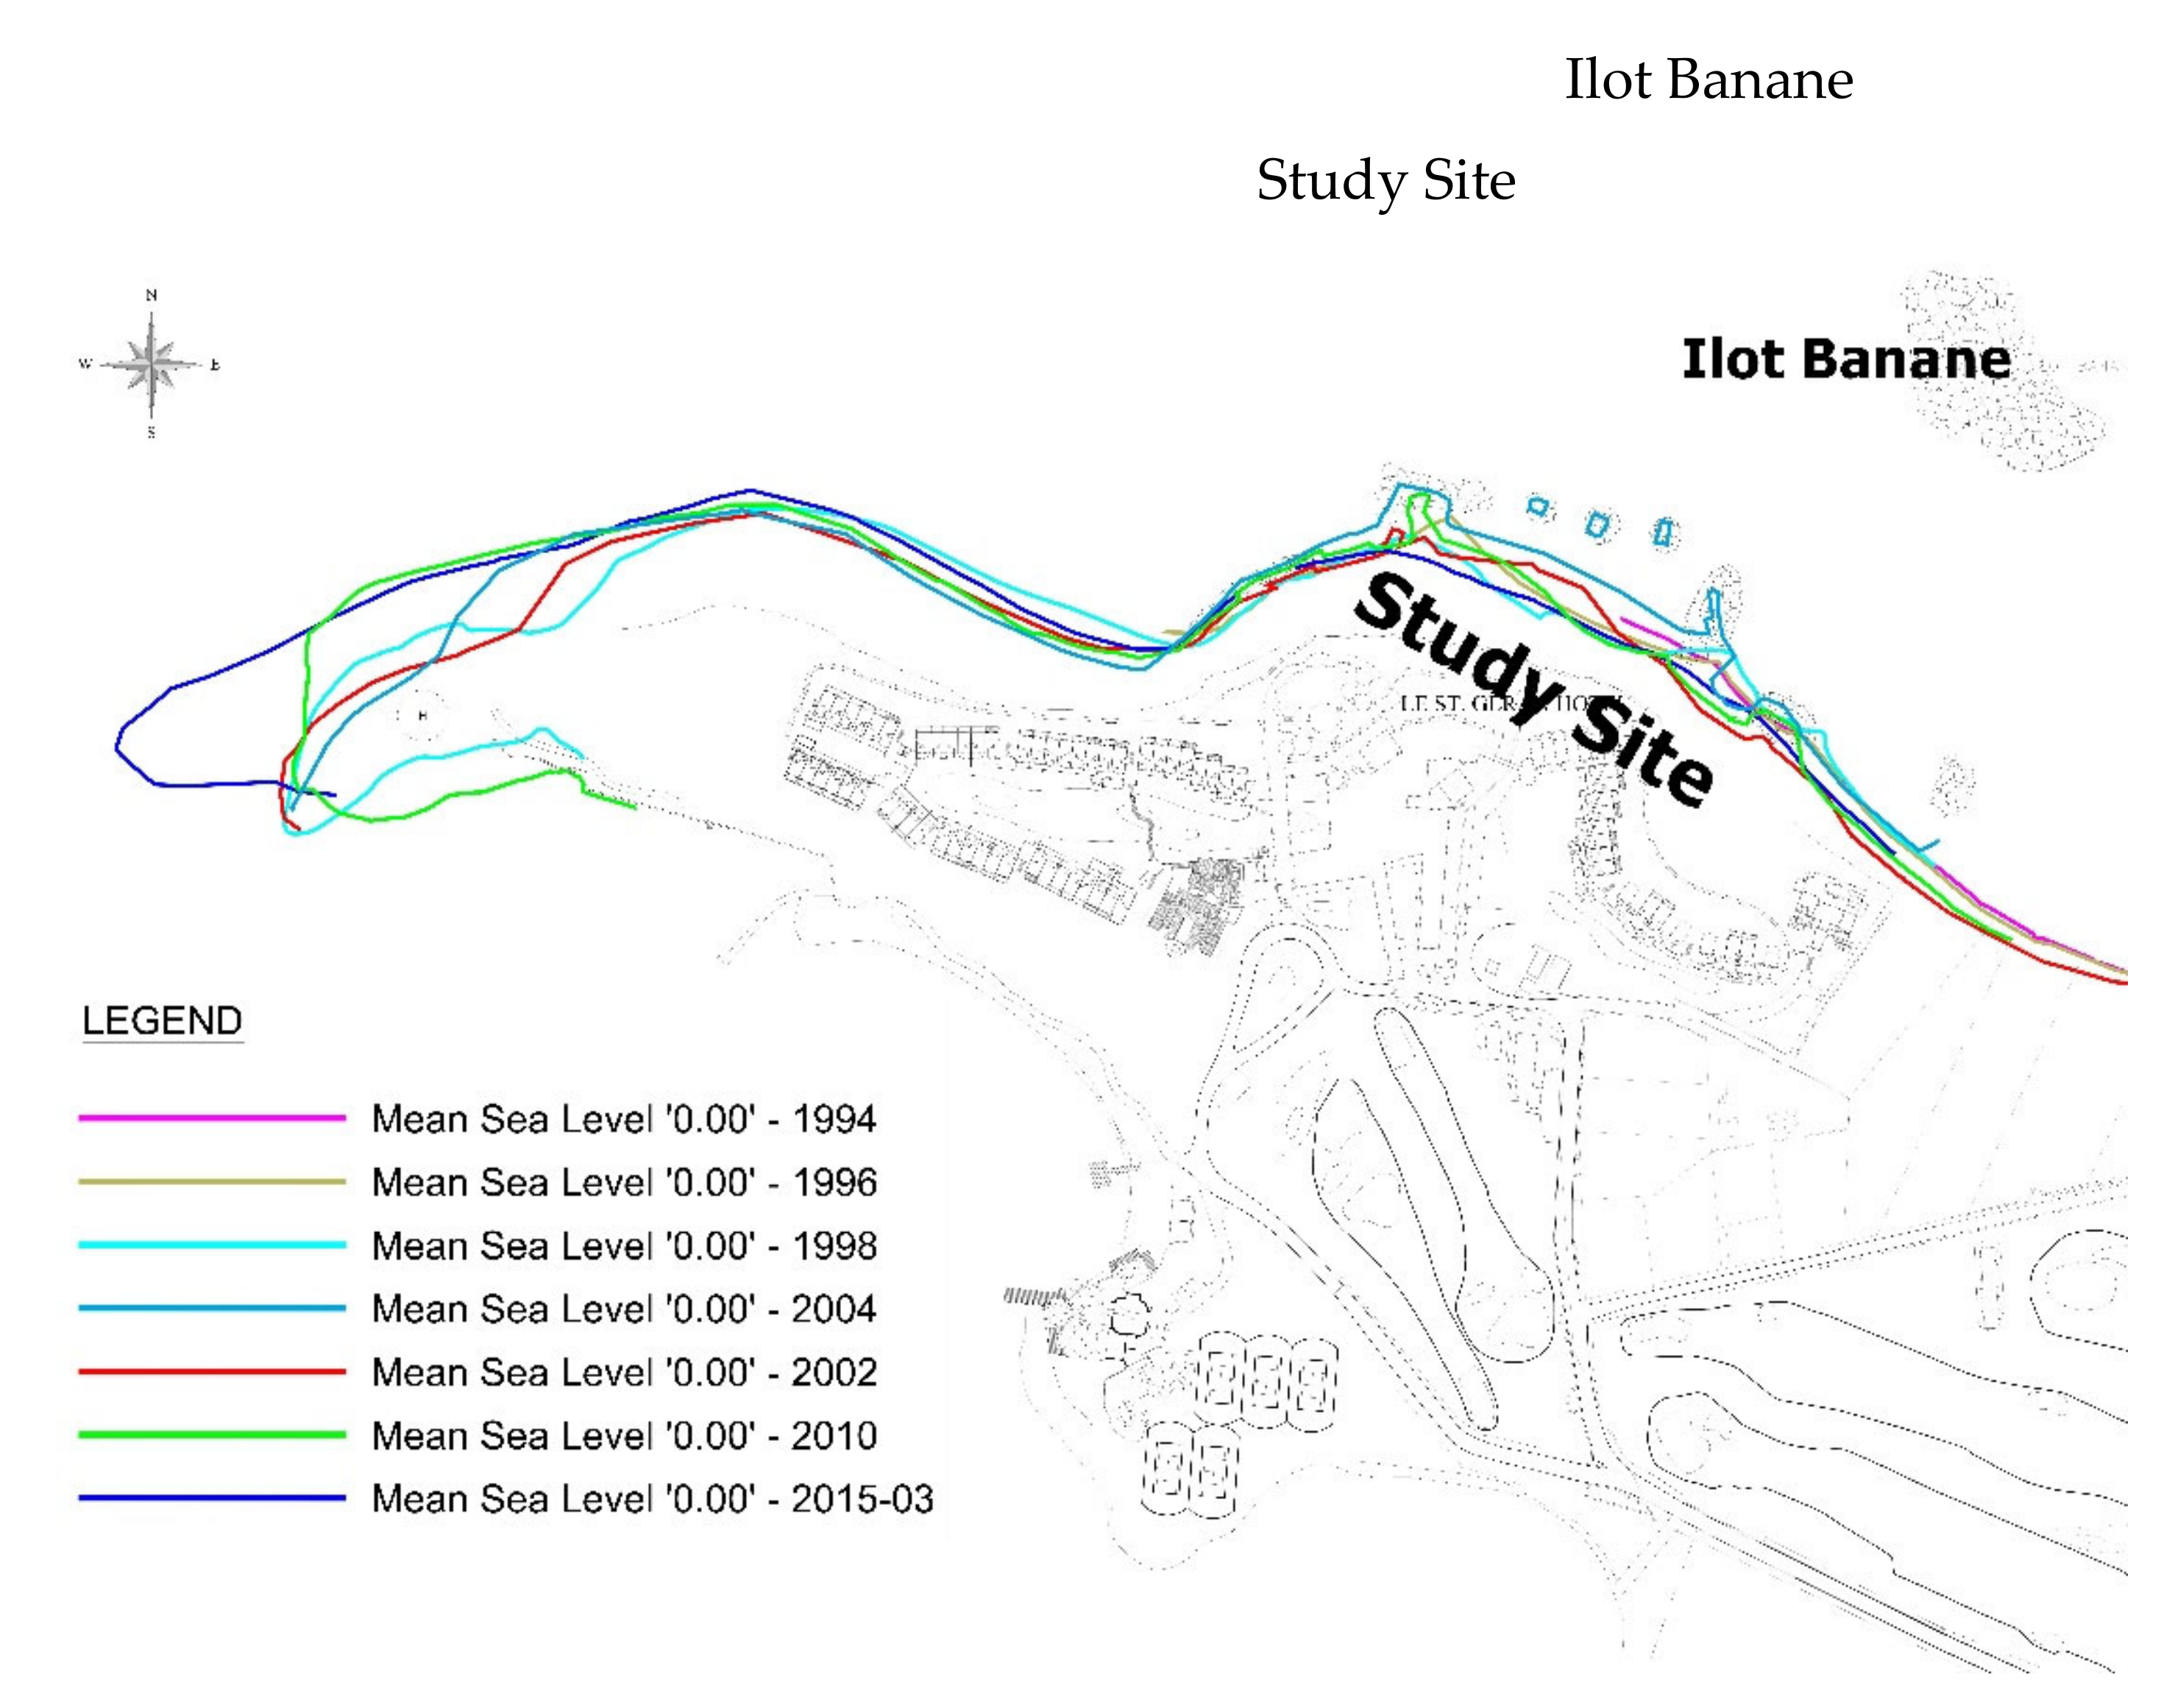
Figure 1. Along the resort foreshore, detailed beach and nearshore profile monitoring (undertaken at random intervals since 1994 (
Figure 3)) shows the shoreline variations and supplements a series of Google Earth images that depict shoreline evolution before and after reef construction.
Sediments were collected from the beach and seabed (by a diver) at 20 sites. The muddiest sediments occur in the deeper regions, especially in the relict river channel near the St Geran spit (
Figure 2a). In the lagoon and on the beach, the mud content is very low (<1%). The sands have a median size (D
50) of ~0.5 mm and the beaches have a slope of 10–15%.
Aquadopp wave/current meters were deployed at 6 locations around the study site, and drogues (hung at 0.5 m below the surface) tracked the flow paths in a range of tidal and wind conditions.
Regional and local-scale modelling was undertaken with Model 2dBeach [
15].
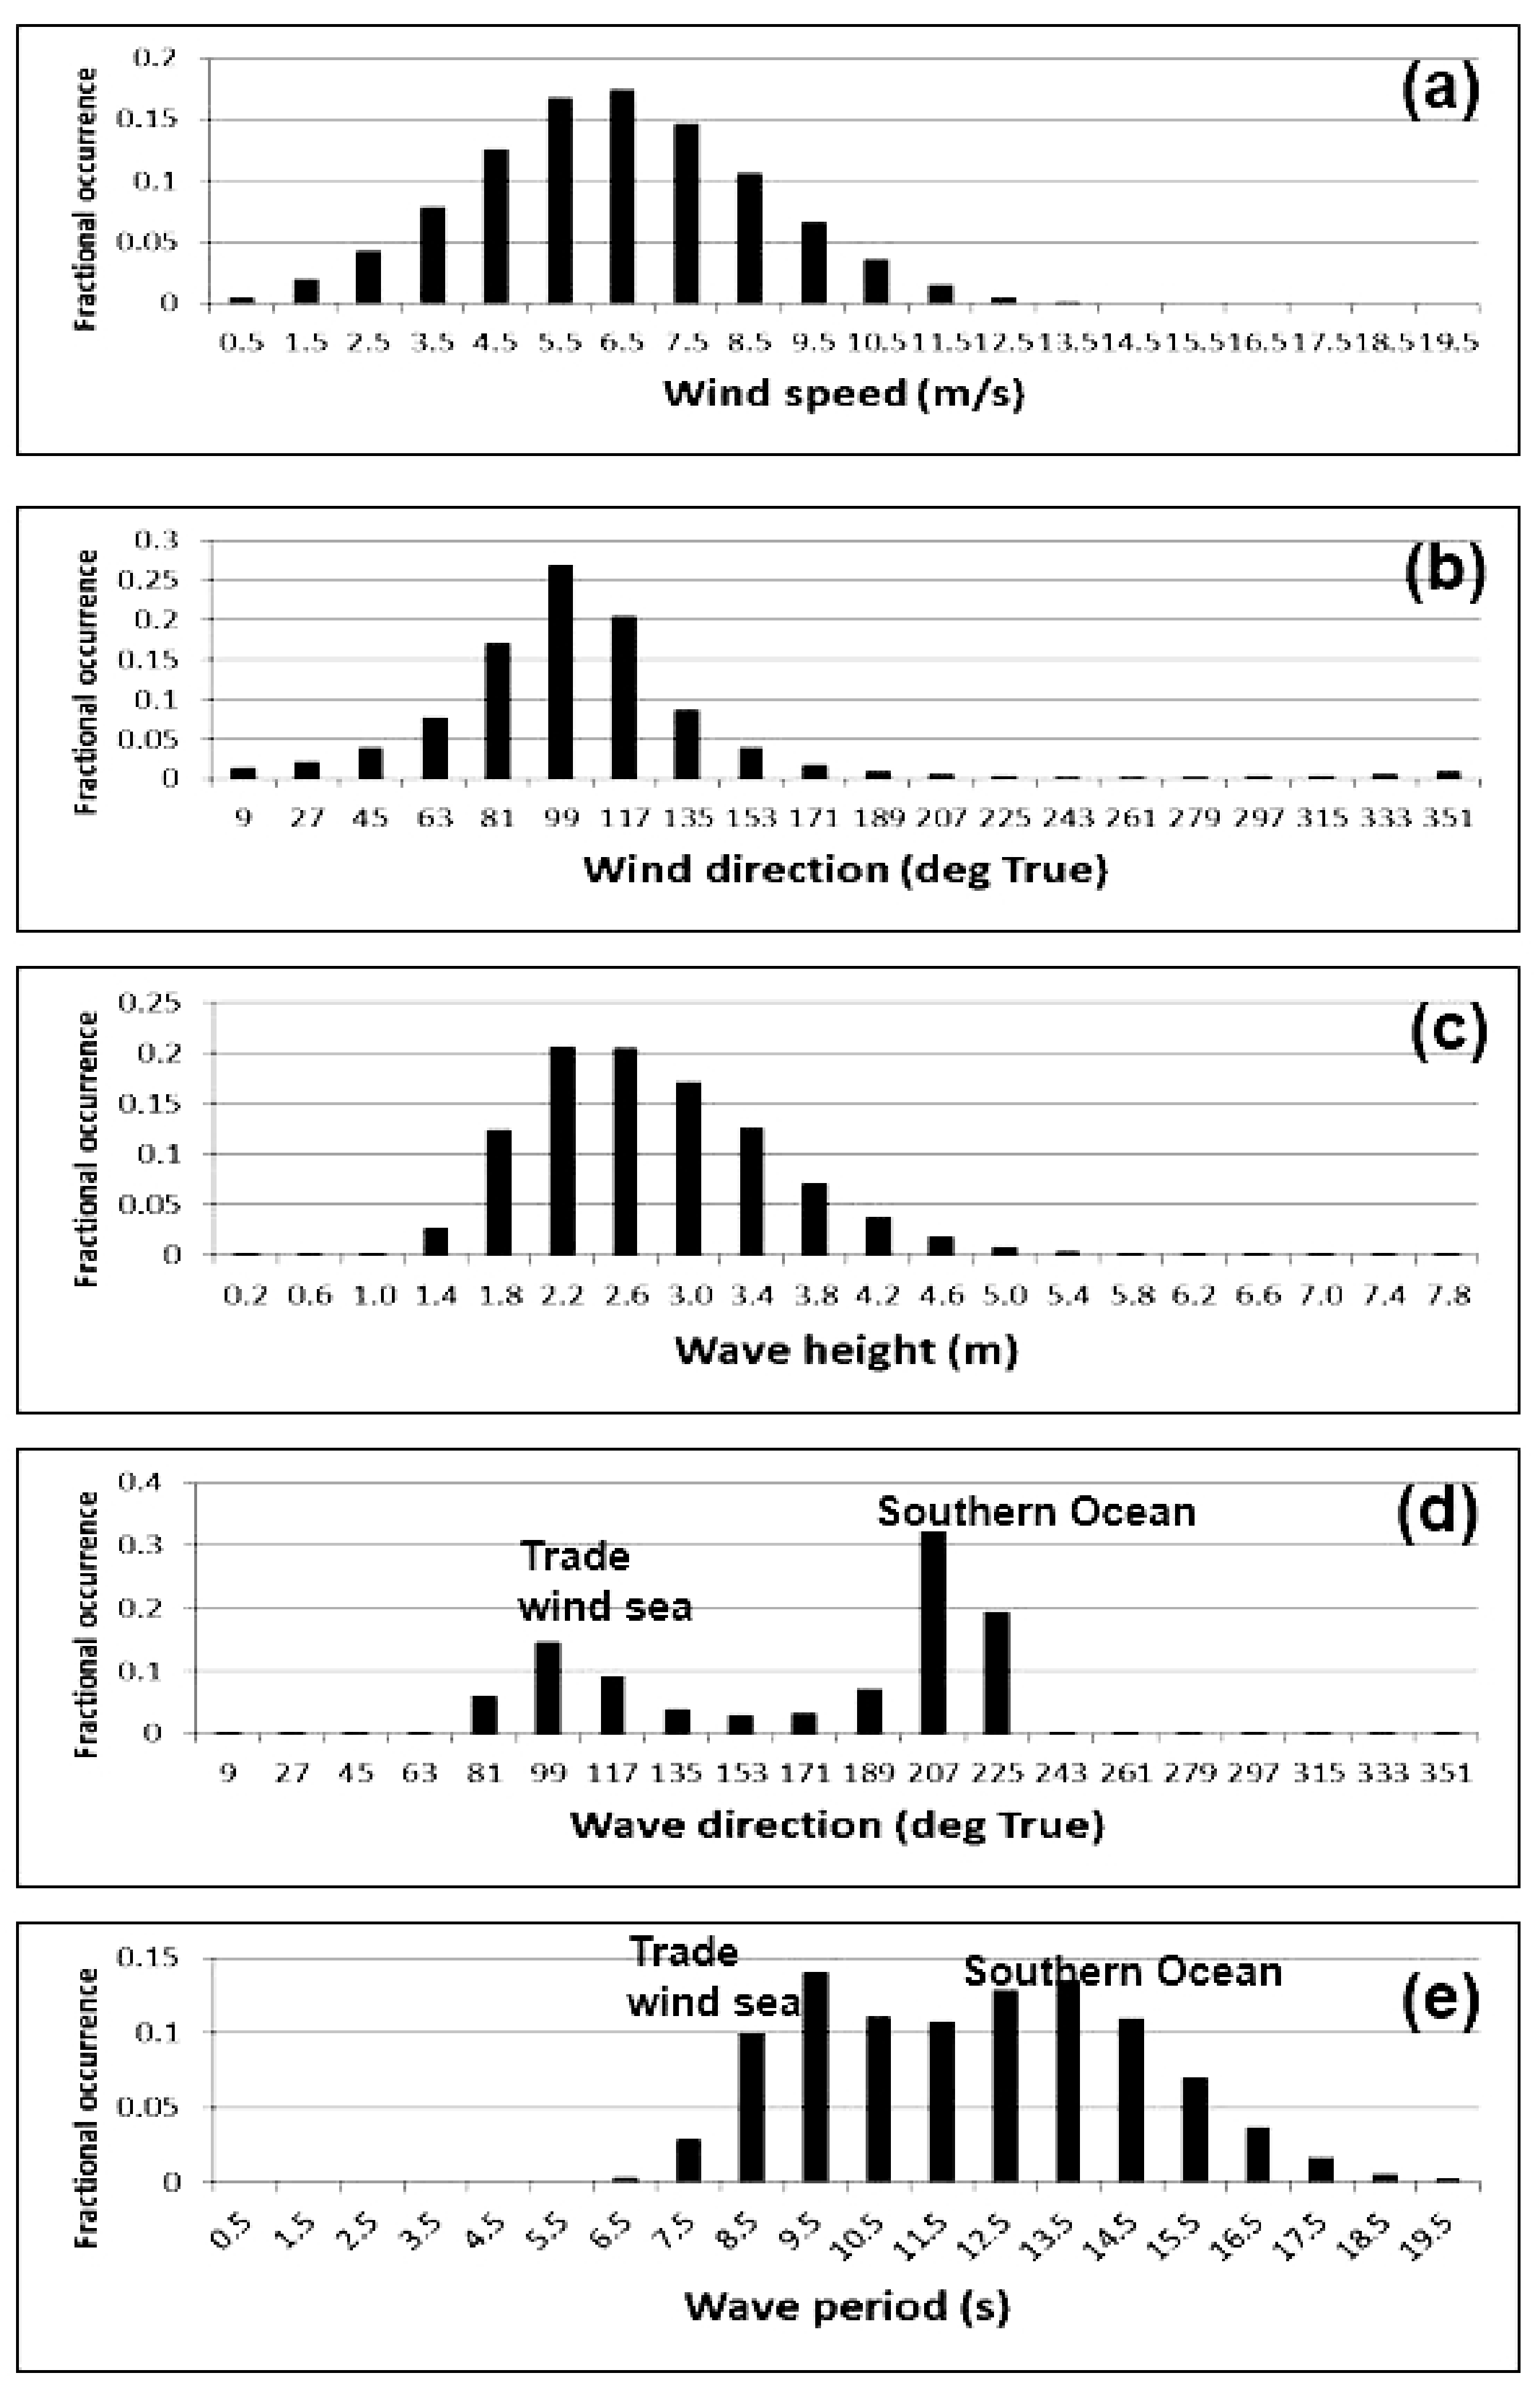
3.1. Wind and Wave Conditions around Mauritius
The winds in Mauritius are most commonly 5–8 ms
−1 from 80–120°Ttrue (
Figure 4a,b). Hindcast wave data from the Wavewatch III model [
16,
17] over 36+ years shows two common wave conditions. The south-east trade winds from 80–120° true generate heights of 2–3 m and periods of 8–10 s (
Figure 4c–e). The second common condition is associated with Southern Ocean lows, generating distant swells arriving from 200–230° true with heights exceeding 2 m and common periods of 14–15 s. The island of Mauritius blocks the Southern Ocean swells at the study site, and so the south-east waves predominate. Occasional cyclone waves from the northerly quadrant have heights exceeding 7 m (
Figure 4c,d).
3.2. Reef and Nourishment Description
The coast protection developed at the site has three components: (1) construction of an offshore reef; (2) removal of three small artificial reefs placed in the year 2000 (
Figure 2a); and (3) shoreline nourishment.
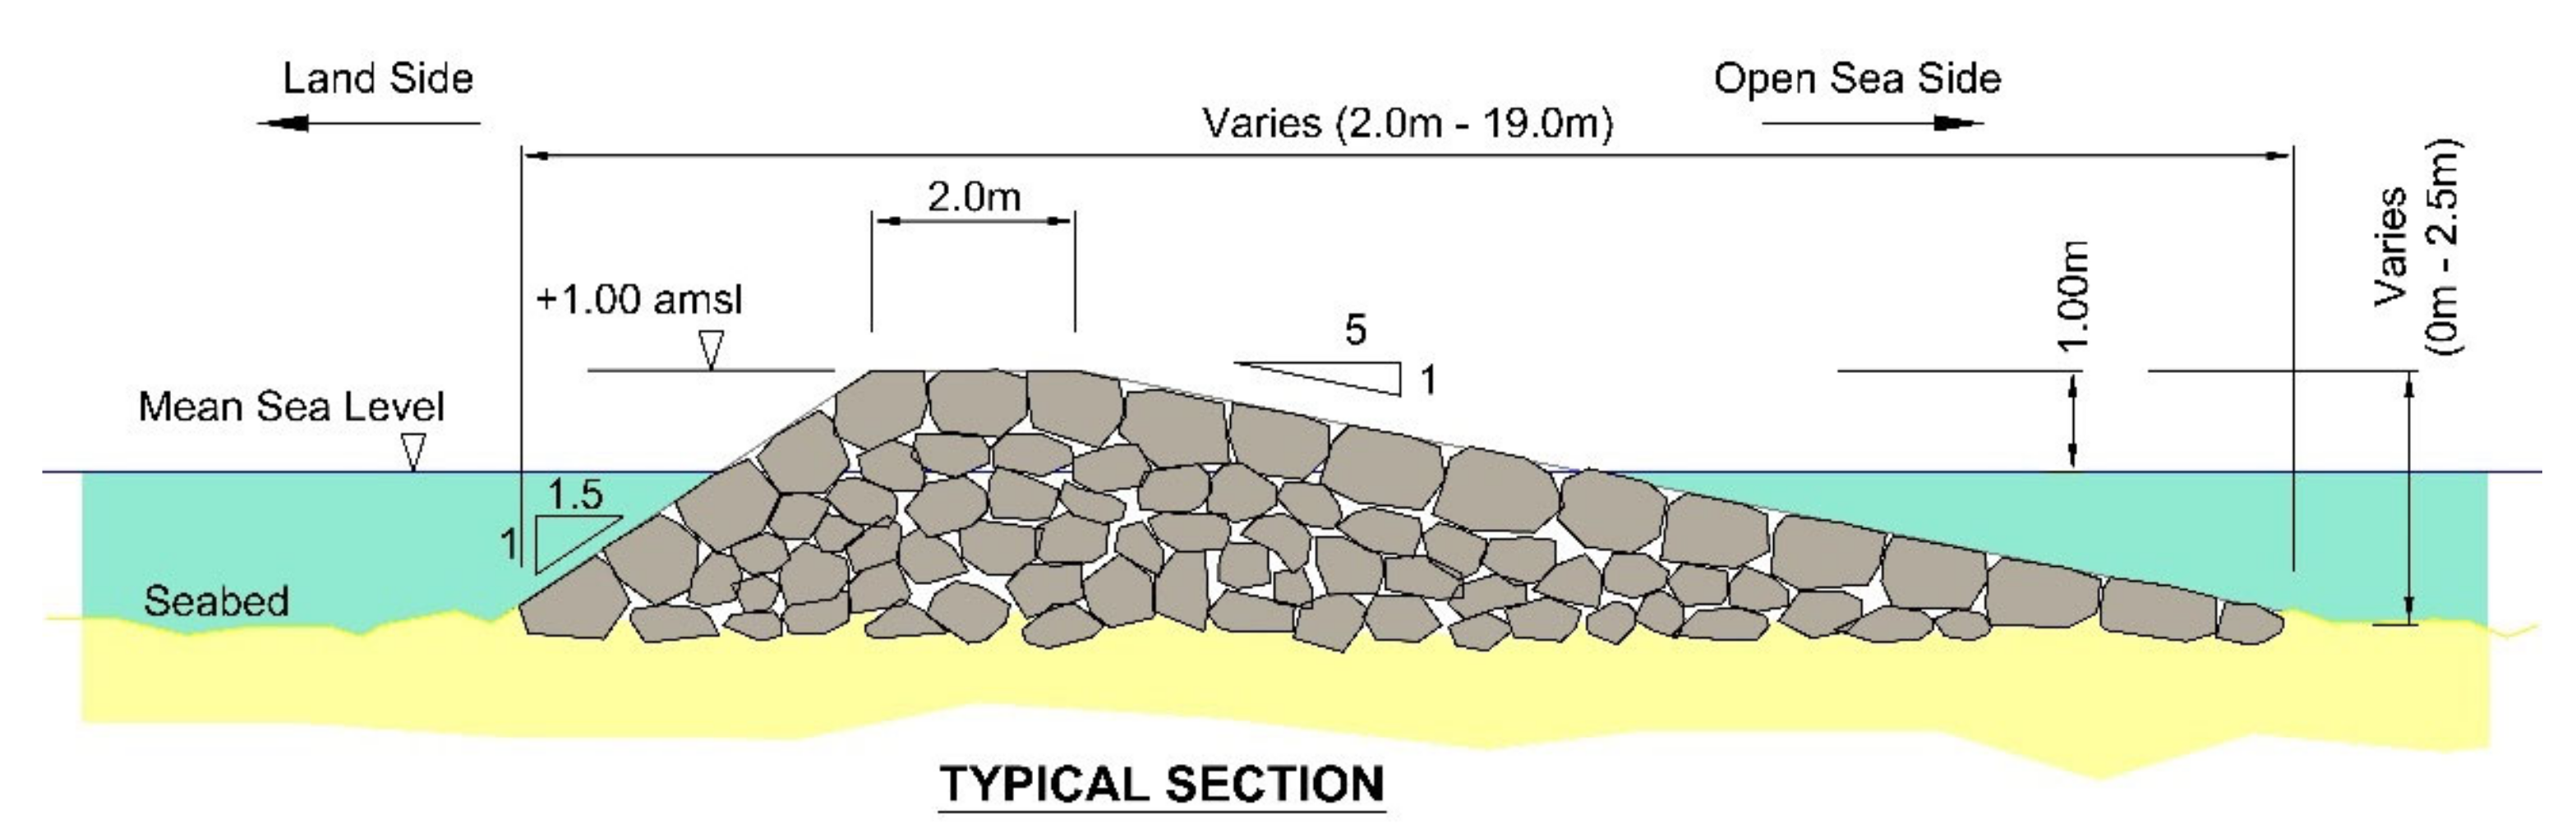
The offshore reef is 95 m long and extends off the western side of Ilot Banane (
Figure 5d). Mean crest height was 1.0–1.2 m above mean sea level, which is just above spring high-tide level. The reef cross-section has base width of 19 m and crest width of 2 m (
Figure 6). The offshore face of the reef has a lower gradient than the lee face (
Figure 6) to enhance rock stability and wave height losses. The reef was constructed from 0.5–1.0 tonne boulders with a total volume of 2400 m
3.
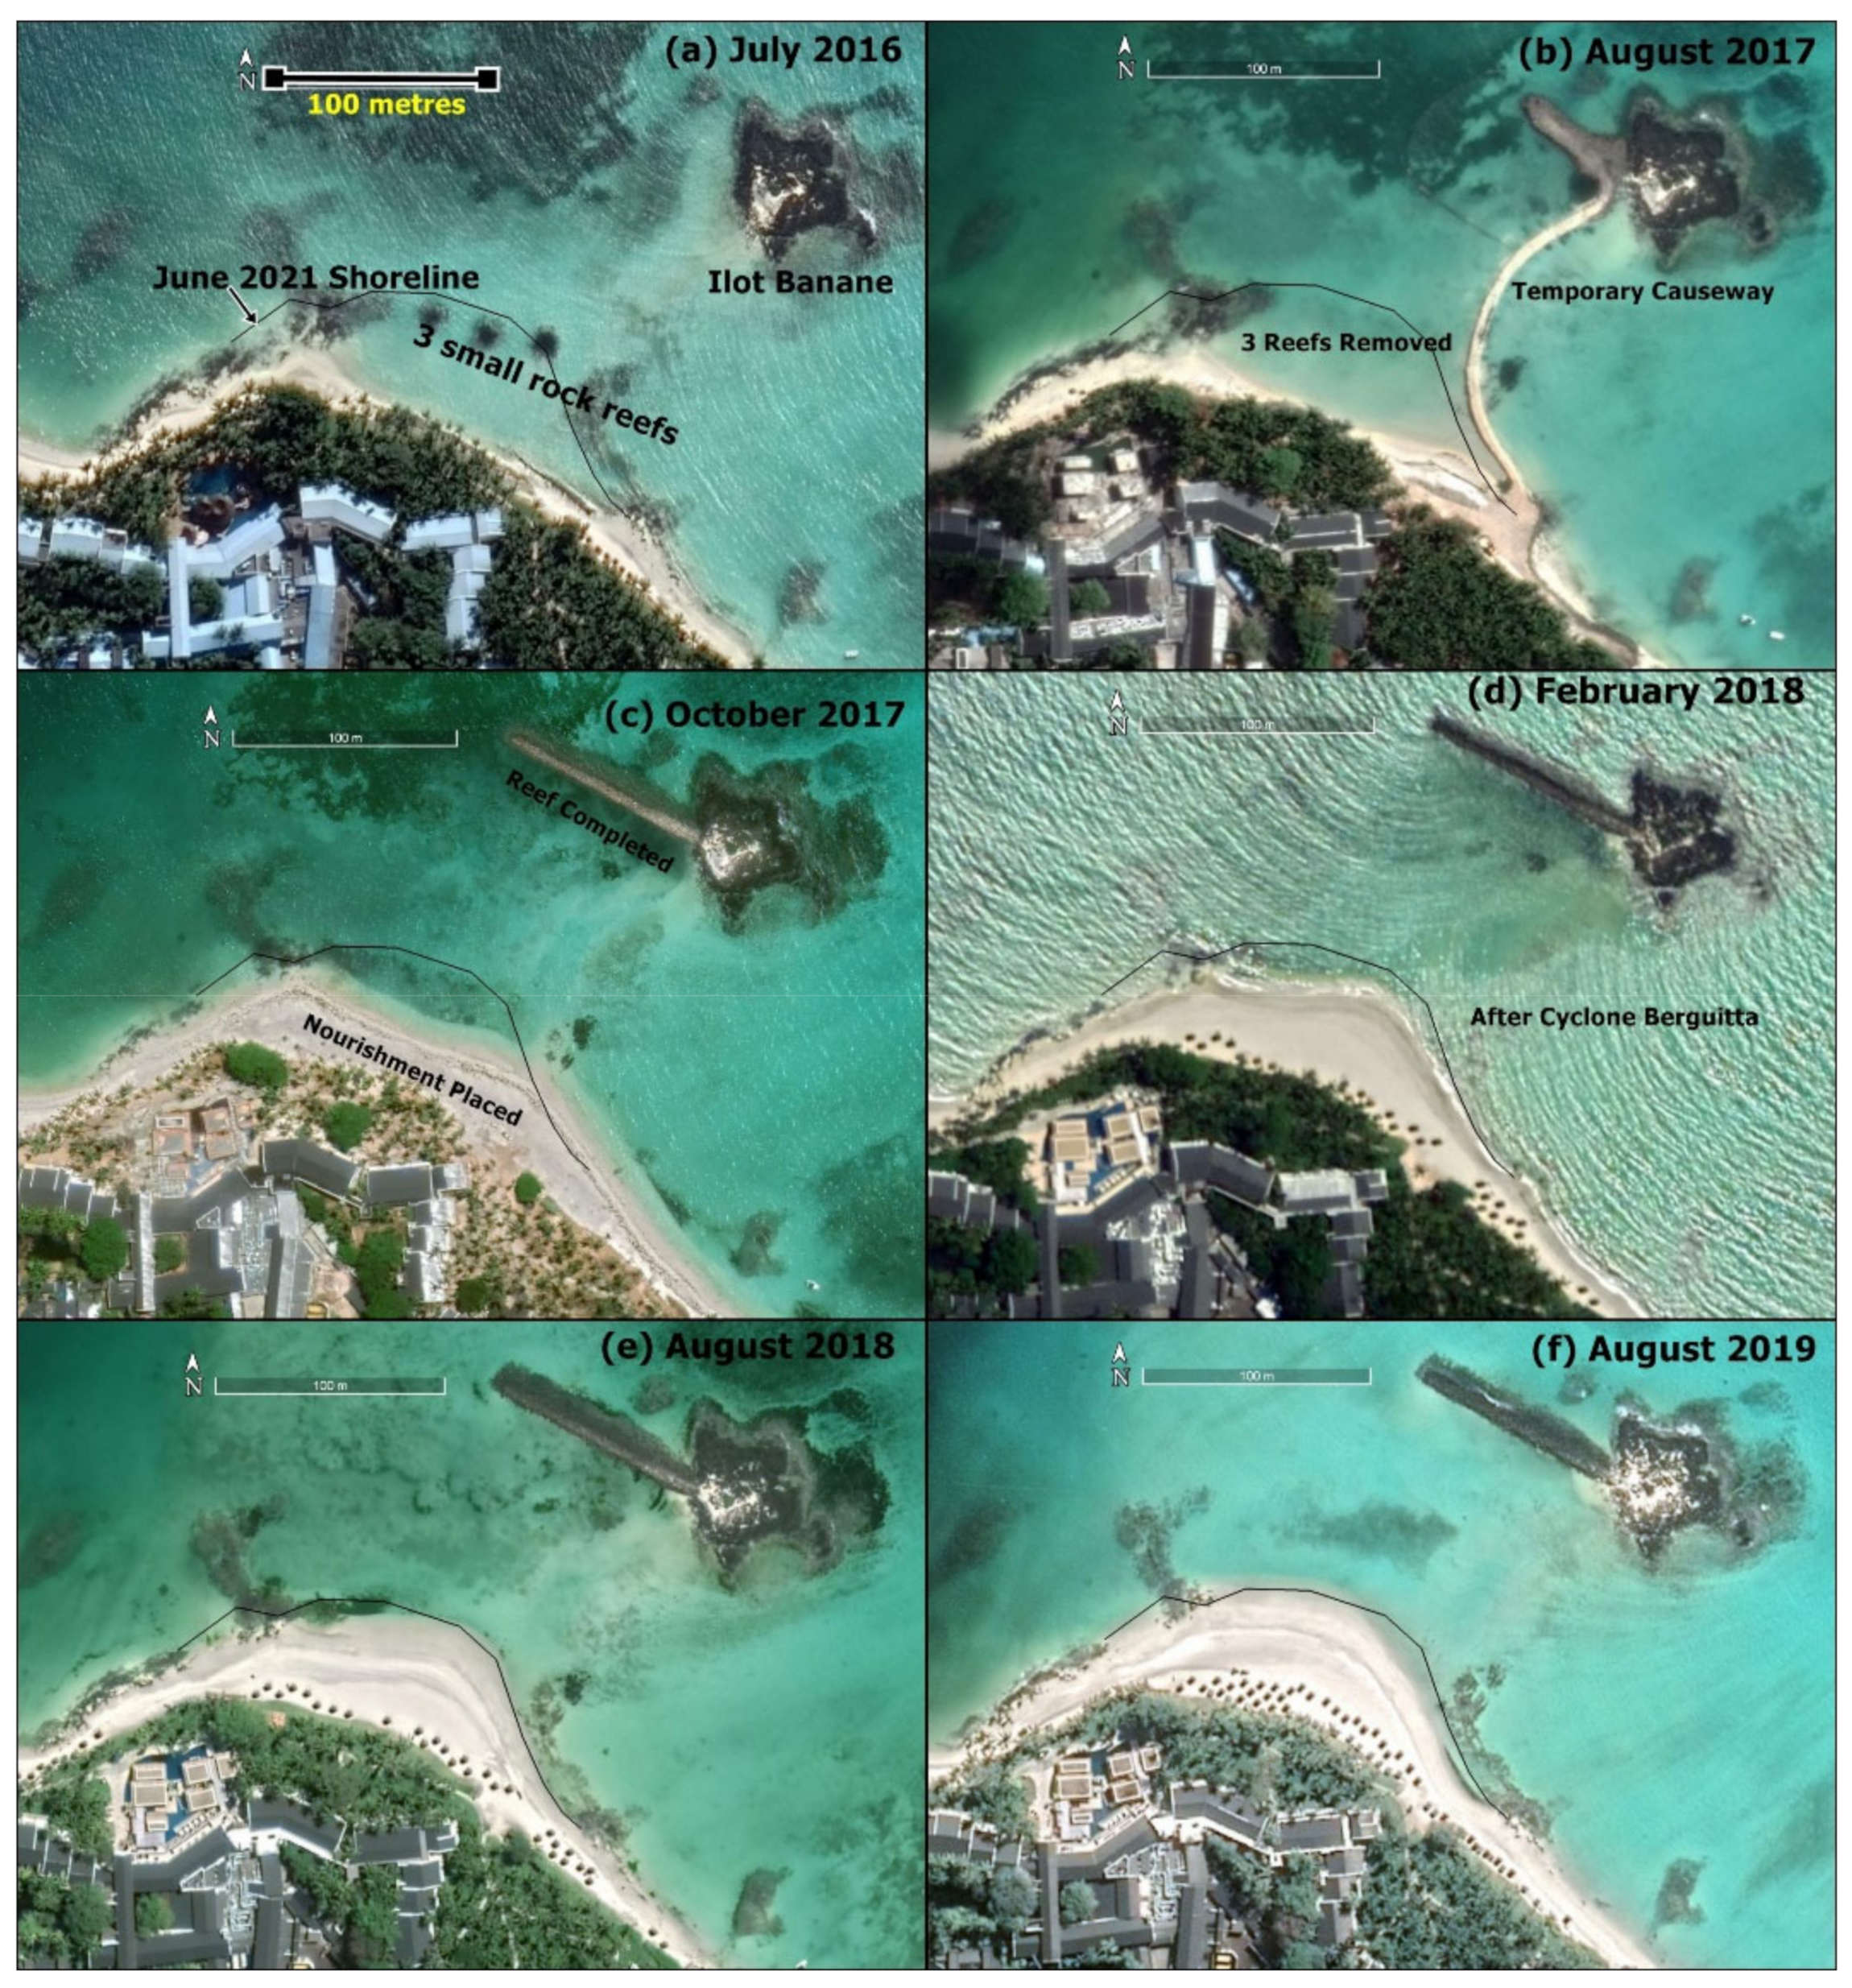
The construction and nourishment were conducted over 3 months and completed in October 2017. For ease of construction, a temporary causeway was built using sand-filled geotextile bags to link the shoreline to Ilot Banane (
Figure 5a,b). This allowed machinery and rock deliveries to reach the island with minimal cost and environmental impact. An excavator placed the rock. When complete, the causeway was removed by spilling the sand from the geobags (which were taken back to shore) (
Figure 5c), while the loose sand formed part of 12,000 m
3 of nourishment placed on the beach in the lee of the reef (
Figure 5c). Nourishment sand was extracted from the sand spit, located 600 m to the west (
Figure 2a), and back-passed onto the eroding beach by truck.
4. Results
An overview of the regional circulation is presented for context and to identify key circulation patterns relevant to potential nourishment sources. Local dynamics around the study site are then considered in relation to reef design. Finally, shoreline changes in the lee of the reef are presented using historical Google Earth images, noting that ground-truthing beach profile surveys are not presented here.
4.1. Overview: Fringing Reef and Lagoon Circulation
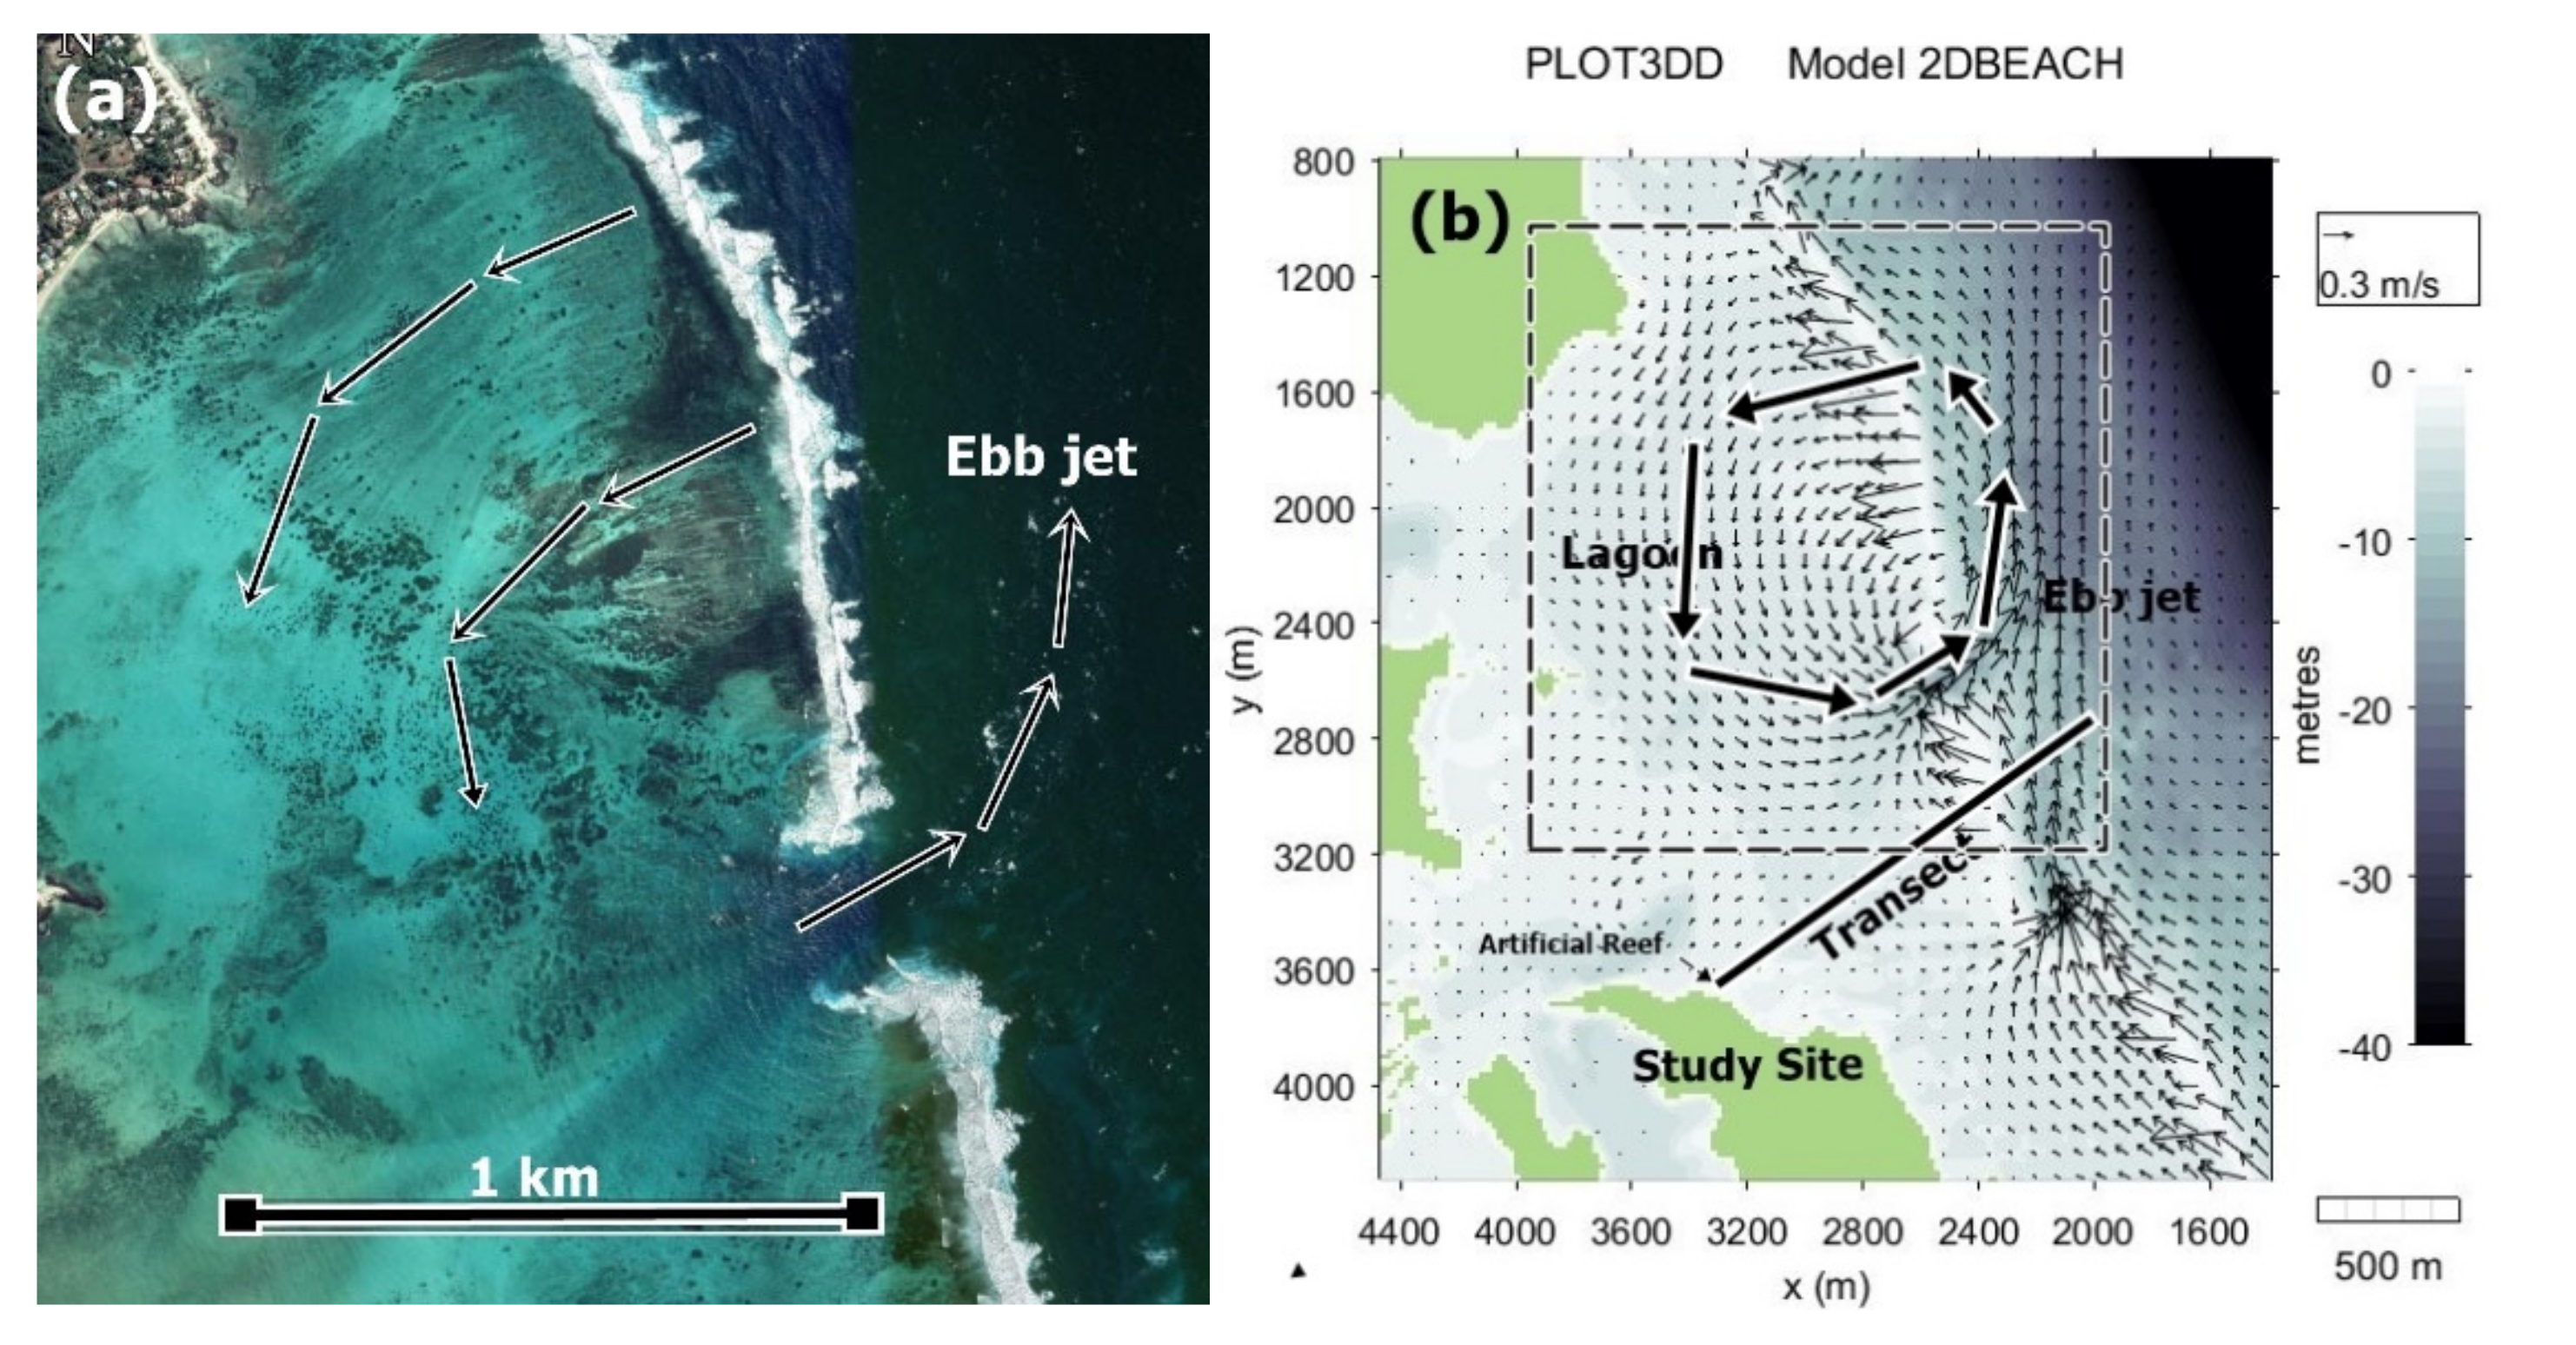
At the regional scale, wave breaking on the fringing reefs forces a current over the reef crest and into the lagoon [
6]. This excess water flows along the lagoon to find an exit. The wide and deep reef passes, where the waves are not breaking, are a common exit location. This pattern is seen in the numerical model and in Google Earth images of the entrance (
Figure 7a,b).
Because of the clear water in the tropical lagoons around Mauritius, circulation patterns can be often inferred from the seabed scour marks that depict the dominant sediment pathways. In
Figure 7a, seabed scour marks depict a circulation loop entering over the reef crest and exiting via the main pass. In
Figure 7b, the circulation loop from the numerical model carries sand over the reef crest, around the lagoon, out through the pass and back along the front of the reef. The model prediction and the circulation inferred from the seabed scour marks are in close agreement.
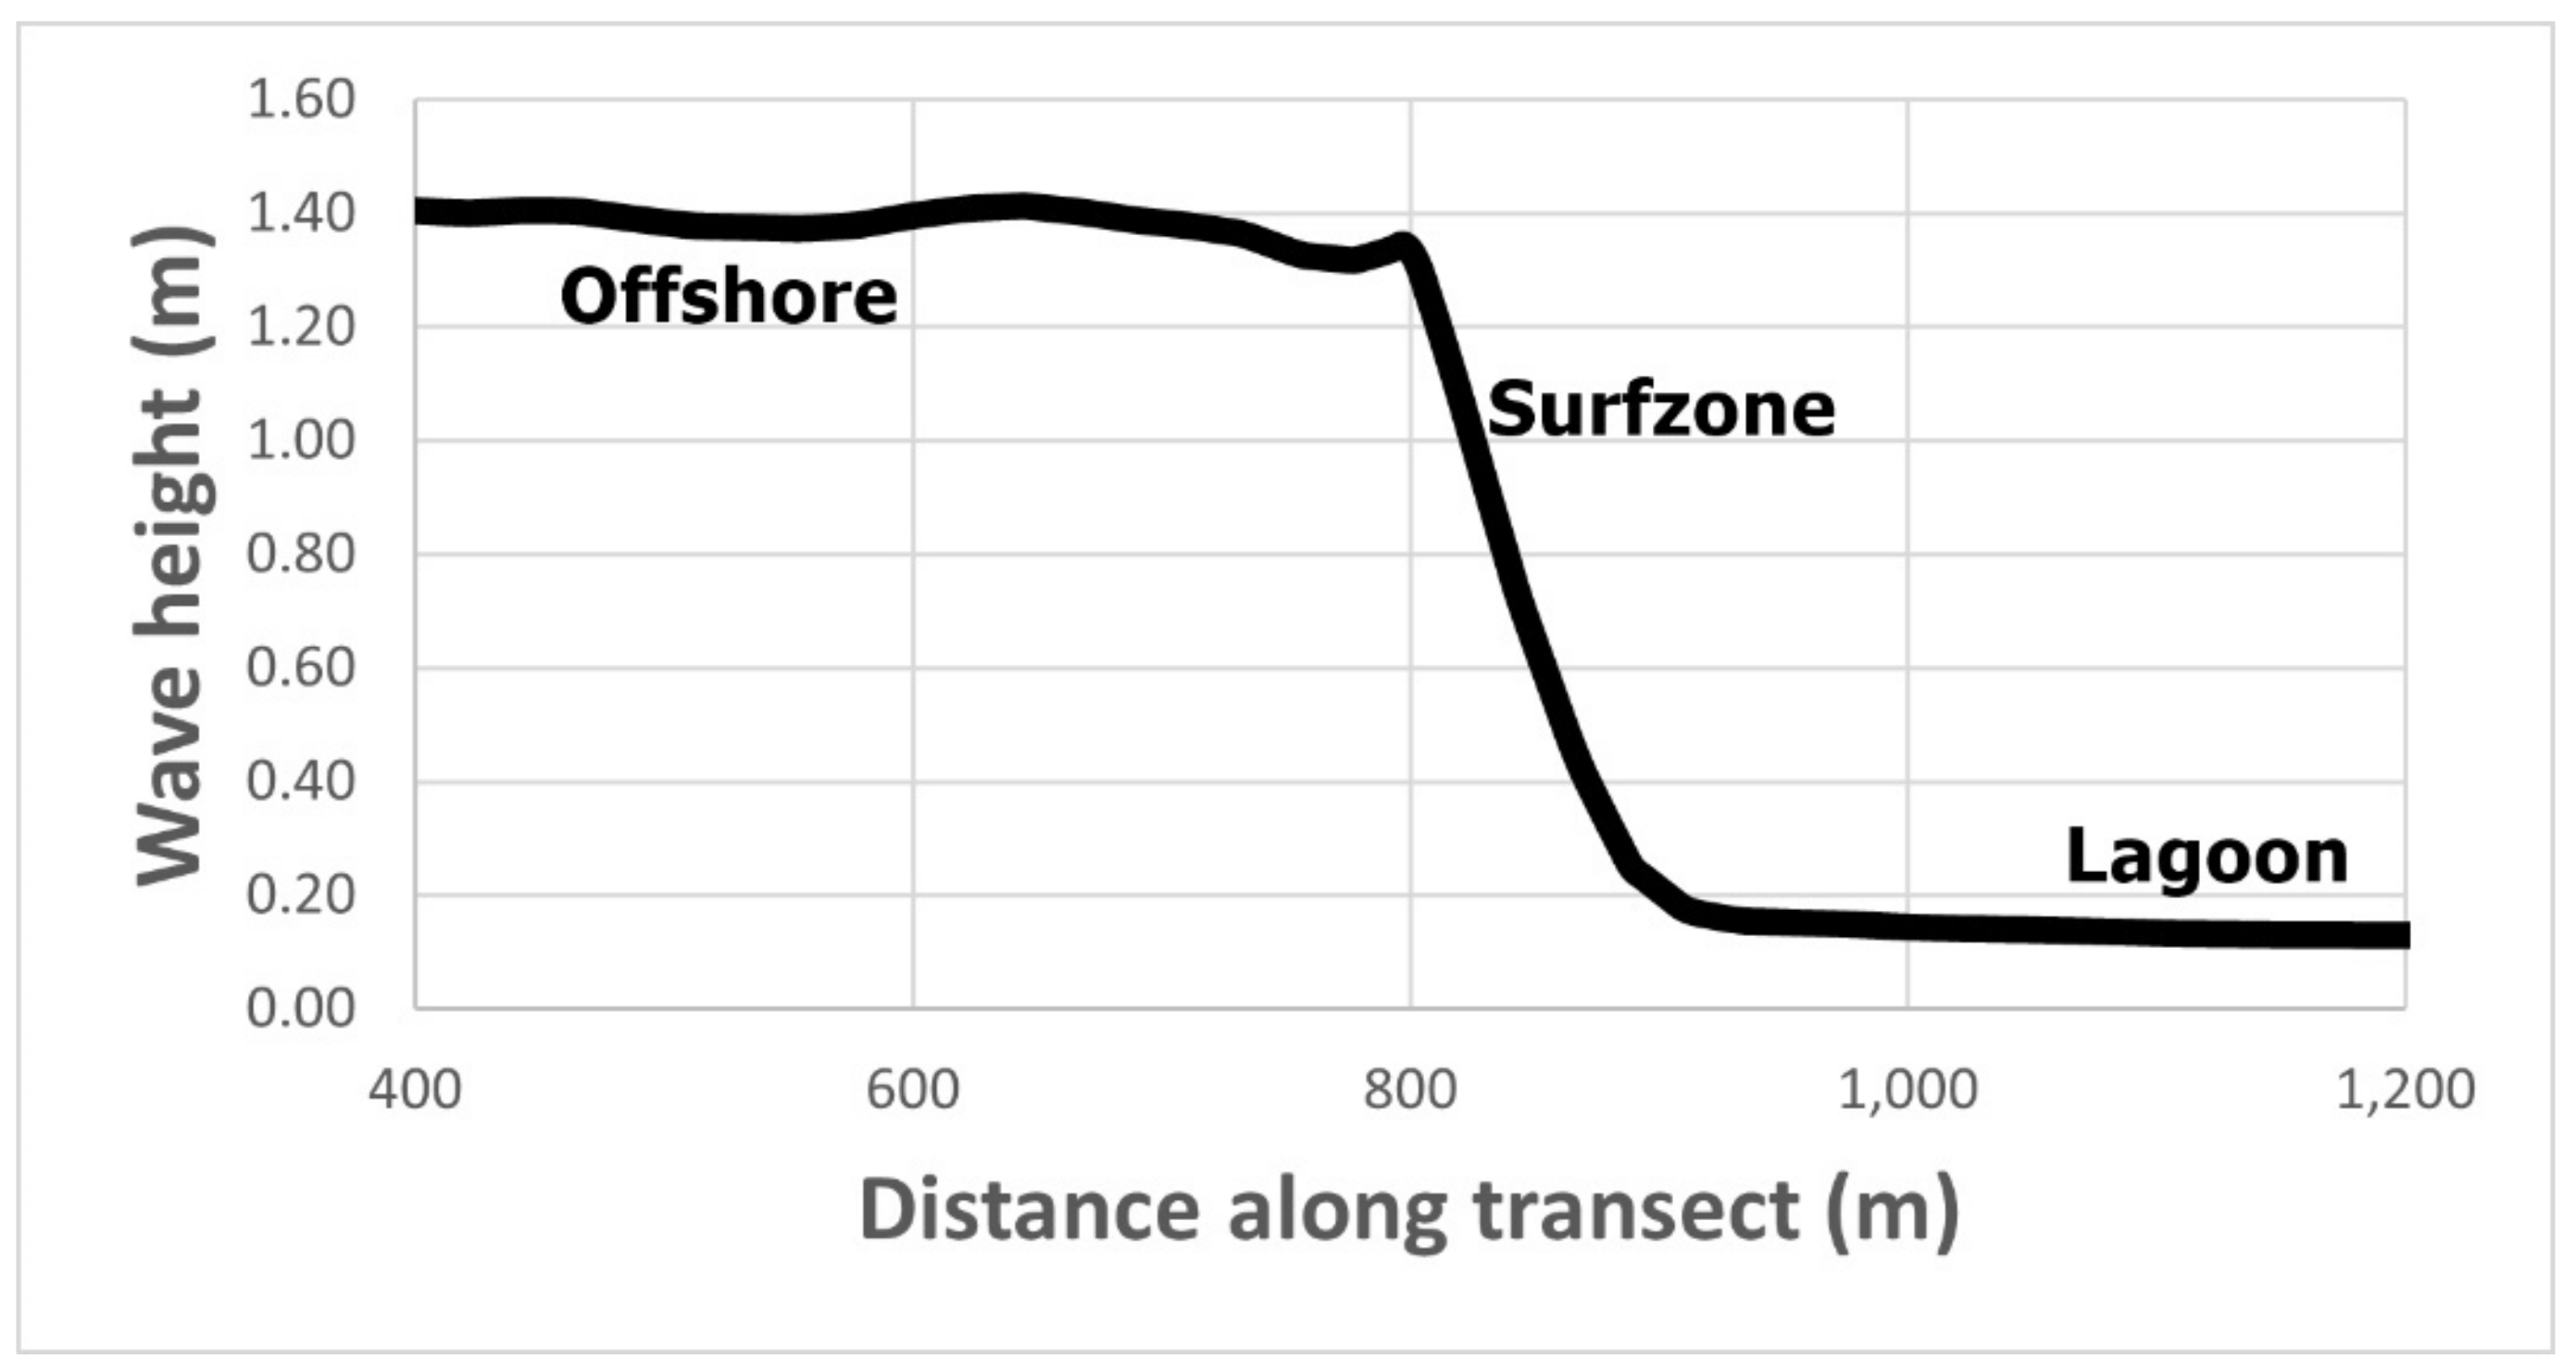
The wave height transformation from deep water to the study site is presented in
Figure 8 (along the transect shown in
Figure 7b). Seaward of the fringing reef, wave height initially dissipates slowly due to: (1) refraction; (2) shoaling in intermediate depths; and (3) high seabed frictional losses over the rough coral on the reef face. Just before breaking on the fringing reef face, the wave height increases by shoaling and then dissipates rapidly in the surf zone due to wave breaking and the formation of multiple wave crests. Height reduces slowly in the lagoon, mostly determined by seabed frictional resistance and refraction.
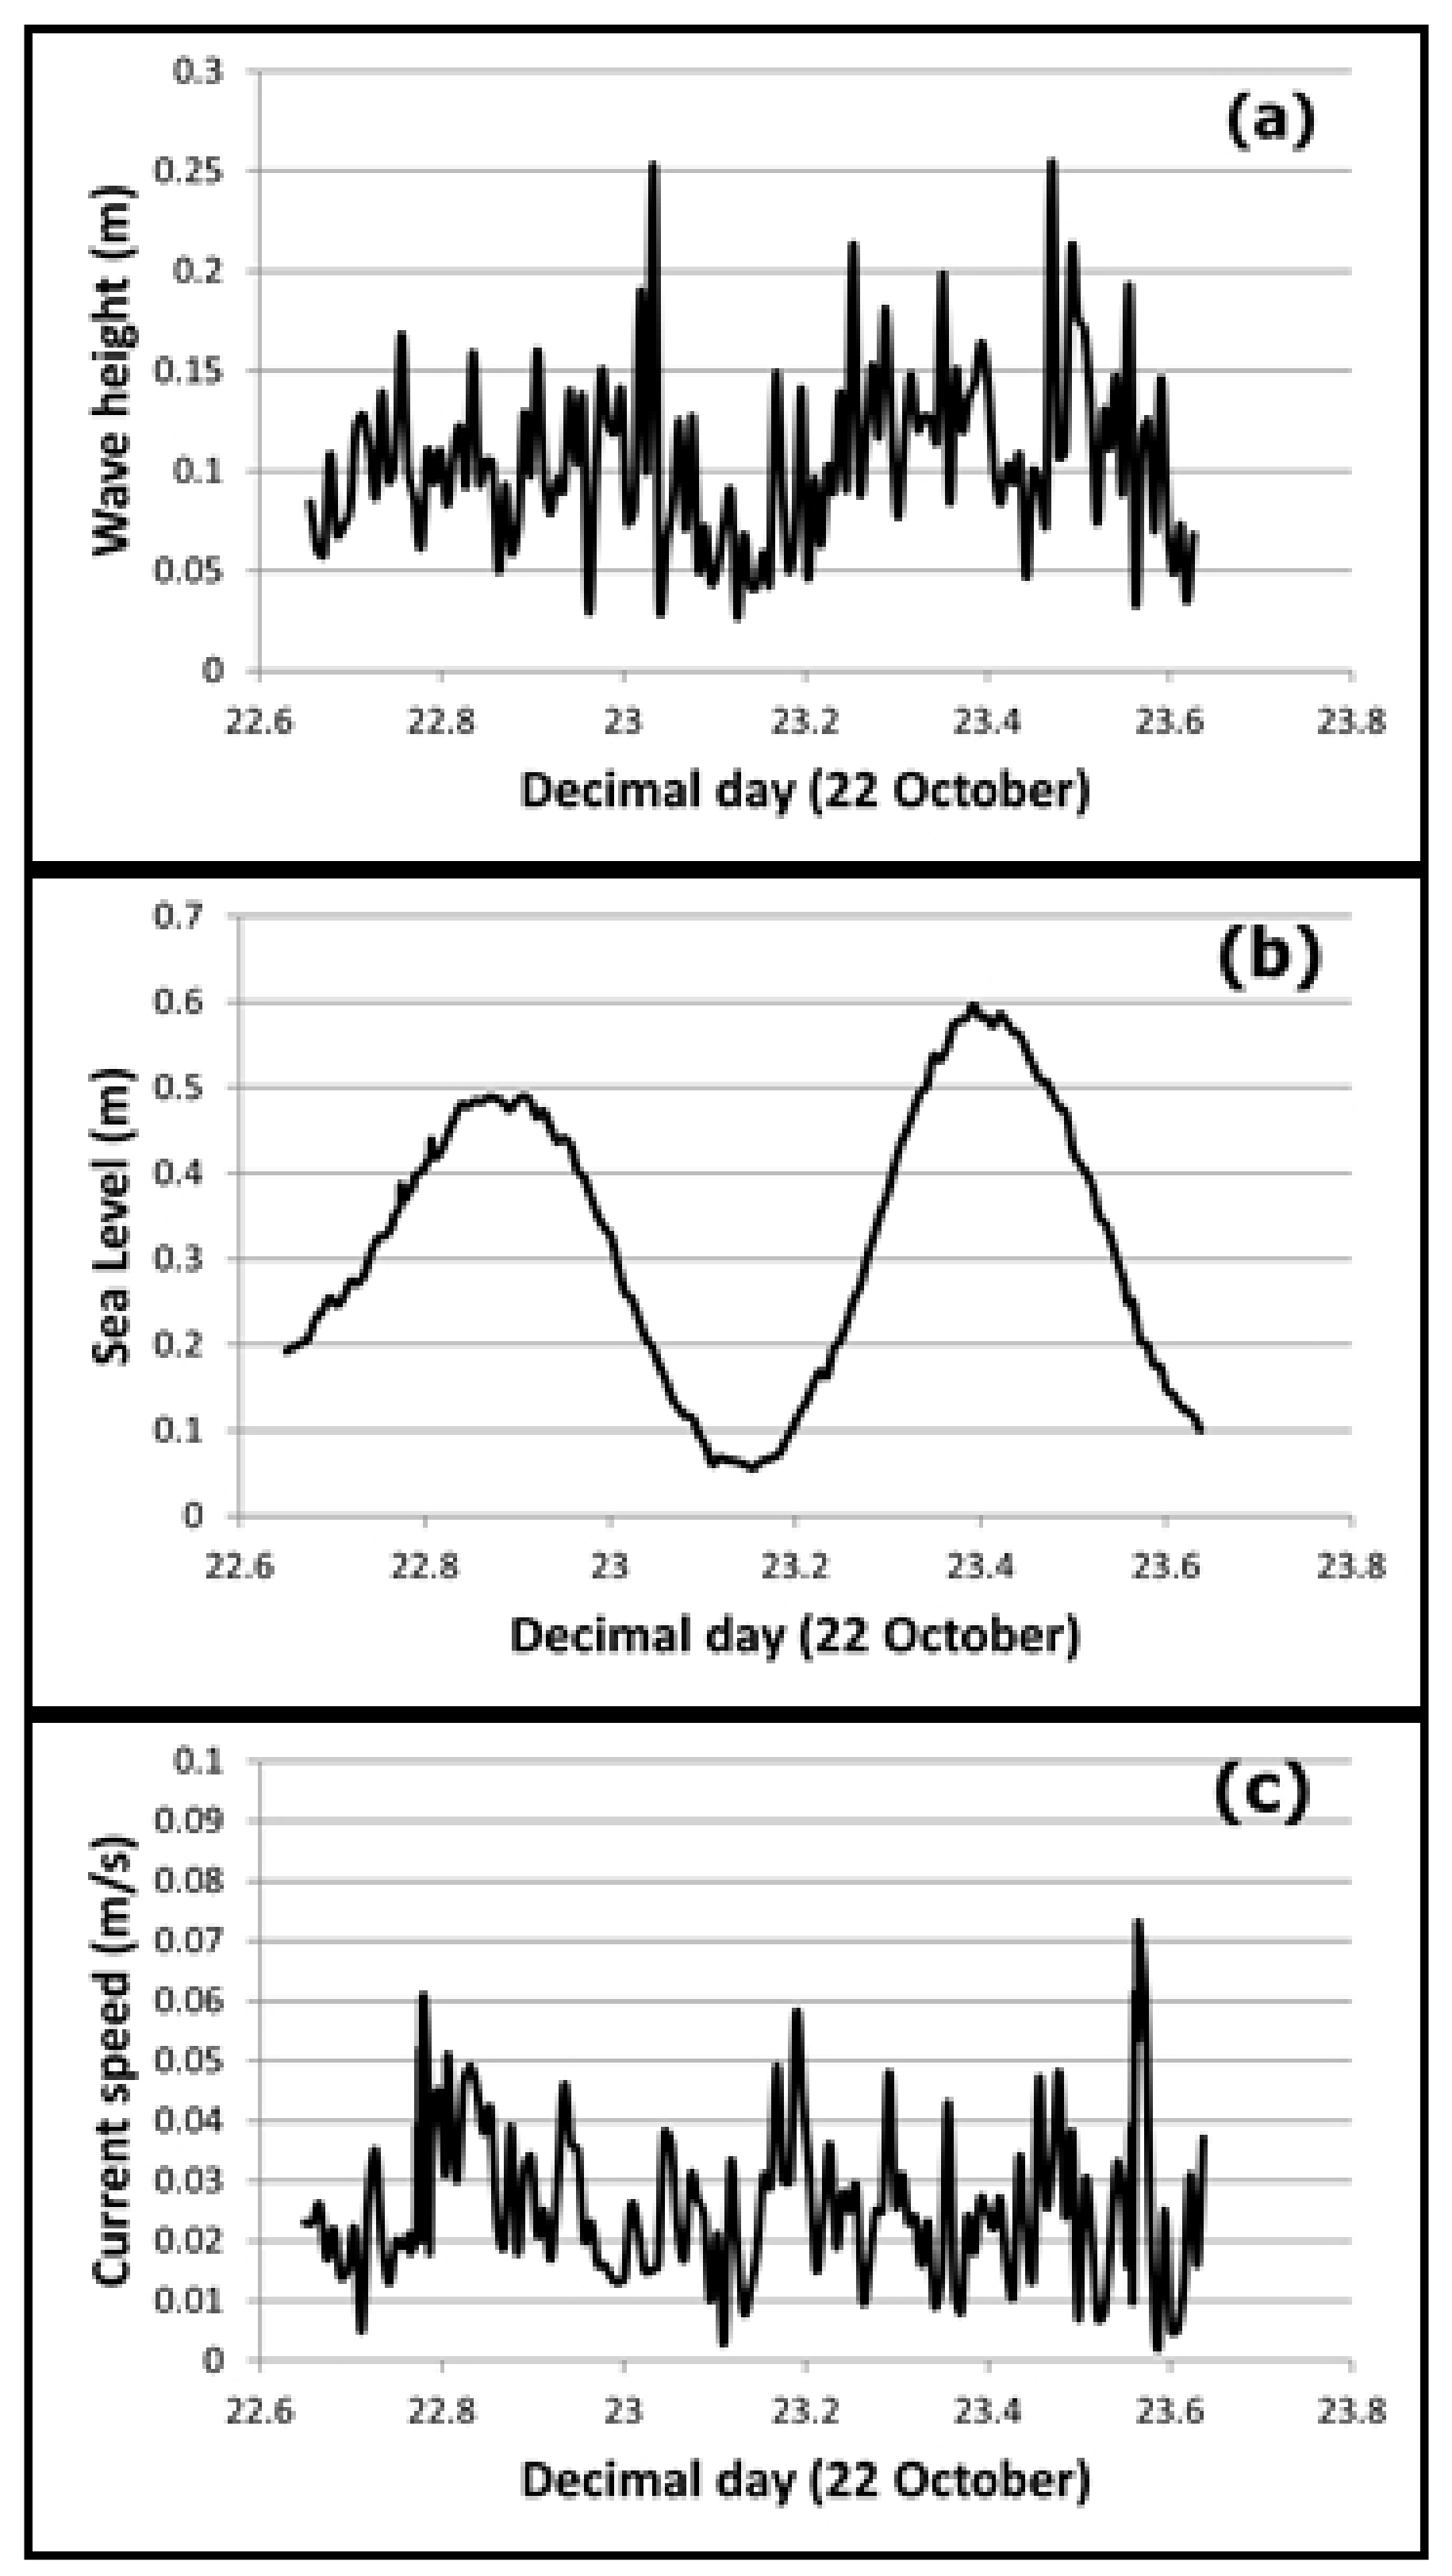
From a wave height of 1.5 m offshore, the wave height reduces to only 0.15 m at the study site according to the model (
Figure 8). During a period with similar offshore wave conditions, measured heights at the study site varied around 0.12 m (
Figure 9a), which confirms the model’s prediction.
4.2. Local Dynamics: Reef Site
Around the study site, measured wave heights mostly increase when the depth of water over the reef crest is greater (
Figure 9a,b). Currents measured by the Aquadopp instruments are typically small (0.01–0.06 ms
−1) (
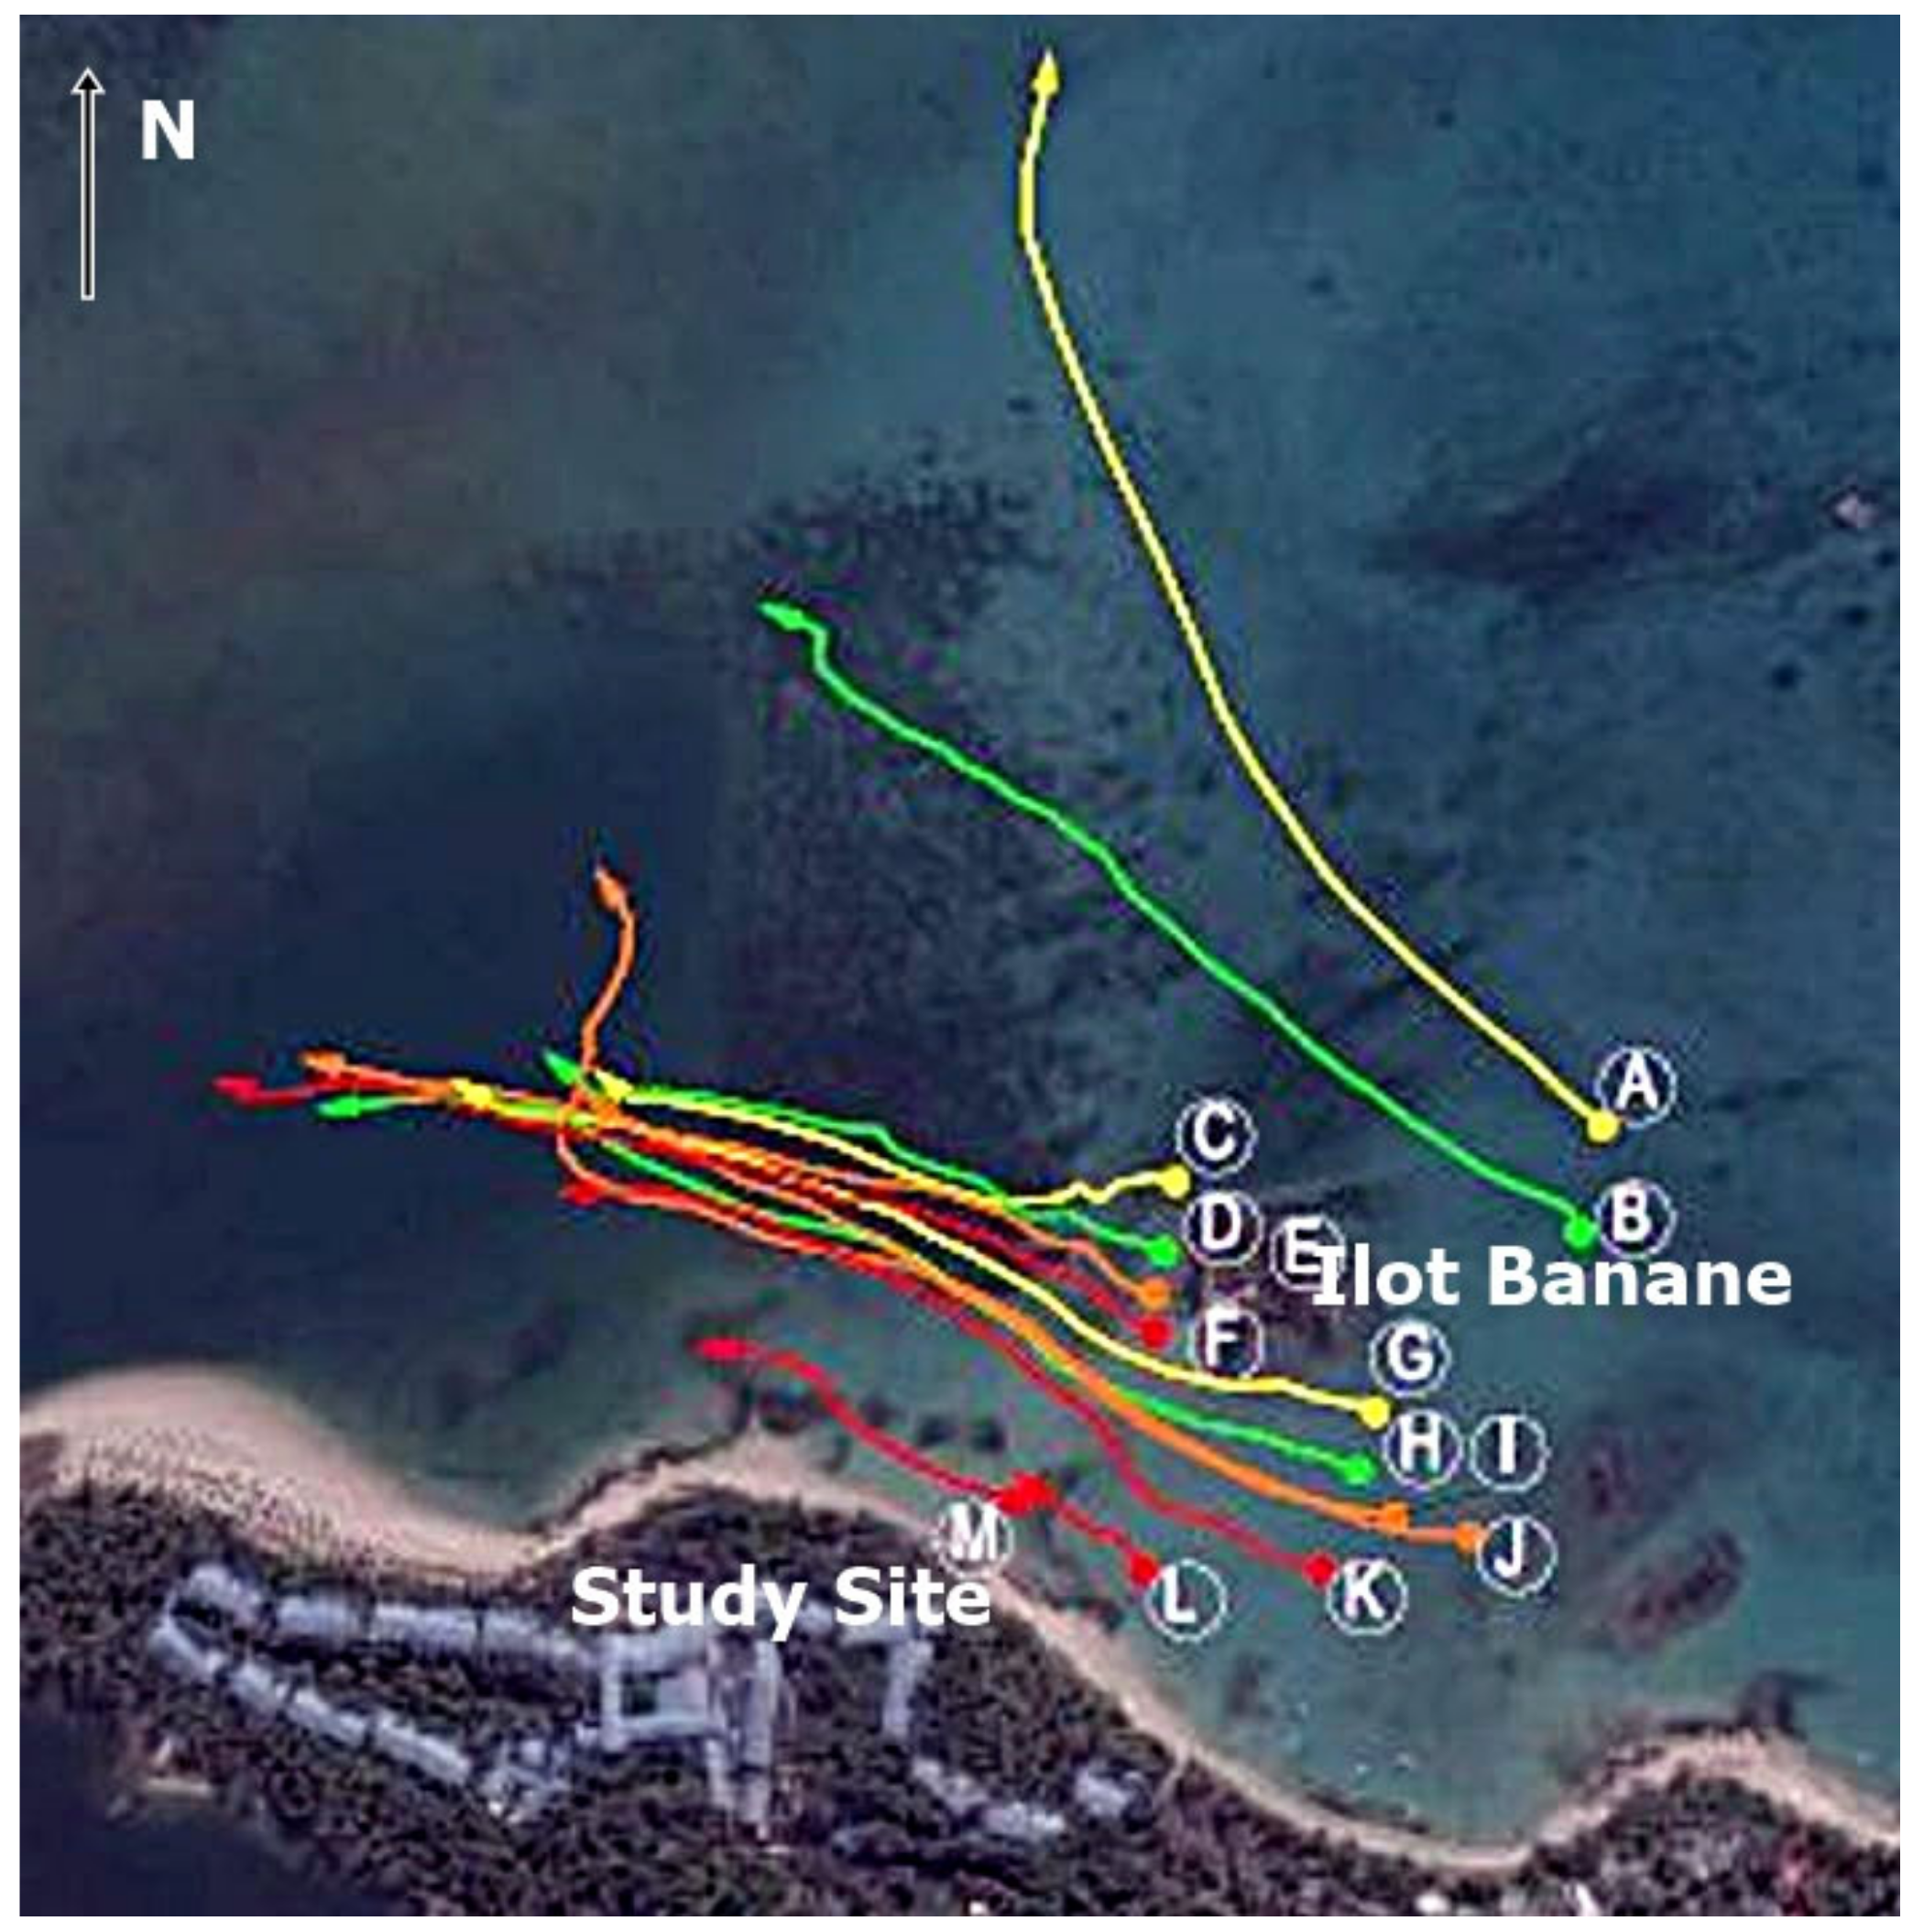
Figure 9c), while the dominant current direction, depicted by drogues, is from east to west (
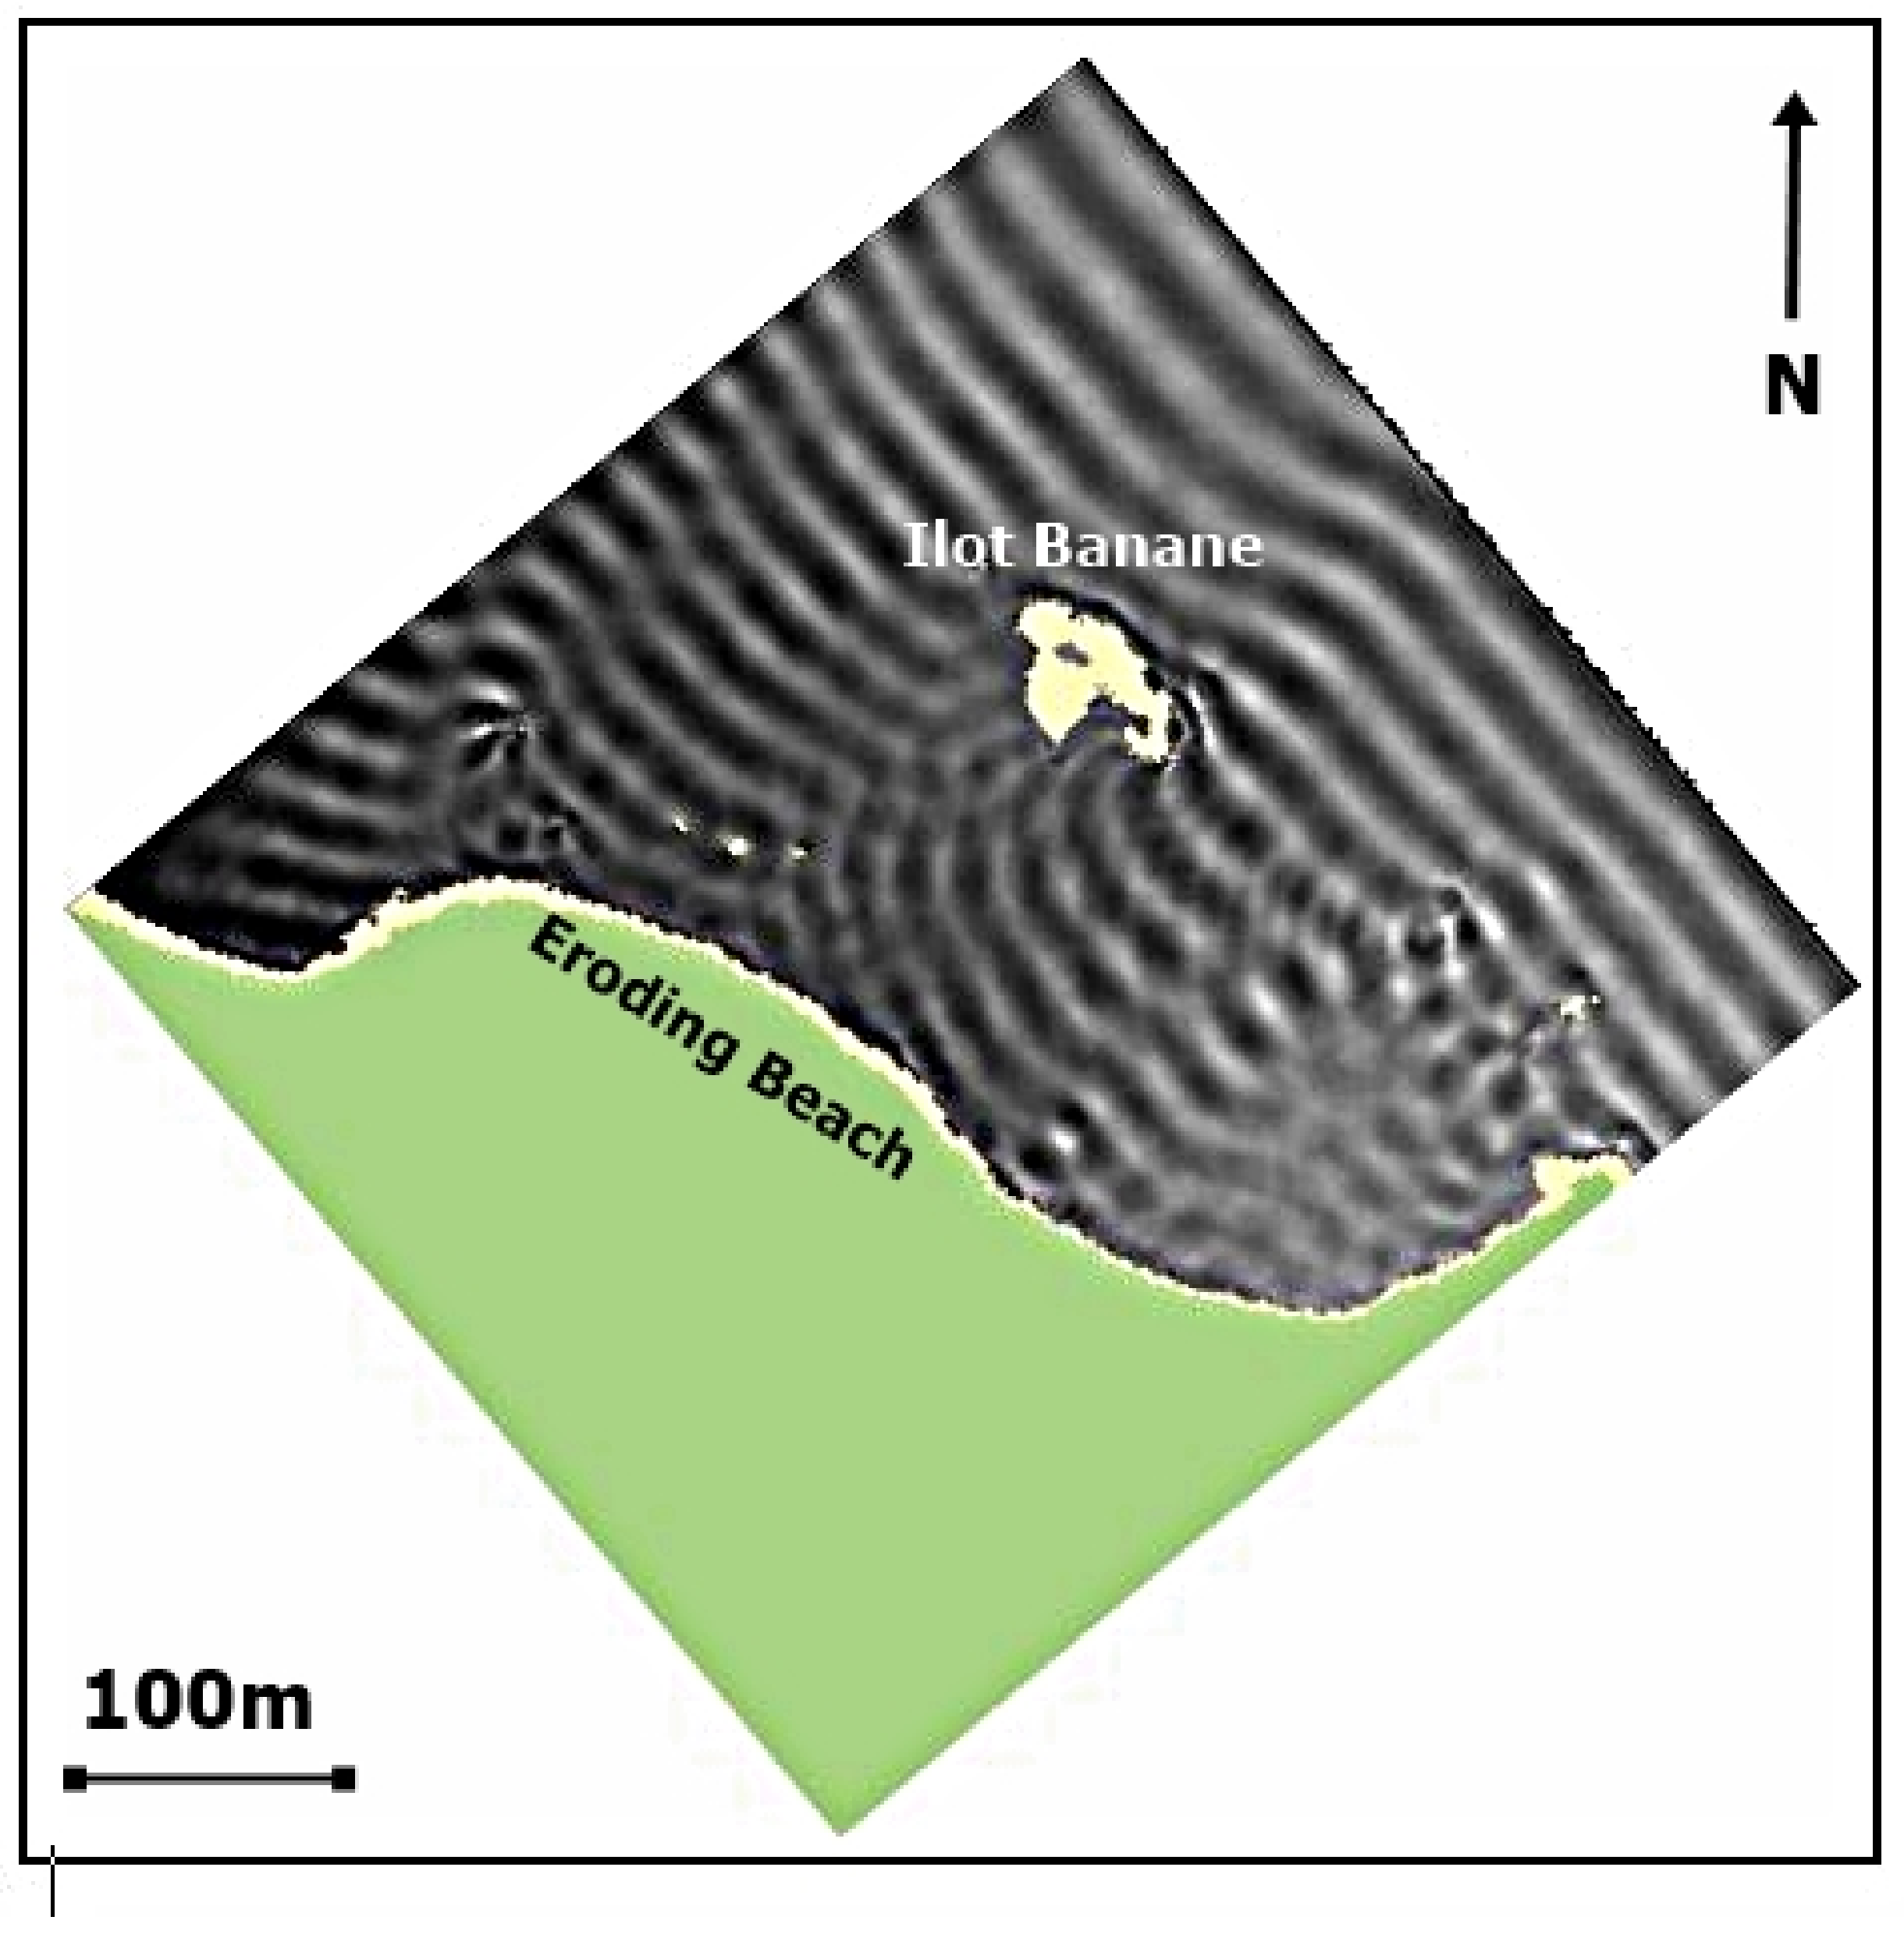
Figure 10). From the computer modelling, waves pass around both sides of Ilot Banane and meet in the lee of the island due to the combined effect of refraction and diffraction (
Figure 11). The same pattern can be seen in Google Earth images (
Figure 5d). The largest wave travels around the eastern side of the island, and its orientation at the shore creates a longshore transport to the west at the beach. This small dominant wave can be seen in
Figure 12a,b. Consequently, net transport is from east to west, which is further confirmed by the presence and growth of the sand spit to the west (
Figure 3).
4.3. Implications for Reef Design
Ideally, an artificial reef should change the equilibrium position of the shoreline to widen the beach but still allow a net movement of sand to pass freely. At the study site, small waves and currents drive a consistent net sediment transport to the east. Consequently, the reef was designed to attach to the western side of Ilot Banane. This allowed the dominant wave on the eastern side to remain intact so that sand delivery from east to west could continue uninterrupted. The 95 m length of the reef was adequate to shelter the shoreline of interest while also giving partial wave protection to the corner of an adjacent beach.
The reef crest was set to be marginally above the spring high-tide level. In combination with rough boulders and a lower gradient on the open-sea side (
Figure 6), the waves are dissipated by the reef for most of the time. Waves may overtop only in extreme conditions when sea levels are higher due to non-tidal influences. If the crest was lower, wave-driven currents over the reef crest create a looping current, which travels over the crest to the lee of the artificial reef and returns around the tips of the reef (the same patterns can be seen on the natural fringing reef in
Figure 7). These currents around the artificial reef have been shown to induce scour in the lee of the reef [
18,
19,
20]. Consequently, if the crest is submerged, the artificial reef needs to be placed further offshore to allow the scour to occur well beyond the beach rather than cutting into the beach itself. This distance was not possible at St Geran, and so the crest was put just above spring tide level to minimise over-topping-induced scour while keeping the crest down for visual amenity purposes. The wave heights in the lee of the reef were reduced due to the extra sheltering (
Figure 5d).
4.4. Evolution of the Salient
The initial condition, after completion of the reef and placement of the nourishment in October 2017, is shown in
Figure 5c. The causeway has been removed and sand has been conveniently placed in a block shape along the eroding beach zone. Four months later in February 2018, the sand began to readjust into a salient shape (
Figure 5d). The beach has remained intact, even though cyclone Berguitta passed north of Mauritius a few weeks earlier (January 2018). By contrast, a cyclone in January 2015 (before reef construction) severely damaged the beach (
Figure 2b and
Figure 12a).
Nearly one year after reef construction in August 2018, the beach has widened by 50 m at the apex of the salient (
Figure 5e). Two years after construction in August 2019, the apex width has stabilised, but the apex has moved to the west (
Figure 5f). Although the salient is still adjusting very slowly, the overall shape of the salient and the apex width remain approximately unchanged from August 2018 until the final measured shape in June 2021 (depicted by the black shoreline on the images). The salient achieved near equilibrium in less than one year and has remained pseudo-stable for nearly 4 years. The salient is still growing very slowly, without the need for new nourishment.
5. Discussion
The resort required reconstruction and preservation of the tourist beach, and the many beach umbrellas on the new salient (evident in Google Earth images (
Figure 5f)) are a testimony to the project’s success from the resort’s perspective, noting that zones outside the reef’s influence have not exhibited the same accretion. Prior works attempted to block land erosion using rock-filled gabion baskets on the beach. The gabion baskets were later exposed and the wire structures degenerated, and the beach was dangerous for visitors and eventually unsuitable for tourism.
5.1. Reef Behaviour
The primary goal of reef construction is to change and control the wave energy impacting the shoreline and, thus, widen the beach [
21]. The beach then acts to protect the land, retain natural beauty and amenity and provide the essential buffer between land and sea.
As input wave angles vary and diffraction/refraction occurs, there are still waves at the beach in the lee of the reef (
Figure 5d). Thus, the reef is not designed to totally block waves [
18]. However, partial wave shelter creates a zone of reduced longshore transport where sediment inputs are greater than outputs [
21]. This allows the salient to grow until a pseudo-equilibrium is reached and the beach stabilises.
In this study, the initial block of nourishment rapidly changed into a salient shape within 4 months (
Figure 5c,d). The salient then continued to grow slowly over the next 4 years.
5.2. The Need for Initial Nourishment
Downdrift beaches will be affected in the initial stages while the young salient is accumulating sand, and so it is beneficial to place an initial nourishment volume which is equal to the volume of the expected salient after reef construction [
4]. For St Geran, the volume was estimated using the formulae of Black and Andrews [
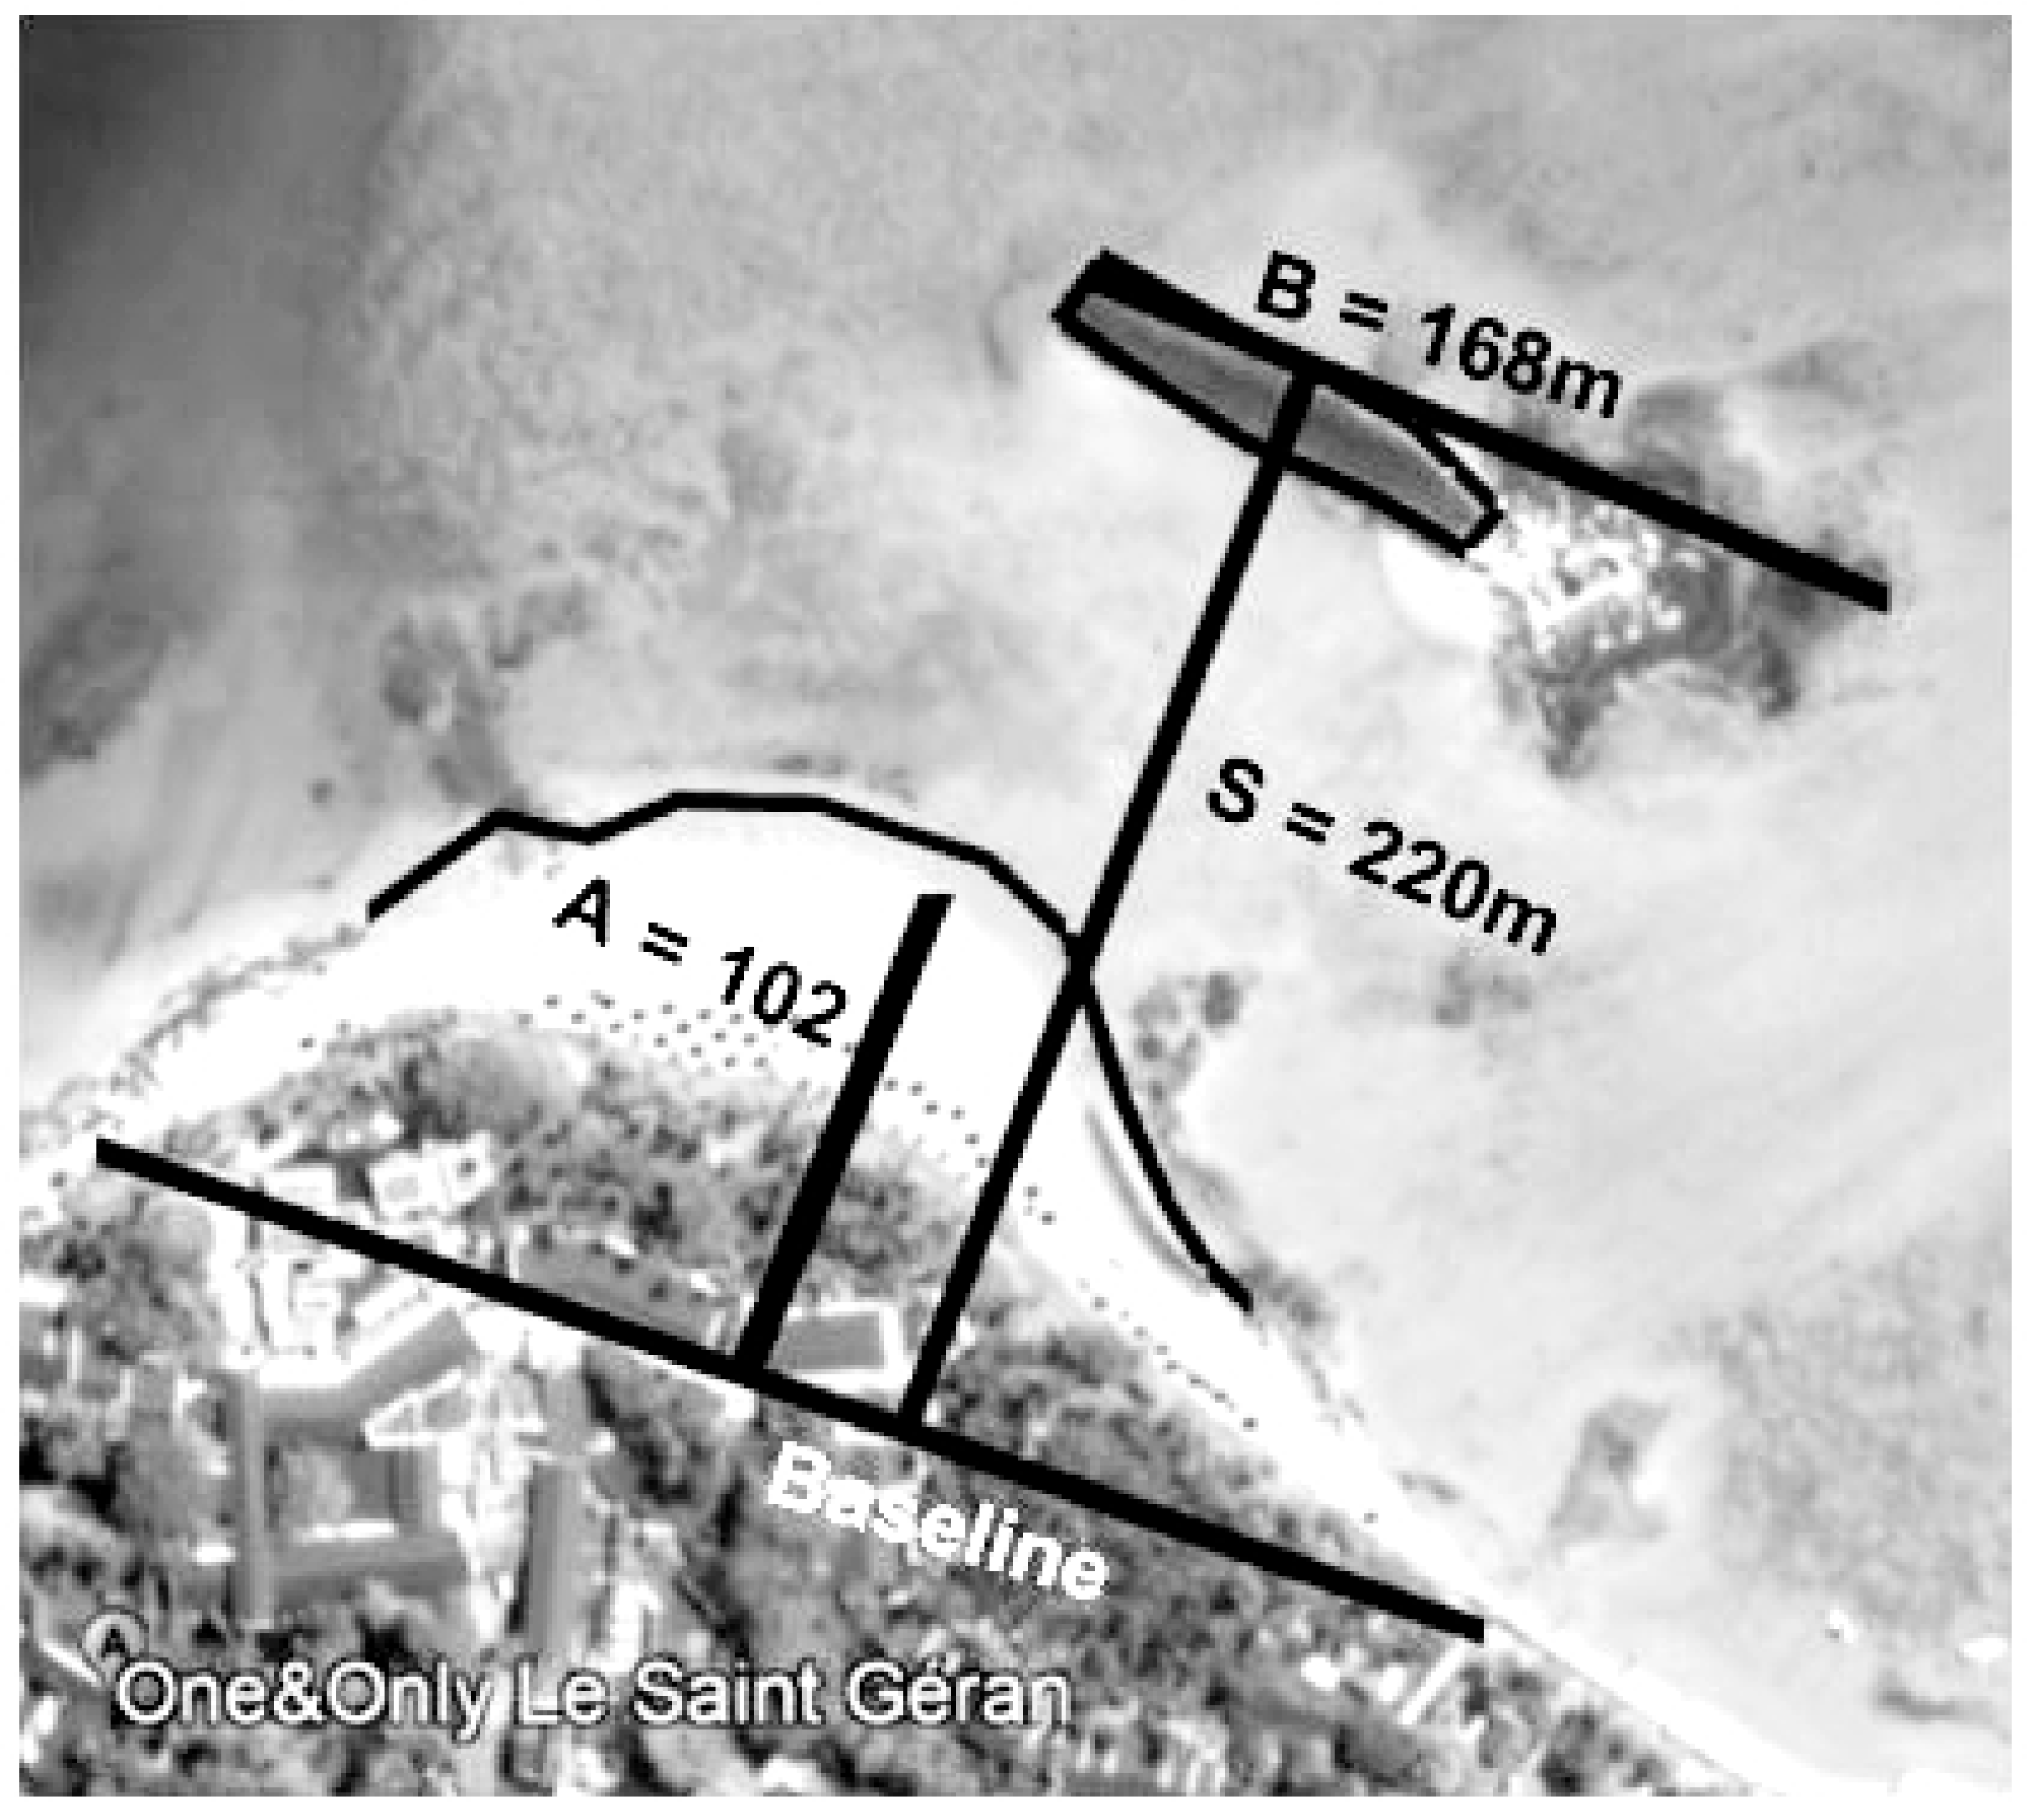
21]. They found that the salient apex width in the lee of natural reefs and islands was dependent on the alongshore length of the reef (B) and the offshore distance from the shoreline (S), where
X
off is the distance from the tip of the salient to the offshore reef, while A is the apex width of the salient at its widest point (
Figure 13).
For the study site, the variables B and S are shown relative to a baseline where the salient joins asymptotically with the natural shoreline in
Figure 13. The formula predicts a salient apex width of 101 m compared to the measured value of 102 m. This agreement suggests that the salient has reached approximate equilibrium, noting, however, that the selection of the baseline at this site is prone to error due to the complexity of the shoreline and natural reefs.
While nourishment placed in the lee of the reef initially formed a strong salient, its growth continued after that time, suggesting that new sand deliveries from the east were being trapped. Moreover, the eastern side of the salient slowly changed shape to become more parallel with the wave crests that bend around the east side of Ilot Banane (
Figure 5d and
Figure 11). The natural migrations of the salient apex (
Figure 5) are also a response to the dominant wave from the east.
The salient growth shows that the initial nourishment volume of 12,000 m
3 was insufficient for the full salient, as confirmed in
Figure 5c. Moreover, the placement of sand to the west of the salient apex allowed some of the initial nourishment to be moved west onto adjacent beaches rather than becoming part of the new salient. Accordingly, to minimise downdrift impacts and a measured erosion trend, an additional 9000 m
3 of nourishment sand was placed on the downdrift beach in July 2021 to compensate for the sand captured in the early phase of salient development.
5.3. Key Attributes of Tropical Islands
5.3.1. Wave Protection
Artificial reefs are an ideal solution on tropical islands because the natural fringing reefs take most of the energy out of the waves [
8]. At St Geran, the wave height at the study site was only 10% of the offshore height. Consequently, the artificial reef can be designed with a small rock size and volume in shallow water. In addition, the crest height needed to prevent the smaller waves from over-topping on the artificial reef is less than in the open ocean with a much larger wave set-up and run-up on the reef face.
Consequently, the cost of reef construction is very low compared to the large reefs needed on open coasts [
18]. Black and Andrews [
21] found that reefs create a length of new beach 3–5 times the length of the reef, which also improves cost effectiveness.
These key attributes make reefs financially achievable and potentially less costly than sea walls or other hard construction at the beach, especially if benefits such as preservation of the beach, livelihoods and tourism are considered in the cost/benefit calculation.
The modelling showed that wave height in the lagoon is very sensitive to the depth at the shallowest segment of the natural offshore reef crest; e.g., wave heights varied with tide level at the study site (
Figure 9b). Depth controls the initiation of wave breaking and dictates the height of the residual swell, that reforms after breaking and passes into the lagoon [
22]. Thus, sea level rise not only creates direct flooding but also more extreme wave set-up and run-up at the shoreline due to the bigger waves. An artificial reef can rebalance the wave conditions to reduce shoreline over-topping while also creating a stable beach and sand dune that inhibits direct flooding due to sea level rise.
5.3.2. Nourishment Sources
Mauritius is a volcanic island, and so the large gaps in the reef are mostly associated with canyons formed by ancient river valleys. Over time, the valleys have been infilled with sand (
Figure 2a) and so provide a major sand repository that is accessible with small dredging equipment in sheltered waters. Moreover, the model confirms that currents are mostly outbound at the exit locations (
Figure 7a), and so sand is being lost to deep water. The sand has compatible grain sizes (D
50 > 0.5 mm) and is relatively stable in the small waves.
While small coral cay islands have no strong river flow to form the river valleys, most small islands still have an exit channel for the water swept into the lagoon by waves on the reef face. These exit channels may provide adequate sand for initial nourishment of a salient. Notably, a reef increases nourishment longevity, thereby lessening repetitive dredging impacts on the environment.
5.3.3. Engineering
Because the lagoon is shallow, the reef could be built from shore. This attribute led to cost savings and reduced environmental impact. In Mauritius, as in many tropical islands, barges needed for offshore construction are not readily available. By using a temporary sand-filled geotextile causeway, rocks and machinery could be taken directly to the construction site, without impacts on local coral or beaches. Only a single 20-tonne excavator was required offshore. The position of the causeway was chosen to be on an existing sandy zone. The geobags were later emptied at the beach so the sand could form part of the nourishment, and they were removed for reuse on a subsequent project. Rock was chosen for the reef to match the character of the Mauritius coast and to provide habitat for marine life.
These engineering methods acknowledge the need for cost-effective construction, the limited availability of heavy plants in small islands and the benefits of creating a marine habitat while also protecting the coast.
6. Conclusions
The natural attributes of tropical islands are ideal for utilisation of reef technology for coastal protection. The reefs may be placed in the lagoon or on the reef flat in shallow water. The natural fringing reef takes most of the height out of the open ocean waves. The medium-to-coarse coral sand is relatively stable in the small wave conditions. In the lee of an artificial reef in Mauritius, a 50 m increase in beach width was achieved on the apex of a salient that formed in the lee of the reef, and it has remained stable over four years. River gorges infilled with relict sand are common in Mauritius and can provide quality nourishment sands in sheltered waters.
Author Contributions
K.B. undertook the scientific investigations, provided the model software, and conducted conceptualisation and formal analysis for the study. He wrote the original draft of the paper. D.S. provided project administration and undertook field data collection and engineering designs. All authors have read and agreed to the published version of the manuscript.
Funding
No external funding was provided for this research paper.
Institutional Review Board Statement
Not applicable.
Informed Consent Statement
Not applicable.
Data Availability Statement
Data has not been archived.
Acknowledgments
The One & Only Resort (Le St Geran) funded a beach management consultancy with Arup (Mauritius) and Sanctuary Beach Pte Ltd. The results of that study provided the baseline information for this paper. The management of the One & Only Resort (Le St Geran) encouraged the preservation of their beaches and showed concern for environmental effects and any impacts on neighbouring coast. Inclusive social awareness programmes were conducted with the public and local fishermen.
Conflicts of Interest
The authors declare no conflict of interest.
References
- Pandolfi, R.M.; Bradbury, R.H.; Sala, E.; Hughes, T.P.; Bjorndal, K.A.; Cooke, R.G.; McArdle, D.; McClenachan, L.; Newman, N.J.H.; Paredes, G.; et al. Global trajectories of the long-term decline of coral reef ecosystems. Science 2003, 301, 955–958. [Google Scholar] [CrossRef] [PubMed] [Green Version]
- Bellwood, D.R.; Hughes, T.P.; Folke, C.; Nystrom, N.; Nyström, M. Confronting the coral reef crisis. Nature 2004, 429, 827–833. [Google Scholar] [CrossRef] [PubMed]
- Nurse, L.A.; McLean, R.F.; Agard, J.; Briguglio, L.P.; Duvat-Magnan, P.; Pelesikoti, N.; Tompkins, E.; Webb, A. Small Islands. In Climate Change 2014: Impacts, Adaptation, and Vulnerability. Part B: Regional Aspects. Contribution of Working Group II to the Fifth Assessment Report of the Intergovernmental Panel on Climate Change; Barros, V.R., Field, C.B., Dokken, D.J., Mastrandrea, M.D., Mach, K.J., Bilir, T.E., Chatterjee, M., Ebi, K.L., Estrada, Y.O., Genova, R.C., et al., Eds.; Cambridge University Press: Cambridge, UK; New York, NY, USA, 2014; pp. 1613–1654. [Google Scholar]
- Black, K.P.; Baba, M.; Mathew, J.; Kurian, N.P.; Ilic, A. Guidelines to prepare India’s coast for climate change. J. Coast. Res. 2021, in press. [Google Scholar] [CrossRef]
- Lee, T.T.; Black, K.P. The energy spectra of surf waves on a coral reef. In Proceedings of the 16th International Conference on Coastal Engineering (ASCE), Hamburg, Germany, 27 August–3 September 1978; pp. 588–608. [Google Scholar]
- Symonds, G.; Black, K.P.; Young, I.R. Wave-driven flow over shallow reefs, submerged reefs. J. Geophys. Res. 1995, 100, 2639–2648. [Google Scholar] [CrossRef]
- Monismith, S.G.; Herdman, L.M.M.; Ahmerkamp, S.; Hench, J.L. Wave transformation and wave-driven flow across a steep coral reef. J. Phys. Oceanogr. 2013, 43, 1356–1379. [Google Scholar] [CrossRef] [Green Version]
- Ferrario, F.; Beck, M.W.; Storlazzi, C.D.; Micheli, F.; Shepard, C.C.; Airoldi, L. The effectiveness of coral reefs for coastal hazard risk reduction and adaptation. Nat. Commun. 2014, 5, 3794. [Google Scholar] [CrossRef] [PubMed]
- Quataert, E.; Storlazzi, C.; van Rooijen, A.; Cheriton, O.; van Dongeren, A. The influence of coral reefs and climate change on wave-driven flooding of tropical coastlines. Geophys. Res. Lett. 2015, 42, 6407–6415. [Google Scholar] [CrossRef]
- Black, K.P. The relative importance of local retention and inter-reef dispersal of neutrally-buoyant material on coral reefs. Coral Reefs 1993, 12, 43–53. [Google Scholar] [CrossRef]
- Hench, J.L.; Leichter, J.J.; Monismith, S.G. Episodic circulation and exchange in a wave-driven coral reef and lagoon system. Limnol. Oceanogr. 2008, 53, 2681–2694. [Google Scholar] [CrossRef] [Green Version]
- Hoeke, R.K.; Storlazzi, C.D.; Ridd, P.V. Drivers of circulation in a fringing coral reef embayment: A wave-flow coupled numerical modelling study of Hanalei Bay, Hawaii. Cont. Shelf Res. 2013, 58, 79–95. [Google Scholar] [CrossRef]
- De Alegria-Arzaburu, A.R.; Mariño-Tapia, I.; Enriquez, C.; Silva, R.; González-Leija, M. The role of fringing coral reefs on beach morphodynamics. Geomorphology 2013, 198, 69–83. [Google Scholar] [CrossRef]
- Silva, R.; Mendoza, E.; Mariño-Tapia, I.; Martínez, M.L.; Escalante, E. An artificial reef improves coastal protection and provides a base for coral recovery. J. Coast. Res. 2016, 75, 467–471. [Google Scholar] [CrossRef]
- Black, K.P.; Rosenberg, M.A. Semi-empirical treatment of wave transformation outside and inside the breaker line. Coast. Eng. 1992, 16, 313–345. [Google Scholar] [CrossRef]
- Tolman, H.L.; Chalikov, D.V. Development of a Third Generation Ocean Wave Model at NOAA-NMC. In Proceedings of Waves—Physical and Numerical Modelling Conference, Vancouver, BC, Canada, 21–24 August 1994; pp. 724–733. [Google Scholar]
- WAVEWATCH III Development Group (WW3DG). User Manual and System Documentation of WAVEWATCH III Version 6.07; Technical. Note 333, NOAA/NWS/NCEP/MMAB; NOAA: College Park, MD, USA, 2019; p. 456. [Google Scholar]
- Black, K.P.; Reddy, K.S.K.; Kulkarni, K.B.; Naik, G.B.; Shreekantha, P.; Mathew, J. Salient evolution and coastal protection effectiveness of two large artificial reefs. J. Coast. Res. 2020, 36, 709–719. [Google Scholar] [CrossRef]
- Black, K.P.; Mead, S.T. Sand bank responses to a multipurpose reef on an exposed sandy coast. Shore Beach 2007, 75, 55–66. [Google Scholar]
- Ranasinghe, R.; Turner, I.L.; Symonds, G. Shoreline response to multi-functional artificial surfing reefs: A numerical and physical modelling study. Coast. Eng. 2006, 53, 589–611. [Google Scholar] [CrossRef]
- Black, K.; Andrews, C. Sandy Shoreline Response to Offshore Obstacles, Part 1: Salient and Tombolo Geometry and shape. J. Coast. Res. 2001, 29, 82–93. [Google Scholar]
- Dally, W.R.; Dean, R.G.; Dalrymple, R.A. Wave height variation across beaches of arbitrary profile. J. Geophys. Res. 1985, 90, 11917–11927. [Google Scholar] [CrossRef]
| Publisher’s Note: MDPI stays neutral with regard to jurisdictional claims in published maps and institutional affiliations. |
© 2021 by the authors. Licensee MDPI, Basel, Switzerland. This article is an open access article distributed under the terms and conditions of the Creative Commons Attribution (CC BY) license (https://creativecommons.org/licenses/by/4.0/).

