Article

The Impact of Swirls on Slurry Flows in Horizontal Pipelines

Research Center of Fluid Machinery Engineering and Technology, Jiangsu University, Zhenjiang 212013, China
*
Authors to whom correspondence should be addressed.
J. Mar. Sci. Eng. 2021, 9(11), 1201; https://doi.org/10.3390/jmse9111201
Submission received: 19 September 2021 / Revised: 28 October 2021 / Accepted: 29 October 2021 / Published: 31 October 2021
(This article belongs to the Section Ocean Engineering)

Abstract

:
In deep ocean transportation pipeline, the swirling internal flow has a significant impact on the marine minerals transportation efficiency and safety. Therefore, the present work investigates various swirl flow motions for the slurry transport characteristics of the multi-sized particulate flow in a horizontal pipeline. Since the internal flow is a liquid-solid-solid mixture, a steady-state three-dimensional Eulerian-Eulerian multiphase approach in conjunction with the k- ω SST turbulence model is implemented for numerical simulation in the commercial CFD software ANSYS FLUENT 17.0. Numerical predictions of the mixture solid concentration distributions are generally in good conformance with experimental measurements. It is clearly revealed the transition of flow regime from heterogeneous to pseudo-homogeneous with the increasing level of swirl intensity at inlet. Compared to non-swirling flow, the swirling flow is of benefit to the multi-sized solid suspension capacity and the transportation efficiency. Moreover, the intense swirling vortex results in a strong influence on the characteristics of the lubrication layer formed by fine solid particles near the bottom of the pipe. These results provide valuable insights regarding the influence of swirl flow on the transport process for deep ocean mining.

1. Introduction

The transportation of fine particles with liquid as a carrier in the form of slurry through long pipeline has been widely utilized in various industrial applications, such as oil sands industry, wastewater treatment, degrading processing and deep ocean mining owing to its energy efficiency, environmental friendliness and easy implement and control [1]. In the specific case of applications in deep ocean mining processing, the under-water transportation pipelines are considered as the most commercial and efficient system for transporting multiphase mixtures containing valuable polymetallic nodules from seafloor to sea surface. The enormous quantities of mineral particles on the seafloor have complex components including manganese (28%), nickel (1.3%), cooper (1.1%), and cobalt (0.2%) and various diameters from less than one to tens of centimetres [2]. In comparison with the terrestrial mines, the deep ocean mine sites can provide more critical metals hosted within polymetallic nodules in the same or less ore deposits. These abundant deep ocean metals are secure and diverse sources for low-carbon applications, such as electric vehicle batteries, computer chips, wind turbines, etc. [3]. Therefore, the collection and long-distance transport of critical metal mineral resources has triggered interest in the deep ocean mining industry over a long time period.
The deep ocean mining system consists four major components: the seabed mining robot, the pipeline transportation system, the sea-surface mining vessel, and the bulk carrier vessel [4]. Among them, the internal fluid flow transporting within the underwater pipeline has become a popular research topic for the processing equipment [
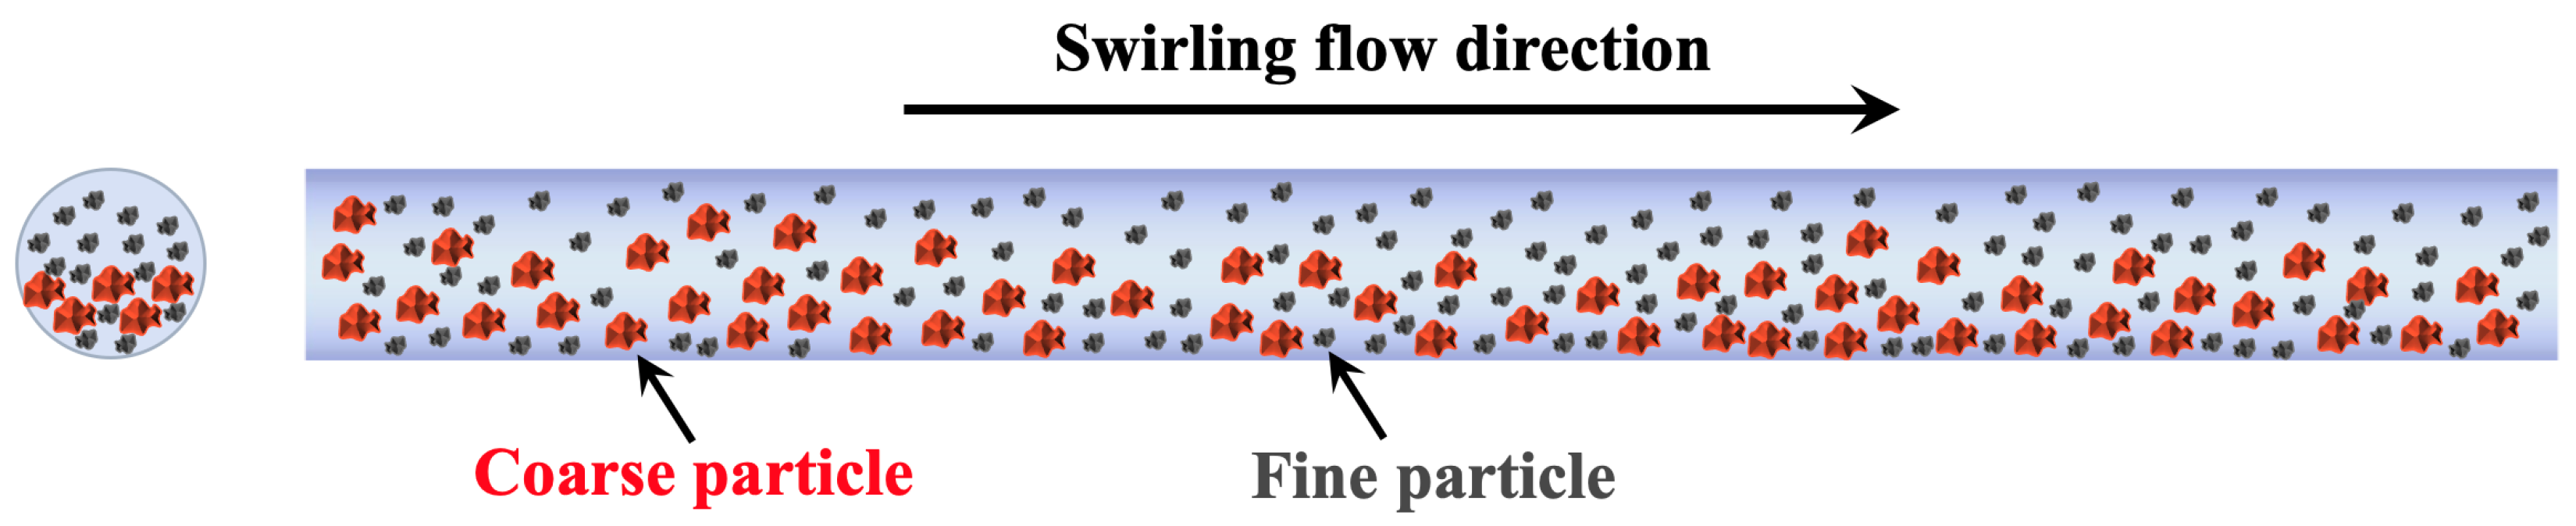
5]. It is significant for deep ocean mining industry to realistically understand the fundamental characteristics and further the complicated transport mechanisms of the multiphase slurry flow process. The slurry of polymetallic nodules in carrying fluid tends to form heterogeneous mixture, with a significant amounts of solid particles setting to the bottom of the pipeline due to their own weight (see Figure 1). The accumulation of solid particles at the bottom of the pipeline affects the transportation performance of the mining pipeline and the collision and friction between the multi-sized particles and the walls [6,7]. As a result, the transport of polymetallic nodules as a slurry through pipelines is a challenging task and require further improvements to overcome the low transportation capacity and high abrasive wear.
There has been a great deal of work aimed on the optimization of the transportation pipeline system to provide improved transportation efficiency and prevention of slurry pipeline blockages and consequently enhancing the mining performance of deep ocean critical metals, either by concentrating on the operating conditions (e.g., velocities, direction, wetness) [8,9,10,11] or by focusing on the slurry properties (e.g., size, shape, concentration) [12,13,14,15]. Li et al. [16] numerically investigated the mechanism of resistance reduction by adding finer particles on coarse-particle slurry in pipelines. The results illustrated that the fine particles act as “near-wall lubrication layer” along the bottom of the pipe, and the pipeline resistance reduces by 20%. Dai et al. [17] experimental and numerically studied the internal flow characteristics at different flow rates and solid concentrations within a pipeline. The authors found that the large solid concentration leads to the clogging phenomenon, while the high slurry flow rate promotes a smooth flow. Chen et al. [18] numerically explored the effect of particle shape on the efficiency and flow characteristics of slurry transport. They observed that the spherical and square platens particles exhibit an almost linear solid concentration distribution, while the line-shaped particles are prone to clogging at the inlet of the pipeline. Recent work by Shi et al. [19] focused on the level of turbulence affected by fine particles under linear flow condition within a pipeline. The results indicate that the higher solid concentration intensifies the turbulence intensity in the lower-half section of the pipeline. In this article this line of research is continued, now focusing on the underline physics of multi-sized particulate slurry flow characteristics under different swirling flow conditions.
The Computational Fluid Dynamics (CFD) have great potential for application to slurry flows in pipelines. The utilization of commerical CFD software (e.g., ANSYS FLUENT) or open-source CFD software (e.g., OPEN Foam) to study the hydrodynamic behaviors of solid-liquid flows reduces the costs of experiments and allows a great control over the physical aspects of the transporting process, especially for the application of deep ocean pipeline system. Messa et al. [20] present a comprehensive description of the modeling methods on the slurry pipe flow. Three main modeling approaches: Eulerian-Lagrangian model, Eulerian-Eulerian model, and mixture model are discussed and the Eulerian-Eulerian model is considered as the optimal choice to simulate slurries with massive amounts of solids. Messa et al. [21] studied the turbulent slurry flow between two horizontal plates using the β - σ two-fluid model, and they found that the degree of asymmetry of the axial velocity profiles is correlated with the crosswise gradients of volume fractions and eddy viscosities. Messa et al. [22] further found that the ratio of pipe length to diameter of 50 to 60 is suitable to attain reliable predictions of hydraulic gradient and mean velocity profile. Schouten et al. [23] adopted Eulerian-Eulerian to investigate the velocity, concentration and pressure gradient of sediment in a pipeline, and they found that the collisional force and averaged drag force are two dominant upward driving forces that compensate gravitation in the bottom wall region.
Recently, the strong swirling flow imposed in the pipeline is considered to be most efficient means of enhancing the mass and heat transfer as well as the liquid-carrying capacity [24,25,26]. Wang et al. [27] studied how the gas-liquid two phase flow field was affected by the turbulent swirling flow inside a horizontal pipeline. The experimental results indicate that the flow patterns can be classified as the swirl linear flow, swirl wave stratified flow, swirl axial flow and swirl dispersed flow with the increasing of swirl intensity. Rayhan and Yanuar [28] compared the rheological behavior and drag reduction of ice slurry flows in a spiral pipeline and circular pipeline. They found that the homogeneous regime is formed in which more ice crystals are suspended in the carrier fluid without any precipitation in the bottom of the pipeline under the effect of the swirling flow. Ariyaratne and Jones [29] reported that the swirling flow is of benefit to coarse particle distribution within a pipeline. Specifically, the lower flow velocity is required to keep particles in suspension and the risk of pipeline blockage is minimized.
As our review of the literature shows, although a few scholars have focused on the experimental and numerical investigations of particulate flows in horizontal pipes, including the effect of operating conditions and the slurry properties on the transporting performances, there are almost no studies carrying out a detailed CFD investigation of multi-sized particulate slurry flow under various swirling flow conditions. Therefore, the main aim of this work is to investigate the hydrodynamic characteristics of multiphase slurry flow of multi-sized particulate slurry flow in a horizontal pipeline over a wide range of swirling conditions. The knowledge of multi-sized solid concentration, velocity distribution, turbulence viscosity ratio, and their variation in the pipe under different swirl ratios is significant for understanding the mechanisms of pipeline transport and resistance reduction for deep ocean mineral engineering purposes.
The outline of the paper is as follows. Section 2 gives a short description of the numerical methodology. Section 3 outlines the validation of 3D CFD models through experimental data. Section 4 presents and discusses simulation results of the flow patterns and hydrodynamics of the multi-sized slurry flow. Section 5 concludes the paper.

2. Numerical Methodology

2.1. Problem Description

A three-dimensional (3D) horizontal pipeline, which is adapted from the experimental study of Kaushal et al. [30], was established to investigate the multi-sized particulate slurry flow with different swirling motions using CFD simulation. The length of the pipe L is 3300 mm and the internal diameter D is 54.9 mm (see Figure 2a). In the 3D multiphase simulation, it is unrealistic to simulate the entire transportation pipeline for deep-sea mining due to the long-distance pipeline (>1000 m). The computational cost of modeling the 3D flow characteristics within the entire pipeline is extremely high. On the other hand, the fluid enters the pipeline at a certain distance will reach a steady sate, and the multiphase flow field will remain unchanged after entering the fully developed flow regime [31]. The current computational domain (D/L = 60) has been proved capable for generating a fully developed flow regime in many works [1,17,19]. This further confirms that the present pipeline is capable to investigate the hydrodynamic characteristics of multiphase slurry flow of multi-sized particulate slurry flow over a wide range of swirling conditions.
In the deep ocean surface, the mineral particles on the seafloor have a wide size range. However, the large size particles (e.g., those of the order of mm or above) will inevitably degrade into powdery particles during the deep ocean hydraulic transportation [32]. This is mainly due to the impact fragmentation of the impellers of the multi-stage lifting motor pumps and the interaction between particles [33]. Therefore, for modeling the swirling flow with multi-sized particulate slurry, some typical experimental cases with a mixture of two spherical solid particles with diameters d of 44 and 125 μ m in equal mass fraction (Kaushal et al. [30]) were simulated to ensure the transportation efficiency and avoid the significant pipeline blockage. The maximum packing limit α s , m a x = 0.63 is taken for each solid phase. Swirl ratio ( S R = W / U ), which represents the ratio of tangential velocity (W) to axial velocity (U), indicates the swirl intensity in the flow. The swirl motion is generated at the entrance of the pipe by imparting constant tangential velocity (W = 0.2 m/s, 0.5 m/s and 1 m/s) and a constant axial velocity of U = 2 m/s. According to the transportation requirement of the deep ocean mining pipeline system, the production capacity of the dry and wet polymetallic nodules is in the range between 30 and 43 ton/h [17]. Thus, three groups of inlet velocity in both normal and tangential directions are specified to explore the impact of swirl flow ( S R = 0.1 − 0.5) on the slurry transporting process. In addition, the solid volume concentration of C s = 0.2 to 0.5 is transported with carrying liquid by the system. For the sake of simplicity, the liquid fluid phase is considered as incompressible fluid and each solid phase has a uniform size (d = 44 or 125 μ m).

2.2. Numerical Details

The Eulerian-Eulerian multiphase approach in the commercial CFD software ANSYS FLUENT 17.0 is applied to simulate the hydrodynamic characteristics of multi-sized slurry flow in a 3D swirling horizontal pipeline. The water, fine sand and coarse sand phases are treated separately as three interpenetrating continuum, by introducing the concept of volume fraction. The volume fraction occupied by each phase are assumed to be continuous functions of space and time and the sum of each volume fraction is to one. A set of Navier-Stokes equations are solve for each phase, and the additional inter-phase momentum transfer terms are added in the transport governing equations for modeling the mutual interphase forces. Among them, water is set as the continuous primary phase, while fine and coarse sands are considered as the dispersed secondary phases. The Kinetic Theory of Granular Flow (KTGF) is used to formulate the hydrodynamic properties of the solid phases, such as the solid pressure, solid viscosity, shearing stress and granular temperature in the two-fluid model. The interfacial momentum transfer between phases of the three-phase system is considered in this study. In particular, the Syamlal-O’brien drag model is applied to describe liquid-solid interfaces, while the Syamlal-O’brien-symmetric drag model is adapted to describe the solid-solid interfaces in the horizontal pipe. The theory proposed by Simonin & Viollet [34] is performed to describe the turbulent dispersion force between liquid-solid interfaces. In addition, the virtual mass force and lift force are not included in the CFD simulations of the liquid-solid pipe flow because the predominant forces are gravity and drag force [19,35]. For solid-solid momentum exchange coefficient and solid-wall momentum exchange coefficient, the coefficient of restitution ( e s s ) between particle and particle is considered as 0.9, while the specularity coefficient ( φ s w ) with a value of 0.451 is adopted for the particle-wall collisions. From the previous work [19], the particle-particle coefficient of restitution with value of 0.9 and the particle-wall specularity coefficient of 0.451 are the optimal values in the modeling of multiphase slurry pipe flow. Thus, the value of e s s = 0.9 and φ s w = 0.451 are considered in the following studies. The acceleration of gravity is set towards Y-axis direction with a value of −9.81 m/s 2 . The physical properties of all the materials used in the present study are presented in Table 1. The empirical erosion equations can be implemented into the CFD framwork to predict the erosion characteristics (e.g., erosion rate). However, the computational cost of the 3D three-phase simulations coupled with erosion model is significantly high. More studies about internal erosion of the pipe can be found in works [36,37].
The turbulence generation mechanisms in liquid-solid-solid three-phase flows differ significantly from those in pure water phase or liquid-solid two-phase flows, mainly due to the constant interactions between multi-sized particles and turbulent eddies. In the present study, the k- ω Shear-Stress Transport (SST) mixture turbulence model, which is a hybrid function of k- ε model in the far-field region and k- ω model in the near-wall region, is adapted instead of a standard k- ε or k- ω model to better capture the turbulent characteristics (turbulent kinetic energy, specific dissipation rate, and turbulent viscosity) for each phase. The Simonin turbulent dispersion force model is chosen for modeling multi-sized particles dispersed in the turbulently flowing streams.
The pipeline entrance is set as velocity inlet condition, while the pipeline exit is set as the pressure outlet condition. The swirl is generated by imposing a tangential velocity and a axial velocity at the inlet of the pipeline. The simulations are performed at different inlet tangential velocities of W = 0.2 m/s ( S R = 0.1), 0.5 m/s ( S R = 0.25) and 1 m/s ( S R = 0.5) and a constant axial velocity of U = 2 m/s. The volume fraction of each solid phase ( α s = 0.2–0.4) is introduced at the inlet condition of the pipeline. The absolute pressure of 101,325 Pa is given at the pipe outlet. The boundary condition for the liquid phase is non-slip surface condition, while that to solid phase is predicted by Johnson and Jackson model. The turbulence specification method of the inlet and outlet is set to intensity and viscosity ratio. The turbulence intensity is set as 5% and the turbulent viscosity ratio is 10. The detailed governing equations and model parameters are summarized in Table 2 and Table 3.
The steady-state based numerical solver with the Phase Coupled SIMPLE algorithm is employed to solve the incompressible liquid-solid-solid three-phase flow field. The finite volume method is adopted to solve the governing equations. The second-order upwind scheme is adopted to solve the governing equations of momentum, turbulent kinetic energy and specific dissipation rate. The Quadratic Upwind Interpolation for Convection Kinematics (QUICK) scheme is used for discretization of the volume fraction equation. Here, five structured meshes with 237,500 (Grid-1), 456,000 (Grid-2), 863,500 (Grid-3), 1,484,000 (Grid-4) and 3,648,000 (Grid-5) cells are constructed for the 3D pipeline geometry. The computational domain of Grid-2 is shown in Figure 2. All of the simulations in this work are performed on Intel(R) Xeon(R) Gold 6238R CPU processor running at 2.20 GHz with 20 cores and 256 GB RAM memory. The computational time of the steady state simulation is about one day.

3. Model Validation and Mesh Sensitivity Analysis

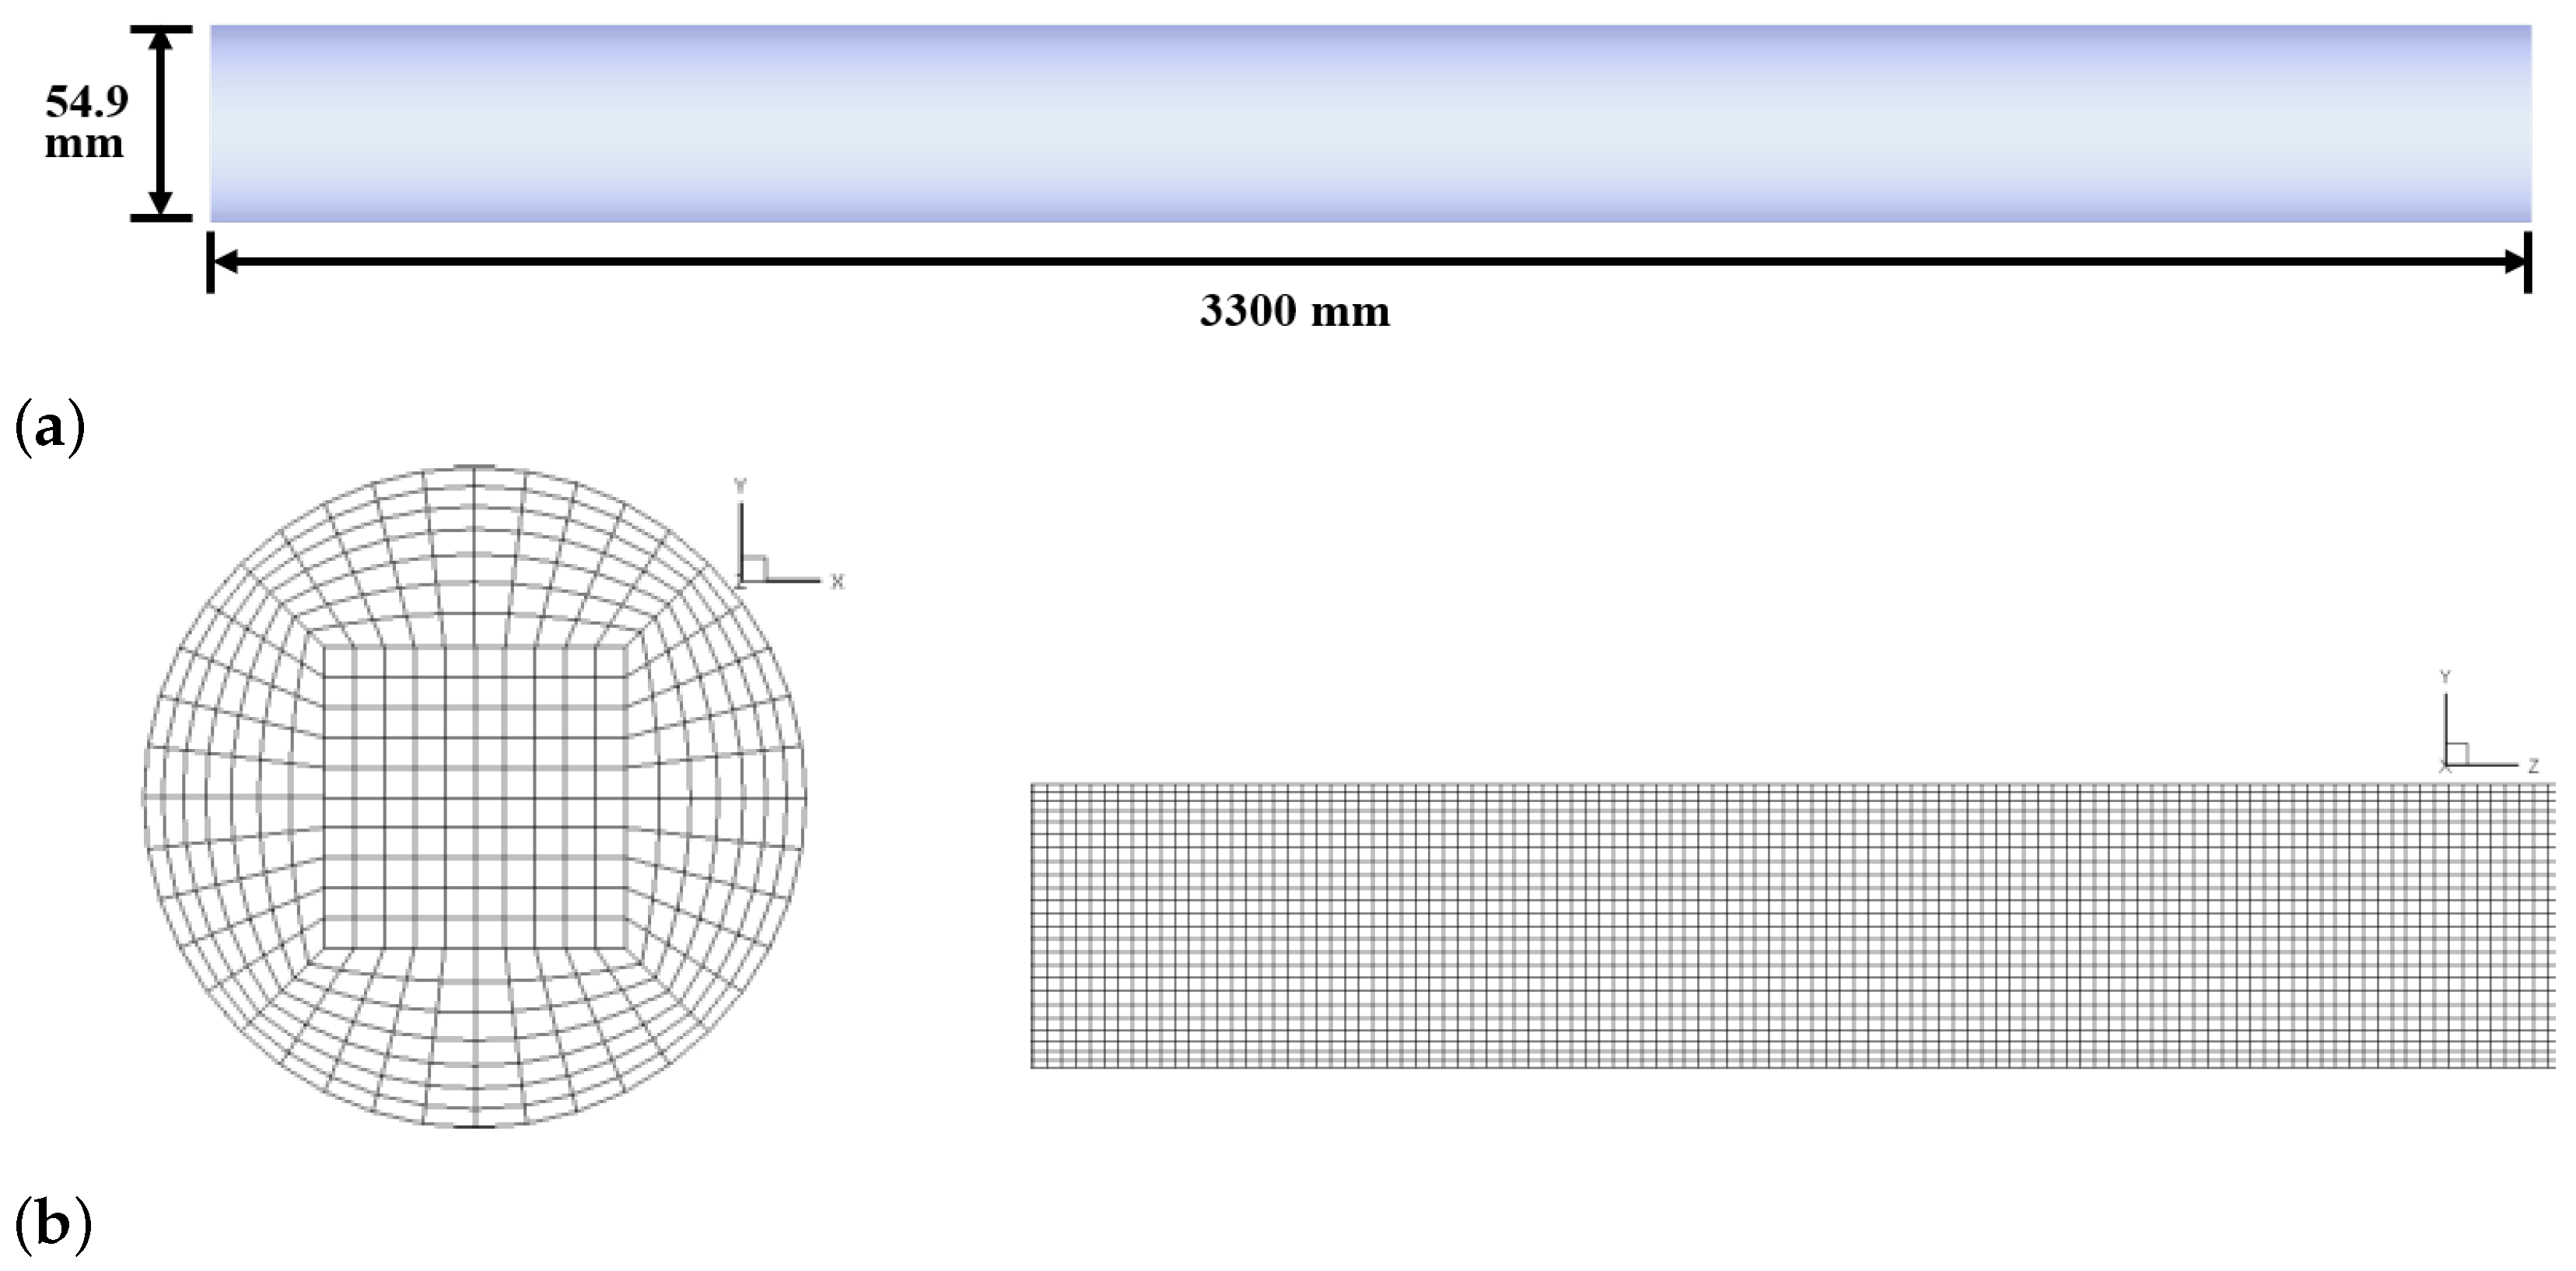
To ensure the good computational results at reasonable calculation cost, the sensitivity of the numerical solutions to computational mesh is investigated in terms of the mixture solid concentration. Five meshing schemes with different cell numbers (237,500, 456,000, 863,500, 1,484,000 and 3,648,000 cells) are used for grid independence test. 
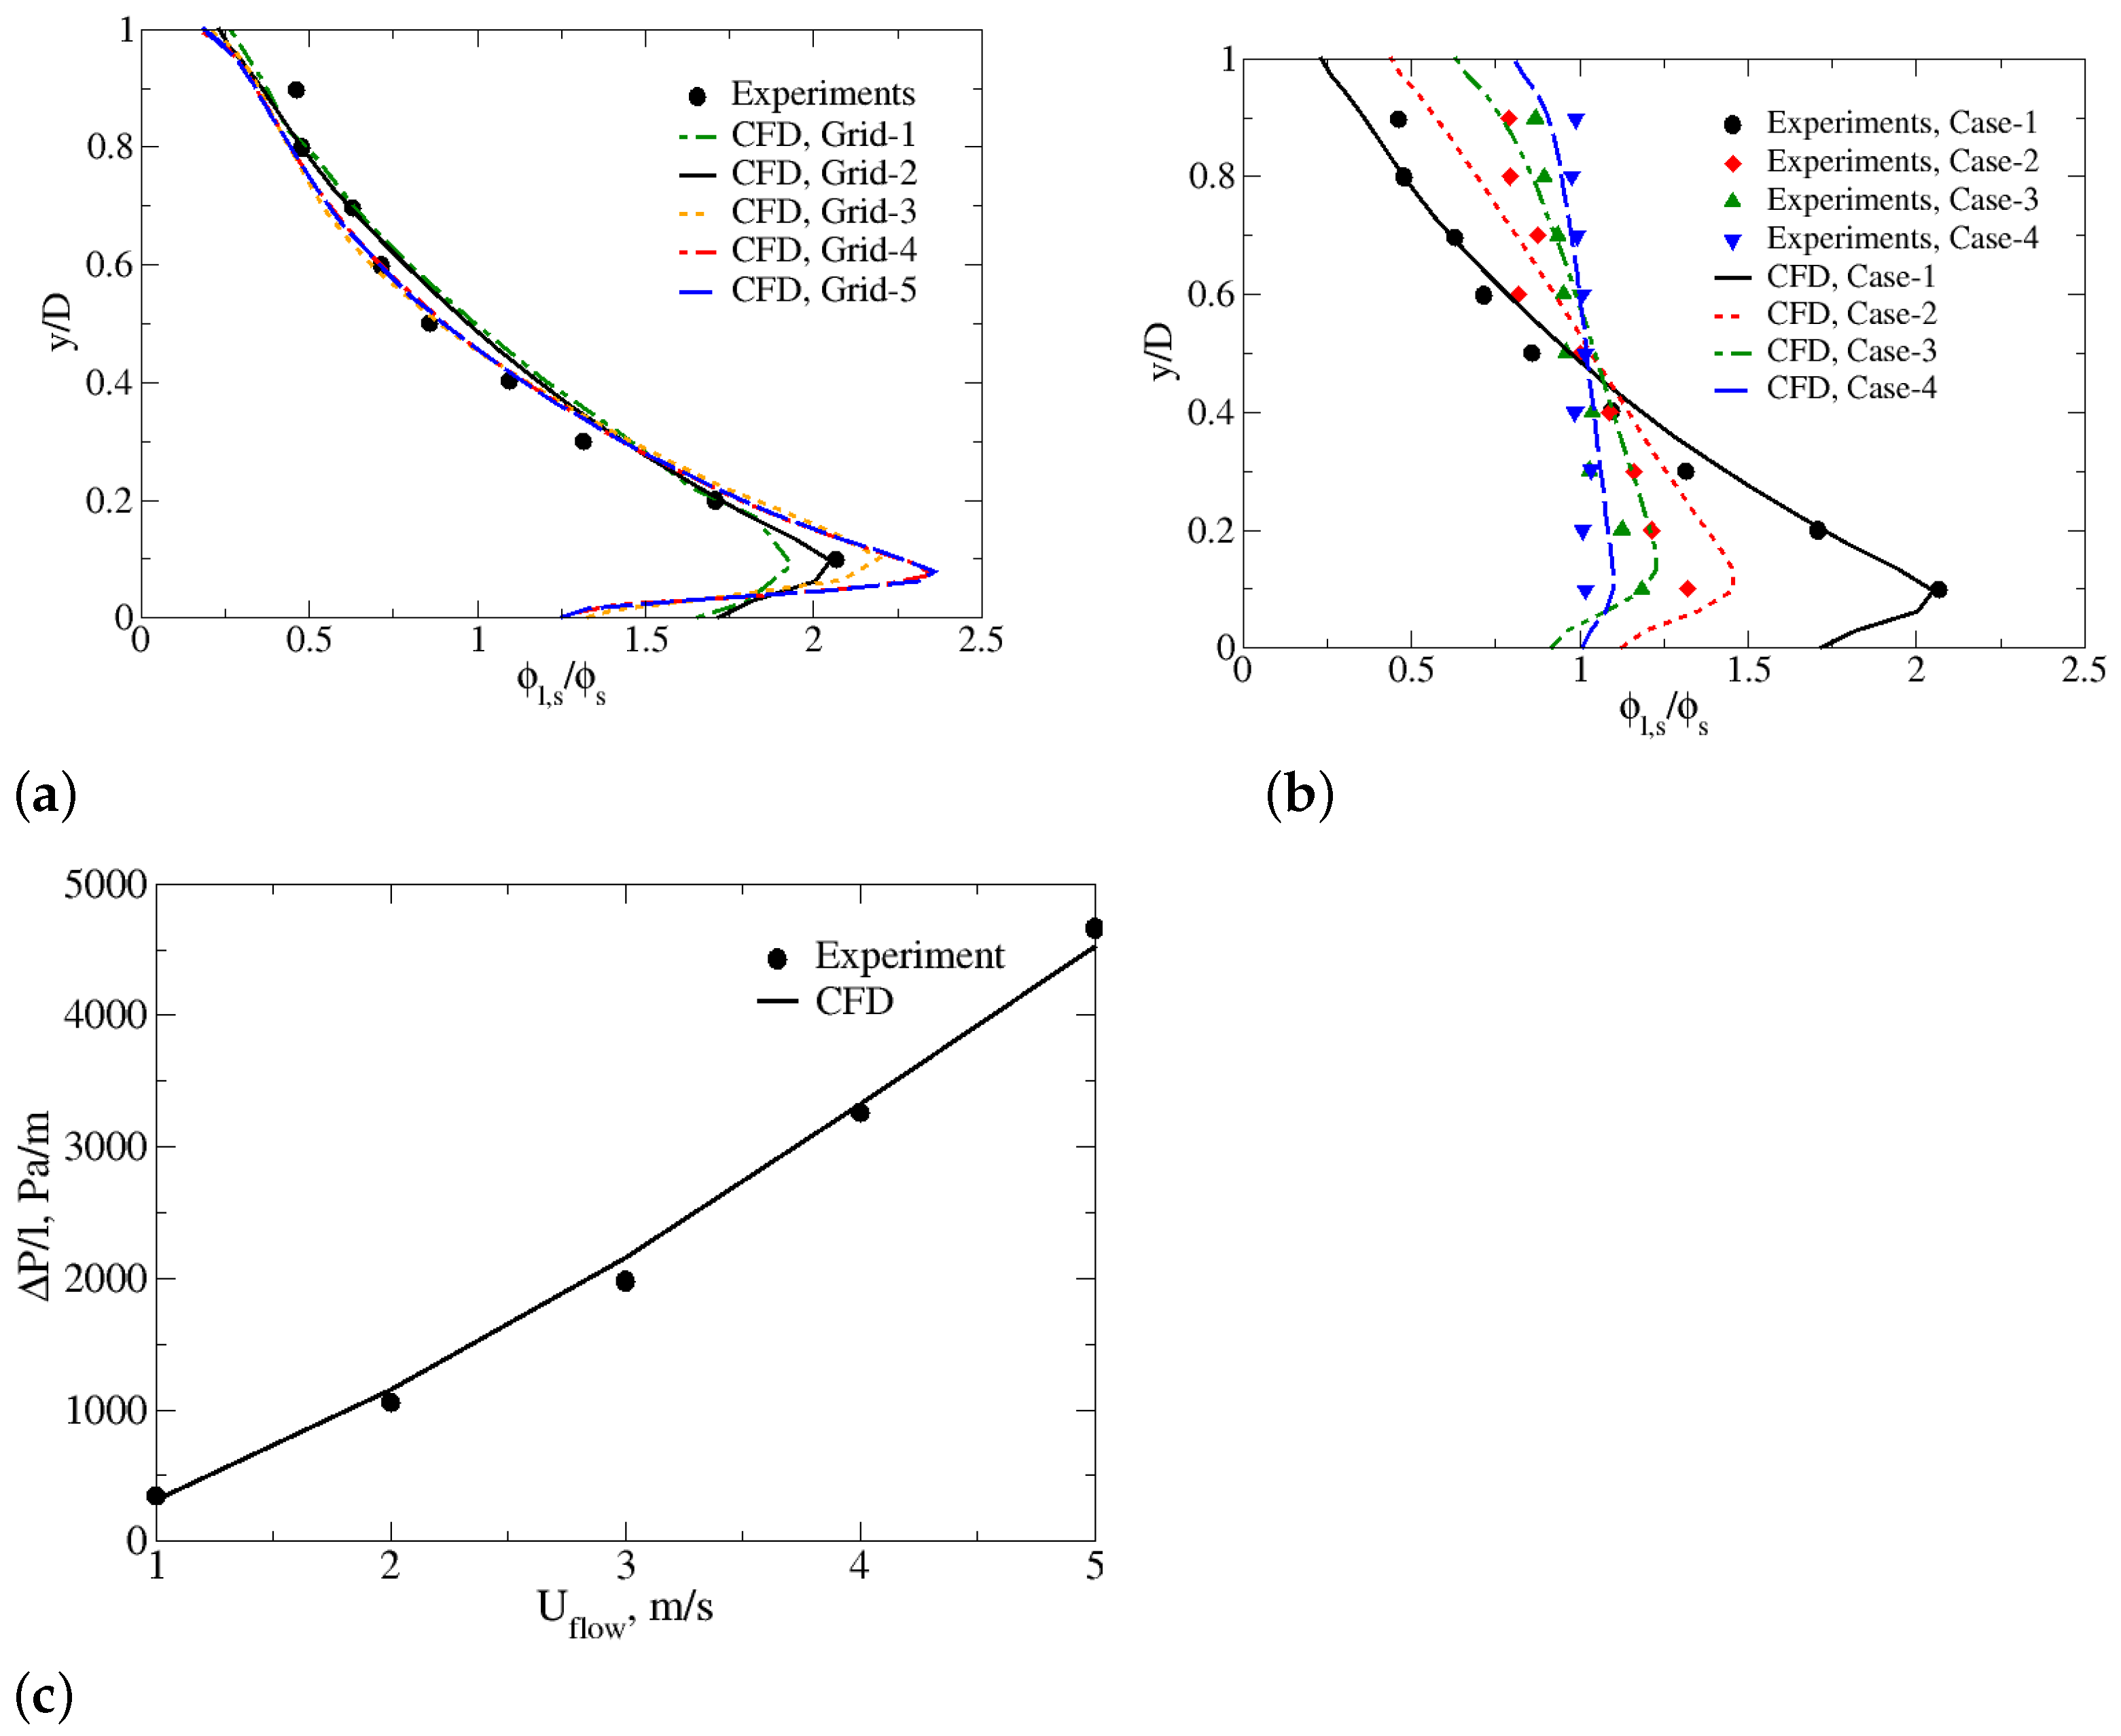
Figure 3a shows the predicted mixture solid concentration along the dimensionless y-coordinate at z/D = 55 with U i n = 2 m/s and ϕ s = 0.2. As can be seen from the figure, higher mixture particle volume concentration distributes close to the bottom of the pipeline owing to the gravity effect. Comparison of the numerical results for the dimensionless solid concentration profiles as predicted by Grid-1 to 5 with those measured experimentally reveals a good agreement. The results obtained from Gird-2 underpredict the solid concentration near the bottom wall, with an averaged deviation of 10.4%, while there is slight overprediction of solid phase at the same region for Grid-3, 4 and 5, with averaged deviations of 10.8%, 13.1% and 13.6%, respectively. This is probably due to the validity of the drag force closure relations utilized in Eulerian-Eulerian multiphase model [19,38]. The experimental data agree well with the simulation results obtained from Grid-2, with an averaged deviation of 9.5%. In addition, the averaged value of the non-dimensional wall distance y + near the wall is about one in the 3D RANS simulations. If the mesh is refined from 456,000 to 3,648,000 cells, the numerical deviate greatly from the experimental measurements near the bottom wall region. Thus, Grid-2 produces a good agreement with experimentally measured solid concentration profiles. Similar grid effect was observed in Eulerian-Eulerian based modeling of solid-liquid flow in pipelines and solid-gas flows in fluidized beds referring to 3D simulations ([19,39,40]). It should be noted that each cell size should exceed the particle diameter in the Eulerian-Eulerain model due to the validity of the drag force closure relations [38]. Therefore, the Grid-2 with 456,000 cells is used in numerical prediction for turbulent swirling flow in the horizontal pipeline to guarantee a satisfactory degree of computation accuracy.
The main purpose of the validation study is to ensure the global formulations meaning a set of all input parameters in each submodel or closure is cable to predict the solid concentration and hydraulic gradient under various flow conditions. Figure 3b exhibits different trends of mixture solid volume concentration for four different cases. Generally, the solid concentration distribution determined through simulations shows good agreement with those obtained from experiments covering inlet slurry velocity (2–5 m/s) and mixture solid concentration (0.2–0.5), which proves the reliability and accuracy of the current global computational model. From the profile, we can observe the transition of the flow regime from the heterogeneous to pseudo-homogeneous distribution as the flow velocity and solid concentration increases from U i n = 2 to 4 m/s and ϕ s = 0.2–0.5, respectively. For the heterogeneous regime, the transported particles can be suspended by the turbulent eddies or the particle-particle and particle-wall collisions above the detectable sliding bed, while the large particles are settled down in the bottom at low velocity. For the pseudo-homogeneous regime, the typical flows laden with increased solid content flowing at high velocity. The relatively uniform distribution of suspended particles in the pipe cross section [20]. For example, the solid concentration obtained from Case-4 in the upper part of the pipeline is higher than that from Case-1. This indicates that the higher slurry velocity and concentration can enhance the suspension of multi-sized particles within the pipe due to the intense particle-particle and particle-wall collisions in the top of the pipe. Additionally, we noted that the global CFD model is fully validated under different operating conditions, and Case-1 ( U i n = 2, ϕ s = 0.2) gives the best comparison result. Therefore, all following simulations in the present study will be conducted at a constant inlet axial velocity U i n = 2 and mixture solid volume concentration ϕ s = 0.2. The trend of pressure drop for multi-sized slurry is present in Figure 3c. Clearly, the increase trend of pressure drop can be observed as the flow velocity increases from 1 to 5 m/s. This further confirms that the current global CFD model is reliable for predicting the multi-sized slurry flow under different operating conditions.

4. Results and Discussion

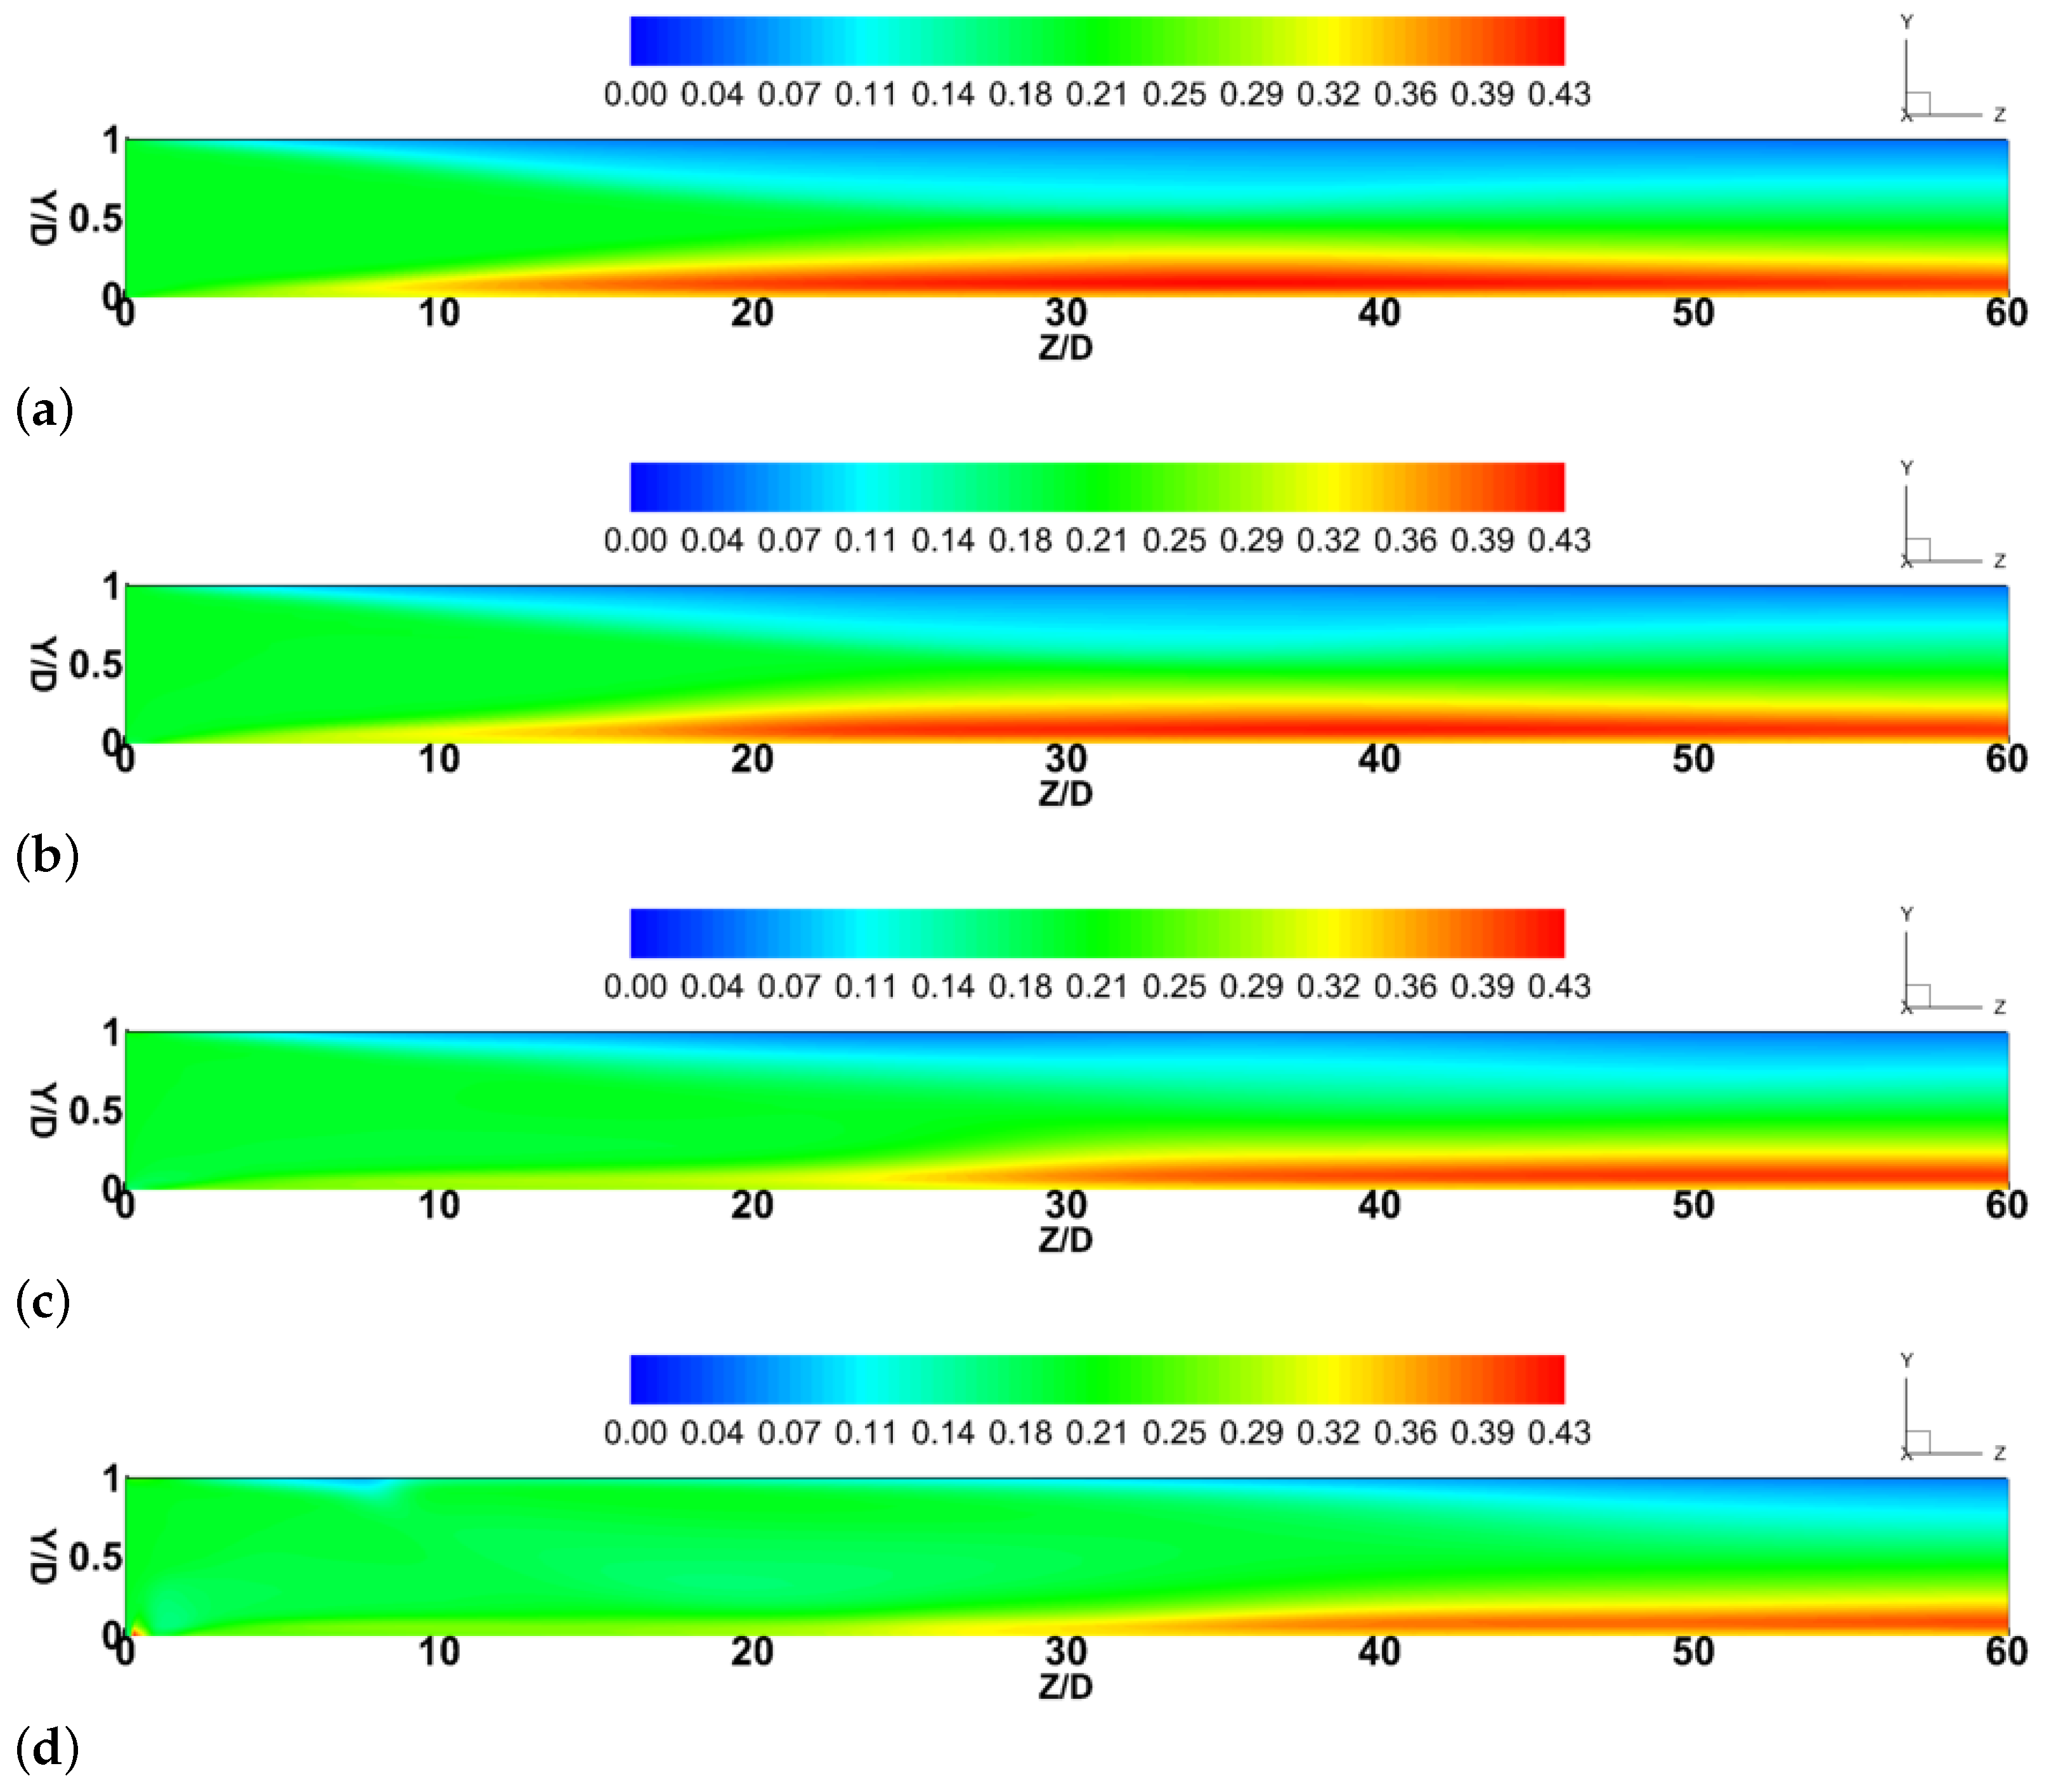
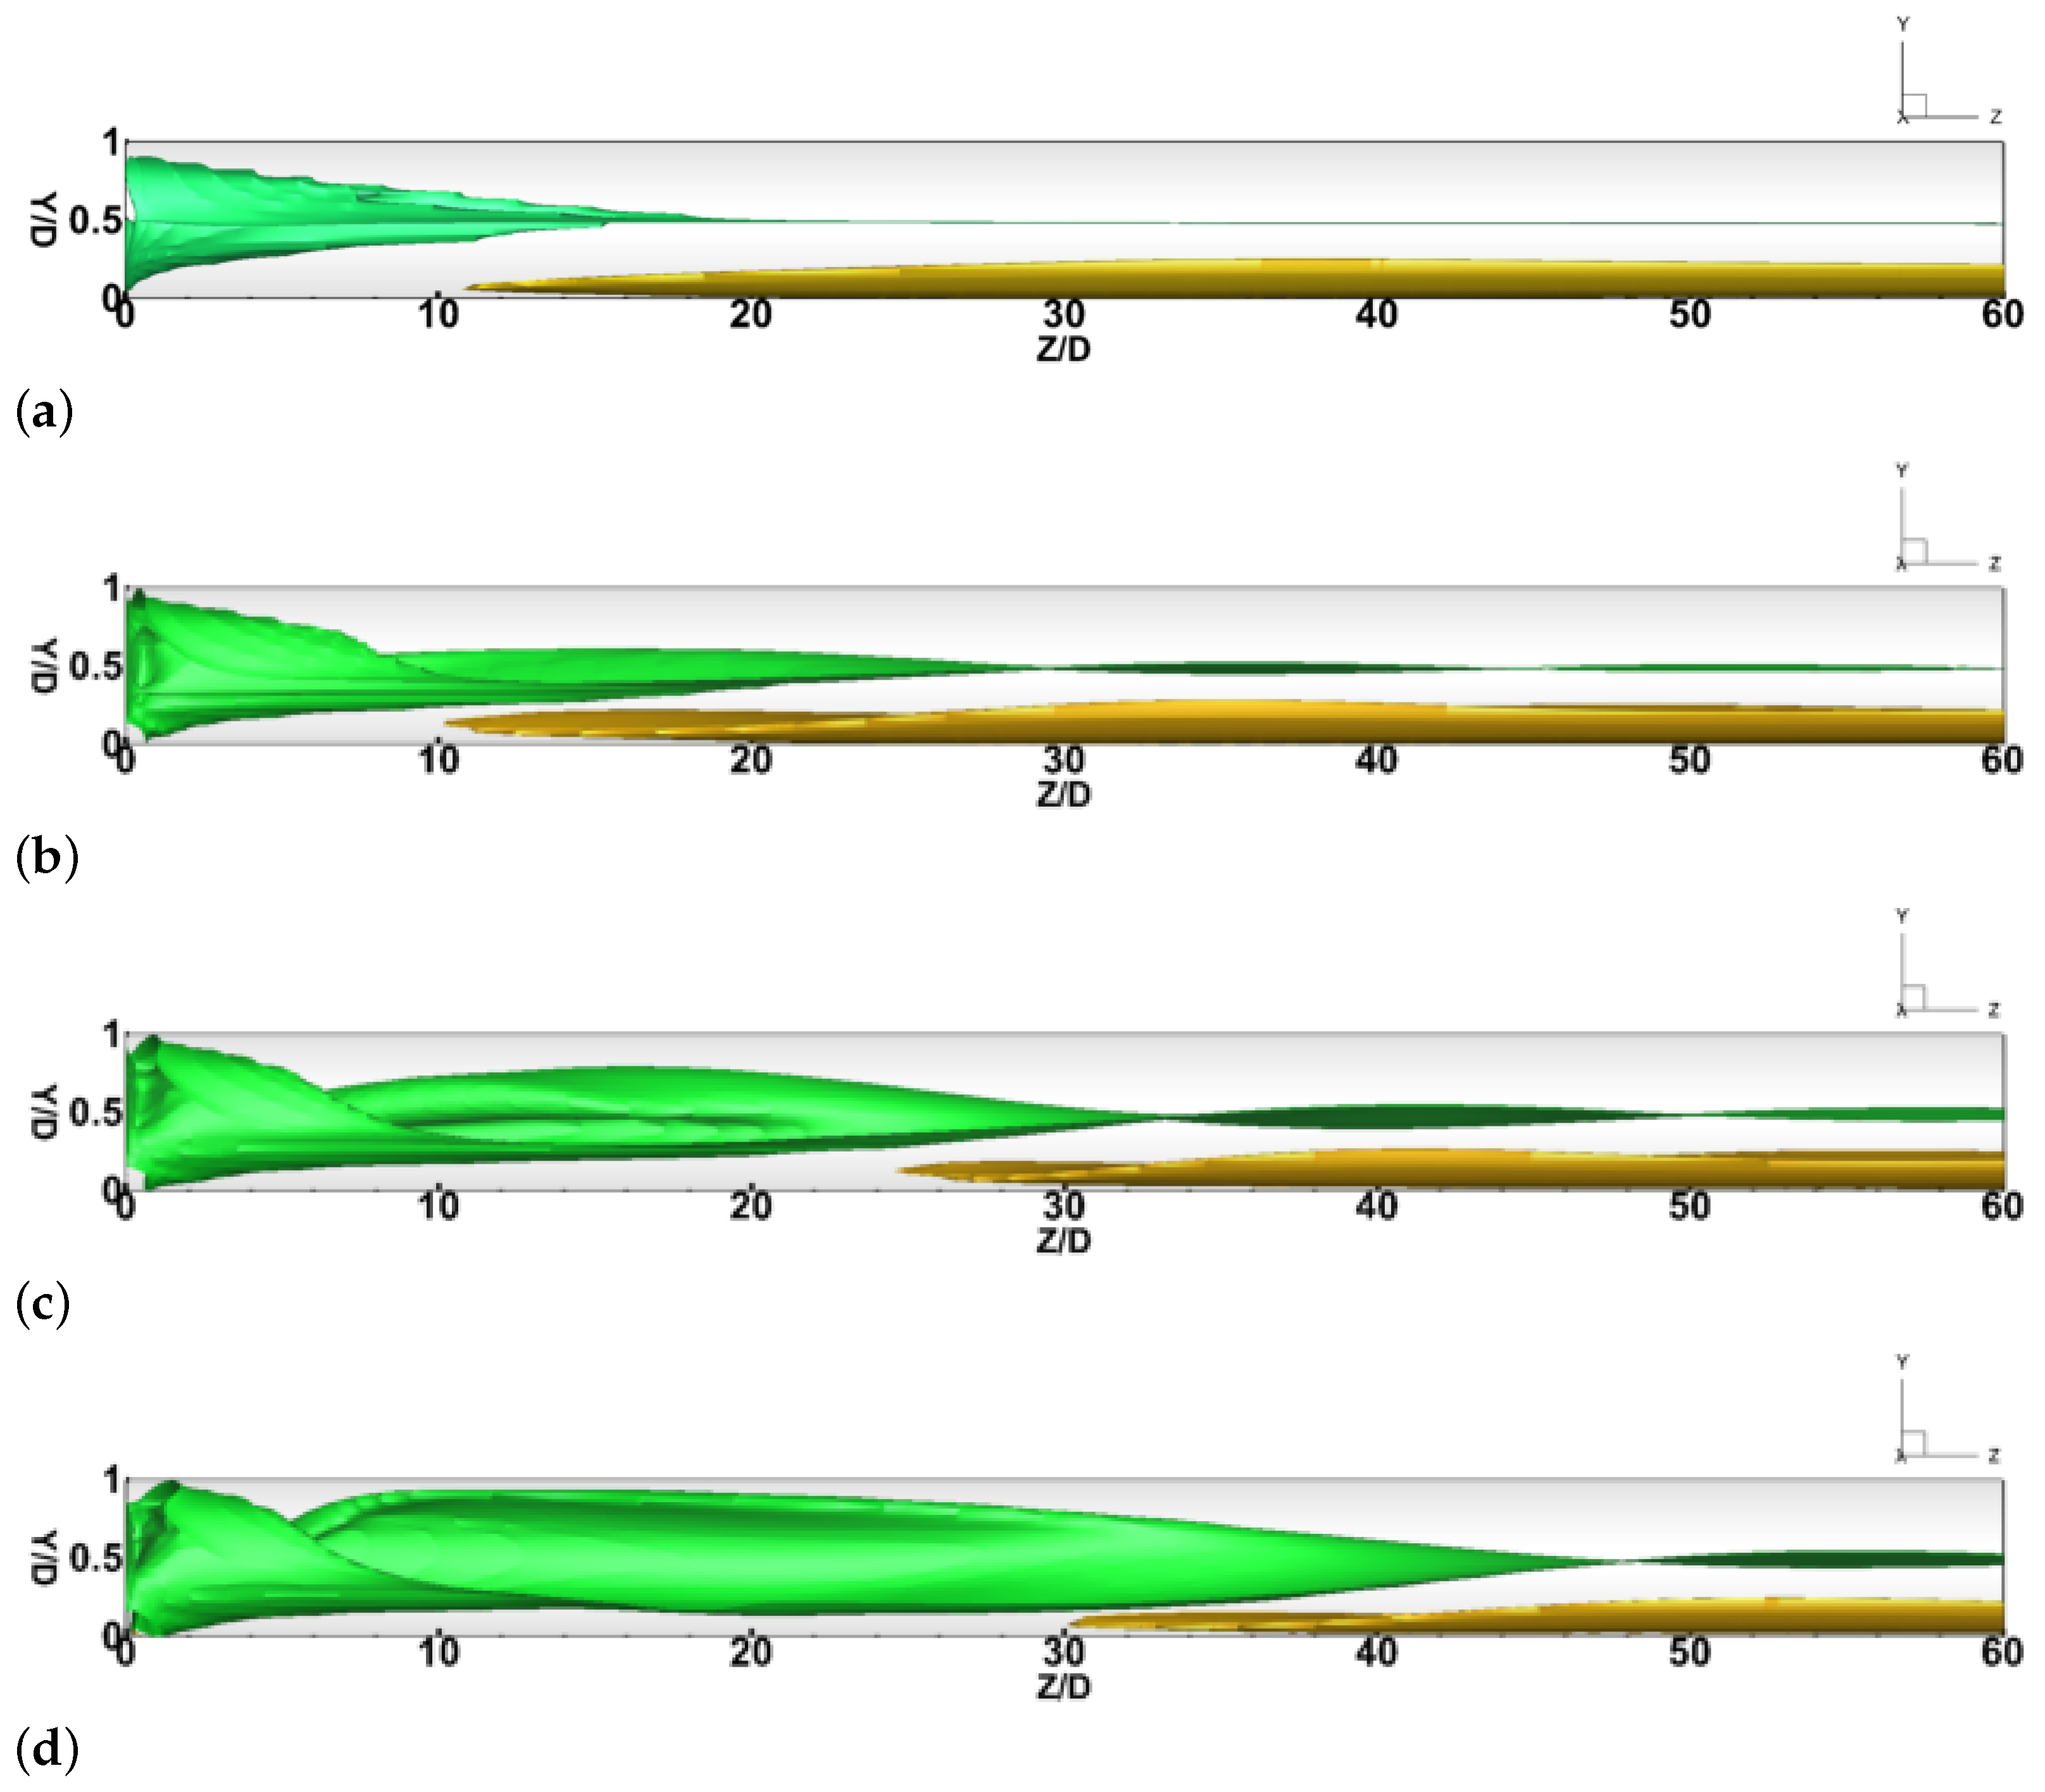
To intuitively compare the performance of vortex-based pipeline, Figure 4 depicts the contour plots of mixture solid volume fraction over the center plane along the domain under different swirl ratios from S R = 0 to 0.5. The red color represents the maximum value of mixture solid phase, while the blue color depicts the water phase. As illustrated in Figure 4, the magnitudes of the mixture solid volume fraction are comparable for all cases. Due to the effect of gravity and centrifugal force, the separation of liquid and micron-sized particle can be observed from the figure. In particular, a higher solid concentration ( ϕ s = 0.32–0.43) is mainly distributed in the bottom of the pipeline, while a lower value exists along the top wall. Similar separation phenomenon of liquid and solid particles (D 50 = 24 μ m) can be observed in the work by Shi et al. [19] who study the solid-liquid-gas-vapor four phases cavitating phenomenon in a Venturi tube. The liquid-solid-solid three-phase flow is fully developed under different swirling flow conditions. However, due to the presence of the centrifugal force in the swirling flow, the solid phase patterns in the liquid-solid-solid three-phase swirling flow are different from those in the straight flow ( S R = 0). In particular, the onset of the fully developed flow is delayed from Z/D = 30 to 50 as the swirl ratio increases from S R = 0 to 0.5. This can be explained by the intense centrifugal force induced by the swirling flow in the upstream of the pipeline, which significantly affects the development of the turbulent pipe flow in the heterogeneous flow regime.
To characterize the transport characteristics predicted using the RANS approach, Figure 5 shows predicted results gained by the 3D k- ω SST turbulence model for four different cases. The iso-surface contour plots of the volume fraction of solid mixture, ϕ s = 0.35 (brown color) and ϕ s = 0.2 (green color), are utilized to visualize the distribution of the mixed slurry in the horizontal pipeline. It is observed that the mixture concentration of ϕ s = 0.2 transported from the inlet of the pipe travels a long distance along the central axis of the pipeline in both linear flow and swirl flow conditions. In the linear flow condition, the conical mixture structure appears at the beginning of the pipe and the axial flow is formed at Z/D = 20, as shown in Figure 5a. In comparison, increasing the swirl ratio from S R = 0 to 0.5 has powerful influence on the transportation characteristics of the mixture slurry flow. Specifically, the twisted motion of the slurry flow is obviously observed in the upstream of the pipe, and the vortex rope diameter increases rapidly during the rise in the inlet swirl intensity. Besides, the swirling flow decays until it becomes an straight flow in the downstream, but the onset position of such transition is delayed from Z/D = 30 to 50 as the swirl ratio increases from S R = 0.1 to 0.5. In this case, the length of settled mixture solid concentration reduces from z/D = 50 to 30. We also noted that the volume of mixture concentration of ϕ s = 0.35 decreases gradually with increment in S R . This reveals that the strong centrifugal force induced by the swirl flow carries more solids particle away from the pipe bottom and thus a higher transport efficiency in the case with a higher swirl intensity.
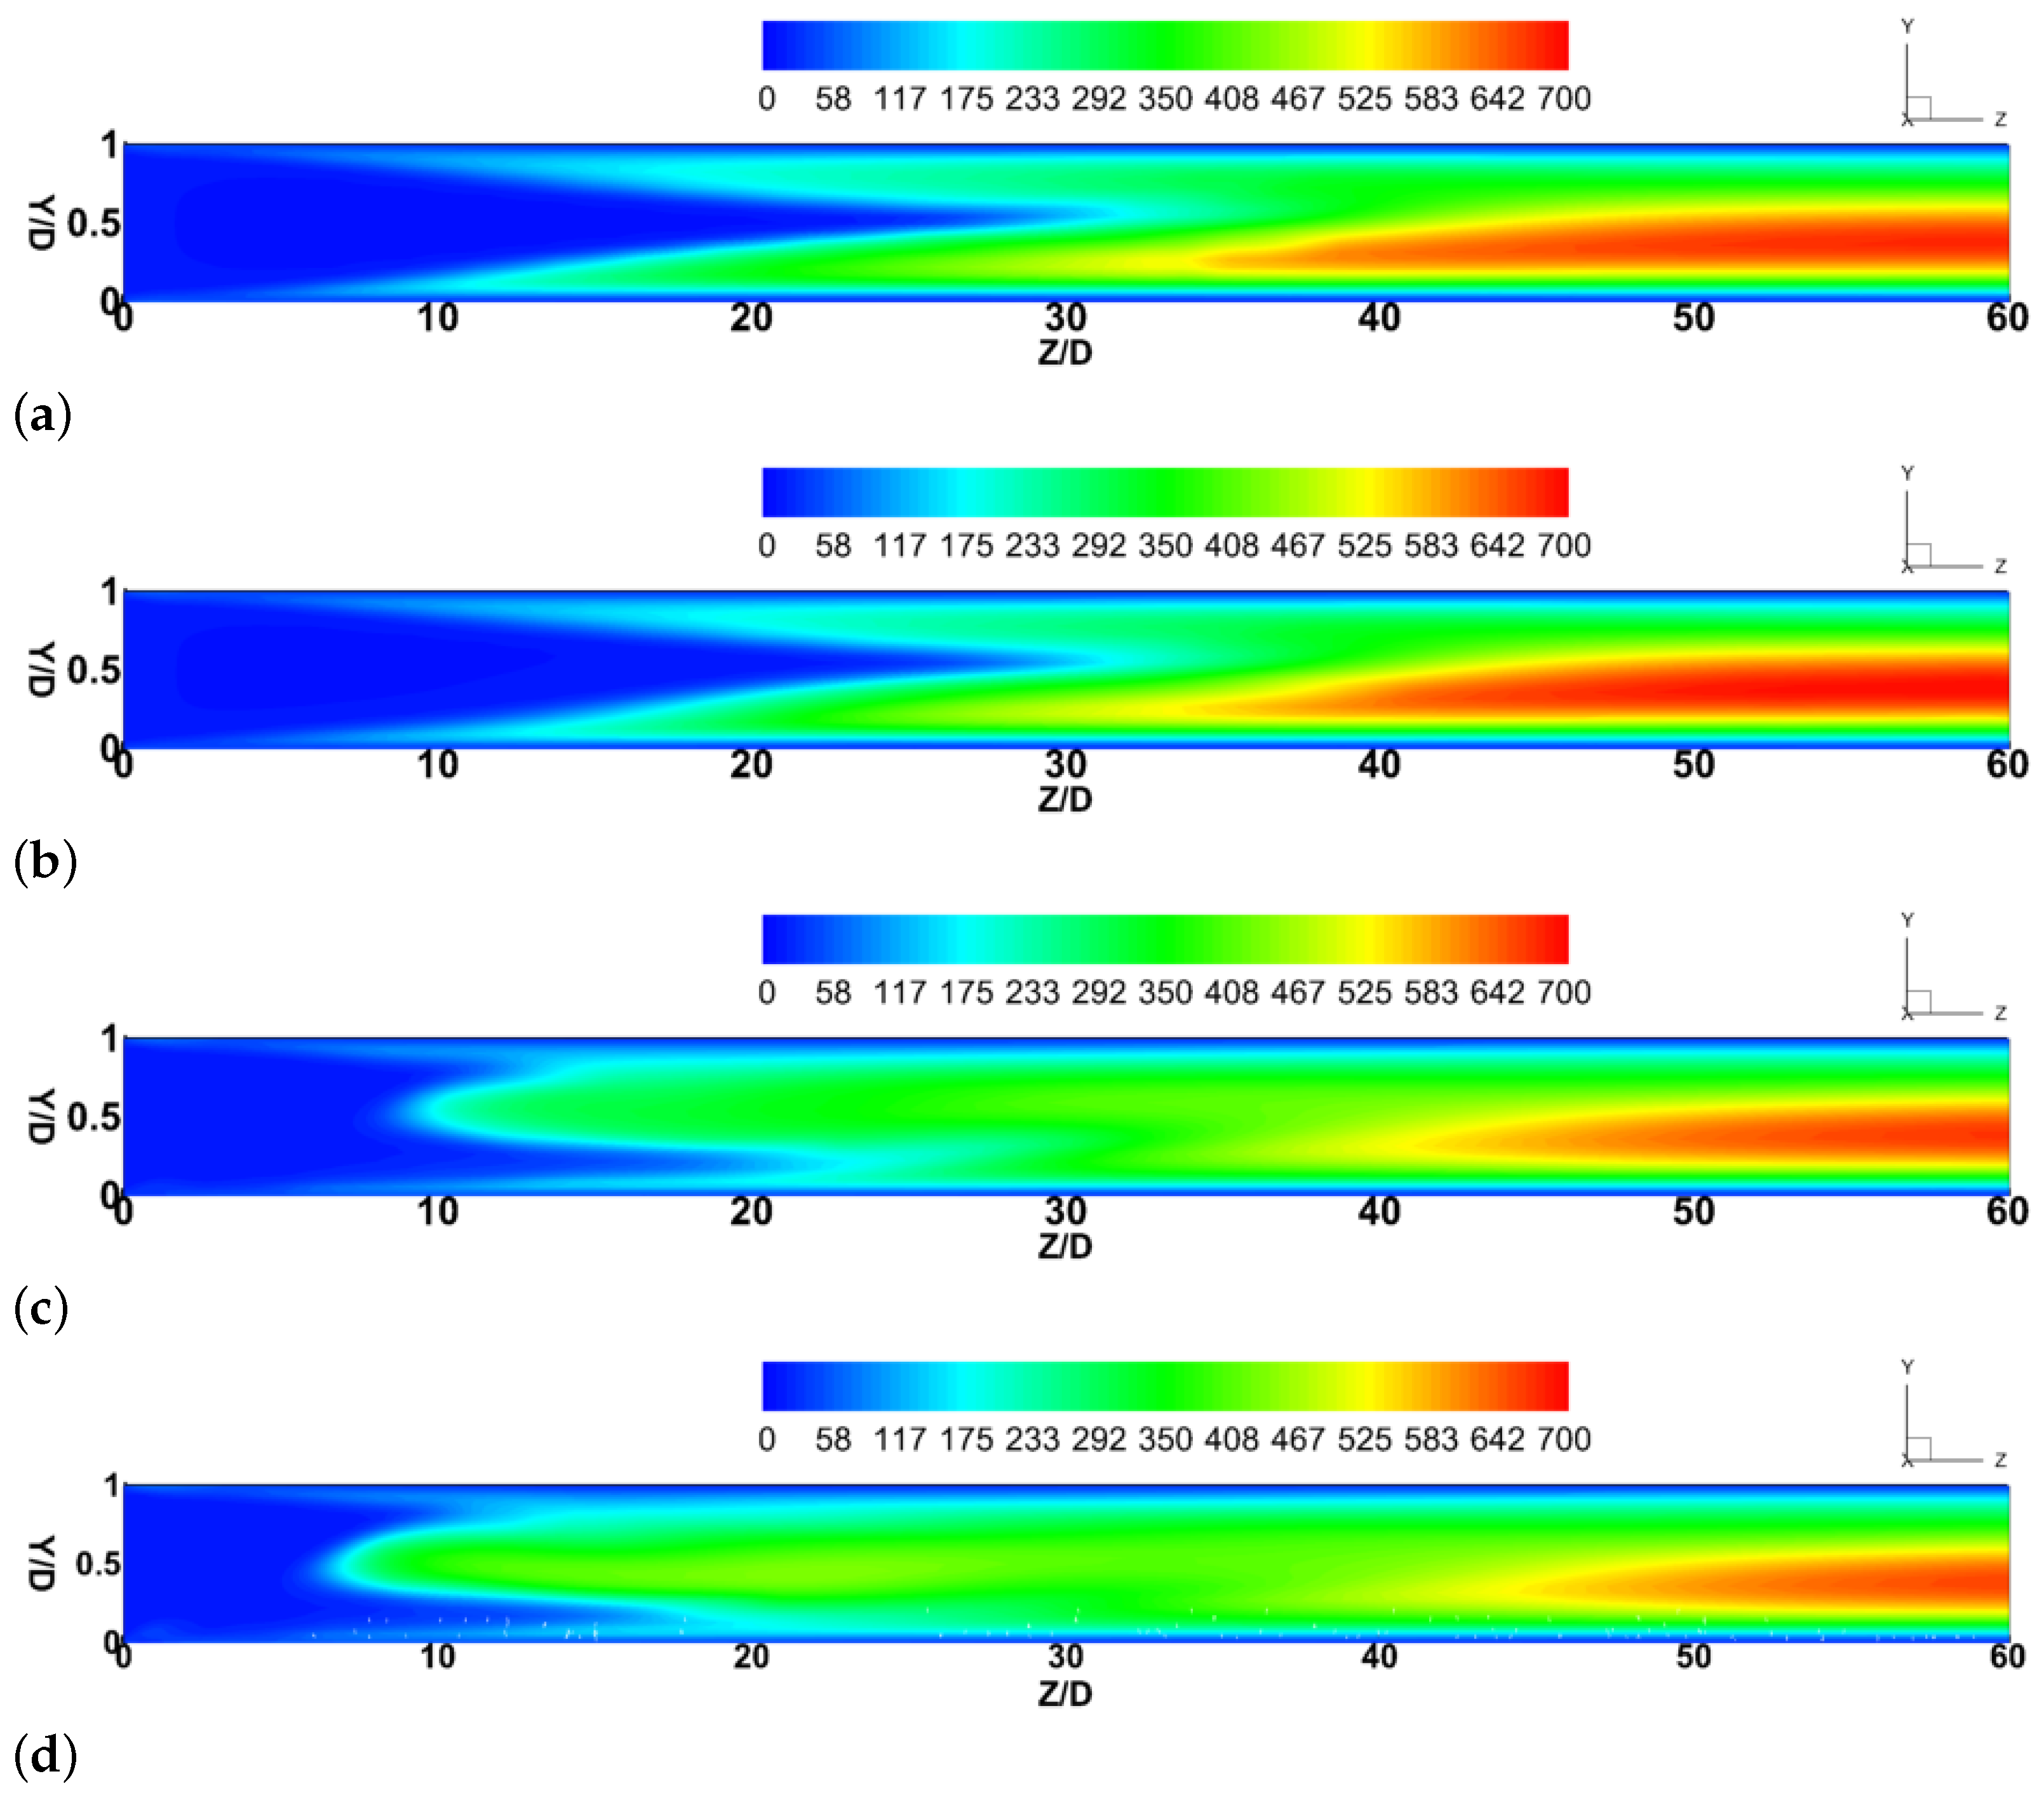
Figure 6 presents the contour plots of the turbulent viscosity ratio ( μ t / μ o ) in the middle plane at four different swirl ratios (0, 0.1, 0.25, and 0.5). As can be seen from the figure, the significant turbulent intensity mainly concentrates in the fully developed flow regime, while a lower turbulence intensity presents in the upstream region. Compared with the linear flow case, in the swirl flow cases, the length of the intense turbulence viscosity greatly reduces (by up to 33%). A higher magnitude of turbulent viscosity ratio ( μ t / μ o = 525–700) predicted from linear flow is present in the region between Z/D = 30 and Z/D = 60, while that for the highly swirling flow ( S R = 0.5) is concentrated in the region between Z/D = 40 and Z/D = 60. As the swirl ratio increases from 0 to 0.5, the turbulent viscosity is more extensive in the upstream along the central axial and almost fills the whole pipeline. This phenomenon is expected since the imposed swirl flow intensifies the turbulence eddying motions and enhances the collision forces between each particles, thereby promoting the rapid mixing and fully suspension of the solid particles.
Figure 7 depicts the streamlines of axial velocities across the horizontal pipeline under different swirling conditions. It is obvious from the figure that the higher magnitude of axial velocity mainly distributes in the centre core of the pipe, while the lower axial velocity appears in the near wall regions. The maximum magnitude of the flow velocity increases by 20% as the imposed swirl ratio rises from S R = 0 to S R = 0.5, indicating that the swirl intensity significantly affects the velocity profiles within the pipeline; hence, the turbulence viscosity ratio is varied intensively as well. The apparent radial expansion of the flow can be observed when the greater swirl strength is introduced. This is owing to the additional tangential velocity component imposed in the inlet of the pipeline, which enhancing the intensive mixing of the fluid and the tangential kinetic energy exchange among multi-sized particles. Far away from the inlet of the pipe, the swirling flow decays apparently along the streamwise direction due to the weakened centrifugal force, finally reaching the straight liquid-solid-solid three-phase flow. On the other hand, the swirling distance increases and the decay rate decreases slightly with the increase of tangential velocity from 0.2 m/s to 1 m/s. Such decaying swirling flow is the results of viscous dissipation and tangential momentum transfer from the central region toward the wall per particle-particle collision and particle-wall collision.
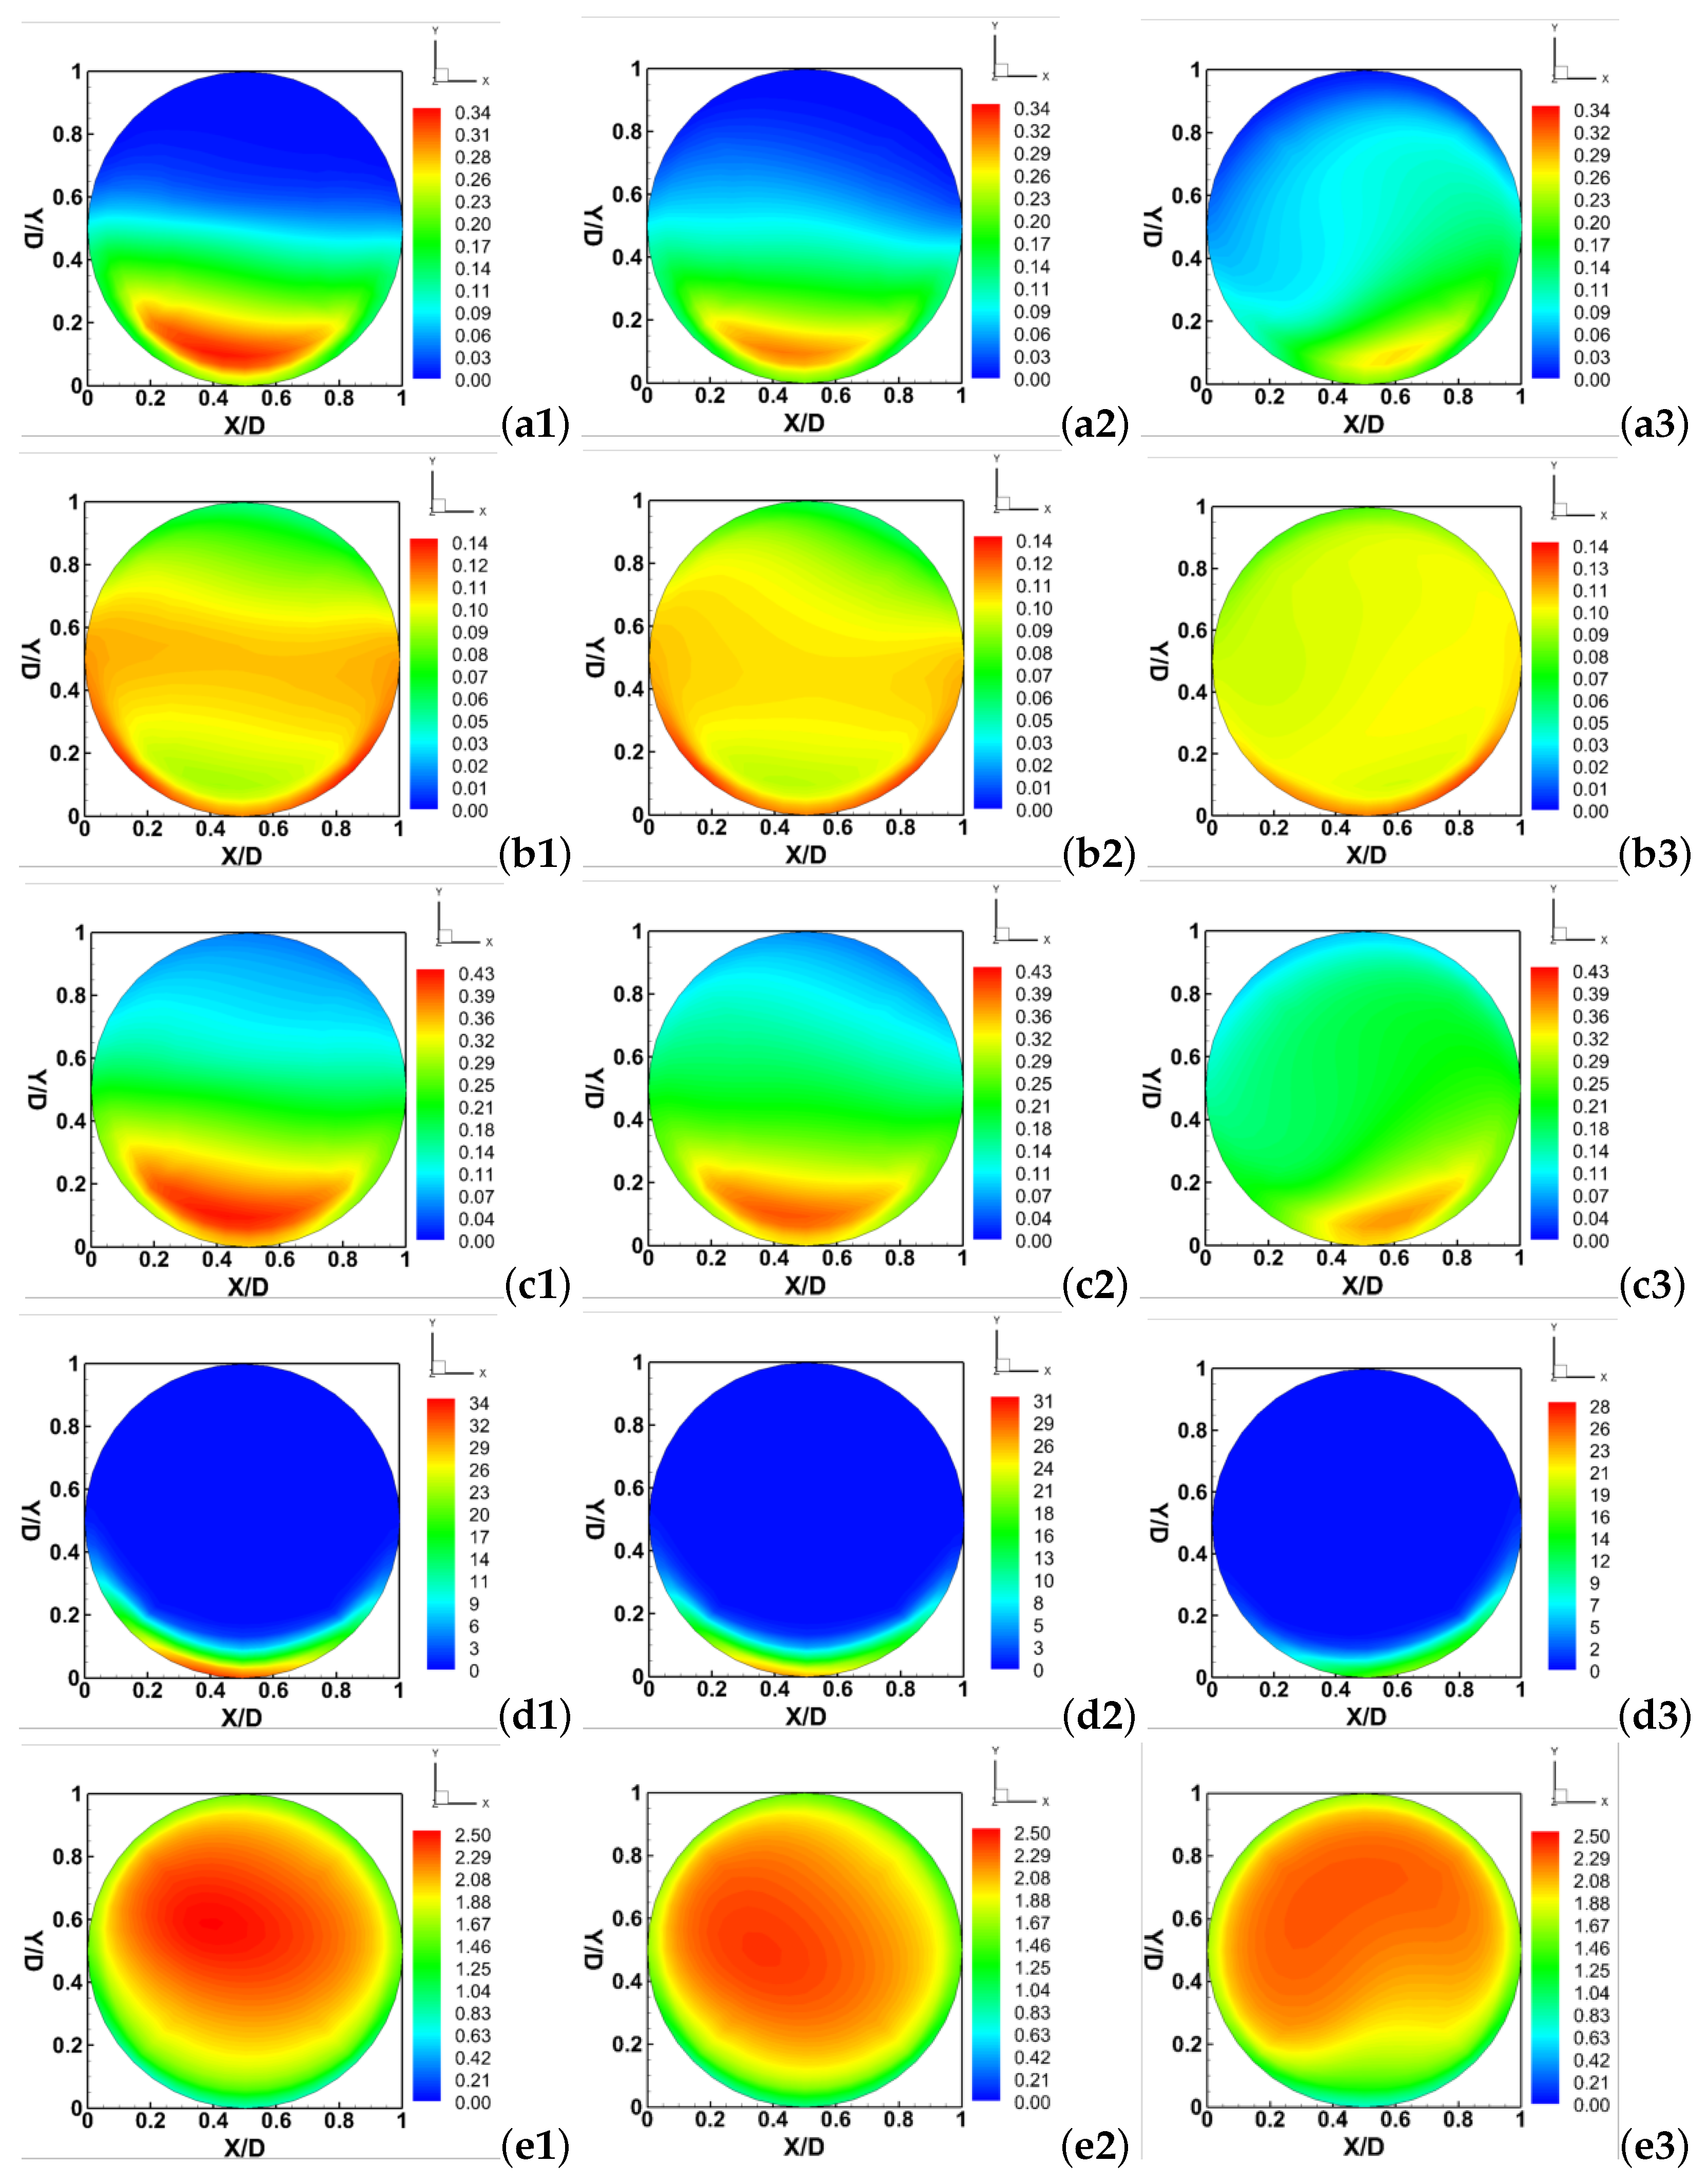
To visualize the flow patterns in the cross-section of the pipeline, Figure 8 exhibits different solid volume fraction, granular pressure and axial velocity magnitude on the cross section of z/D = 35 under different swirling motions. As observed in Figure 8a–c, the distributions of coarse particle phase, fine particle phase and mixture phase are distinct for S R = 0.1, 0.25 and 0.5. In general, the higher coarse solid concentration is mainly distributed in the lower-half section (y/D = 0 to 0.2), while the fine solid concentration remains in a pseudo-homogeneous flow regime. Additionally, the fine particles form a near-wall lubrication layer along the bottom wall, which can significantly reduce the collision and friction between the coarse particles and the wall. Due to the complex swirl effect affecting the local flow patterns, each solid volume fraction are asymmetric about the central vertical line (x/D = 0.5). However, the mixture concentration is reduced near the bottom of the pipe and the slurry flow is closing toward homogeneity with increasing swirl intensity from S R = 0.1 to 0.5, implying that more particles remain suspended and thus the pipeline transport efficiency of multi-sized particulate flow is improved significantly.
Figure 8d,e shows the simulation results obtained for the different trends of granular pressure and axial velocity distribution. As shown, the maximum granular pressure, which is located close to the central bottom wall, decreases from 34 to 28 (about 18%) as the swirl ratio increases from S R = 0.1 to 0.5. In addition, the granular pressure distribution is more asymmetric at higher swirling condition. This suggests that the granular pressure is sensitive to the change in the swirl intensity. Higher swirl strength leads to lower collision probability and intensity through the enhanced vortex motion, thereby minimizing the pipeline wear. On the other hand, the effect of swirling motion on the axial velocity pattern is evident, as shown in Figure 8e. It is noted that the maximum velocity ( U z = 2.5 m/s) is situated above the pipe center, and it moves upward slowly with the increase in swirl intensity from S R = 0.1 to 0.5. The near-wall lubrication layer formed by the fine particles near the bottom wall reduces the carrier fluid viscosity, thereby enhancing the local velocity slightly. However, the better particle suspension performance leads to the expansion of mixture solid concentration toward center region; the intense swirling motion causes the break down of lubrication layer. In this case, the velocity magnitude presenting in the near bottom wall region decreases slightly as the swirl ratio increases from S R = 0.1 to 0.5.
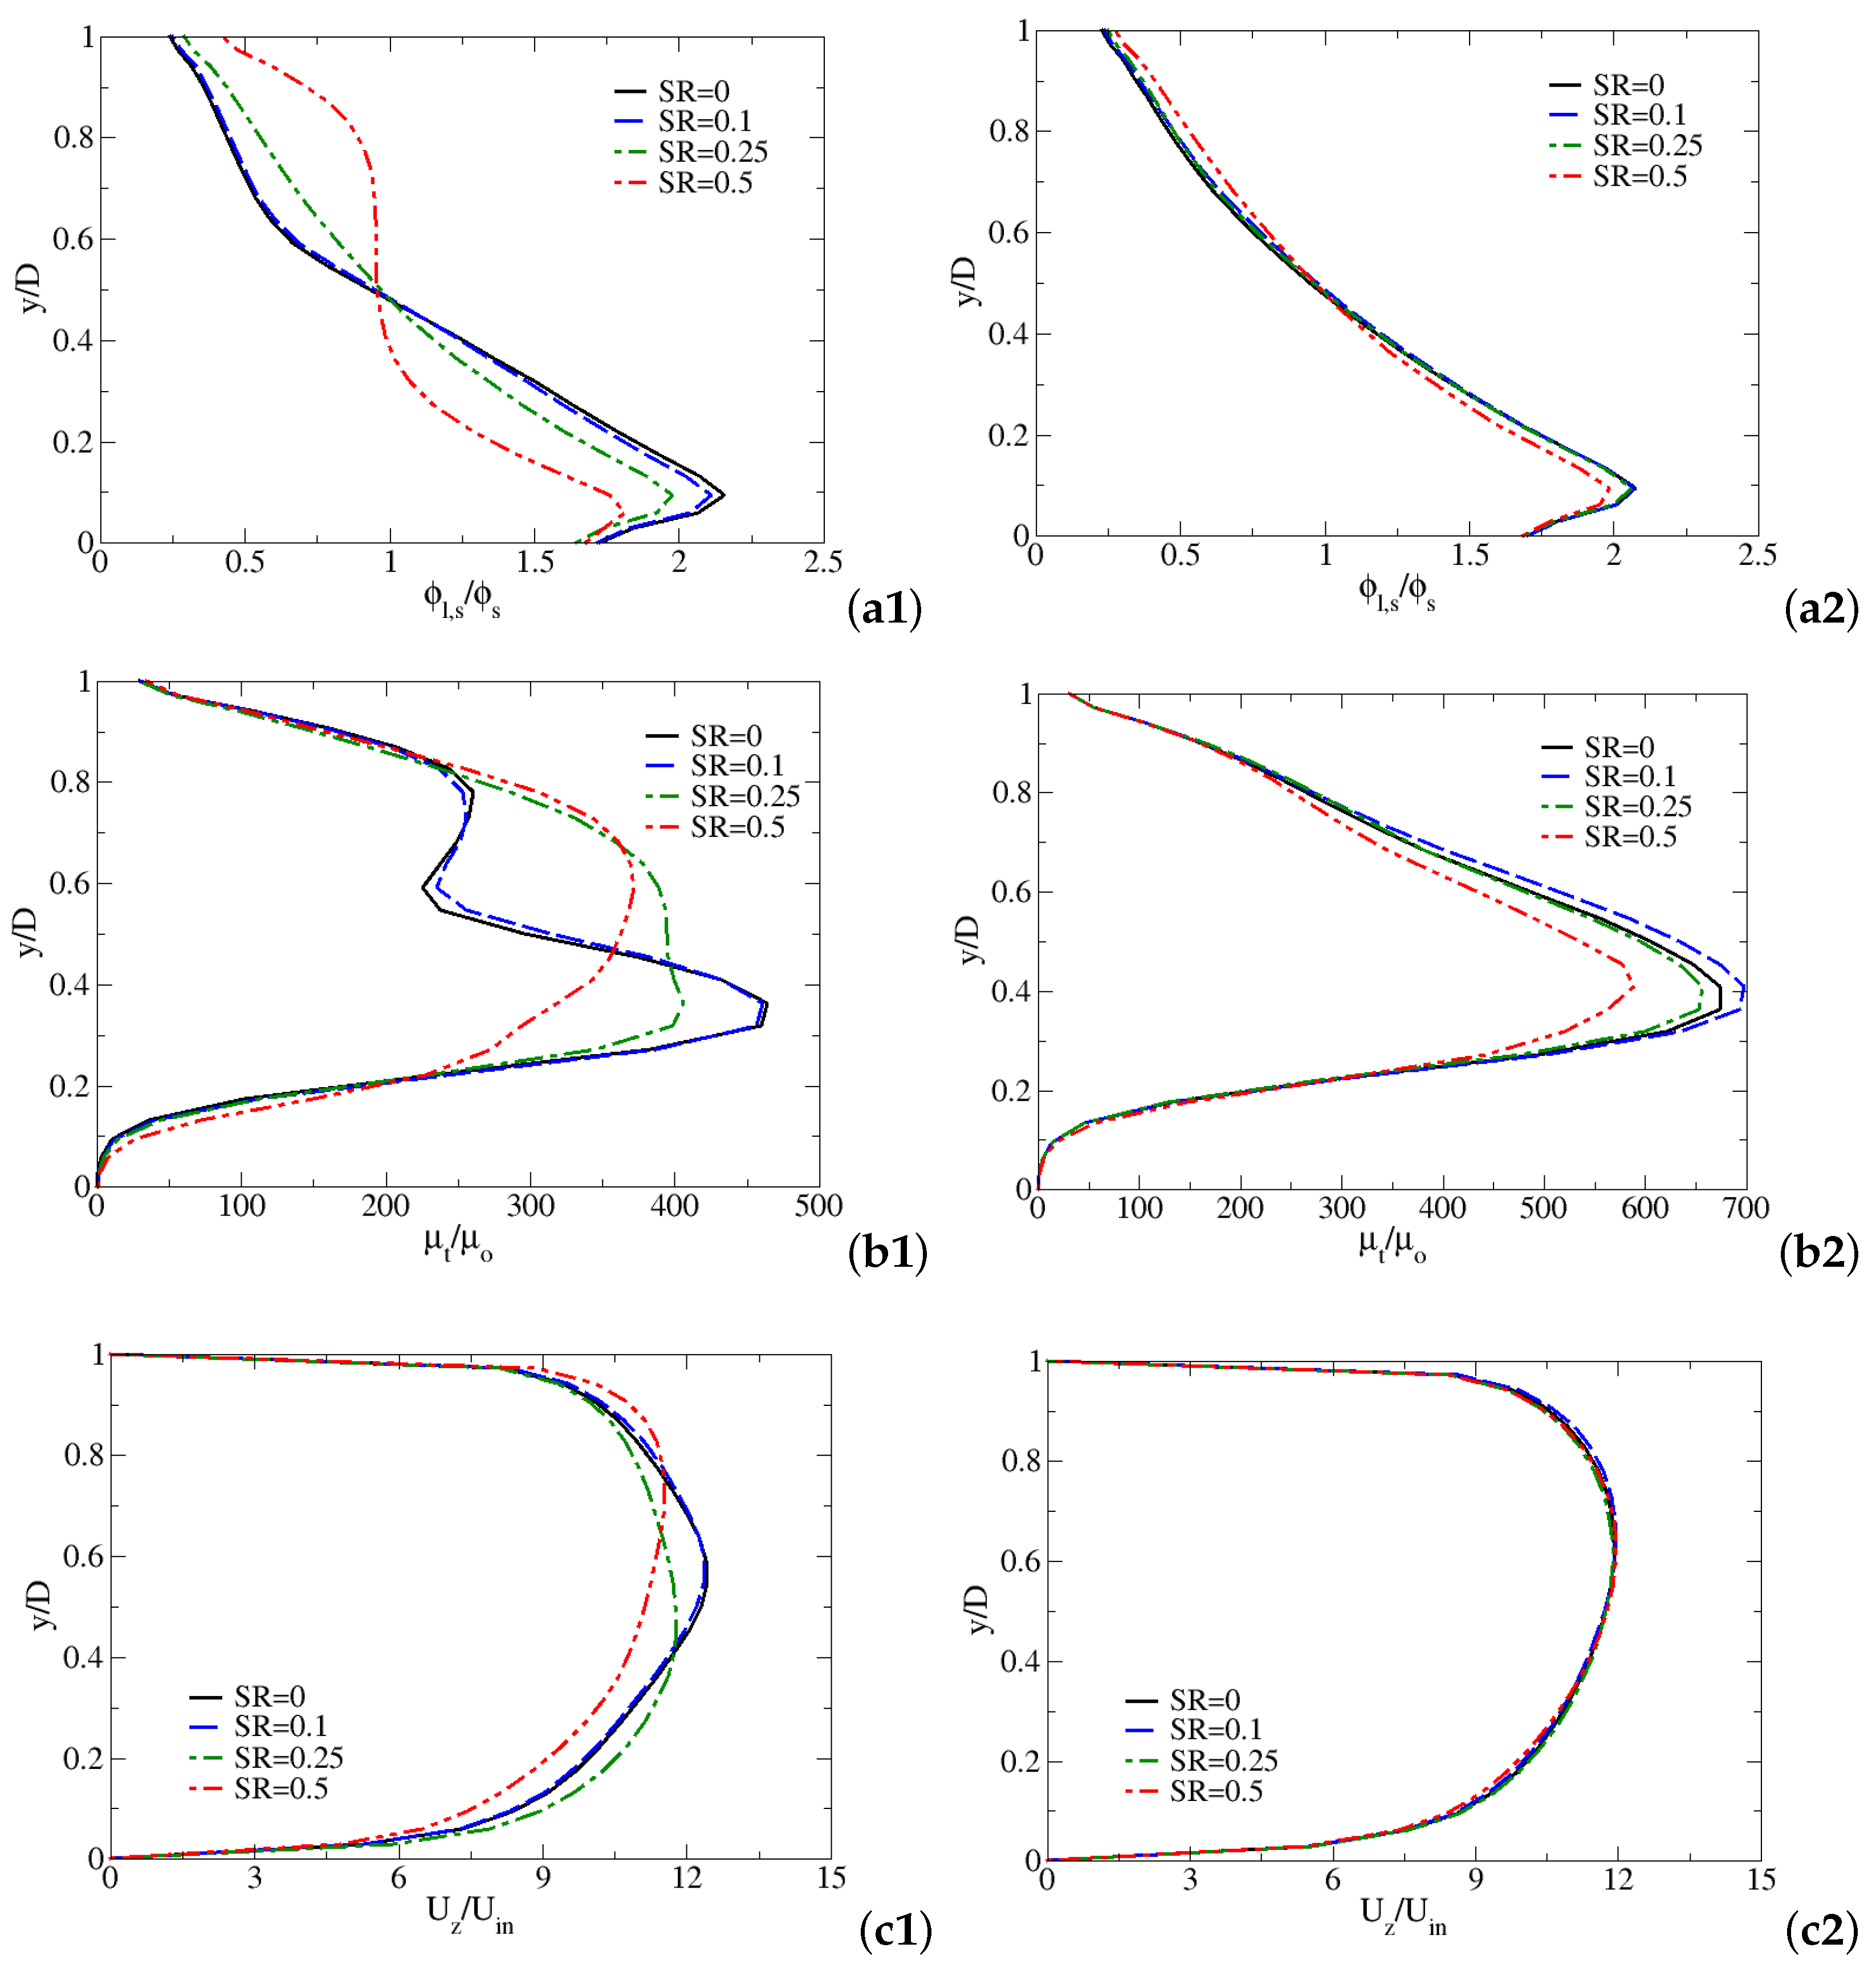
The qualitative difference between the predictions of the fluid characteristics under various swirl ratios is shown in Figure 9. A cross section evolution of the significant dimensionless parameters such as multi-sized solid volume fraction ( ϕ l , s / ϕ s ), turbulent viscosity ratio ( μ t / μ o ), and z-axial velocity ( U z / U i n ) as a function of y/D have been collected along the central vertical line. Two different positions have been identified: (1)-swirling flow condition (z/D = 35) and (2)-straight flow condition (z/D = 55). The comparison of the results obtained from swirl flow and straight flow regimes can help us understand the decaying swirling flow behaviors under different swirl intensities. Generally, the higher the swirl intensity, the more of the multi-sized particles suspend in the pipe. This trend become more evident at the highest swirl ratio S R = 0.5. However, comparing Figure 9(a1,2), the swirl effect becomes less dominant at z/D = 55 over z/D = 35 owing to the weak swirl effect of the fluid. On the other hand, the turbulent viscosity ratio declines more pronouncedly by about 20% and 16% at position z/D = 35 and 55, respectively, as illustrated in Figure 9(b1,2). This further confirms that the fully developed turbulent flow is postponed by the extensive swirl intensity existing in the upstream region. At the same cross-section positions, we found that the effect of swirl intensity on the flow velocity is relatively small. Conversely, the local velocity decreases obviously with the increase of swirl ratio in the lower-half section of the pipeline at z/D = 35 (see Figure 9(c1)), due to the results of break up of lubrication layer and the enhanced suspension behaviors.

5. Concluding Remarks

In this study, 3D simulations of the liquid-solid-solid three-phase flow in a horizontal pipeline mimicking marine minerals transportation have been conducted using the commercial CFD software ANSYS FLUENT 17.0. Two types of solid particles with different diameter (44 and 125 μ m) but with the same mass fraction have been added in the flow. The Eulerian-Eulerian multiphase model in conjunction with the k ω SST scheme was validated against the experimental data from the literature, with the deviation in mixture concentration controlled within in 10%. From the perspective of internal multiphase flow mechanics, an attempt is made for the first time to investigate the hydrodynamic behaviors of multi-sized slurry flow such as concentration distribution, turbulent intensity, granular pressure, and velocity distribution in the horizontal pipeline under various swirling motions ( S R = 0, 0.1, 0.25 and 0.5).
Analysis of the simulation results shows that the initial swirling motion has a strong influence on the flow characteristics and particulate transportation. In particular, imposing a sufficient swirling motion in a multi-sized particulate flow leads to the heterogeneous to pseudo-homogeneous regime transition in the pipeline. The imposed swirl intensifies the turbulence eddying motions and hence improving the suspension ability of the multi-sized particles and minimizing the pipeline wear. In addition, the fine particles develop a lubrication layer near the bottom wall of the pipe, which can significantly reduce the intensity of collision between the coarse particles and the bottom wall. However, the intense swirling vortex results in a significant disruption of the near-wall lubrication layer, and hence the local turbulent viscosity ratio and velocity declines slightly. In this view, a required pipeline transportation efficiency and resistance loss between multi-sized particles and wall can be controlled by imposing a swirl motion, taking into account the effect of the near-wall lubrication layer. On the whole, the research in this study explores a new three-phase flow under swirl condition, which provides a general framework and reference for the design and process optimization of the deep ocean mining pipeline transportation system. The effect of scale up on the pipeline should be investigated further using 3D CFD-based simulations.

Author Contributions

Writing—review & editing, H.S.; Software, H.S.; Validation, H.S.; Visualization, H.S.; Supervision, J.Y. and Y.L.; Conceptualization, Y.L. All authors have read and agreed to the published version of the manuscript.

Funding

Financial supports from the National Natural Science Foundation of China (Project No.52106043, No.52079057 and No.51809120), the Senior Talent Foundation of Jiangsu University, China (No.20JDG058), and the Natural Science Foundation of Jiangsu Province (No.BK20180871) are greatly appreciated.

Acknowledgments

A huge thanks is due to the editor and reviewers for their valuable comments to improve the quality of this paper.

Conflicts of Interest

The authors declare no conflict of interest.

References

  1. Li, M.; He, Y.; Liu, Y.; Huang, C. Effect of interaction of particles with different sizes on particle kinetics in multi-sized slurry transport by pipeline. Powder Technol. 2018, 338, 915–930. [Google Scholar] [CrossRef]
  2. Hein, J.R.; Koschinsky, A.; Kuhn, T. Deep-ocean polymetallic nodules as a resource for critical materials. Nat. Rev. Earth Environ. 2020, 1, 158–169. [Google Scholar] [CrossRef]
  3. Hein, J.R.; Mizell, K.; Koschinsky, A.; Conrad, T.A. Deep-ocean mineral deposits as a source of critical metals for high-and green-technology applications: Comparison with land-based resources. Ore Geol. Rev. 2013, 51, 1–14. [Google Scholar] [CrossRef]
  4. Leal Filho, W.; Abubakar, I.R.; Nunes, C.; Platje, J.J.; Ozuyar, P.G.; Will, M.; Nagy, G.J.; Al-Amin, A.Q.; Hunt, J.D.; Li, C. Deep seabed mining: A note on some potentials and risks to the sustainable mineral extraction from the oceans. J. Mar. Sci. Eng. 2021, 9, 521. [Google Scholar] [CrossRef]
  5. Dai, Y.; Li, X.; Yin, W.; Huang, Z.; Xie, Y. Dynamics analysis of deep-sea mining pipeline system considering both internal and external flow. Mar. Georesources Geotechnol. 2021, 39, 408–418. [Google Scholar] [CrossRef]
  6. Gillies, R.G.; Shook, C.A. Modelling high concentration settling slurry flows. Can. J. Chem. Eng. 2000, 78, 709–716. [Google Scholar] [CrossRef]
  7. Coker, E.H.; Van Peursem, D. The erosion of horizontal sand slurry pipelines resulting from inter-particle collision. Wear 2018, 400, 74–81. [Google Scholar] [CrossRef]
  8. Wei, C.; Wei, Y.; Ji, Z. Model predictive control for slurry pipeline transportation of a cutter suction dredger. Ocean Eng. 2021, 227, 108893. [Google Scholar] [CrossRef]
  9. Samson, R.; Biello, J.A. Longitudinal instability of slurry pipeline flow. Int. J. Multiph. Flow 2017, 90, 57–63. [Google Scholar] [CrossRef] [Green Version]
  10. Van Wijk, J.; Talmon, A.; van Rhee, C. Stability of vertical hydraulic transport processes for deep ocean mining: An experimental study. Ocean Eng. 2016, 125, 203–213. [Google Scholar] [CrossRef]
  11. Shi, H.; Wang, X.; Liu, Q.; Nikrityuk, P. The influence of inflow swirls on phases separation in a Venturi tube. Sep. Purif. Technol. 2021, 281, 119954. [Google Scholar] [CrossRef]
  12. Miedema, S.A. A new approach to determine the concentration distribution in slurry transport. Dredg. Summit Expo 2017, 189–203. [Google Scholar]
  13. Kaushal, D.; Tomita, Y. Experimental investigation for near-wall lift of coarser particles in slurry pipeline using γ-ray densitometer. Powder Technol. 2007, 172, 177–187. [Google Scholar] [CrossRef]
  14. Schaan, J.; Sumner, R.J.; Gillies, R.G.; Shook, C.A. The effect of particle shape on pipeline friction for Newtonian slurries of fine particles. Can. J. Chem. Eng. 2000, 78, 717–725. [Google Scholar] [CrossRef]
  15. Shi, H.; Liu, Q.; Nikrityuk, P. Modeling of cavitating flows past a micro-sized particle. Int. J. Multiph. Flow 2020, 128, 103276. [Google Scholar] [CrossRef]
  16. Li, M.Z.; He, Y.P.; Liu, W.H.; Liu, Y.D.; Huang, C.; Jiang, R.H. Effect of adding finer particles on the transport characteristics of coarse-particle slurries in pipelines. Ocean Eng. 2020, 218, 108160. [Google Scholar] [CrossRef]
  17. Dai, Y.; Zhang, Y.; Li, X. Numerical and experimental investigations on pipeline internal solid-liquid mixed fluid for deep ocean mining. Ocean Eng. 2021, 220, 108411. [Google Scholar] [CrossRef]
  18. Chen, Q.; Xiong, T.; Zhang, X.; Jiang, P. Study of the hydraulic transport of non-spherical particles in a pipeline based on the CFD-DEM. Eng. Appl. Comput. Fluid Mech. 2020, 14, 53–69. [Google Scholar] [CrossRef]
  19. Shi, H.; Li, M.; Liu, Q.; Nikrityuk, P. Experimental and numerical study of cavitating particulate flows in a venturi tube. Chem. Eng. Sci. 2020, 219, 115598. [Google Scholar] [CrossRef]
  20. Messa, G.V.; Yang, Q.; Adedeji, O.E.; Chára, Z.; Duarte, C.A.R.; Matoušek, V.; Rasteiro, M.G.; Sanders, R.S.; Silva, R.C.; de Souza, F.J. Computational Fluid Dynamics Modelling of Liquid–Solid Slurry Flows in Pipelines: State-of-the-Art and Future Perspectives. Processes 2021, 9, 1566. [Google Scholar] [CrossRef]
  21. Messa, G.; Malin, M.; Matoušek, V. Parametric study of the β-σ two-fluid model for simulating fully suspended slurry flow: Effect of flow conditions. Meccanica 2021, 56, 1047–1077. [Google Scholar] [CrossRef]
  22. Messa, G.V.; Matoušek, V. Analysis and discussion of two fluid modelling of pipe flow of fully suspended slurry. Powder Technol. 2020, 360, 747–768. [Google Scholar] [CrossRef]
  23. Schouten, T.; van Rhee, C.; Keetels, G. Two-phase modelling for sediment water mixtures above the limit deposit velocity in horizontal pipelines. J. Hydrol. Hydromechanics 2021, 69, 263–274. [Google Scholar] [CrossRef]
  24. Shi, H.; Nikrityuk, P. The Influence of Inflow Swirl on Cavitating and Mixing Processes in a Venturi Tube. Fluids 2020, 5, 170. [Google Scholar] [CrossRef]
  25. Martemianov, S.; Okulov, V.L. On heat transfer enhancement in swirl pipe flows. Int. J. Heat Mass Transf. 2004, 47, 2379–2393. [Google Scholar] [CrossRef]
  26. Liu, W.; Jiang, S.; Li, H. Experimental Study of Liquid-Carrying by Swirling Flow in a U-shaped Tube. Exp. Therm. Fluid Sci. 2021, 130, 110479. [Google Scholar] [CrossRef]
  27. Wang, S.; Ding, B.; Rao, Y.; Chen, F. Study on the influence of coconut oil on flow pattern and pressure drop of two-phase swirl flow. RSC Adv. 2019, 9, 32644–32655. [Google Scholar] [CrossRef] [Green Version]
  28. Rayhan, F.; Yanuar, Y. Rheological behavior and drag reduction characteristics of ice slurry flow in spiral pipes. Therm. Sci. Eng. Prog. 2020, 20, 100734. [Google Scholar] [CrossRef]
  29. Ariyaratne, C.; Jones, T. Design and optimization of swirl pipe geometry for particle-laden liquids. AIChE J. 2007, 53, 757–768. [Google Scholar] [CrossRef]
  30. Kaushal, D.; Sato, K.; Toyota, T.; Funatsu, K.; Tomita, Y. Effect of particle size distribution on pressure drop and concentration profile in pipeline flow of highly concentrated slurry. Int. J. Multiph. Flow 2005, 31, 809–823. [Google Scholar] [CrossRef]
  31. Xu, H.; Chen, W.; Hu, W. Hydraulic transport flow law of natural gas hydrate pipeline under marine dynamic environment. Eng. Appl. Comput. Fluid Mech. 2020, 14, 507–521. [Google Scholar] [CrossRef]
  32. Yamazaki, T.; Sharma, R. Preliminary Experiment on Powderization of Deep-sea Sediment during Hydraulic Transportation. In Proceedings of the Fourth (2001) Ocean Mining Symposium, Szcecin, Poland, 23–27 September 2001. [Google Scholar]
  33. Li, Y.; Liang, K.; Dai, H.; Zhang, C. Degradation of Polymetallic Nodules in Deep-Sea Multi-Stage Lifting Motor Pump. Minerals 2021, 11, 656. [Google Scholar] [CrossRef]
  34. Simonin, C.; Viollet, P. Predictions of an oxygen droplet pulverization in a compressible subsonic coflowing hydrogen flow. Numer. Methods Multiph. Flows 1990, 91, 65–82. [Google Scholar]
  35. Fluent, A. Ansys Fluent Theory Guide; ANSYS Inc.: Canonsburg, PA, USA, 2011; Volume 15317, pp. 724–746. [Google Scholar]
  36. Chen, J.; Wang, Y.; Li, X.; He, R.; Han, S.; Chen, Y. Reprint of Erosion prediction of liquid-particle two-phase flow in pipeline elbows via CFD–DEM coupling method. Powder Technol. 2015, 282, 25–31. [Google Scholar] [CrossRef]
  37. Brown, G. Erosion prediction in slurry pipeline tee-junctions. Appl. Math. Model. 2002, 26, 155–170. [Google Scholar] [CrossRef]
  38. van der Hoef, M.A.; van Sint Annaland, M.; Deen, N.; Kuipers, J. Numerical simulation of dense gas-solid fluidized beds: A multiscale modeling strategy. Annu. Rev. Fluid Mech. 2008, 40, 47–70. [Google Scholar] [CrossRef]
  39. Shi, H.; Komrakova, A.; Nikrityuk, P. Fluidized beds modeling: Validation of 2D and 3D simulations against experiments. Powder Technol. 2019, 343, 479–494. [Google Scholar] [CrossRef]
  40. Shi, H.; Reza, M.O.; Nikrityuk, P.A. The impact of swirling on the dynamics of a spouted bed. Powder Technol. 2021, 380, 143–151. [Google Scholar] [CrossRef]
Figure 1. Schematic diagram of the three-phase deep ocean transportation pipeline.
Jmse 09 01201 g001
Figure 2. Geometry of the computational domain-(a) and the axial and cross-section view of computational Grid-2 (456,000 cells)-(b).
Jmse 09 01201 g002
Figure 3. Validation: (a) Experimental and simulated solid concentration distribution in multi-sized slurry at U i n = 2 m/s, ϕ s = 0.2. Grid-1: 237,500 cells; Grid-2: 456,000 cells; Grid-3: 863,500 cells, Grid-4: 1,484,000 cells; Grid-5: 3,648,000; (b) Experimental and simulated solid concentration distribution in multi-sized slurry with Grid-2. Case-1: U i n = 2 m/s, ϕ s = 0.2; Case-2: U i n = 3 m/s, ϕ s = 0.3; Case-3: U i n = 4 m/s, ϕ s = 0.4; Case-4: U i n = 5 m/s, ϕ s = 0.5; (c) Experimental and simulated pressure drop in Pa/m for multi-sized slurry at ϕ s = 0.2.
Jmse 09 01201 g003
Figure 4. Contours of mixture solid volume fraction in the middle plane: (a) S R = 0; (b) S R = 0.1; (c) S R = 0.25; (d) S R = 0.5.
Jmse 09 01201 g004
Figure 5. Iso-surface contours of mixture solid volume fraction: (a) S R = 0; (b) S R = 0.1; (c) S R = 0.25; (d) S R = 0.5. ϕ s = 0.35 (brown color) and ϕ s = 0.2 (green color).
Jmse 09 01201 g005
Figure 6. Contours of turbulent viscosity ratio ( μ t / μ o ) in the middle plane: (a) S R = 0; (b) S R = 0.1; (c) S R = 0.25; (d) S R = 0.5.
Jmse 09 01201 g006
Figure 7. Axial velocity streamlines: (a) S R = 0; (b) S R = 0.1; (c) S R = 0.25; (d) S R = 0.5.
Jmse 09 01201 g007
Figure 8. Contour plots for coarse particle volume fraction for S R = 0.1, 0.25 and 0.5 (a1a3), fine particle volume fraction for S R = 0.1, 0.25 and 0.5 (b1b3), mixture solid volume fraction for S R = 0.1, 0.25 and 0.5 (c1–c3), granular pressure for S R = 0.1, 0.25 and 0.5 (d1d3), and z-axial velocity for S R = 0.1, 0.25 and 0.5 (e1e3) in x-y plane at z/D = 35.
Jmse 09 01201 g008
Figure 9. Predicted CFD profiles along r/D for S R = 0–0.5: mixture solid volume fraction at z/D = 35 (a1) and z/D = 55 (a2), turbulent viscosity ratio at z/D = 35 (b1) and z/D = 55 (b2) and z-axial velocity magnitude at z/D = 35 (c1) and z/D = 55 (c2).
Jmse 09 01201 g009
Table 1. Physical properties of water, fine particle and coarse particle.
MaterialDensity
(kg/m 3 )
Viscosity
(kg/m-s)
Diameter
( μ m)
Water998.2 1.001 × 10 3
Fine particle2470 1.789 × 10 5 44
Coarse particle2470 1.825 × 10 5 125
Table 2. Governing equations used in the simulations.
Continuity equation t α q ρ q + · α q ρ q v q = 0
Momentum balance t α q ρ q v q + · α q ρ q v q v q = α q p q + · α q τ ¯ q ¯
+ p = 1 n ( R p q + R p q v p q R q p v q p )
Stress tensor τ ¯ q ¯ = α q μ q v q + v q T + α q λ q 2 3 μ q · v q I ¯ ¯
Interphase force p = 1 n R p q = p = 1 n K p q v p v q
Syamlal-O’Brien drag model
(for liquid-solid interactions)
K l s = α s ρ s f τ s ; τ s = ρ s d s 2 18 μ l ; f = C D R e s α l 24 ; R e s = ρ l d s v s v l μ l
C D = ( 0.63 + 4.8 R e s / v r , s ) 2
Syamlal-O’Brien-symmetric drag model
(for solid-solid interactions)
K p q = 3 ( 1 + e p q ) ( π 2 + C f r , p q π 2 8 ) α p ρ p α q ρ q ( d p + d q ) 2 g 0 , p q 2 π ( ρ p d p 3 + ρ q d q 3 ) | v p v q |
Solid pressure p s = α s ρ s Θ s + 2 ρ s 1 + e s s α s 2 g 0 , s s Θ s
Radial distribution function g 0 , s s = 1 α s α s , m a x 1 3 1
Collisional energy dissipation γ θ s = 12 1 e s s 2 g 0 , s s d s π 0.5 ρ s α s 2 Θ s 1.5
Kinetic energy transfer ϕ l s = 3 · K l , s θ s
Solid shear viscosity μ s = μ s , c o l + μ s , k i n + μ s , f r
Collisional viscosity μ s , c o l = 4 5 α s ρ s d s g 0 , s s ( 1 + e s s ) ( θ s π ) 1 / 2 α s
Kinetic viscosity μ s , k i n = α s d s ρ s θ s π 6 ( 3 e s s ) [ 1 + 2 5 ( 1 + e s s ) ( 3 e s s 1 ) α s g 0 , s s ]
Frictional viscosity μ s , f r = p s s i n ϕ 2 I 2 D
Bulk viscosity λ s = 4 3 α s ρ s d s g 0 , s s 1 + e s s θ s π 1 / 2
Granular temperature Θ q = 1 3 ( v q 2 )
k- ω SST model t ( ρ k ) + x i ( ρ k u i ) = x i ( Γ k k x j ) + G k Y k + S k
t ( ρ ω ) + x i ( ρ ω u i ) = x i ( Γ ω ω x j ) + G ω Y ω + D ω + S ω
Table 3. List of numerical models and schemes.
Parameter/Variable/NameModel/SCHEME
Models
Multiphase modelEulerian-Eulerian
Volume Fraction ParametersImplicit Scheme
Viscous model k ω SST model
Granular viscositySyamlal-O’Brien
Granular Bulk viscosityLun et al.
Frictional ViscosityJohnson et al.
Frictional pressureBased-KTGF
Granular temperatureAlgebraic
Solid pressureLun et al.
Radial distributionSyamlal-O’Brien
Solution
Pressure-velocity couplingPhase Coupled SIMPLE Scheme
Spatial discretization-GradientLeast Squares Cell Based
Spatial discretization-MomentumSecond Order Upwind
Spatial discretization-Volume FractionQUICK
Spatial discretization-Turbulent Kinetic EnergySecond Order Upwind
Spatial discretization-Specific Dissipation RateSecond Order Upwind
Publisher’s Note: MDPI stays neutral with regard to jurisdictional claims in published maps and institutional affiliations.

