Offshore Wind Energy Resource in the Kingdom of Morocco: Assessment of the Seasonal Potential Variability Based on Satellite Data

 ,
, 
Abstract
1. Introduction
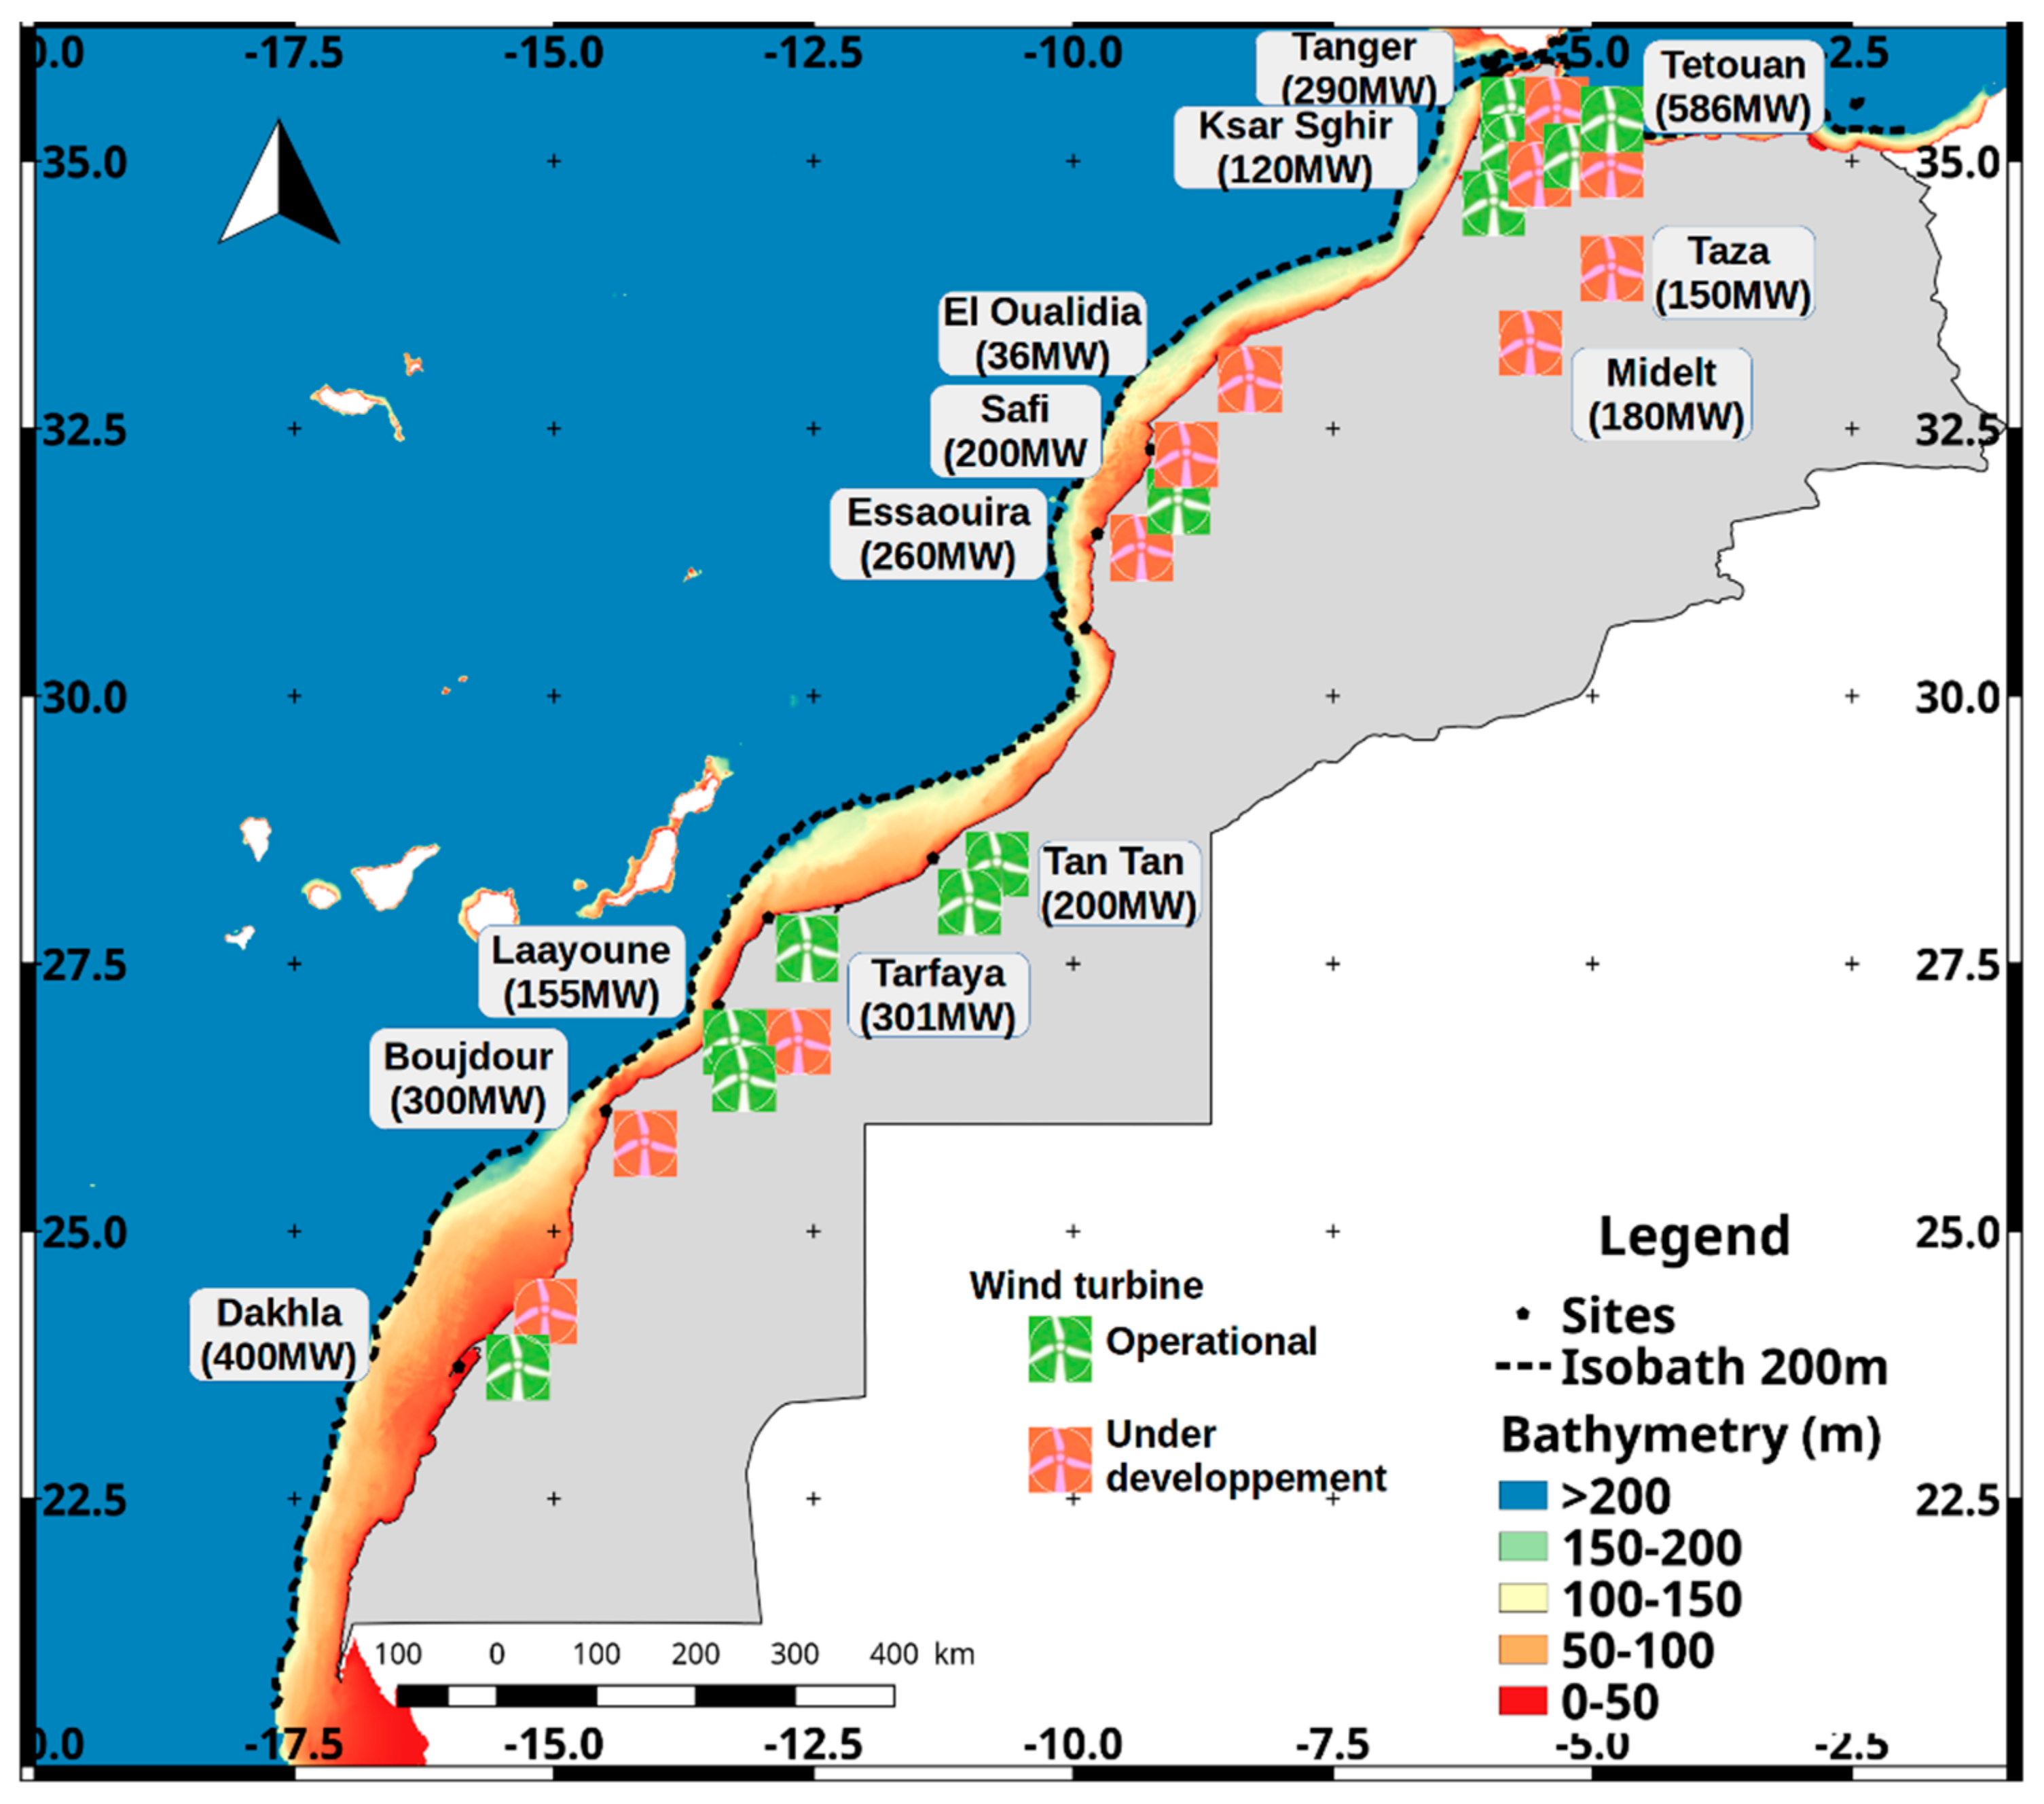
2. Study Area
- -
- Huge wind energy potential due to it 3500 km coast line with annual average wind speed exceeding 9 m s−1 at 40 m elevation. Therefore, the estimated total theoretical potential of wind power in Morocco is 25 GW [17].
- -
3. Materials and Methods
3.1. Remote-Sensing Data Collection
3.2. Methods
3.2.1. Weibull Distribution
3.2.2. Evaluation of Wind Power Density (WPD)
3.2.3. Wind Speed Vertical Extrapolation
4. Results and Discussion
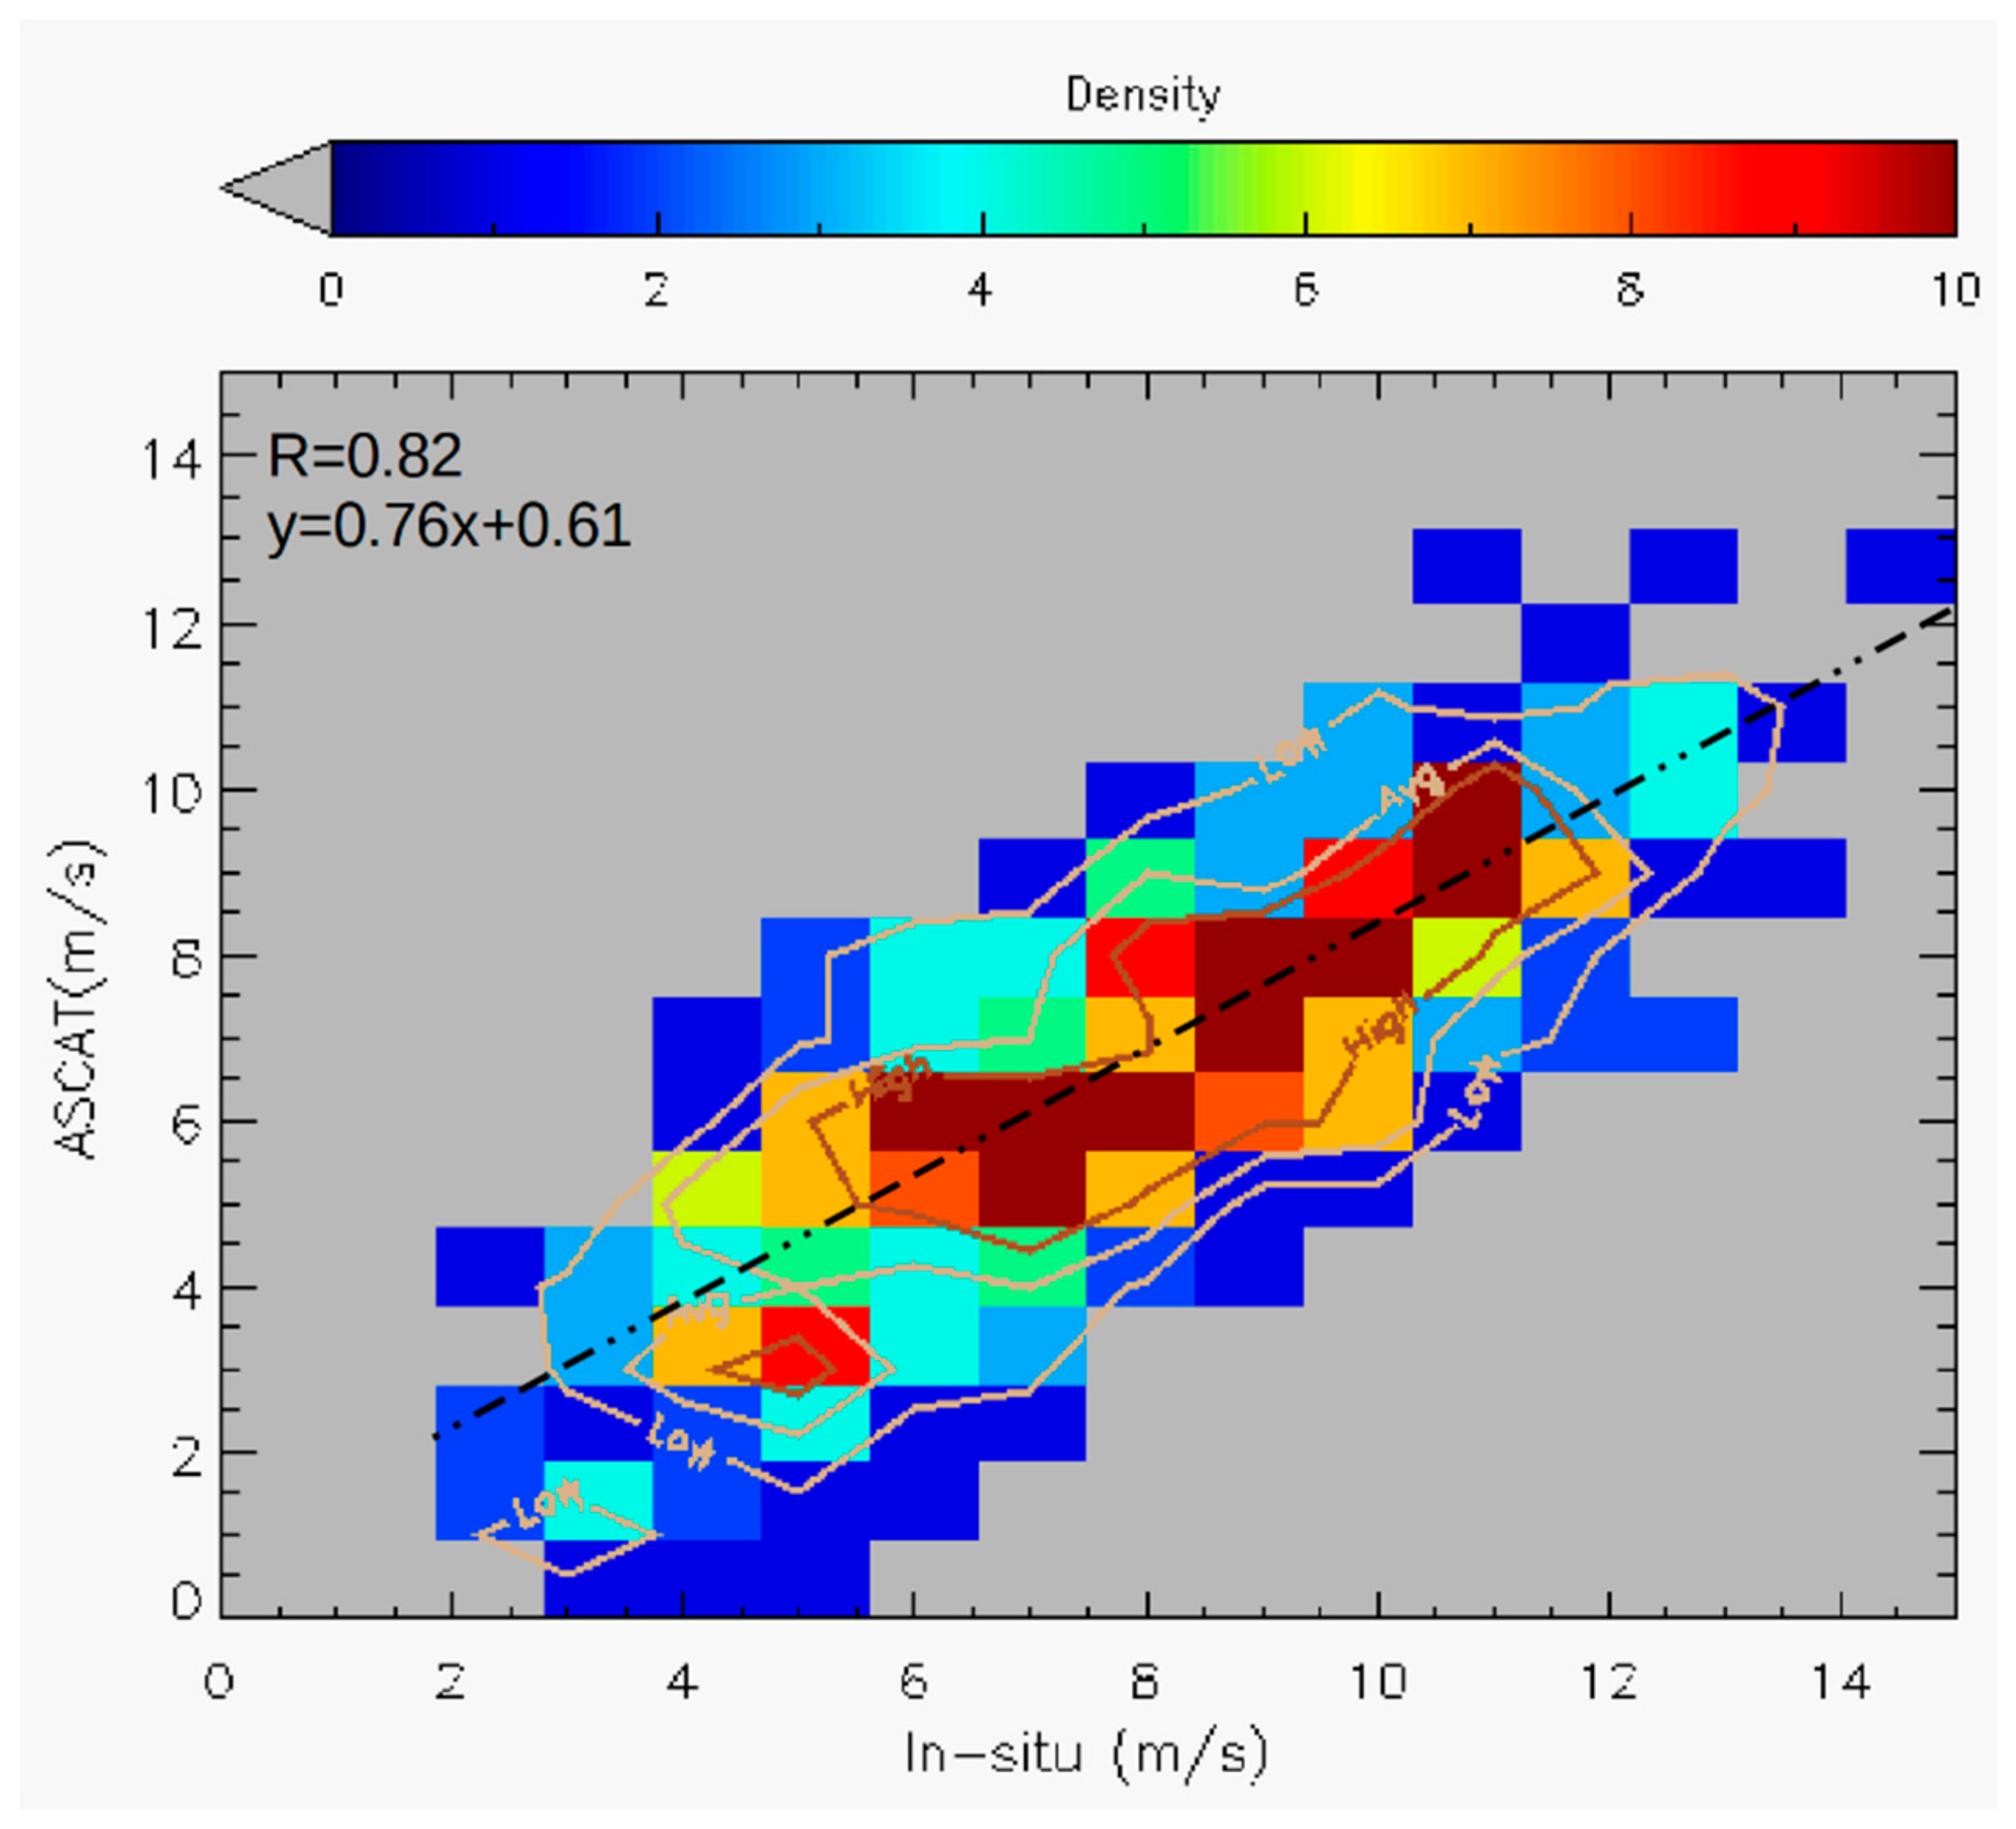
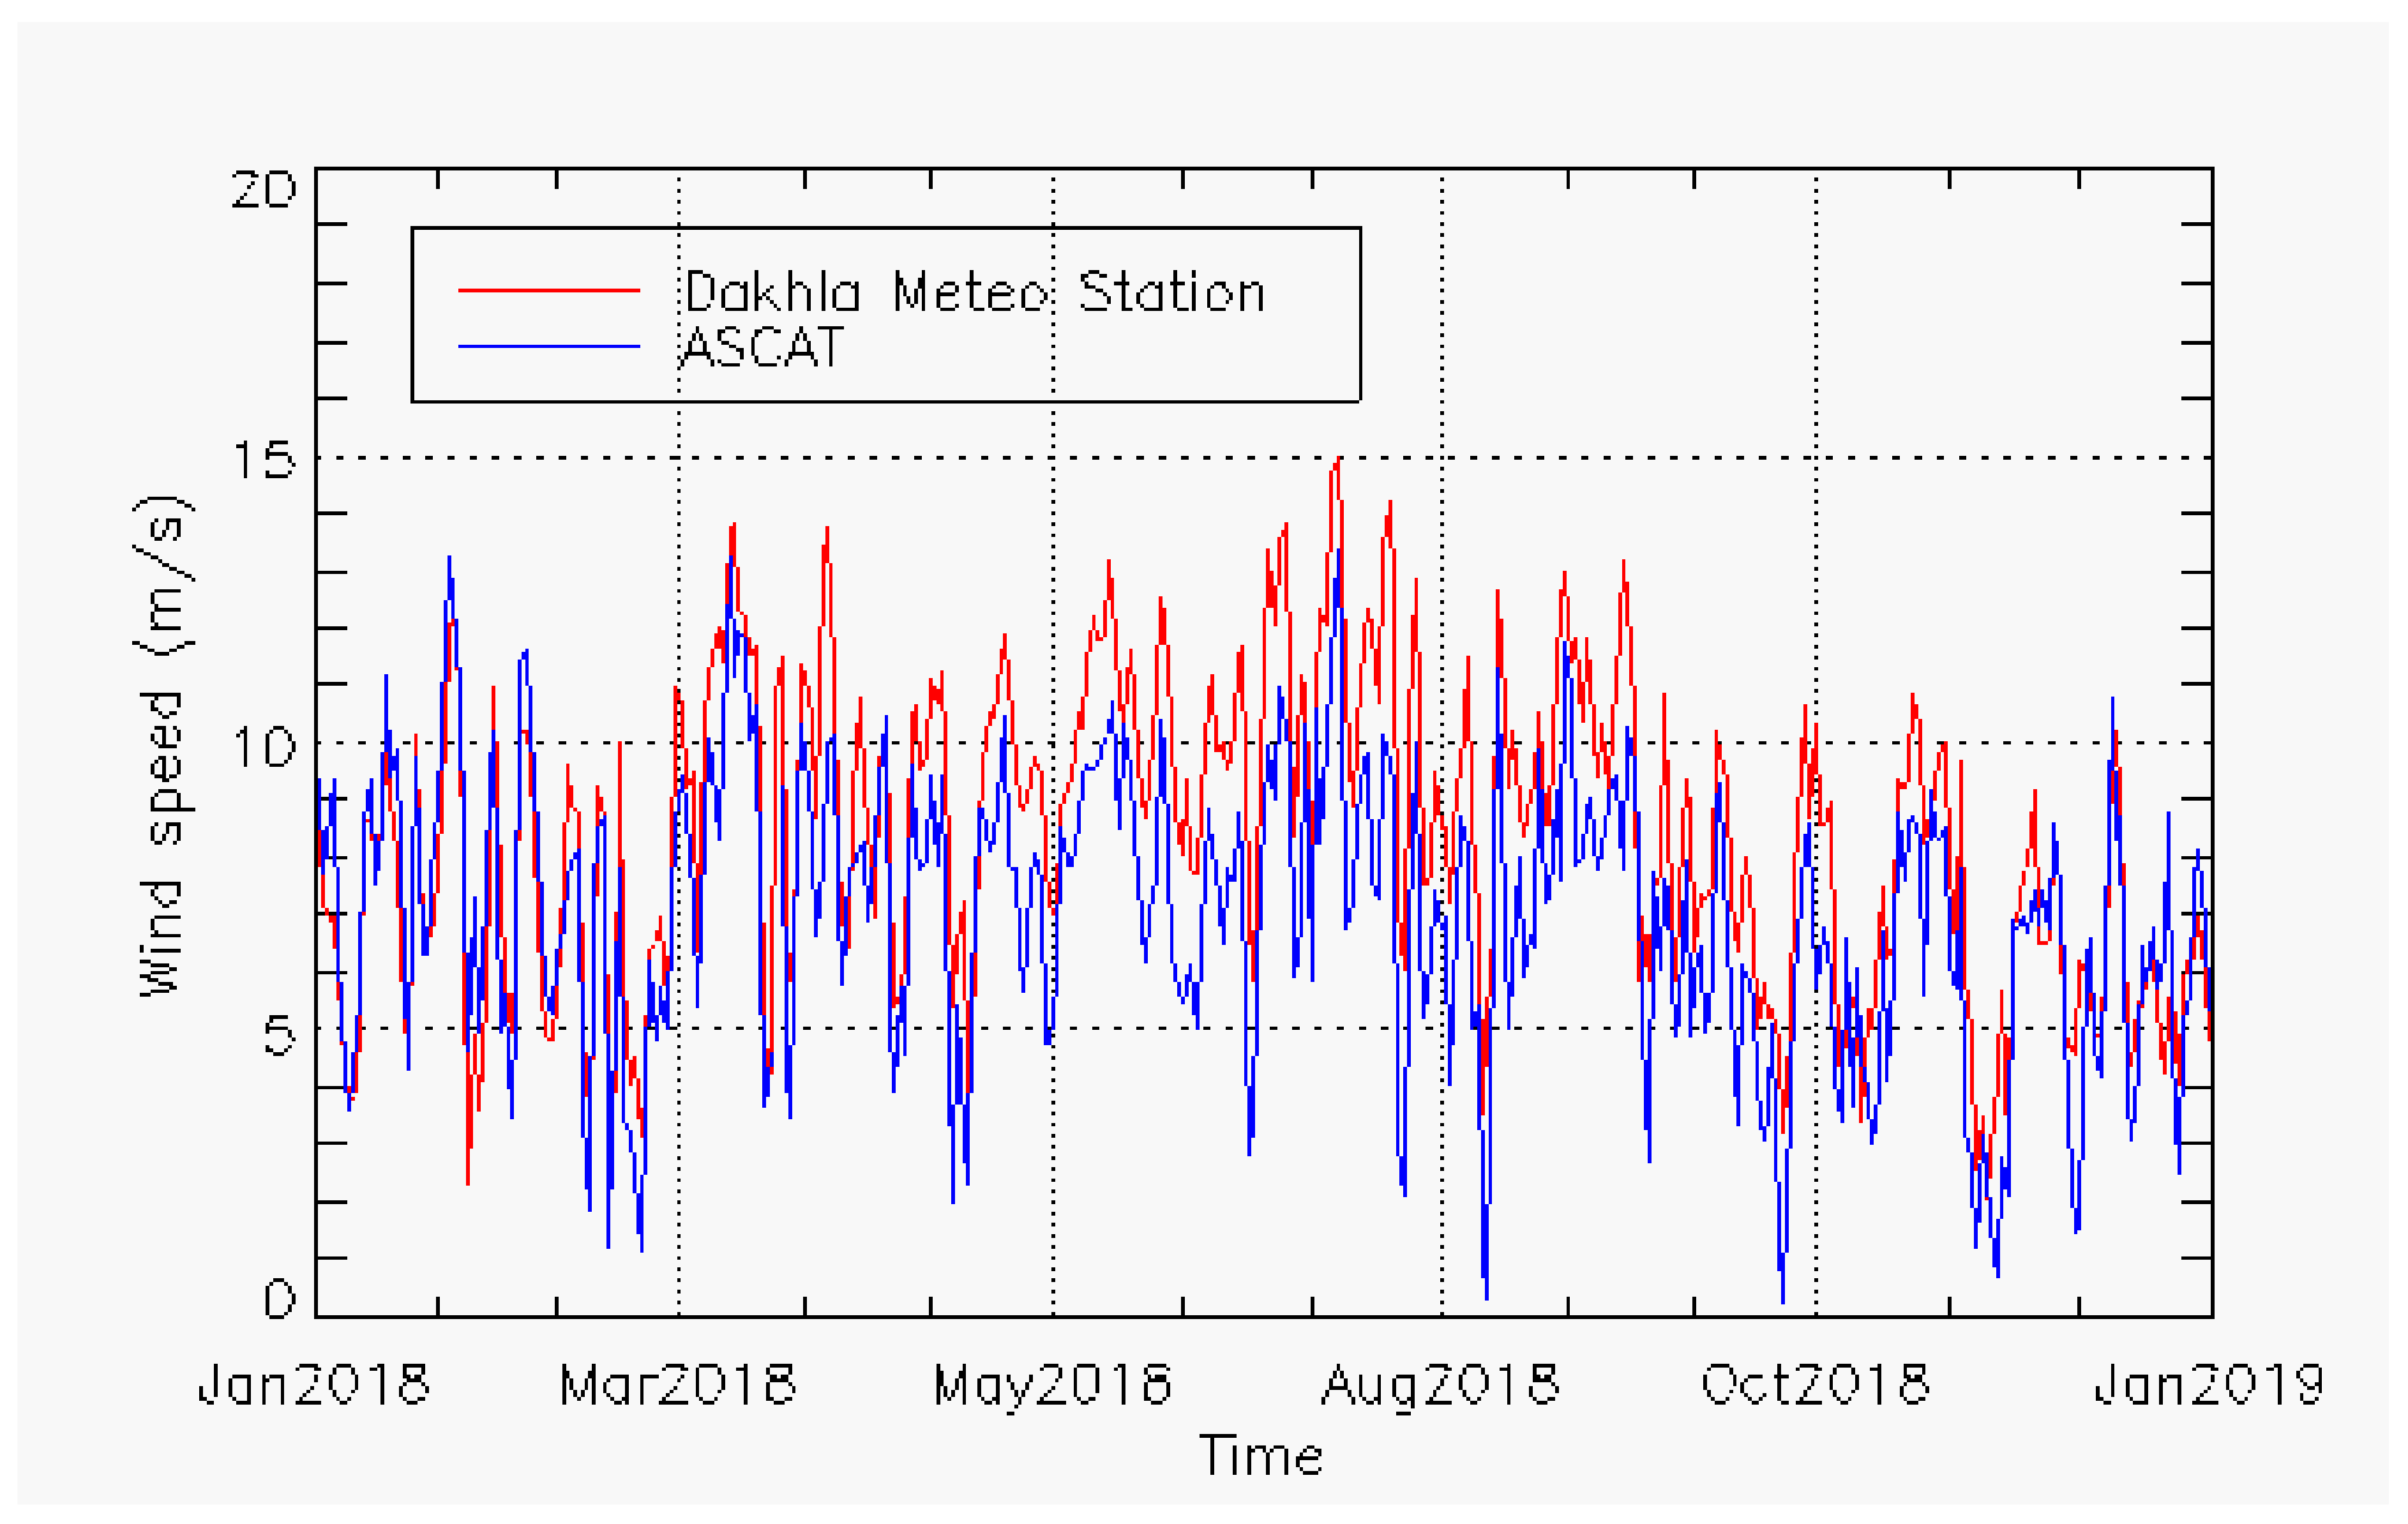
4.1. Comparison of Scatterometer Winds and In Situ Measurement
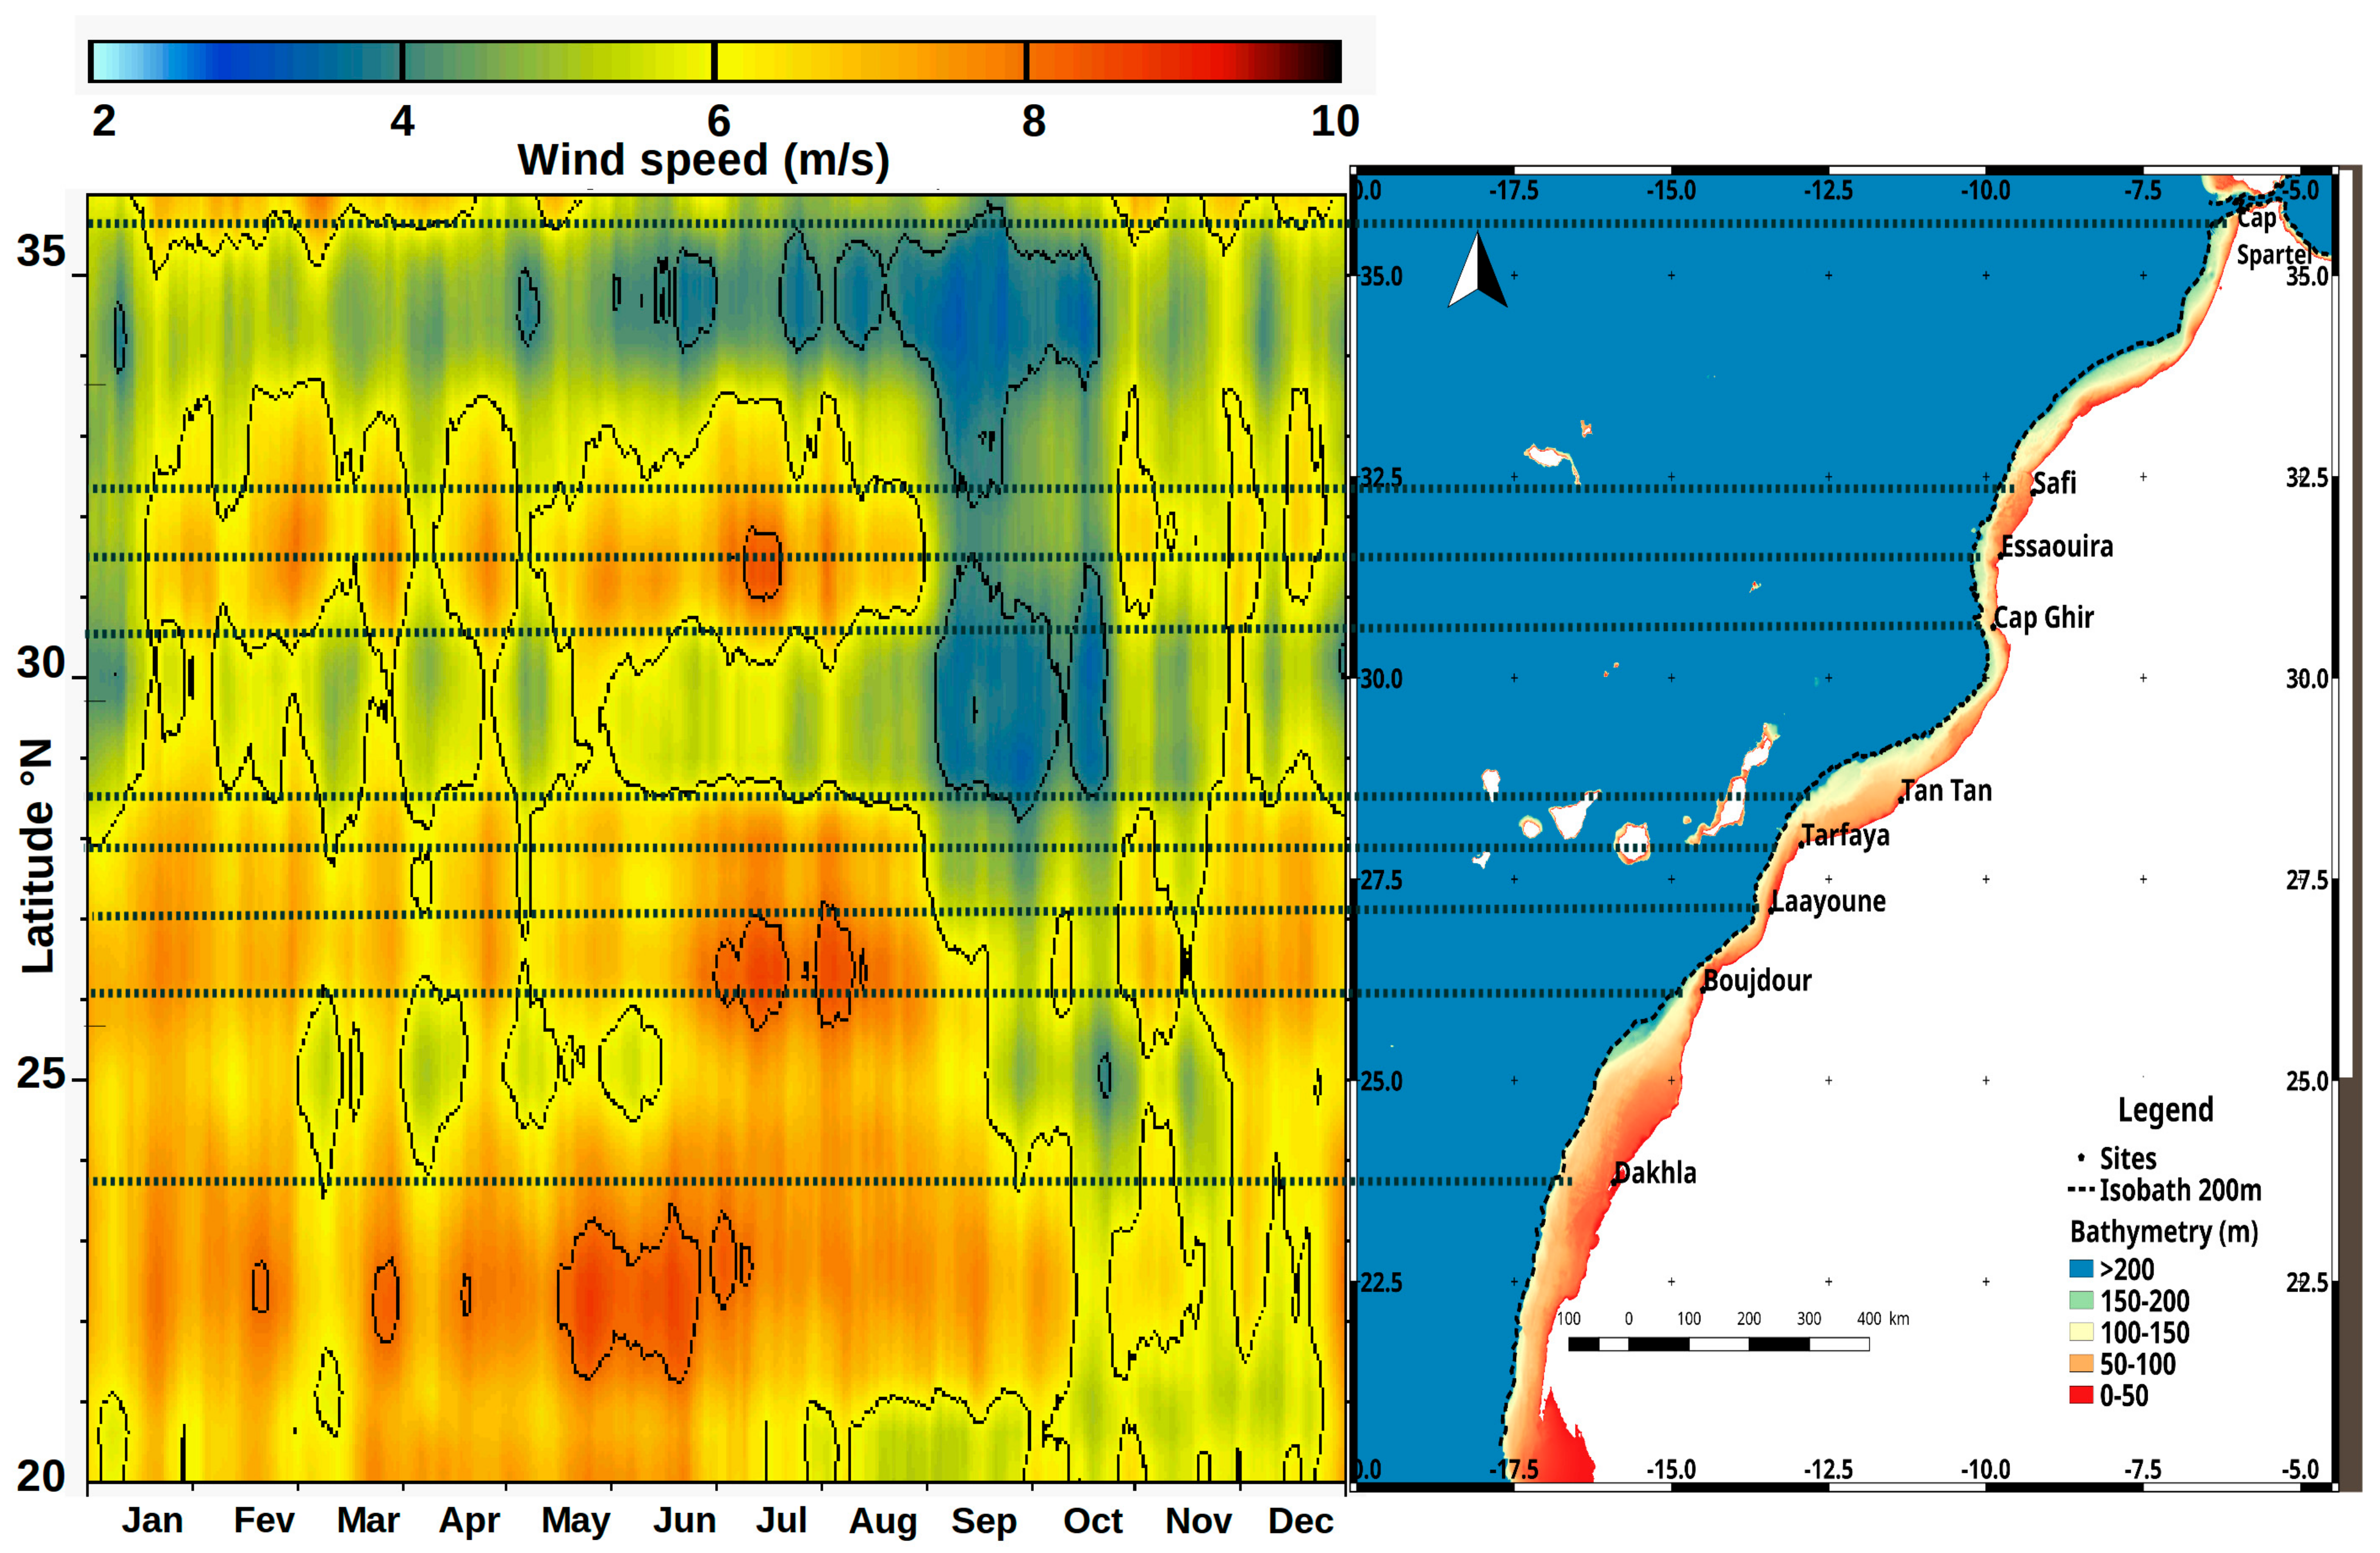
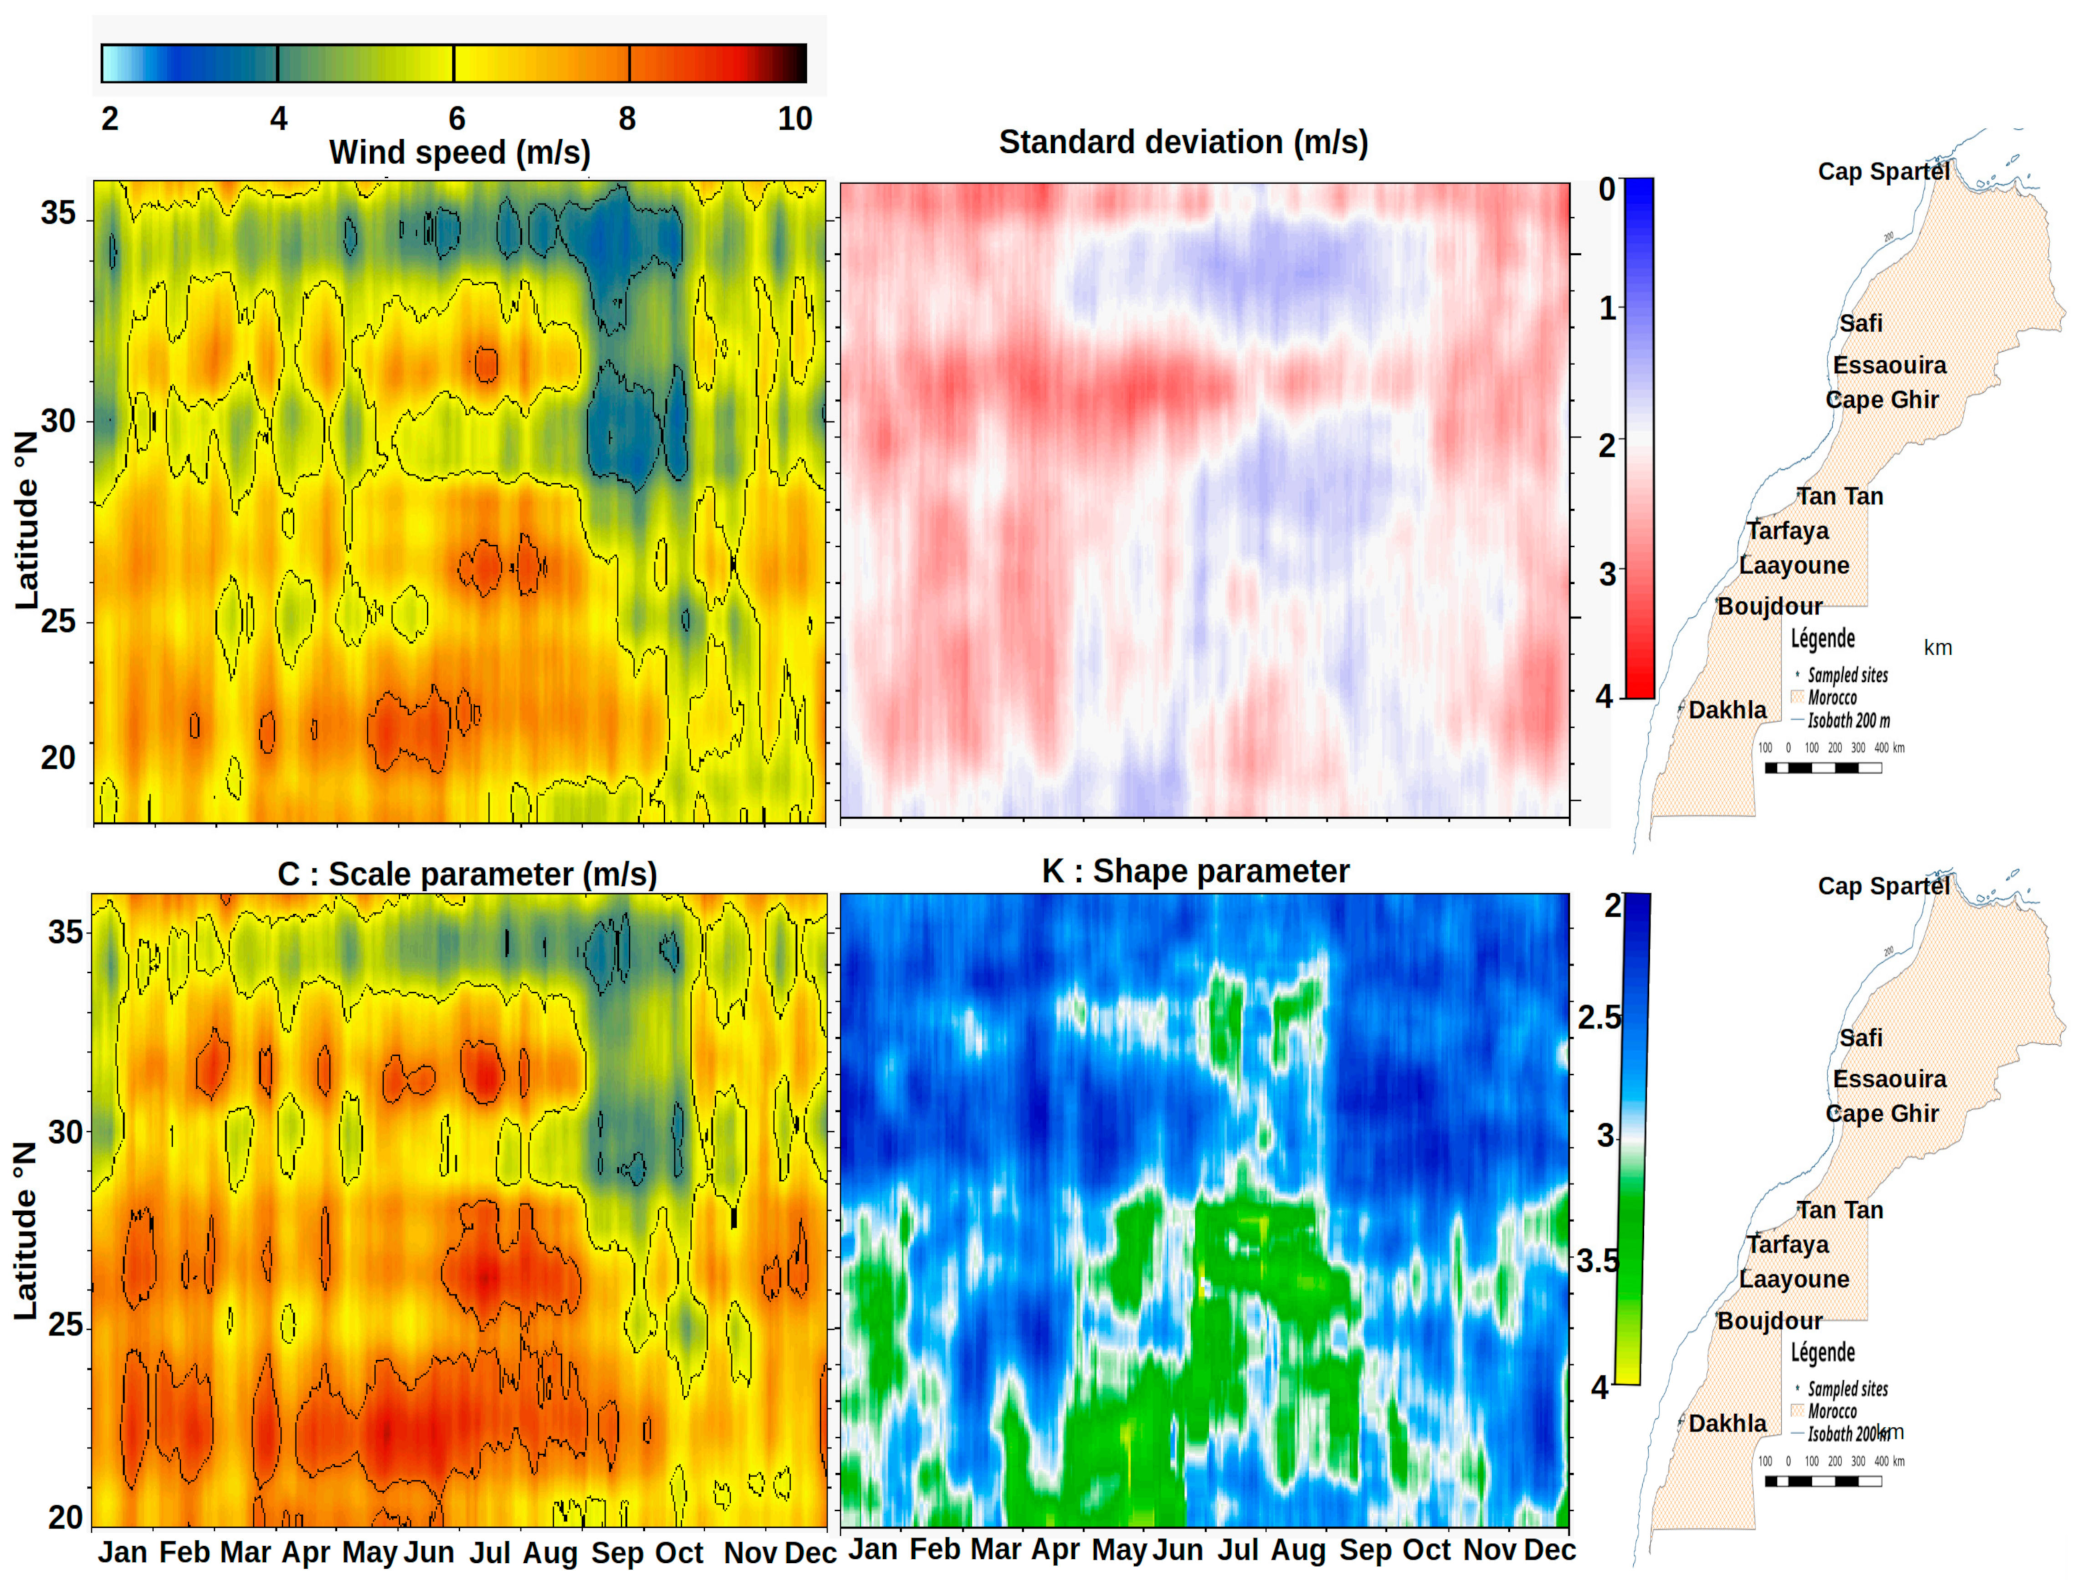
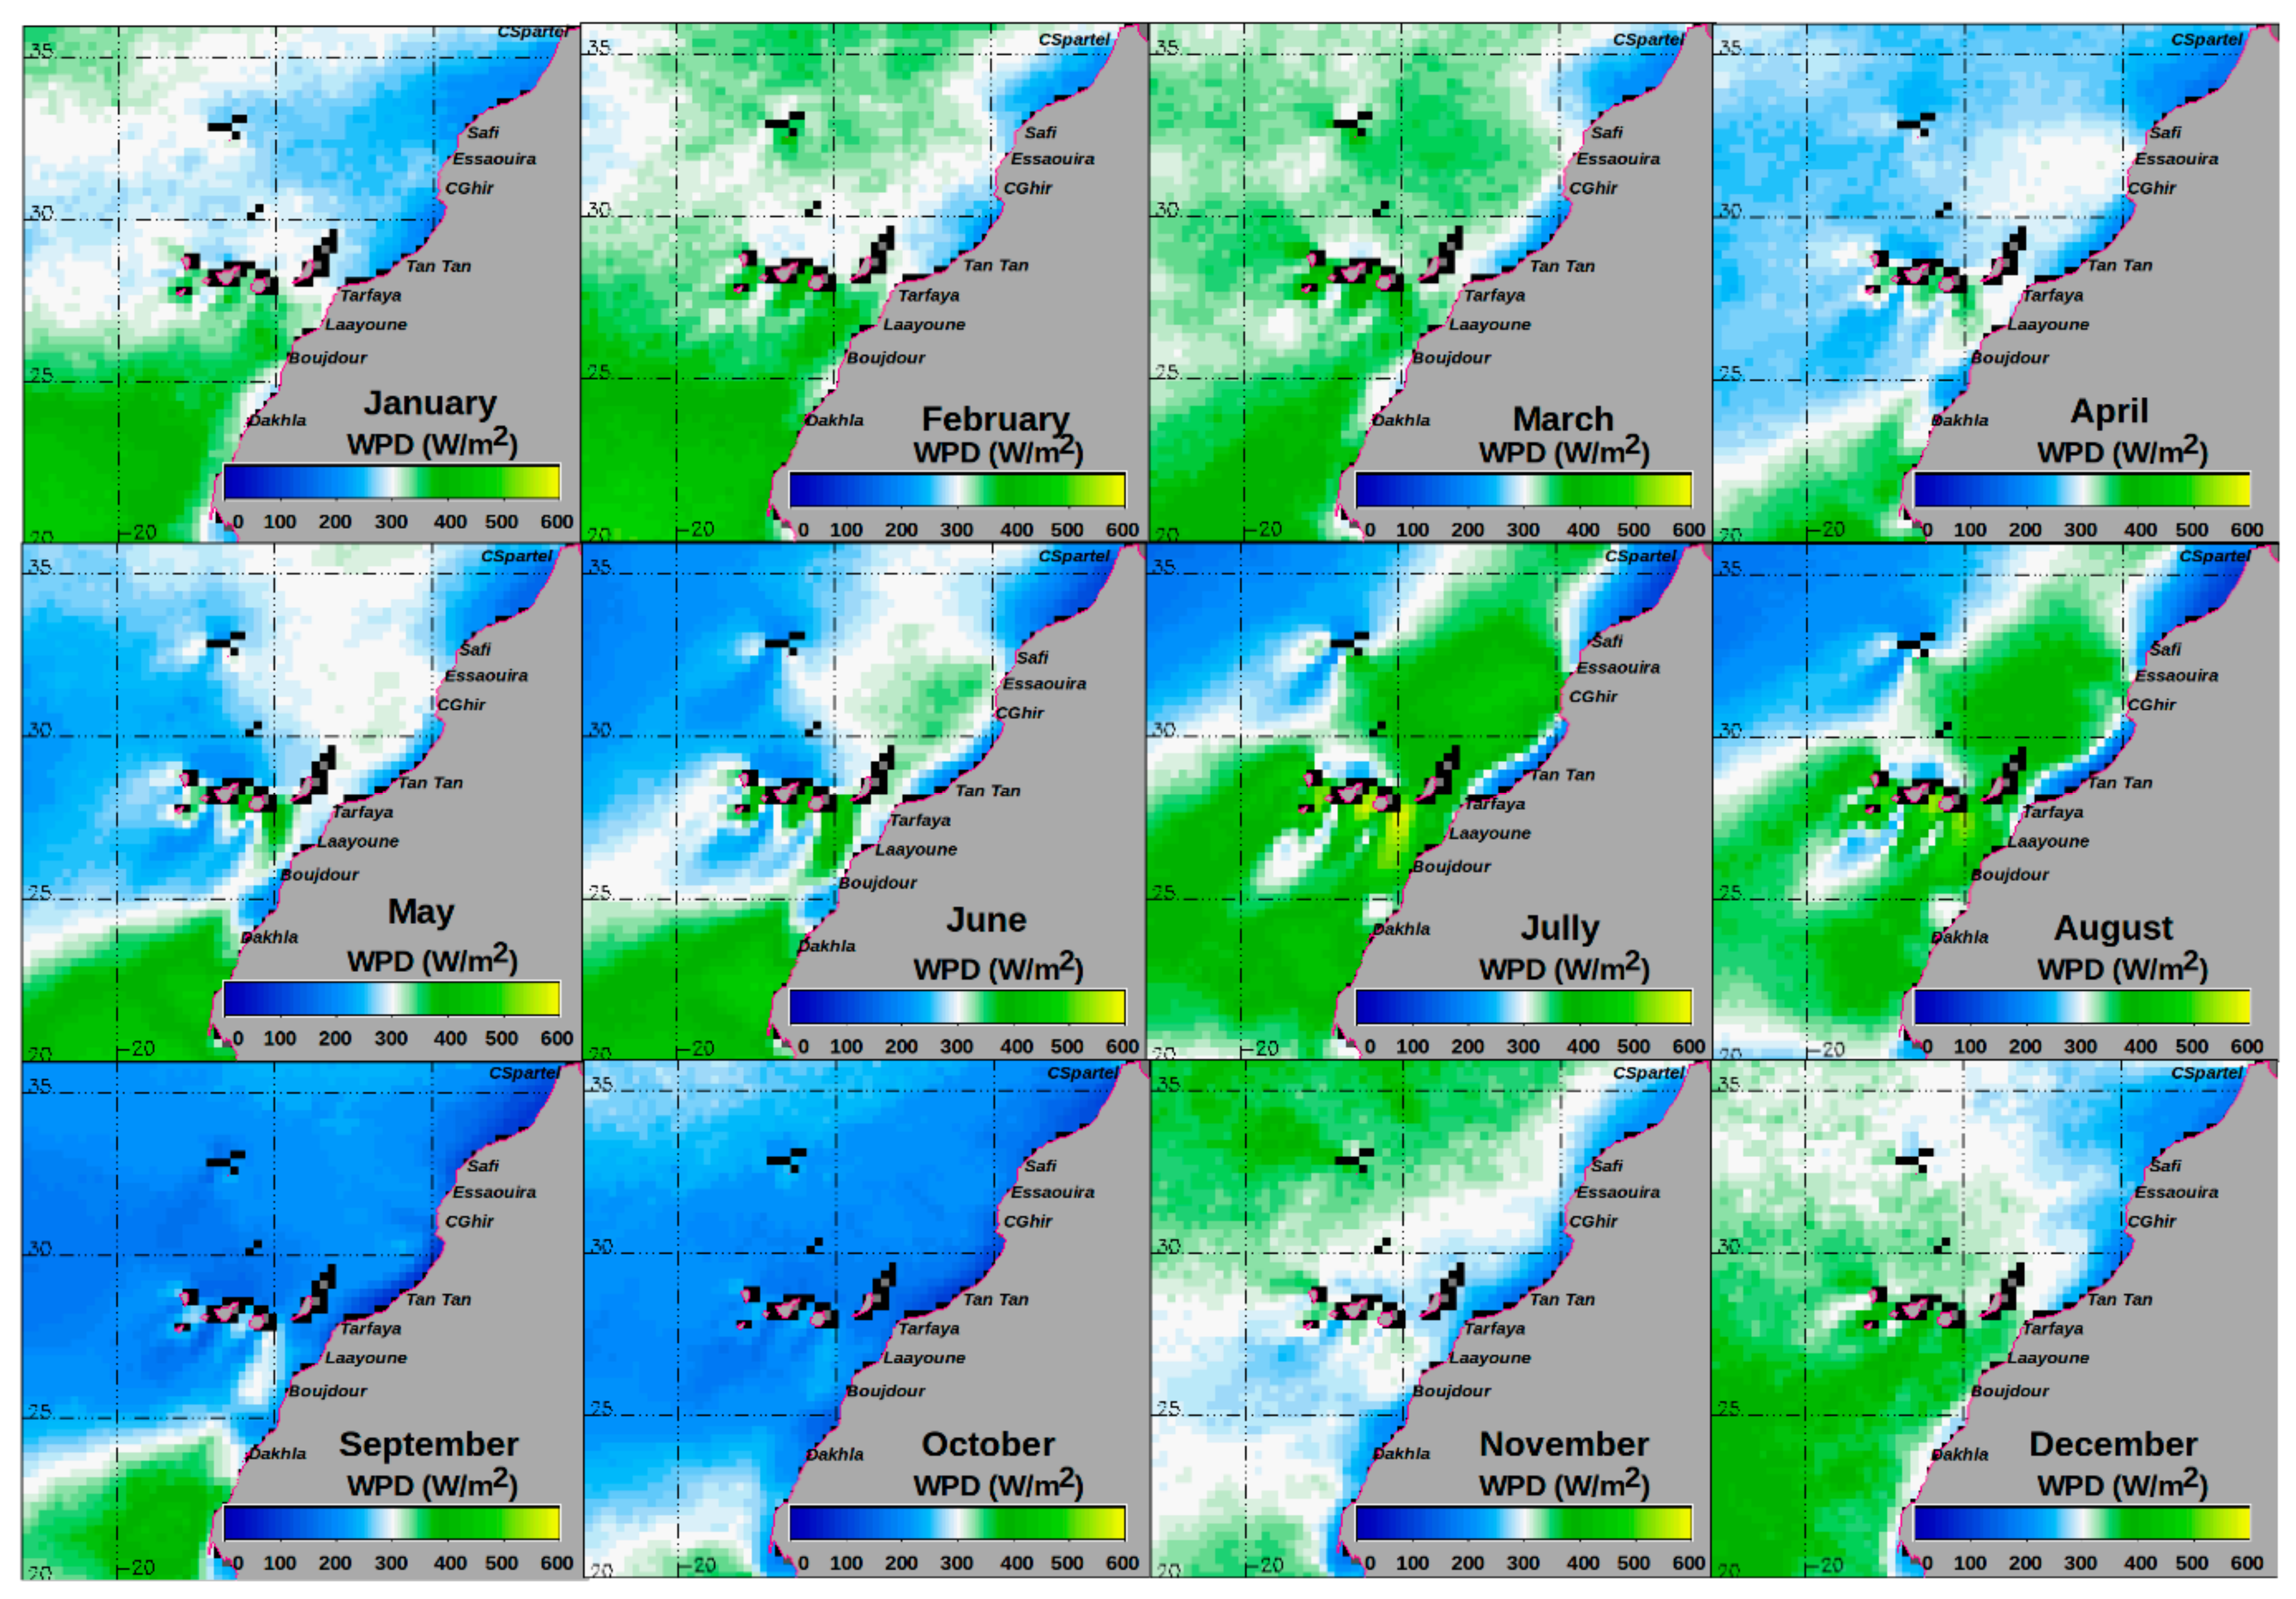
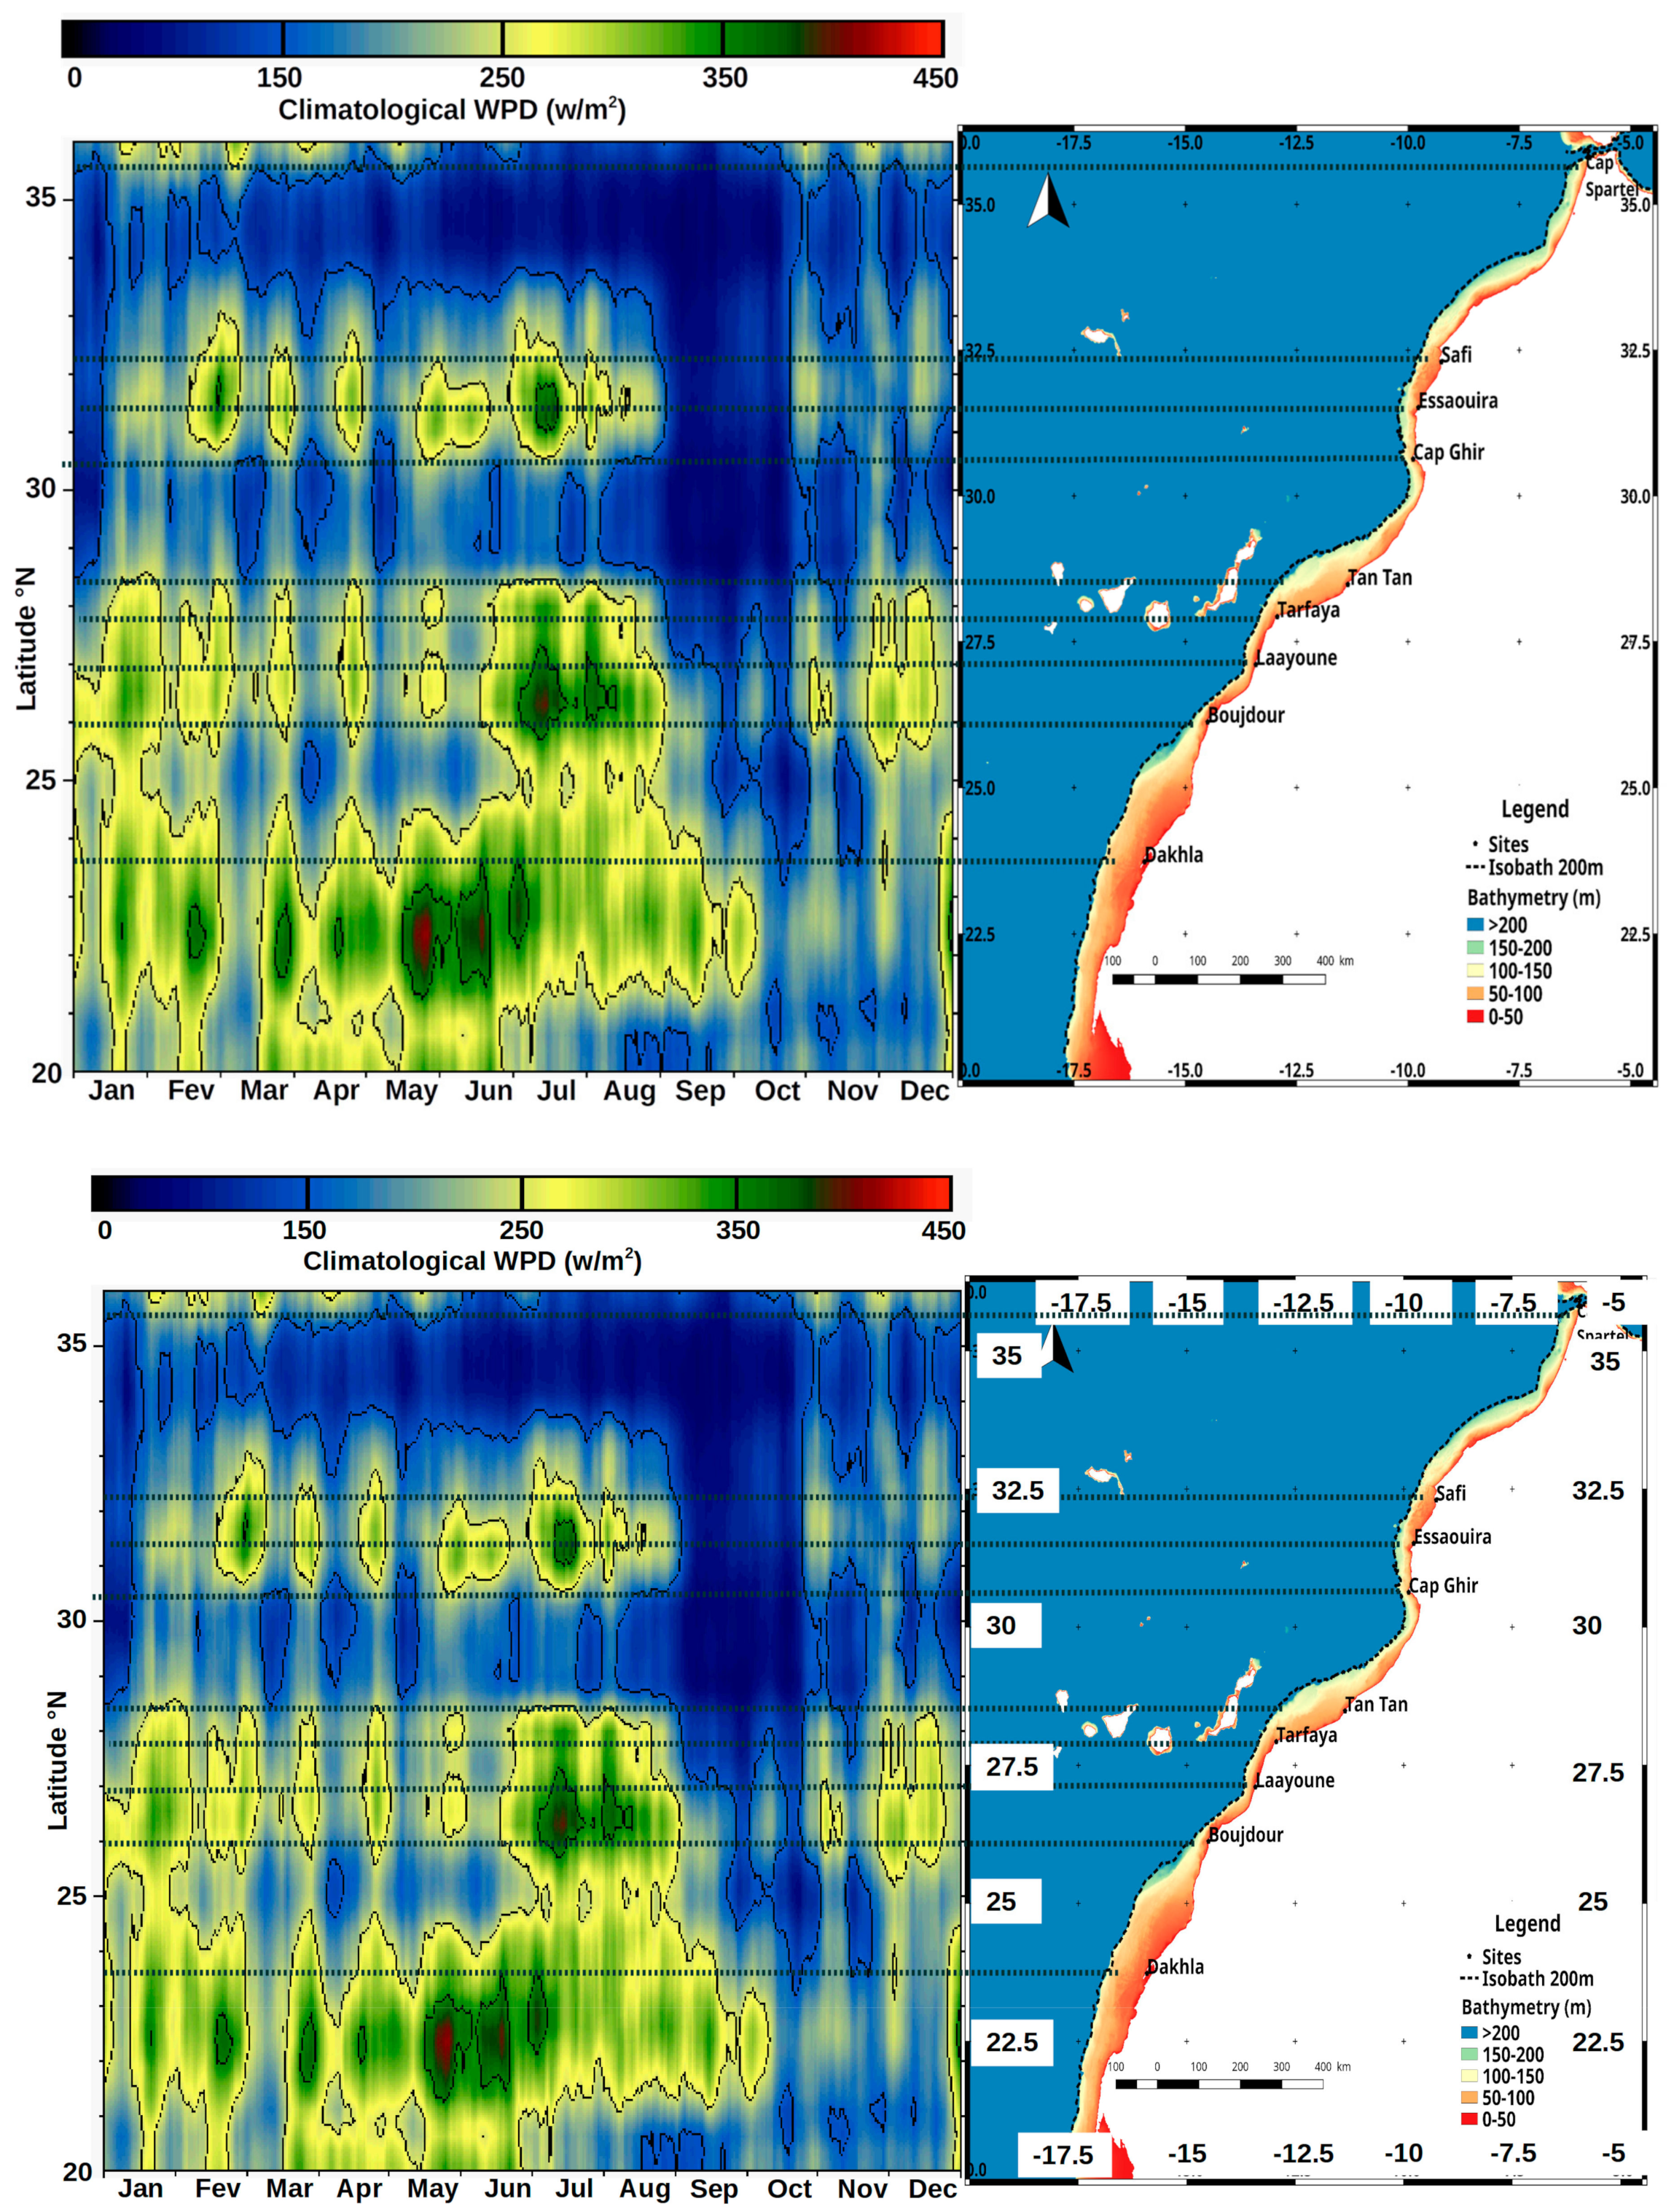
4.2. Seasonal Variability
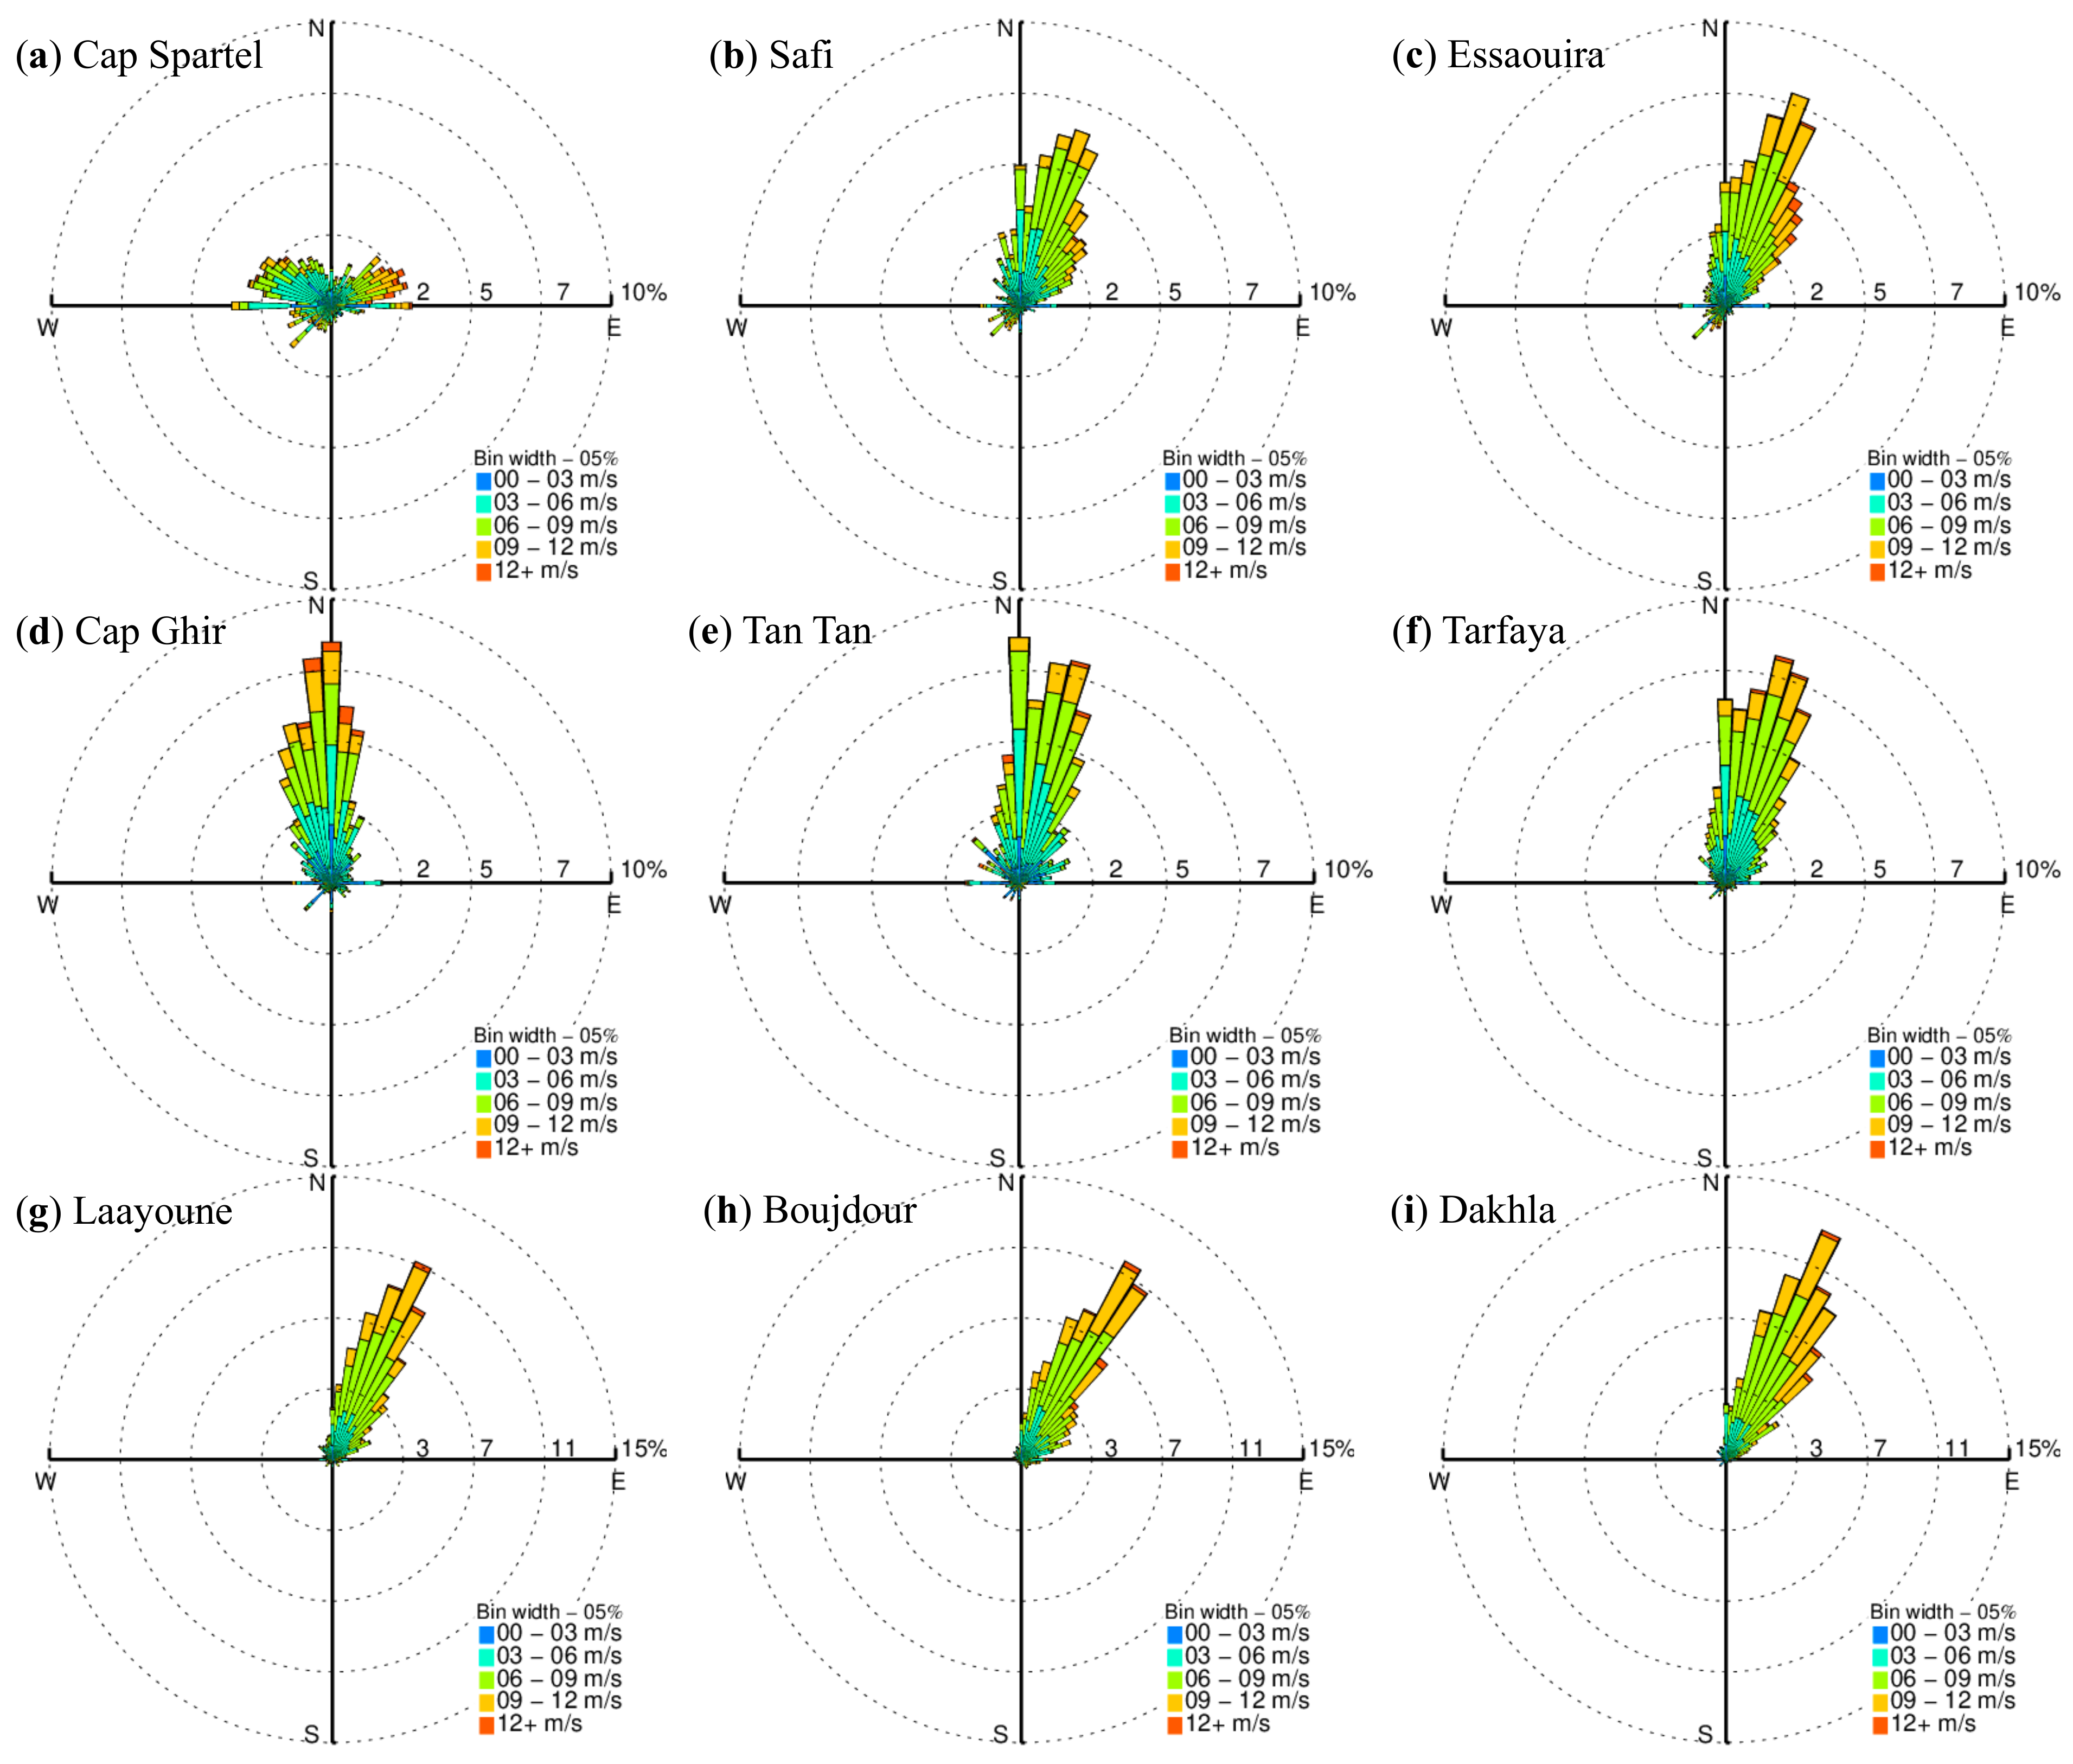
4.3. Wind Roses
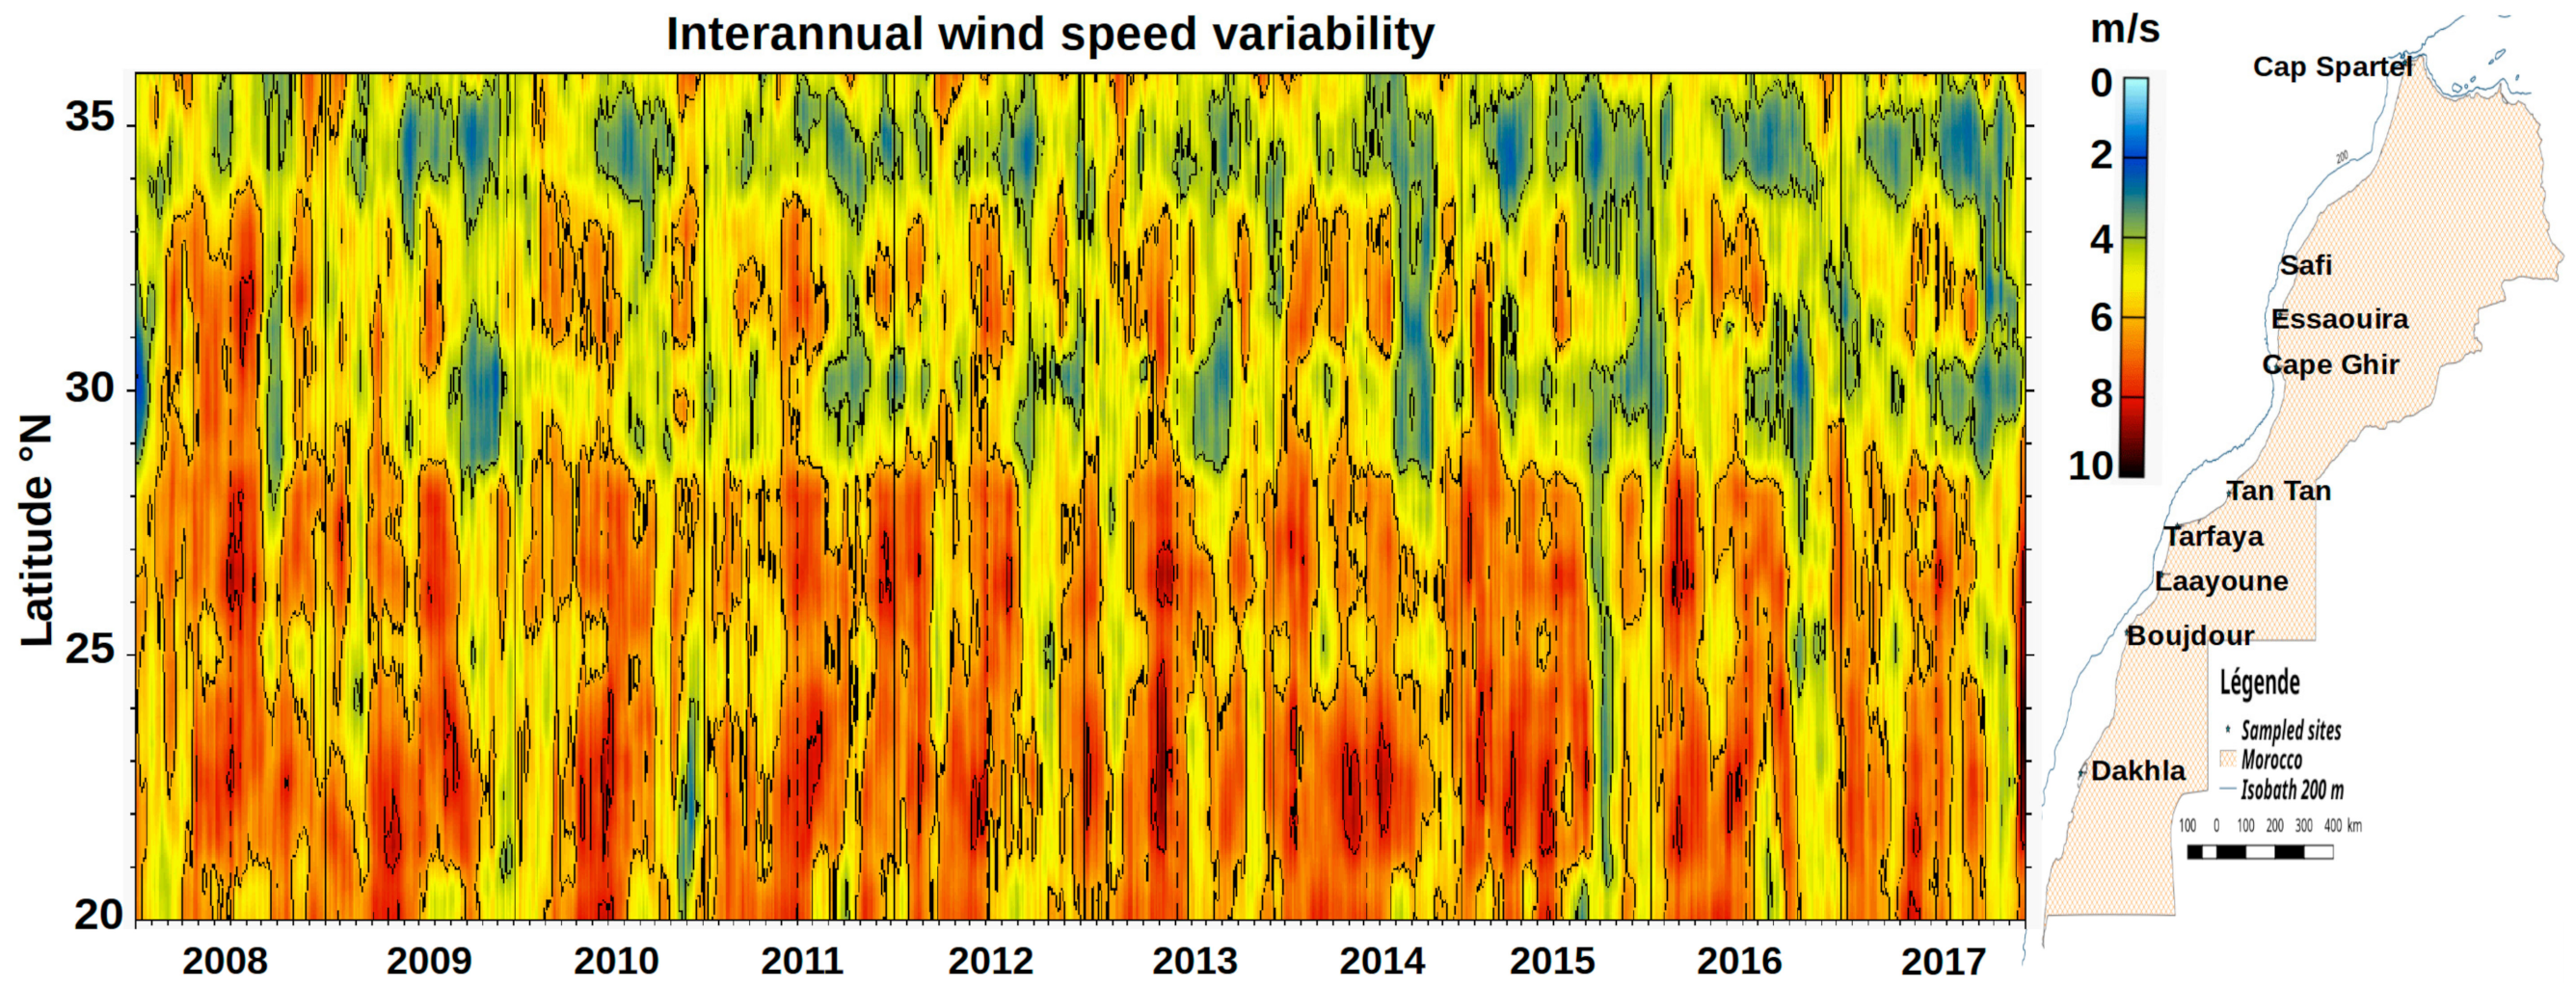
4.4. Interannual Variability
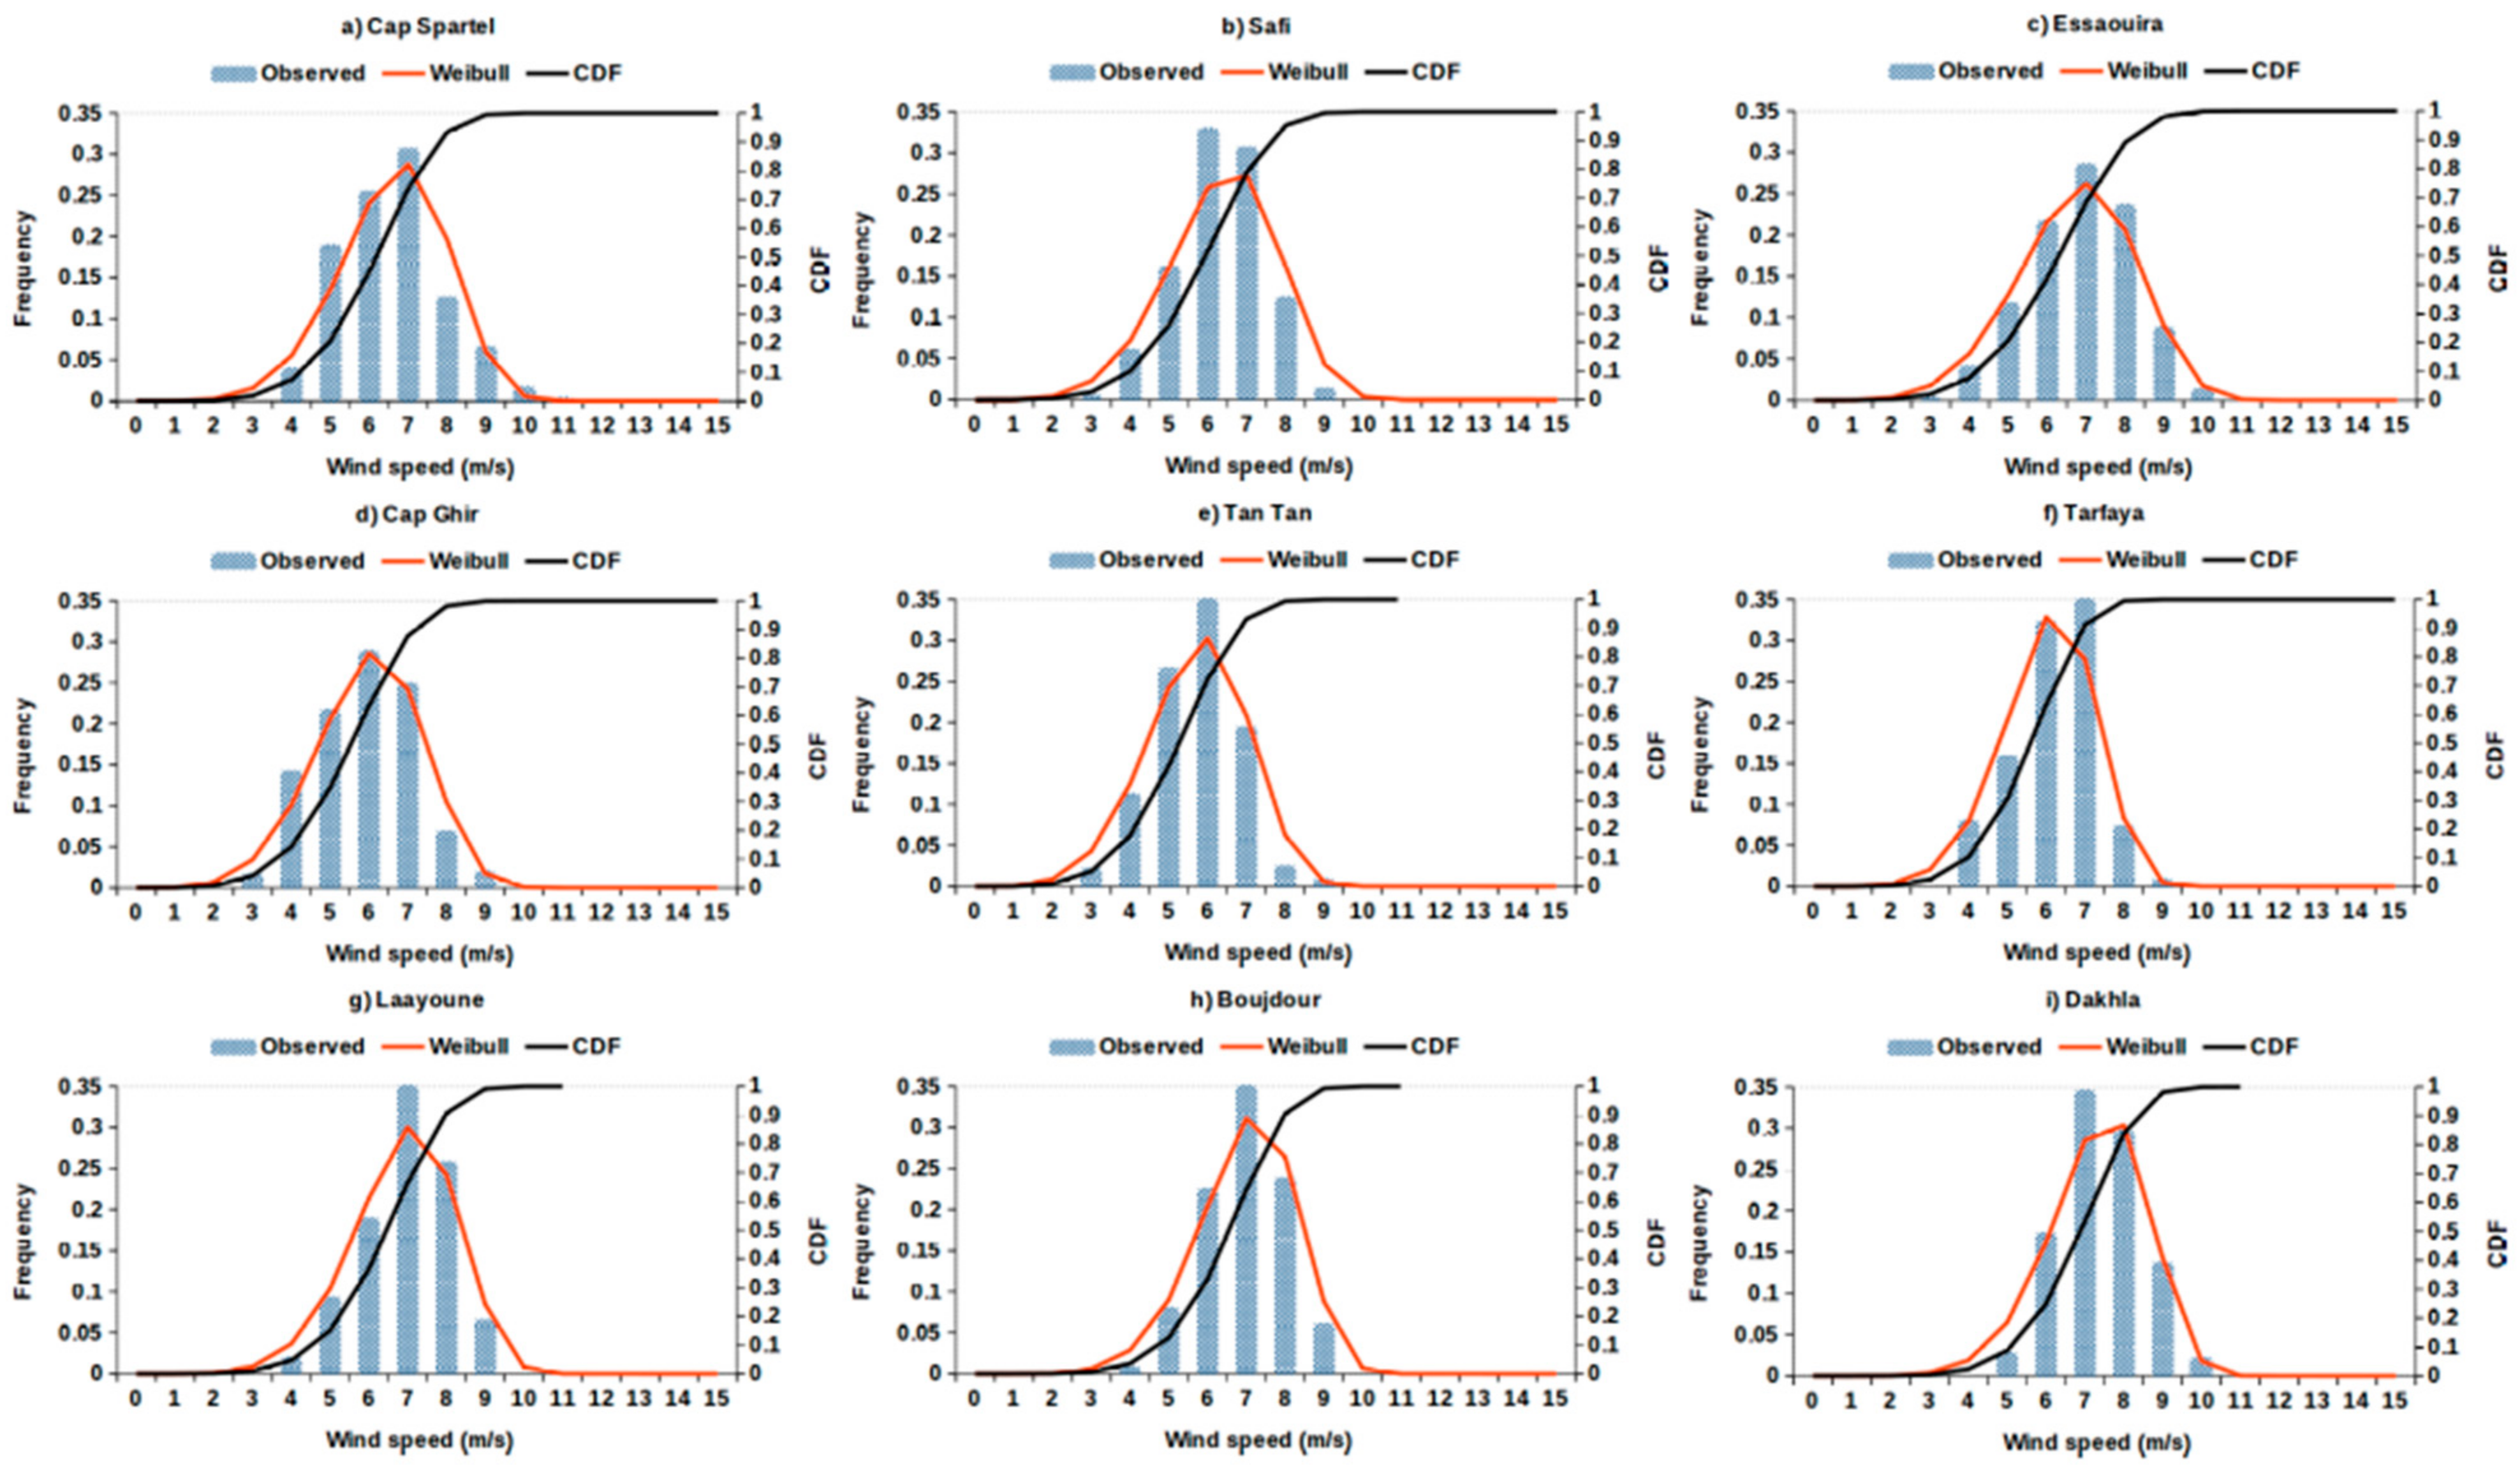
4.5. Weibull Distribution
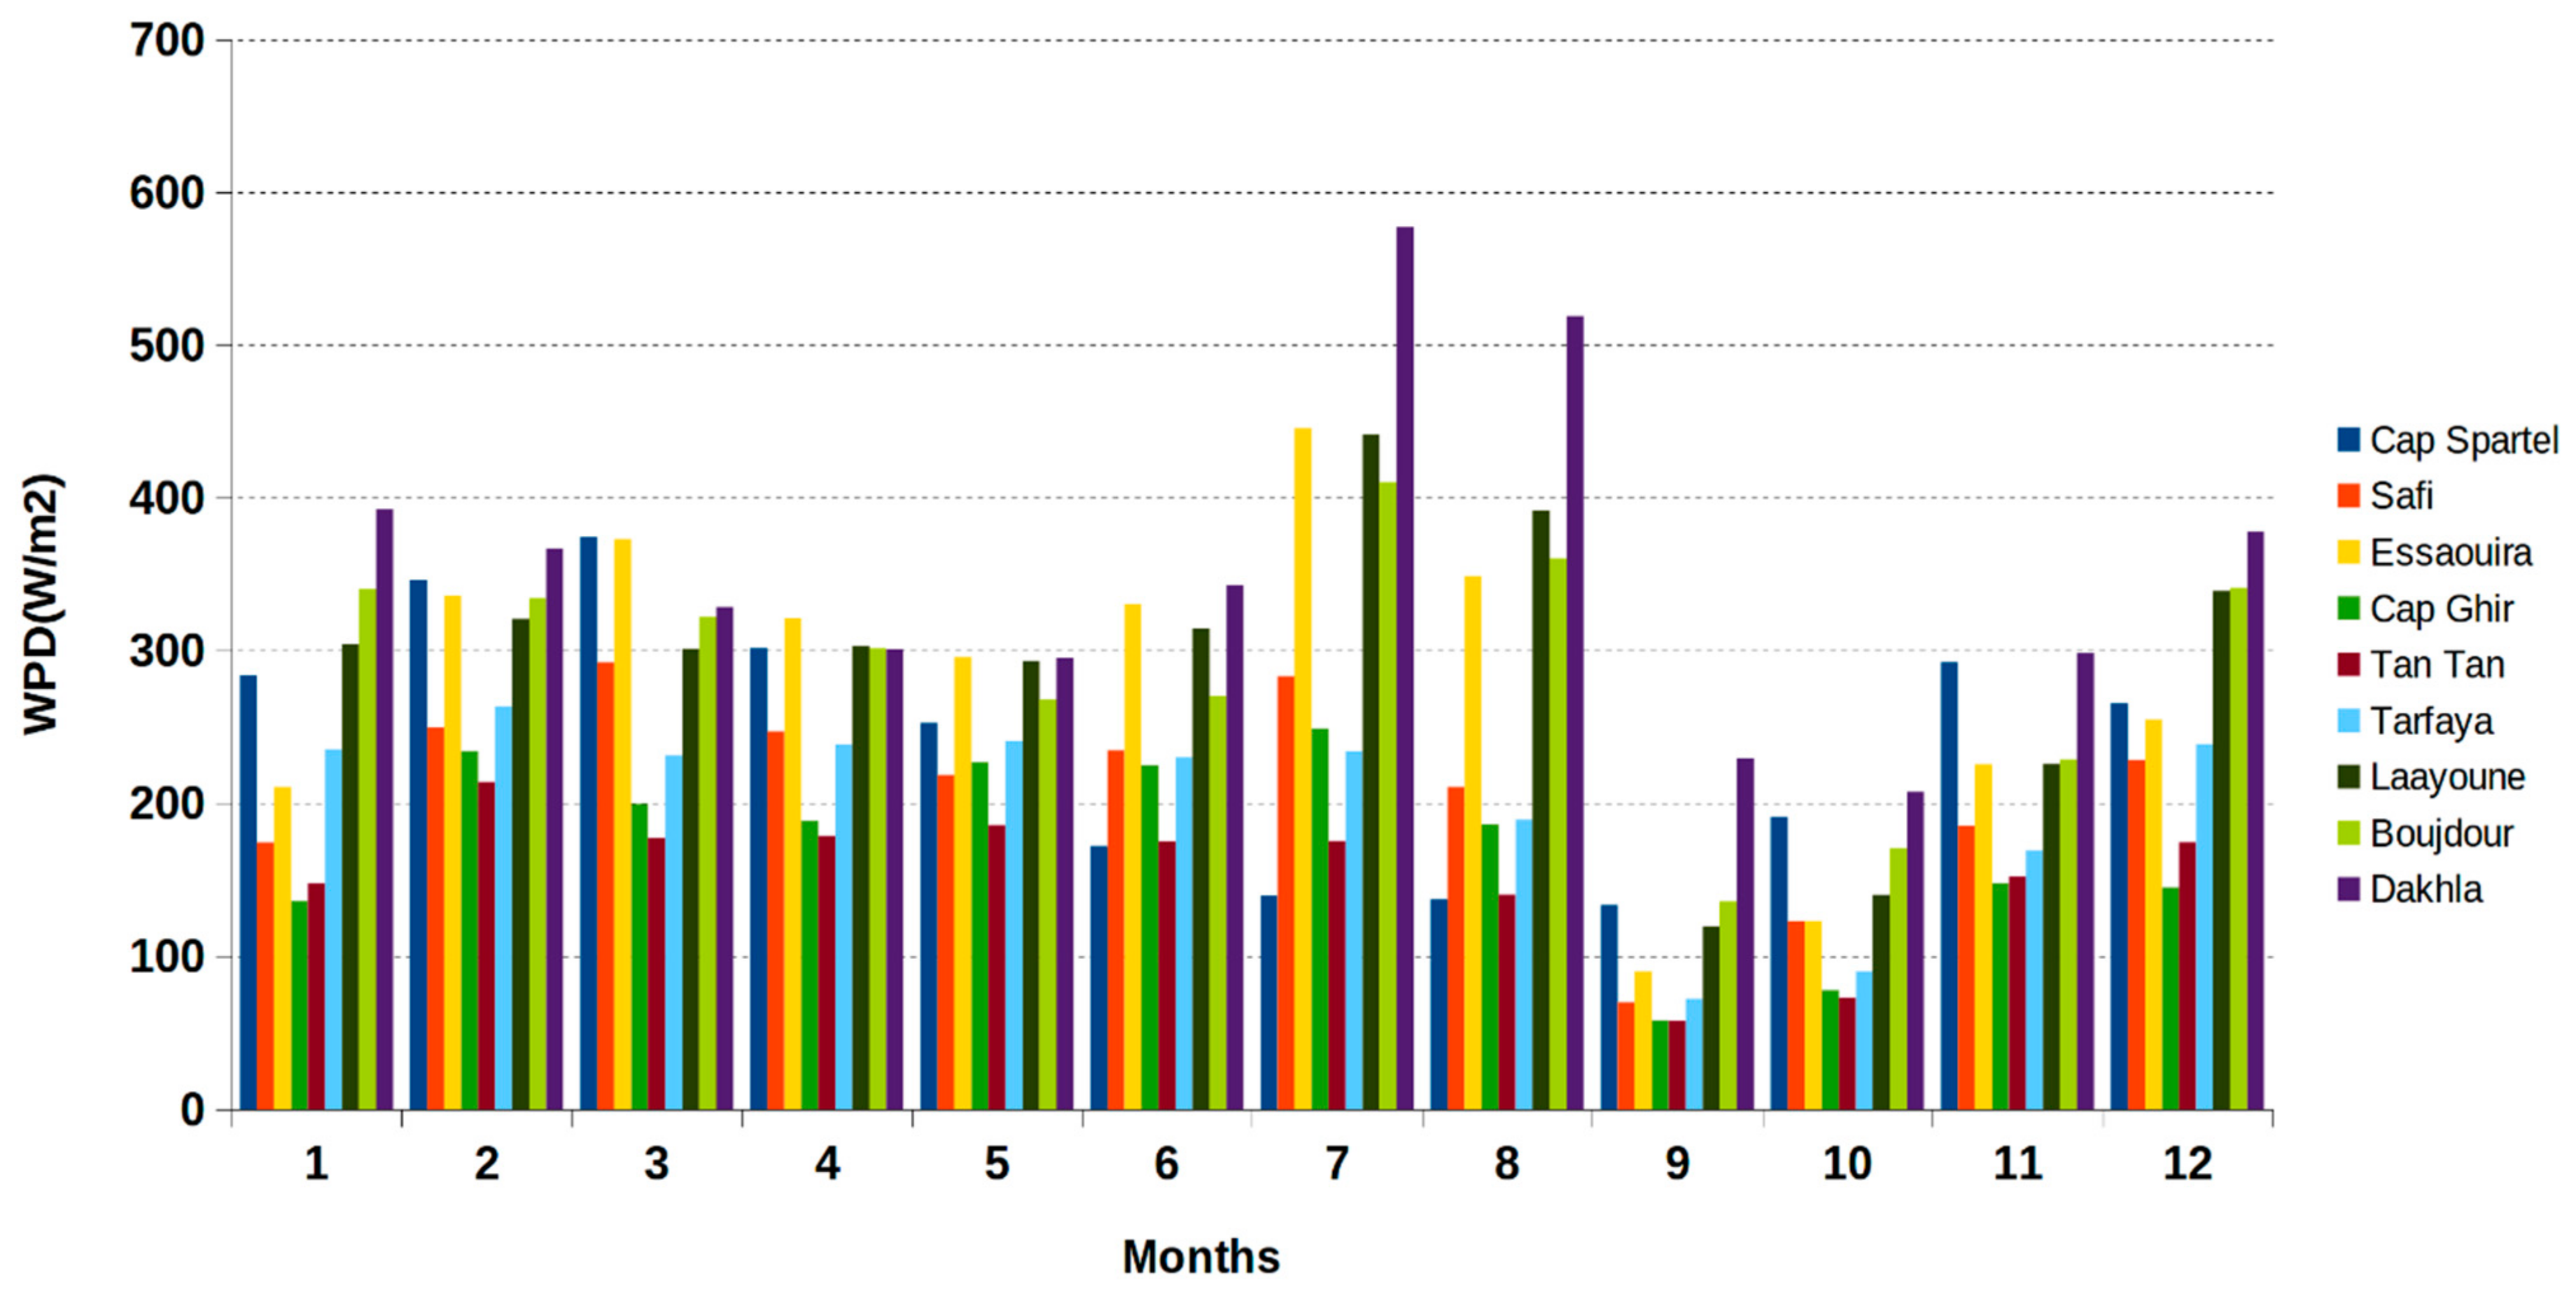
4.6. Mean Wind Power Densities
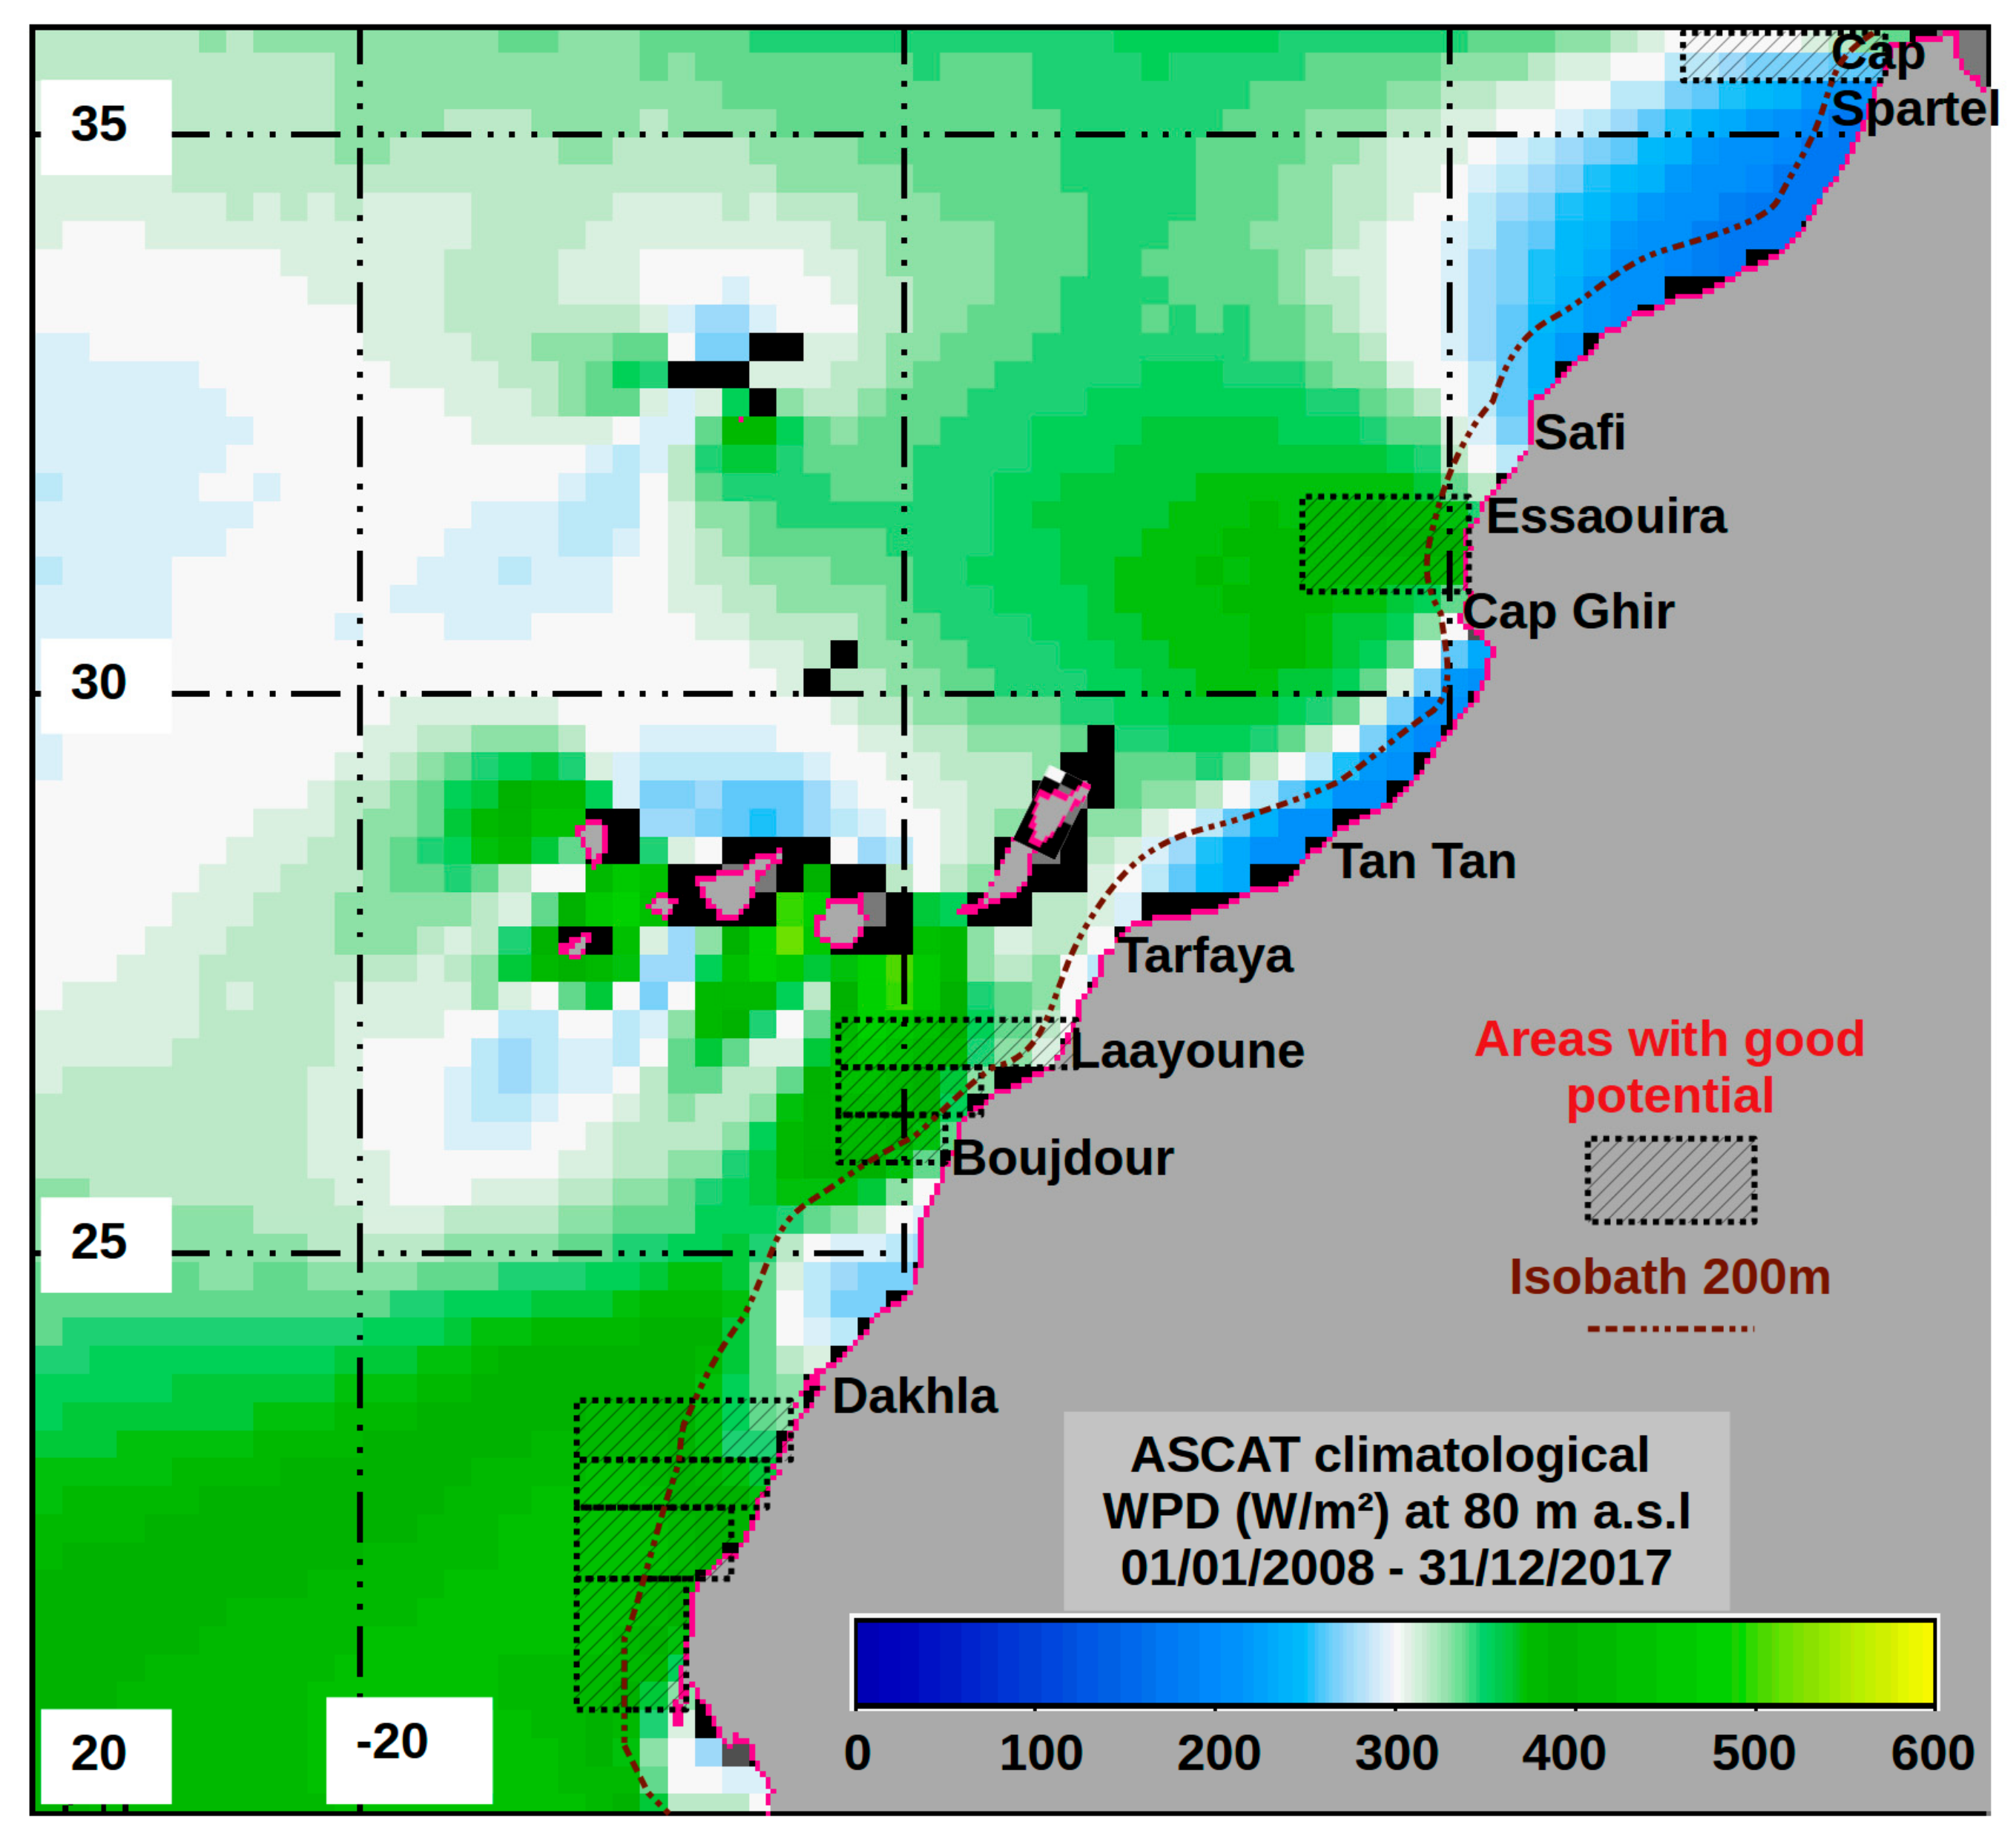
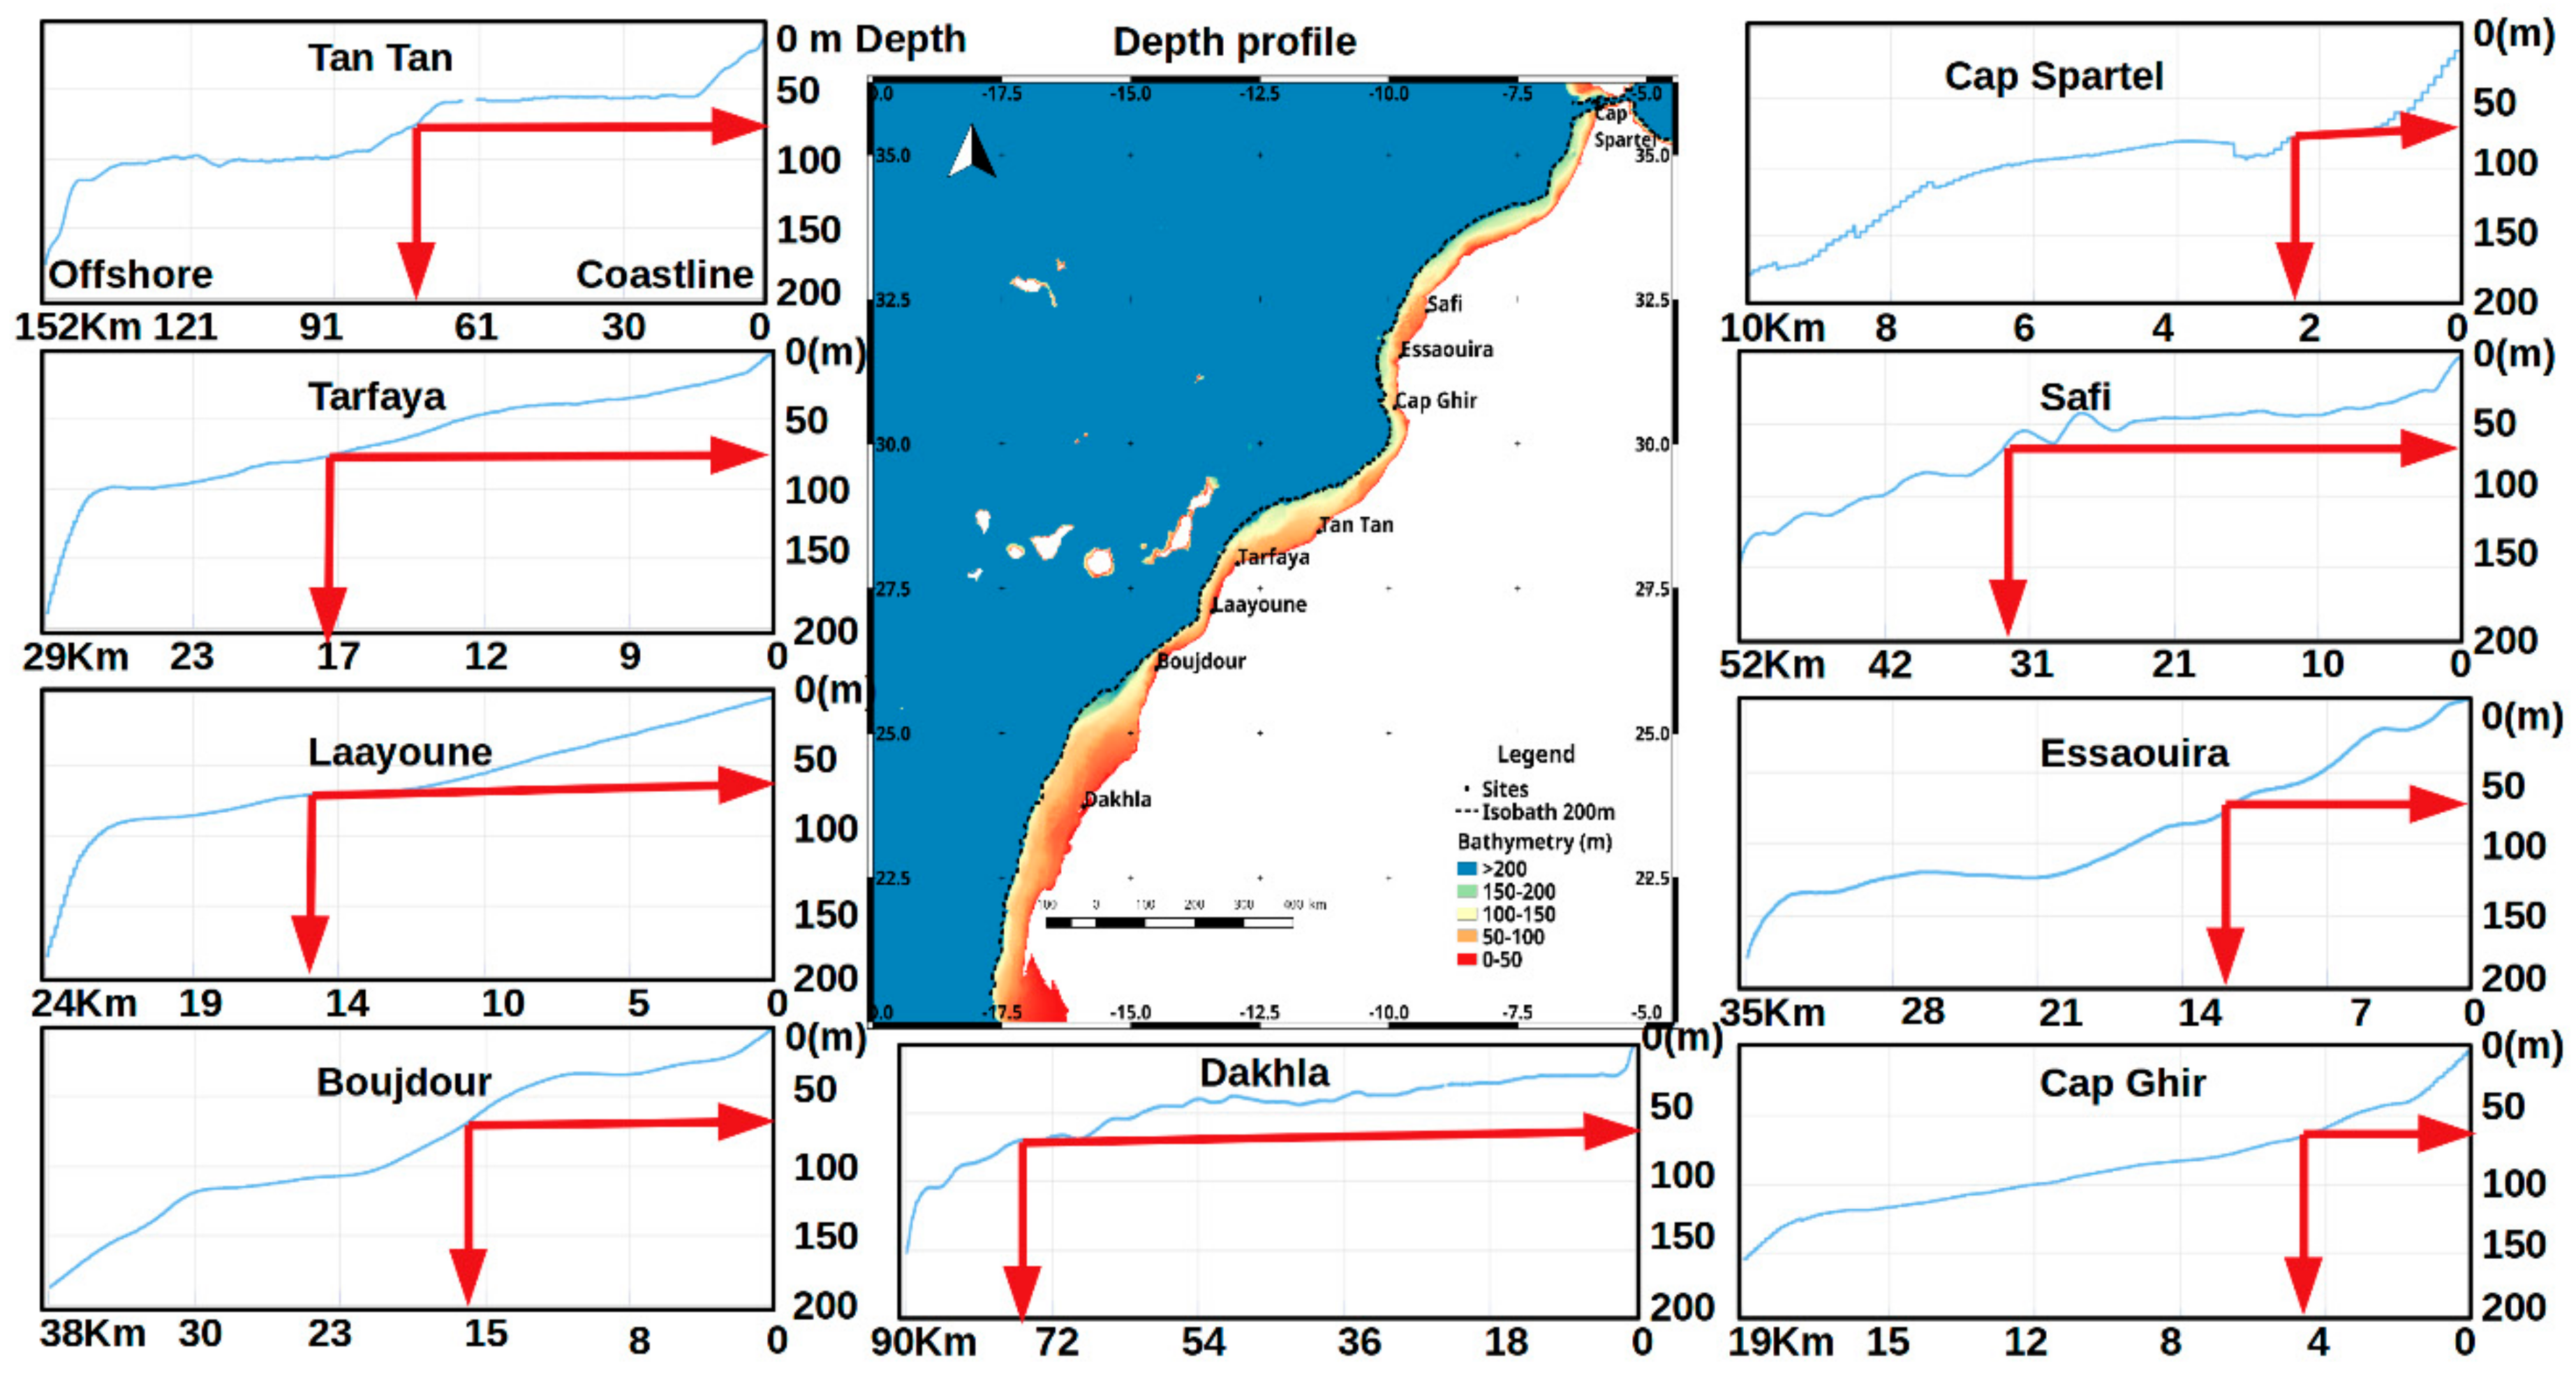
4.7. Considerations about Wind Technology and Bathymetry
- -
- Group 1: Very narrow continental shelf
- -
- Group 2: Thin continental shelf
- -
- Group 3: Very wide continental shelf
5. Conclusions
- Wind characteristic analysis for nine sites of Moroccan shoreline was conducted and the seasonal maps and wind roses are presented.
- The wind roses and Hovmoller analysis showed the prevailing wind directions for 10 m height over sea level.
- Wind distribution was modeled using the Weibull probability function and the Weibull parameters were calculated. The results show the lowest variability of wind mainly on the South.
- ASCAT data can be used to usefully map wind resources in countries with large extensional areas.
- The offshore winds that blow over the Atlantic shelves are a strong asset for the country. Wind resources are suitable for economically attractive electric generation, with three regions of higher productivity, the northern area at Cap Spartel, central area near Essaouira and the southern area in front and south of Dakhla.
- Regarding the power density parameter, the wind potential is on average 200 W/m2 for the entire region. This value varies depending on the season and month. The maximum energy density at height of 80 m a.s.l is more than 500 W/m2 at the Dakhla site followed by Boujdour, Laayoune, Tarfaya and Essaouira with values in the range of 350–450 W/m2. For the northern stations, the average values do not exceed 200 W/m2. On the other hand, a production peak is observed at the Essaouira site during the summer, although the average annual production does not exceed 300 W/m2.
- The large energy resource in the southern area is attributed to a large wind intensity. These southern areas tend to have a high quantity of resources at wind speeds between 7 m s−1 and 8 m s−1 and wide continental shelves.
- These regions can potentially benefit from their proximity to harbor structures and planned projects which make them promising regions for possible exploitation of wind energy.
Author Contributions
Funding
Institutional Review Board Statement
Informed Consent Statement
Data Availability Statement
Conflicts of Interest
References
- Kumar, Y.; Ringenberg, J.; Depuru, S.S.; Devabhaktuni, V.K.; Lee, J.; Nikolaidis, E.; Andersen, B.; Afjeh, A. Wind energy: Trends and enabling technologies. Renew. Sust. Energy Rev. 2106, 53, 209–224. [Google Scholar] [CrossRef]
- Huang, J.; Mc Elroy, M.B. A 32-year perspective on the origin of wind energy in warming climate. Renew. Energy 2015, 77, 482–492. [Google Scholar] [CrossRef]
- Intergovernmental Panel on Climate Change. Climate Change. Impacts, Adaptation and Vulnerability. In Contribution of Working Group II to the Fourth Assessment Report of the Intergovernmental Panel on Climate Change; Parry, M.L., Canziani, O.F., Palutikof, J.P., van der Linden, P.J., Hanson, C.E., Eds.; Cambridge University Press: Cambridge, UK, 2007. [Google Scholar]
- Sellers, B.J.; Voltaire, J.A.; Gustafson, S.M.; Hartman, W.A. Energy Sustainability in Morocco. 2015. Available online: https://digitalcommons.wpi.edu/iqp-all/787 (accessed on 28 December 2020).
- Second Edition of Ministry Media day under Theme “Energy and Mining, Levers for Sustainable Development: Assessments and Prospects”, Second the Ministry of Energy, Mining, and Sustainable Development Organized on Wednesday. 9 January 2019. Available online: www.mem.gov.ma (accessed on 28 December 2020).
- Masen (Moroccan Agency for Sustainable Energy) The Integrated Wind Project 850 MW, Infographics. 2017. Available online: www.masen.ma (accessed on 28 December 2020).
- Haddouche. Renewable Energy Policy and Wind Energy in Morocco; CDER Center for Renewable Energies Development: Marrakech, Morocco, 2006. [Google Scholar]
- European Marine Observation and Data Network Bathymetry. Available online: https://www.emodnet-bathymetry.eu/data-products (accessed on 28 December 2020).
- Allouhi, A.; Kousksou, T.; Jamil, A.; El Rhafiki, T.; Mourad, Y.; Zeraouli, Y. Economic and environmental assessment of solar air-conditioning systems in Morocco. Renew. Sustain. Energy Rev. 2015, 50, 770v81. [Google Scholar] [CrossRef]
- El Mghouchi, Y.; Ajzoul, T.; El Bouardi, A. Prediction of daily solar radiation intensity by day of the year in twenty-four cities of Morocco. Renew. Sustain. Energy Rev. 2016, 53, 823–831. [Google Scholar] [CrossRef]
- ONEE: Chiffres Clés 2019. Available online: http://www.one.org.ma/FR/pdf/Depliant%20Statistiques%20FR%202019.pdf (accessed on 28 December 2020).
- Renewable Energy Solutions for the Mediterranean & Africa, Country Profile Morocco. 2018. Available online: https://www.res4med.org/wp-content/uploads/2018/06/Country-profile-Marocco-2.pdf (accessed on 28 December 2020).
- GWEC (Global Wind Energy Council). Global Wind Report; GWEC: Brussels, Belgium, 2019. [Google Scholar]
- IEA (International Energy Agency). Offshore Wind Outlook; IEA: Paris, France, 2019. [Google Scholar]
- Kousksou, T.; Allouhi, A.; Belattar, M.; Jamil, A.; El Rhafiki, T.; Arid, A.; Zeraouli, Y. Renewable energy potential and national policy directions for sustainable development in Morocco. Renew. Sustain. Energy Rev. 2015, 47, 46–57. [Google Scholar] [CrossRef]
- World Wide Fund. Environmental Impacts of Offshore Wind Power Production in the North Sea: A Literature Overview; World Wide Fund for Nature (WWF): Oslo, Norway, 2014. [Google Scholar]
- Enzili, M.; Nayysa, A.; Affani, F.; Simonis, P. Wind energy in Morocco, potential—State of the art—Perspectives. DEWI Mag. 1998, 12, 42–44. [Google Scholar]
- El Khchine, Y.; Sriti, M.; El Kadri, N.D. Evaluation of wind energy potential and trends in Morocco. Heliyon 2019, 5, e01830. [Google Scholar] [CrossRef]
- Hasager, C.B. Offshore winds mapped from satellite remote sensing. WIREs Energy Environ. 2014, 3, 594–603. [Google Scholar] [CrossRef]
- Guo, Q.; Xu, X.; Zhang, K.; Li, Z.; Huang, W.; Mansaray, L.R.; Liu, W.; Wang, X.; Gao, J.; Huang, J. Assessing Global Ocean Wind Energy Resources Using Multiple Satellite Data. Remote Sens. 2018, 10, 100. [Google Scholar] [CrossRef]
- Bagiorgas, H.S.; Mihalakakou, G.; Rehman, S.; Al-Hadhrami, L.M. Wind Power Potential Assessment for Seven Buoys Data Collection Stations in Aegean Sea Using Weibull Distribution Function. J. Renew. Sustain. Energy 2012, 4, 1–16. [Google Scholar] [CrossRef]
- Talha Arslan, N.; Murat Bulut, Y.; Arzu Altın, Y. Comparative study of numerical methods for determining Weibull parameters for wind energy potential. Renew. Sustain. Rev. 2014, 40, 820–825. [Google Scholar] [CrossRef]
- Pavia, E.G.; O’Brien, J.J. Weibull statistics of wind speed over the ocean. J. Clim. Appl. Meteorol. 1986, 25, 1324–1332. [Google Scholar] [CrossRef]
- Savenkov, M. On the Truncated Weibull Distribution and its Usefulness in Evaluating the Theoretical Capacity Factor of Potential Wind (or Wave) Energy Sites. J. Eng. Technol. 2009, 1, 21–25. [Google Scholar]
- Troen, I.; Petersen, E.L. European Wind Atlas; Risoe National Laboratory: Roskilde, Danemark, 1989. [Google Scholar]
- Weibull, W. A Statistical Distribution Function of Wide Applicability. J. Appl. Mech. 1951, 103, 293–297. [Google Scholar]
- Fazelpour, F.; Soltani, N.; Soltani, S.; Rosen, M.A. Assessment of wind energy potential and economics in the north-western Iranian cities of Tabriz and Ardabil, Renew. Sustain. Energy Rev. 2015, 45, 87–99. [Google Scholar] [CrossRef]
- Liu, W.T.; Tang, W.; Xie, X. Wind power distribution over the ocean. Geophys. Res. Lett. 2008, 35. [Google Scholar] [CrossRef]
- Harvesting the Wind: The Physics of Wind Turbines. Carleton College. 2005. Available online: http://digitalcommons.carleton.edu/pacp/7 (accessed on 28 December 2020).
- Carvalho, D.; Rocha, A.; Gomez-Gesteira, M.; Silva Santos, C. Offshore winds and wind energy production estimates derived from ASCAT, OSCAT, numerical weather prediction models and buoys—A comparative study for the Iberian Peninsula Atlantic coast. Renew. Energy 2017, 102, 433–444. [Google Scholar] [CrossRef]
- Soukissian, T.; Karathanasi, F.; Axaopoulos, P. Satellite-based offshore wind resource assessment in the Mediterranean Sea. IEEE J. Ocean Eng. 2017, 42, 73–86. [Google Scholar] [CrossRef]
- Nagababu, G.; Kachhwaha, S.S.; Savsani, V. Estimation of technical and economic potential of offshore wind along the coast of India. Energy 2017, 138, 79–91. [Google Scholar] [CrossRef]
- Benazzouz, A.; Mordane, S.; Orbi, A.; Chagdali, M.; Hilmi, K.; Atillah, A.; Pelegrí, J.L.; Demarcq, H. An improved coastal upwelling index from sea surface temperature using satellite-based approach—The case of the Canary Current upwelling system. Cont. Shelf Res. 2014, 81, 38–54. [Google Scholar] [CrossRef]
- Pimenta, F.; Kempton, W.; Garvine, R. Combining meteorological stations and satellite data to evaluate the offshore wind power resource of southeastern Brazil. Renew. Energy 2008, 33, 2375–2387. [Google Scholar]
- Salvação, N.; Soares, C.G. Offshore wind energy assessment for the Iberian coasts using remotely sensed data. In Renewable Energies Offshore; Soares, C.G., Ed.; Taylor & Francis Group: Didecott, UK, 2015; pp. 237–244. [Google Scholar]
- Balog, I.; Ruti, P.M.; Tobin, I.; Armenio, V.; Vautard, R. A numerical approach for planning offshore wind farms from regional to local scales over the Mediterranean. Renew. Energy 2016, 85, 395–405. [Google Scholar]
- Daoudi, M.; Abdelaziz, A.S.M.; Mohammed, E.; Elmostapha, E. Wind speed data and wind energy potential using Weibull distribution in Zagora, Morocco. Int. J. Renew. Energy Dev. 2019, 8, 267–273. [Google Scholar] [CrossRef]
- Heimiller, D.; Beiter, P.; Scott, G.; Draxl, C. Offshore Wind Energy Resource Assessment for the United States Walt Musial. National Renewable Energy Laboratory. 2016. Available online: www.nrel.gov/publications (accessed on 28 December 2020).
- Moller, B.; Hong, L.; Lonsing, R.; Hvelplund, F. Evaluation of offshore wind resources by scale development. Energy 2012, 48, 314–322. [Google Scholar] [CrossRef]
- Mhammdi, N.; Snoussi, M.; Medina, F.; Jaaïdi, E.B. Chapter 10 Recent sedimentation in the NW African shelf. Geol. Soc. London Mem. 2014, v.41, 131–146. [Google Scholar] [CrossRef]
- Elsner, P.; Suarez, S. Renewable energy from the highseas: Geo-spatial modelling of resource potential and legal implications ford eveloping offshore wind projects beyond the national jurisdiction of coastal states. Energy Policy 2019, 128, 919–929. [Google Scholar] [CrossRef]


| City | Project | Capacity (MW) | Date of Commissioning | Statute |
|---|---|---|---|---|
| TANGER | HAOUMA | 50 | 2013 | Operational |
| TANGER I | 140 | 2010 | Operational | |
| TANGER II | 100 | 2020 | In progress | |
| KSAR SGHIR | JBEL KHELLADI | 120 | 2017 | Operational |
| TETOUAN | ABDELKHALEK TORRÈS | 54 | 2000 | Operational |
| LAFARGE | 32 | 2011 | Operational | |
| KOUDIA BAIDA | 200 | 2020 | In progress | |
| TAQA NORD | 200 | 2020 | In progress | |
| TAZA | TAZA—PEI PHASE I | 150 | 2021 | In progress |
| MIDELT | MIDELT—PEI | 180 | 2020 | In progress |
| EL OUALIDIA | El OUALIDIA | 36 | 2020 | In progress |
| SAFI | SAFI | 200 | 2021 | In progress |
| ESSAOUIRA | JBEL LAHDID—PEI | 200 | 2021 | In progress |
| TANTAN | AKHEFNIR I | 100 | 2013 | Operational |
| AKHEFNIR II | 100 | 2017 | Operational | |
| TARFAYA | TARFAYA | 301 | 2014 | Operational |
| AMOGDOUL | 60 | 2007 | Operational | |
| LAAYOUNE | CIMAR | 5 | 2012 | Operational |
| FOUM EL OUED | 50 | 2013 | Operational | |
| TISKRAD—PEI | 100 | 2022 | In progress | |
| BOUJDOUR | BOUJDOUR—PEI | 300 | 2021 | In progress |
| DAKHLA | AFTISSAT II | 200 | 2022 | In progress |
| AFTISSAT I | 201.6 | 2019 | Operational |
| Sites | WGS84 Coordinates | |
|---|---|---|
| Longitude (West) | Latitude (North) | |
| Cap Spartel | −5.99 | 35.80 |
| Safi | −9.30 | 32.24 |
| Essaouira | −9.77 | 31.51 |
| Cap Ghir | −9.65 | 30.43 |
| Tan Tan | −11.36 | 28.46 |
| Tarfaya | −12.93 | 27.94 |
| Laayoune | −13.46 | 27.12 |
| Boujdour | −14.50 | 26.12 |
| Dakhla | −16.02 | 23.66 |
| Sites | Speed at 80 m | WPD at 80 m | Width of the Continental Shelf | Distance of the Shallow Water | Foundation | ||
|---|---|---|---|---|---|---|---|
| Max | Mean | Max | Mean | ||||
| Cap Spartel | 8.48 | 7.23 | 374.10 | 240.67 | very narrow | <3 NM | Floating |
| Safi | 7.81 | 6.91 | 292.2 | 209.54 | Medium | ~12 NM | Fixed |
| Essaouira | 8.99 | 7.56 | 445.46 | 279.44 | Medium | ~12 NM | Fixed |
| Cap Ghir | 7.40 | 6.45 | 248.71 | 172.63 | very narrow | <3 NM | Floating |
| Tan Tan | 7.039 | 6.24 | 213.66 | 154.04 | Wide | >24 NM | Fixed |
| Tarfaya | 7.547 | 6.82 | 263.24 | 202.55 | Medium | ~12 NM | Fixed |
| Laayoune | 8.97 | 7.71 | 441.48 | 291.04 | Medium | >3 MN <12 MN | Floating |
| Boujdour | 8.75 | 7.72 | 410.15 | 290.10 | Medium | >3 MN <12 MN | Floating |
| Dakhla | 9.8 | 8.25 | 577.26 | 352.95 | Wide | >24 NM | Fixed |
Publisher’s Note: MDPI stays neutral with regard to jurisdictional claims in published maps and institutional affiliations. |
© 2020 by the authors. Licensee MDPI, Basel, Switzerland. This article is an open access article distributed under the terms and conditions of the Creative Commons Attribution (CC BY) license (http://creativecommons.org/licenses/by/4.0/).
Share and Cite
Benazzouz, A.; Mabchour, H.; El Had, K.; Zourarah, B.; Mordane, S. Offshore Wind Energy Resource in the Kingdom of Morocco: Assessment of the Seasonal Potential Variability Based on Satellite Data. J. Mar. Sci. Eng. 2021, 9, 31. https://doi.org/10.3390/jmse9010031
Benazzouz A, Mabchour H, El Had K, Zourarah B, Mordane S. Offshore Wind Energy Resource in the Kingdom of Morocco: Assessment of the Seasonal Potential Variability Based on Satellite Data. Journal of Marine Science and Engineering. 2021; 9(1):31. https://doi.org/10.3390/jmse9010031
Chicago/Turabian StyleBenazzouz, Aïssa, Hassan Mabchour, Khalid El Had, Bendahhou Zourarah, and Soumia Mordane. 2021. "Offshore Wind Energy Resource in the Kingdom of Morocco: Assessment of the Seasonal Potential Variability Based on Satellite Data" Journal of Marine Science and Engineering 9, no. 1: 31. https://doi.org/10.3390/jmse9010031
APA StyleBenazzouz, A., Mabchour, H., El Had, K., Zourarah, B., & Mordane, S. (2021). Offshore Wind Energy Resource in the Kingdom of Morocco: Assessment of the Seasonal Potential Variability Based on Satellite Data. Journal of Marine Science and Engineering, 9(1), 31. https://doi.org/10.3390/jmse9010031