Article

Development of Depth-Limited Wave Boundary Layers over a Smooth Bottom

1
Department of Civil Engineering, Tohoku University, 6-6-06 Aoba, Sendai 980-8579, Japan
2
Department of Hydraulic Engineering, Tsinghua University, No. 1 Tsinghua Yuan, Haidian District, Beijing 100084, China
*
Author to whom correspondence should be addressed.
J. Mar. Sci. Eng. 2021, 9(1), 27; https://doi.org/10.3390/jmse9010027
Submission received: 26 November 2020 / Revised: 23 December 2020 / Accepted: 25 December 2020 / Published: 29 December 2020
(This article belongs to the Section Coastal Engineering)

Abstract

:
A theoretical and numerical study is carried out to investigate the transformation of the wave boundary layer from non-depth-limited (wave-like boundary layer) to depth-limited one (current-like boundary layer) over a smooth bottom. A long period of wave motion is not sufficient to induce depth-limited properties, although it has simply been assumed in various situations under long waves, such as tsunami and tidal currents. Four criteria are obtained theoretically for recognizing the inception of the depth-limited condition under waves. To validate the theoretical criteria, numerical simulation results using a turbulence model as well as laboratory experiment data are employed. In addition, typical field situations induced by tidal motion and tsunami are discussed to show the usefulness of the proposed criteria.

1. Introduction

Unlike steady flow in an open channel, the wave boundary layer is generally confined in the immediate vicinity of the bottom, resulting in large bottom shear stress due to its steep velocity gradient near the bed. According to the theory of Stokes’s 2nd problem [1], the wave boundary layer thickness under laminar condition is in the order of (νT)1/2, in which ν: the kinematic viscosity of the fluid, and T: the wave period. Hence, laminar boundary layer thickness under wave motion with T = 10 s attains only O(0.3 cm). In addition, if we consider a small-scale laboratory experiment with the wave period of T = 1–2 s, boundary layer thickness becomes thinner in the order of O(0.1 cm). For this reason, a detailed measurement of flow velocity distribution in a wave boundary layer is extremely difficult in a laboratory scale wave flume. Due to such a background, instead of using a wave flume with a free surface, an oscillatory tunnel which enables flow generation with longer period has been utilized by many researchers using either a U-shaped [2,3,4,5,6,7,8,9,10] or a loop-type [11,12] oscillating tunnel. In addition, placement of large roughness elements on the bottom in an oscillatory tunnel facilitates precise measurement of fluid motion in a wave boundary layer by increasing the boundary layer thickness.
Using these types of the flow generation system, study on wave boundary has been made by various researchers [13,14,15,16,17]. However, even using such an oscillating tunnel, the period of oscillatory motion produced by the system is up to approximately T = 10 s at the maximum, which is extremely smaller than that under tsunami and tidal waves.
Compared with wind-generated waves, period of tsunami is much longer, and much thicker boundary layer development is expected. Tinh and Tanaka [18] analyzed velocity distribution under tsunami measured at water depth of 10 m in Monterey Bay, US, during the 2010 Chilean Earthquake Tsunami [19], and showed that the distribution was extremely similar to that under wind-generated waves. In particular, the boundary layer thickness, δ, under the tsunami was about 40 cm, which is far smaller than the water depth h. Moreover, Tinh and Tanaka [18] carried out an investigation on tsunami boundary layer development under a hypothetical shoaling tsunami using an equation of Sana and Tanaka [20,21]. As a result, it was shown that even at the water depth of 10 m, the depth-limited condition was not satisfied. Recently, Tanaka et al. [22] used a newly proposed full-range equation for wave boundary layer thickness by Tanaka et al. [23], and obtained a result similar to Tinh and Tanaka [18].
Meanwhile, Yalin and Russell [24] carried out a series of experimental measurements in a wave channel with long period waves ranging from T = 2.0 min to 20.0 min, and the time-variation of bottom shear stress was measured using a bed shear meter. Moreover, an empirical equation for shear stress, which consists of two terms proportional square of velocity and water surface slope, was proposed. Knight and Ridgway [25] conduct a similar experiment using wave period from T = 1.2 min to 2.7 min, and showed that the velocity profile changes from a wave-like to a current-like profile with the increase in the period of wave motion. In laboratory experiments by Chen et al. [26], the wave period varied from T = 0.5 min to 4 min, and combined a laser-induced fluorescence system and 2D laser Doppler velocimetry were used to measure the velocity and solute concentration simultaneously. Larsen et al. [27] carried out an experimental study of tsunami-induced scour around a monopole foundation, and it is shown that under extremely long period condition, the current-like boundary layer is observed.
Numerical computation has also been employed for this topic such as Rodi and Cereki [28] using the k-ε model. They validated their computation results by comparing with a laboratory-estuary result of Knight and Ridgway [25] and also with field data in the Humber Estuary, U.K. (Johns [29]). Meanwhile, Li et al. [30] used a three-dimensional large eddy simulation (LES) to simulate oscillating tidal boundary layers with a water depth of h = 10 m. Williams and Fuhrman [31] applied the k-ω turbulence model to the tsunami boundary layer, and showed that the computed boundary layer is not depth-limited under their computational condition. Recently, Kaptein et al. [32] investigated the influence of reduced water depth on turbulent oscillatory flows using a direct numerical simulation (DNS) and LES.
In order to recognize the difference between wave-like and current-like boundary layers over a rough bottom, Tanaka et al. [33] and Tinh and Tanaka [18] used am/ks and h/ks, in which am: the amplitude of water particle motion outside the boundary layer (=Um/σ), σ: the angular frequency (=2π/T), and Um the amplitude of the wave-induced velocity outside the boundary layer, ks: Nikuradse’s equivalent roughness, and h: the water depth. However, investigations on depth-limited boundary layers for a smooth bottom have never been made in the past. It should be noted that, according to a recent investigation by Tanaka et al. [22] on flow regime under the tsunami, laminar regime, and smooth turbulent regime are commonly observed during the tsunami shoaling process from the tsunami source area to the shallow region. In the present investigation, therefore, the demarcation between non-depth-limited and depth-limited boundary layers over a smooth bottom is theoretically derived and validated using various data sources including the recent numerical computation results of Kaptein et al. [32].

2. Theoretical Considerations

Four approaches will be used in the following theoretical considerations to obtain an equation to classify into non-depth-limited (Figure 1a) and depth-limited (Figure 1b) boundary layers.

2.1. Criterion Modified from the Rough-Turbulent Formula by Tanaka

Tanaka et al. [33] obtained a demarcation for recognizing the depth-limited condition over a rough bottom as:
h k s = 0.171 ( a m k s ) 0.797
Recently, Tinh and Tanaka [18] obtained an approximated equation for Equation (1) by simplifying the power on the right-hand side to be 1.0:
h k s = 2.5 × 10 2 a m k s
From Equation (2), a relationship between two Reynolds numbers can be easily derived for the smooth turbulent condition:
R = 2.5 × 10 2 R e
where R and R e are, respectively, the current Reynolds number and the wave Reynolds number defined as:
R = U m h ν
R e = U m a m ν
Instead of the combination of R e and R , Kaptein et al. [32] used an equivalent relationship expressed in terms of R e δ and h / δ s defined as:
R e δ = U m δ s ν
in which δ s denotes the Stokes layer thickness defined by the following equation:
δ s = 2 ν σ
It is here noted that R e δ used by Kaptein et al. [32] can be correlated with R e , Equation (5), as follows:
R e = R e δ 2 2
Moreover, the current Reynolds number R defined by Equation (4) is correlated with R e δ and h / δ s as:
R = R e δ × h δ s
Using the relationship of Equations (8) and (9), the demarcation given by Equation (3) can be converted to an equivalent relationship expressed in terms of R e δ and h / δ s :
h δ s = 1.25 × 10 2 R e δ

2.2. Criterion Modified from the Rough-Turbulent Formula by Kajiura

Kajiura [34] theoretically obtained a demarcating criterion similar to Equation (2) expressed in terms of h and am with a slightly different constant:
a m h = 100
Using the Reynolds numbers defined by Equations (4) and (5), an equation similar to Equation (3) is derived:
R = 1.0 × 10 2 R e
An equivalent relationship in terms of R e δ and h / δ s , similar to Equation (10), is expressed as:
h δ s = 5.0 × 10 3 R e δ

2.3. Criterion in Terms of Boundary Layer Thickness

By equating wave-induced boundary layer thickness δ and water depth h , Tinh and Tanaka [18] proposed an equation and a diagram for demarcating wave friction zone and steady friction zone under a rough turbulent regime. Similarly, under smooth turbulent condition, the following equation recently proposed by Tanaka et al. [23] can be applied to obtain a criterion in terms of wave boundary layer thickness:
δ a m = 0.331 f w 2 = 0.234 exp { 3.97 + 3.68 R e 0.0748 }
where f w is the wave friction coefficient in smooth turbulent regime. By substituting Equation (14) into h = δ , the following relationship is obtained:
R = 0.234 R e   exp { 3.97 + 3.68 R e 0.0748 }
Similar to Equation (10), Equation (15) is converted to be expressed in terms of R e δ and h / δ s :
h δ s = 0.117 R e δ   exp { 3.97 + 3.88 R e δ 0.150 }

2.4. Criterion in Terms of Friction Factor

Alternatively, by equating wave friction factor f w and steady current friction factor f c , Tinh and Tanaka [18] proposed a demarcation for the rough turbulent condition. For a smooth bottom, an expression for wave and steady friction factor respectively proposed by Tanaka [35] and Tanaka and Thu [36] will be applied:
f w = exp { 7.94 + 7.35 R e 0.0748 }
f c = exp { 7.60 + 5.98 R 0.0977 }
Equating Equations (17) and (18) leads to a simple relationship between R and R e as:
R = ( 0.0569 + 1.23 R e 0.0748 ) 10.24
Larsen and Fuhrman [37] used a similar method to recognize the location where the depth-limited condition is satisfied in their numerical simulations for propagation and run-up of full-scale tsunamis using a Reynolds-averaged Navier–Stokes model.
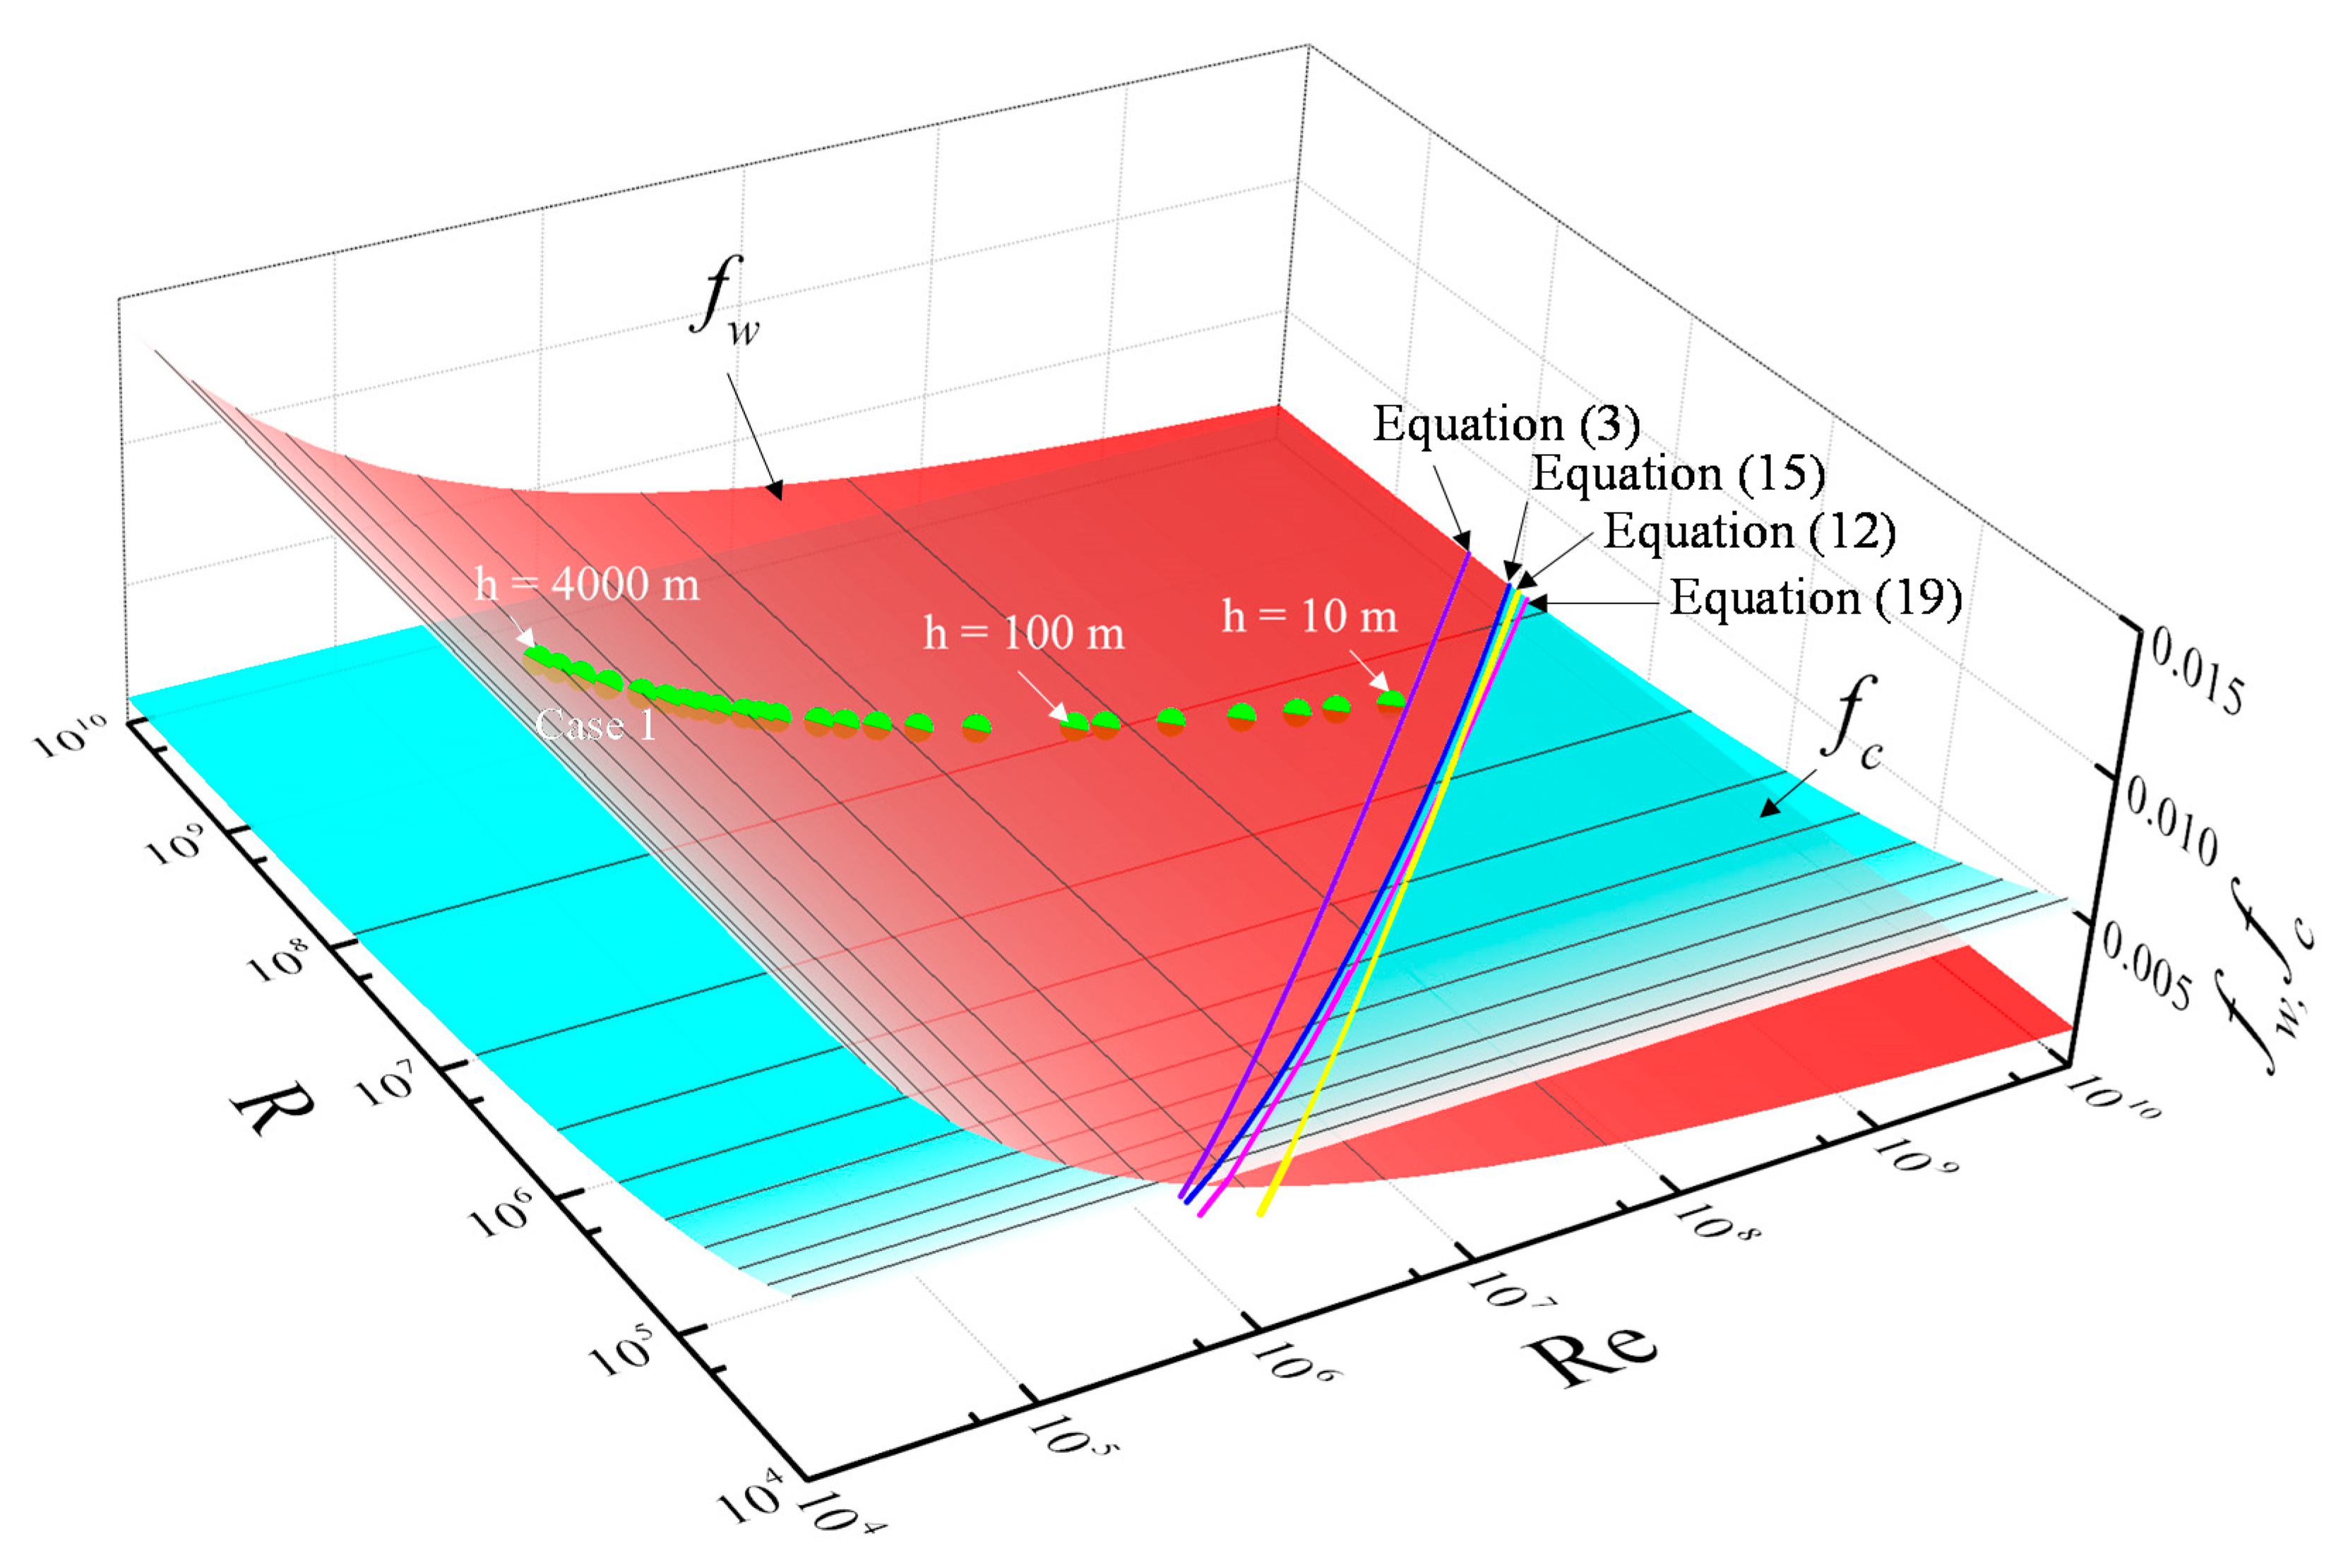
Figure 2 shows a bird’s-eye view relationship between two friction coefficients, Equations (17) and (18), in which Equation (19) can be observed as an intersection of the two surfaces of f w and f c . In addition, Equations (3), (12) and (15) are plotted in R e R coordinates for comparison. It is confirmed that these four equations, which have been derived from totally different approaches, gives a remarkably similar relationship between R and R e . The plots on the f w plane for Case 1 will be explained later in Section 4.5.
Again, Equation (19) is further modified so that the demarcation is expressed in term of R e δ and h / δ s :
h δ s = ( 0.0569 + 1.30 R e δ 0.150 ) 10.24 / R e δ

3. Data Collection and Numerical Analysis Using the k-ω Model

3.1. Data Collection

To validate the criteria for the depth-limited condition from the different approaches, data collection has been made from various sources.
Kaptein et al. [32] carried out a numerical simulation of LES and NDS to investigate the effect of the water depth on the development of tide-induced wave boundary layers. Table 1 summarizes the numerical computation conditions by Kaptein et al. [32]. Using Equations (8) and (9), R e δ and h / δ s values in Kaptein et al.’s [32] numerical simulation are converted to R e and R , as shown in Table 1. In this table, open and closed circles correspond to non-depth-limited and depth-limited conditions, which have been recognized from their computation results for velocity distribution, bottom shear stress, and turbulence intensity.
Meanwhile, Knight and Ridgway [25] and Larsen et al. [27] conducted an open channel experiment and obtained flow velocity distribution in tide- or tsunami-induced boundary layers. The nature of depth-limited or non-depth-limited can be classified from the measured flow velocity as illustrated in Table 1.
Laboratory experiments for a non-depth-limited wave boundary layer over a smooth bottom have been more extensively performed including Hayashi and Ohashi [38], Hino et al. [39], Jensen et al. [16], and Sawamoto and Sato [40]. Their experimental conditions in terms of R e δ and h / δ s , or an equivalent relationship between R e and R , are summarized in Table 1. Unlike Knight and Ridgway. [25] and Larsen et al. [27], these experiments have been carried out using an oscillating tunnel without a free surface. Therefore, half of the height of a closed conduit is assumed to be equal to the water depth h .

3.2. Numerical Analysis Using a Turbulence Model

In addition to collecting data from previous researches, numerical analysis using a two-equation turbulence model is conducted so that a more comprehensive investigation can be made by combining with the experimental data listed in Table 1.
The following linearized boundary layer equation will be used in the present study:
u t = 1 ρ p x + 1 ρ τ z
where u: the velocity in the boundary layer, t: the time, p: the pressure, ρ: the fluid density, x, z: the horizontal and vertical coordinates, and τ: the shear stress. The pressure gradient in Equation (21) under non-depth-limited condition is obtained from the free stream velocity, U, with the time-variation, U = U m sin ( σ t ) (e.g., Jonsson [2,13]):
1 ρ p x = U t = U m σ   c o s ( σ t )
Meanwhile, after reaching the depth-limited condition, free stream velocity is absent in the vertical direction, and consequently the assumption of the boundary layer cannot be applied. Instead, the pressure gradient term in Equation (21) is evaluated using the linearized shallow water equation with the assumption of hydrostatic pressure distribution (e.g., Proudman [41], Kajiura [34], Johns [29]):
1 ρ p x = g η x = U 0 t = U 0 m σ   c o s ( σ t )
where g: the gravitational acceleration, η: the water surface elevation, U 0 : the depth-averaged velocity, and U 0 m : the amplitude of U 0 . From Equations (22) and (23), the same form of equation can be used for the present numerical simulation. In addition, we can assume U m = U 0 m under the long wave condition as employed by Tinh and Tanaka [18].
Various types of turbulence model have been applied to oscillatory boundary layer such as mixing-length theory [42], the Reynolds stress model [43,44,45], one-equation turbulence model [46], low-Reynolds number k-ε model [47,48,49], high-Reynolds number k-ε model [50,51], k-ω model [31,48,52], and direct numerical simulation [53,54]. In recent years, the k-ω model has been widely utilized by many researchers, as it can simulate a variety of turbulent flows, including steady and unsteady boundary layer flows, free shear flows, etc. [55]. Hence, considering numerical model accuracy and computational economy, the k-ω turbulence model has been used in the present study. In the numerical computation of the k-ω model, the boundary layer equation is solved along with governing equations for k and ω by using the finite difference method using an implicit scheme [52]. Sufficiently fine mesh size is employed in the immediate vicinity of the bottom, with gradually increasing the mesh spacing in the upward direction [18,56].
The computation cases listed in Table 2 are selected to make up for the deficient range of the Reynolds number of the collected data summarized in Table 1. The recognition of “boundary layer classification” in Table 2 will be explained later in Section 4.1.

4. Results and Discussion

4.1. Numerical Results Using the k-ω Model

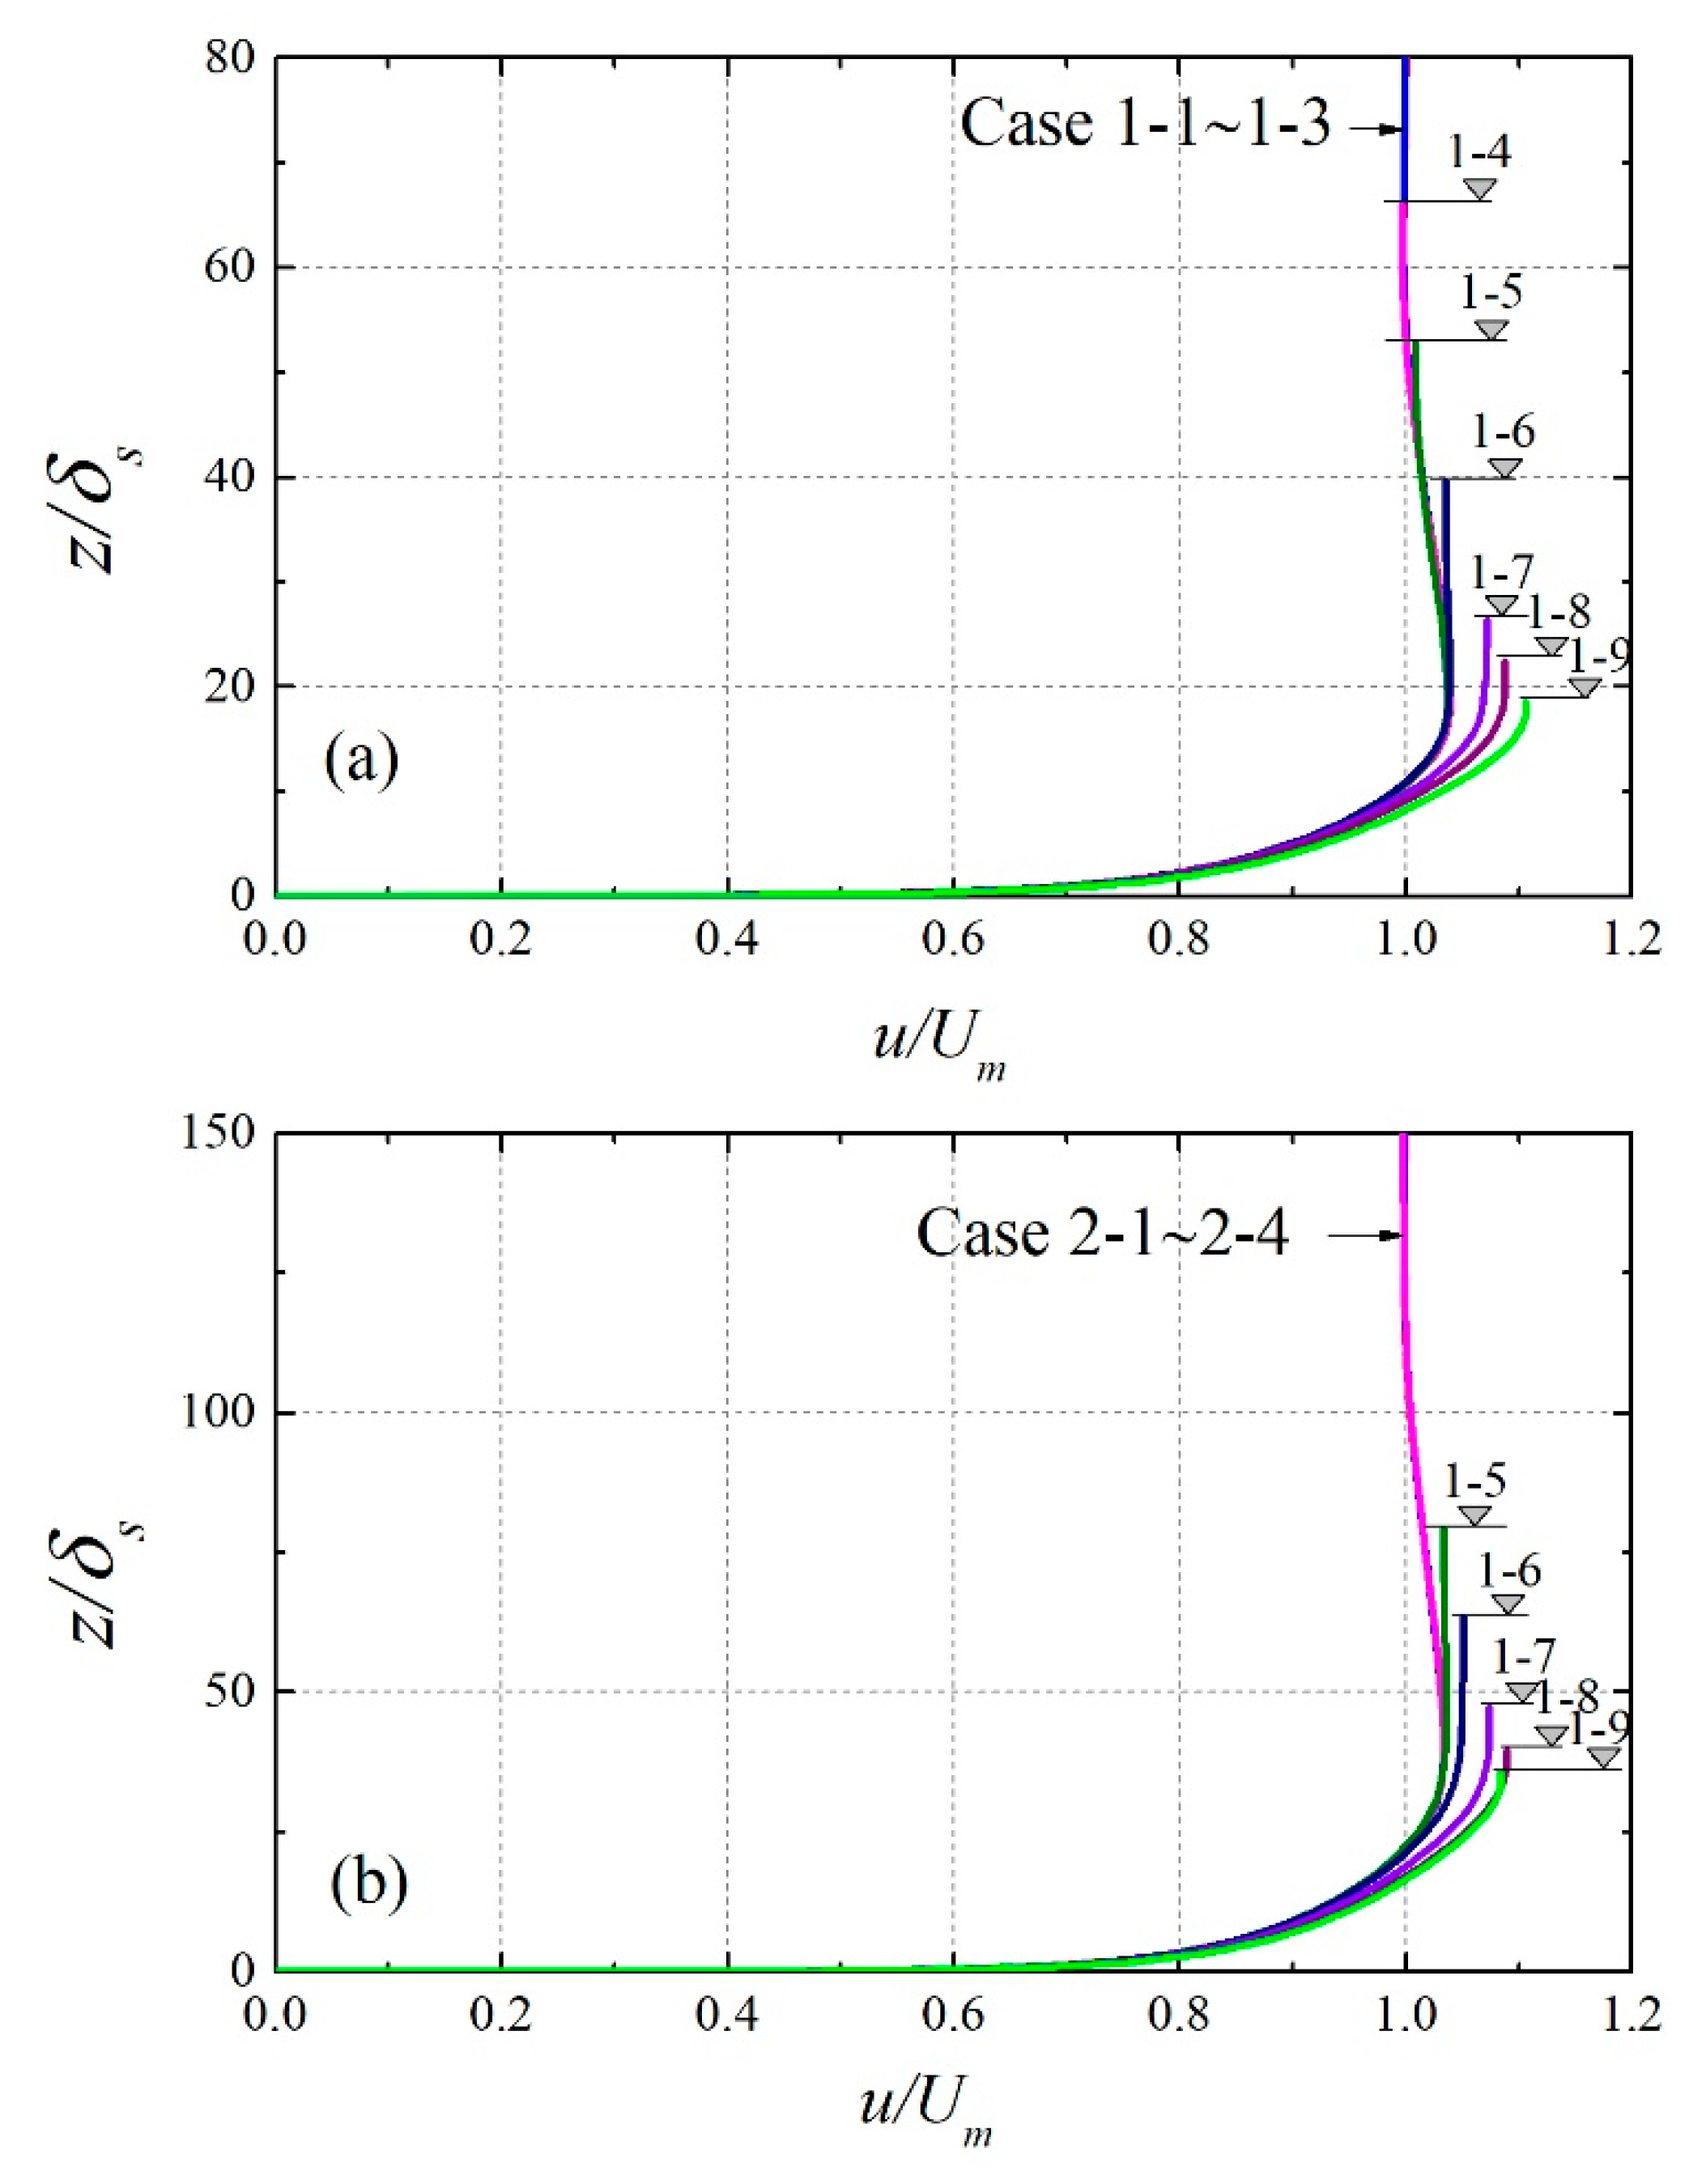
The influence of water depth on the velocity profile under wave crest (σt = π/2) is illustrated in Figure 3. In Figure 3a for Re = 3.51 × 10⁶, the results from Case 1-1 through 1-4 coincide perfectly, whereas the computation results from Case 1-5 through 1-9 shows a distinct influence of the water depth. Similarly, in numerical simulations for higher Re-value (Re = 1.99 × 10⁷) shown in Figure 3b, the water depth affects the velocity profile with the decreasing R value.
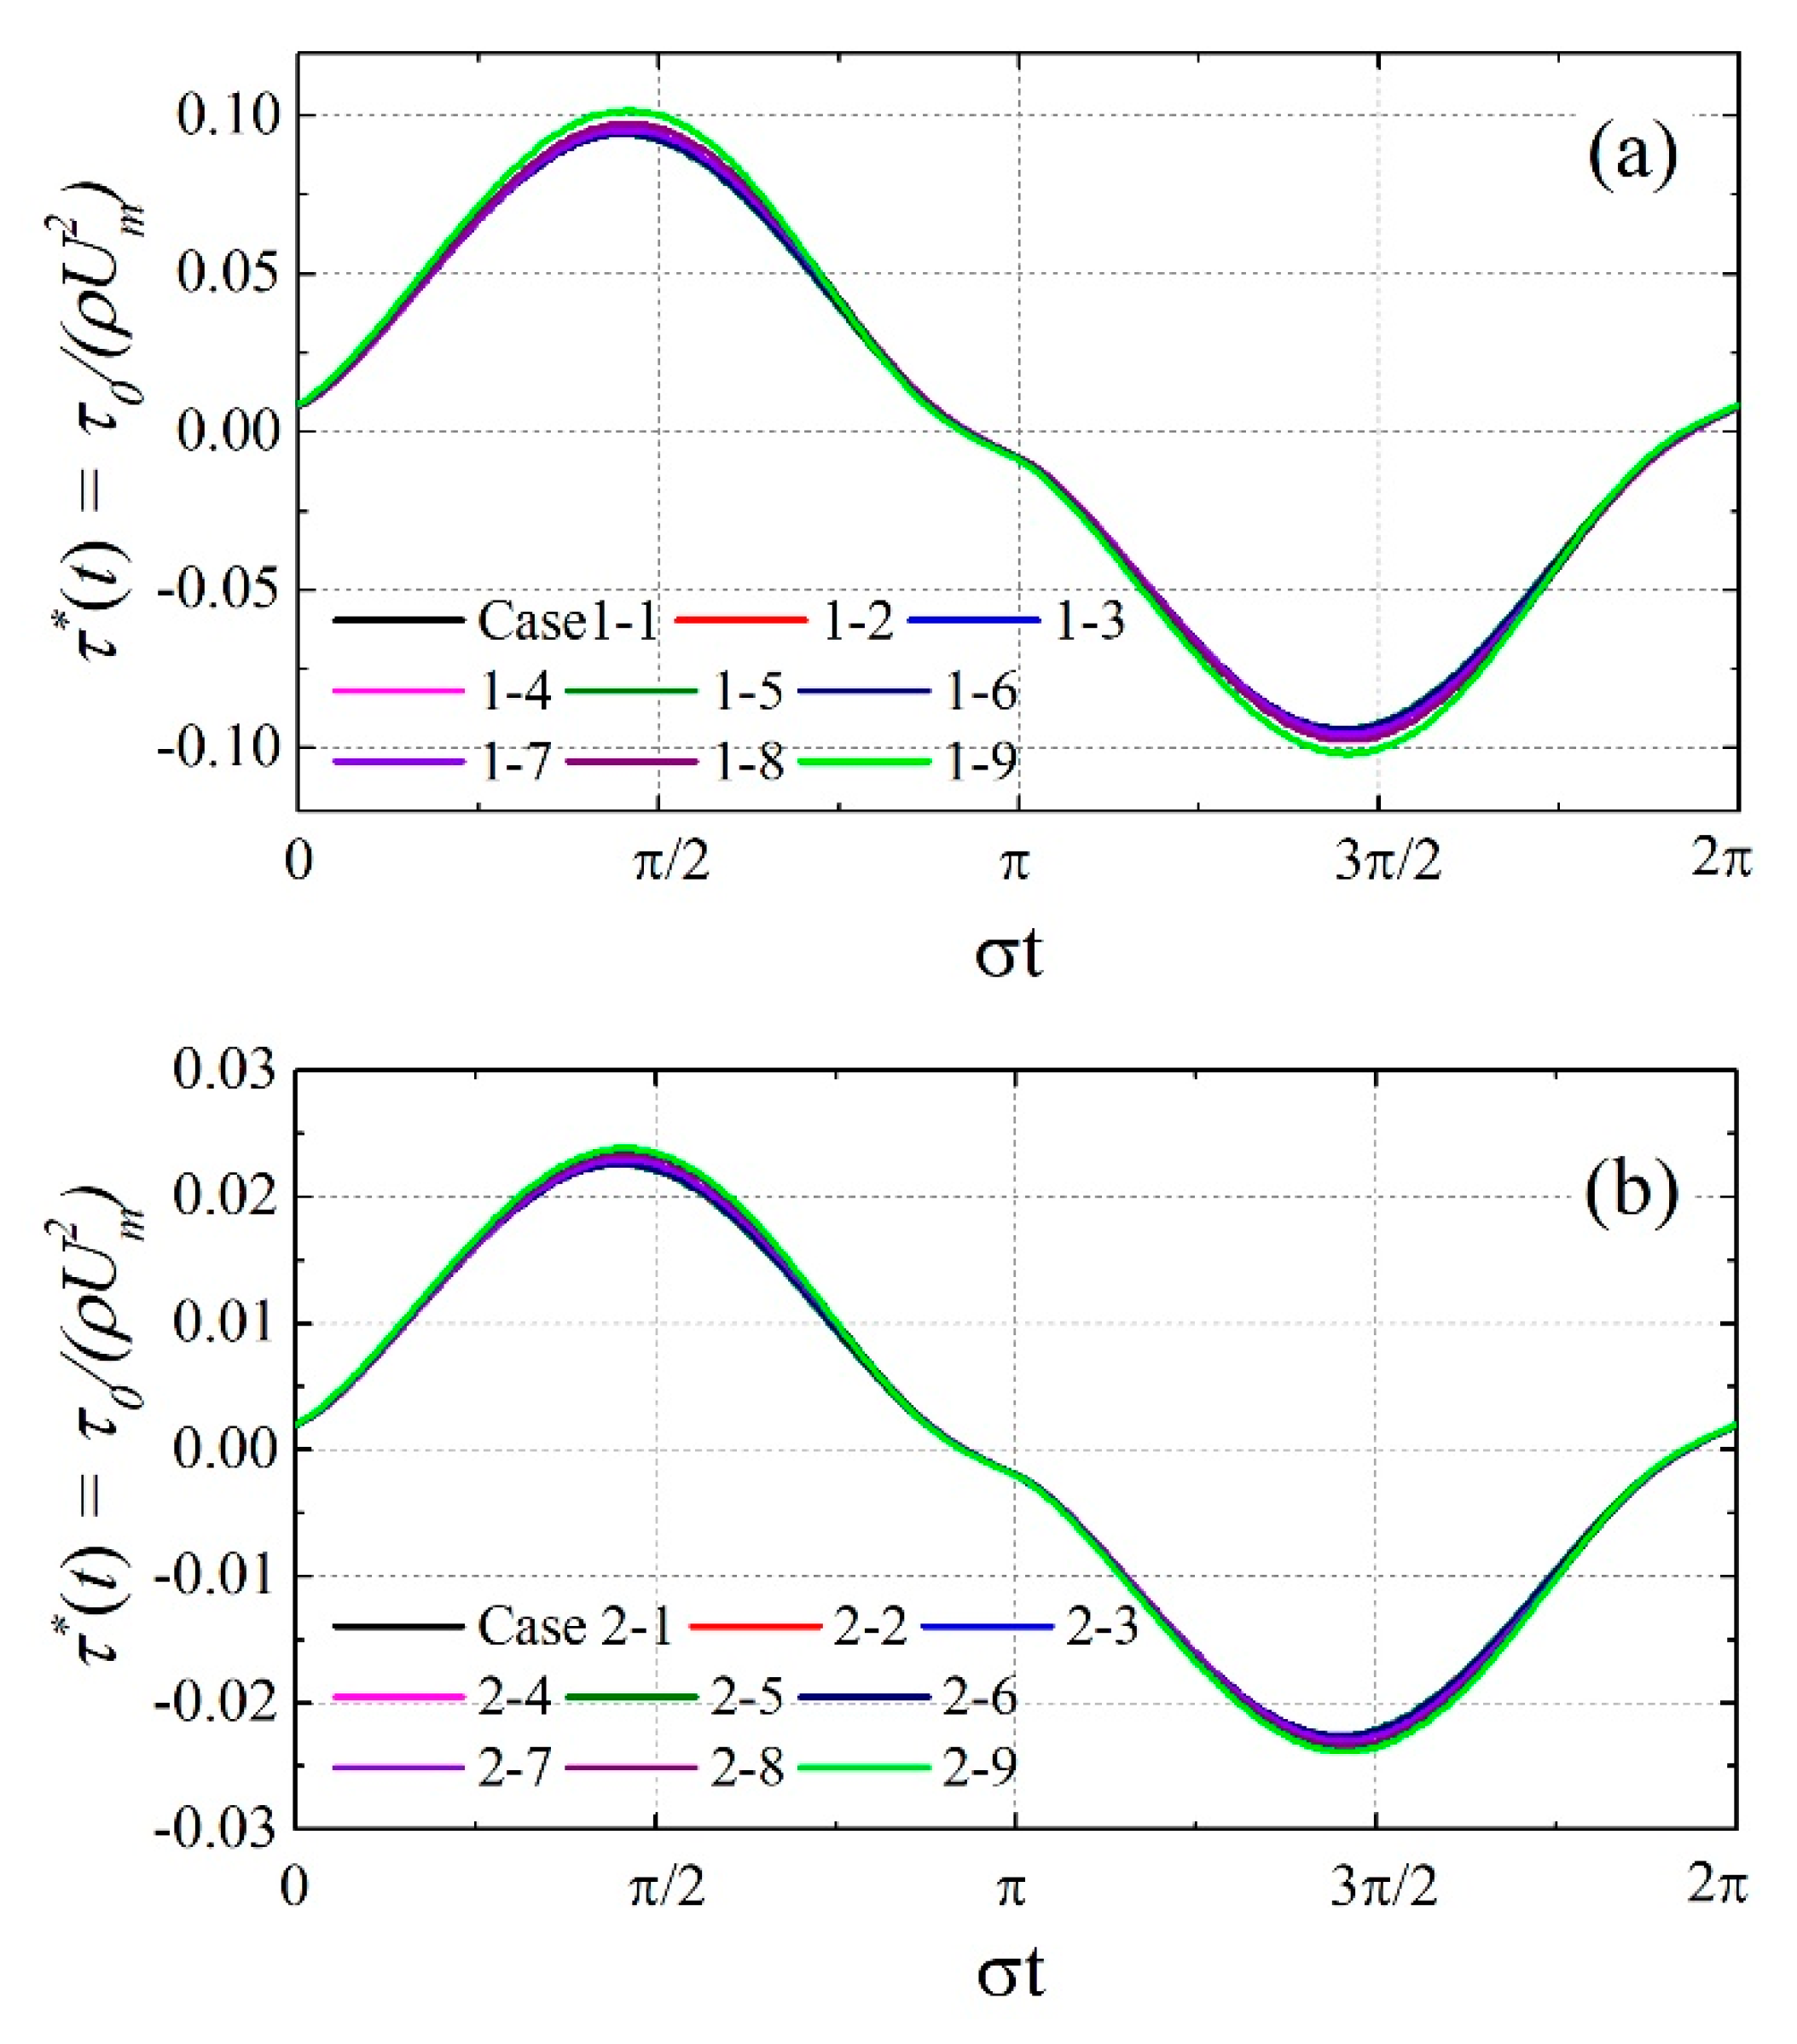
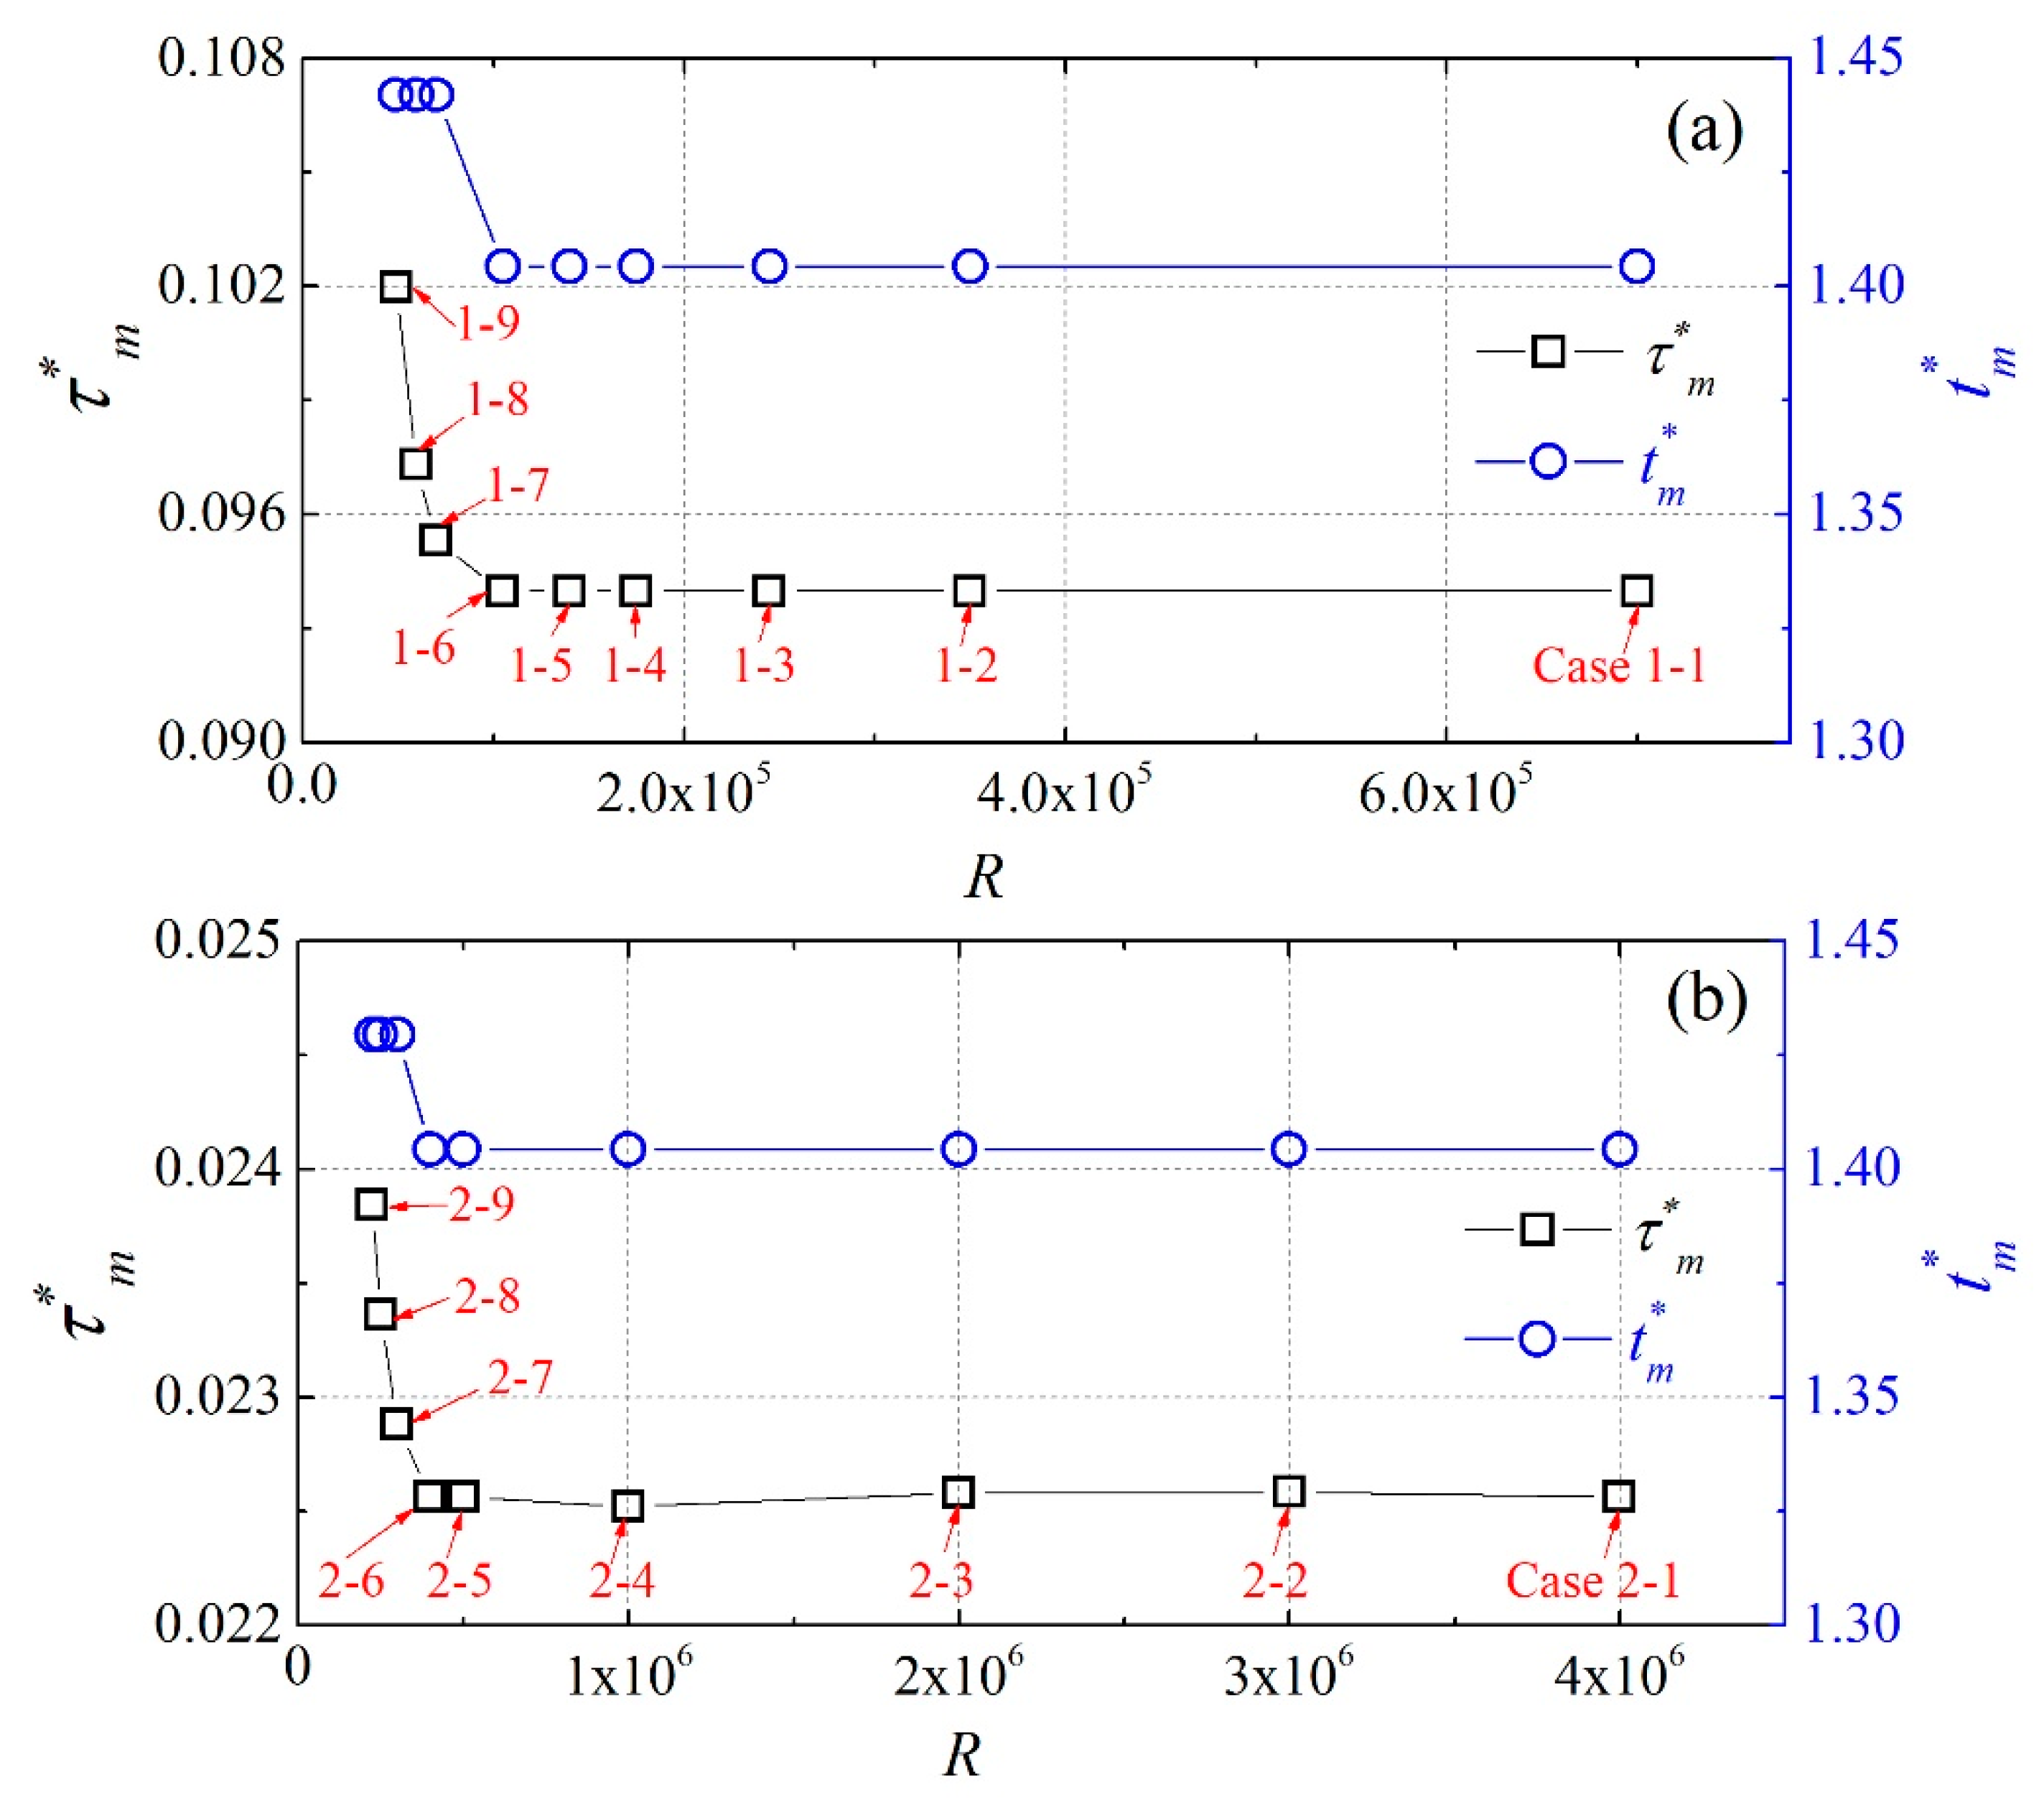
In Figure 4, the bottom shear stress is shown in a dimensionless form normalized by ρUm2. Similar to Figure 3, a slight change in time-variation of bottom shear stress is observed with decreasing R value. However, transitional behavior in response to the R value is not clearly visible in this diagram. In order to make a closer inspection of the transitional behavior in the shear stress in Figure 4, Figure 5 is plotted as a relationship between τ*m (the maximum shear stress), t*m (the time when τ*m appears), and R. From these diagrams, the transition can be observed between Case 1-6 and Case 1-7 in Figure 5a, whereas it is between Case 2-6 and Case 2-7 in Figure 5b. Thus, the boundary layer classification is made as summarized in Table 2 using open and closed symbols.
.

4.2. Validation of Proposed Criteria by Using the Collected Data and k-ω Model Computations

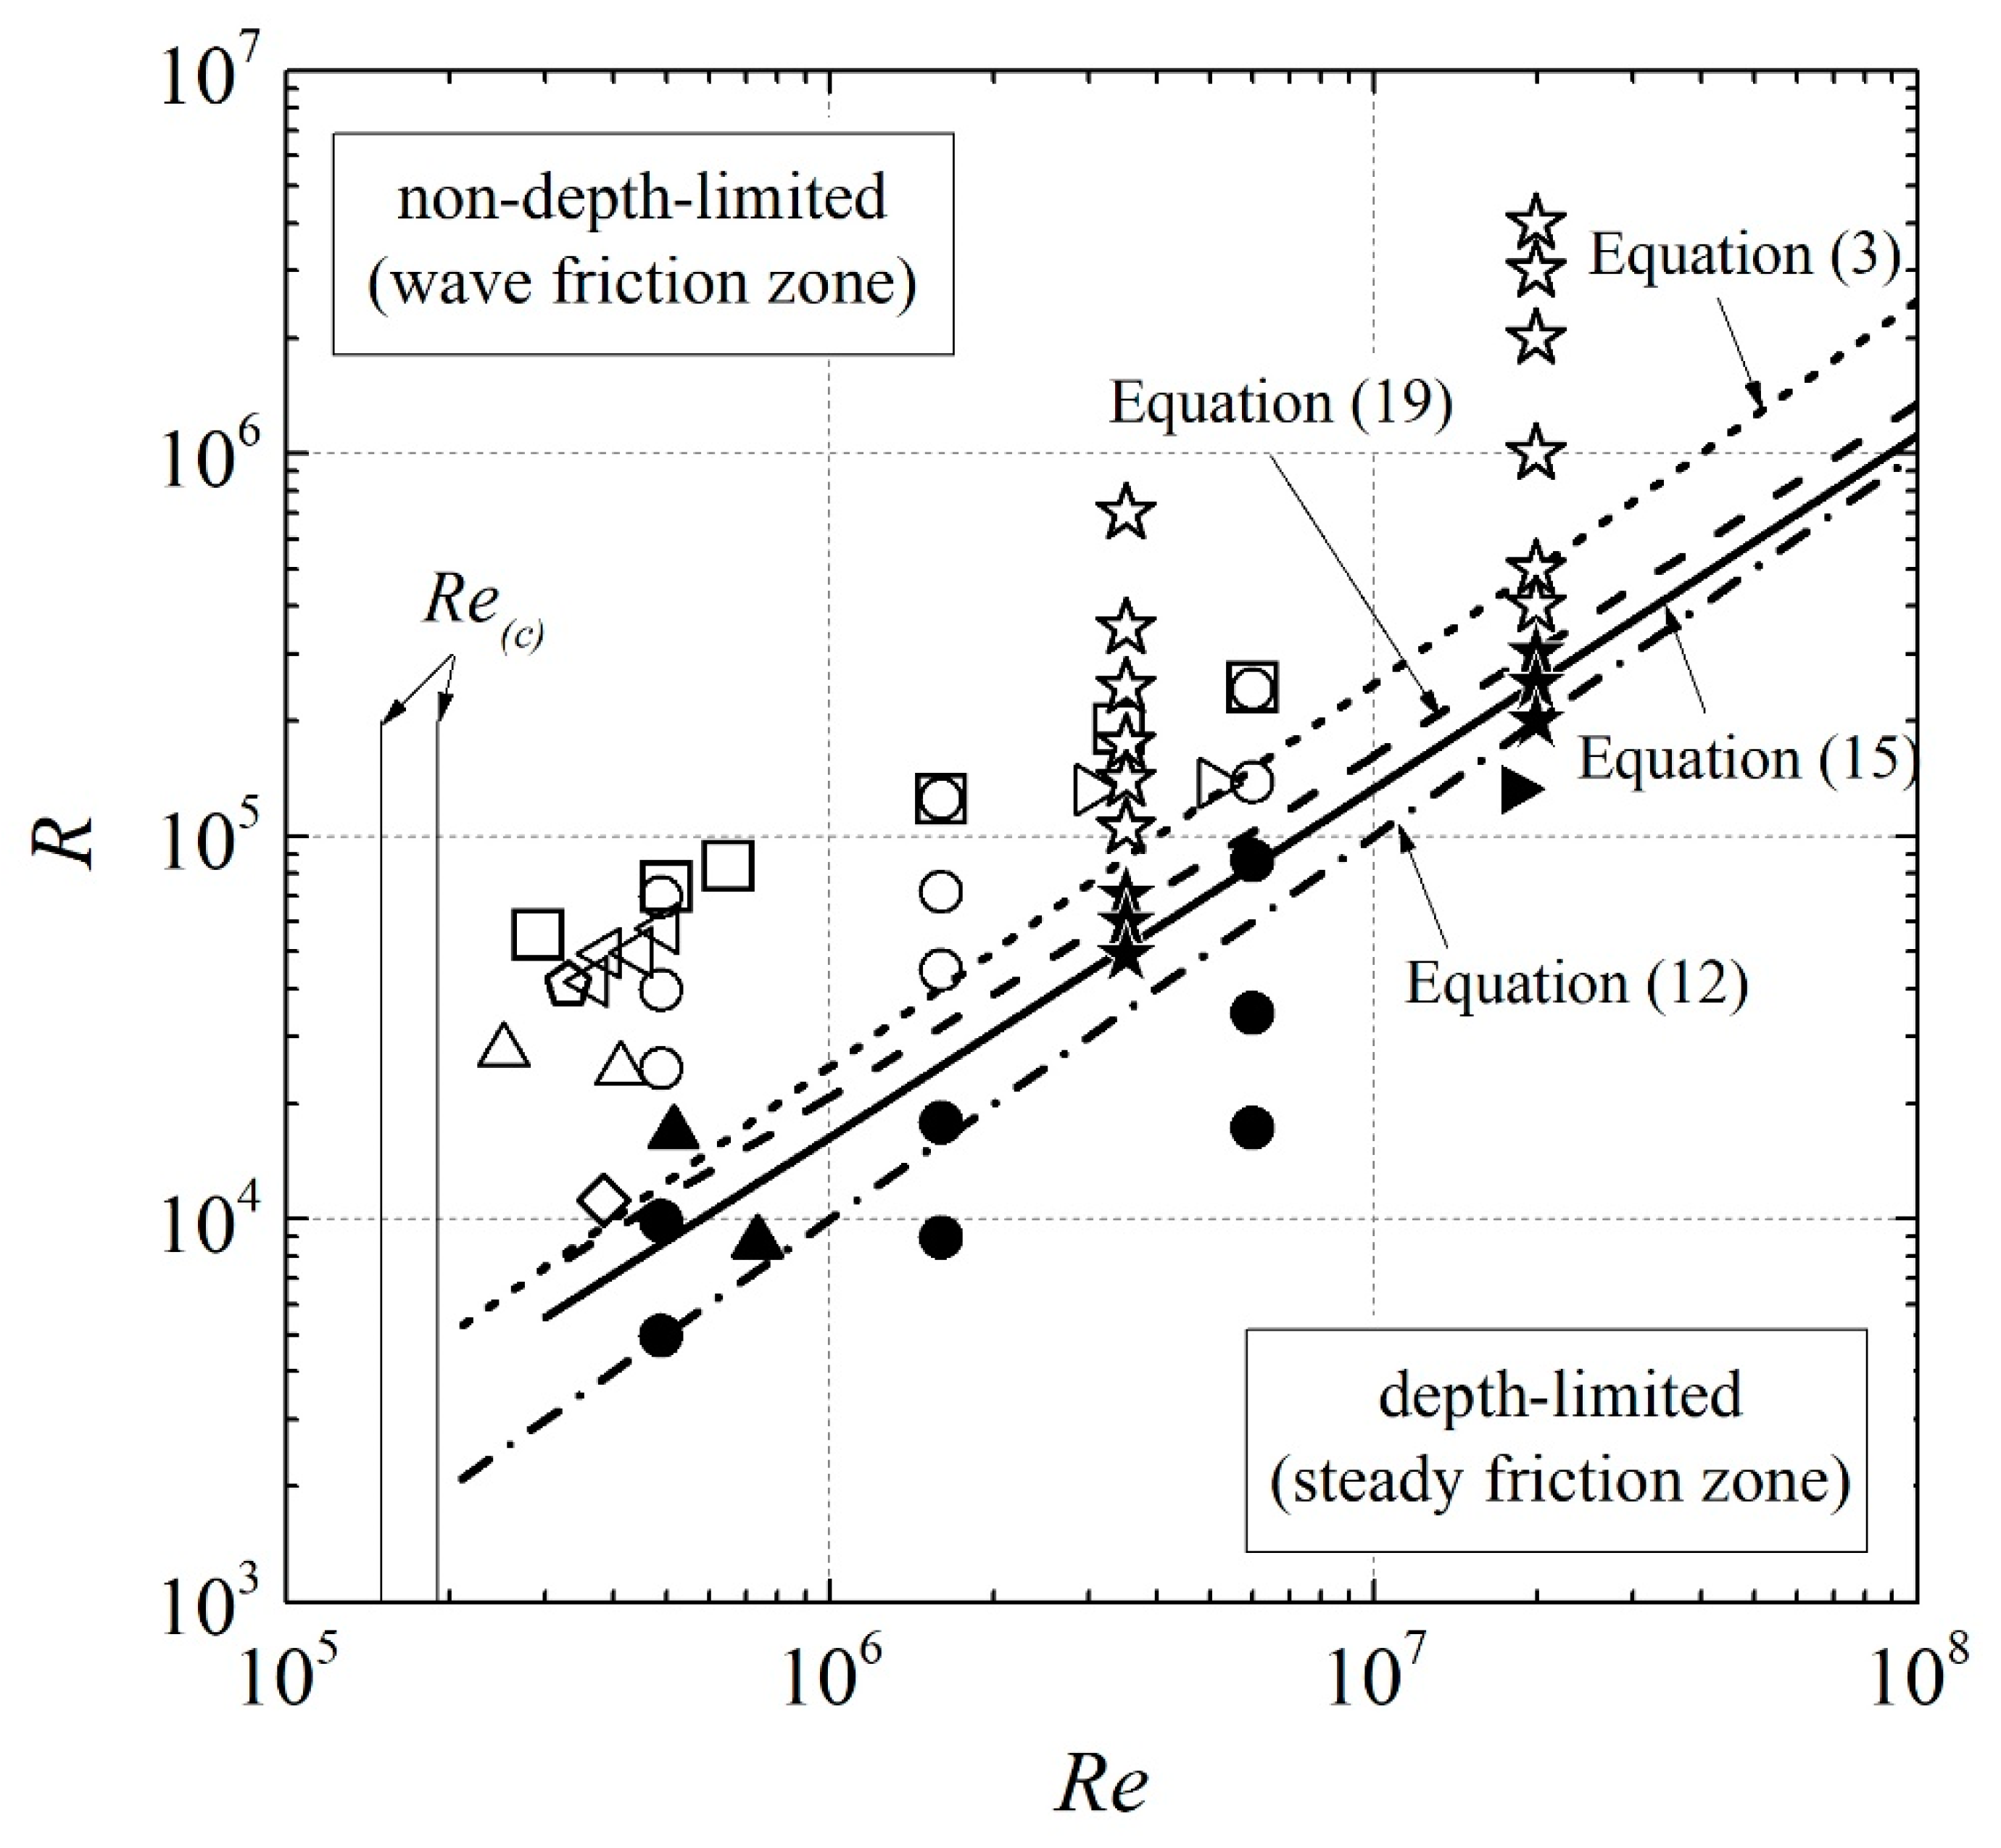
The numerical and experimental data sets summarized in Table 1 and Table 2 are plotted in Figure 6, as a relationship between R e and R , along with the four demarcations, Equaions (3), (12), (15), and (19). Tanaka and Shuto [57] experimentally proposed a critical Reynolds numbers Re(c) for the transition from laminar to turbulence in an oscillatory boundary layer, Re(c) = 1.9 × 10⁵, while Sumer and Fuhrman [55] proposed a slightly lower value, Re(c) = 1.5 × 10⁵. It is confirmed that the whole data plotted in Figure 5 are higher than these critical values for the transition to turbulence.
From Figure 6, it is concluded that the results from the present k-ω model computations are entirely consistent with other results summarized in Table 1. In addition, it is confirmed that Equations (15) and (19) are more suitable as a demarcation line for recognition of non-depth-limited and depth-limited conditions, as compared with Equations (3) and (12).
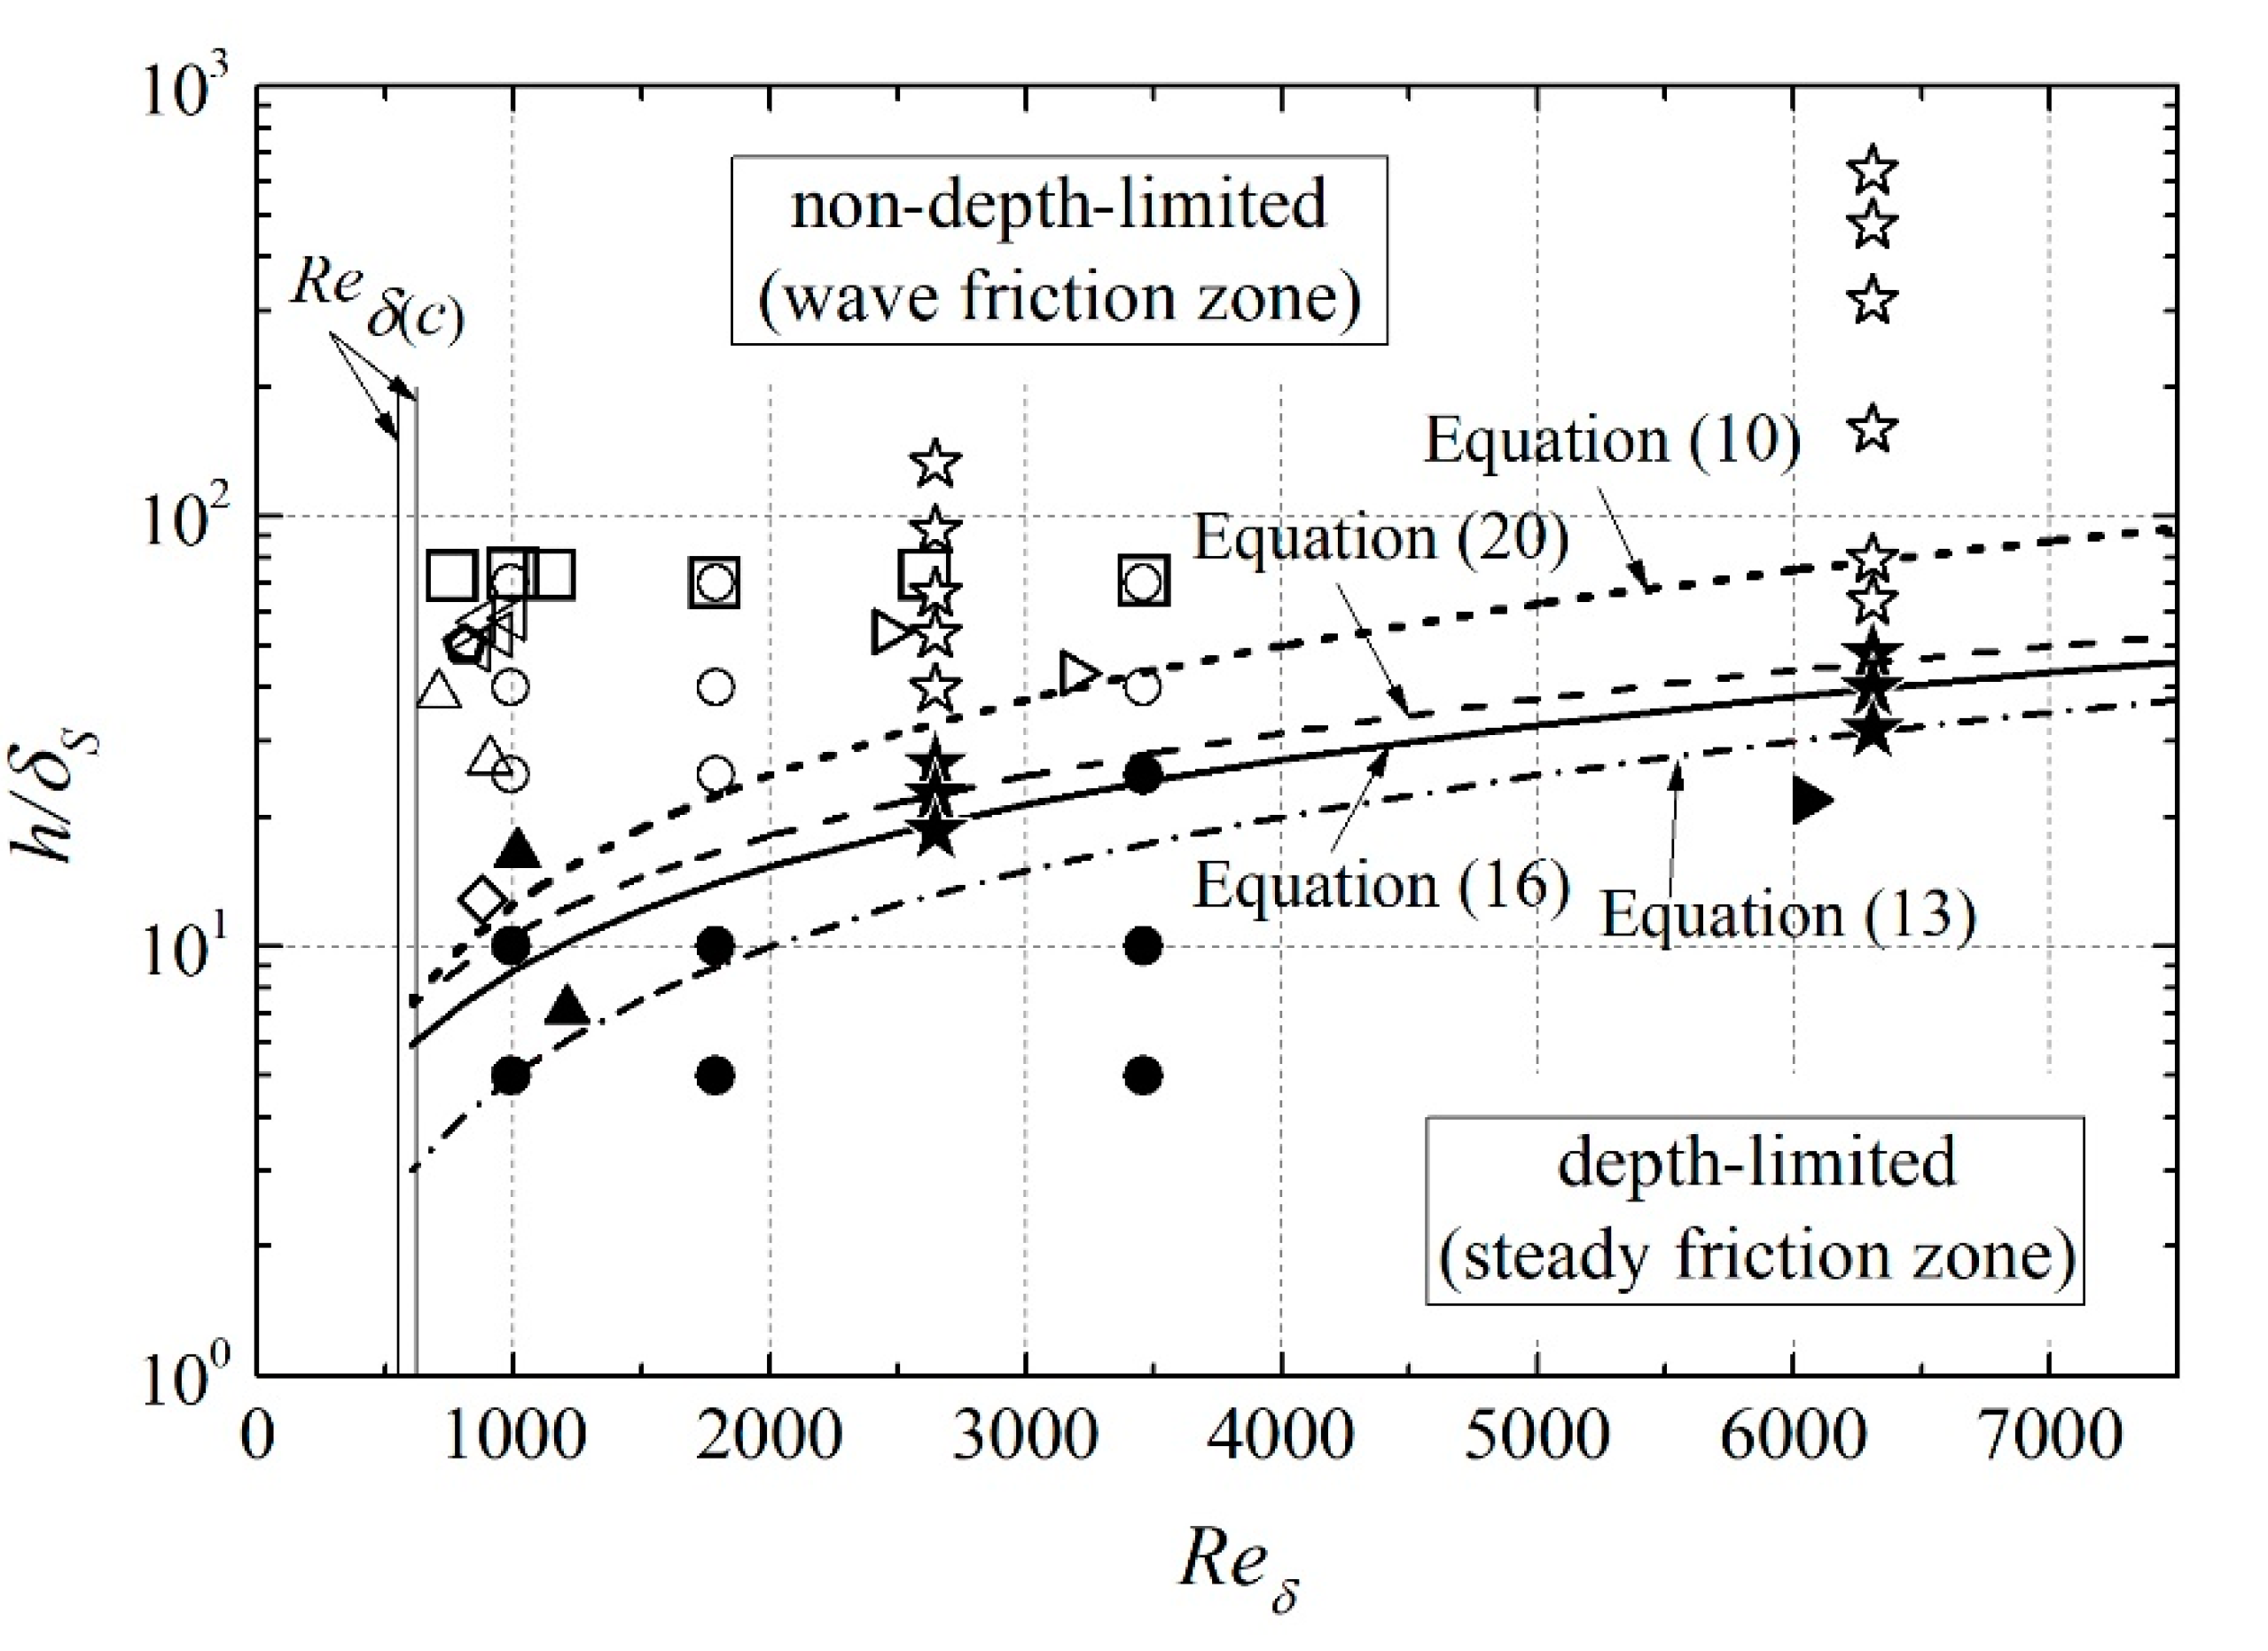
Similarly, Figure 7 is obtained as an equivalent relationship between R e δ and h / δ s as employed by Kaptein et al.’s [32], together with corresponding demarcations, Equtions (10), (13), (16), and (20). Again, the critical Reynolds numbers for transition to turbulence proposed by Tanaka and Shuto [57] and Sumer and Fuhrman [55] are shown in the diagram in terms of R e δ ( c ) (=620 and 550) by converting from Re(c) using Equation (8). As a demarcation line, Equations (16) and (20), modified from Equations (15) and (19), are more suitable.

4.3. Application to the Rhine Estuary

Kaptein et al. [32] reported Van der Giessen et al.’s [58] field observation results of tide-induced boundary layer development in the Rhine River Estuary, the Netherlands. The measurement results are summarized in Table 3, in which the boundary layer thickness δ is calculated using Equation (14) for smooth bottom proposed by Tanaka et al. [23]. Judging from δ / h ratio in Table 3, it is clear that the tide-induced boundary layer in the Rhine Estuary is under depth-limited condition. This result is confirmed in Figure 8 by comparing the field data with the demarcation equations.
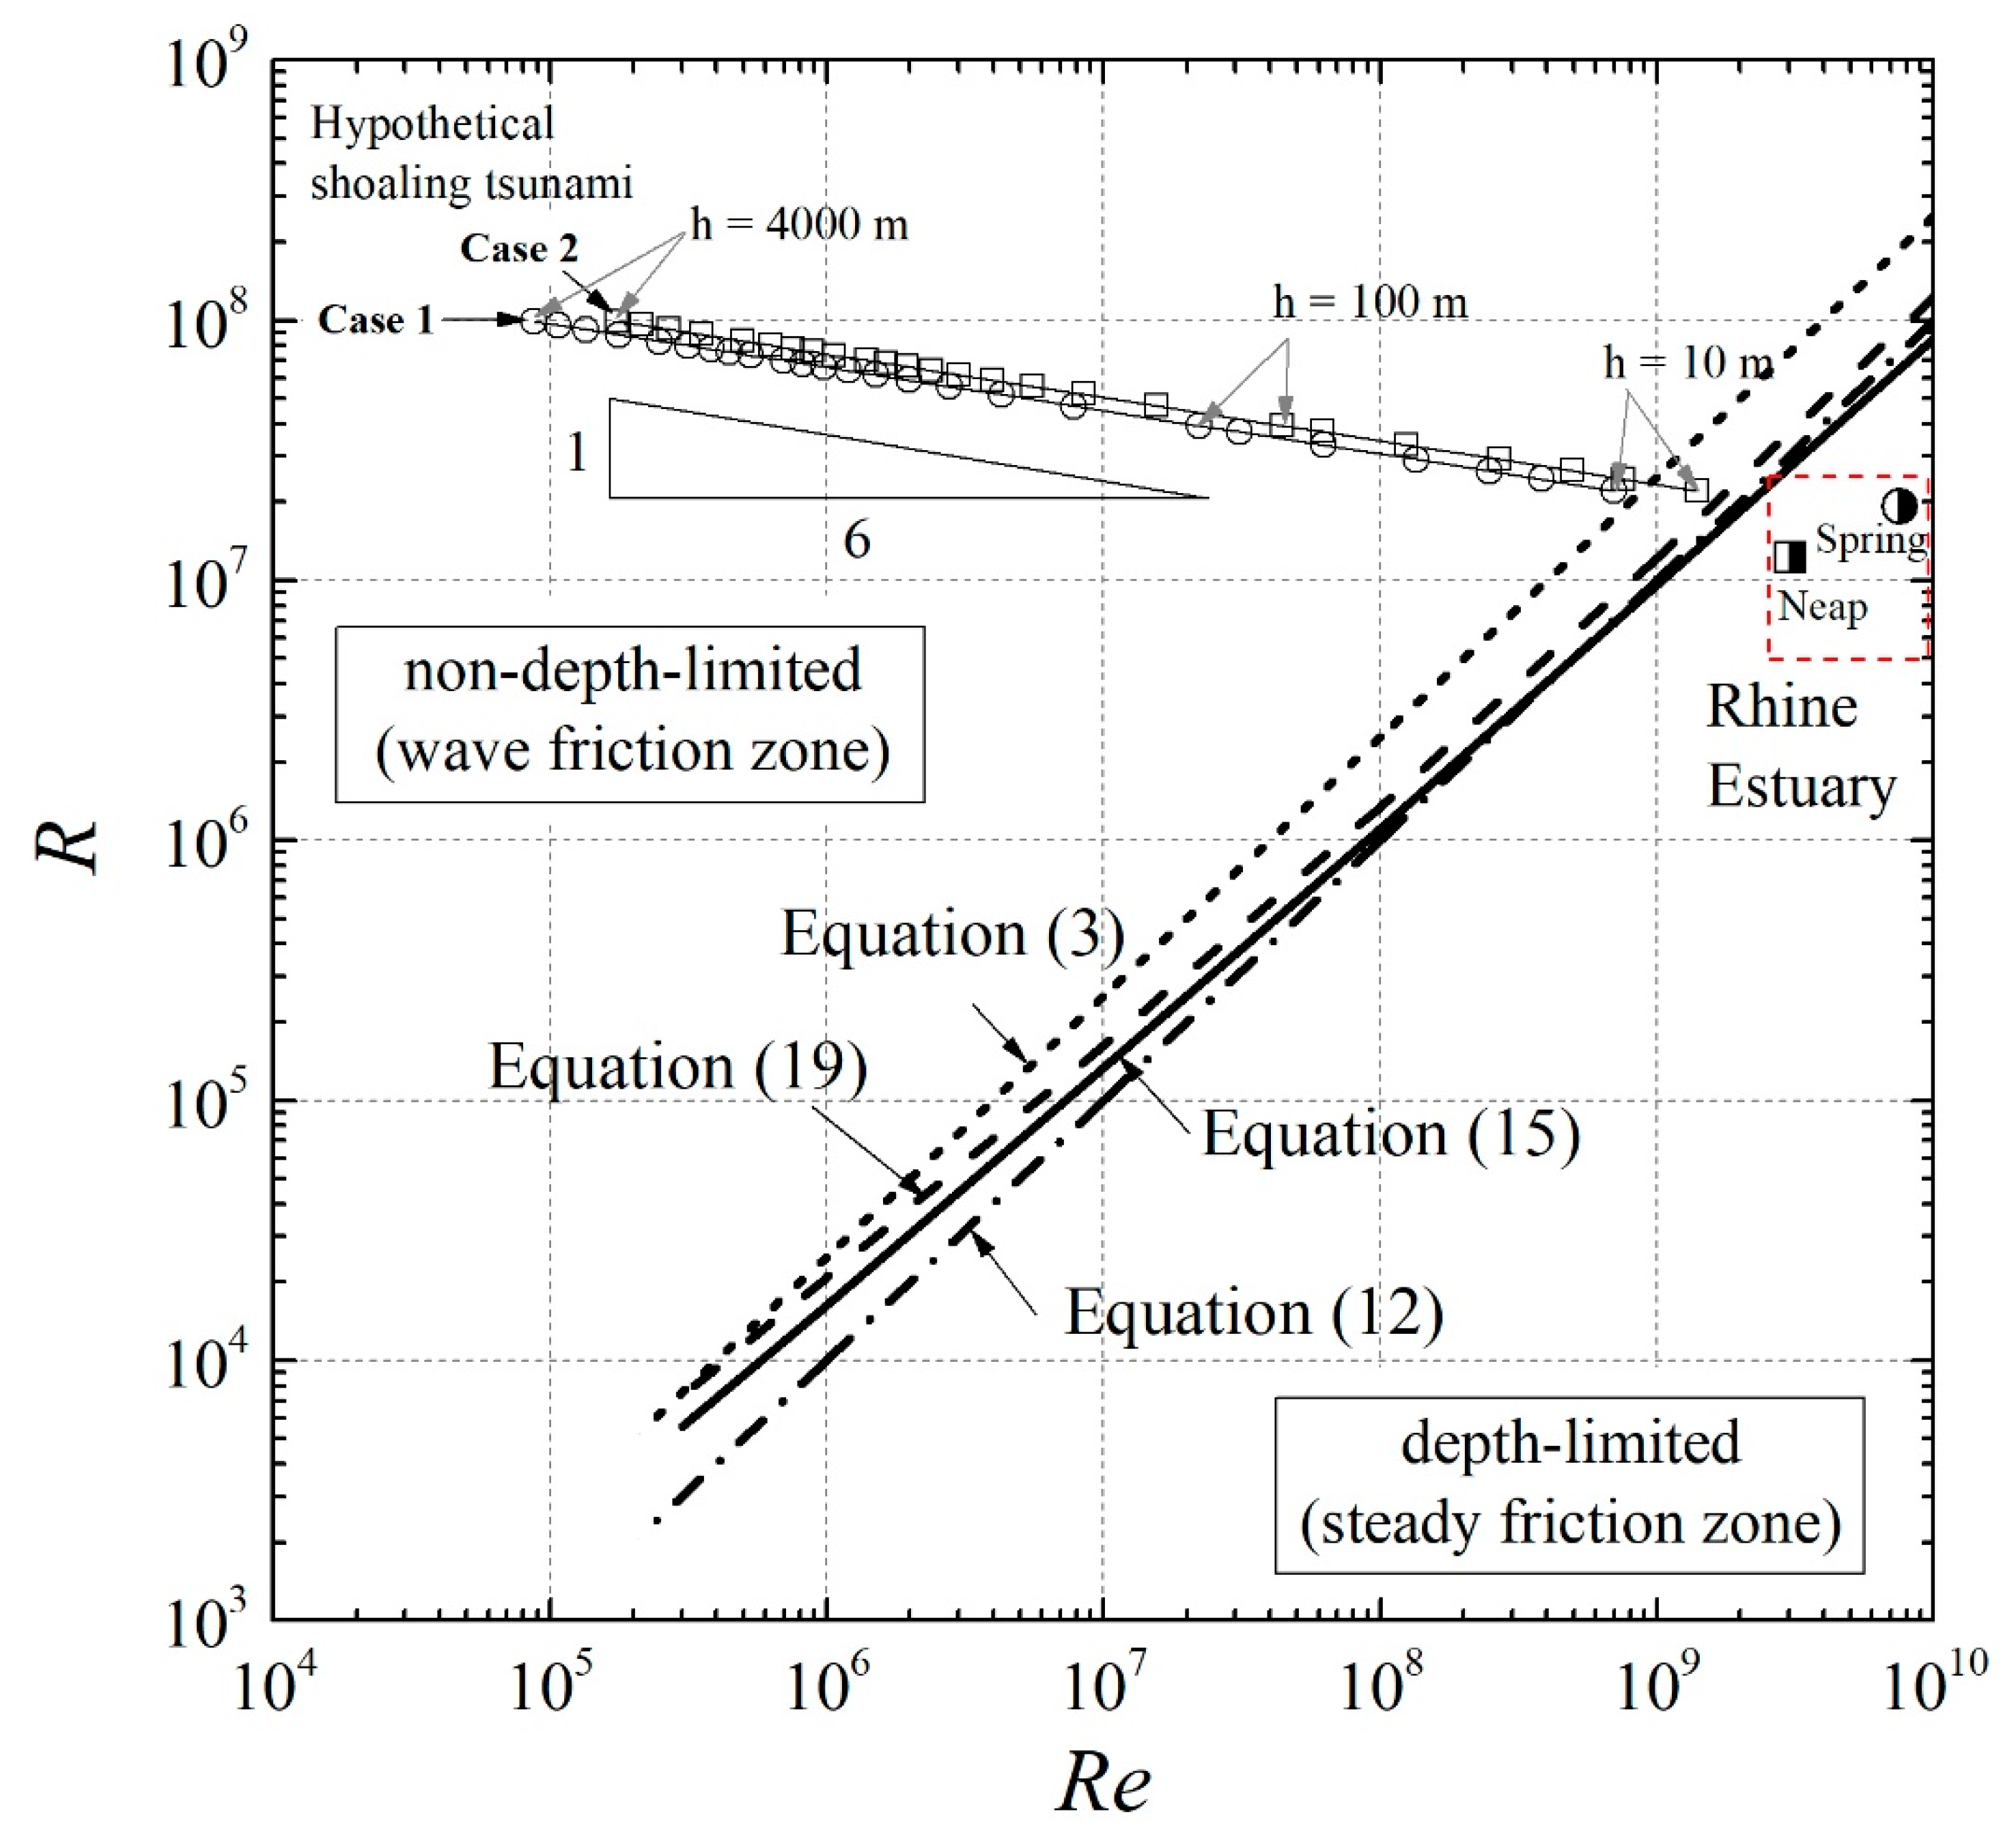
As compared with Figure 6, the range of Re and R is much higher in Figure 7, and it is observed that in the higher range of Reynolds numbers, Equations (12), (15), and (19) give similar demarcation. The plots designated as “shoaling tsunami” will be explained later in detail in Section 4.5.

4.4. Demarcation in Terms of H / h and h / L

In general, the nature of wave motion can be described by using dimensionless quantities such as H / h and h / L , in which H: the wave height and L: the wave length. Hence, it will be of practical convenience to convert the demarcation criteria in terms of R e and R to an expression in terms of H / h and h / L . For this purpose, the following linear long wave theory is used:
U m = H 2 g h
Using Equation (24), h / L and H / h are correlated with R e and R as:
H / h h / L = 4 π R e R
Hence, from Equation (3), we obtain:
H h = 5.03 × 10 2 h L
Equation (26) is shown in Figure 9 with a breaking limit equation. It is noteworthy that even in the region of long waves ( h / L ≤ 0.05), the depth-limited region is confined in the small area located in the left top in Figure 9.
The data obtained in the Rhine River estuary by Van der Giessen et al. [58] is plotted in this diagram. The corresponding wave height H is estimated by using the linear long wave theory, Equation (24). It is again confirmed that the data in the Rhine River estuary satisfies the depth-limited condition in Figure 9, as already depicted in Figure 8.

4.5. Application to a Hypothetical Shoaling Tsunami

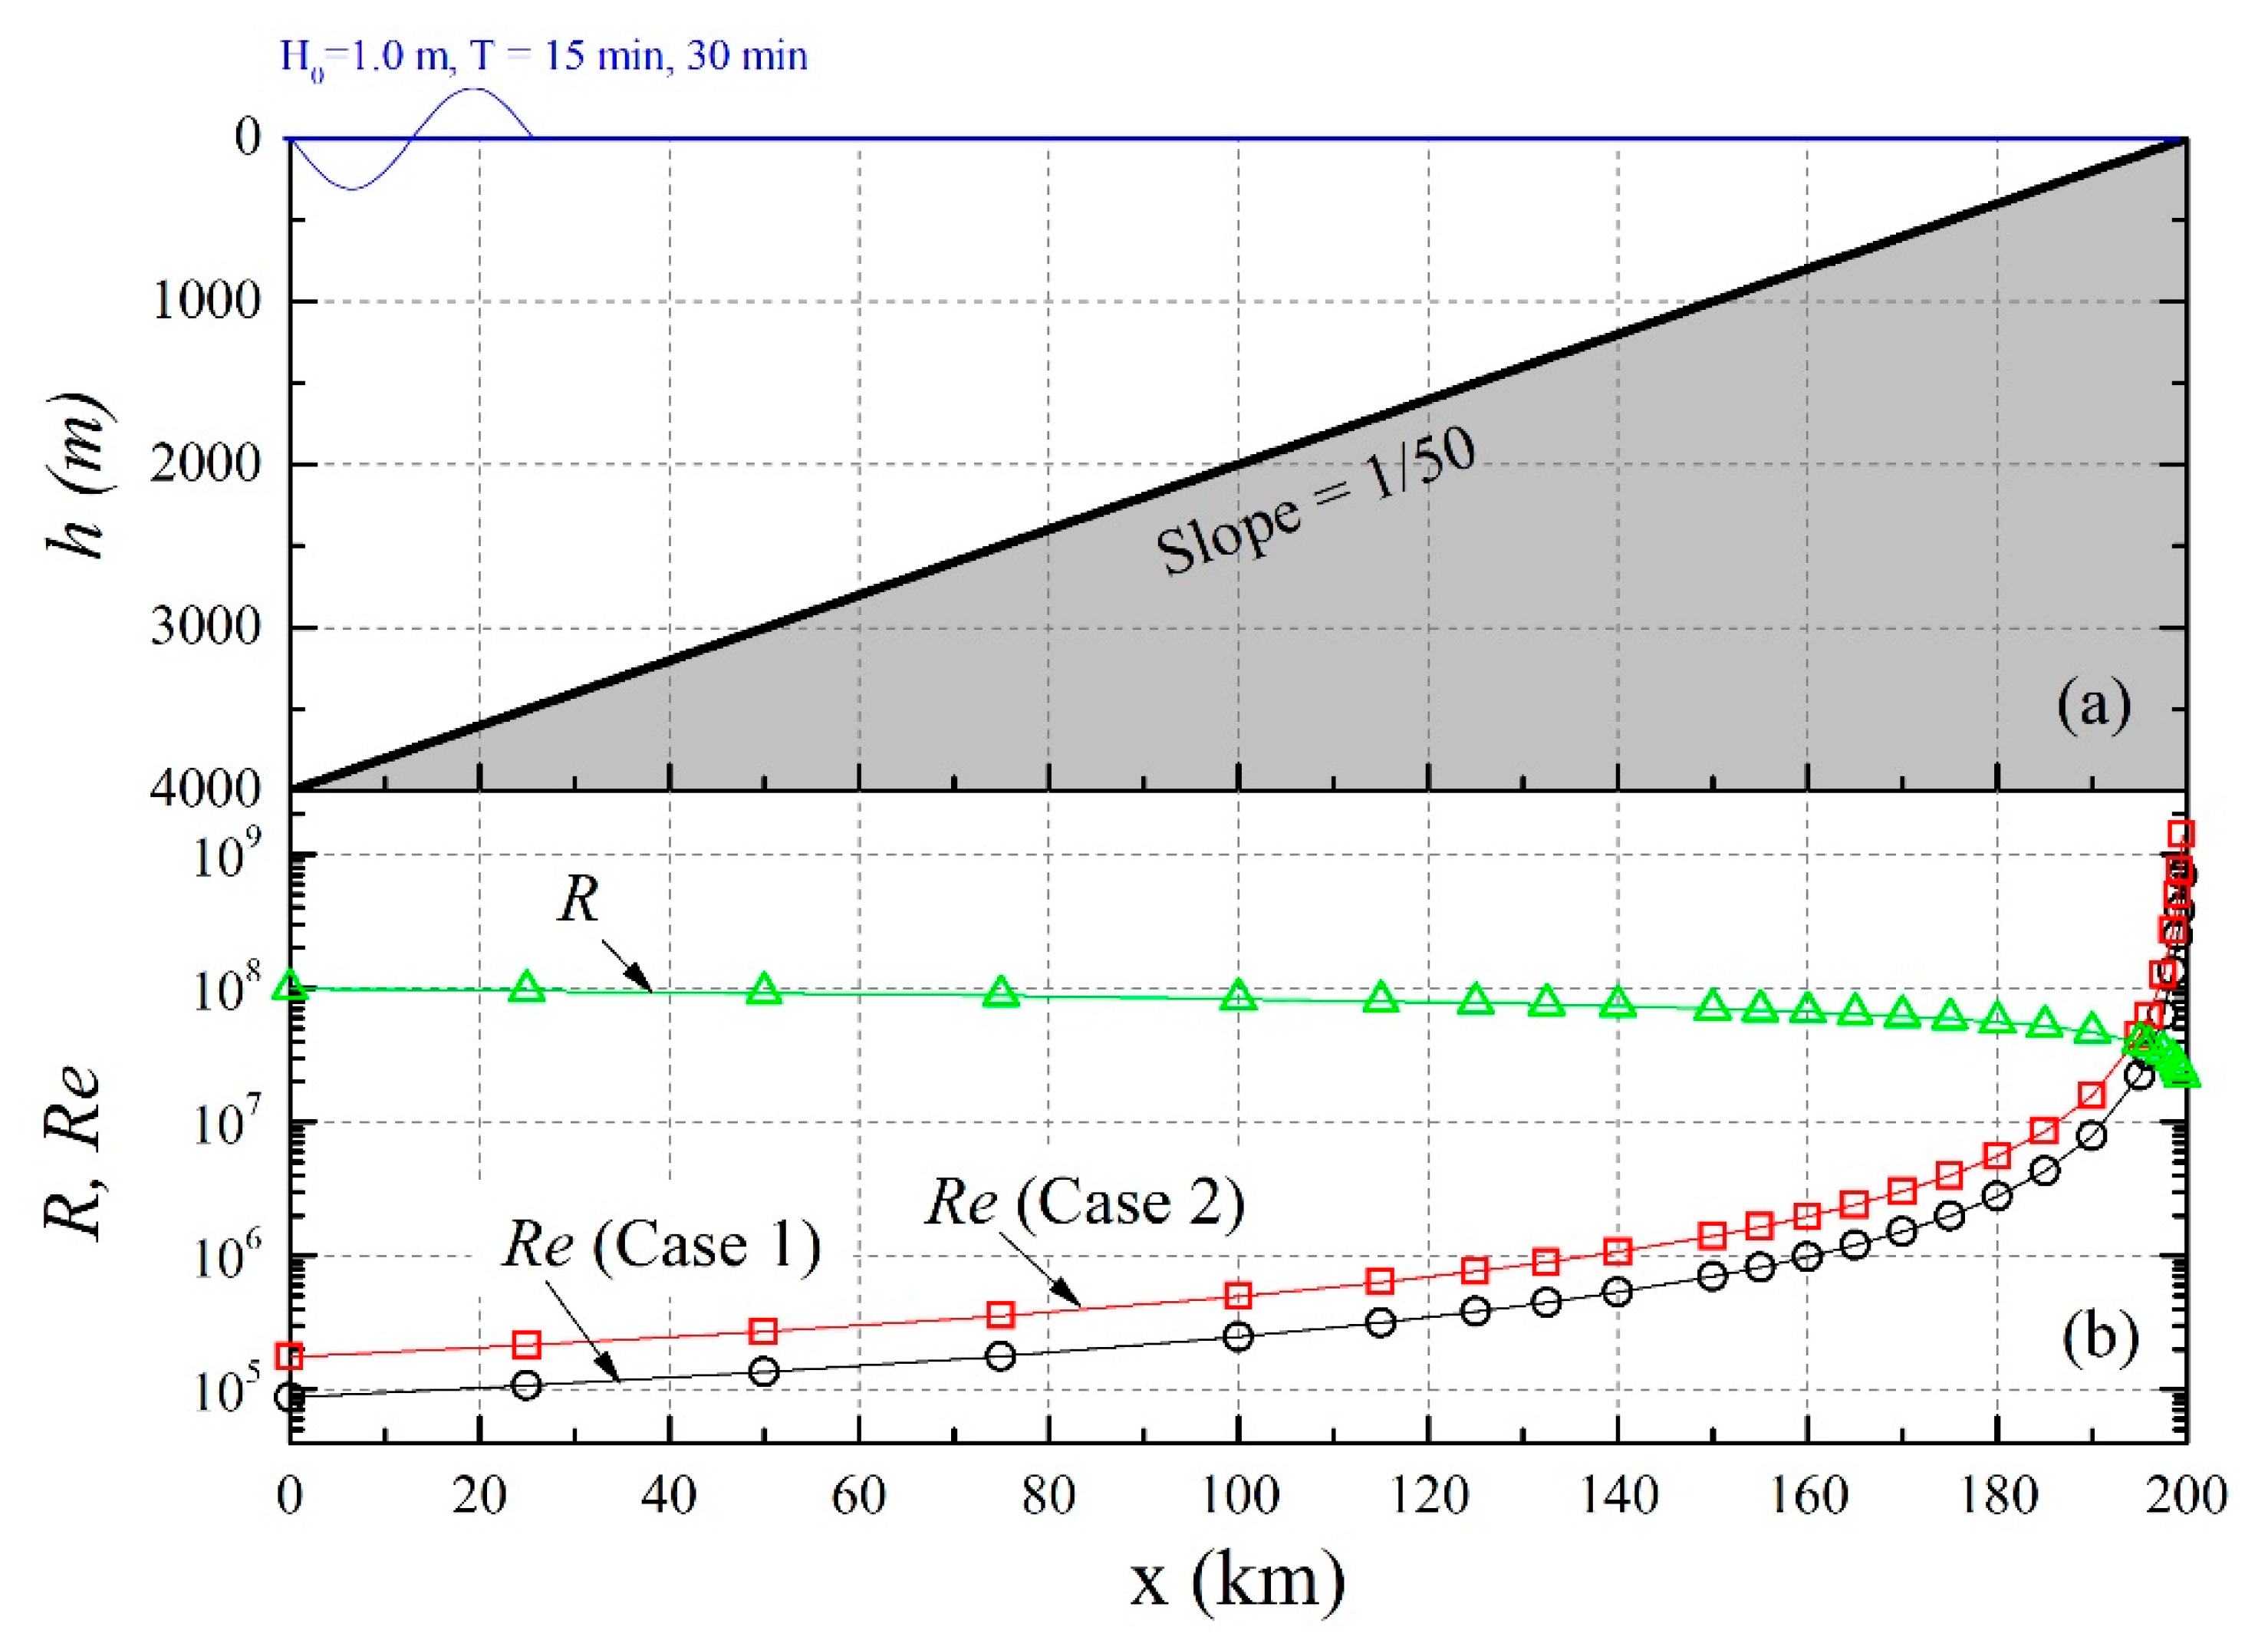
It is interesting to note that the wave period of tsunami is intermediate between wind-generated waves and the tidal motion described above. Therefore, the proposed criteria will be now applied to a hypothetical shoaling tsunami over a uniformly sloping sea bottom as illustrated in Figure 10a. Here, following Tinh and Tanaka [18], we employ hypothetical tsunami source conditions as shown in Table 4 and Figure 10a.
Following Williams and Fuhrman [31] and Tinh and Tanaka [18], the tsunami shoaling process from the source to the shallow sea region is obtained by applying Green’s law:
H = H 0 ( h 0 h ) 1 / 4
where the subscript “0” denotes quantities in the tsunami source area.
Based on Equation (5), the wave Reynolds number in the tsunami source area, R e ( S ) , is obtained:
R e ( S ) = U m 0 a m 0 ν
Meanwhile, the wave Reynolds number Re at an arbitrary location under the shoaling process can be correlated with R e ( S ) defined by Equation (28):
R e = R e ( S ) ( h h 0 ) 3 / 2
Similar to Equation (29), the current Reynolds number R at an arbitrary place during the tsunami shoaling can be correlated with that at the tsunami source, R ( S ) :
R = R ( S ) ( h h 0 ) 1 / 4
where R ( S ) is defined as:
R ( S ) = U m 0 h 0 ν
By eliminating the water depth, h , from Equations (29) and (30), we obtain the following equation for the relationship between R e and R :
R = R ( S ) ( R e R e ( S ) ) 1 / 6
In Figure 10b, the cross-shore variation of Re and R under the shoaling tsunami is plotted. During the shoaling process, Re shows a gradual increase due to the combined effect of an increase of tsunami-induced velocity by Equation (24) and tsunami amplification by Equation (25). Meanwhile, the R value shows a decrease mainly due to the reduction of water depth in Equation (4).
In Figure 8, the interrelationship between R e and R is plotted by open circles for the hypothetical shoaling tsunamis. According to Equation (32), the slope of the line for the tsunami shoaling process is −1/6 as illustrated in Figure 8. In addition, the shoaling process of Case 1 in terms of R e and R is plotted in Figure 2. In both Figure 1 and Figure 7, it is seen that, even at the water depth of h = 10 m, the hypothetical tsunami is located in the region of non-depth-limited region. This result is in good agreement with the field observation result by Lacy et al. [19] during the 2010 Chilean Tsunami.

5. Conclusions

The influence of water depth on the wave boundary layer on a smooth bottom is investigated in this study. The criteria obtained in the present study are expressed in terms of wave and steady current Reynolds numbers, or alternatively in terms of another Reynolds number and a dimensionless water depth using the Stokes layer thickness as a scale length. Among four criteria, theoretical results based on the wave boundary layer thickness and the friction factor yields similar demarcations. In addition, these two theoretical results show good agreement with the collected data from numerical analysis as well as from laboratory experiments. Moreover, the criteria are effectively applied to tidal motion and a hypothetical shoaling tsunami over a smooth bottom.
Since the results presented herein are based on periodical linear wave theory on a flat bottom, modification is required when we apply them to non-linear wave motion over a sloping bottom. For example, Larsen and Fuhrman [37] proposed a method to use time-varying boundary layer thickness by replacing the orbital amplitude with the cumulative distance traveled by a free-stream particle, instead of using a simple relationship for sinusoidal waves, am = Um/σ.

Author Contributions

H.T. and X.Y. wrote of the manuscript and contributed to the interpretation of the results. N.X.T. and G.L. performed the experimental data analysis and numerical simulation as well as preparation of the figures. All authors have read and agreed to the published version of the manuscript.

Funding

This research was funded by Tohoku University-Tsinghua University Collaborative Research Fund (2020–2021).

Institutional Review Board Statement

Not applicable.

Informed Consent Statement

Not applicable.

Data Availability Statement

The data presented in this study are available on request from the corresponding author.

Acknowledgments

The authors would like to express their sincere gratitude to the financial support from the Tohoku University-Tsinghua University Collaborative Research Fund.

Conflicts of Interest

The authors declare no conflict of interest.

References

  1. Schlichting, H. Boundary Layer Theory, 9th ed.; Springer: Berlin/Heidelberg, Germany, 1979; 805p. [Google Scholar]
  2. Jonsson, I.G. Measurements in the turbulent wave boundary layer. In Proceedings of the 10th IAHR Congress, London, UK, 1–5 September 1963; pp. 85–92. [Google Scholar]
  3. Carstens, M.R.; Neilson, F.M. Evolution of a duned bed under oscillatory flow. J. Geophys. Res. 1967, 72, 3053–3059. [Google Scholar] [CrossRef]
  4. Chan, K.W.; Baird, M.H.I.; Round, G.F. Behavior of beds of dense particles in a horizontally oscillating liquid. Proc. R. Soc. Lond. A Math. Phys. Sci. 1972, 330, 537–559. [Google Scholar]
  5. Lofquist, K.E.B. An Effect of Permeability on Sand Transport by Waves; CERC TM-62. U. S. Army Corps of Engineers; Coastal Engineering Research Center: Vicksburg, MS, USA, 1975; 74p. [Google Scholar]
  6. Hulsbergen, C.H.; Bosman, J.J. A closely responding, versatile wave tunnel. In Proceedings of the 17th Coastal Engineers Conference, Sydney, Australia, 23–28 March 1980; ASCE: New York, NY, USA, 1980; pp. 310–317. [Google Scholar]
  7. Horikawa, K.; Watanabe, A.; Katori, S. Sediment transport under sheet flow condition. In Proceedings of the 18th Coastal Engineers Conference, Cape Town, South Africa, 14–19 November 1982; ASCE: New York, NY, USA, 1982; pp. 1335–1352. [Google Scholar]
  8. King, D.B.; Powell, J.D.; Seymour, R.J. A new oscillatory flow tunnel for use in sediment transport experiments. In Proceedings of the 19th International Conference on Coastal Engineering, Houston, TX, USA, 3–7 September 1984; pp. 1559–1570. [Google Scholar]
  9. Gonzalez-Rodriguez, D.; Madsen, O.S. Boundary-layer hydrodynamics and bedload sediment transport in oscillating water tunnels. J. Fluid Mech. 2011, 667, 48–84. [Google Scholar] [CrossRef] [Green Version]
  10. Van der A, D.A.; O’Donoghue, T.; Davies, A.G.; Ribberink, J.S. Experimental study of the turbulent boundary layer in acceleration-skewed oscillatory flow. J. Fluid Mech. 2011, 684, 251–283. [Google Scholar] [CrossRef] [Green Version]
  11. Dedow, H.R.A. A pulsating water tunnel for research in reversing flow. Houille Blanche 1966, 7, 837–841. [Google Scholar] [CrossRef] [Green Version]
  12. Riedel, H.P.; Kamphuis, J.W.; Brebner, A. Measurement of bed shear stress under waves. In Proceedings of the 13th International Conference on Coastal Engineering, Vancouver, BC, Canada, 10–14 July 1972; ASCE: New York, NY, USA, 1972; pp. 587–603. [Google Scholar]
  13. Jonsson, I.G. Wave boundary layers and friction factors. In Proceedings of the 10th International Conference on Engineers Conference, Tokyo, Japan, 5–8 September 1966; ASCE: New York, NY, USA, 1966; pp. 127–148. [Google Scholar]
  14. Jonsson, I.G. A new approach to oscillatory rough turbulent boundary layers. Ocean Eng. 1980, 7, 109–152. [Google Scholar] [CrossRef]
  15. Sleath, J.F.L. Turbulent oscillatory flow over rough beds. J. Fluid Mech. 1987, 82, 369–409. [Google Scholar] [CrossRef]
  16. Jensen, B.L.; Sumer, B.M.; Fredsøe, J. Turbulent oscillatory boundary layers at high Reynolds numbers. J. Fluid Mech. 1989, 206, 265–297. [Google Scholar] [CrossRef] [Green Version]
  17. Yuan, J.; Madsen, O.S. Experimental study of turbulent oscillatory boundary layers in an oscillating water tunnel. Coast. Eng. 2014, 89, 63–84. [Google Scholar] [CrossRef]
  18. Tinh, N.X.; Tanaka, H. Study on boundary layer development and bottom shear stress beneath a tsunami. Coast. Eng. J. 2019, 61, 574–589. [Google Scholar] [CrossRef]
  19. Lacy, J.R.; Rubin, D.M.; Buscombe, D. Currents, drag, and sediment transport induced by a tsunami. J. Geophys. Res. 2012, 117, C9. [Google Scholar] [CrossRef]
  20. Sana, A.; Tanaka, H. Full-range equation for wave boundary layer thickness. Coast. Eng. 2007, 54, 639–642. [Google Scholar] [CrossRef]
  21. Sana, A.; Tanaka, H. Corrigendum to “Full-range equation for wave boundary layer thickness” [Coast. Eng. 54 (2007) 639–642]. Coast. Eng. 2019, 152, 103516. [Google Scholar] [CrossRef]
  22. Tanaka, H.; Tinh, N.X.; Sana, A. Transitional behavior of flow regime in shoaling tsunami boundary layers. J. Mar. Sci. Eng. 2020, 8, 700. [Google Scholar] [CrossRef]
  23. Tanaka, H.; Tinh, N.X.; Sana, A. Improvement of the full-range equation for wave boundary layer thickness. J. Mar. Sci. Eng. 2020, 8, 573. [Google Scholar] [CrossRef]
  24. Yalin, M.S.; Russell, R.C.H. Shear stresses due to long waves. J. Hyd. Res. 1966, 4, 55–98. [Google Scholar] [CrossRef]
  25. Knight, D.W.; Ridgway, M.A. Velocity distributions in unsteady open channel flow with different boundary roughness. In Proceedings of the 17th of IAHR Congress, Baden, Germany, 15–19 August 1977; pp. 437–444. [Google Scholar]
  26. Chen, D.; Chen, C.; Tang, F.E.; Stansby, P.; Li, M. Boundary layer structure of oscillatory open-channel shallow flows over smooth and rough beds. Exp. Fluids 2007, 42, 719–736. [Google Scholar] [CrossRef]
  27. Larsen, B.E.; Arbøll, L.K.; Kristoffersen, S.F.; Carstensen, S.; Fuhrman, D.R. Experimental study of tsunami-induced scour around a monopile foundation. Coast. Eng. 2018, 138, 9–21. [Google Scholar] [CrossRef] [Green Version]
  28. Celik, I.; Rodi, W. Calculation of wave-induced turbulent flows in estuaries. Ocean Eng. 1985, 12, 531–542. [Google Scholar] [CrossRef]
  29. Johns, B. On the vertical structure of tidal flow in river estuaries. Geophys. J. R. Astr. Soc. 1966, 12, 103–110. [Google Scholar] [CrossRef] [Green Version]
  30. Li, M.; Sanford, L.; Chao, S.Y. Effects of time dependence in unstratified tidal boundary layers: Results from large eddy simulations. Estuar. Coast. Shelf Sci. 2005, 62, 193–204. [Google Scholar] [CrossRef]
  31. Williams, I.A.; Fuhrman, D.R. Numerical simulation of tsunami-scale wave boundary layers. Coast. Eng. 2016, 110, 17–31. [Google Scholar] [CrossRef] [Green Version]
  32. Kaptein, S.J.; Duran-Matute, M.; Roman, F.; Armenio, V.; Clercx, H.J.H. Effect of the water depth on oscillatory flows over a flat plate: From the intermittent towards the fully turbulent regime. Environ. Fluid Mech. 2019, 19, 1167–1184. [Google Scholar] [CrossRef] [Green Version]
  33. Tanaka, H.; Sana, A.; Kawamura, I.; Yamaji, H. Depth-limited oscillatory boundary layers on a rough bottom. Coast. Eng. Jap. 1999, 41, 85–105. [Google Scholar] [CrossRef]
  34. Kajiura, K. On the bottom friction in an oscillatory current. Bull. Earthq. Res. Inst. 1964, 42, 147–174. [Google Scholar]
  35. Tanaka, H. An explicit expression of friction coefficient for a wave-current coexistent motion. Coast. Eng. Jpn. 1992, 35, 83–91. [Google Scholar] [CrossRef]
  36. Tanaka, H.; Thu, A. Full-range equation of friction coefficient and phase difference in a wave-current boundary layer. Coast. Eng. 1994, 22, 237–254. [Google Scholar] [CrossRef]
  37. Larsen, B.E.; Fuhrman, D.R. Full-scale CFD simulation of tsunamis. Part 2: Boundary layers and bed shear stresses. Coast. Eng. 2019, 151, 42–57. [Google Scholar] [CrossRef]
  38. Hayashi, T.; Ohashi, M. A dynamical and visual study on the oscillatory turbulent boundary layer. In Turbulent Shear Flows 3; Springer: Berlin/Heidelberg, Germany, 1982; pp. 18–33. [Google Scholar]
  39. Hino, M.; Kashiwayanagi, M.; Nakayama, A.; Hara, T. Experiments on the turbulence characteristics and the structure of a reciprocating flow. J. Fluid Mech. 1983, 131, 363–400. [Google Scholar] [CrossRef]
  40. Sawamoto, M.; Sato, E. The structure of oscillatory turbulent boundary layer over rough bed. Coast. Eng. Jpn. 1991, 34, 1–14. [Google Scholar] [CrossRef]
  41. Proudman, J. Dynamical Oceanography; Methuen: London, UK, 1953; 409p. [Google Scholar]
  42. Bakker, W.T. Sand concentration in an oscillatory flow. In Proceedings of the 14th International Conference on Coastal Engineering, Copenhagen, Denmark, 24–28 June 1974; ASCE: New York, NY, USA, 1974; pp. 1129–1148. [Google Scholar]
  43. Sheng, Y.P. A turbulent transport model of coastal processes. In Proceedings of the 19th International Conference on Coastal Engineering, Houston, TX, USA, 3–7 September 1984; pp. 2380–2396. [Google Scholar]
  44. Brørs, B.; Eidsvik, K.J. Oscillatory boundary layer flows modelled with dynamic Reynolds stress turbulence closure. Cont. Shelf Res. 1994, 14, 1455–1475. [Google Scholar] [CrossRef]
  45. Hanjalić, K.; Jakirlić, S.; Hadžić, I. Computation of oscillating turbulent flows at transitional Re-numbers. In Turbulent Shear Flows 9; Durst, F., Kasagi, N., Launder, B.E., Schmidt, F.W., Suzuki, K., Whitelaw, J.W., Eds.; Springer: Berlin/Heidelberg, Germany, 1995; pp. 323–342. [Google Scholar]
  46. Justesen, P.; Fredsøe, J. Distribution of turbulence and suspended sediment in the wave boundary layer. Prog. Rep. 1985, 62, 61–67. [Google Scholar]
  47. Tanaka, H.; Sana, A. Numerical Study on Transition to Turbulence in a Wave Boundary Layer. In Sediment Transport Mechanisms in Coastal Environments and Rivers; World Scientific: Singapore, 1994; pp. 14–25. [Google Scholar]
  48. Foti, E.; Scandura, P. A low Reynolds number k–ε model validated for oscillatory flows over smooth and rough wall. Coast. Eng. 2004, 51, 173–184. [Google Scholar] [CrossRef]
  49. Sana, A.; Tanaka, H. Review of k-ε model to analyze oscillatory boundary layers. J. Hydr. Eng. 2000, 126, 701–710. [Google Scholar] [CrossRef]
  50. Tanaka, H. Turbulence structure and bed friction under waves and current interacted motion. In Proceedings of the 3rd International Symposium on River Sedimentation, Jackson, MS, USA, 31 March–4 April 1986; University of Mississippi: Oxford, MS, USA, 1986; pp. 334–343. [Google Scholar]
  51. Justesen, P. Prediction of turbulent oscillatory flow over rough beds. Coast. Eng. 1988, 12, 257–284. [Google Scholar] [CrossRef]
  52. Sana, A.; Ghumman, A.R.; Tanaka, H. Modeling of a rough-wall oscillatory boundary layer using two-equation turbulence models. J. Hydr. Eng. 2009, 135, 60–65. [Google Scholar] [CrossRef]
  53. Spalart, P.R.; Baldwin, B.S. Direct Simulation of a Turbulent Oscillating Boundary Layer; NASA Tech. Memorandum 89460; Ames Research Center: Moffett Field, CA, USA, 1987.
  54. Vittori, G.; Verzicco, R. Direct simulation of transition in an oscillatory boundary layer. J. Fluid Mech. 1998, 371, 207–232. [Google Scholar] [CrossRef]
  55. Sumer, M.B.; Fuhrman, D.R. Turbulence in Coastal and Civil Engineering; World Scientific: Singapore, 2020; 758p. [Google Scholar]
  56. Tanaka, H.; Tinh, N.X. Numerical study on sea bottom boundary layer and bed shear stress under tsunami. In Proceedings of the 29th International Ocean and Polar Engineering Conference (ISOPE), Honolulu, HI, USA, 16–21 June 2019; pp. 3189–3195. [Google Scholar]
  57. Tanaka, H.; Shuto, N. Friction laws and flow regimes under wave and current motion. J. Hydr. Res. 1984, 22, 245–261. [Google Scholar] [CrossRef]
  58. Van der Giessen, A.; De Ruijter, W.; Borst, J. Three-dimensional current structure in the Dutch coastal zone. Neth. J. Sea Res. 1990, 25, 45–55. [Google Scholar] [CrossRef]
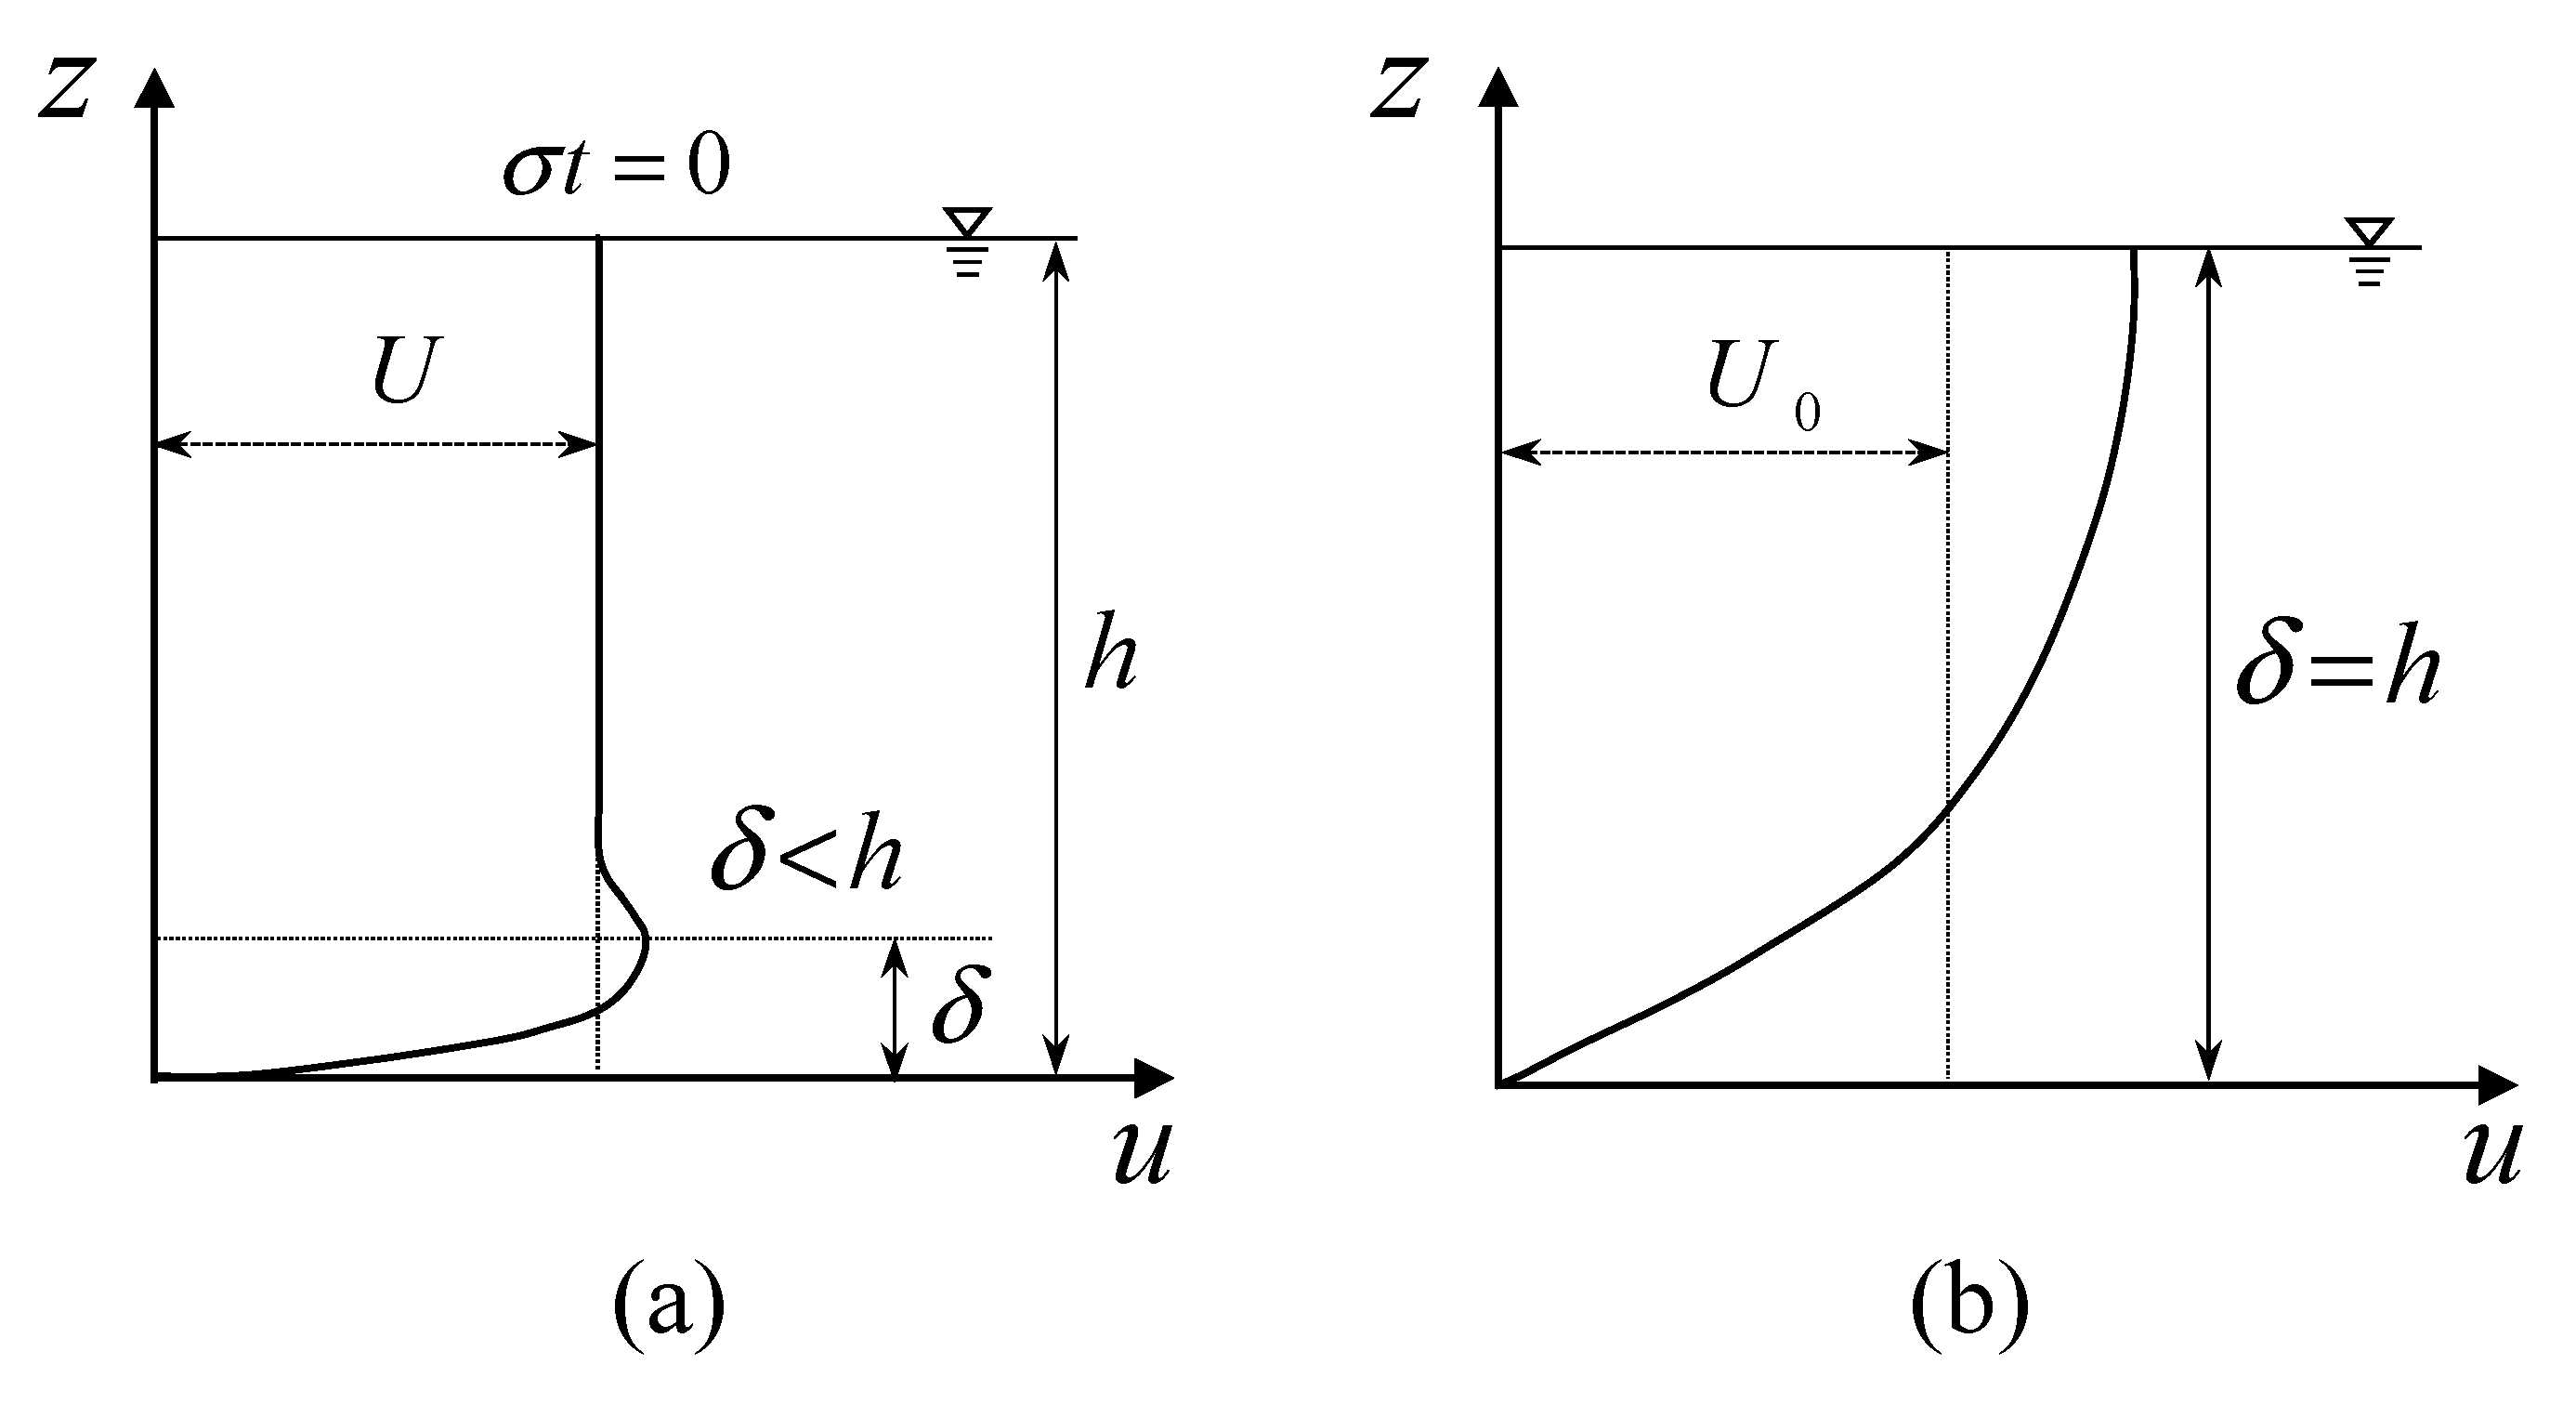
Figure 1. Two types of bottom boundary layer, (a) wave boundary layer and (b) current type velocity profile.
Jmse 09 00027 g001
Figure 2. 3D view of friction factors, Equations (3), (12), (15), and (19), and a hypothetical shoaling tsunami (Case 1).
Jmse 09 00027 g002
Figure 3. Velocity profile under wave crest (σt = π/2). (a) Re = 3.51 × 10⁶, (b) Re = 1.99 × 10⁷.
Jmse 09 00027 g003
Figure 4. Time-variation of dimensionless bottom shear stress τ * ( t ) . (a) Re = 3.51 × 10⁶, (b) Re = 1.99 × 10⁷.
Jmse 09 00027 g004
Figure 5. Transitional behavior of maximum bottom shear stress and its appearance time. (a) Re = 3.51 × 10⁶, (b) Re = 1.99 × 10⁷.
Jmse 09 00027 g005
Figure 6. Demarcation in terms of Re and R. For an explanation of symbols see Table 1 and Table 2.
Jmse 09 00027 g006
Figure 7. Demarcation in terms of R e δ and h / δ s . For an explanation of symbols see Table 1 and Table 2.
Jmse 09 00027 g007
Figure 8. Application of the demarcation conditions to the Rhine Estuary and to a hypothetical tsunami.
Jmse 09 00027 g008
Figure 9. Demarcation line in terms of H / h and h / L .
Jmse 09 00027 g009
Figure 10. Cross-shore variation of Re and R.
Jmse 09 00027 g010
Table 1. List of collected data.
Authors R e δ h / δ s R e R Boundary Layer Classification (*)
Kaptein et al. [32]99054.90 × 1054.95 × 103 Jmse 09 00027 i001
990104.90 × 1059.90 × 103 Jmse 09 00027 i002
990254.90 × 1052.48 × 104 Jmse 09 00027 i003
990404.90 × 1053.96 × 104 Jmse 09 00027 i004
990704.90 × 1056.93 × 104 Jmse 09 00027 i005
179051.60 × 1068.95 × 103 Jmse 09 00027 i006
1790101.60 × 1061.79 × 104 Jmse 09 00027 i007
1790251.60 × 1064.48 × 104 Jmse 09 00027 i008
1790401.60 × 1067.16 × 104 Jmse 09 00027 i009
1790701.60 × 1061.25 × 105 Jmse 09 00027 i010
346055.99 × 1061.73 × 104 Jmse 09 00027 i011
3460105.99 × 1063.46 × 104 Jmse 09 00027 i012
3460255.99 × 1068.65 × 104 Jmse 09 00027 i013
3460405.99 × 1061.38 × 105 Jmse 09 00027 i014
3460705.99 × 1062.42 × 105 Jmse 09 00027 i015
Knight and Ridgway [25]Exp. 170738.62.51 × 1052.74 × 104
290727.04.13 × 1052.46 × 104
3101516.55.16 × 1051.67 × 104
412097.17.36 × 1058.67 × 103
Larsen et al. [27]Case 10245753.83.02 × 1061.32 × 105
11319143.25.09 × 1061.37 × 105
12605121.91.83 × 1071.32 × 105
Hayashi and Ohashi [38]Case 187256.83.87 × 1054.95 × 104
299557.74.95 × 1055.74 × 104
393953.04.44 × 1054.98 × 104
485448.93.65 × 1054.18 × 104
Hino et al. [39]-87612.83.84 × 1051.13 × 104
Jensen et al. [16]Test 576172.62.9 × 1055.5 × 104 Jmse 09 00027 i016
6100073.75.0 × 1057.4 × 104 Jmse 09 00027 i017
7114073.26.5 × 1058.4 × 104 Jmse 09 00027 i018
8178970.01.6 × 1061.3 × 105 Jmse 09 00027 i019
9260873.03.4 × 1061.9 × 105 Jmse 09 00027 i020
10346470.96.0 × 1062.5 × 105 Jmse 09 00027 i021
Sawamoto and Sato [40]Case 281250.23.30 × 1065.71 × 104 Jmse 09 00027 i022
(*) open symbol: non-depth-limited (wave-like) boundary layer, closed symbol: depth-limited (current-like) boundary layer.
Table 2. List of the k-ω model simulation.
Numerical Cases R e δ h / δ s R e R Boundary Layer Classification (*)
Case 1-126492643.51 × 1067.00 × 105
1-226491323.51 × 1063.50 × 105
1-32649923.51 × 1062.45 × 105
1-42649663.51 × 1061.75 × 105
1-52649533.51 × 1061.40 × 105
1-62649403.51 × 1061.05 × 105
1-72649263.51 × 1067.00 × 104
1-82649223.51 × 1065.95 × 104
1-92649183.51 × 1064.90 × 104
Case 2-163086341.99 × 1074.00 × 106
2-263084761.99 × 1073.00 × 106
2-363083171.99 × 1072.00 × 106
2-463081591.99 × 1071.00 × 106
2-56308791.99 × 1075.00 × 105
2-66308631.99 × 1074.00 × 105
2-76308481.99 × 1073.00 × 105
2-86308401.99 × 1072.50 × 105
2-96308361.99 × 1072.25 × 105
(*) open symbol: non-depth-limited (wave-like) boundary layer, closed symbol: depth-limited (current-like) boundary layer.
Table 3. Tidal flow conditions in the Rhine Estuary [32,58].
U m (m/s) R e = U m   a m / ν R = U m   h / ν δ (m) δ / h
Neap tide0.73.06 × 1091.23 × 10744.92.25
Spring tide1.17.55 × 1091.92 × 10767.43.37
Note: Tidal period T = 12.42 h, tidal angular frequency ω = 1.41 × 10⁻⁴ s−1, a kinematic viscosity ν = 1.14 × 10⁻⁶ m2/s, Depth h = 20 m, and δ from Equation (14).
Table 4. Input conditions for hypothetical tsunamis.
Case 1Case 2
h 0 Depth of the source4000 m4000 m
H 0 Tsunami height at the source1 m1 m
T Tsunami period at the source15 min30 min
Publisher’s Note: MDPI stays neutral with regard to jurisdictional claims in published maps and institutional affiliations.