1. Introduction
There is currently a great interest in solving environmental problems with the aim of reducing the effects of climate change. The main objective of this is to eliminate the dependence on fossil fuels and the environmental repercussions that their exploitation has caused [
1,
2]. The reduction in greenhouse gas emissions, which are responsible for climate change, by means of renewable technologies for electricity generation is, therefore, being promoted in order to replace fossil fuels [
3,
4,
5,
6]. The European Union (EU) has established the need to achieve a reduction in greenhouse gas emissions of just above 80% with the objective of ensuring that more than 80% of the EU’s electricity will be produced by renewable energy sources by 2050 [
7,
8]. Of the various renewable energy sources available, onshore wind power is now a mature technology and has been consolidated in numerous countries [
9]. This renewable energy source has the possibility of being implemented on a large scale in electrical systems, signifying that an offshore installation is an option that will allow the installed wind power to be increased, since there is a larger surface area for the installation of these turbines [
10,
11].
Offshore wind energy is already leading a large part of the European energy transition. European companies represent 90% of the offshore global market, whose cumulative offshore wind capacity reached 22,072 MW at the end of 2019. There are 110 offshore wind farms in 12 European countries and 5047 grid-connected wind turbines [
12,
13,
14]. Some of the advantages of offshore wind power are the following: (i) the wind is constant and its speed is higher owing to the absence of geographical features; (ii) there is a reduction in visual impact and noise pollution; (iii) job creation; (iv) industrial diversification and (v) the energy produced is independent of the price of fuels.
However, the economic cost associated with its installation and maintenance is high owing to the difficulty involved in carrying out construction tasks in the ocean. Moreover, the appropriate spaces on the continental shelf are limited and it is, therefore, necessary to install them further from the coast. These types of offshore structures are attached to the seabed by mooring lines. There are many different floating foundations, which are grouped together in [
15]:
Spar buoys: large ballasted buoys below the turbine that provide buoyancy force and stability owing to ballast, which helps lower the center of gravity. The Statoil Hywind Project in the North Sea is the first floating wind farm in the world to have a 30 MW spar buoy array, using five Siemens SWT6.0-154 6 MW turbines [
16].
Tension leg platforms (TLPs): positively buoyant structures. These are held in place by steel ropes in tension. Moreover, when the cables are positioned at an angle, the tension is increased and the platform better resists the torque induced by the turbine thrust. The Glosten Pela Star is a TLP floating wind turbine that was designed with five arms, each of which is attached to a synthetic fiber tendon [
17]. Its prototype was tested in 2013, but delays as regards obtaining planning permission caused the project to be shelved.
Semisubmersibles: a group of buoys give the structure both buoyancy and stability. These platforms can be installed in deep waters [
18] and can additionally be towed to and installed in their place of operation without the need for special vessels. The WindFloat, which is the most notable example of these structures, was installed off the cost of Portugal, where the depth is greater than 40 m, in 2011. It has a 2 MW wind turbine and produces sufficient electricity to power 1300 houses for 5 years. The second phase of this project was installed in more extreme conditions at a depth of 85–100 m and currently it consists of 3 or 4 wind turbines of 8 MW each [
19].
One of the current problems with offshore wind structures is the oscillations produced by the waves and the wind, signifying that the inclination of the structure must not exceed 10° in the operating phase [
20,
21]. If the inclination of the structure exceeds 10°, the turbine must shut down for safety reasons. The risk is not that of capsizing, but the blades could hit the tower in their rotational movement. The inclination increases the blades’ bending owing to the gravitational force and the wind caused by thrust. The worst-case scenario could lead to the destruction of the offshore wind turbine, even though the rotor shaft has a predefined tilt angle and the distance between the tower and the blades is several meters. Although this hazard can be eliminated by shutting down the turbine, the tilt should be reduced to the lowest possible value. In addition, when the blades are out of the design position, turbine efficiency and performance deteriorate and, owing to the unwanted angle of attack, undesirable loads are produced on the blades that could cause structural problems. Keeping this problem in mind, the objective of this paper is to design technical solutions with which to substantially reduce/eliminate changes in the orientation of offshore turbine structures, despite the undesirable effects of the wind and the waves. The proposed solution is based on the design and the control of an active floating structure, which is achieved by means of three cylindrical columns that contain an inner water ballast system whose main function is to stabilize the turbine and to keep it vertical in order to improve its operation and, therefore, help maintain the offshore wind turbine in the optimal conditions required to harness energy from the wind. The use of this active floating structure is expected to influence the following aspects: (i) the maintenance of the offshore wind turbine in optimal conditions for energy capture; (ii) a reduction in the cost of energy; (iii) an increase in the profitability of the project; (iv) less human intervention or (v) easy operation, among others.
The remainder of the paper is structured as follows:
Section 2 presents brief descriptions of both the wind turbine and the proposed active floating structure studied herein. The conditions of hydrostatic equilibrium for the Windfloat turbine are presented in
Section 3, after which the proposed dynamic model for the Windfloat turbine is developed in
Section 4, resulting in a multivariable, time-dependent and strongly coupled system. In
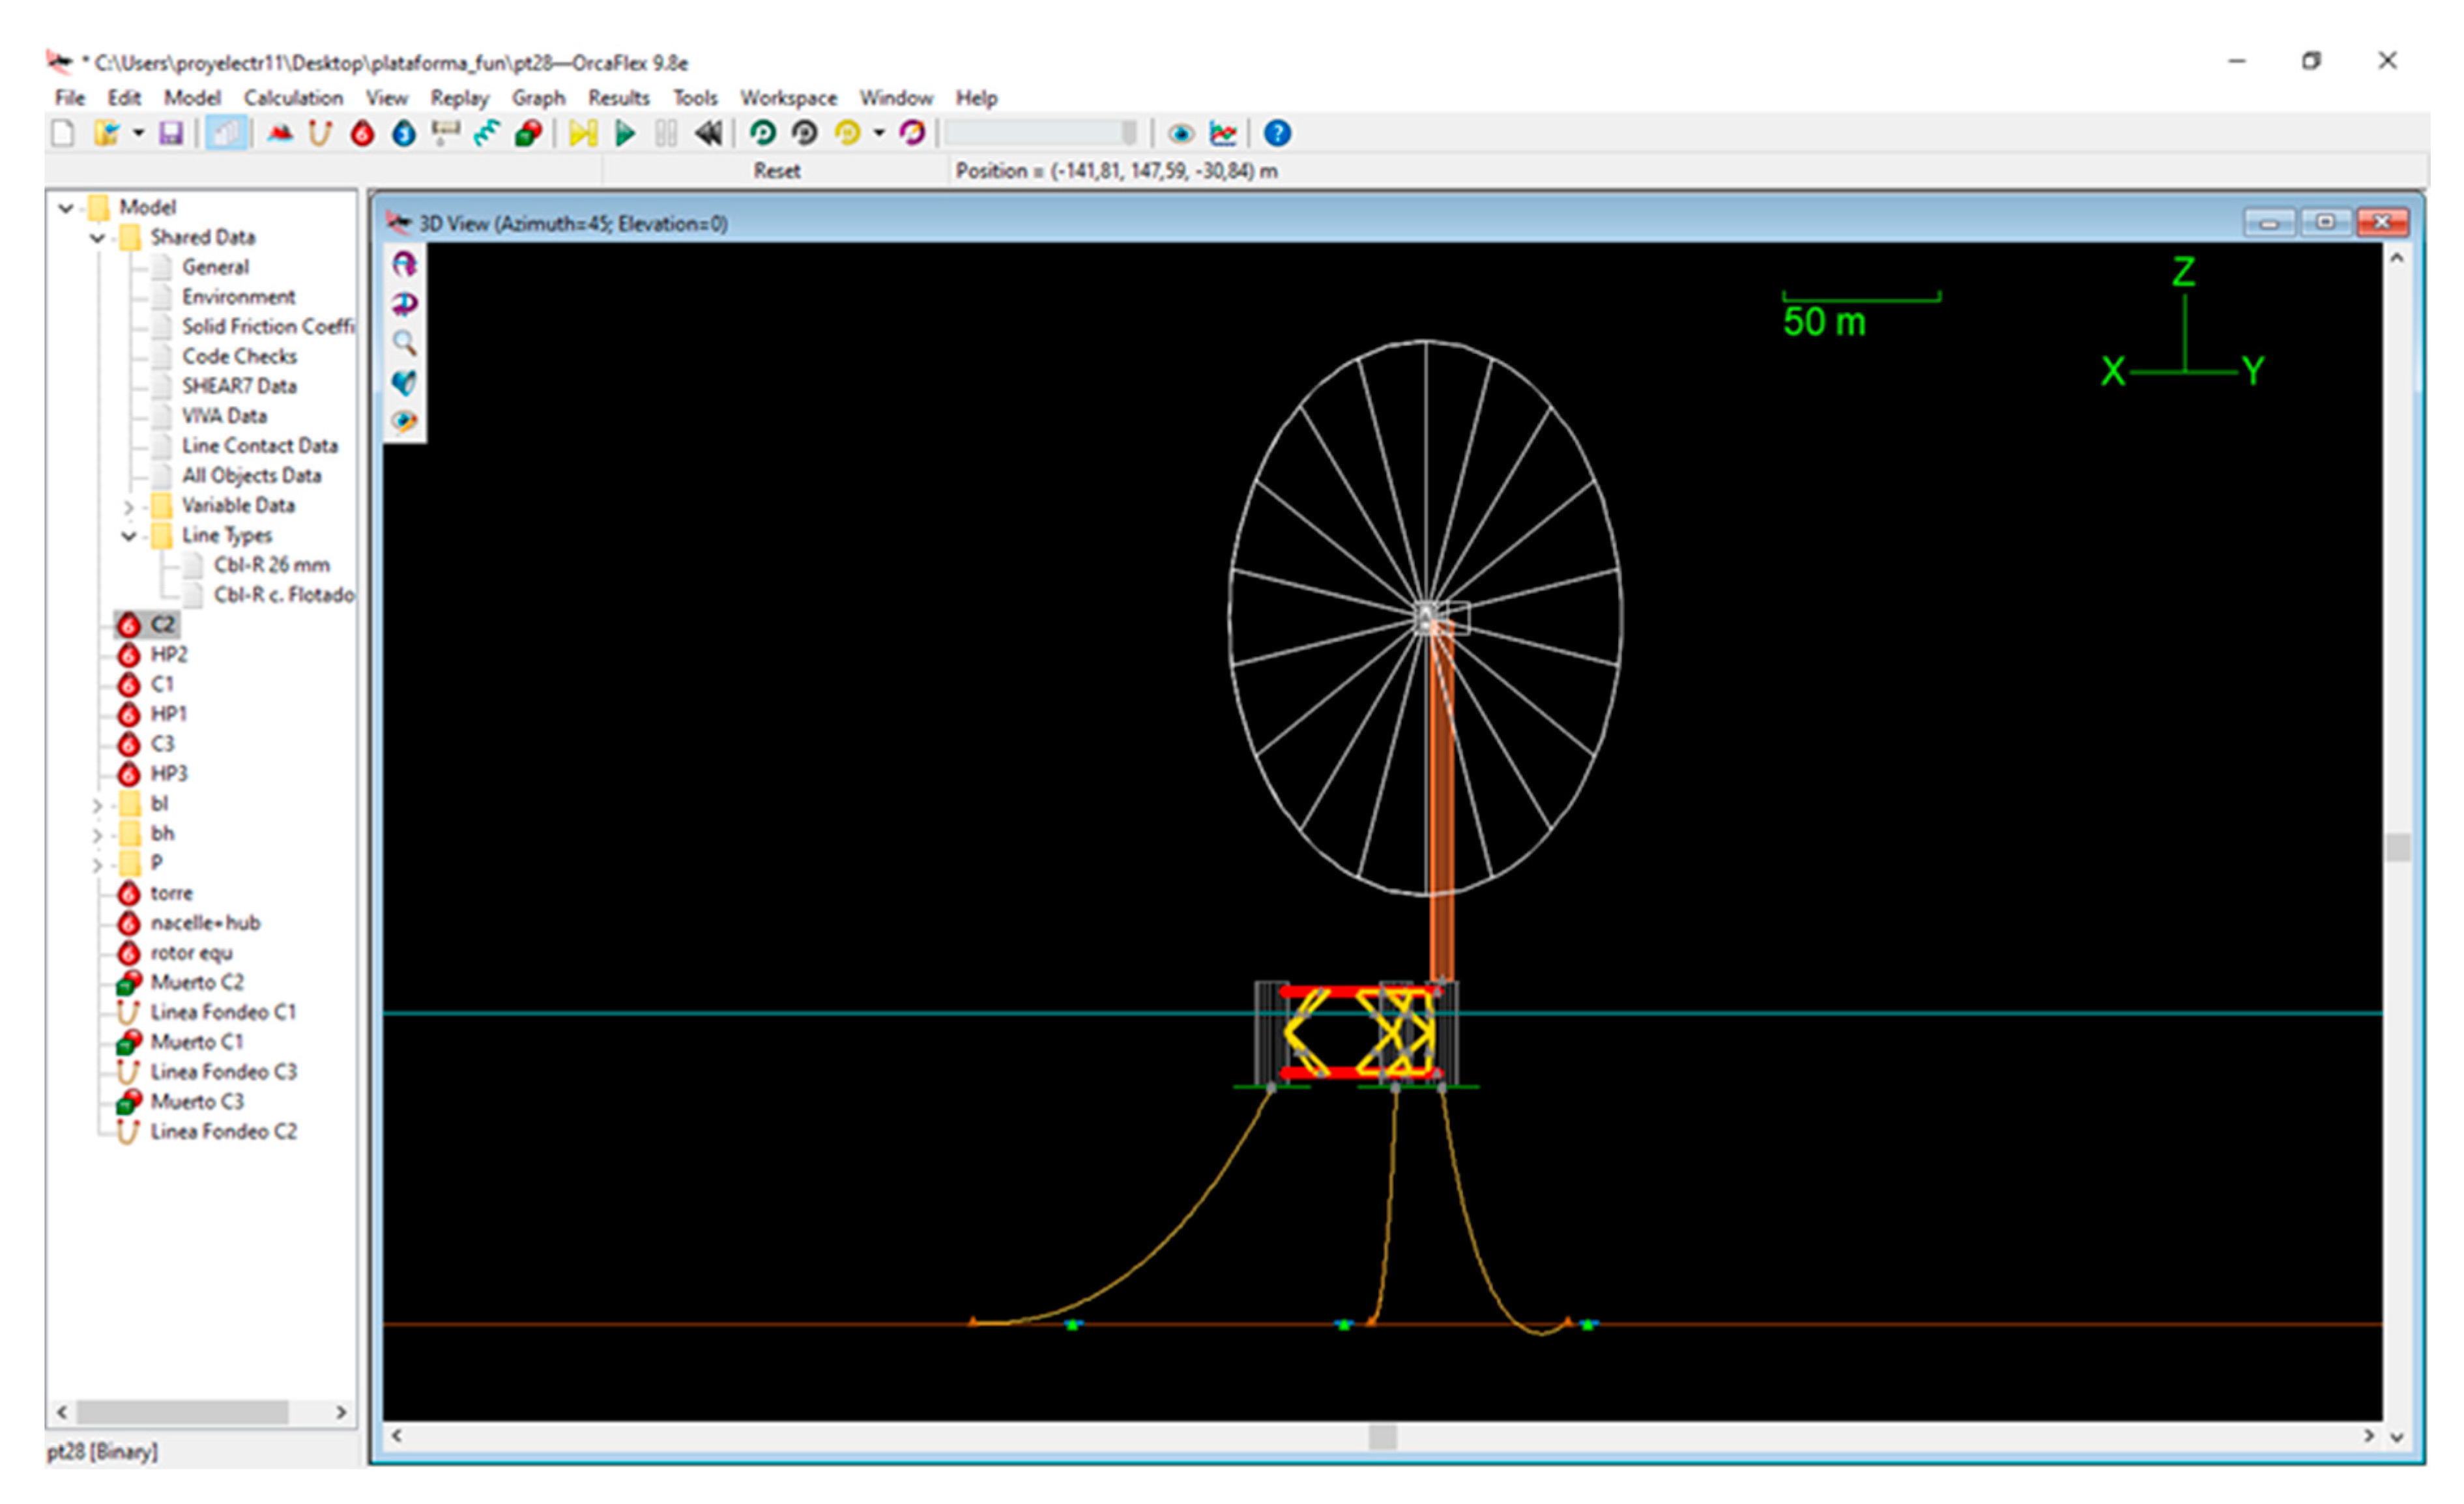
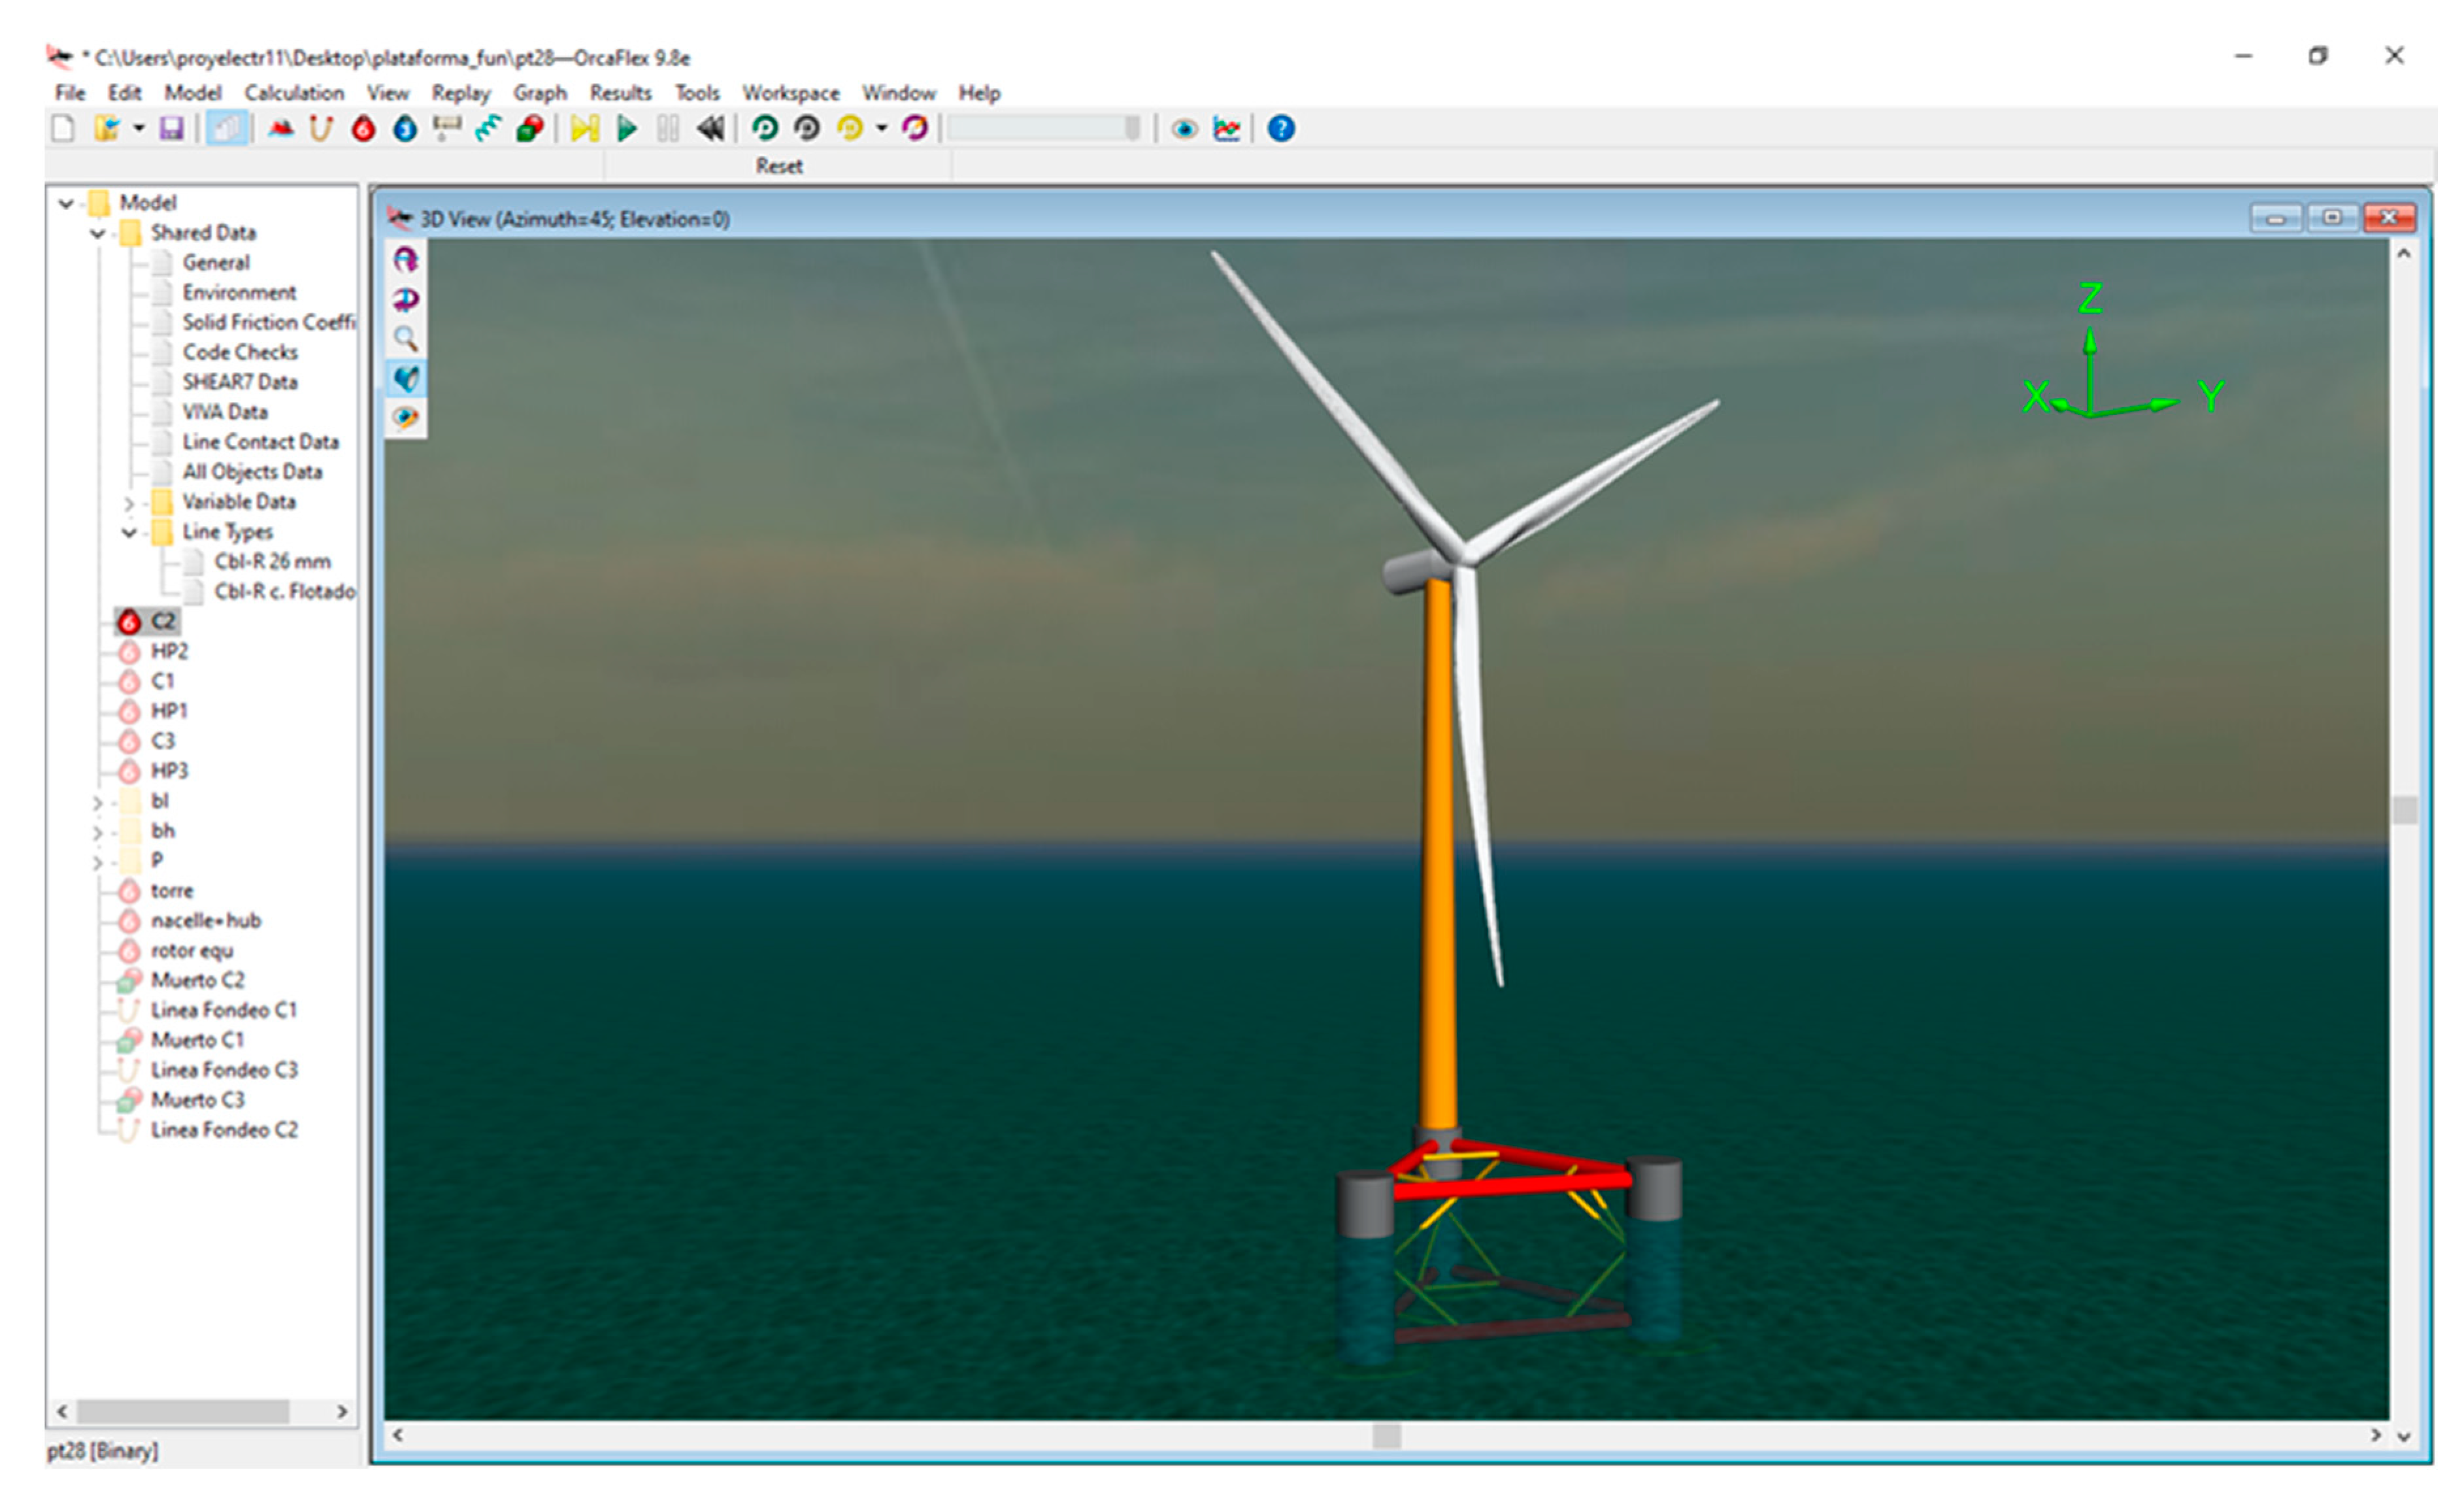
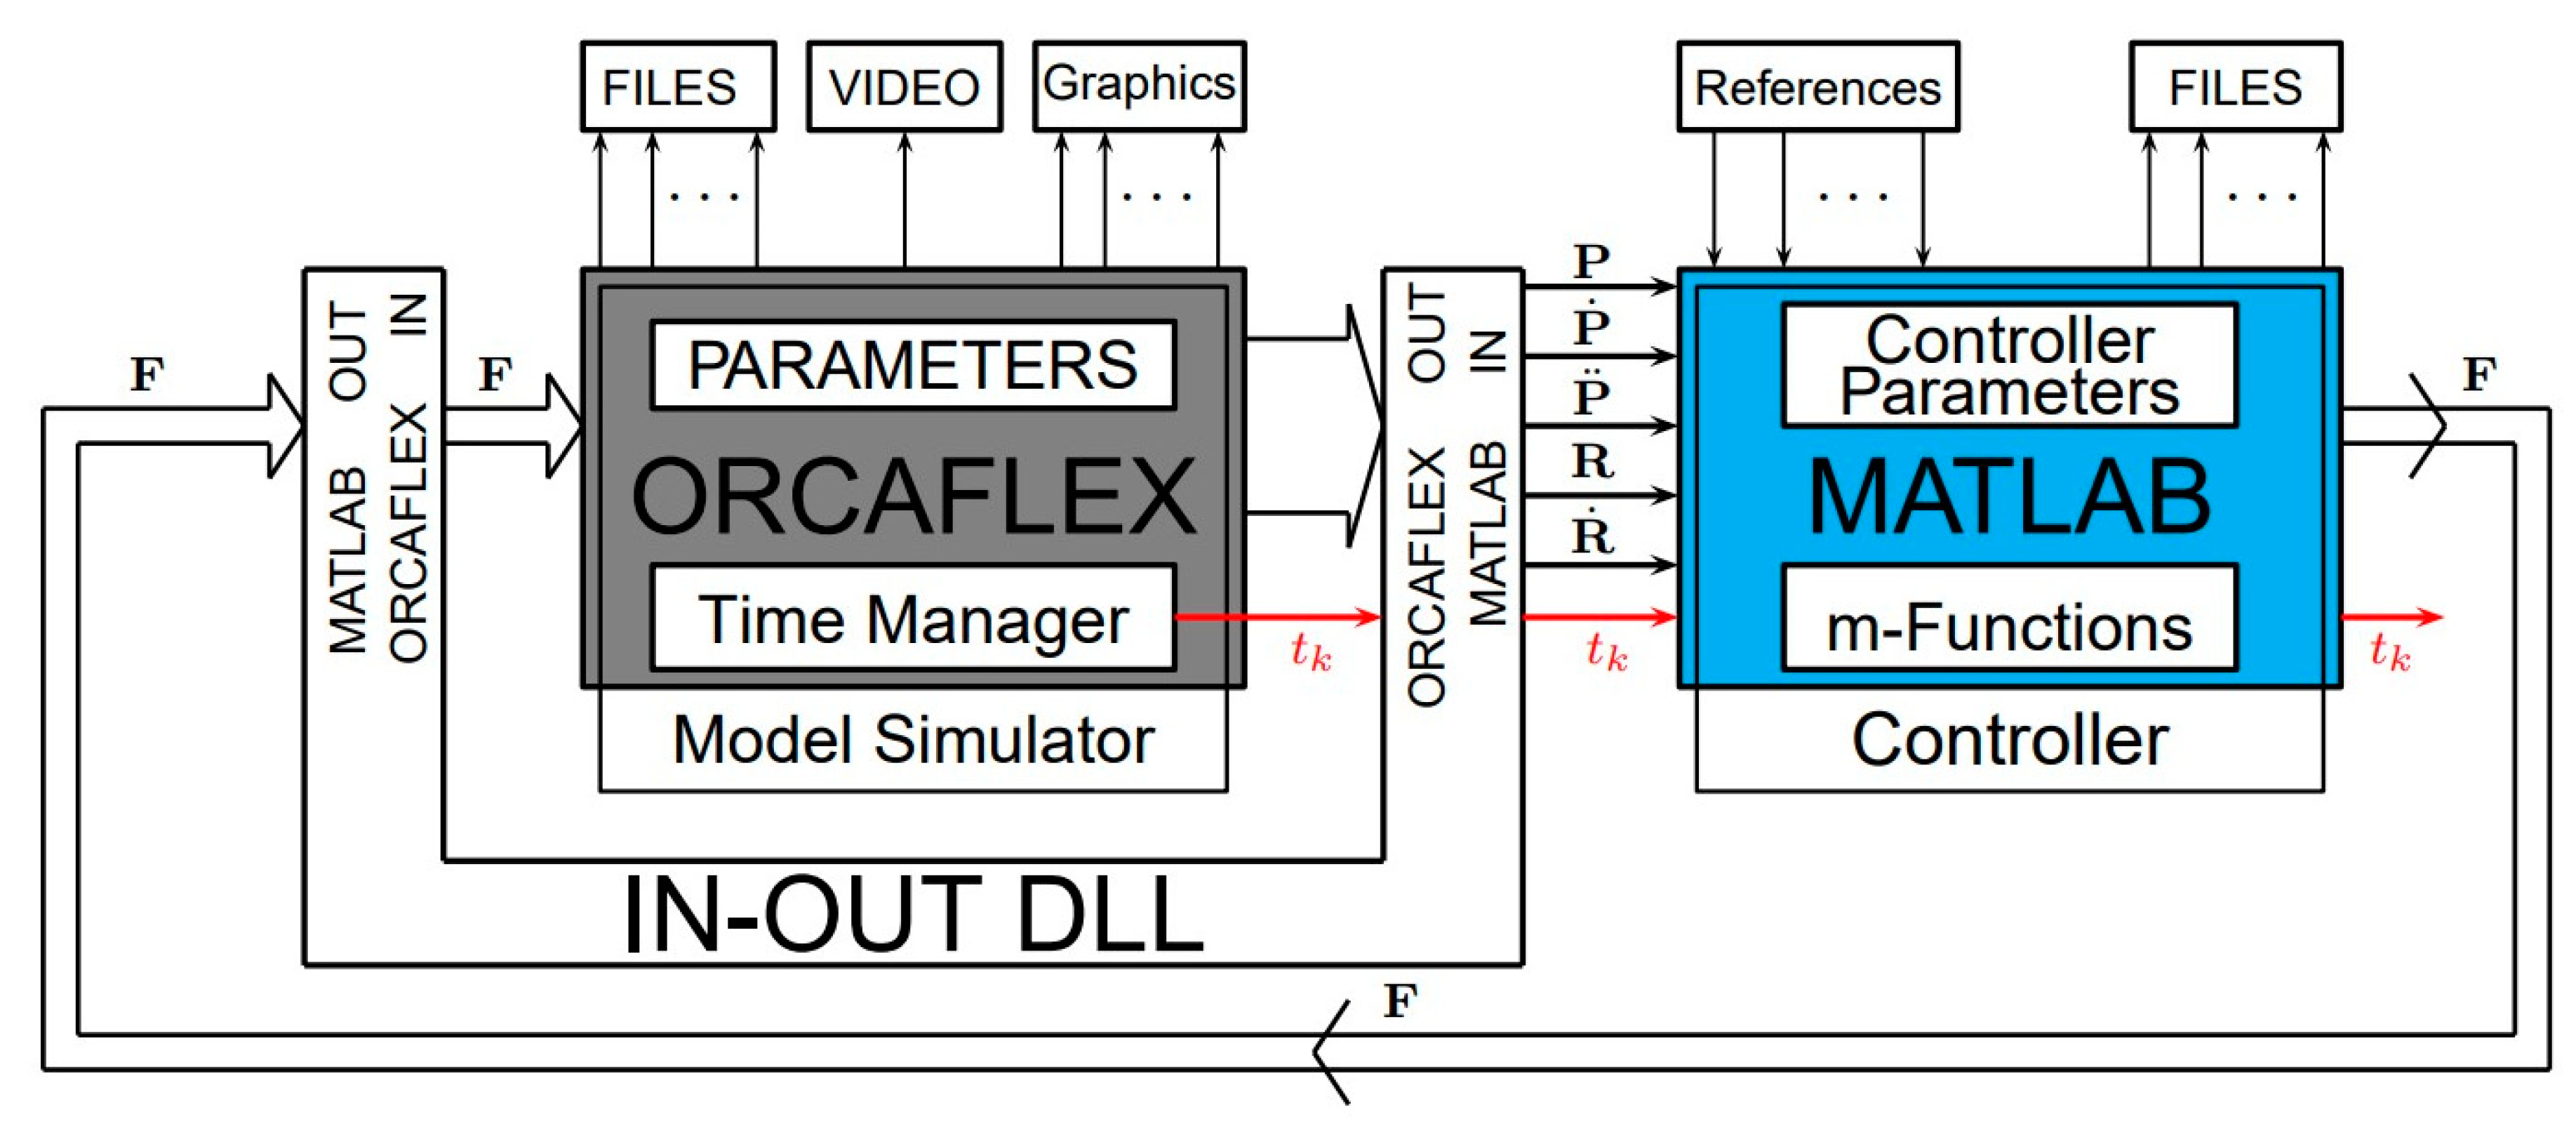
Section 5, this dynamic model is employed as the basis on which to propose the non-linear solution adopted to control the system. The validation setup performed by the research group using the Matlab-OrcaFlex tool is explained in
Section 6, while
Section 7 deals with the validation results obtained after using the proposed control system in both situations of model parametric uncertainties and unmodeled unmatched disturbances caused by the effects of the wind and the waves on the Windfloat turbine. Finally,
Section 8 provides the conclusions of this paper and proposals for future work.
2. Brief Description of the Wind Turbine
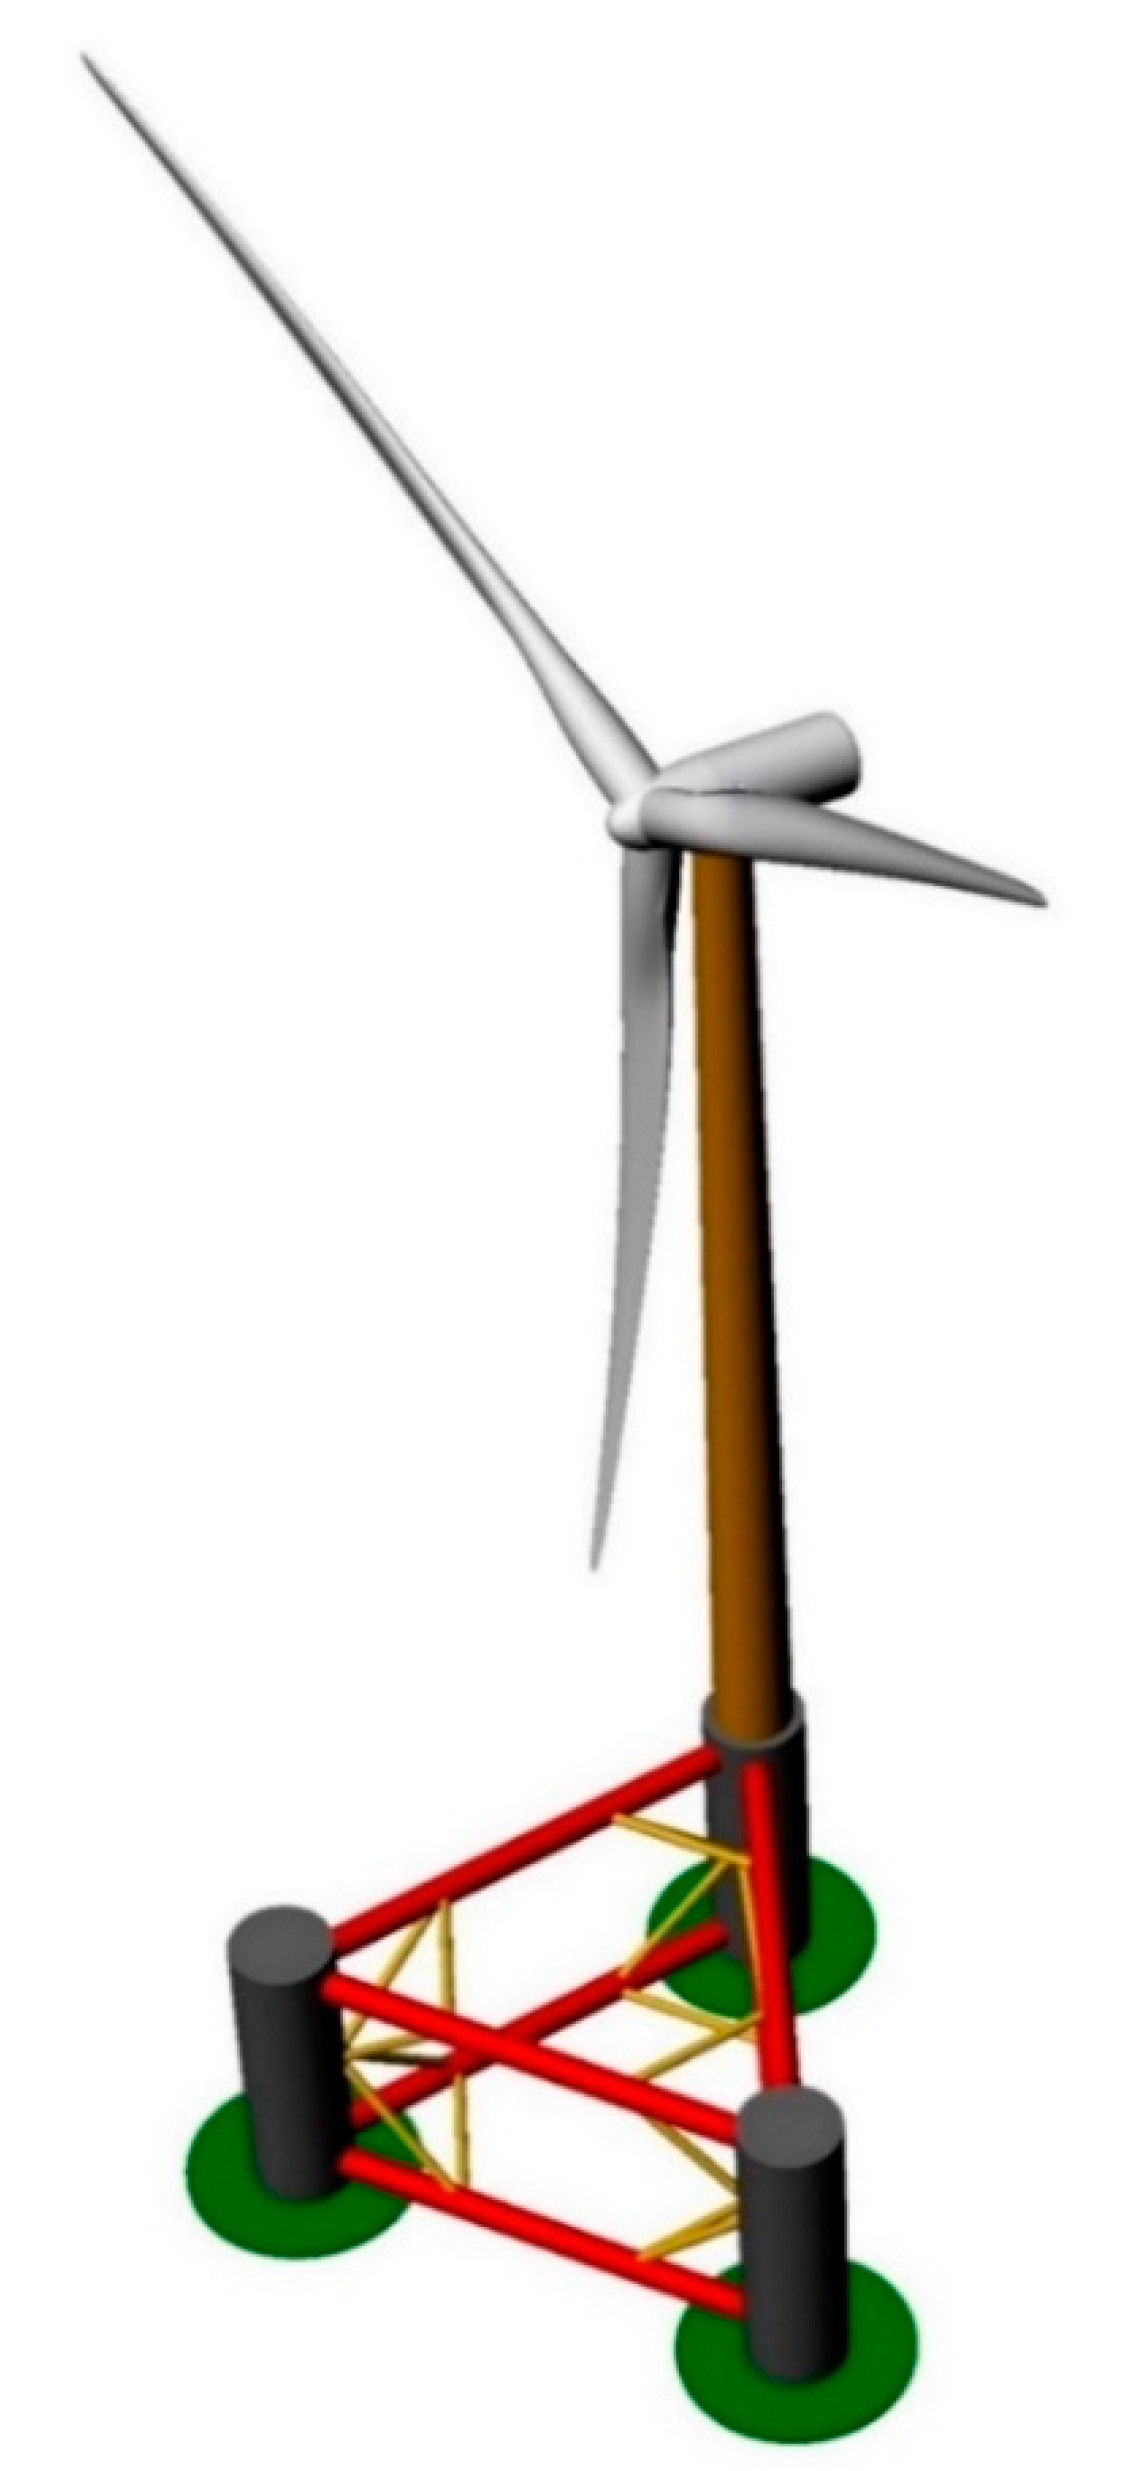
Figure 1 shows the computer-aided design (CAD) general view of the platform studied in this work, which was created by keeping in mind the Windfloat concept [
22] of a 10 MW DTU turbine [
23,
24,
25]. This is because the platform design was conceived with safety margins and, therefore, had to be capable of supporting the loading forces that can be expected of wind turbines with power ratings of up to 10 MW. From the perspective of our proposal as regards controlling the orientation, the most important elements of the device provide the platform with its floating system, which is achieved by means of three cylindrical columns that contain an inner water ballast system whose main function is to stabilize the turbine and to keep it vertical in order to improve its operation. The water inside the ballast tanks is pumped internally to compensate the significant forces and torques that act on the turbine when the wind interacts with the blades. Each of the three water ballast compartments is located in the upper half of its associated column. The wind turbine itself is located on the top of one of the columns, which provides buoyancy to the whole weight of the turbine. The other two columns must be partially filled with solid ballast in order to compensate the difference in weights of the three columns and obtain the hydrostatic equilibrium that keeps the device floating and vertical in the absence of any kind of external disturbance. Heavy plates are located at the bottom of the columns that increase the weight and the viscous damping due to vortexes that occur at the edge of the plates. The added mass also increases due to a greater volume of surrounding fluid that must move, providing a wider hydrodynamic added inertia to the structure [
26,
27]. The platform is fixed to the seabed with at least three mooring lines (other works have proposed more lines, such as [
22], which proposes six mooring lines).
Table 1 summarizes the main dimensions of the elements that comprise the floating platform used in this work, while
Table 2 contains the main dimensions of the wind turbine.
In order to model the environmental loads applied to the generator, we chose a location near the coast of Ferrol, in Galicia (whose specific geographical coordinates are 43°50′ N, 8°50′ W) [
28]. The bathymetry of the seabed and the winds in Galicia allow offshore wind energy exploitation. The sea depth in the neighborhood of the proposed location is approximately 150 m and consequently meets the necessary requirements for wind speed, which are 9.5 m/s at an elevation of 80 m [
29].
3. Hydrostatic Equilibrium
Since the wind turbine is considered as a semisubmersible platform, the first step in the design and conception of the device must be to obtain a nominal hydrostatic equilibrium. In hydrostatic terminology, both the gravitational and the buoyancy forces are denominated as “restoring forces”. This section proposes a simple distribution of the gravity forces resulting from the masses of the rigid bodies and the buoyancy forces owing to the ballast tanks located inside the device. This proposal is not intended to coincide with the current disposition of these elements in one of the real devices under study but is used for the sole purpose of this paper to show the proposed closed loop orientation control system. This study can, of course, be easily adapted to other mass arrangements and buoyancy tanks.
The most important assumption in this section is that: only three lumped masses of the same values are considered, which are denoted as , where subindex i denotes the number of the mass (and the number of cylinders in the device as ) and subindex RB denotes rigid body.
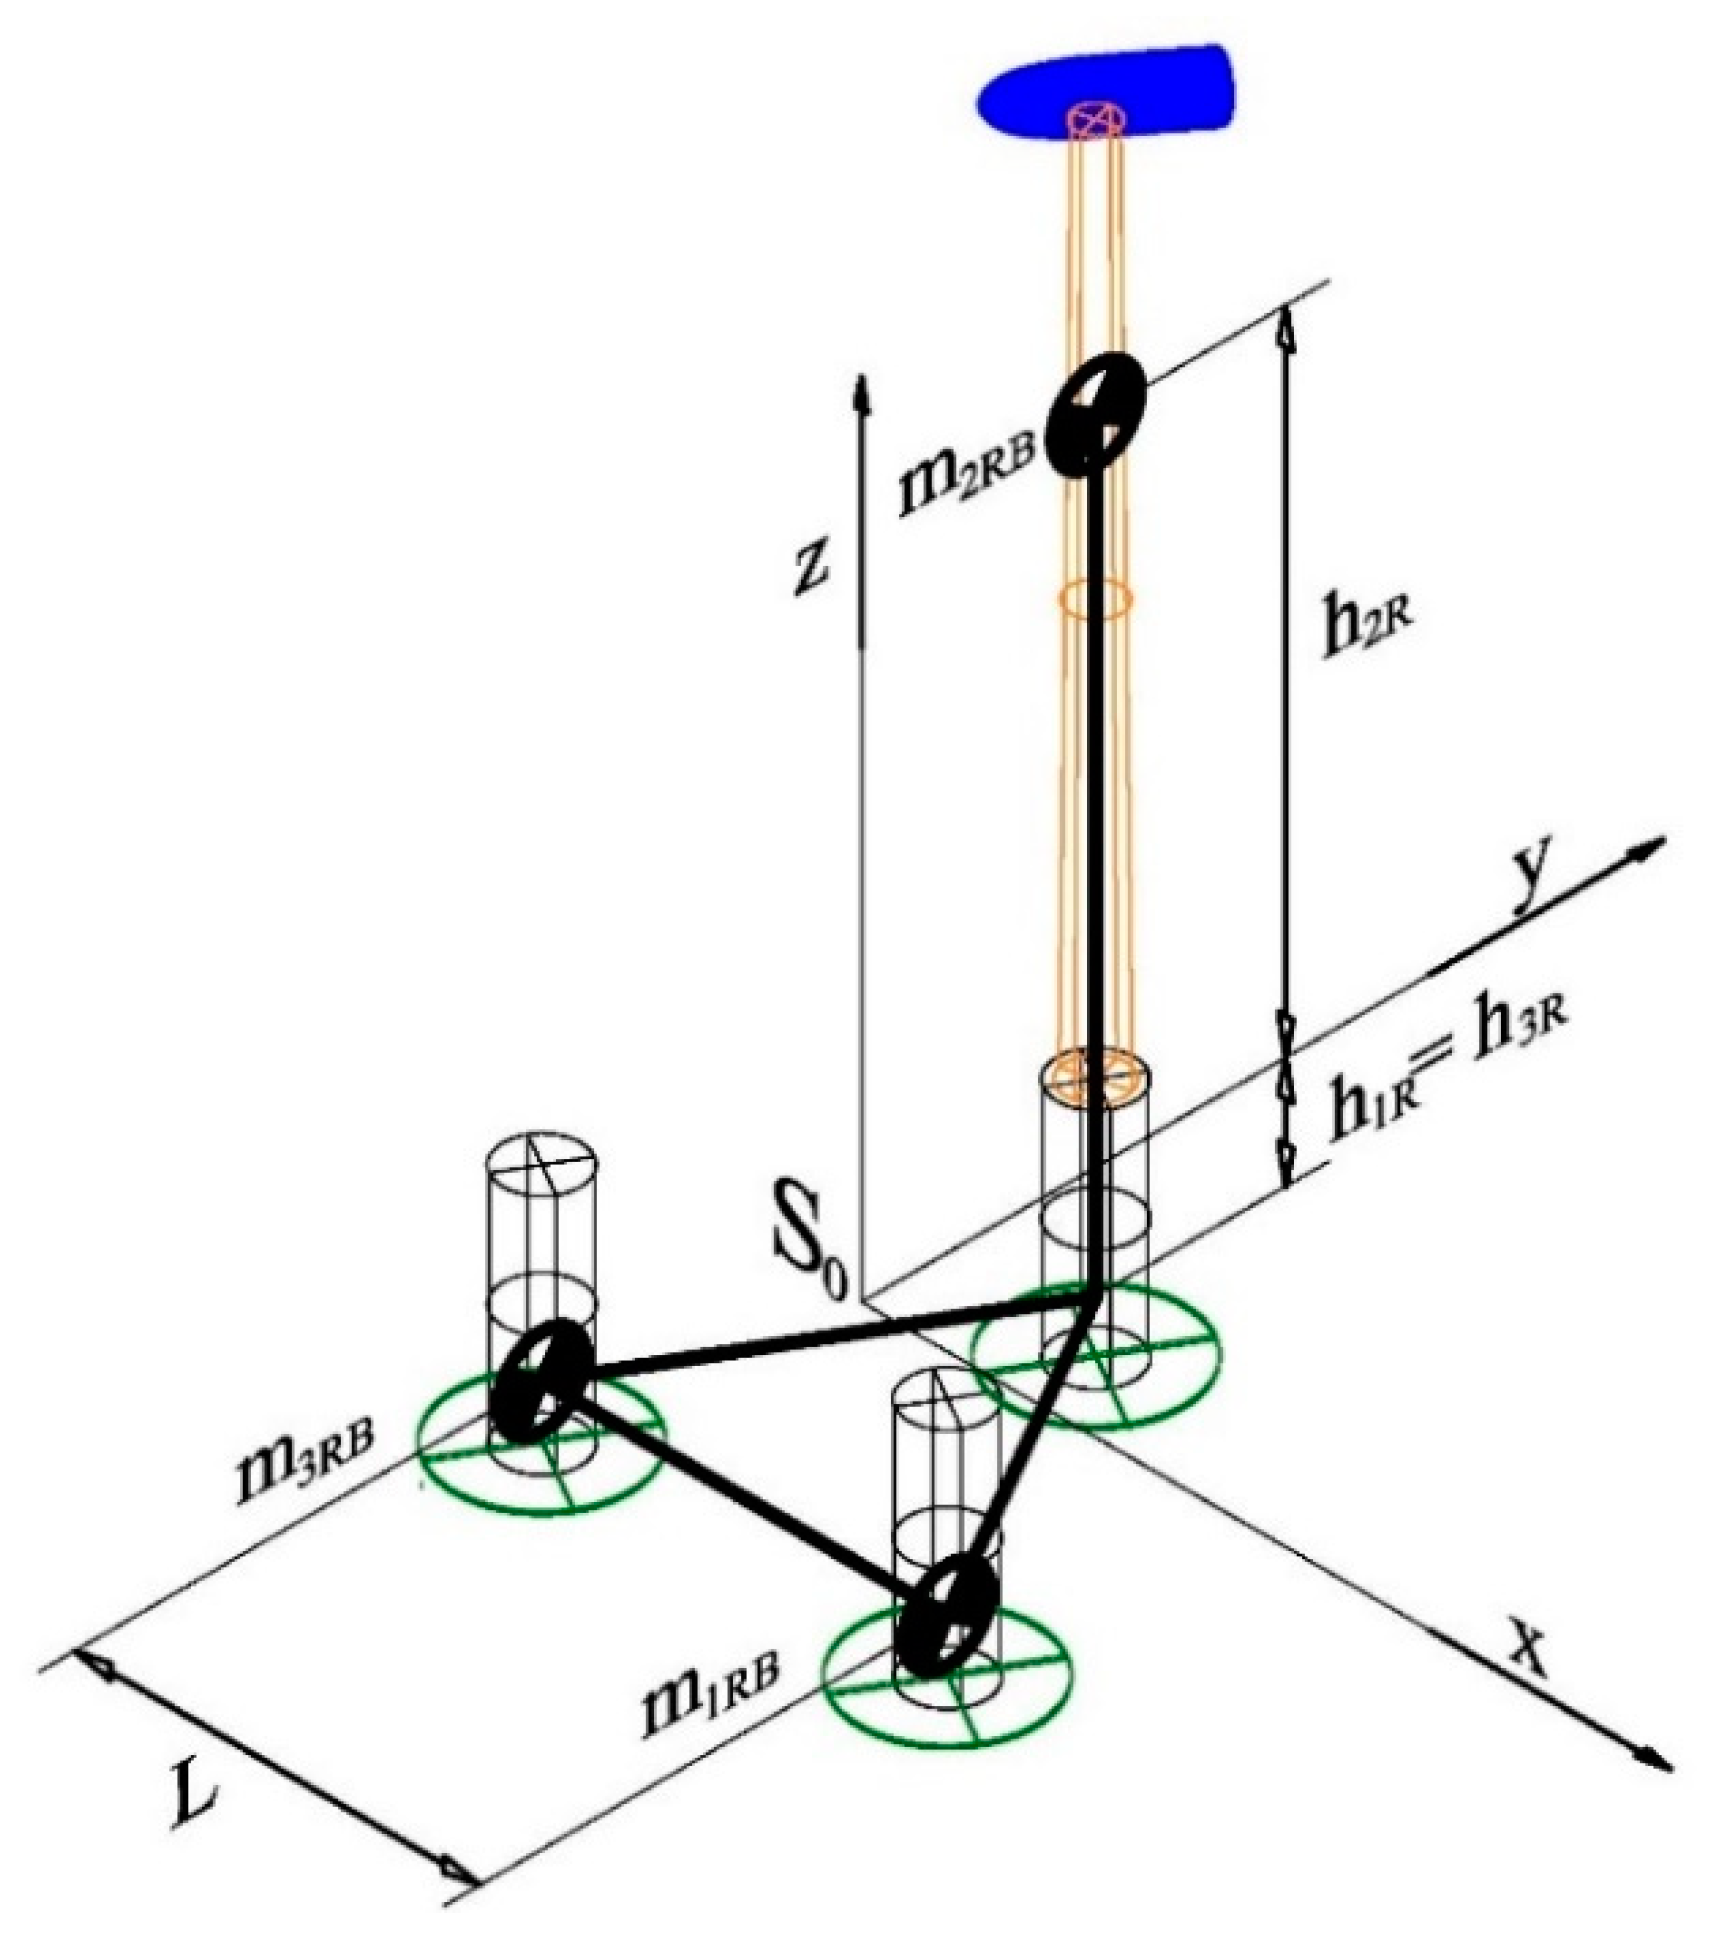
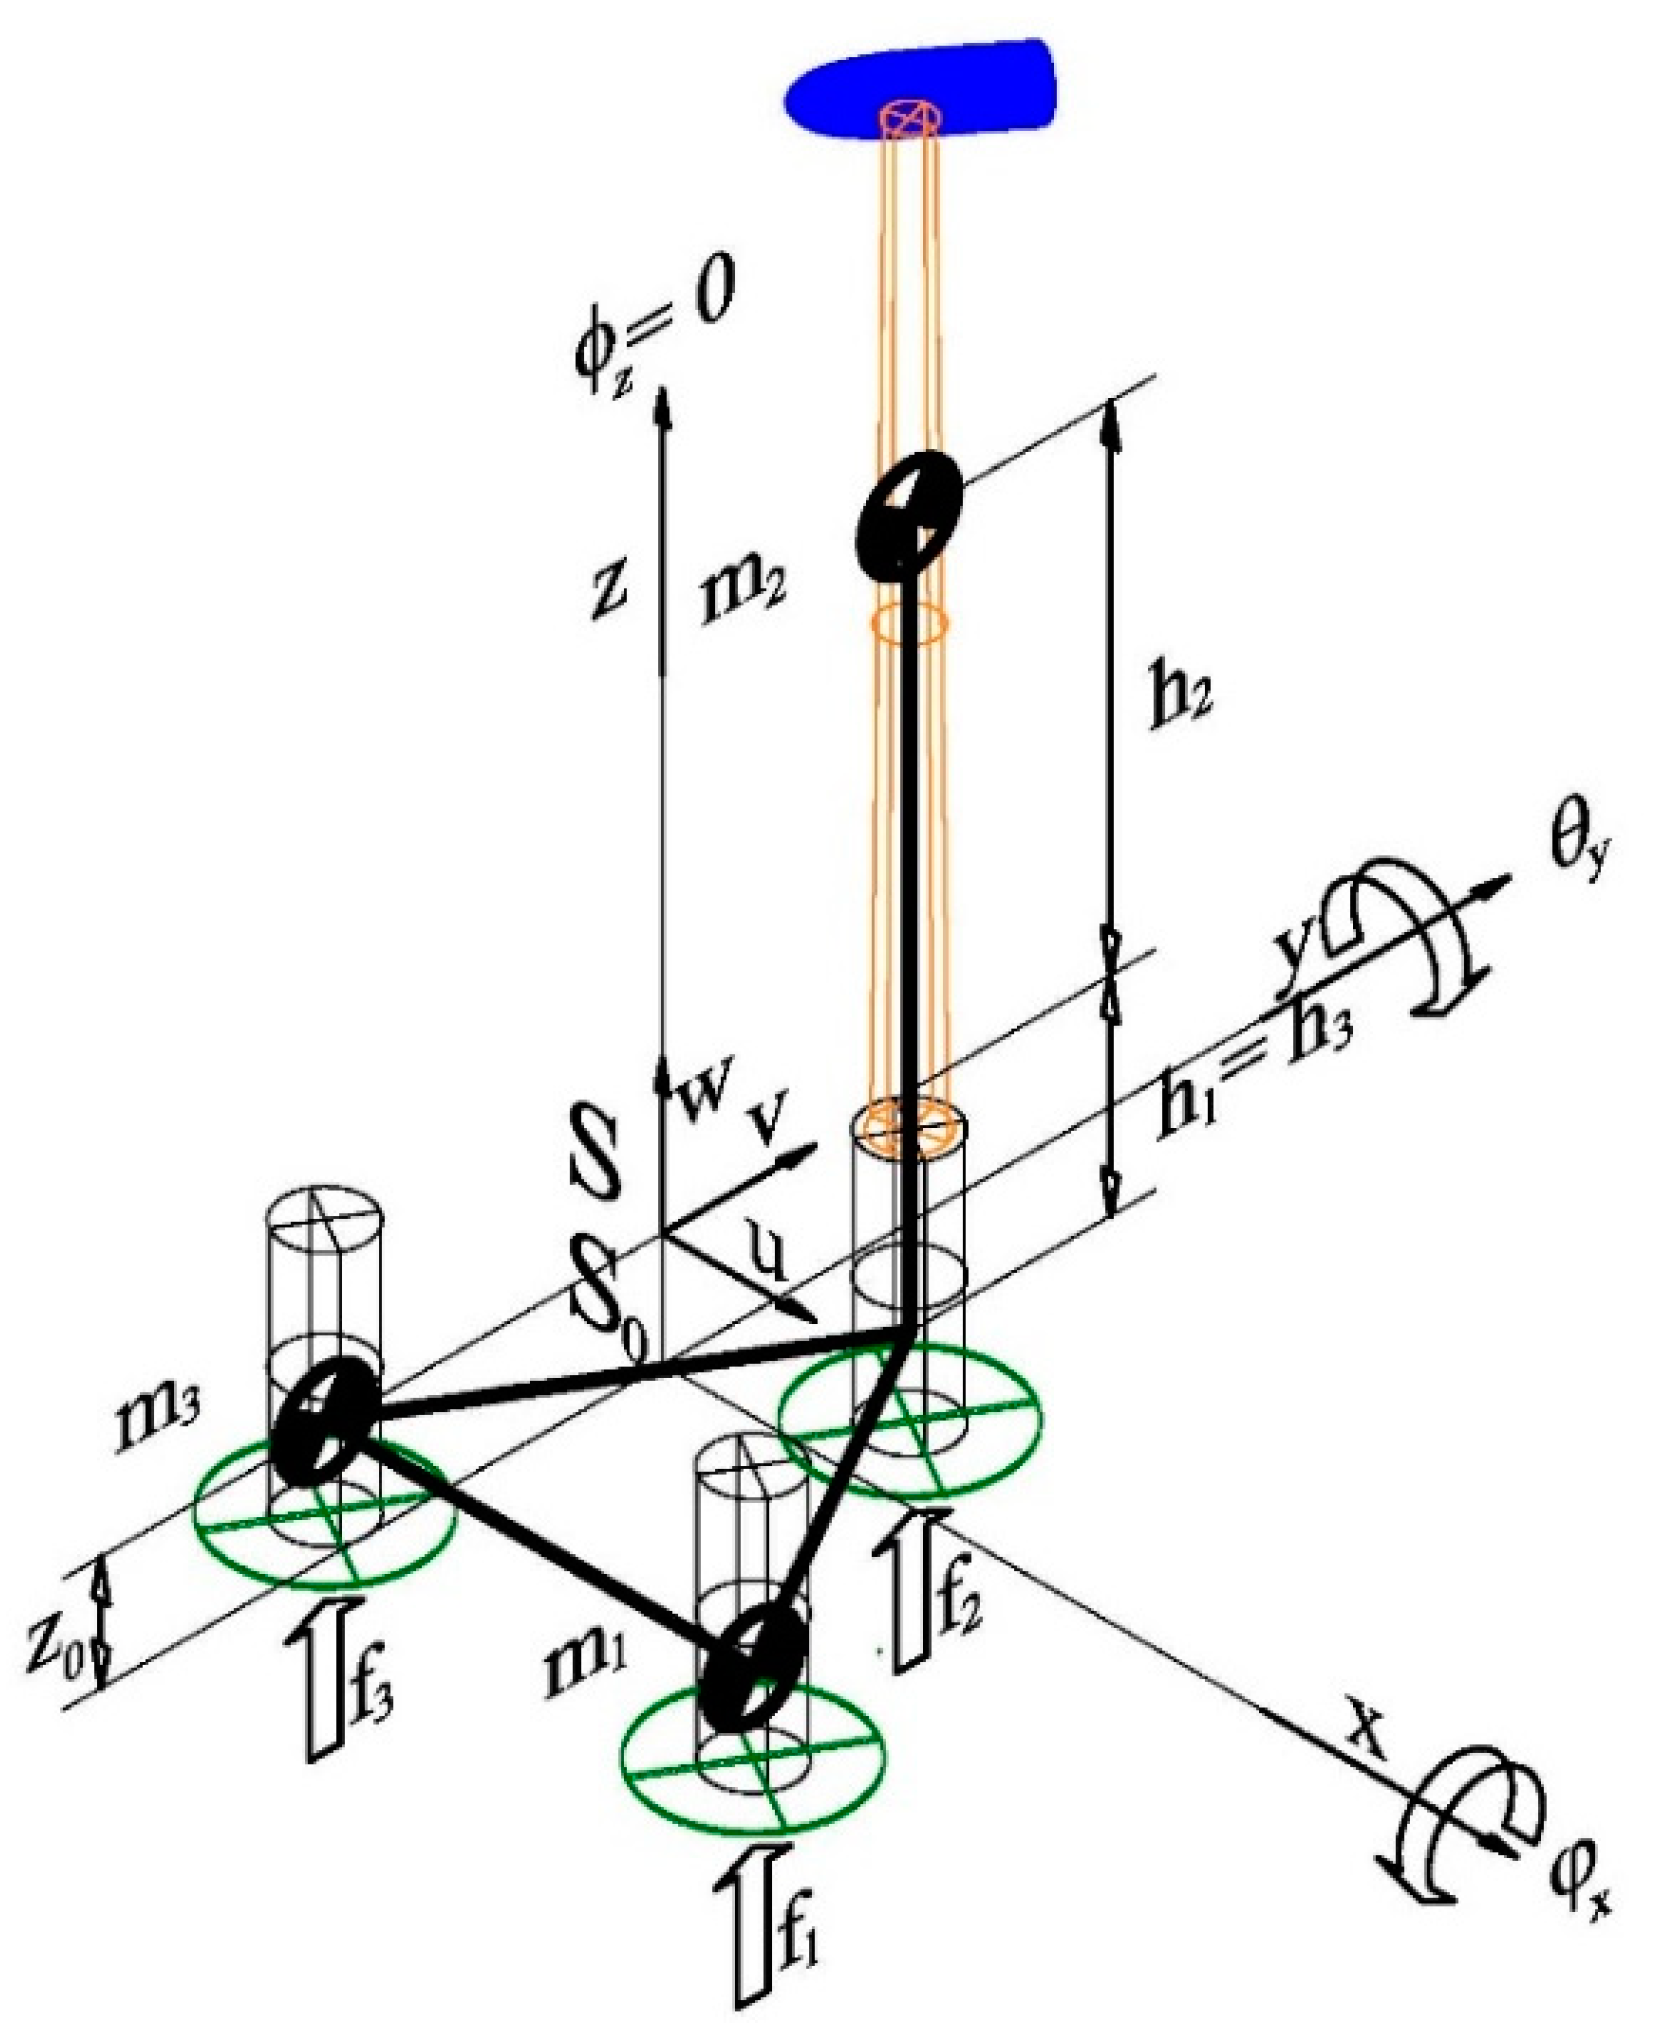
Let us define a fixed reference frame as an orthogonal reference defined by the orthogonal vector set whose -axis is vertically oriented. Its origin is at the geometrical center of an equilateral triangle of side that comprises the cylinders in the device at zero depth (), which is computed at the level of the sea (free surface). The horizontal plane of coincide, therefore, coincides with a perfect, undisturbed flat free surface of the sea.
According to
Figure 2, the proposed locations of the three lumped masses with respect to
are:
This location of masses leads to the local center of gravity (CoG) vector results of
with respect to
. Under the hypothesis that
;
;
and
, where
denotes the distance along the z axis for each i-th rigid body mass, in accordance with
Figure 2:
Let
denote the part of the volume (for
) of fluid displaced by the device in a perfect flat sea, without any kind of mooring system and associated with the i-th mass (and cylinder or column),
be the water density and
be the acceleration of gravity, both considered constant. The resulting restoring forces for each mass are balanced and they are:
The volume represents the submerged part of the i-th column (including its flat-plate, structural elements as braces, etc.) corresponding to the i-th mass. If the volumes associated with each part of the whole device (including the not submerged parts) are denoted as , where , and under the previously mentioned hydrostatic equilibrium conditions , the wind generator floats and remains stable with null orientation.
Owing to the need to obtain a stable nominal hydrostatic equilibrium and good buoyancy conditions, a more extensive study has been carried out by using the MAXSURF Software [
30], which makes it possible to obtain the main hydrostatic parameters. We employed the stability conditions and the displacement for the proposed platform based on the 3D CAD model with the main dimensions shown in
Table 1, above.
The main hydrostatic parameters were obtained without any kind of mooring lines, in the absence of any kind of environmental disturbances and under a static flat and horizontal sea, and are summarized in
Table 3, below.
The notation employed corresponds with that usually used in naval architecture. The metacenters, KMs (denominated as KM_T when the platform rotates around the -axis and KM_L when it rotates around the x-axis) are the vertical lines through the new center of buoyancy for the heel platform with each of the vertical lines through the original center of buoyancy to the lowest part of the platform, denoted as KB.
The platform is considered stable because the metacenter is greater than the height of the center of gravity at the lowest part of the platform, denoted as KG. The resulting torque will give the floated heeled body a rotation in the opposite direction to the tilt, thus allowing the body to return to its initial position.
There is no regulation that is directly applicable to the case of offshore platforms for wind turbines, and we have, therefore, employed the offshore oil and gas standards of Det Norske Veritas DNV [
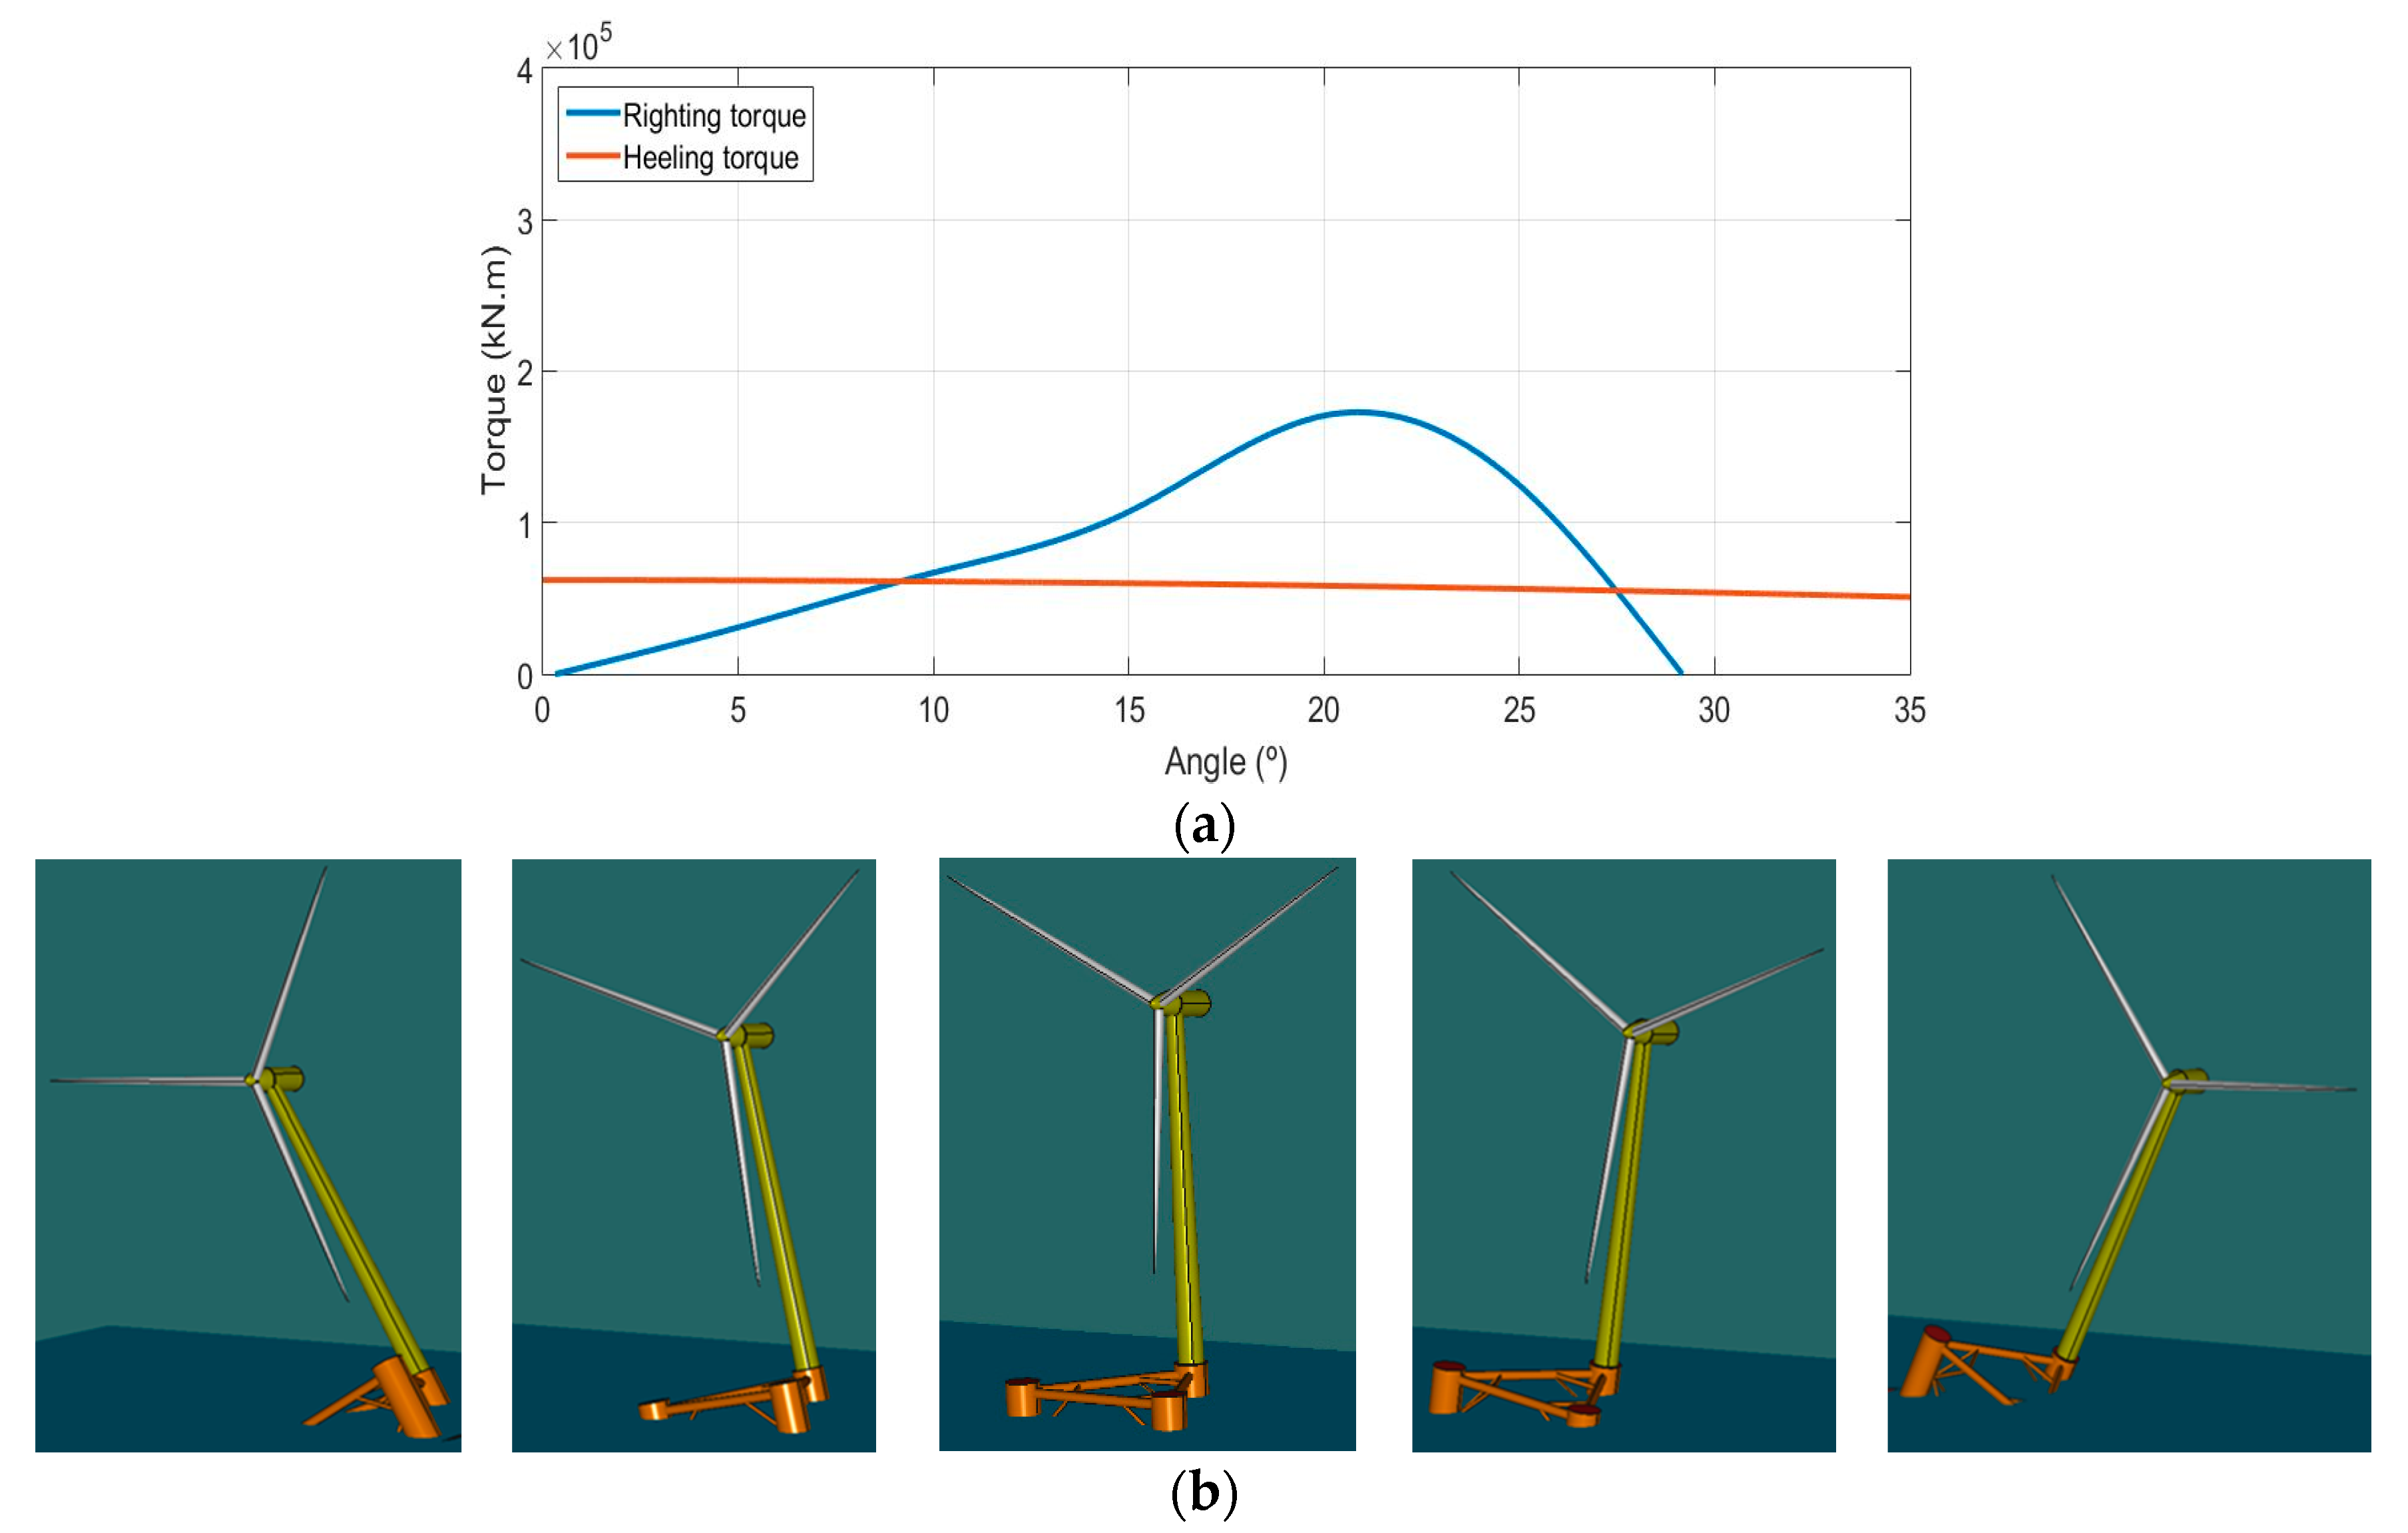
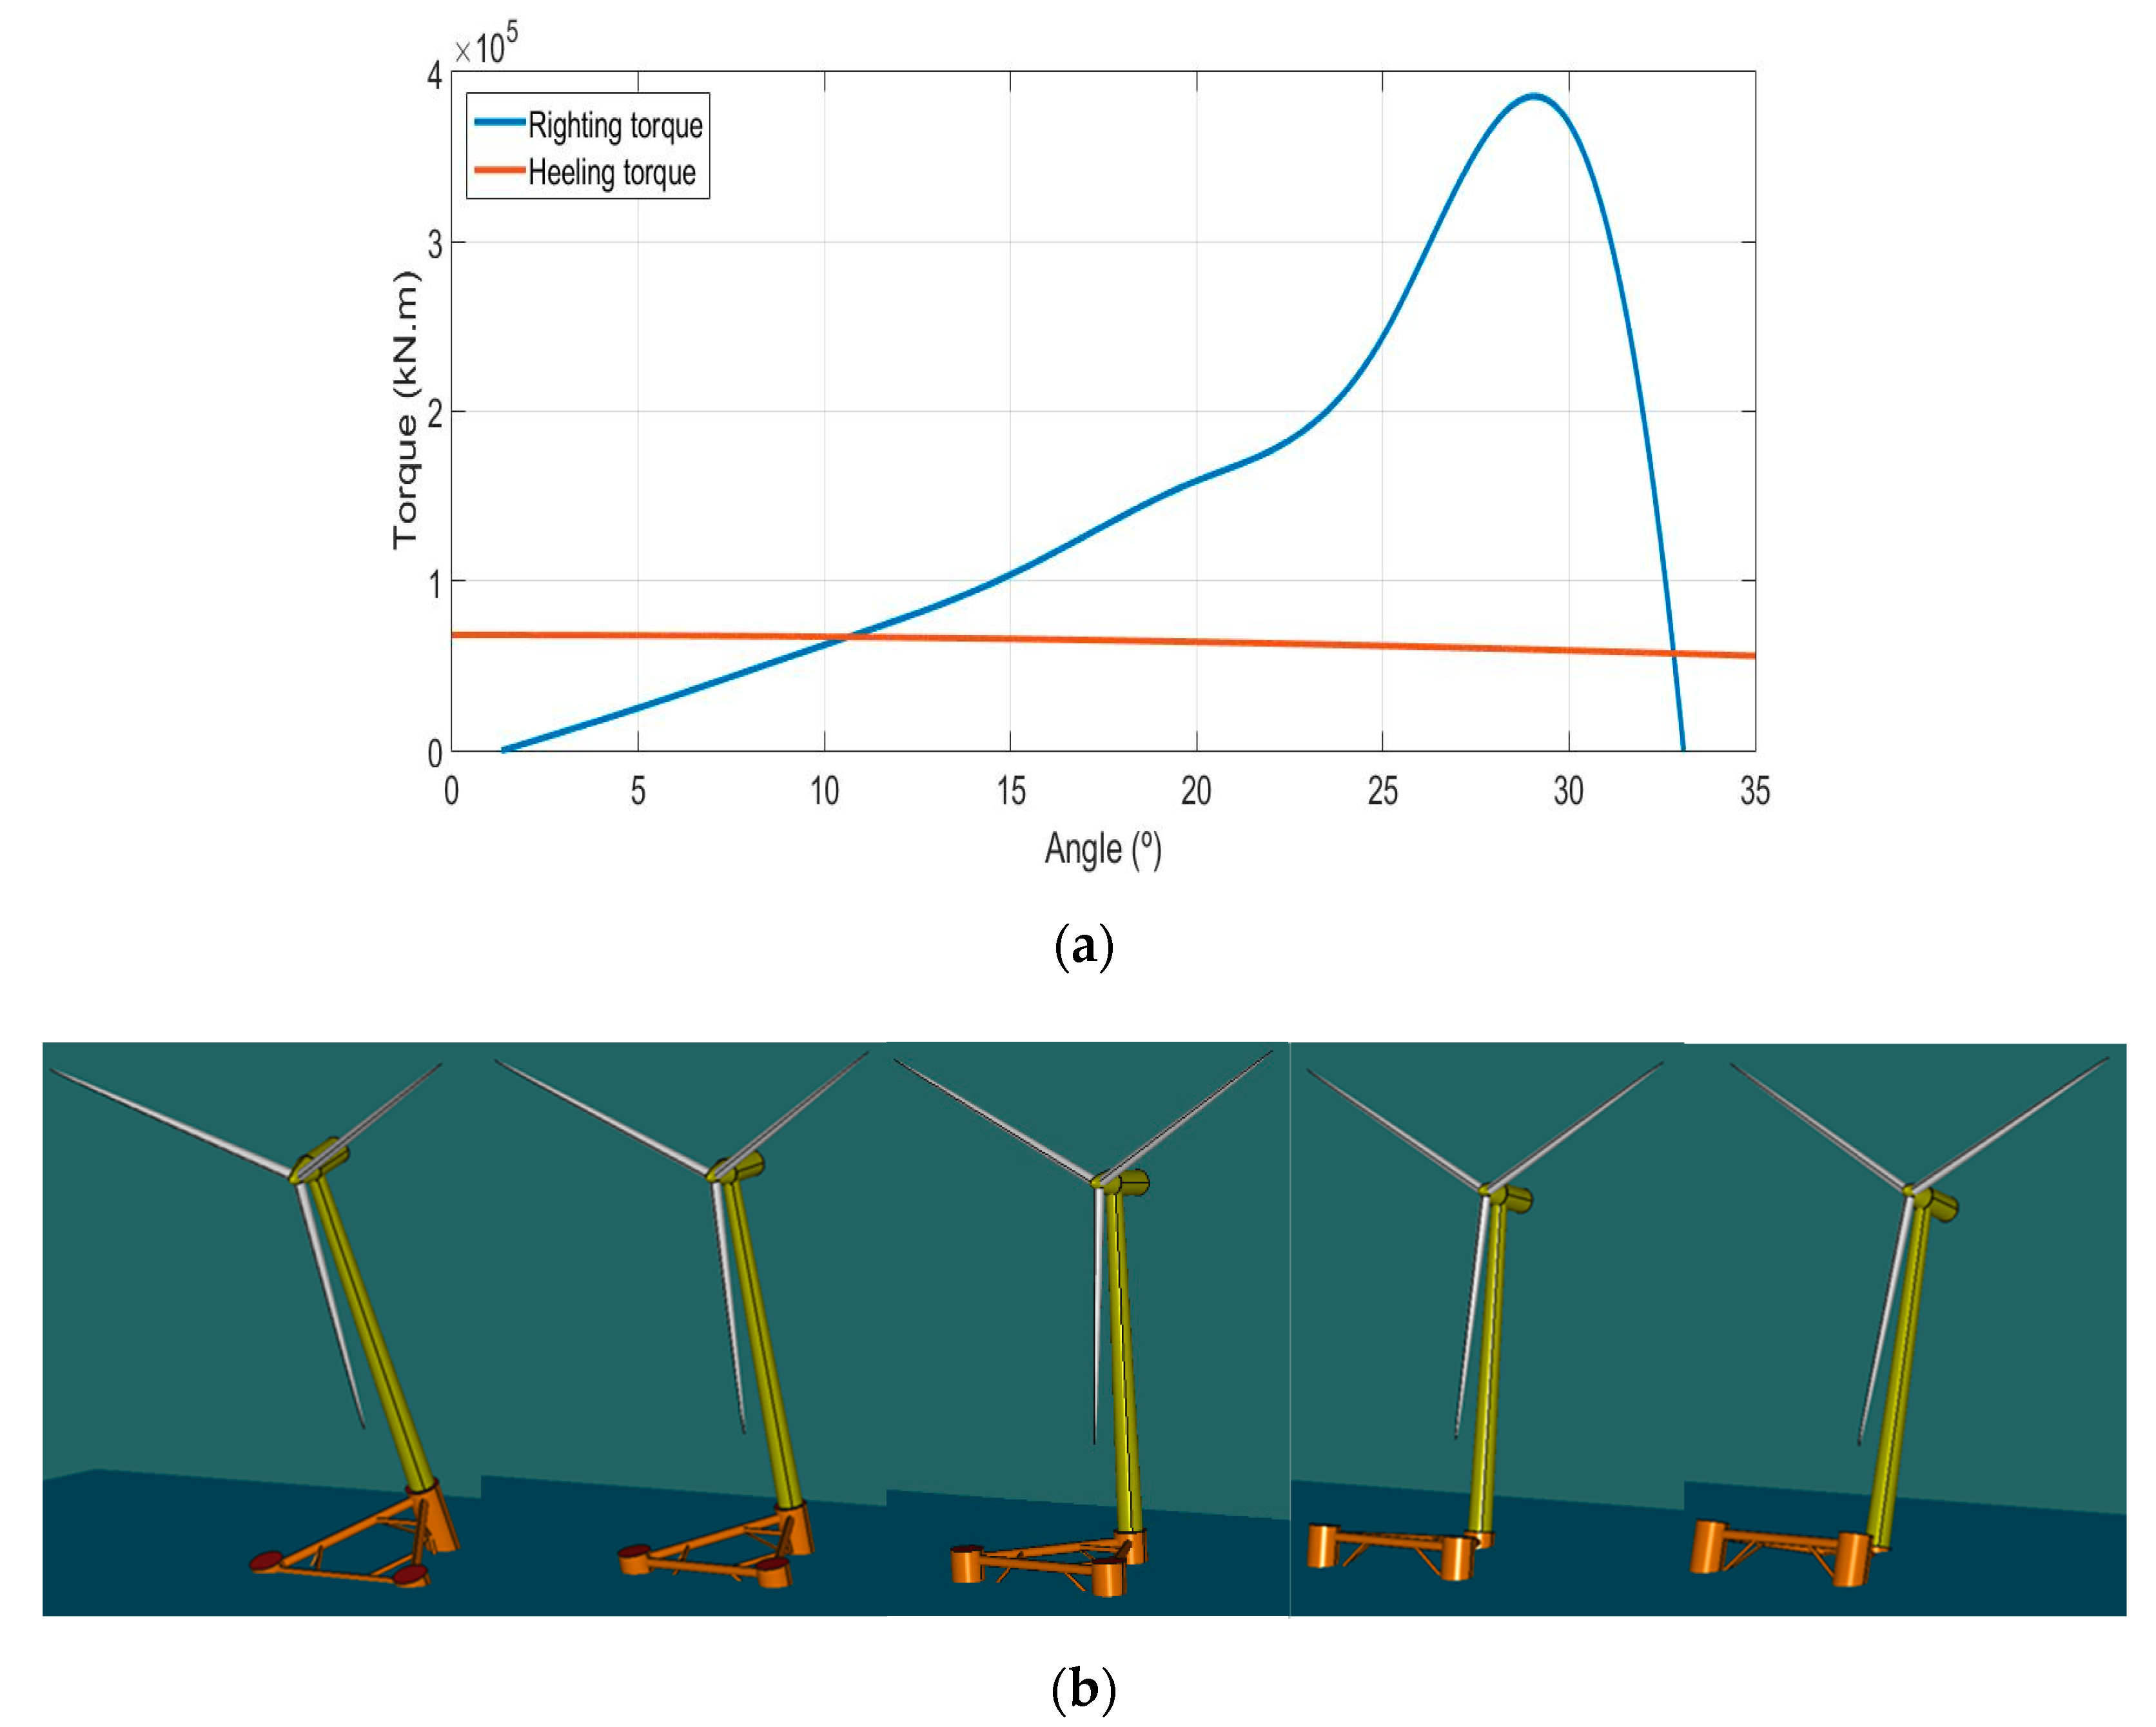
31]. According to this rule, when measuring the intact stability of the platform, the criteria are based on comparing the righting torque curve, at constant displacement, with the heeling torque curve caused by the wind, both as a function of the heel angle. The criteria of this standard are summarized in the following points:
The area under the righting torque curve (ART) at the second intercept must not be less than 30% in excess of the area under the wind heeling torque (AHT) curve at the same limiting angle;
The first intercept must be less than 15°;
The righting torque curve must be positive for the entire range of angles, from upright to the second intercept.
The stability has been verified only for operating conditions and according to DNV, and the heeling torque is owing to winds with a speed of 50 knots. These curves, which were obtained with the MAXSURF Software, are interesting for the transverse axis of the vessel, but in the case of the platform, the curves for both axes contained in the sea surface plane
, were studied, because they had two degrees of freedom (DoFs), to be controlled. The corresponding graph for the y-axis is shown in
Figure 3a, while that for the x-axis is shown in
Figure 4a. These figures make it possible to appreciate that criteria ii. and iii. were fulfilled. Point i. of the criteria was verified with the data obtained with the MAXSURF Software, which are summarized in
Table 4 (Areas in m
2).
Mooring Lines Effect over the Device
Figure 5 (below) shows the xy-plane view of the proposed disposition of the mooring lines from a local perspective. They were attached from the bottom of each of the heave-plates to the seabed. A different number and diverse disposition of mooring lines can be used (see [
22] a.e.). Only three mooring lines were considered here because this was the minimum number of catenaries required in order to fix the device to the seabed.
The catenaries are located symmetrically, and the angles of these three catenaries with respect to the z-axis are , and , respectively.
In situations of null orientation, all catenaries will be identically located and the cable tension T of each catenary will produce a force over the base of the column (including its heave plate), which is (notations
and
are used for the sake of simplicity):
where
denotes the angle that forms the
i-th catenary with respect to the horizontal plane. The effect of the mooring lines on the device is the following force:
It is easily observed that in the absence of any kind of marine current, there will not be any displacement in the x–y plane, but that the mooring lines from the perspective of the hydrostatic analysis will produce only a vertical displacement. By adding this effect to Equation (3), the new hydrostatic equilibrium point, therefore, results in:
The hydrostatic force in heave will consequently be different with respect to that provided by Equation (3) in the sense that the heave displacement that the catenaries produce on the device is newly restored by incrementing the displaced volume (
). The whole difference is:
If perfect cylindrical shapes were considered, the increase in the vertical displacement of the device owing to the catenaries could be easily obtained as
, where
is the extern radius of the columns. Due to the presence of complex shapes, such as structural reinforcements, pontoon or bracing, and without taking into account the effects of disturbances such as biofouling, among others, this vertical displacement was obtained from the exhaustive numerical analysis using MAXSURF. The final coordinates of the CoG with respect to
obtained according to Equations (6) and (7) were provided by Equation (2), with heights of the masses
which were obtained in this final hydrostatic equilibrium and are represented in
Figure 2, above.
4. Dynamic Model
Obtaining a dynamic model of the previously shown device, which is provided with two degrees of freedom (DoFs), was an essential stage when designing the controller. The proposed model falls in the category of a “Control Design Model” [
32], and is considered to be a very simple model, if not the simplest. It is based on the following assumptions (in addition to assumption (i) shown in
Section 3):
- (i)
The vertical motion of the generator is ignored, because the water ballast is pumped only among the ballast tanks.
- (ii)
The displacements of the center of gravity are negligible when ballast handling moves water among tanks.
- (iii)
The added masses of the submerged part are constant, well known, and considered to be lumped.
- (iv)
Viscous friction is modeled as being constant and is considered to be fully uncoupled.
- (v)
Restoring effects are computed geometrically.
- (vi)
Only small angle variations are considered, because the main issue of the proposed controller is to maintain the vertical orientation of the generator.
The most important simplification of the dynamic model was stated in the previous section and consists of computing the dynamics for only three lumped masses of identical value. Any number of finite masses with suitable values can, of course, be used.
A new local reference frame
defined by orthogonal vectors
is linked to the turbine and located at its own center of gravity (CoG). Let us define the two DoF (only the rotations around axes
x and
y are computed) as
and
respectively, which allow the frame
to rotate with regard to the fixed reference frame
. These variables are grouped as a generalized coordinate vector
. This reference frame
is, therefore, displaced by only a vertical distance
with respect to
when the turbine is arranged with a null orientation (
), as shown in
Figure 6.
Once the fixed ballast (based on concrete, steel or other) and the fixed buoyancy tanks have both been adjusted in order to obtain good stability performance and null orientation, as shown in
Section 3, above, the active hydrostatic actuators are considered (a proposal for active hydrostatic actuators was provided in [
33]). These are responsible for creating the restoring forces that move the device, and they are ideally located in the same positions in which each of the three active ballast tanks of water associated with its cylinder are considered to be placed. These actuators will produce only vertical component forces that are obtained as differences between buoyancy forces and forces owing to gravity caused by water handling. For the sake of simplicity, forces from the actuators are considered as only buoyancy forces, which is in accordance with simplification (i), above, which defined masses as constants.
From an inertial point of view, each of these masses is formed of both the rigid body mass
and the added mass
, which is also considered constant:
The net force of each of the elements (mainly cylinders) is obtained by computing the following forces: (a) that produced by the actuators (which is the multivariable control variable); (b) the loss of buoyancy, which is computed as the incremental volume that emerges outside the sea because of the motion of the device and (c) the incremental tension of the catenaries. The
i-th net force produced by the actuators is, therefore:
where
denotes the incremental volume of the
i-th hydrostatic actuator and is a time dependent variable:
.
4.1. Control Torques Produced by Actuators
The forces produced by each of the actuators are applied to the device. A detailed proposal of an actuator system was provided in [
33]. The application points of these forces with respect to the local reference frame
are:
where
denotes the vertical component of the ballast tanks with respect to the rotating reference frame
. When rotations around fixed axes x and y are produced, the real positions of each point with respect to
are obtained by using the composition of two basic rotation matrices [
34], as follows:
In order to compute the generalized torques from the hydrostatic actuators, and owing to the fact that the transfer of ballast water occurs internally, the sum of forces is null, that is:
. The torque vector produced by the actuators is, therefore:
Due to the location of the turbine over the 2nd column, as represented in
Figure 2, it is considered that
, which can be expressed as a function of only forces
and
by employing the following equation:
The relationship shown below is then obtained:
In Equation (15) it can be observed that the
-component of the torque is null, which justifies the fact that it is not possible to cause rotations along the z axis with only vertical hydrostatic forces in the proposed dynamic model (this result was previously represented in
Figure 6 as
).
If the torques around the
and
axes are grouped as
, and forces
and
are grouped as
, the final relationship between the control forces and torques results in what it is denominated as the coupling matrix:
where matrix
, results in a
-dependant well-defined term, and it relates the non-diagonal relationship between the forces and torques involved, which results in a strongly coupled, non-linear and time-dependent system.
4.2. Torques Owing to the Loss of Buoyancy
The submerged volume of each of the cylinders of the wind turbine does not remain constant if the orientation does not remain null
.
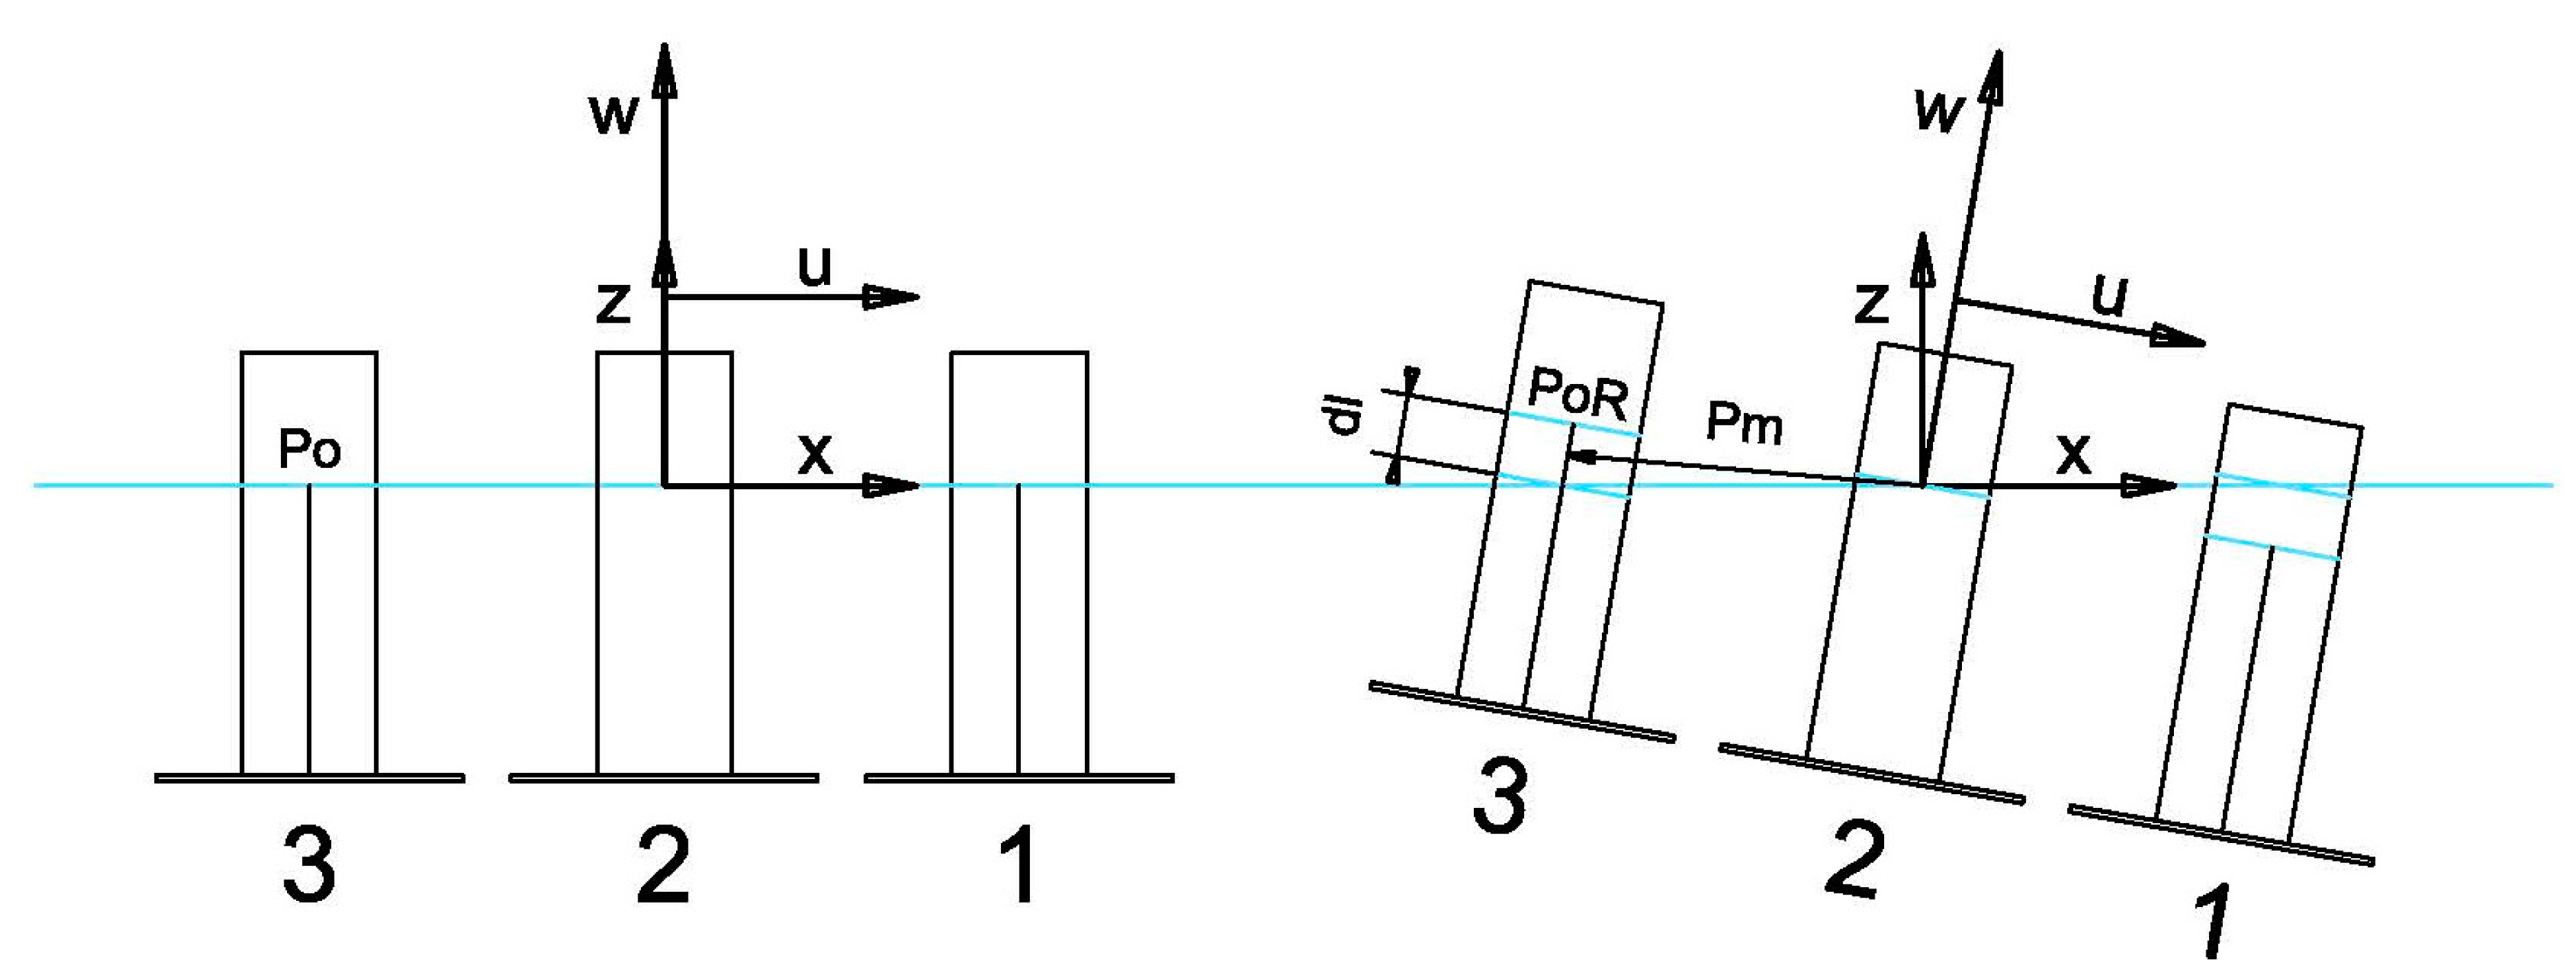
Figure 7 (below) shows the procedure used to obtain the torques owing to the loss of buoyancy. Only a brief schema of the columns of the wind turbine as cylinders with the heave-plates have been represented in this figure, and a rotation of an intentionally exaggerated angle of
has been drawn.
The intersections of each of the axes of their associated cylinders with the sea surface when the device remains vertical are points with notation similar to the points defined in Equation (1) or (10), but with null vertical components,
. They are denoted as
(the subindexes have been not represented in
Figure 7 for the sake of clarity). When the orientation of the device is not null, the straight lines that define the axes of the cylinders can be expressed in a parametrical form as follows:
where the points
denote the rotated points from
,
parameter of each straight line and
denotes the orientation of the rotated
-axis from the reference frame
that is obtained from the third column of
, provided in Equation (12).
For each cylinder, the parameters
are calculated as the intersection of the line defined by Equation (17) with the free surface (
(see
Figure 4, in which only one dl parameter has been represented in cylinder 3).
After obtaining the three parameters
from the previous equation, the equivalent volumes of the loss (or gain) of buoyancy and the associated vertical forces are:
where
is the inner radius of the water ballast tanks. The points of application of these vertical forces are:
and the torque owing to this loss of buoyancy is eventually obtained from the first two components (components
and
, only, because component
is null) of the following equation:
4.3. Torques from Wind
Wind speed changes continuously, so it is necessary to describe it statistically. Several functions can be used to describe the frequency of the wind speed distribution, such as the Weibull distribution [
35],
, where
β represents the shape parameter (also known as the Weibull slope) and
η denotes the scale parameter. The Weibull distribution of the wind speed is characteristic at each location. For a given wind velocity, the value of the forces on the hub of the wind turbine can then be estimated by means of a complex analysis, being of the form:
where coefficient
is a function of the tip speed ratio (TSR) and the shape of the blades, A is the area covered by the turbine blades,
is the air density and
denotes the speed of the wind. For any given rotor, the coefficient
is well known and is tabulated as a function of the TSR.
Although this force must be considered as a distributed set of forces over the rotor, because the hub and the low-speed shaft of the generator concentrate all the rotor efforts. These forces can be considered concentrated and their absolute value is denoted as
. In a matrix notation, where
is the angle of incidence of the force over the hub of the gondola with respect to the horizontal plane
, this results in:
The generalized torque from the wind effects on the hub is easily computed:
where distances
and
determine the position of the hub with respect to system
(these were intentionally omitted from
Figure 2 for the sake of clarity).
4.4. Rotation Dynamics
In this subsection, the Lagrange formulation allows us to obtain the equations of motion for the wind turbine in the absence of any kind of external disturbances and frictions. The generalized coordinates are taken as previously: . For the computation of the Lagrange function, the kinetic and potential energies are computed beforehand.
4.4.1. Local Inertia Matrix
The inertia matrix with respect to reference system
is obtained from the proposed lumped mass distribution. It can be written as a symmetric and positive definite matrix:
The values of the coefficients of the inertia matrix are shown in
Appendix A. Under the hypothesis of perfect symmetry,
, and
, matrix
becomes simpler:
4.4.2. Computation of the Rotation Kinetic Energy
The kinetic energy of the wind turbine when rotations on first the
-axis and then the
-axis are applied is given by:
where
and
denote the angular velocities over axes
and
, respectively. By substituting Equation (26) with
and Equation (12) in Equation (28), we obtain:
4.4.3. Computation of the Rotation Potential Energy
The above-mentioned absence of any kind of disturbance, and the hydrostatic equilibrium depicted in
Section 3, signifies that the total potential energy has a zero value under these conditions.
4.4.4. Lagrange Formulation
Upon employing Lagrange’s equations, expressed by:
where
is the Lagrange function
,
and
is the sum of external torques, the final model is obtained (see the coefficients of matrices
and
in
Appendix A.
where the torque owing to the friction terms is approximated by employing two uncoupled quadratic functions with a constant friction coefficient according to assumption (
v) and is a
dependent function.
The remaining control variables on the right-hand side of Equation (31) have already been defined: the control torques from the hydrostatic actuators were provided in Equation (16), the torques owing to the loss of buoyancy were defined as a function of in Equation (22), the torque owing to the thrust horizontal force over the rotor was defined as a function of in Equation (25) and, finally, denotes the unmodeled torques of the proposed model and the effects of the wind on the rest of the structure, from the waves and from the mooring lines, which are also considered as unmodeled external disturbances.
4.4.5. Proposed Dynamic Model
By grouping all of the torques that have been modeled, with the exception of the control torque, a function
is defined:
Equation (32) can, therefore, be rewritten in a simplified form as:
5. Proposed Control
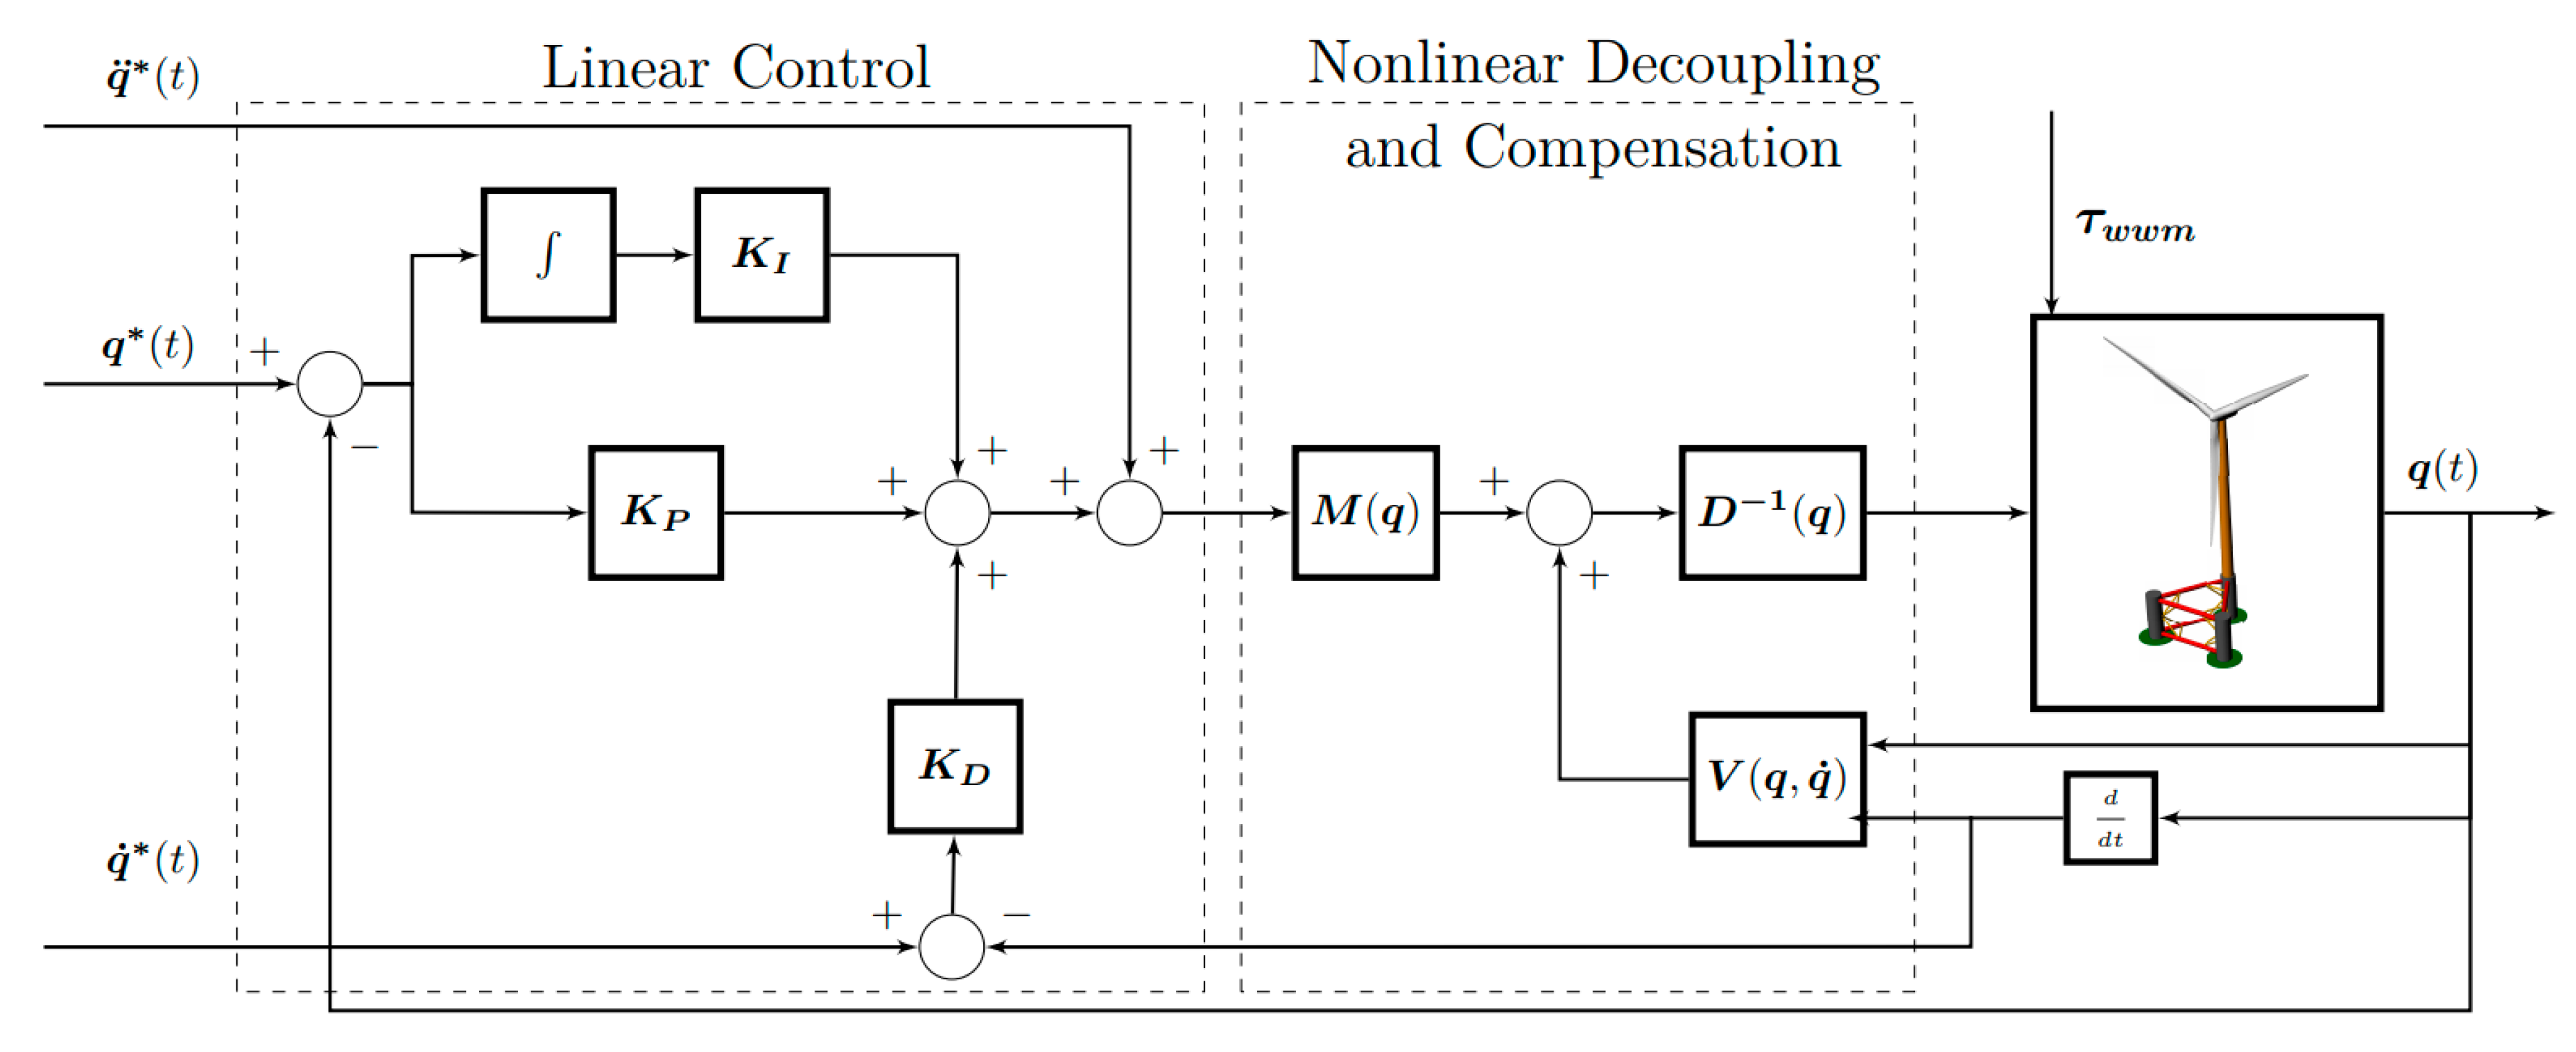
Figure 8 illustrates the proposed control system for the two DoF wind float studied herein. Let us define a desired reference for both axes x and y in the form of time functions:
and
, respectively. A nonlinear feedback controller is used to accomplish the tracking of the desired controlled variables, which is intended to maintain their null value,
, and which is given by (time dependence is omitted):
In which the auxiliary control signal
is synthesized as follows:
, and are diagonal positive definite matrices that denote the parameters of a vector-value classical uncoupled multivariable proportional-integral-derivative (PID) controller.
As will be noted in
Figure 8, the control scheme is composed of an inner non-linear loop based on the proposed dynamic model and the outer loop based on classical PID controllers, which are responsible for obtaining the desired closed loop dynamics of the whole controlled system. The main objective of the inner loop is to obtain a linear and decoupled input/output relationship in the absence of any kind of external disturbance, which were included as
.
The sensorial system required in order to compute these non-linear terms has to be located in the device, and this is summarized as follows:
- (i)
An inertial measurement unit (IMU) is required in order to obtain the orientation variables and their time derivatives . All the terms of functions and can be computed from these signals, with the exception of the term and;
- (ii)
The strain gauge load cells located over the bearings of the rotor make it possible to compute by measuring the real thrust over the hub of the rotor and applying Equation (25) or;
- (iii)
By using the information captured by the vane and anemometer located on the gondola and estimating the force of the wind from tables of the known
coefficients [
24] and Equations (23)–(25).
The inner loop also requires the online computation of the inverse of the matrix that relates the control forces also provided by actuators and control torques , too. This matrix is invertible, with the exception of values of which are unattainable. Furthermore, the main objective of the outer loop is to stabilize the overall system. Once the matrix has been coupled to the dynamics of the system, this part of the controller design is highly simplified, since it operates an uncoupled multivariable time invariant system.
The dynamics of the closed loop tracking error vector
is obtained after substituting expressions (36) and (37) in (35). In the absence of any kind of external disturbance, the following expression yields:
The closed loop error, therefore, evolves governed by the following third order
multivariable differential equation:
whose time evolution of the error converges in an asymptotically-dominated manner onto a small as desired neighborhood of the origin of the phase space of the tracking error vector, depending on the design matrices of the outer loop of the controller
designed. These controller matrices must be designed so as to render the following
complex valued diagonal matrix
, defined as:
The desired closed loop dynamics is then proposed from [
36,
37]:
which can be defined as a function of only one design parameter
(in rad/s). A linear system with a monovariable characteristic polynomial provided by Equation (41) has a similar time response to the well-known critically dumped second order system with natural frequency
and a damping coefficient
. The controller design matrices
can then be directly obtained by equaling Equations (40) and (41).
7. Validation Results
This section shows the results of various simulations carried out to validate the correct behavior of the proposed control system with which to maintain the orientation of the previously proposed platform provided to a ballast system close to the null value.
The dynamic model implemented in OrcaFlex and the control system (37) described above were used to carry out numerical simulations with which to demonstrate the goodness of both in terms of controllability and the ability to achieve the desired orientation with the forces derives from the change in ballast.
7.1. Validation of System Decoupling
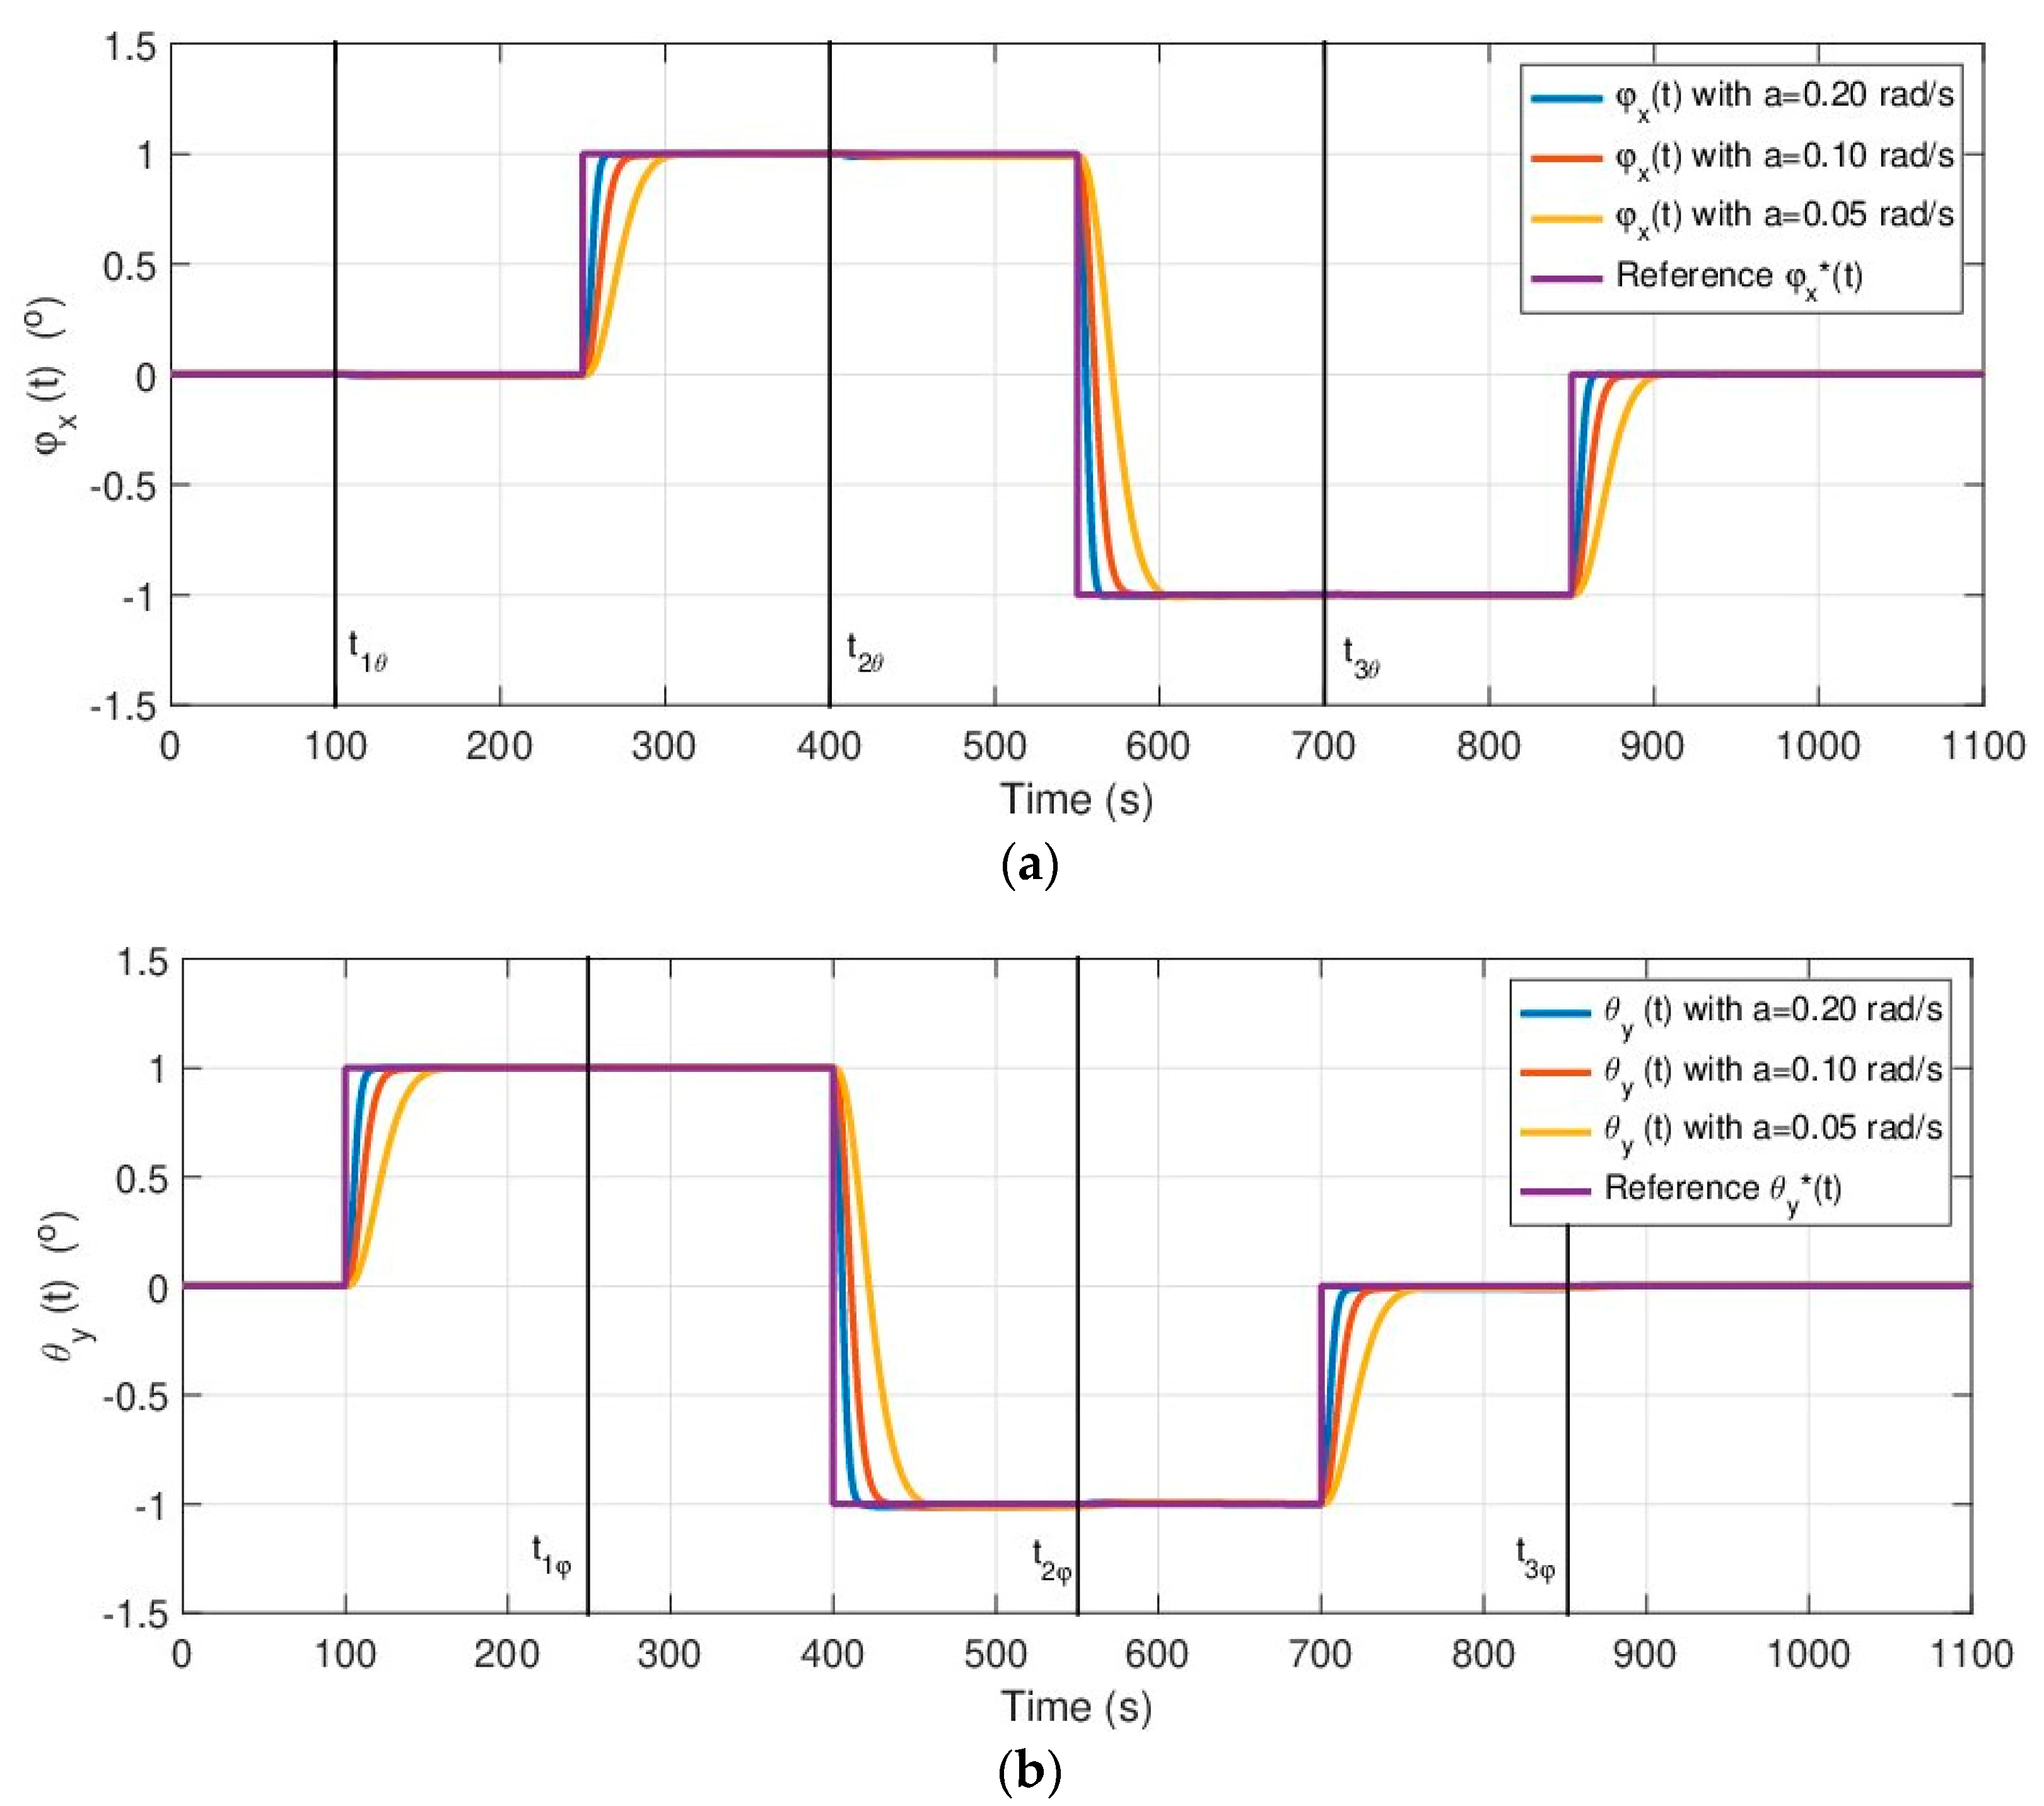
The set of simulations is formed for a step reference signal in the absence of external disturbances, such as the wind and waves, in order to validate the transient and steady state responses and test the dynamic decoupling between independent movements. Actuator saturation is not considered here, and a first order filter was used to obtain the time derivative of the output signals. The simulations in
Figure 12a show the temporal responses obtained for the variable
before a reference step signal,
, with an increase of
and transitions in 250 s, 550 s and 850 s. The regulator gains were obtained from (41) with the design parameter
, which takes the values
,
and
.
Figure 12b shows the reference signal
, corresponding to a step signal with the same increases and transitions at 100 s, 400 s and 700 s, and the temporal responses for the variable
, for the same values
. The initial operating point is taken as being
.
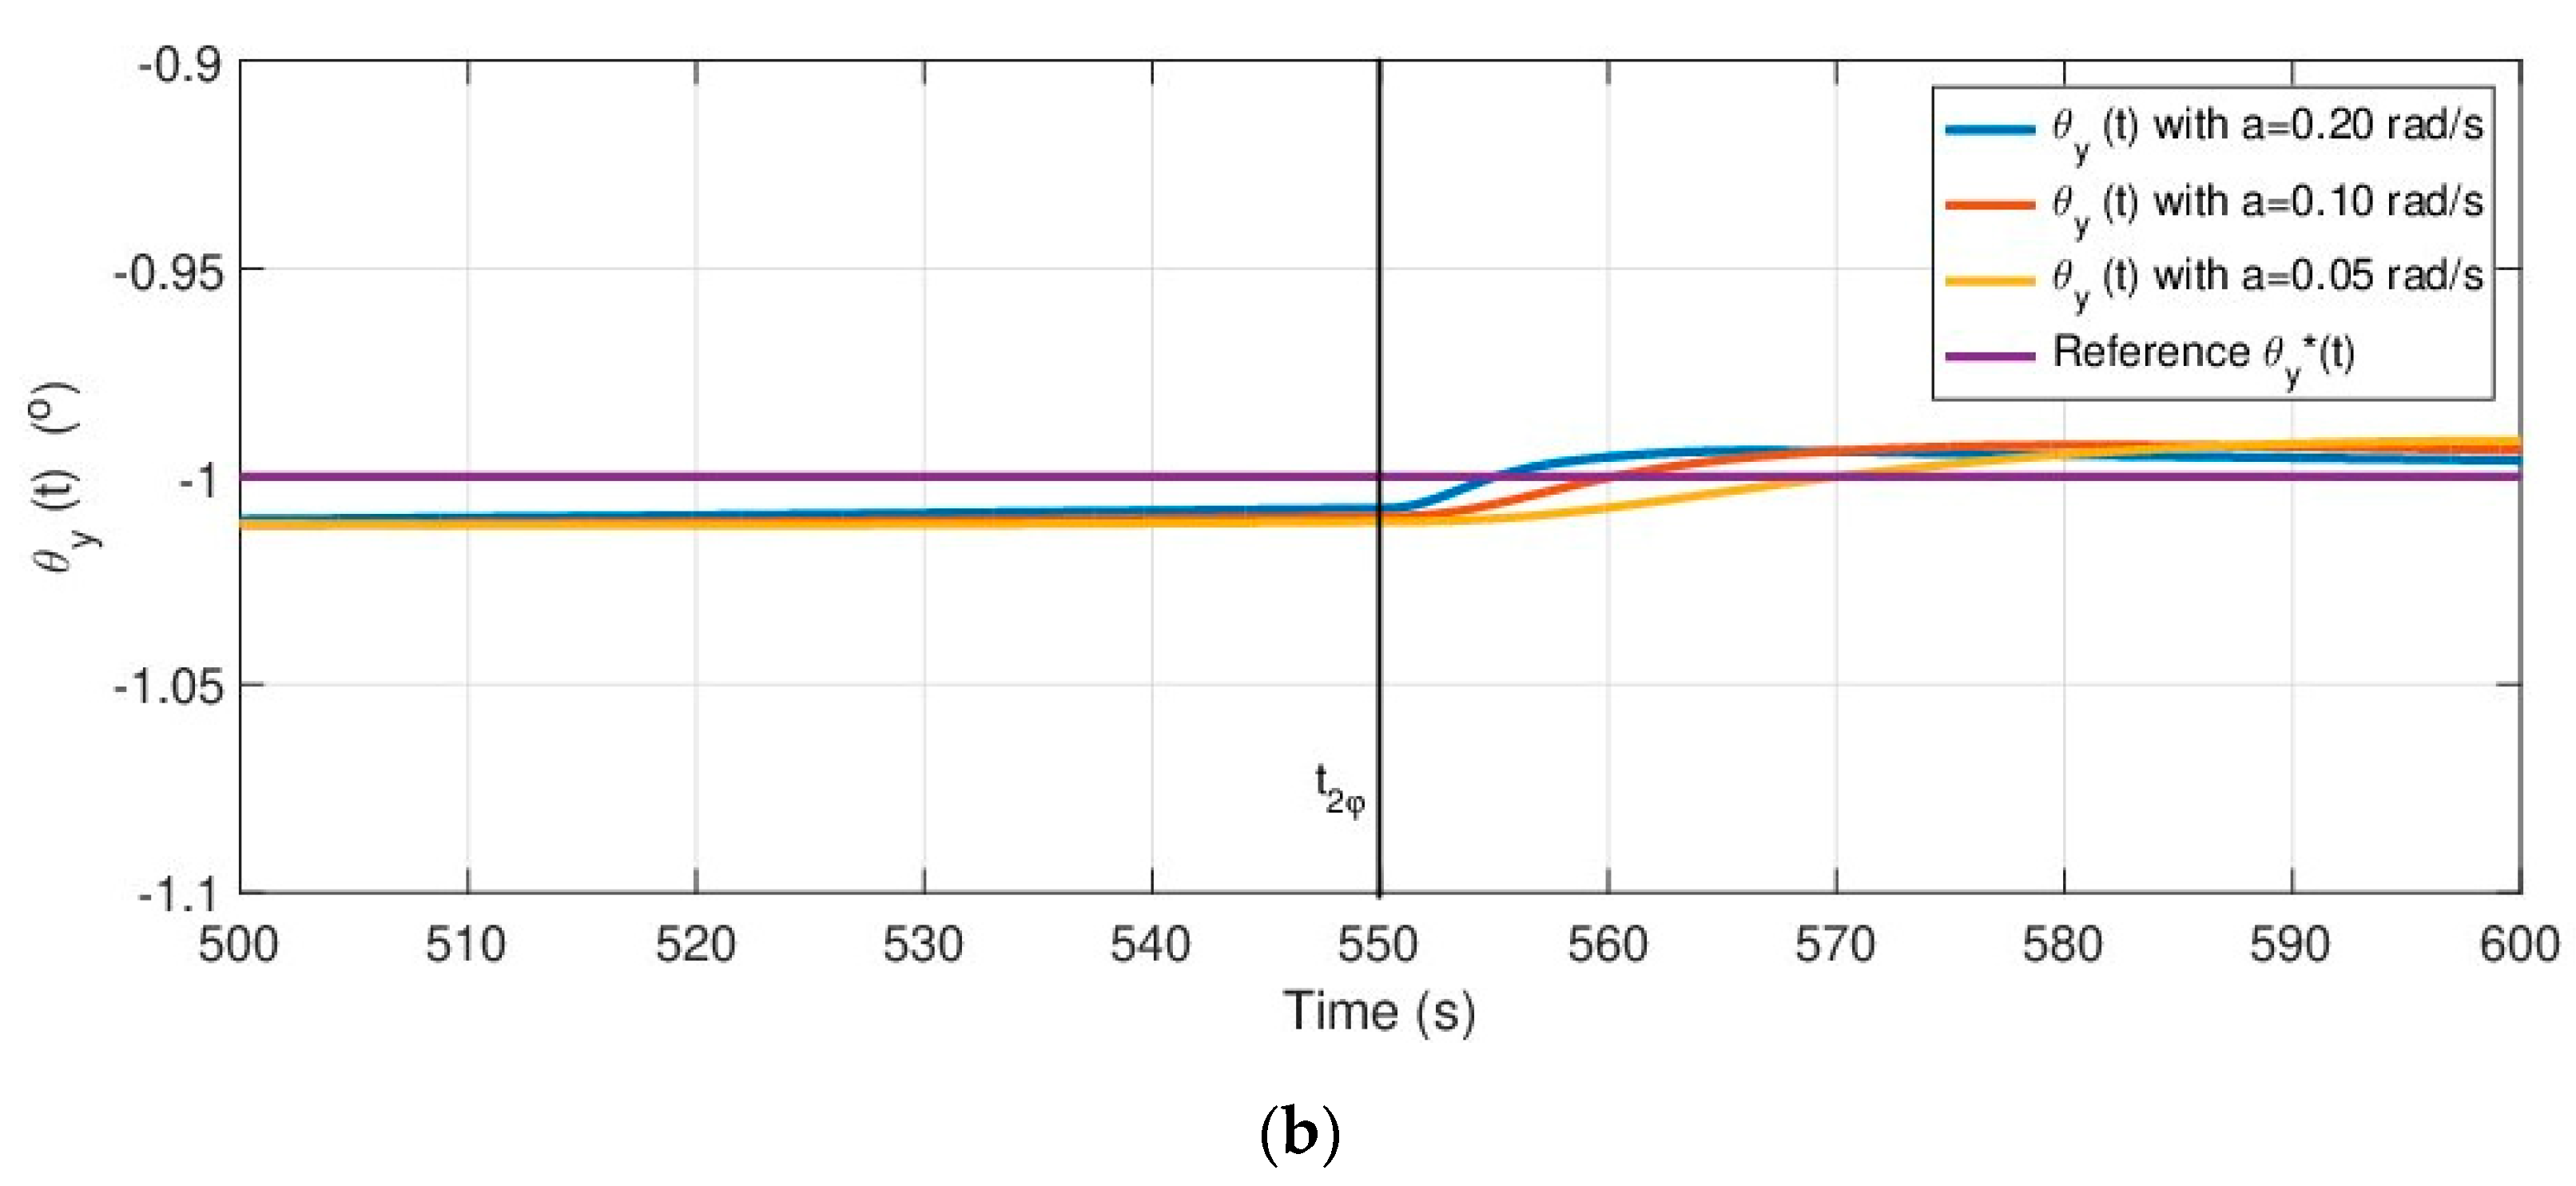
Figure 13a shows the zoom of the temporal responses
in the time interval
scan. The response was better while the closed loop dynamics was faster. The steady error was not fully canceled in the neighborhood of
, which was owing to the maximum change in the orientation
, and there was no perfect decoupling at all.
Figure 13b similarly shows the zoom of the temporal orientation responses
for the time interval
s, in which the maximum change in the orientation
occurred at
.
7.2. External Disturbances: Waves and Wind
Various environmental models can be used to achieve realistic simulations of any kind of marine device. In this work, a classical wave spectrum
was used as a function of both the frequency
and the direction
, with a Pierson–Moskowitz (PM) spectrum [
40]. Due to the closed loop dynamics expected for the device, owing to the presence of the superposed low frequency (LF) model and wave frequency (WF), only the LF effects will be considered as external disturbances.
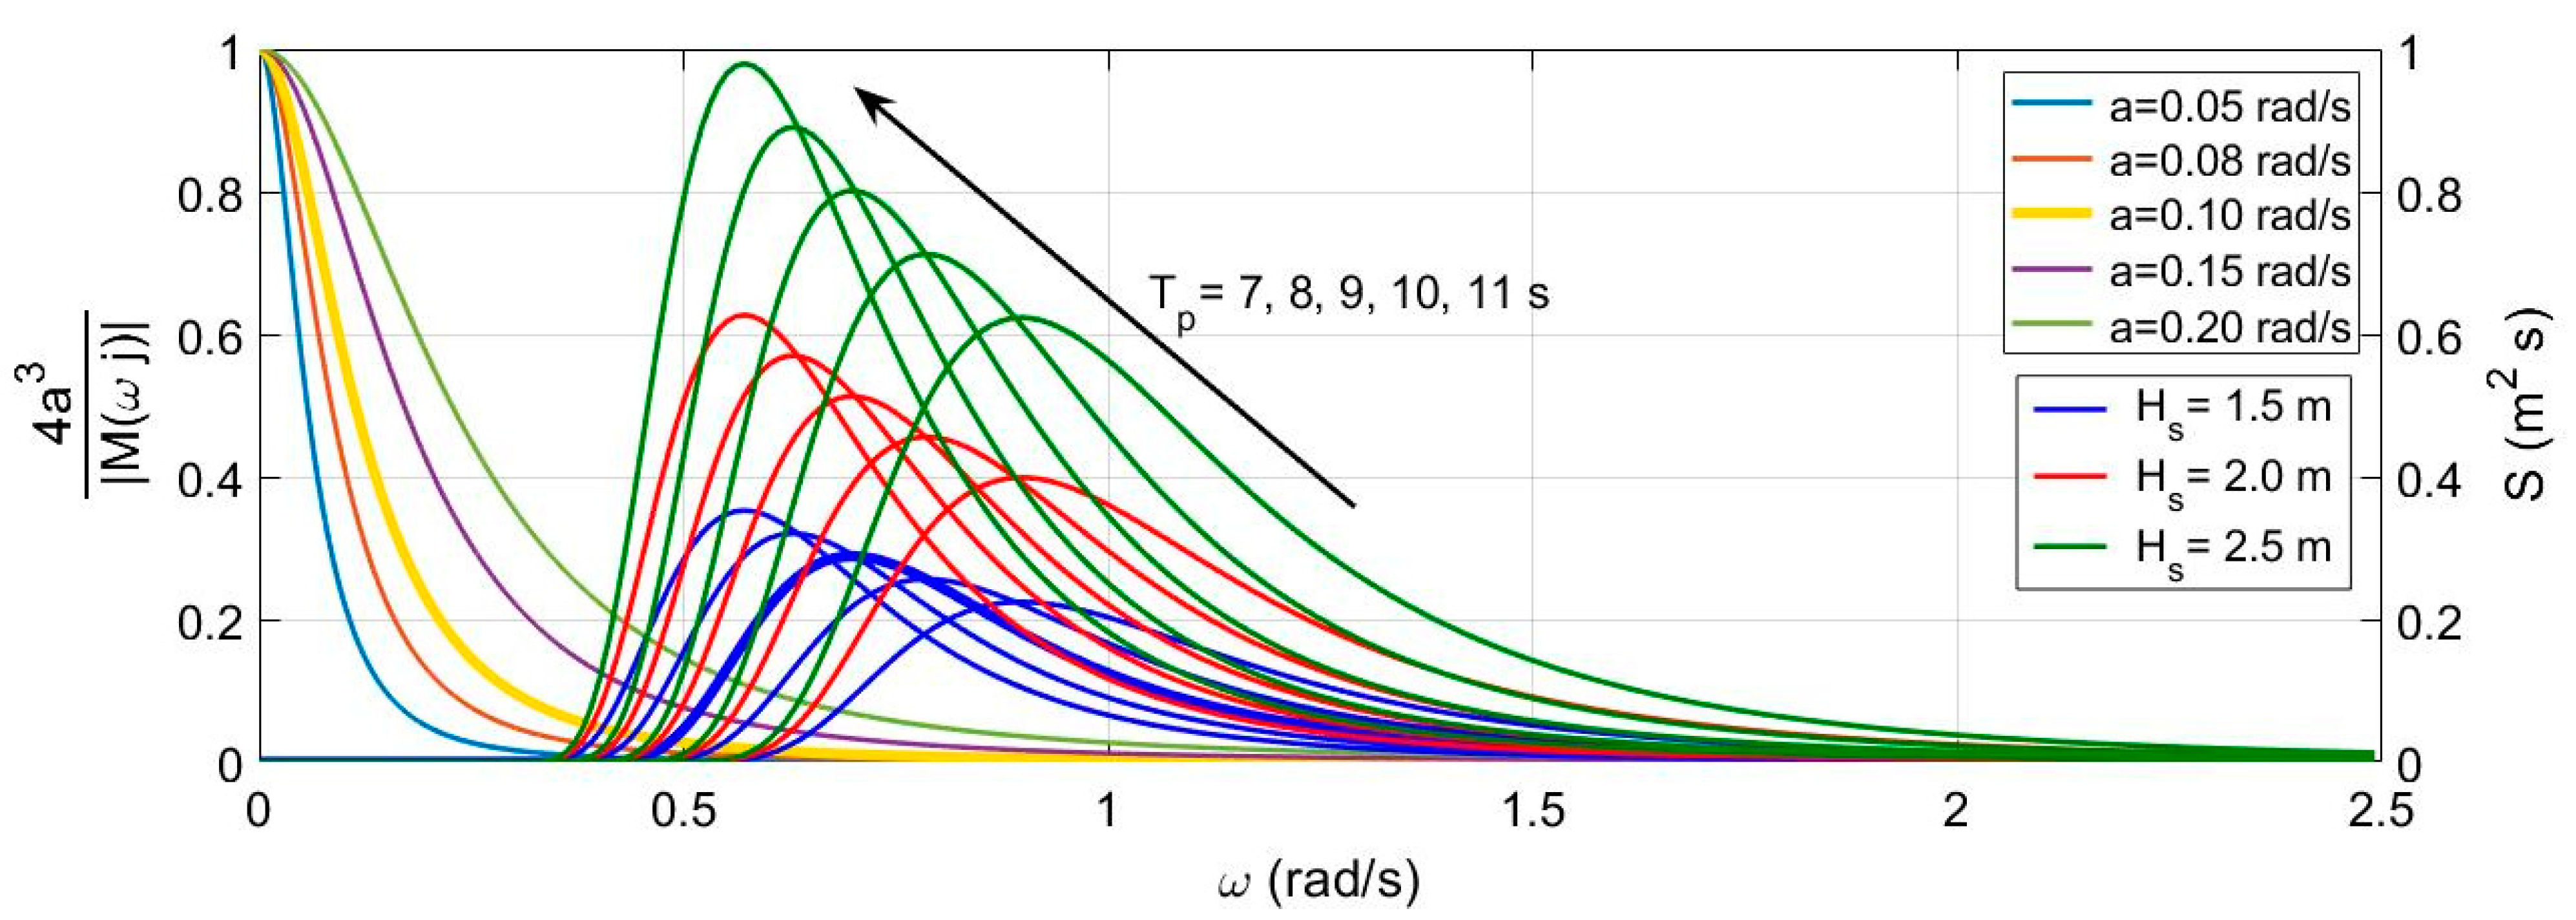
Figure 14 shows the PM spectrum for a significant wave height of
,
and
for the peak periods of
,
,
,
and
each (the values selected are the most frequent in the chosen location [
29]), along with the Bode (a linear rather than a logarithmic plot for easy comparison) magnitude for the proposed closed loop desired dynamics with a different design parameter
, whose values were
,
,
,
and
. Upon observing the graph, the interaction with the waves of the desired closed loop dynamics with
and
, which is greater than that of the rest, can be appreciated. The regulator chosen to carry out the following simulations will be that which has a value for the design parameter of
, because the dynamics corresponding to the regulators with
and
are considered too slow.
From the point of view of the frequency domain, the controlled platform exhibits a closed-loop dynamics given by Equation (41) and behaves as a low-pass filter with the cut-off frequency set in parameter “a”, without any kind of resonance. Then, the wave frequency zone acts on the platform in the rejection zone of the low-pass filter as external disturbances that are all rejected with a minimum attenuation of approximately −130 dB for a value of a = 0.10 rad/s, which results in an imperceptible effect on the time domain responses.
Furthermore, in the first set of simulations in this section, the behavior of the platform to step inputs of both angular coordinates was shown. A simulation with null reference signals and step variations of the wind magnitudes is presented as follows. This simulation does not, of course, represent a realistic case, but this kind of simulation is very useful as regards demonstrating the goodness of the controller [
41,
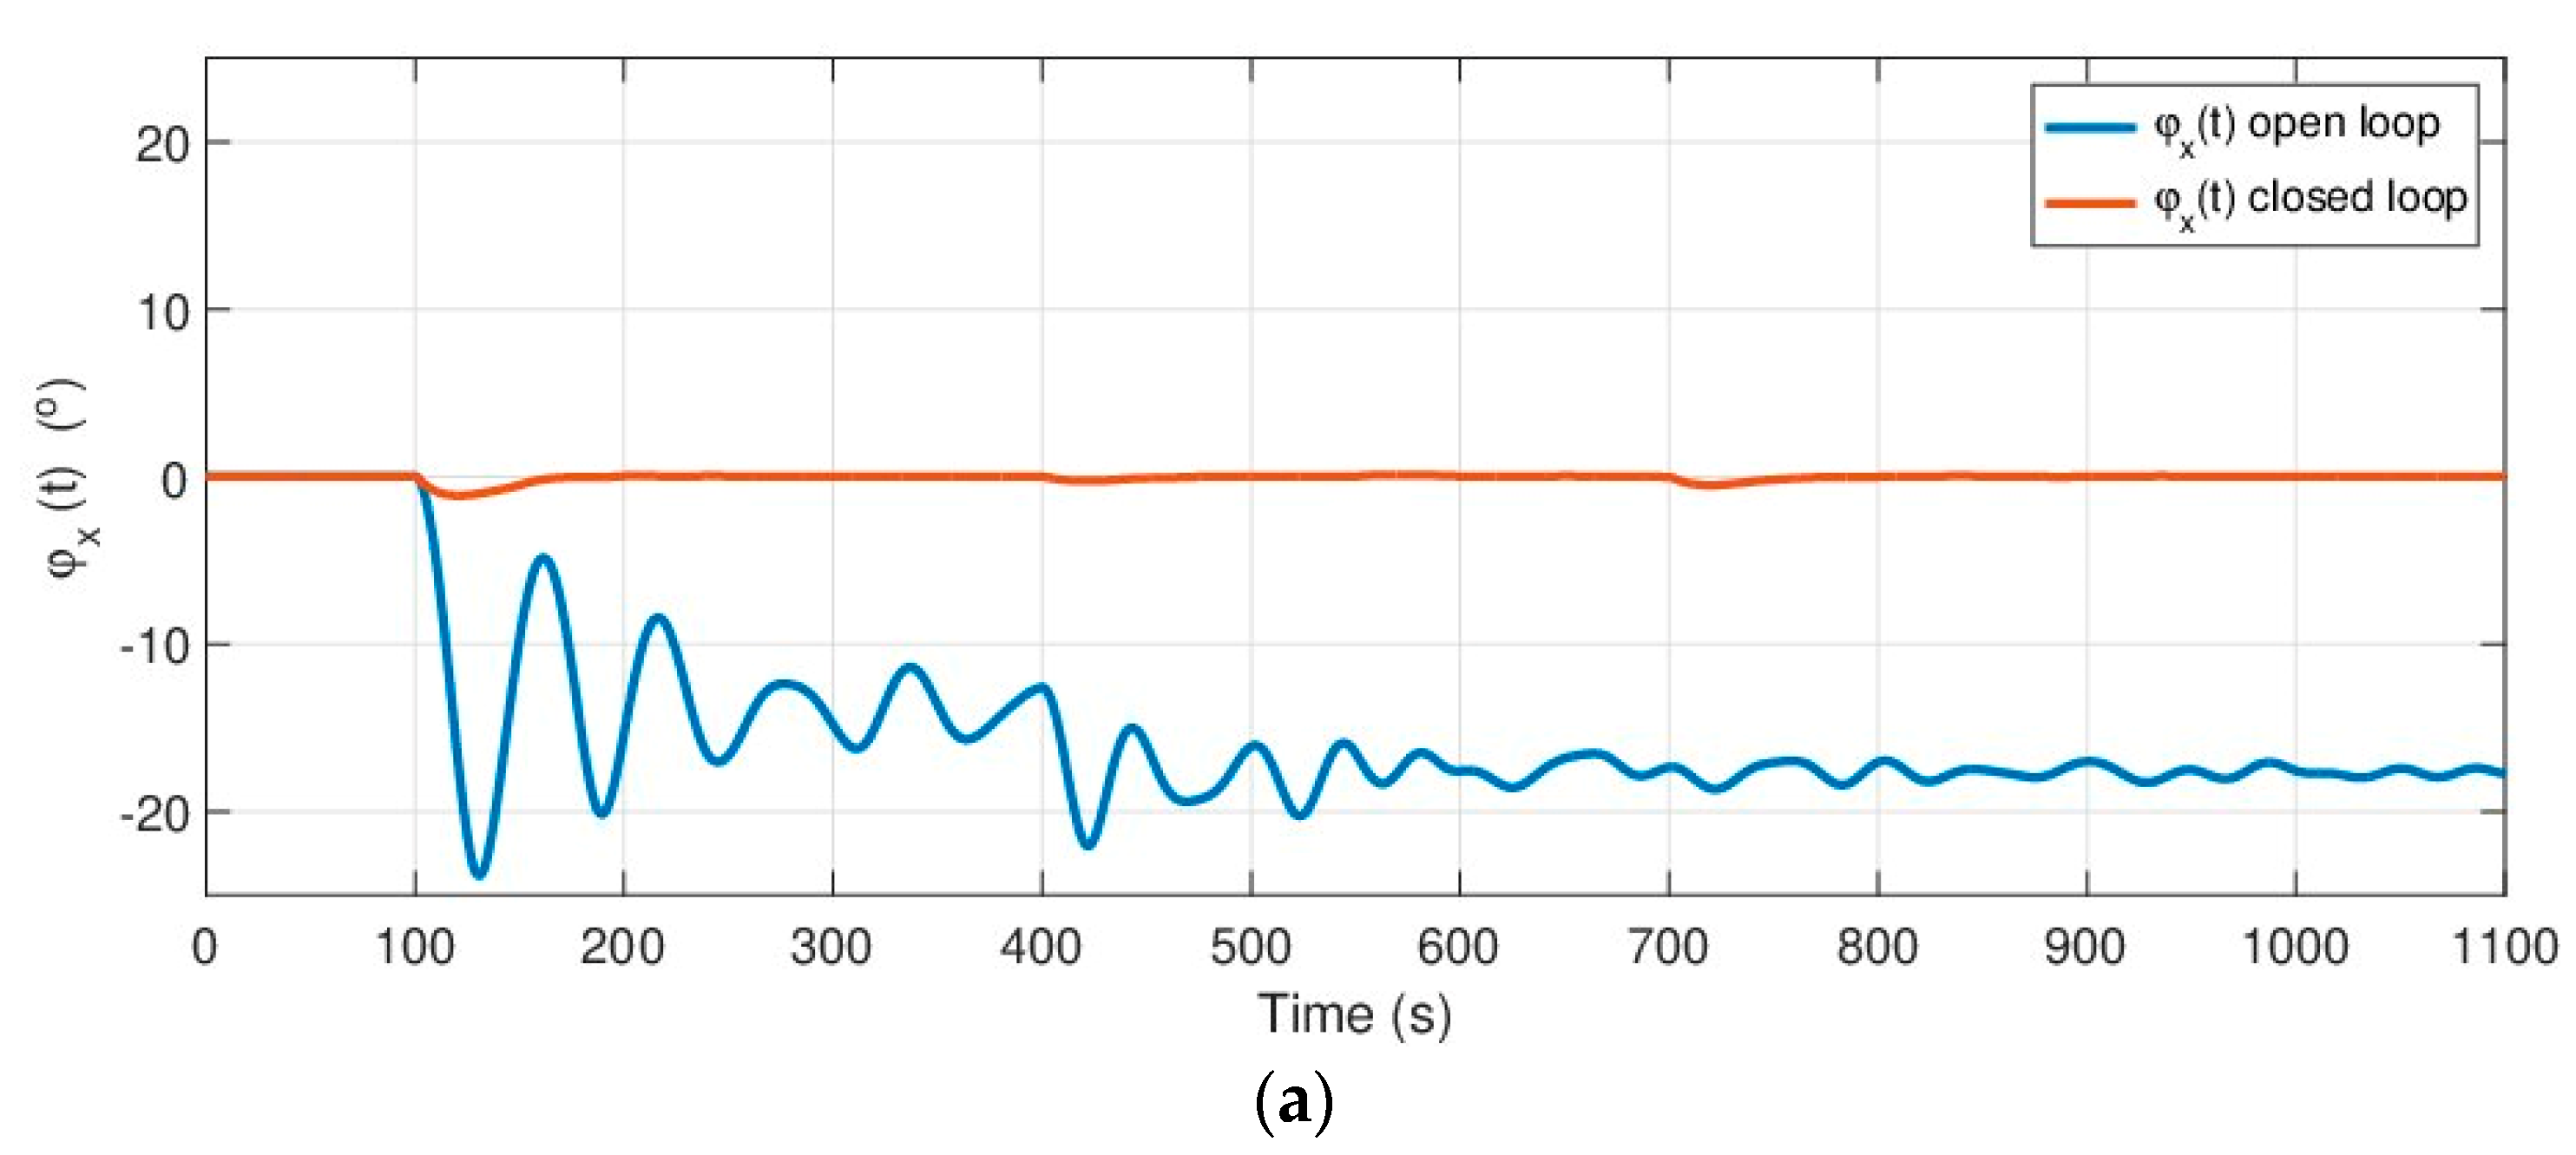
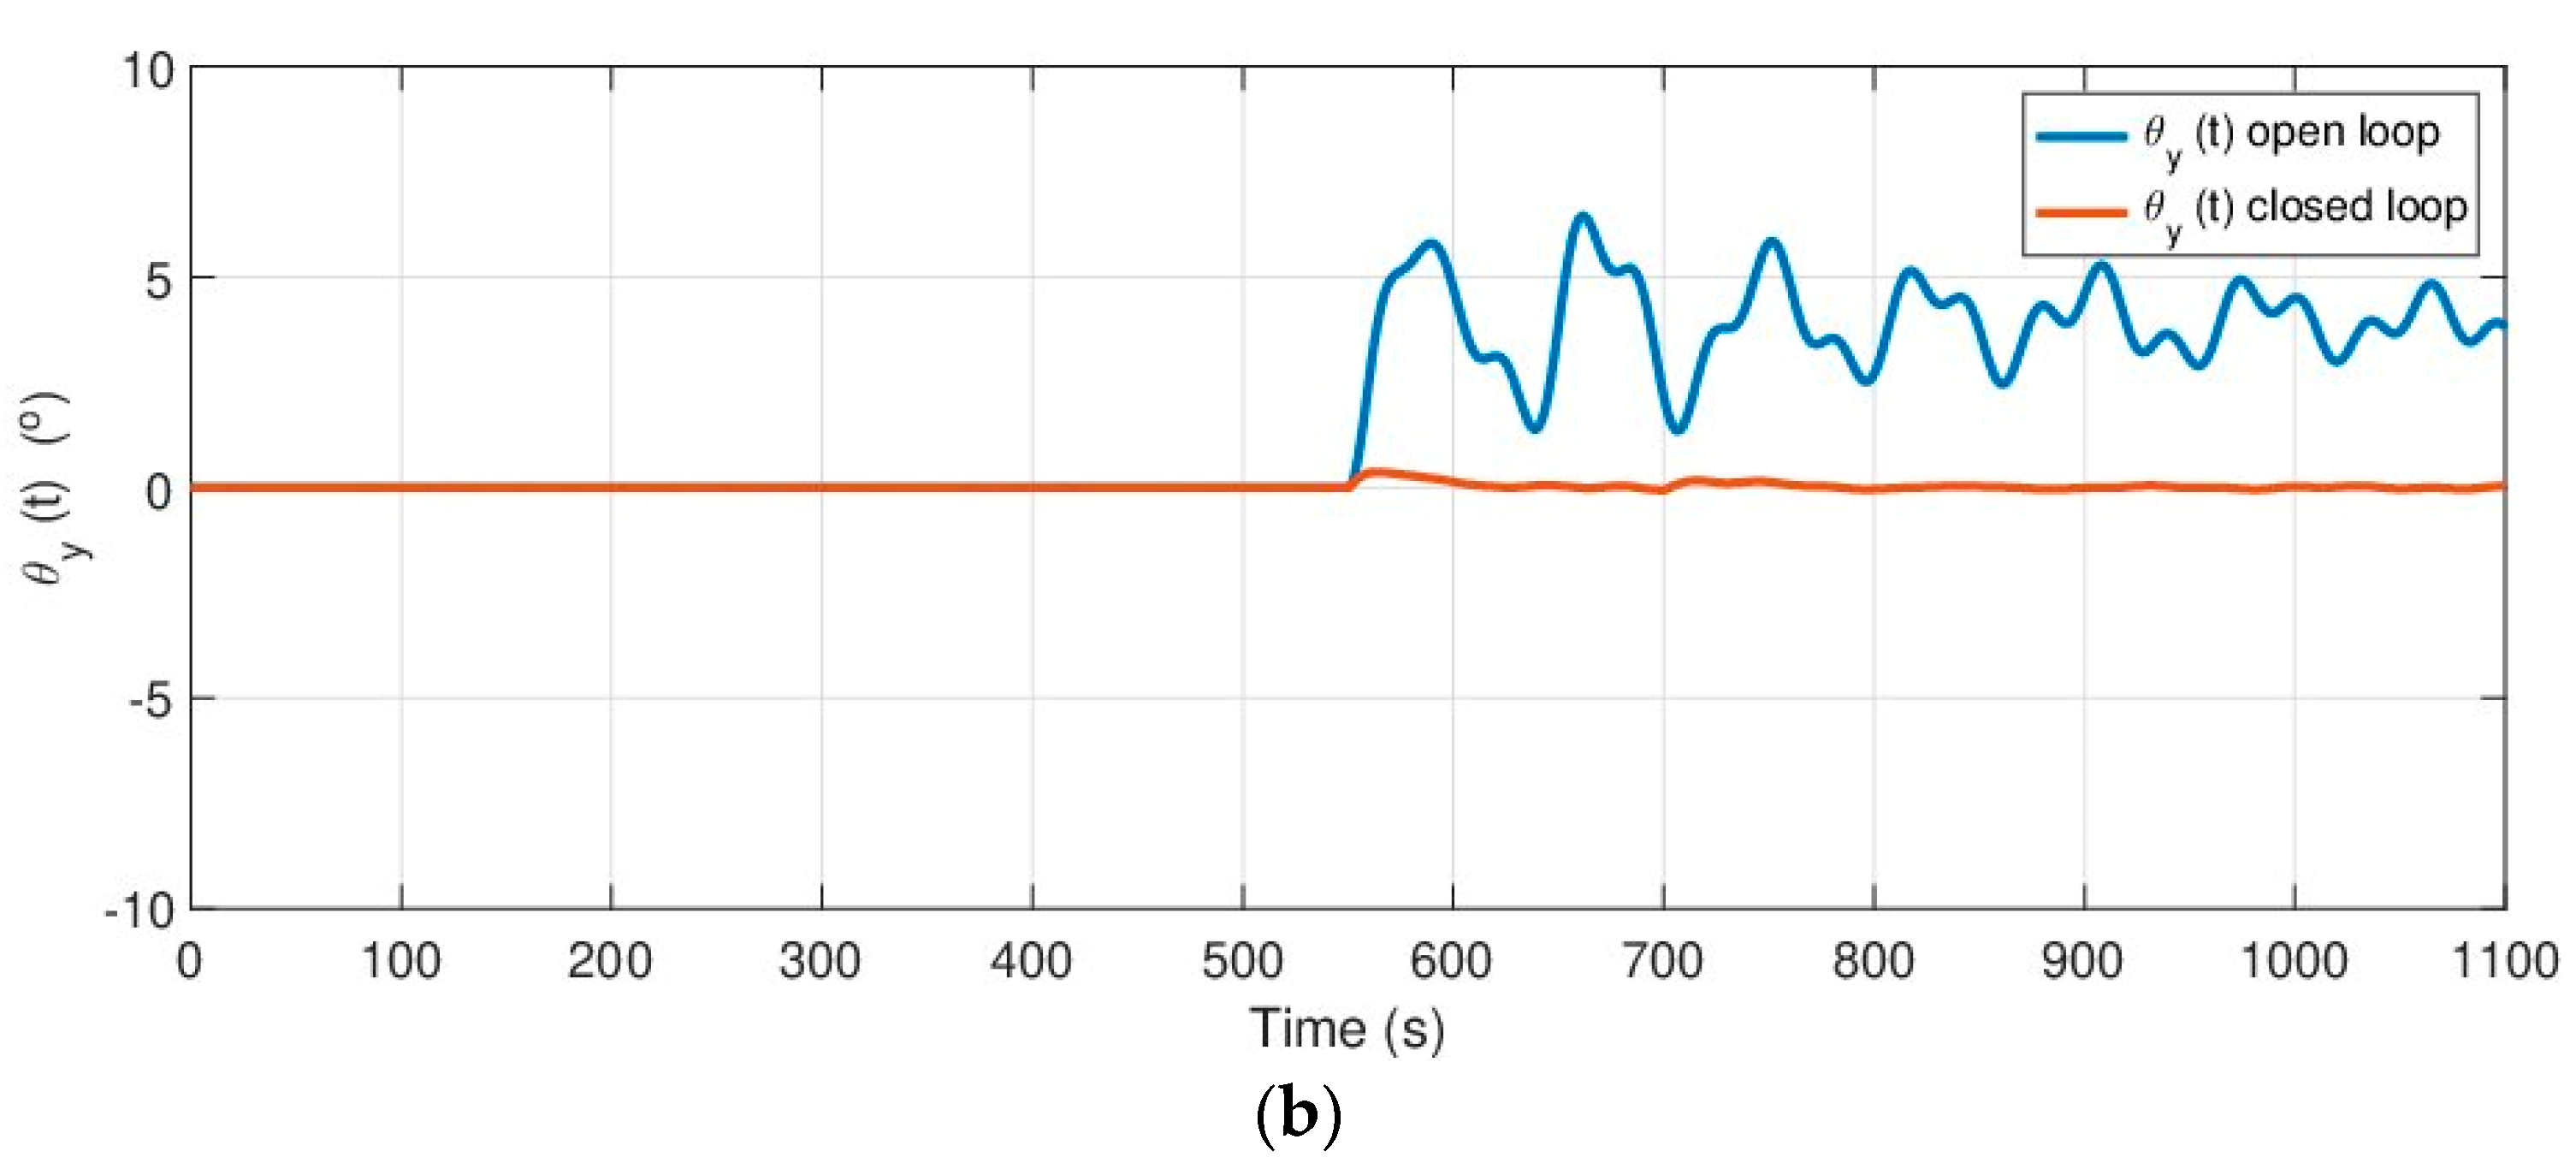
42]. Both the orientation responses of the platform under open loop and closed loop dynamics for the controller with the previously chosen design parameter
and when it has been subjected to wind disturbances with the next step-type signals with transitions in both the speed,
, and orientation,
are depicted in
Figure 15.
The first graph shows, from the open loop time response, that the platform cannot maintain a null orientation in , reaching a heel angle of after the first transition in the wind speed with an undamped oscillating response of around . When the second transition in wind speed occurred, the oscillating response of the platform increased its inclination to . Owing to this response, this orientation hardly varied when the wind decreased its speed or changes its orientation, and it was possible only to appreciate a decrease in the oscillation value. With regard to the orientation for the open loop response, which can be seen in the second graph, the change was perceptible only after the transition in the wind direction, increasing the inclination up to approximately .
The behavior of the platform after the same disturbances created by the wind according to Equation (42), but in a closed loop, is then plotted on the same graphs, which makes it possible to verify that the proposed control system is able to compensate for the wind effects, but that the non-modeled effects caused by the unmodeled terms owing to the mooring cables are still present. The effects of the sudden changes in wind speed and orientation on the behavior of the platform can also be appreciated in both
Figure 15a,b because of the non perfect decoupling term based on the inverse of matrix
defined in Equation (16).
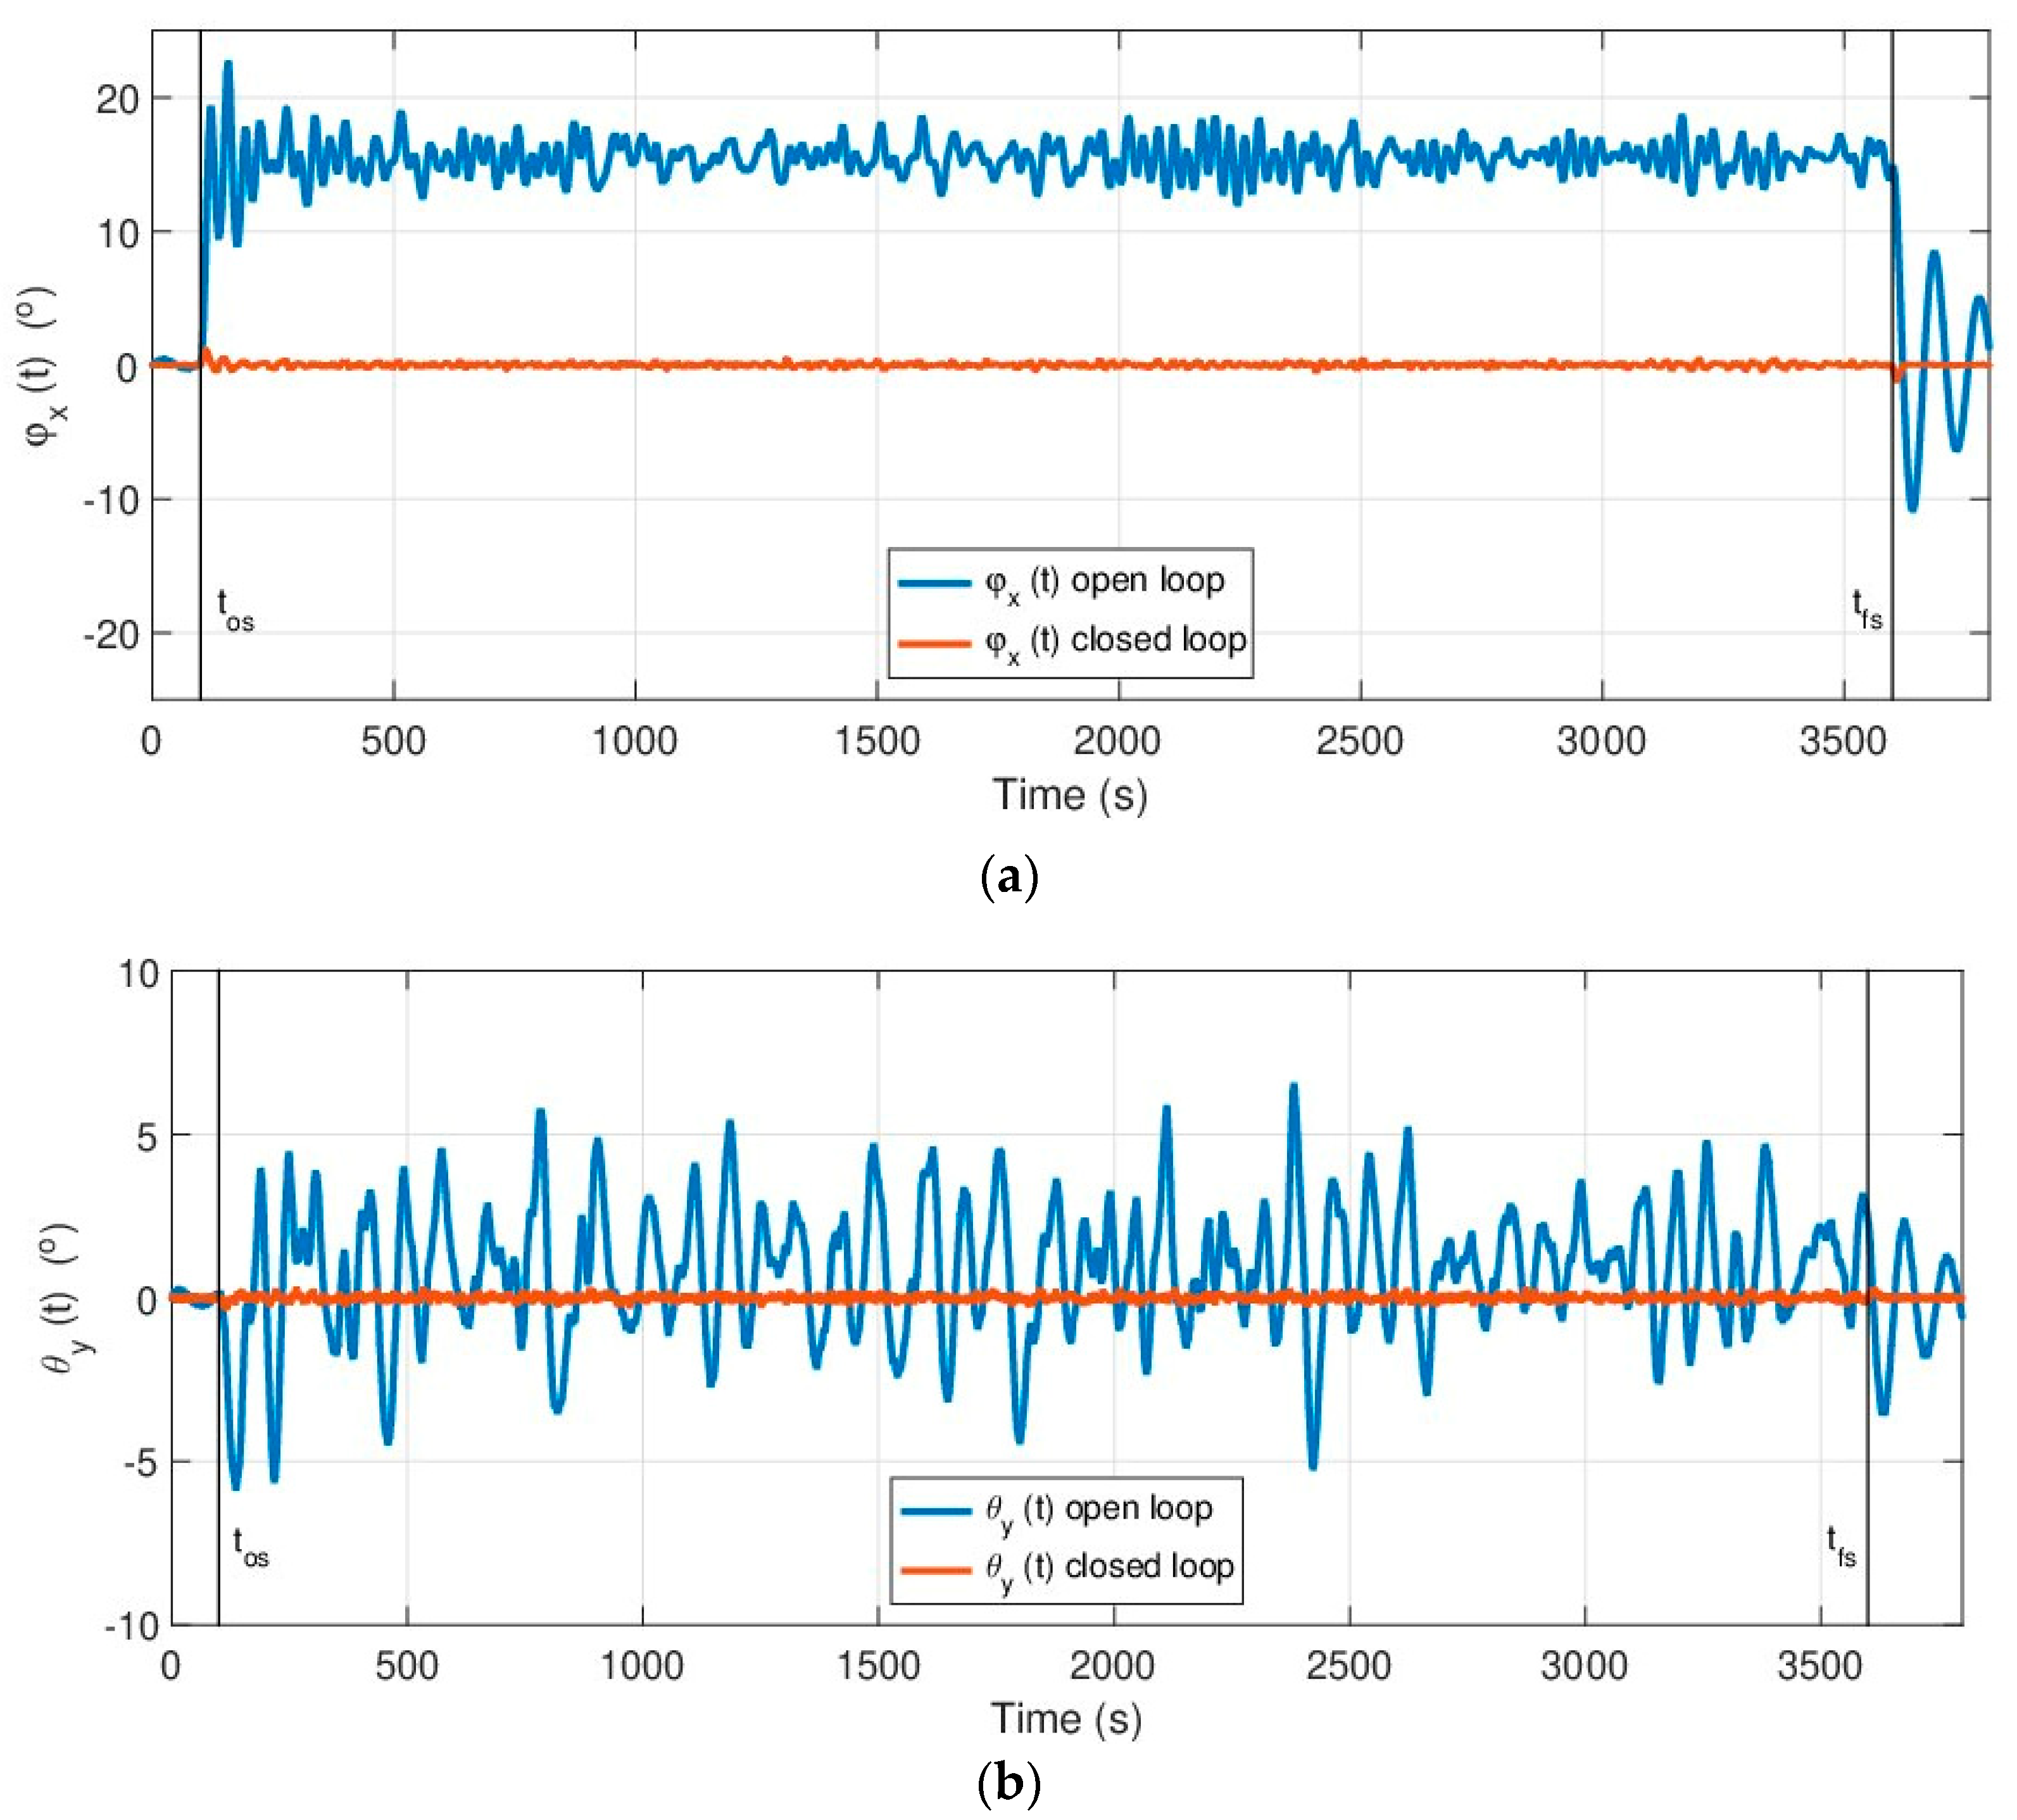
In the last simulation, the wind values were obtained from the data recorded by the La Langosteira II buoy (43.35N, 8.56W) [
29], which is located very close to the point chosen for the location of the platform. The registered values of wind speed and orientation are, according to the Weibull distribution, which are
and
respectively, expected for this location. The compensation of the wind signal was obtained after being processed by a low pass filter, while Gaussian noise from a normal distribution
was intentionally added. The saturation and non-ideal dynamics of the actuators were programmed. We also modeled a regular wave with a period of
and a significant height of
, which is the most frequent wave according to the data collected by the buoy.
The platform was then subjected to the force of the wind, resulting in angle variations of up to approximately and when it operated in open loop. The time intervals in which its oscillations, owing to the effect of waves only, were close to the desired null value for both angles in the first and last section of the simulation interval, correspond to time intervals with an intentionally null speed of the wind but in the presence of wave disturbances.
With regard to the closed loop time responses, which have been plotted in an overlapping manner with the open loop time responses, it can be seen in
Figure 16 that the proposed control system is able to maintain the platform with almost null orientation (less than 0.2° in the worst case for both angles), in spite of the presence of the same wind and wave disturbances used in the open loop simulation.
