Abstract
Mangroves are important in protecting and stabilizing coastal zones. Pneumatophores of the mangrove species Avicennia marina can form a large aboveground complex of aerial roots, which are important in supporting mangrove growth in low-oxygen environments. We examined the relationship between mangrove tree height, tree girth, sediment mud content, and oxygen levels with pneumatophore abundance. As sediments with higher mud content have more anaerobic conditions due to their lower porosity, we hypothesized that pneumatophore abundance would be positively correlated with sediment mud content and negatively correlated with sediment oxygen levels. Pneumatophore abundance of A. marina ranged from 14 to 516 per m2 (mean 171.8 ± 0.61 per m2), pneumatophore height from 6.6 to 27.5 cm (14.1 ± 0.86 cm), and maximum pneumatophore diameter from 8.5–12.7 mm (8.5 ± 0.24 mm). Pneumatophore abundance was positively correlated with tree height and tree girth. As hypothesized, pneumatophore abundance was positively correlated with percentage of mud content in sediment and negatively correlated with oxygen percentage. This suggests that mangrove trees can adapt to anaerobic and water-logged conditions by increasing their number of pneumatophores, hence providing greater surface area for gas exchange. In addition, there was a significant effect of mangrove (natural and planted), tidal position, and their interaction. With natural mangrove having higher abundance of pneumatophores compared to the planted mangrove, with the highest number closest to the sea. While pneumatophore abundance did not differ among tidal zones in planted mangrove.
1. Introduction
Mangroves are declining in area worldwide, due to increases in human activities that infringe on their habitats [1,2]. Fortunately, in the Arabian Gulf mangrove cover has been increasing in protected areas [3]. Avicennia marina (Forssk.) Vierh., the only mangrove species occurring in the Arabian Gulf, is highly adaptable and can grow in a broader range of habits than most other mangrove species [4,5]. Avicennia marina seedlings initially develop a heart root system, growing multiple vertical roots simultaneously, which increases stability and oxygen uptake [6]. Pneumatophores, aerial roots that grow aboveground from the belowground root system, are found in Avicennia and in four other genera of mangroves [7]. Pneumatophores have a large number of lenticels that facilitate gas exchange above the surface, an adaptation for living in the oxygen-poor conditions of tidal soils [8]. However, gas exchange cannot occur while the pneumatophores are flooded, e.g., during high tide [9]. Therefore global sea level rise, or other factors that cause permanent flooding of pneumatophores, will have a negative effect on mangrove growth, due to interruption of gas exchange in the root system, ultimately leading to mangrove death [10,11]. For example, 4.5 months of flooding in the Kosi estuary, South Africa, caused mass mortality of the mangrove in lower parts of the estuary, while mangrove growing on higher ground survived [12].
There is limited information available on the abundance and size of pneumatophores, and their relation with other morphological features of mangroves. However, more pneumatophores are found in mangroves growing on polluted and inundated soils, with anaerobic conditions, than in mangroves on drier and less contaminated soils [13,14]. In addition, small-scale topographical variations (±15 cm) have been shown to influence pneumatophore abundance and length [15]. Macropores, or cavities in soils, increase drainage of water and help facilitate transport of solutions, salt, and other particles in sediments [16,17]. These macropores are usually created by penetration by plant roots, burrowing activities by soil invertebrates, and aggregation of soil particles [18,19,20]. The growth of mangrove trees has also been shown to be positively associated with crab burrow macropores [20], possibly because these macropores facilitate desalination in the mangrove growing environment [17].
The aim of the present study was to evaluate the relationship between mangrove tree size, sediment mud content, oxygen, and crab burrows in sediment, and pneumatophore abundance in Avicennia marina (Forssk.). As sediments with higher mud content have more anaerobic conditions due to lower permeability [14], we hypothesized that there would be a positive relationship between pneumatophore abundance and sediment mud content, and a negative relationship between pneumatophore abundance and sediment oxygen level and number of crab burrows.
2. Materials and Methods
2.1. Study Species and Area
Avicennia marina (Forssk.) Vierh., the only mangrove species occurring in Qatar, is found in the tidal habitat between mean sea level and high tide water level [21]. The aboveground biomass in this natural mangrove is higher near the sea than on upper levels near the land [22], so sampling at different tidal levels is required to encompass this range of growth. Field studies were conducted between November 2010 and November 2012 at 10 sites, two natural mangrove stands at Al Khor (25°41′50.53″ N, 51°33′08.18″ E) and Al Dhakhira (25°44′53.17″ N, 51°32′11.03″ E), and eight sites with planted mangroves (Zekreet (25°29′13.53″ N, 50°50′07.62″ E), Al Mafyar (26°08′33.75″ N, 51°16′35.57″ E), Fuwairit (26°02′00.32″ N, 51°22′04.37″ E), Ras Laffan (25°56′13.67″ N, 51°31′50.03″ E), Semaisma (25°34′37.90″ N, 51°29′17.28″ E), Al Wakra (25°10′47.43″ N, 51°37′00.56″ E), Umm Al Hul (25°04′52.54″ N, 51°37′03.98″ E), and Khor Al Adaid (24°38′41.36″ N, 51°19′49.24߱ E) along the eastern, northern, and western coasts of Qatar (Figure 1).
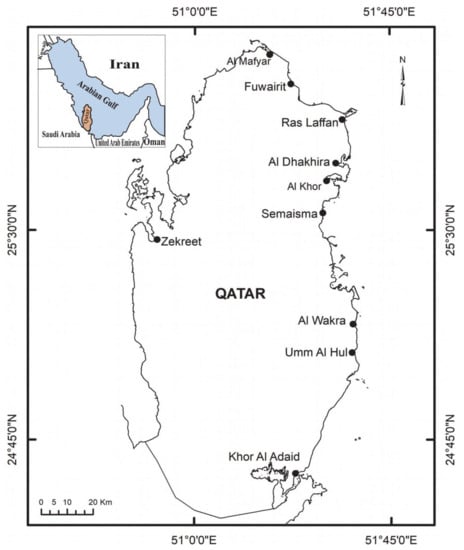
Figure 1.
Map of Qatar showing the locations of the sampled mangrove sites. Two natural mangrove stands at Al Khor and Al Dhakhira, and eight sites with planted mangroves (Zekreet, Al Mafyar, Fuwairit, Ras Laffan, Semaisma, Al Wakra, Umm Al Hul, and Khor Al Adaid along the eastern, northern, and western coasts of Qatar).
2.2. Data Collection
Each site was sampled on four occasions (once per season in spring, summer, fall, and winter). Sampling was conducted at upper, middle, and lower tidal levels at each site, with three replicates at each tidal level (total n = 90).
2.2.1. Environmental Conditions
Sediment samples were collected to a depth of 30 cm at each sampling site, using a PVC cylindrical core with 4 cm diameter, and transported to laboratory, where they were dried for 24 h at 100 °C. Particle size distribution in these sediment samples was analyzed using the sieve method [23]. The percentage clay and silt fractions were combined to mud content in the sediment. Water salinity was measured at each site using a refractometer (American Optical Co, Buffalo, NY, USA). A portable refractometer (OAKTON Instruments, Vernon Hills, IL, USA, DO2/C/Data meter, DO 300 Series) was used to determine dissolved oxygen and hydrogen-ion in seawater. All these parameters were recorded in shallow waters and usually made at 0.5 m depth. Additionally, the refractometer was used to determine oxygen concentration in soil water of natural and planted mangroves. The soil water was measured at low tide after digging holes to allow groundwater to seep but preventing entry of seawater.
2.2.2. Pneumatophore Abundance and Crab Burrows
On each sampling occasion, frequencies of crab burrows and pneumatophores were counted in a quadrat measuring 1 m × 1 m, under mangrove cover. This was done with three replicates at the upper, middle, and low tidal levels at each site. Pneumatophore height (mm) and maximum aboveground diameter (mm), and A. marina tree height (cm) and tree girth (cm) at 1 m height were measured. Data on tree and seedling density of A. marina at each site can be found in Table 1, while Supplementary Materials to this paper provide data on the age of the mangrove (Table S1), hydrological parameters (Table S2), elevation, and slope at the 10 sites (Figure S1), and some photos of the mangrove (Figure S2). At high tide, the upper tidal level at the sites is covered by up to 30 cm of seawater, the middle tidal level by around 60 cm, and the lower tidal level by approximately 100 cm of seawater. At all coastal sites in Qatar, the tide changes diurnally (twice a day).

Table 1.
Density of trees and seedlings of natural and planted Avicennia marina mangroves at different sites in Qatar.
2.2.3. Statistical Analyses
Linear regression was used to test for relationships between tree height, tree girth, pneumatophore height, mud content, crab burrows, oxygen level, and pneumatophore abundance, mean values for each of the three replicate plots were calculated for each of the tidal levels. To test if pneumatophore abundance differed between natural or planted mangrove and tidal position (upper, middle, or lower tidal position), we applied univariate ANOVA, with mangrove and position as fixed factors. The statistical analysis was done in SPSS version 26 (IBM).
3. Results
All eight sites showed growth higher than 1 m in height, except for Zekreet (west coast) and Khor Al Adaid (far south), where planted mangroves trees showed stunted growth and measured less than 1 m in height (Table 1, Figure S2.).
3.1. Upper Tidal Level
At the upper tidal level at the 10 sites, the height of A. marina trees varied between 0.45–2.0 m. Pneumatophore abundance varied between 14 and 158 per m2, Pneumatophore diameter varied between 6.2–12.65 mm. while maximum tree girth varied between 9.0 cm and 27.5 cm. Crab burrow abundance varied between 0 and 16 per m2. The highest mud (silt and clay) was 65.23% and the lowest 9.85% (Table 2). There was a positive linear regression between pneumatophore abundance and tree height and between pneumatophore abundance and pneumatophore height (Figure 2). There was a positive linear regression between pneumatophore abundance and tree girth (Figure 2). In addition, there was a positive linear regression between pneumatophore abundance and mud content (percentage of silt and clay in the sediment) (Table 3), and a negative linear regression with oxygen concentration (Figure S3).

Table 2.
Average values of different pneumatophore morphology and related parameters measured in natural and planted mangroves at sites in Qatar (Pneumat abundance = Pneumatophore abundance; Pneumat height = Pneumatophore height; Pneumat dia. = Pneumatophore diameter), SD = standard deviation; SE = standard error, n = 90 (n = 3 per tidal position at each site).
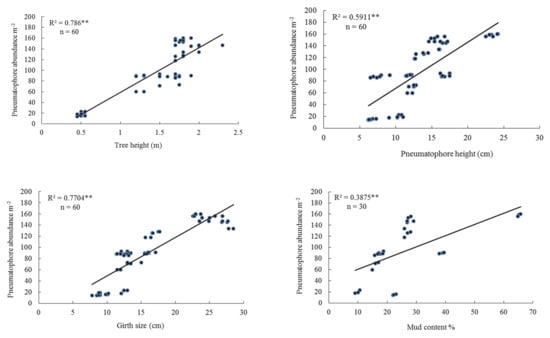
Figure 2.
Relationship between pneumatophore abundance, tree height, pneumatophore height, tree girth size, and mud content in the upper tidal level. Level of significance ** p < 0.001.

Table 3.
Linear regression (R2 values) and p-values between different parameters of mangrove morphology at different tidal level sites in Qatar. P. ab. = Mean pneumatophore abundance; T. Ht = Mean tree height; P. Ht. = Mean pneumatophore height; P. Dia = Mean maximum pneumatophore diameter; G.S = Mean maximum girth size of tree; Md. Ct. = Mean percent mud content in mangrove soil; Br.no. = Mean crab burrow number.
3.2. Middle Tidal Level
At the middle tidal level at the 10 sites studied, mangrove tree height varied between 0.4–2.07 m. Pneumatophore abundance varied between 50 and 360 per m2, and pneumatophore diameter varied between 6.9 and 9.35 mm. Maximum tree girth varied from 7 to 28 cm. Crab burrow abundance varied between 0 and 22 per m2. The highest mud content was 74.46% and the lowest 9.23% (Table 2).
There was a positive linear regression between pneumatophore abundance and tree height and between pneumatophore abundance and pneumatophore height (Figure 3). There was also a positive linear regression between pneumatophore abundance and tree girth (Figure 3). In addition, there was a positive linear regression between pneumatophore abundance and percentage mud content (Figure 3, Table 3). While there was a negative linear regression between pneumatophore abundance and oxygen level (Figure S3).
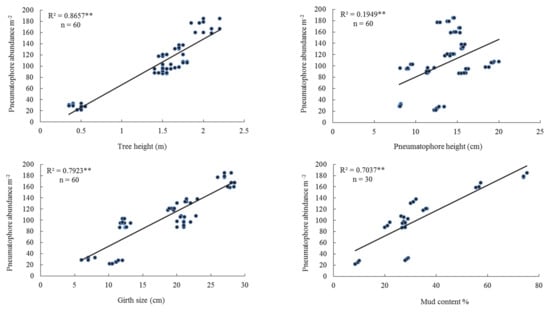
Figure 3.
Linear regression pneumatophore abundance, tree height, pneumatophore height, girth size, and mud content in the middle tidal level. Level of significance ** p < 0.001.
3.3. Lower Tidal Level
At the lower tidal level at the 10 sites, the height of mangrove trees ranged between 0.35 and 3 m. Pneumatophore abundance varied between 30–516 per m2, and pneumatophore diameter varied between 7.0–9.3 mm. Maximum tree girth varied between 8.0 cm and 55 cm. Crab burrow abundance varied between 0 and 33 per m2. The highest mud content (silt and clay) was 79.76% and the lowest 14.20% (Table 2). There was a positive linear regression between pneumatophore abundance and tree height and between pneumatophore abundance and pneumatophore height (Table 2, Figure 4). There was also a positive linear regression between pneumatophore abundance and tree girth, and percentage mud content (Figure 4, Table 3), but a negative linear regression with oxygen level (Figure S3).


Figure 4.
Relationship between pneumatophore abundance, tree height, pneumatophore height, girth size, and mud content in the lower tidal level. Level of significance ** p < 0.001.
3.4. All Tidal Level Sites
Overall, the average abundance of pneumatophores in natural and planted mangroves at all 10 sites studied varied between 14 and 516 per m2. The height of mangrove trees ranged between 0.4 m and 3 m, while pneumatophore diameter varied between 6.2 and 12.7 mm. Maximum tree girth varied between 7 and 55 cm. Crab burrow abundance varied between 0 and 33 per m2. The highest mud content was 79.8% and the lowest 9.2% (Table 2).
Pneumatophore abundance increased at all study sites with increasing mud content (Figure 5). Pneumatophore abundance had a positive linear regression with tree height, tree girth, and pneumatophore height (Figure 5, Table 3). However, crab burrow abundance varied greatly between sites and there was only a weak relationship between the number of crab burrows and pneumatophore abundance (Table 3). Within sites, it was highest at the lower tidal level, and at all sites, it showed a weak relationship with most of the mangrove and sediment parameters analyzed (Figure 2, Figure 3, Figure 4 and Figure 5, Table 4). There was a negative linear regression between pneumatophore abundance and oxygen level (Figure S3).
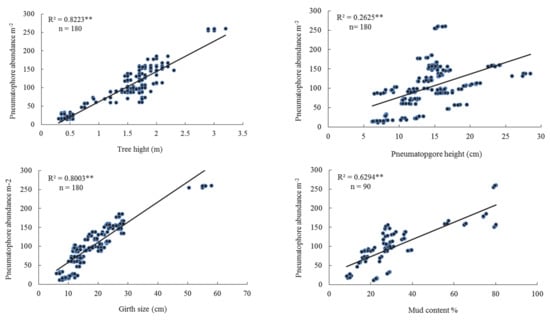
Figure 5.
Linear regression between pneumatophore abundance, tree height, pneumatophore height, girth size, and mud content in all tidal levels combined. Level of significance ** p < 0.001.

Table 4.
Overall abundance average of crab burrows m2 observed at different sites. Natural mangrove n = 18 (2 sites), planted mangrove = 72 (8 sites).
Pneumatophore abundance was significantly higher in natural mangrove compared to planted mangrove (Figure 6, Table 5). In addition, pneumatophore abundance differed among tidal levels in natural, but not in planted mangrove (Figure 6, Table 5). Lower and middle tidal levels having higher abundance of pneumatophores in natural mangrove (Figure 6).
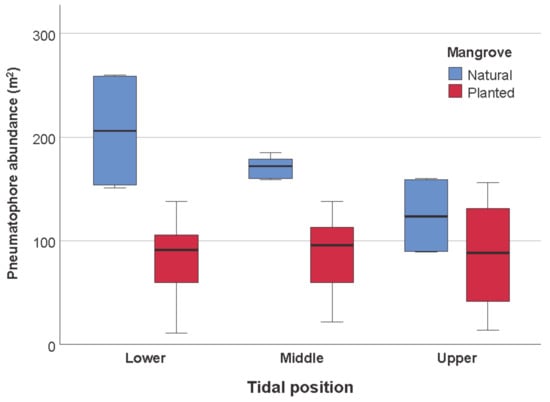
Figure 6.
Box-plot graph showing the differences in pneumatophore abundance in mangrove (natural or planted) and tidal position (upper, middle, lower tidal zones) in Qatar. Data in the middle “box” show the median, and the lower (25%) and upper quartile (75%) of the scores. The upper and lower whiskers represent scores outside the middle 50%.

Table 5.
Result of univariate ANOVA testing the effect of mangrove (natural or planted) and tidal position on pneumatophore abundance in Qatar.
4. Discussion
The overall abundance of pneumatophores in natural and planted mangroves at all three tidal levels at all sites investigated varied between 14 and 516 per m2, with an average abundance of 171.8 ± 20.39 per m2 (Table 2). In previous studies, pneumatophore abundance in A. marina has been found to range between 56 and 1168 per m2 in Pakistan [14], between 4 and 1950 per m2 in Kenya (Dahdouh-Guebas et al., 2004), and between 80 and 180 per m2 in Mozambique [24,25]. In addition, pneumatophore abundance in A. marina has been shown to vary with microtopography in the intertidal zone, with depressions on the landward side having higher densities of pneumatophores than depressions closer to the sea [15].
We found that pneumatophores were larger and occurred in higher abundance in the middle and lower tidal levels, which are under a greater depth of tidal water for a longer time than the upper tidal level. Similarly, other studies have found an increase in the size and abundance of pneumatophores in more frequently flooded conditions and in anaerobic conditions [6,26]. This supports the suggestion that pneumatophore abundance and size increase with more extended periods of inundation and more anaerobic conditions, in order to support gas exchange [14]. In general, mangroves are reported to grow more rapidly in areas frequently inundated by tides or at sites with lower salinity, compared with areas that are less regularly flooded and where the salinity is very high [27,28]. For example, the optimum salinity level for growth of A. marina is reported to vary between 10 and 60‰, while mean seawater salinity is 35‰ [29]. At the sites in Qatar examined in this study, the salinity ranges between 41 and 51‰ [30]. In addition to pneumatophores that are an adaption to facilitate gas exchange in oxygen poor conditions, Avicenna marina have stilt roots to provide plant stability (Figure S2). Stilt roots have also been observed in newly planted seedlings of A. marina in Malaysia, providing anchorage for the seedlings [31].
We found that pneumatophore abundance was positively correlated with tree height, tree girth, and pneumatophore height (Figure 2, Figure 3, Figure 4 and Figure 5), which were also correlated with each other (Table 3). This indicates that larger trees have more, and larger, pneumatophores.
It has been suggested that pneumatophore abundance can be used as an index of the anaerobic status of the soil in which mangroves are growing [32]. As hypothesized, pneumatophore abundance increased with the percentage of mud (silt + clay; Table 2) and decreased with oxygen content. Similar to other studies [33], we found a strong positive correlation between pneumatophore abundance and mud content in sediment at the middle (R2 = 0. 7962) and lower tidal levels (R2 = 0.7411) (Figure 3, Figure 4 and Figure 5), but a weak correlation (R2 = 0.3755) at the upper tidal levels (Figure 2). The negative correlation with oxygen level generally being weaker (Figure S3). The presence of mud in sediment decreases the porosity, and hence the amount of oxygen the sediment can contain [14]. Sites with a high mud content thus become progressively anaerobic, and in response, the mangrove trees at such sites develop increasing pneumatophore abundance [14]. Pneumatophore abundance is reported to be lower in mangroves on sand-dominated sediments [13,14,34]. Besides, sites with a higher mud content in the sediment likely offer more favorable conditions for plant growth, as mud particles adsorb more nutrients than coarser sandy particles [35].
Mangroves are typically rich in benthic macrofauna and contribute to rapid recycling of nutrients within both terrestrial and marine food chains [11,36,37,38]. The macrofauna in mangroves in Qatar is dominated by brachyuran crabs such as Scopimera carbricauda, Nasima dotilliformis, Manningis arabicum, and Macrophthalmus depressus [30]. We found no clear relationship between crab burrow abundance and pneumatophore abundance, pneumatophore size, tree height, or tree girth (Table 3). This was surprising, as burrows have been shown to facilitate water/material movement and to modify soil properties [39,40]. In addition, burrows have been shown to remove salt around the mangrove roots and sediments [17,18,19], and improve sediment oxygenation [38].
Similar to other studies [41], we found that plots in natural mangrove closest to the sea had the highest abundance of pneumatophores. However, this was not the case for the planted mangrove, where we found no difference in abundance along the tidal positions. This could potentially be because the mangroves were planted at the same time along the tidal gradient. As sites with a higher abundance of pneumatophores bind sediments faster than sites with a lower abundance of pneumatophores [42], the natural mangrove is potentially more effective in sediment accretion. Salinity could potentially affect penumatophores/mangrove trees. While we did not measure salinity in the sediments, another study in the natural mangrove at Al Dhakhira found no effect of salinity on chlorophyll, and in addition, the above-ground biomass of mangrove increased toward the sea with increasing salinity in the sediment [22]. Thus, it is unlikely that salinity had any negative effect on pneumatophore abundance.
5. Conclusions
Pneumatophores are important for supporting growth of Avicenna marina. However, there are few studies on what factors influence pneumatophore abundance. Here, we examined the relationship between mangrove trees, sediment mud content, oxygen levels, and pneumatophore abundance. In addition, we studied if pneumatophore abundance differed between natural and planted mangrove and tidal position. We found that pneumatophore abundance was positively correlated with tree height and tree girth, suggesting that older trees develop more pneumatophores. As hypothesized, there was a positive correlation between pneumatophore abundance and percentage mud content in the sediment, suggesting that mangroves adapt to anaerobic and water-logged conditions by increasing the number of pneumatophores, which provide a large surface area for gas exchange. In addition, there was a significant effect of mangrove (natural and planted), tidal position, and their interaction on pneumatophore abundance. With natural mangroves having a higher abundance of pneumatophores compared to the planted mangrove, with the highest number closest to the sea. The difference between natural and planted mangroves may partly be due to differences in the age of mangroves, the natural populations being older. While pneumatophore abundance did not differ among tidal zones in planted mangrovse.
Supplementary Materials
The following are available online at https://www.mdpi.com/2077-1312/9/1/100/s1, Figure S1: Google Earth images showing the occurrence of Avicennia marina mangroves at Al Khor, Al Dhakhira, Semaisma, Al Mafyar, Fuwairit, Zekreet, Ras Laffan, Al-Wakra, Umm Al Hul, and Khor Al Adaid in Qatar. The mangroves appear in dark green in the true color images. The topography at the mangrove occurrences shows a gradient decreasing from high land elevation to low elevation towards the sea. Measured elevation at the mangrove sites suggested that they are distributed at less than 3 m elevation. Figure S2 Photos of mangrove in Qatar. Figure S3. Relationship between oxygen concentration and pneumatophore abundance. Table S1: Year of plantation for afforested (planted) mangrove in Qatar. Table S2: Hydrological parameters for the sampled mangrove sites in Qatar.
Author Contributions
Conceptualization, J.A.A.-K.; methodology, J.A.A.-K.; formal analysis, J.A.A.-K.; investigation, J.A.A.-K.; writing—original draft preparation, J.A.A.-K. and J.M.A.; writing—review and editing, J.A.A.-K. and J.M.A.; visualization, J.A.A.-K. All authors have read and agreed to the published version of the manuscript.
Funding
J.M.A. was funded by Qatar Petroleum.
Institutional Review Board Statement
Not applicable.
Informed Consent Statement
Not applicable.
Data Availability Statement
The data presented in this study is available in supplementary materials.
Acknowledgments
Special appreciation goes to the Environmental Studies Center (ESC), for giving permission to use its laboratory. The authors thank the reviewers for constructive comments that improved the paper. Rajendran Sankaran for help with drawing the map and elevation gradients.
Conflicts of Interest
The authors declare no conflict of interest.
References
- Alongi, D.M. The Impact of Climate Change on Mangrove Forests. Curr. Clim. Chang. Rep. 2015, 1, 30–39. [Google Scholar] [CrossRef]
- Xia, P.; Meng, X.; Li, Z.; Feng, A. Sedimentary Records of Mangrove Evolution during the Past One Hundred Years Based on Stable Carbon Isotope and Pollen Evidences in Maowei, SW China. J. Ocean Univ. China 2016, 15, 447–455. [Google Scholar] [CrossRef]
- Toosi, N.B.; Soffianian, A.R.; Fakheran, S.; Pourmanafi, S.; Ginzler, C.; Waser, L.T. Comparing Different Classification Algorithms for Monitoring Mangrove Cover Changes in Southern Iran. Glob. Ecol. Conserv. 2019, 19, e00662. [Google Scholar] [CrossRef]
- Almahasheer, H.; Duarte, C.M.; Irigoien, X. Phenology and Growth Dynamics of Avicennia Marina in the Central Red Sea. Sci. Rep. 2016, 6, 1–9. [Google Scholar] [CrossRef]
- Clough, B.B. Mangrove Ecosystems in Australia: Structure, Function and Management; Australian National University Press: Canberra, Australian, 1982. [Google Scholar]
- Kathiresan, K.; Bingham, B.L. Biology of Mangroves and Mangrove Ecosystems. Adv. Mar. Biol. 2001, 40, 81–251. [Google Scholar]
- Srikanth, S.; Lum, S.K.Y.; Chen, Z. Mangrove Root: Adaptations and Ecological Importance. Trees 2016, 30, 451–465. [Google Scholar] [CrossRef]
- Wada, H. Soil-Water-Plant Relationships of Mangroves in Thailand. Galaxea 1988, 7, 257–270. [Google Scholar]
- Allaway, W.G.; Curran, M.; Hollington, L.M.; Ricketts, M.C.; Skelton, N.J. Gas Space and Oxygen Exchange in Roots of Avicennia Marina (Forssk.) Vierh. Var. Australasica (Walp.) Moldenke Ex NC Duke, the Grey Mangrove. Wetl. Ecol. Manag. 2001, 9, 221–228. [Google Scholar] [CrossRef]
- Augustinus, P.G.E.F. The Changing Shoreline of Suriname (South America); Utrecht University: Utrecht, The Netherlands, 1978; Volume 95. [Google Scholar]
- Jimenez, J.A.; Lugo, A.E.; Cintron, G. Tree Mortality in Mangrove Forests. Biotropica 1985, 177–185. [Google Scholar] [CrossRef]
- Breen, C.M.; Hill, B.J. A Mass Mortality of Mangroves in the Kosi Estuary. Trans. R. Soc. S. Afr. 1969, 38, 285–303. [Google Scholar] [CrossRef]
- Dicks, B. Oil and the Black Mangrove, Avicennia Marina in the Northern Red Sea. Mar. Pollut. Bull. 1986, 17, 500–503. [Google Scholar] [CrossRef]
- Saifullah, S.M.; Elahi, E. Pneumatophore Density and Size in Mangroves of Karachi, Pakistan. Pak. J. Bot. 1992, 24, 5. [Google Scholar]
- Dahdouh-Guebas, F.; Kairo, J.G.; De Bondt, R.; Koedam, N. Pneumatophore height and density in relation to micro-topography in the grey mangrove avicennia marina. Belg. J. Bot. 2007, 140, 213–221. [Google Scholar]
- Susilo, A.; Ridd, P.V. The Bulk Hydraulic Conductivity of Mangrove Soil Perforated with Animal Burrows. Wetl. Ecol. Manag. 2005, 13, 123–133. [Google Scholar] [CrossRef]
- Pülmanns, N.; Nordhaus, I.; Diele, K.; Mehlig, U. Artificial Crab Burrows Facilitate Desalting of Rooted Mangrove Sediment in a Microcosm Study. J. Mar. Sci. Eng. 2015, 3, 539–559. [Google Scholar] [CrossRef]
- Heron, S.F.; Ridd, P.V. The Use of Computational Fluid Dynamics in Predicting the Tidal Flushing of Animal Burrows. Estuar. Coast. Shelf Sci. 2001, 52, 411–421. [Google Scholar] [CrossRef]
- Susilo, A.; Ridd, P.V.; Thomas, S. Comparison between Tidally Driven Groundwater Flow and Flushing of Animal Burrows in Tropical Mangrove Swamps. Wetl. Ecol. Manag. 2005, 13, 377–388. [Google Scholar] [CrossRef]
- Smith, N.F.; Wilcox, C.; Lessmann, J.M. Fiddler Crab Burrowing Affects Growth and Production of the White Mangrove (Laguncularia Racemosa) in a Restored Florida Coastal Marsh. Mar. Biol. 2009, 156, 2255–2266. [Google Scholar] [CrossRef]
- Al-Khayat, J.A.; Jones, D.A. A Comparison of the Macrofauna of Natural and Replanted Mangroves in Qatar. Estuar. Coast. Shelf Sci. 1999, 49, 55–63. [Google Scholar] [CrossRef]
- Chang, H.; Han, S.H.; Kim, S.; An, J.; Alatalo, J.M.; Son, Y. Interactions between Topsoil Properties and Ecophysiological Responses of Mangroves (Avicennia Marina) along the Tidal Gradient in an Arid Region in Qatar. Turk. J. Agric. For. 2019, 43, 121–126. [Google Scholar]
- Buchanan, J.B.; Kain, J.M. Measurement of the physical and chemical environment. In Methods for the Study of Marine Benthos; Blackwell Scientific Publications Oxford: Oxford, UK, 1971; Volume 16, pp. 30–58. [Google Scholar]
- Dahdouh-Guebas, F.; De Bondt, R.; Abeysinghe, P.D.; Kairo, J.G.; Cannicci, S.; Triest, L.; Koedam, N. Comparative Study of the Disjunct Zonation Pattern of the Grey Mangrove Avicennia Marina (Forsk.) Vierh. in Gazi Bay (Kenya). Bull. Mar. Sci. 2004, 74, 237–252. [Google Scholar]
- Macia, A.; Abrantes, K.G.S.; Paula, J. Thorn Fish Terapon Jarbua (Forskal) Predation on Juvenile White Shrimp Penaeus Indicus, H. Milne Edwards and Brown Shrimp Metapenaeus Monoceros (Fabricius): The Effect of Turbidity, Prey Density, Substrate Type and Pneumatophore Density. J. Exp. Mar. Biol. Ecol. 2003, 291, 29–56. [Google Scholar] [CrossRef]
- Toma, T.; Nkamura, K.; Patanaponpaiboon, P.; Ogino, K. Effect of Flooding Water Level and Plant Density on Growth of Pneumatophore of Avicennia Marina. Tropics 1991, 1, 75–82. [Google Scholar] [CrossRef]
- Susilo, A. A New Method in Determining Bulk Hydraulic Conductivity of Mangrove Forest Sediment. Wit Trans. Ecol. Environ. 2005, 83, 10. [Google Scholar]
- Tomlinson, P.B. The Botany of Mangroves; Cambridge University Press: Cambridge, UK, 2016. [Google Scholar]
- Nguyen, H.T.; Stanton, D.E.; Schmitz, N.; Farquhar, G.D.; Ball, M.C. Growth Responses of the Mangrove Avicennia Marina to Salinity: Development and Function of Shoot Hydraulic Systems Require Saline Conditions. Ann. Bot. 2015, 115, 397–407. [Google Scholar] [CrossRef]
- Al-Khayat, J.A.; Abdulla, M.A.; Alatalo, J.M. Diversity of Benthic Macrofauna and Physical Parameters of Sediments in Natural Mangroves and in Afforested Mangroves Three Decades after Compensatory Planting. Aquat. Sci. 2019, 81, 4. [Google Scholar] [CrossRef]
- Tamin, N.M.; Zakaria, R.; Hashim, R.; Yin, Y. Establishment of Avicennia Marina Mangroves on Accreting Coastline at Sungai Haji Dorani, Selangor, Malaysia. Estuar. Coast. Shelf Sci. 2011, 94, 334–342. [Google Scholar] [CrossRef]
- MacNae, W. A General Account of the Fauna and Flora of Mangrove Swamps and Forests in the Indo-West-Pacific Region. Adv. Mar. Biol. 1969, 6, 73–270. [Google Scholar]
- Stokes, D.J.; Healy, T.R.; Cooke, P.J. Expansion Dynamics of Monospecific, Temperate Mangroves and Sedimentation in Two Embayments of a Barrier-Enclosed Lagoon, Tauranga Harbour, New Zealand. J. Coast. Res. 2010, 26, 113–122. [Google Scholar] [CrossRef]
- Mandura, A.S.; Khafaji, A.K.; Saifullah, S.M. Ecology of a Mangrove Stand of a Central Red Sea Coast Area: Ras Hatiba (Saudi Arabia). Proc. Saudi Biol. Soc. 1988, 11, 85–112. [Google Scholar]
- Park, S.G. Aspects of Mangrove Distribution and Abundance in Tauranga Harbour; Environment Bay of Plenty: Huakatani, New Zealand, 2004. [Google Scholar]
- Zhou, X.; Cai, L.; Fu, S. Comparison of Meiofaunal Abundance in Two Mangrove Wetlands in Tong’an Bay, Xiamen, China. J. Ocean Univ. China 2015, 14, 816–822. [Google Scholar] [CrossRef]
- Chen, X.; Cai, L.; Zhou, X.; Rao, Y. Geographical Variation in Oligochaete Density and Biomass in Subtropical Mangrove Wetlands of China. J. Ocean Univ. China 2017, 16, 925–931. [Google Scholar] [CrossRef]
- Al-Khayat, J.A.; Giraldes, B.W. Burrowing Crabs in Arid Mangrove Forests on the Southwestern Arabian Gulf: Ecological and Biogeographical Considerations. Reg. Stud. Mar. Sci. 2020, 39, 101416. [Google Scholar] [CrossRef]
- Stieglitz, T.; Ridd, P.; Müller, P. Passive Irrigation and Functional Morphology of Crustacean Burrows in a Tropical Mangrove Swamp. Hydrobiologia 2000, 421, 69–76. [Google Scholar] [CrossRef]
- Dunn, R.J.K.; Welsh, D.T.; Teasdale, P.R.; Gilbert, F.; Poggiale, J.-C.; Waltham, N.J. Effects of the Bioturbating Marine Yabby Trypaea Australiensis on Sediment Properties in Sandy Sediments Receiving Mangrove Leaf Litter. J. Mar. Sci. Eng. 2019, 7, 426. [Google Scholar] [CrossRef]
- Crona, B.I.; Holmgren, S.; Rönnbäck, P. Re-Establishment of Epibiotic Communities in Reforested Mangroves of Gazi Bay, Kenya. Wetl. Ecol Manag. 2006, 14, 527–538. [Google Scholar] [CrossRef]
- Young, B.M.; Harvey, E.L. A Spatial Analysis of the Relationship Between Mangrove (Avicennia Marinavar.Australasica) Physiognomy and Sediment Accretion in the Hauraki Plains, New Zealand. Estuar. Coast. Shelf Sci. 1996, 42, 231–246. [Google Scholar] [CrossRef]
Publisher’s Note: MDPI stays neutral with regard to jurisdictional claims in published maps and institutional affiliations. |
© 2021 by the authors. Licensee MDPI, Basel, Switzerland. This article is an open access article distributed under the terms and conditions of the Creative Commons Attribution (CC BY) license (http://creativecommons.org/licenses/by/4.0/).