Article

Transitional Behavior of a Flow Regime in Shoaling Tsunami Boundary Layers

1
Department of Civil Engineering, Tohoku University, 6-6-06 Aoba, Sendai 980-8579, Japan
2
Department of Civil Engineering and Architecture, Sultan Qaboos University, P.O. Box 33, Al-Khoud, Muscat 123, Oman
*
Author to whom correspondence should be addressed.
J. Mar. Sci. Eng. 2020, 8(9), 700; https://doi.org/10.3390/jmse8090700
Submission received: 21 August 2020 / Revised: 7 September 2020 / Accepted: 7 September 2020 / Published: 9 September 2020
(This article belongs to the Section Coastal Engineering)

Abstract

:
The transitional flow regime of the bottom boundary layer under hypothetical shoaling tsunamis is investigated in the entire region from the tsunami source to the shallow sea area. In order to calculate the shoaling process of a tsunami, an analytical method based on Green’s law and the linear long wave theory are employed, and flow regime criteria for the wave boundary layer proposed by one of the authors are applied. It is found that the bottom boundary layer in a tsunami source area is located in the laminar regime. Subsequently, transition occurs to the smooth turbulence during the shoaling process, with a transition from the smooth to the rough turbulent region in the shallow area. For precise evaluation of bottom friction acting on the sea bed and the resulting energy dissipation beneath the tsunami, it is highly necessary to include such transitional behavior in sea bottom boundary layers.

1. Introduction

In general, the nature of the flow pattern can be classified into laminar and turbulent regimes depending on the relevant Reynolds number. In the case of a flow motion with a rigid boundary, the latter is further classified into smooth and rough turbulent flow depending on the roughness condition on the wall. Since the frictional resistance on the wall surface and resulting energy dissipation are significantly dependent on the mode of flow motion, identification and understanding of the flow regime is of practical importance for various flow phenomena.
In many practical applications in the field of hydraulic engineering, a Manning’s roughness coefficient, which is valid only in a fully rough turbulent regime under a steady uniform condition, has been widely utilized in various flow situations. Even under tsunami waves, a Manning’s coefficient or equivalent expression in terms of Darcy–Weisbach’s f has commonly been utilized in order to evaluate bottom shear stress in tsunami numerical simulations for various hazard mitigation studies, simply assuming that the wave period of the tsunami is sufficiently long to satisfy the quasi-steady condition [1,2,3]. However, there have been quite few investigations on tsunami boundary layer development on the sea bottom, especially in regard to transitional behavior of flow regimes in tsunami boundary layers.
Tanaka et al. [4] carried out a detailed experimental study to explore the properties of a depth-limited wave boundary layer. A criterion has been proposed for the inception of the depth-limited state (Figure 1a) on a rough bottom. According to the first reported field observation during the 2010 Chilean earthquake tsunami in U.S. by Lacy et al. [5], the depth-limited condition is not satisfied even at h = 10 m (h: the water depth). In addition, the acceleration effect is significant to the near-bed momentum, and bottom shear stress is not in phase with the velocity. This unsteady behavior cannot be simulated using a conventional tsunami simulation model with a friction term expressed in terms of quadratic friction law. William and Fuhrman [6] also concluded that over the range of conditions they considered, the tsunami boundary layer thickness grows to O (1 m), as demonstrated in Figure 1b and typically is not limited by the water depth as a steady flow in an open channel (Figure 1a). According to Sumer and Fuhrman [7], investigations for the 2004 Indian Ocean tsunami and the 2011 Tohoku tsunami suggest that the tsunami-induced boundary layers at the depths of respectively h = 14 m and h = 20 m would only span a fraction of the total water depth. In an experimental study of tsunami-induced scour around a monopole foundation carried out by Larsen et al. [8], it is shown that under the condition of an extremely long period, a current-like boundary layer is observed.
In the recent investigations of authors, it was concluded that the bottom boundary layer behavior beneath the tsunami is similar to that induced by wind waves, rather than the steady flow boundary layer in the most computational domain from the tsunami source area to the shallow water region (Tinh and Tanaka [9]). However, Tinh and Tanaka [9] simply assumed in the conventional manner the tsunami boundary layer is under a rough turbulent condition, without detailed discussion of the inherent flow regime transition. The present study is a supplementary work to Tinh and Tanaka [9] in the sense that the transitional behavior of the flow regime in a bottom boundary layer beneath hypothetical shoaling tsunamis is focused on. The result of the present study enables us to predict precise bottom shear stress under a tsunami by identifying and understanding the flow regime for a given input tsunami condition.

2. Flow Regime in a Wave Boundary Layer

Jonsson [10,11] was the first to propose a flow regime diagram under wave motions as well as a friction factor diagram covering both laminar and turbulent flows. Later, Kamphuis [12] obtained similar diagrams for wave friction factors and flow regimes based on a laboratory experiment of direct shear stress measurement in an oscillating water tunnel. Myrhaug [13] proposed a theory for a wave friction coefficient and the phase lead of bottom shear stress for rough, smooth and transitional smooth-to-rough turbulent flow. Tanaka and Sana [14] applied the k-ε turbulence model to investigate the transitional regime in a wave boundary layer on a smooth bottom. An abrupt change in friction factor and phase difference is successfully predicted by the model, which is well in agreement with the available experimental data. For combined motion of the wave and current, similar investigations on flow regime transition have been carried out by Tanaka and Shuto [15], Christoffersen and Jonsson [16], Myrhaug and Slaattelid [17], and Tanaka and Thu [18].
Depending on the methodology for identifying and defining flow regime transition employed by each researcher, flow regime criteria are slightly different from one another. In this study, the flow regime criteria proposed by Tanaka and Thu [18] will be used, assuming that the steady current component is zero in their equations originally obtained for wave–current co-existent motion. The transition from laminar to smooth turbulent flow is given by the following equations.
Lower limit:
R e = 2.5 × 10 5
Upper limit:
R e = 6.0 × 10 5
Here, Reynolds number Re is defined by
R e = U m a m ν
where U m : the amplitude of the wave-induced velocity outside the boundary layer, a m : the amplitude of water particle motion outside the boundary layer (=   U m / σ ), σ : the angular frequency (=   2 π / T , T : the wave period), and ν : the molecular viscosity of the fluid. Williams and Fuhrman [6] carried out numerical analysis of tsunami-like wave boundary layers using a transitional variant of the k-ω turbulence model. According to their numerical result, the critical Reynold numbers similar to Equations (1) and (2) are valid for the transition to turbulence in a tsunami boundary layer.
With an increase in wave Reynolds number, another transition occurs in the wave boundary layer from a smooth to a rough turbulent regime. To recognize this type of transition under combined waves and current, both Myrhaug and Slaattelid [17] and Tanaka and Thu [18] applied Equations (4) and (5) proposed by Schlichting [19] for a steady current expressed in terms of roughness Reynolds number, k s + .
Lower limit:
k s + = u m * k s ν = 5
Upper limit:
k s + = u m * k s ν = 70
where u m * : the maximum of friction velocity, and k s : the equivalent roughness length. The left side of Equations (4) and (5) represents the ratio of equivalent roughness to the viscous sublayer thickness. For practical convenience of engineering applications, Tanaka and Thu [18] further modified Equations (4) and (5) to express them in terms of Re and a m / k s as follows:
Lower limit:
R e = 25 ( a m k s ) 1.15
Upper limit:
R e = 350 ( a m k s ) 1.15
Equations (4) and (5) or Equations (6) and (7) will be applied for recognition of transitional behavior in the present investigation on the tsunami boundary layer.

3. Calculation Method of Tsunami Transformation

3.1. Tsunami Shoaling Process

Four cases of input tsunami characteristics in the source area are examined as listed in Table 1, having different wave periods T and seabed sediment diameters d. The equivalent roughness is obtained from the diameter of bed material using k s = 2 d . In the case of sea bed with bed forms, vegetation or other forms of benthic aquatic life, the bed roughness will remarkably increase as compared with simple grain roughness considered in this study. The bathymetry of the sea area is assumed to have a 1/50 slope as depicted in Figure 2a, in which the x-coordinate is defined with the origin at the offshore boundary.
Following Williams and Fuhrman [6] and Tinh and Tanaka [9], the wave shoaling process from the source to the shallow sea region is obtained by applying Green’s law.
H = H 0 ( h 0 h ) 1 / 4
where H: the wave height at an arbitrary point with the water depth h, and the subscript “0” denotes quantity in the tsunami source area. Furthermore, the following linear long wave theory is applied to calculate the amplitude of tsunami-induced free-stream velocity Um.
U m = H 2 g h
where g: the gravitational acceleration.

3.2. Calculation of Friction Factor and Friction Velocity

In order to apply Equations (4) and (5), the maximum shear velocity under the tsunami is required to distinguish the flow regime from smooth and rough turbulent flow. In this study, the full-range equation proposed by Tanaka and Thu [18], originally proposed for wave–current combined motion, will be used to calculate wave friction coefficient under shoaling tsunami, f w , since it can provide the smoothly interpolated value for each flow regime even in the transitional regime. The definition of the friction factor and the relationship with shear velocity is
τ 0 m = ρ u m * 2 = ρ 2 f w U m 2
where τ 0 m is the maximum bottom shear stress under wave motion, and ρ is the fluid density.
Calculation is made at selected x-coordinates depicted in Table 2.

3.3. Calculation of Boundary Layer Thickness

For computing wave boundary layer thickness under a shoaling tsunami, the full-range equation originally proposed by Sana and Tanaka [20,21] and recently modified by the authors [22] will be applied. The definition of wave boundary thickness proposed by Jensen et al. [23] is used in this study, which is the height of overshooting at σ t = 0 under the wave crest as defined in Figure 1b. There are alternative definitions for wave boundary layer thickness, such as Jonsson [10] based on the minimum distance from the bottom to an elevation where the velocity equals the amplitude of the free-stream velocity, U m , and Sleath [24] and Yuan and Madsen [25] in terms of the distance where the defect velocity amplitude is 1% or 5% of the free-stream amplitude. Among these definitions, that of Jensen et al. [23] has successfully been applied for demarcating the friction factor under the tsunami [22].
Both of the full-range equations for wave friction factor and wave boundary layer thickness utilized in the present investigation are summarized in Table 3, in which Equation (12) is employed from Equation (6) for smooth interpolation in the transitional region between smooth and rough turbulent regime.

4. Results and Discussion

4.1. Transitional Flow Regime in Terms of Boundary Layer Thickness

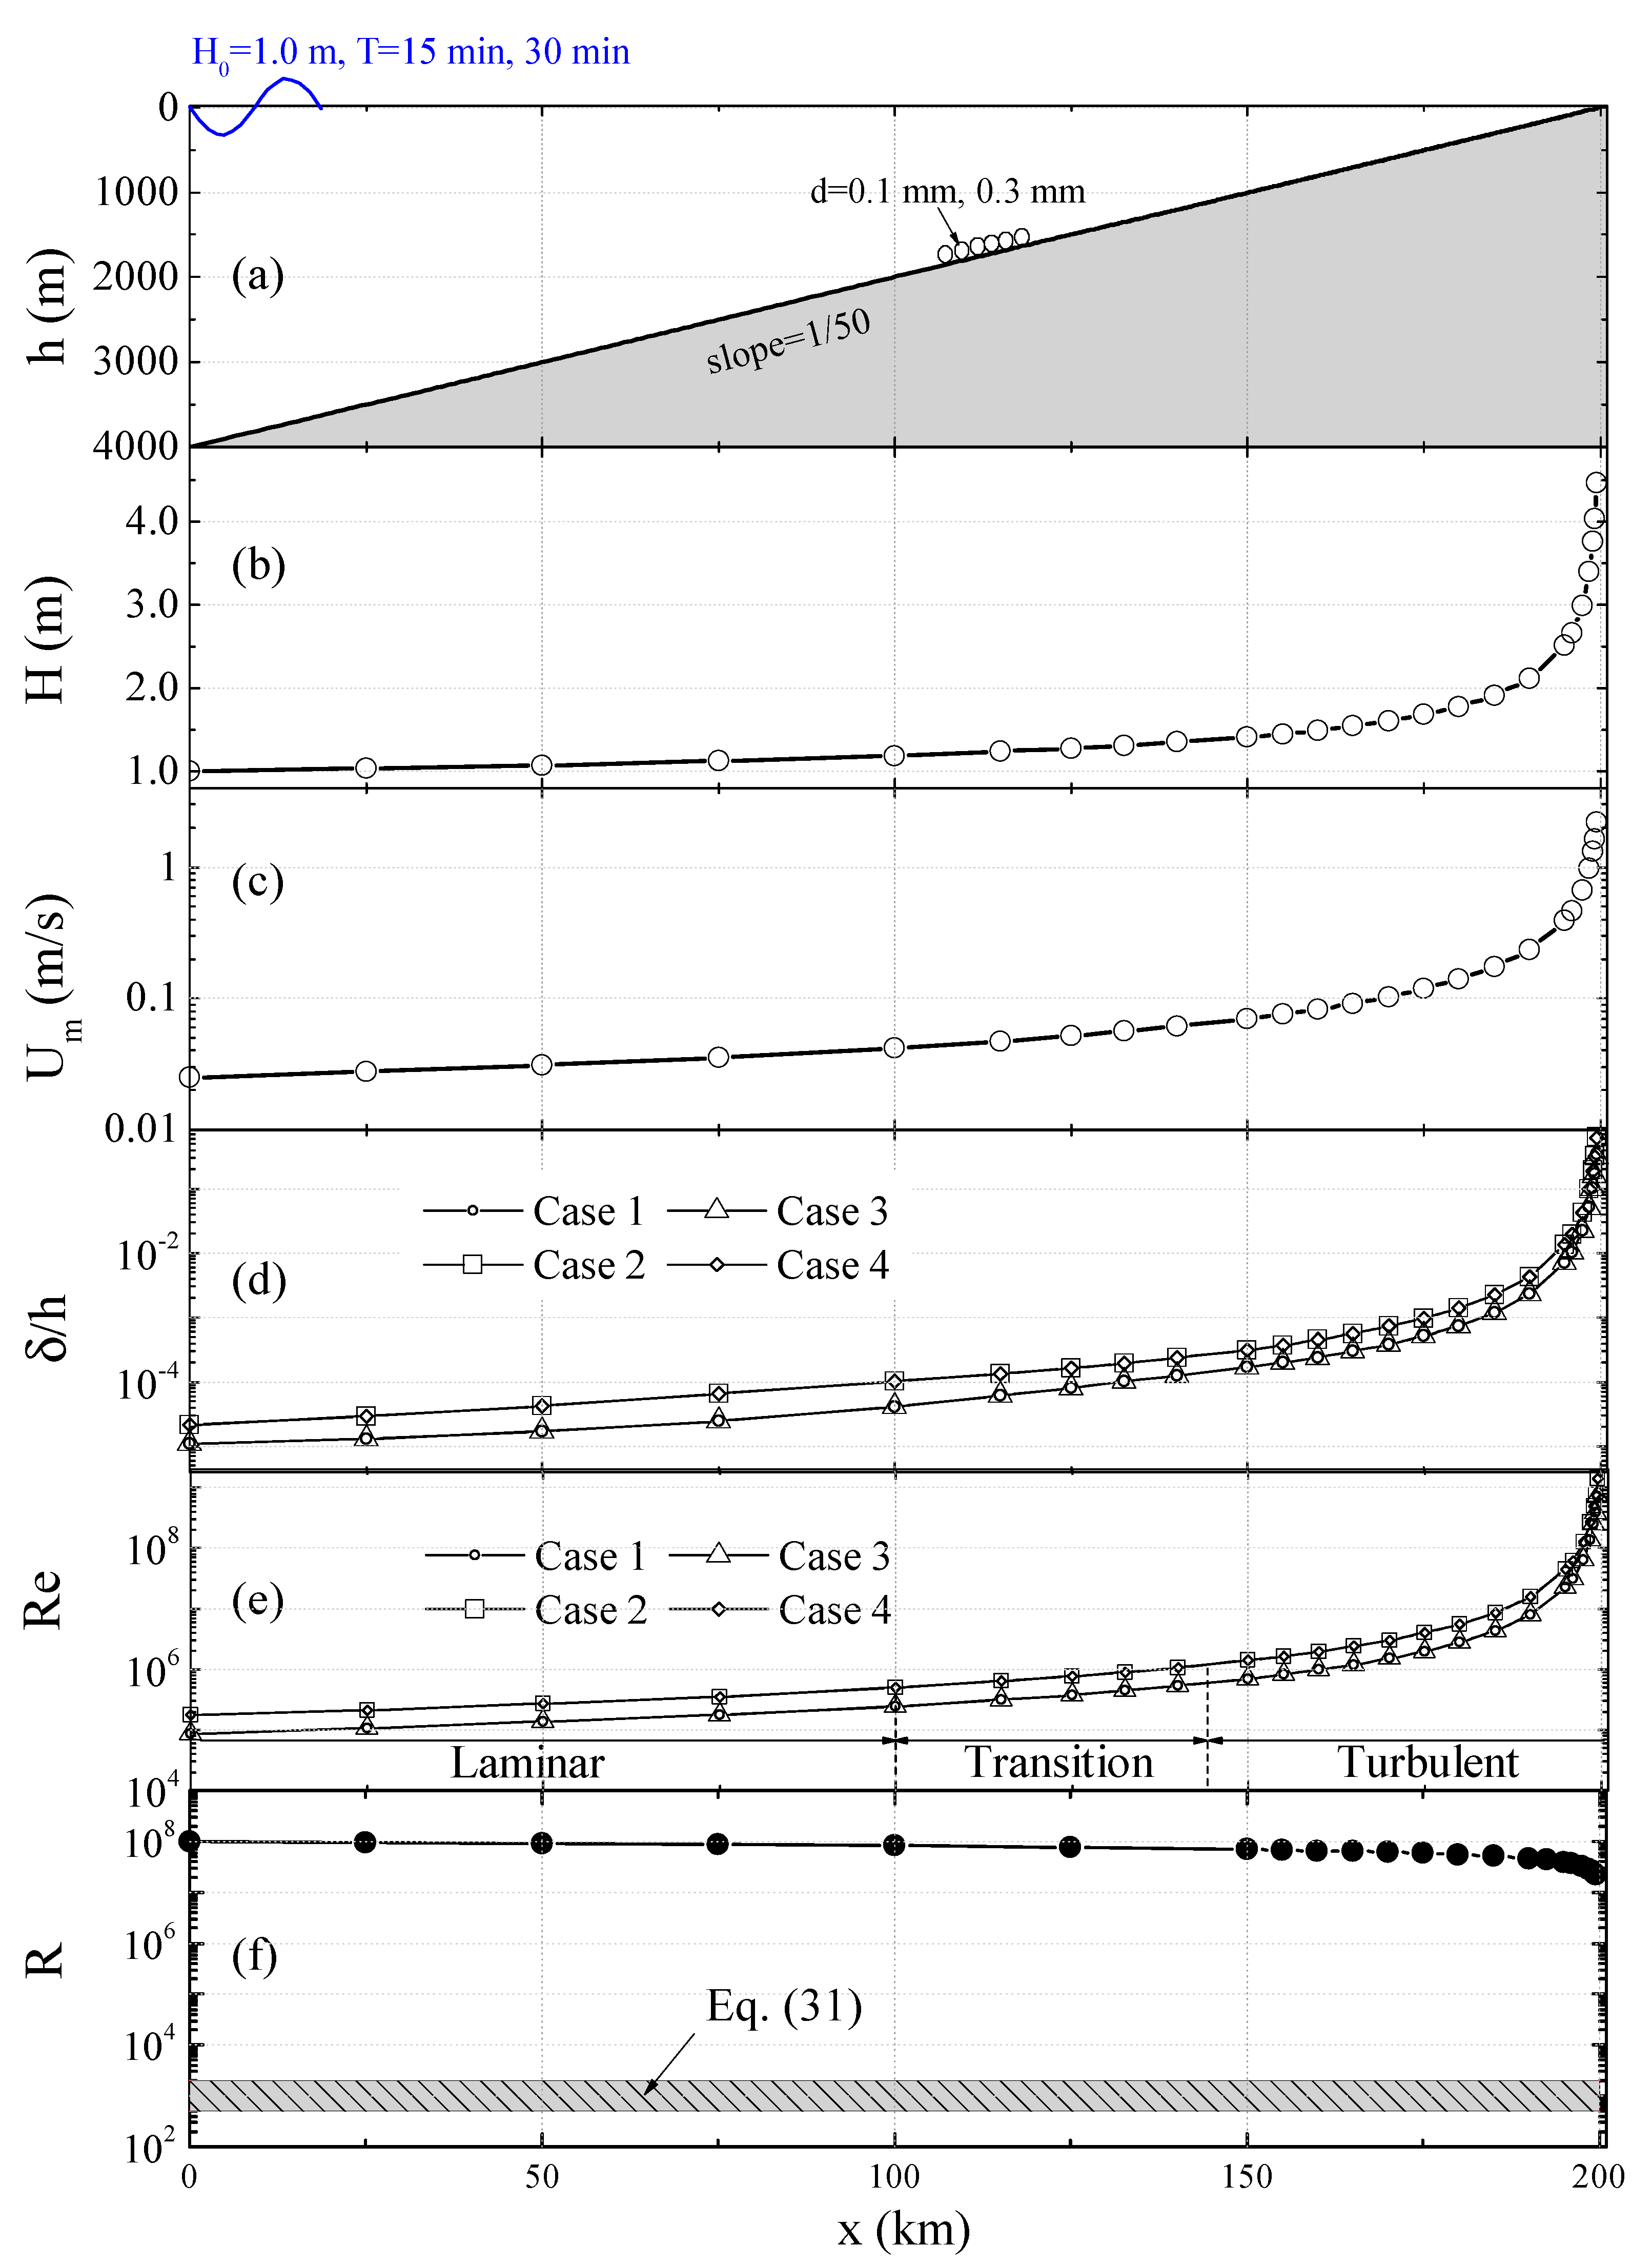
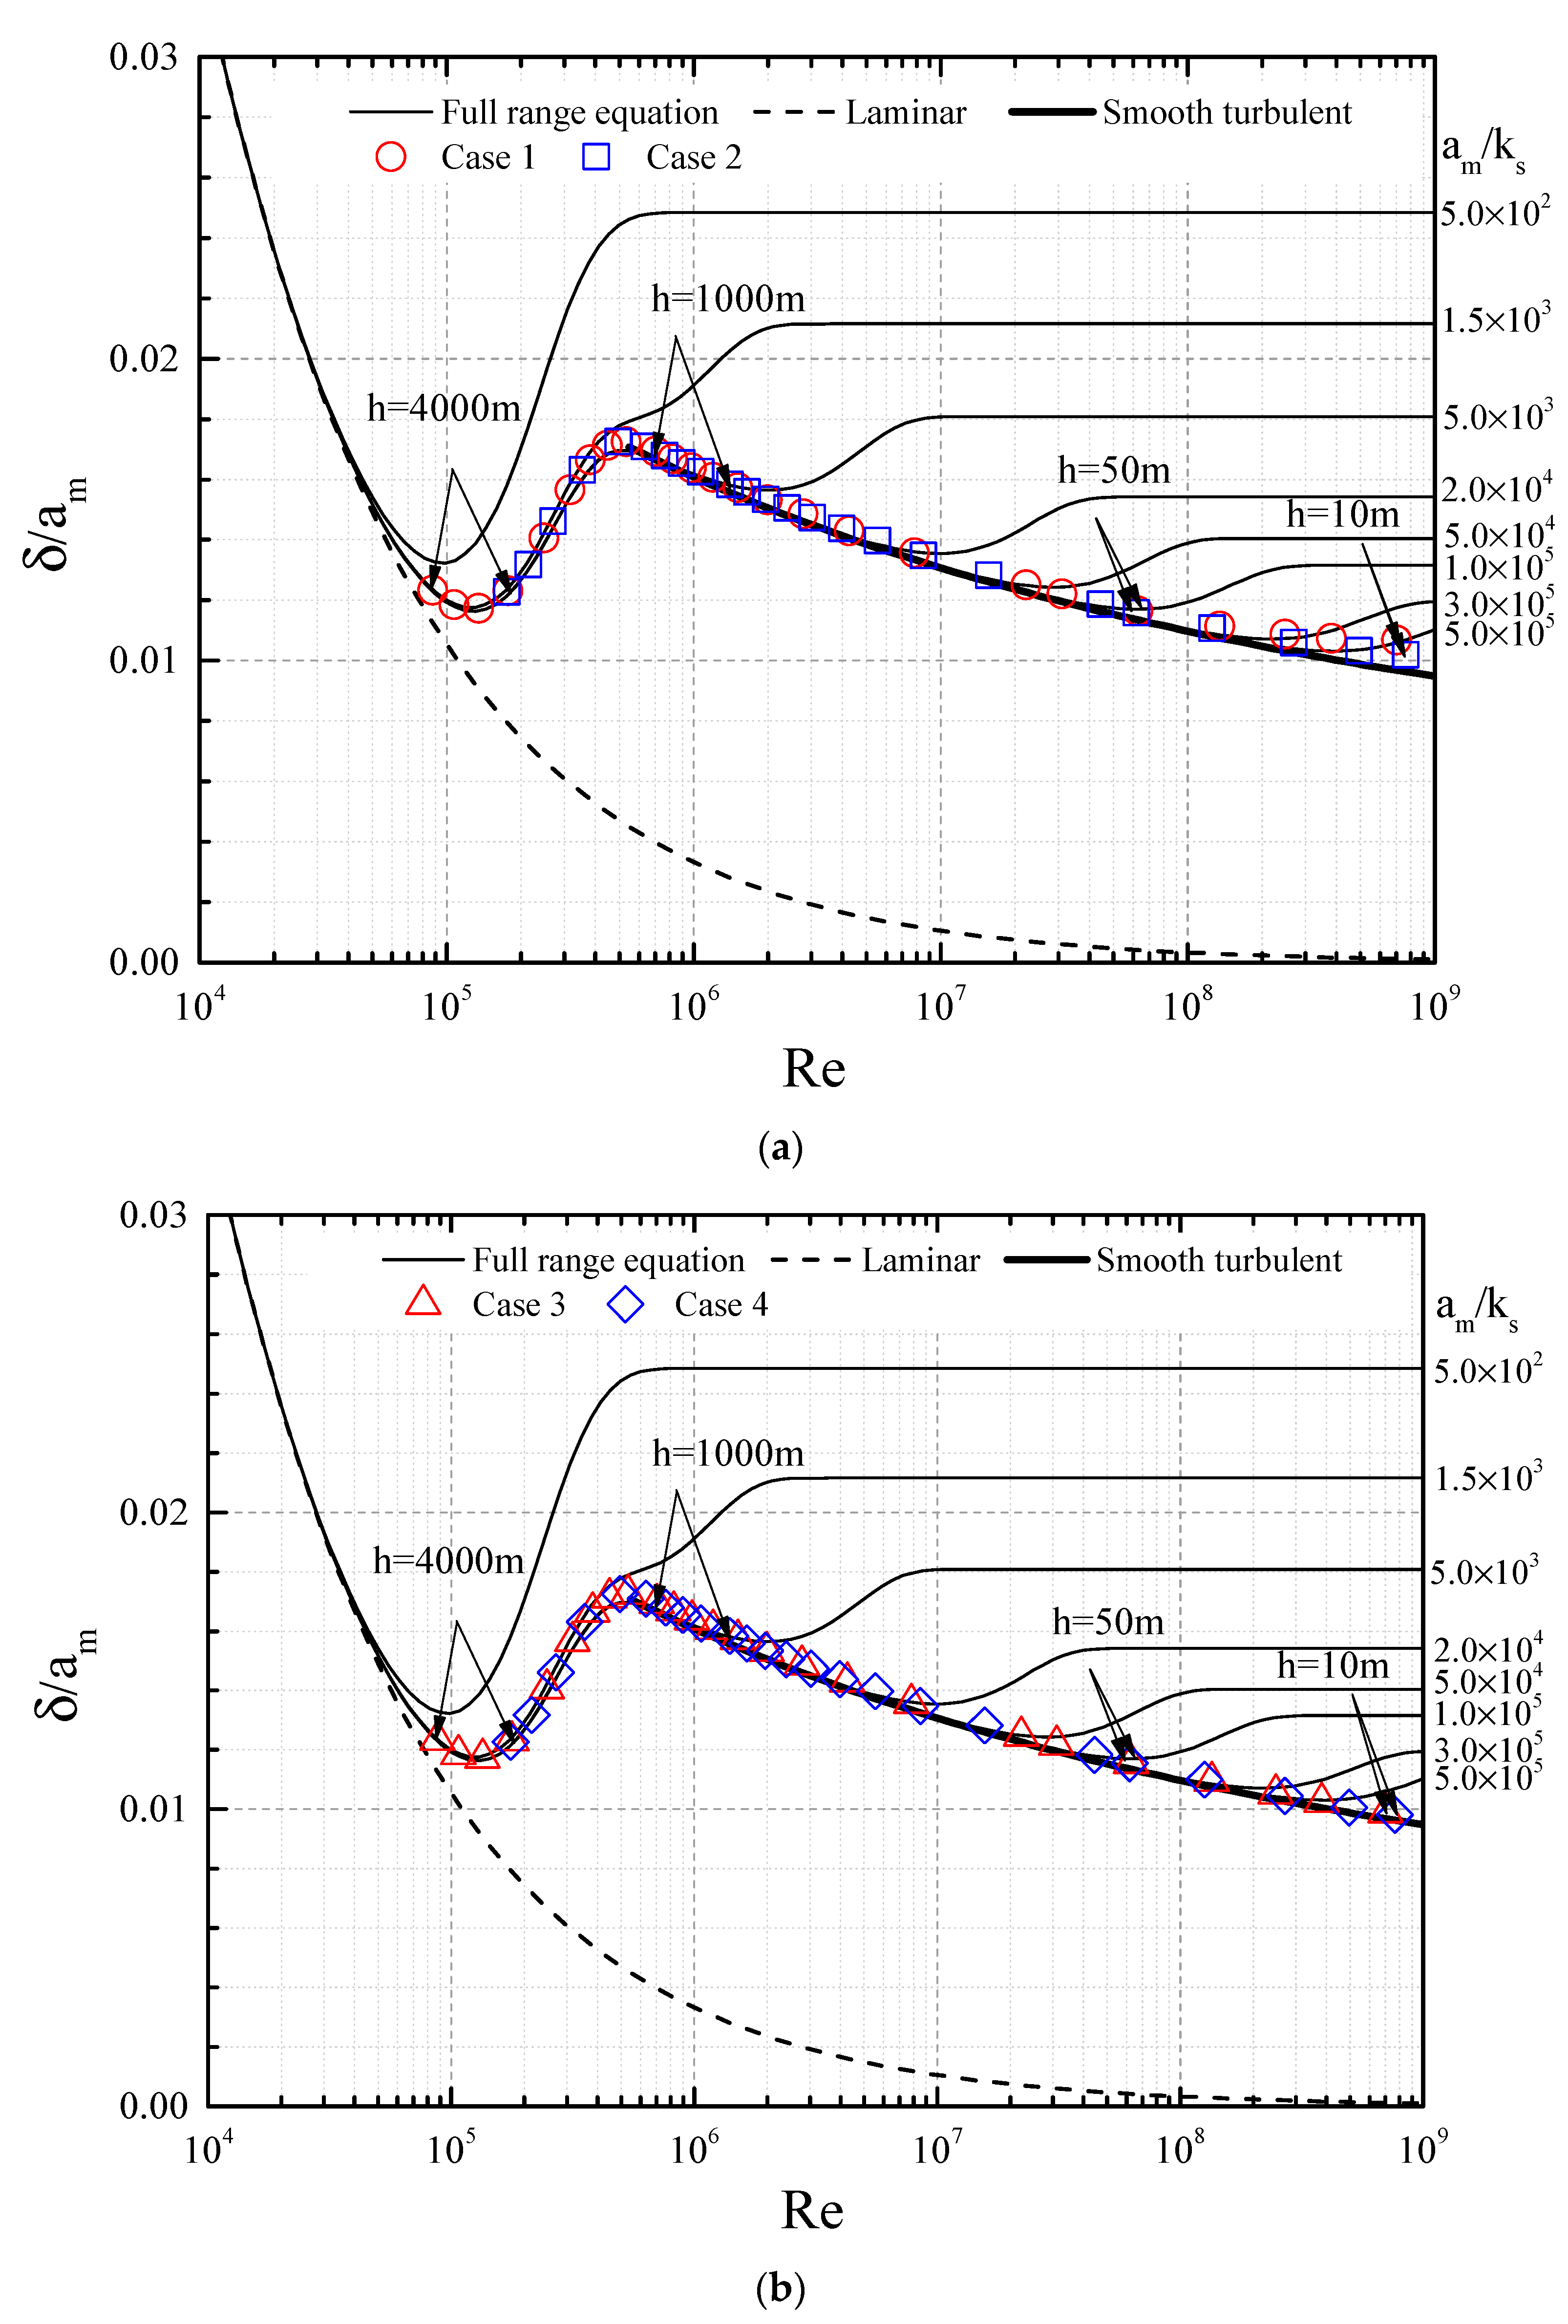
The wave height and maximum velocity under the shoaling tsunami are computed using Equations (8) and (9), respectively, as shown Table 2, and are plotted in Figure 2b,c. Substituting the a m / k s and R e values in Table 2 into the full-range equation for wave boundary layer thickness shown in Table 3(b), Figure 3a,b are obtained for transitional variation of the boundary layer thickness under the shoaling tsunami. It is observed in Figure 3a (d = 0.3 mm) that transitional behavior occurs from laminar to smooth turbulence, and finally slight deviation from smooth turbulence to the smooth–rough transitional regime at h = 10 m is observed. Meanwhile, as shown in Figure 3b, with finer bed material (d = 0.1 mm), transition from smooth turbulence cannot be seen even at h = 10 m.
The ratio of the boundary thickness to the water depth, δ / h , in the entire region of tsunami shoaling is shown in Figure 2d. As seen in the figure, the boundary layer is very thin as compared with the water depth in all cases as explained in Figure 1b, and it can be confirmed that the steady flow friction coefficient cannot be applied, although almost all of the past studies on tsunami numerical simulation assumed so. As depicted in Figure 1, because of the steep velocity gradient in the wave boundary layer, the bottom shear stress from the wave friction factor ( τ 0 ( 2 ) ) is usually greater than that from steady flow theory ( τ 0 ( 1 ) ).

4.2. Transitional Flow Regime in Terms of the Re vs. am/ks Relationship

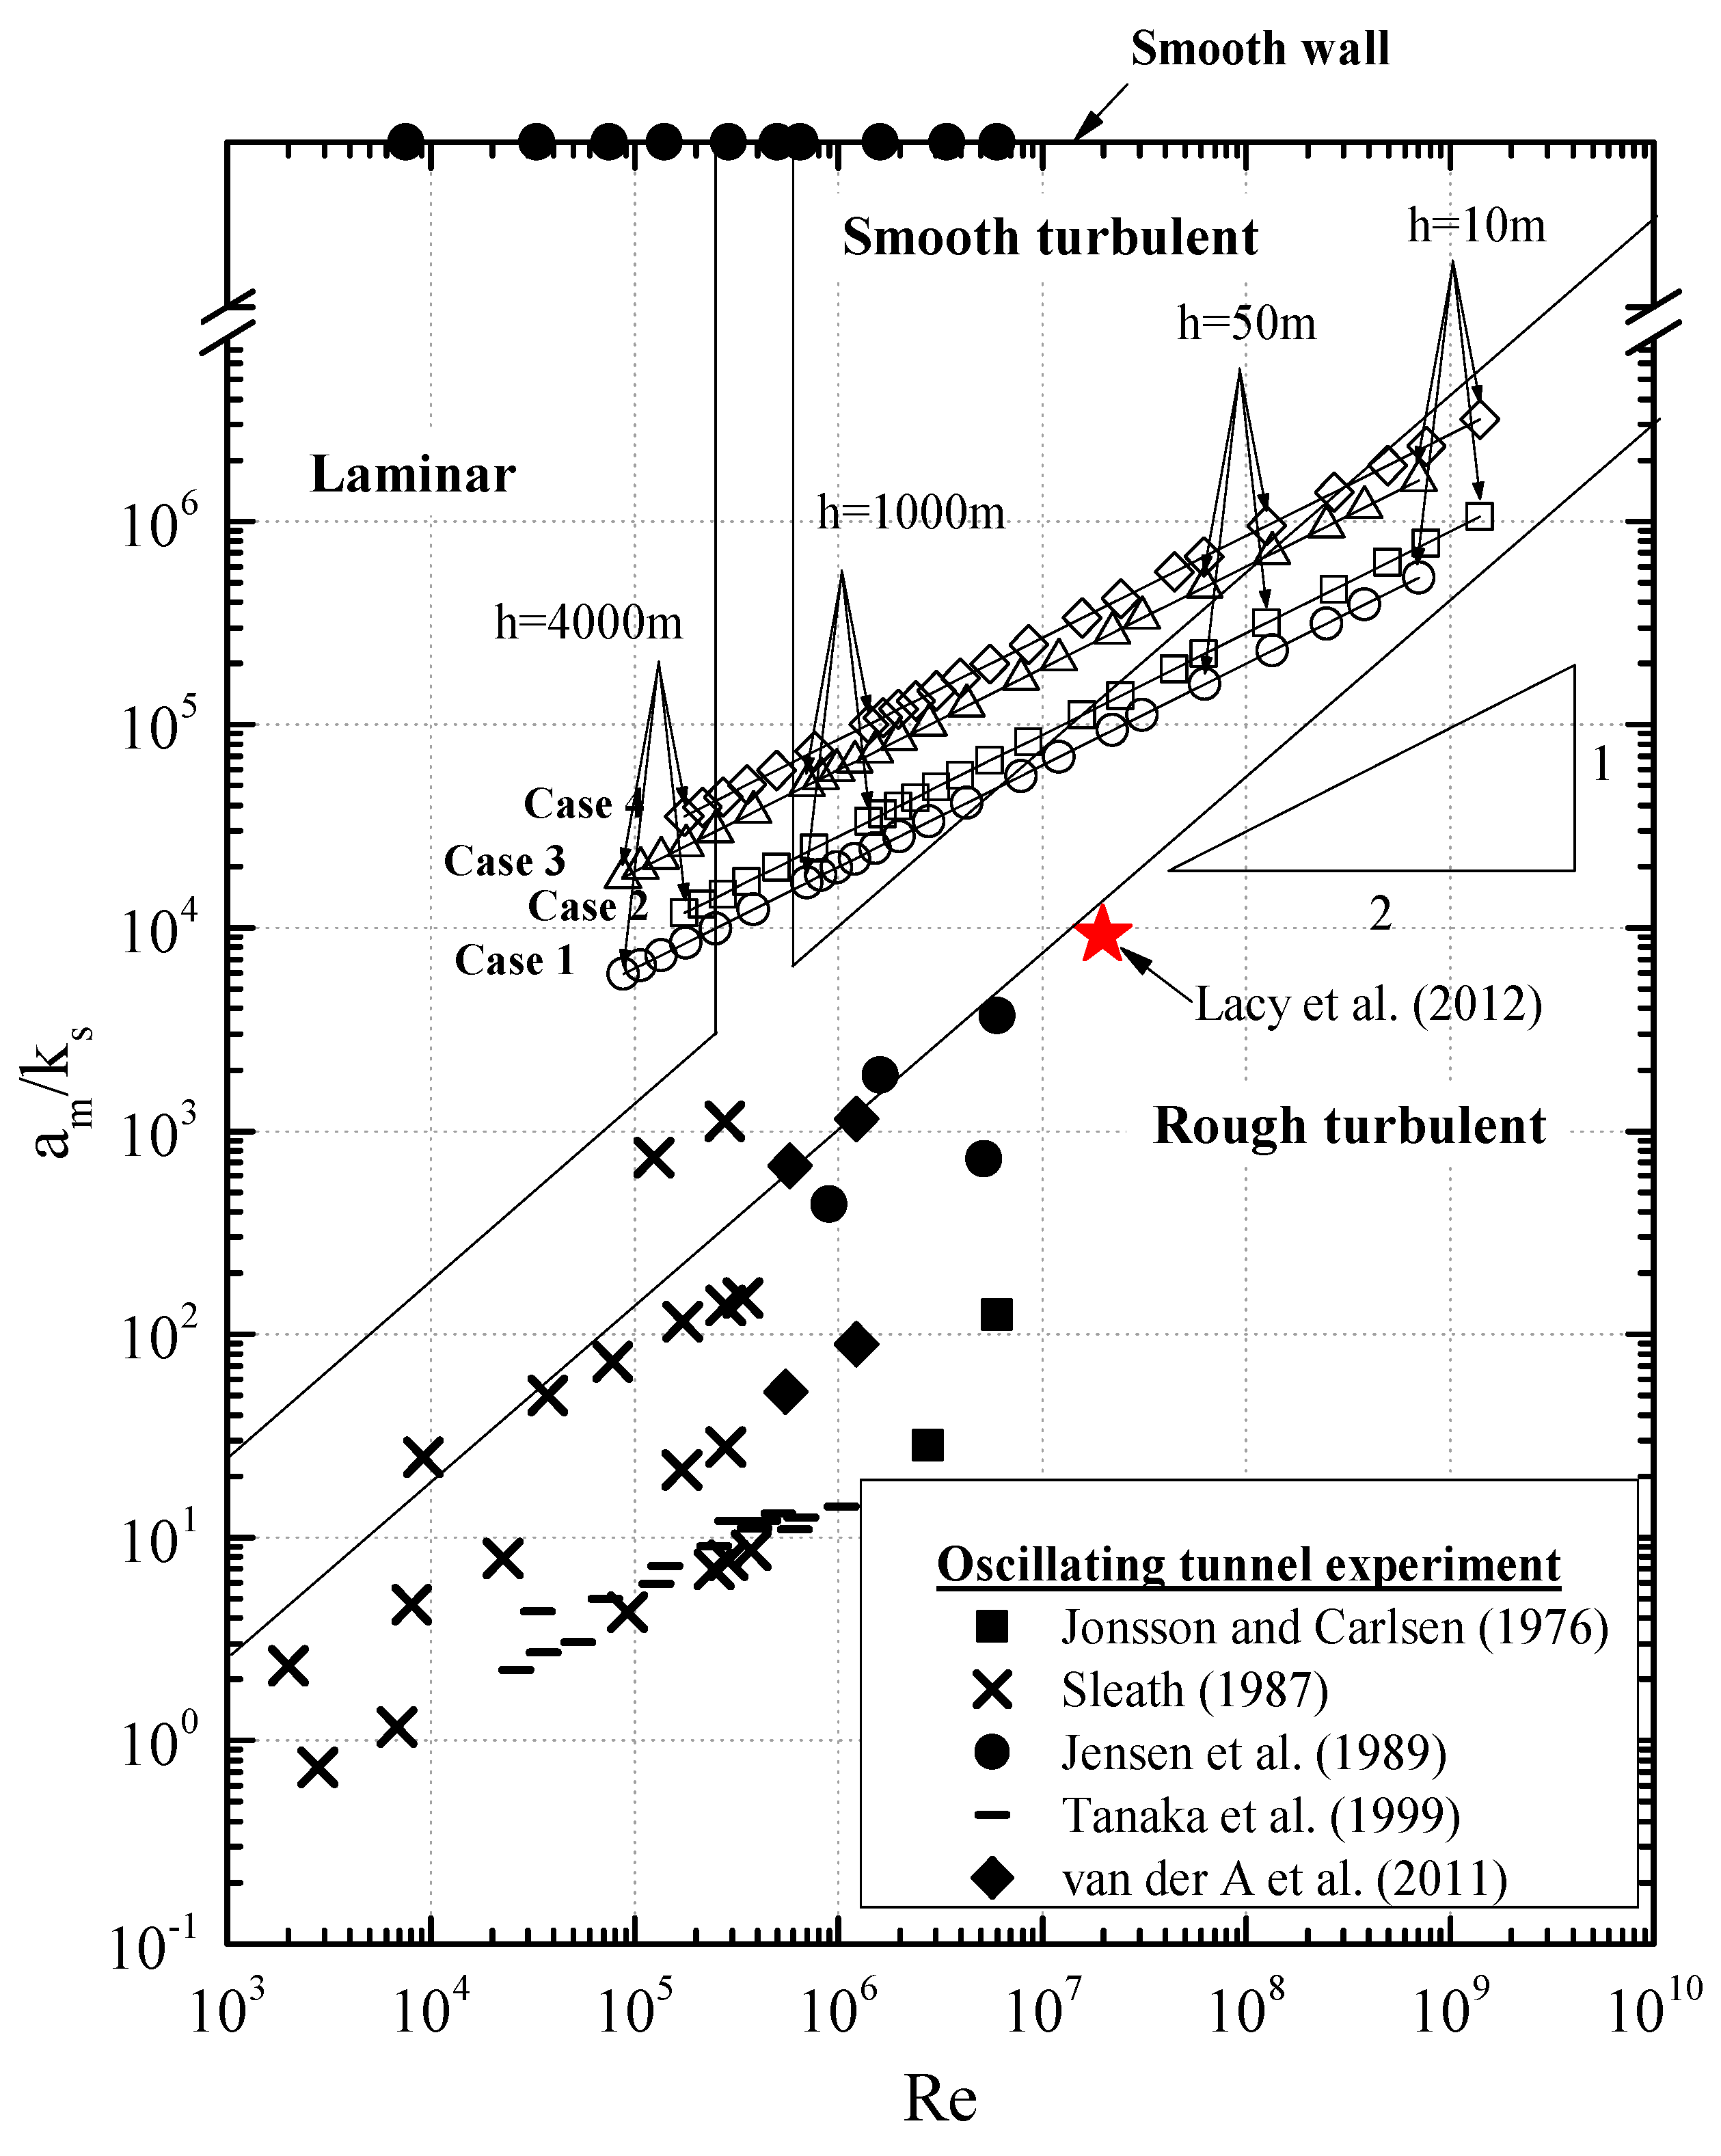
In Figure 4, the transitional flow regime under tsunami shoaling is plotted in a diagram in terms of R e and a m / k s (Tanaka and Thu [18]). The demarcation lines in this diagram are obtained from Equations (1), (2), (6) and (7). The relationship between R e and a m / k s is expresses as
a m k s = δ S 2 k s R e 1 / 2
where δ S is the Stokes layer thickness defined as [19]
δ S = 2 ν σ
Therefore, in Figure 4, the plotted data of each shoaling tsunami are located on the straight line with a slope of 1/2 in log–log plots.
The bottom boundary layer in the tsunami source area is located in laminar regime in Figure 4, as previously reported by Williams and Fuhrman [6]. According to the linear long wave theory, the maximum tsunami-induced velocity in the source area from Equation (9) is in the order of O (1 cm/s) as seen in Table 2, resulting in an extremely small Reynolds number—much smaller than the critical values given by Equation (1).
In Figure 4, field data obtained by Lacy et al. during the 2020 Chilean Tsunami are plotted, and are located slightly below Equation (7).
Under wind-generated wave boundary layers, there have been numerous laboratory experiments under full-scale sea wave conditions using an oscillating flow tunnel, such as those by Jonsson and Carlsen [26], Sleath [24], Jensen et al. [23], Tanaka et al. [4], and van der A et al. [27]. These experimental conditions for wind-generated waves are plotted in Figure 4 for comparison with tsunami boundary layers investigated in this study. It is confirmed that the conditions of wind-generated wave boundary layer studies with rough bottom are confined to the range in the left bottom corner of Figure 4 with a smaller value of R e and a m / k s , whereas the smooth bottom experiments that are plotted on the axis of a m / k s are infinity.
It is confirmed that in Figure 4, after departing the source area, transition occurs from laminar to transitional flow, from transitional to smooth turbulent flow, and finally from smooth turbulent to transitional area. In the condition considered in the preset study, however, a fully rough turbulent regime cannot be reached even at the water depth of 10 m.

4.3. Laminar-to-Turbulent Transition

Substituting Equation (9) into Equation (3), Reynolds number R e ( S ) at the tsunami source area is obtained.
R e ( S ) = g H 0 2 T 8 π h 0 ν
Further modification of Equation (25) can be made by substituting constant values such as g , π and ν (=   1.0 × 10 6   m 2 / s ).
R e ( S ) = 3.9 × 10 5 × H 0 2 T h 0   ( SI   units )
In order to discuss the Reynolds number at the tsunami source area, h 0   = 4000 m and H 0   = 1 m are substituted into Equation (26), and only the period T of tsunami will be treated as an independent variable. The relationship between Reynolds number and wave period is illustrated in Figure 5. When the period exceeds T   = 42.7 min, transition occurs from laminar to turbulent flow according to Equation (1). In order to cross the upper limit of transition given by Equation (2), a much longer wave period is required at the tsunami source area.
Meanwhile, Reynolds number R e at an arbitrary location can be correlated with R e ( S )   defined by Equation (26) as
R e = R e ( S ) ( h h 0 ) 3 / 2
Equation (27) indicates that reduction of water depth causes increase in the wave Reynolds number in the shallow area. The calculation result of the Reynolds number by Equation (27) is shown in Figure 2e. Since the Reynolds number does not include the bottom roughness, the lines in Figure 2e are drawn separately for cases with different wave periods. It is observed that the Reynolds number for the T = 15 min tsunami (Case 1 and Case 3) exceeds the critical values given in Equations (1) and (2), at x = 101 km and x = 145 km, respectively, whereas for the T = 30 min tsunami (Case 2 and Case 4), this occurs at x = 42 km and x = 112 km, respectively.
It is noteworthy that the Reynolds number relevant to a steady current, R , is defined using the water depth as a characteristic length.
R = U m h ν
Similar to Equation (27), R at an arbitrary place can be correlated with that at the tsunami source, R ( s ) , as
R = R ( s ) ( h h 0 ) 1 / 4
where R ( s ) is defined as
R ( S ) = U m 0 h 0 ν
According to Equation (29), R decreases with decreasing water depth during the tsunami propagation, which is opposite to the behavior observed for Equation (27).
The steady current Reynolds number is obtained in Table 2 for the shoaling tsunami. According to Chow [28], the critical Reynolds number for transition to turbulence in a steady open channel flow is
R = 500 2000
The R value in Table 2 is in the order of O (107), which remarkably exceeds the above critical value for a steady flow, as illustrated in Figure 2f. Hence, based on the steady current Reynolds number, it might be presumed that the boundary layer beneath the tsunami is fully turbulent. However, the steady current Reynolds number is not suitable under the tsunami for recognizing the flow regime, since the development of the sea bottom boundary layer is not limited by the water surface in most of the computational domain (see Figure 1 and Figure 2d). In the wave Reynolds number defined by Equation (3), the representative length is am, and its magnitude is distinctly smaller as compared with the water depth, especially in the deep sea region, resulting in a laminar regime in the tsunami source area as depicted in Figure 4.

4.4. Smooth-to-Rough Transition

In order to apply Equations (4) and (5) as a criterion for transition from smooth to rough turbulence, the maximum friction velocity, u m * , obtained from the full-range friction factor in Table 3 is used. According to the results shown in Figure 6, the roughness Reynolds numbers in four cases are all located in the region from the smooth turbulence to the transitional regime under shoaling tsunamis. The behavior has already been observed in Figure 4.

4.5. Transitional Flow Regime in Terms of Friction Coefficient

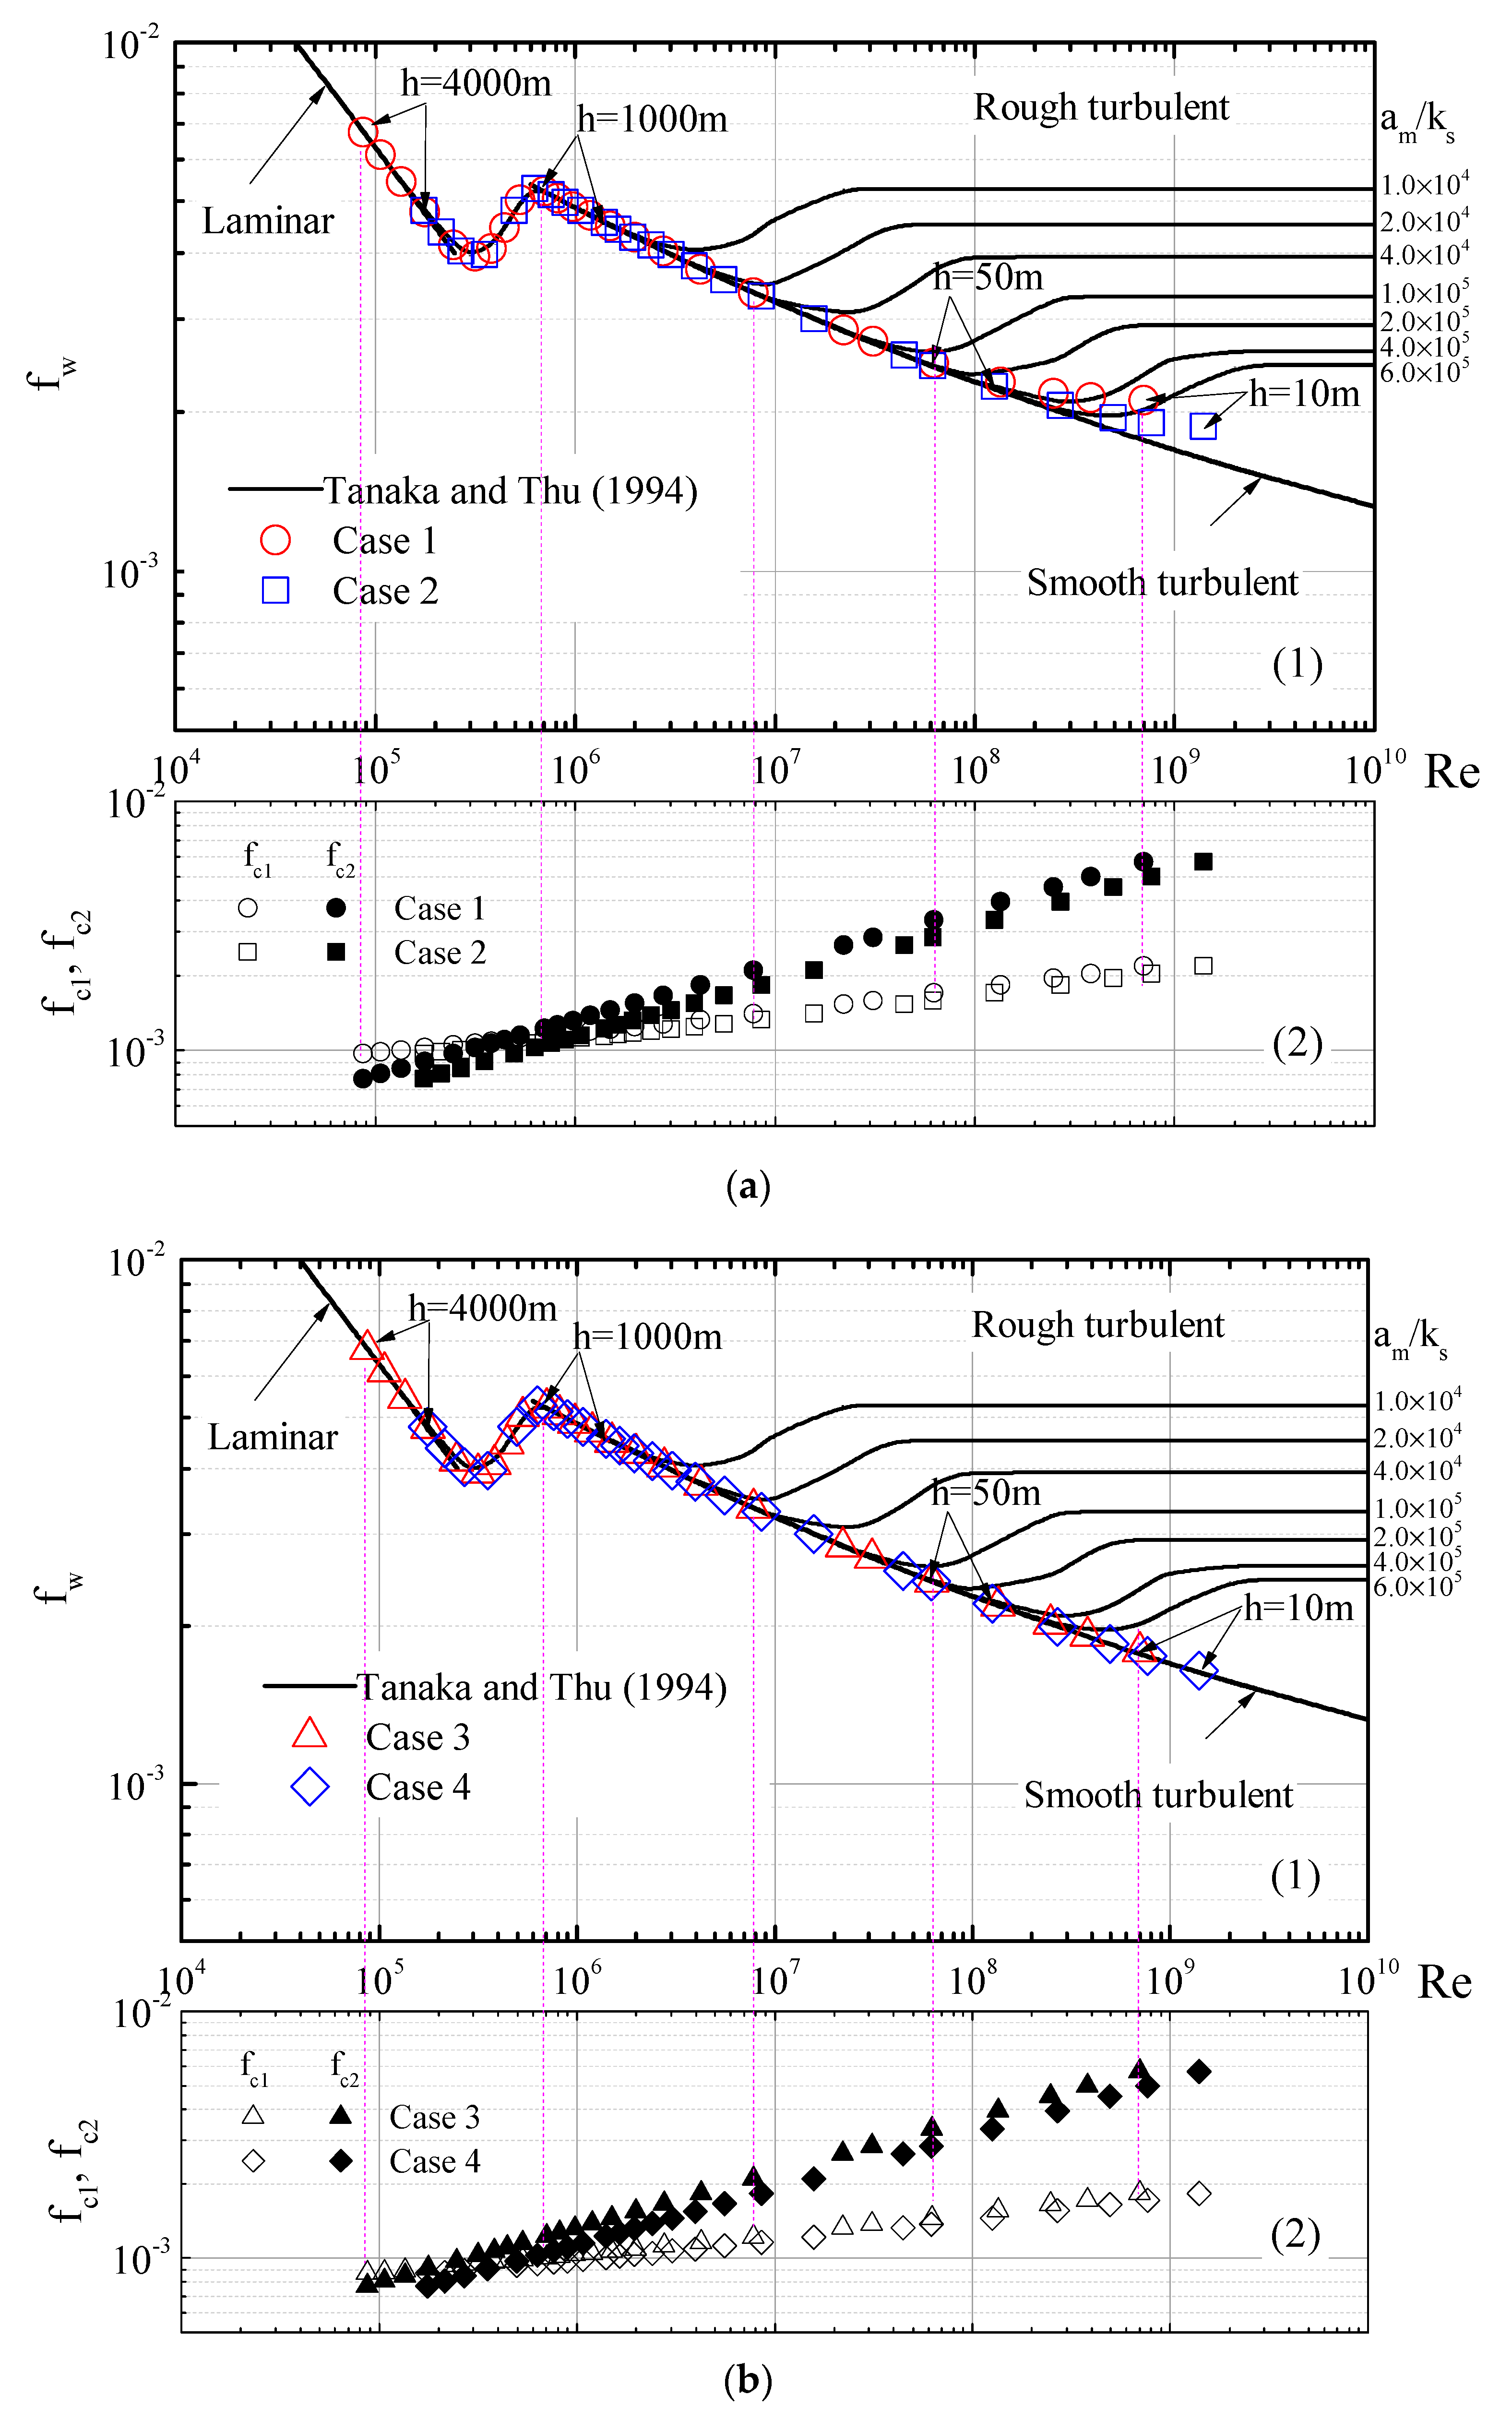
In order to examine how the wave friction coefficient varies under the shoaling tsunami condition, f w values are plotted in the diagram proposed by Tanaka and Thu [18] for each computation point from the tsunami source to the shallow area (Figure 7(a1,b1)). Although transitional behavior is clearly observed from the laminar to the smooth turbulent regime in both diagrams, slightly different behavior is seen between these diagrams; at h = 10 m, the friction factor deviates from the smooth turbulent equation in Figure 7(a1), whereas the plots remain on the smooth turbulent equation up to h = 10 m in Figure 7(b1). This is due to the difference in grain size between the two test groups as summarized in Table 1. The same behavior has already been observed in diagrams for boundary layer thickness depicted in Figure 3a,b.

4.6. Comparison with Steady Friction Laws

For the purpose of comparison with a conventional shear stress evaluation method, Figure 7(a2,b2) is plotted using the following steady flow friction coefficient f c 1 (derived using logarithmic velocity distribution) and f c 2 (derived from Manning’s formula) at each computational point.
f c 1 = 2 κ 2 { l n ( h z 0 ) 1 } 2
f c 2 = 2 g n 2 h 1 / 3
where κ : the Karman constant (=0.4), z 0 : the roughness length (=   k s / 30 ), and n : Manning’s roughness coefficient. Here Manning’s n is assumed to be 0.025 s/m1/3 as used in conventional computations. It is clear in Figure 7(a2,b2) that the increasing/decreasing tendency of fw from the tsunami source to the shallow area is totally opposite to that of f c 1 and f c 2 .
In order to make a comparison among the three friction coefficients in Figure 7a,b, f c 1 / f w and f c 2 / f w are illustrated by taking h (the water depth) as a horizontal scale in Figure 8a,b for each computational case. By using the steady friction law, f c 1 , the friction factor is underestimated in the entire computational domain, whereas f c 2 gives overestimation in the shallow area. Similar analysis has been carried out by Larsen et al. [29] for their numerical analysis results of a full-scale tsunami, using a Reynolds-averaged Navier–Stokes model. They concluded that using n = 0.0125 s/m1/3, Equation (33) gives a tendency to under-predict the magnitude of bottom shear stress at the toe of a slope in their computational domain.

4.7. Transitional Flow Regime and Transitional Friction Factor under a Tsunami

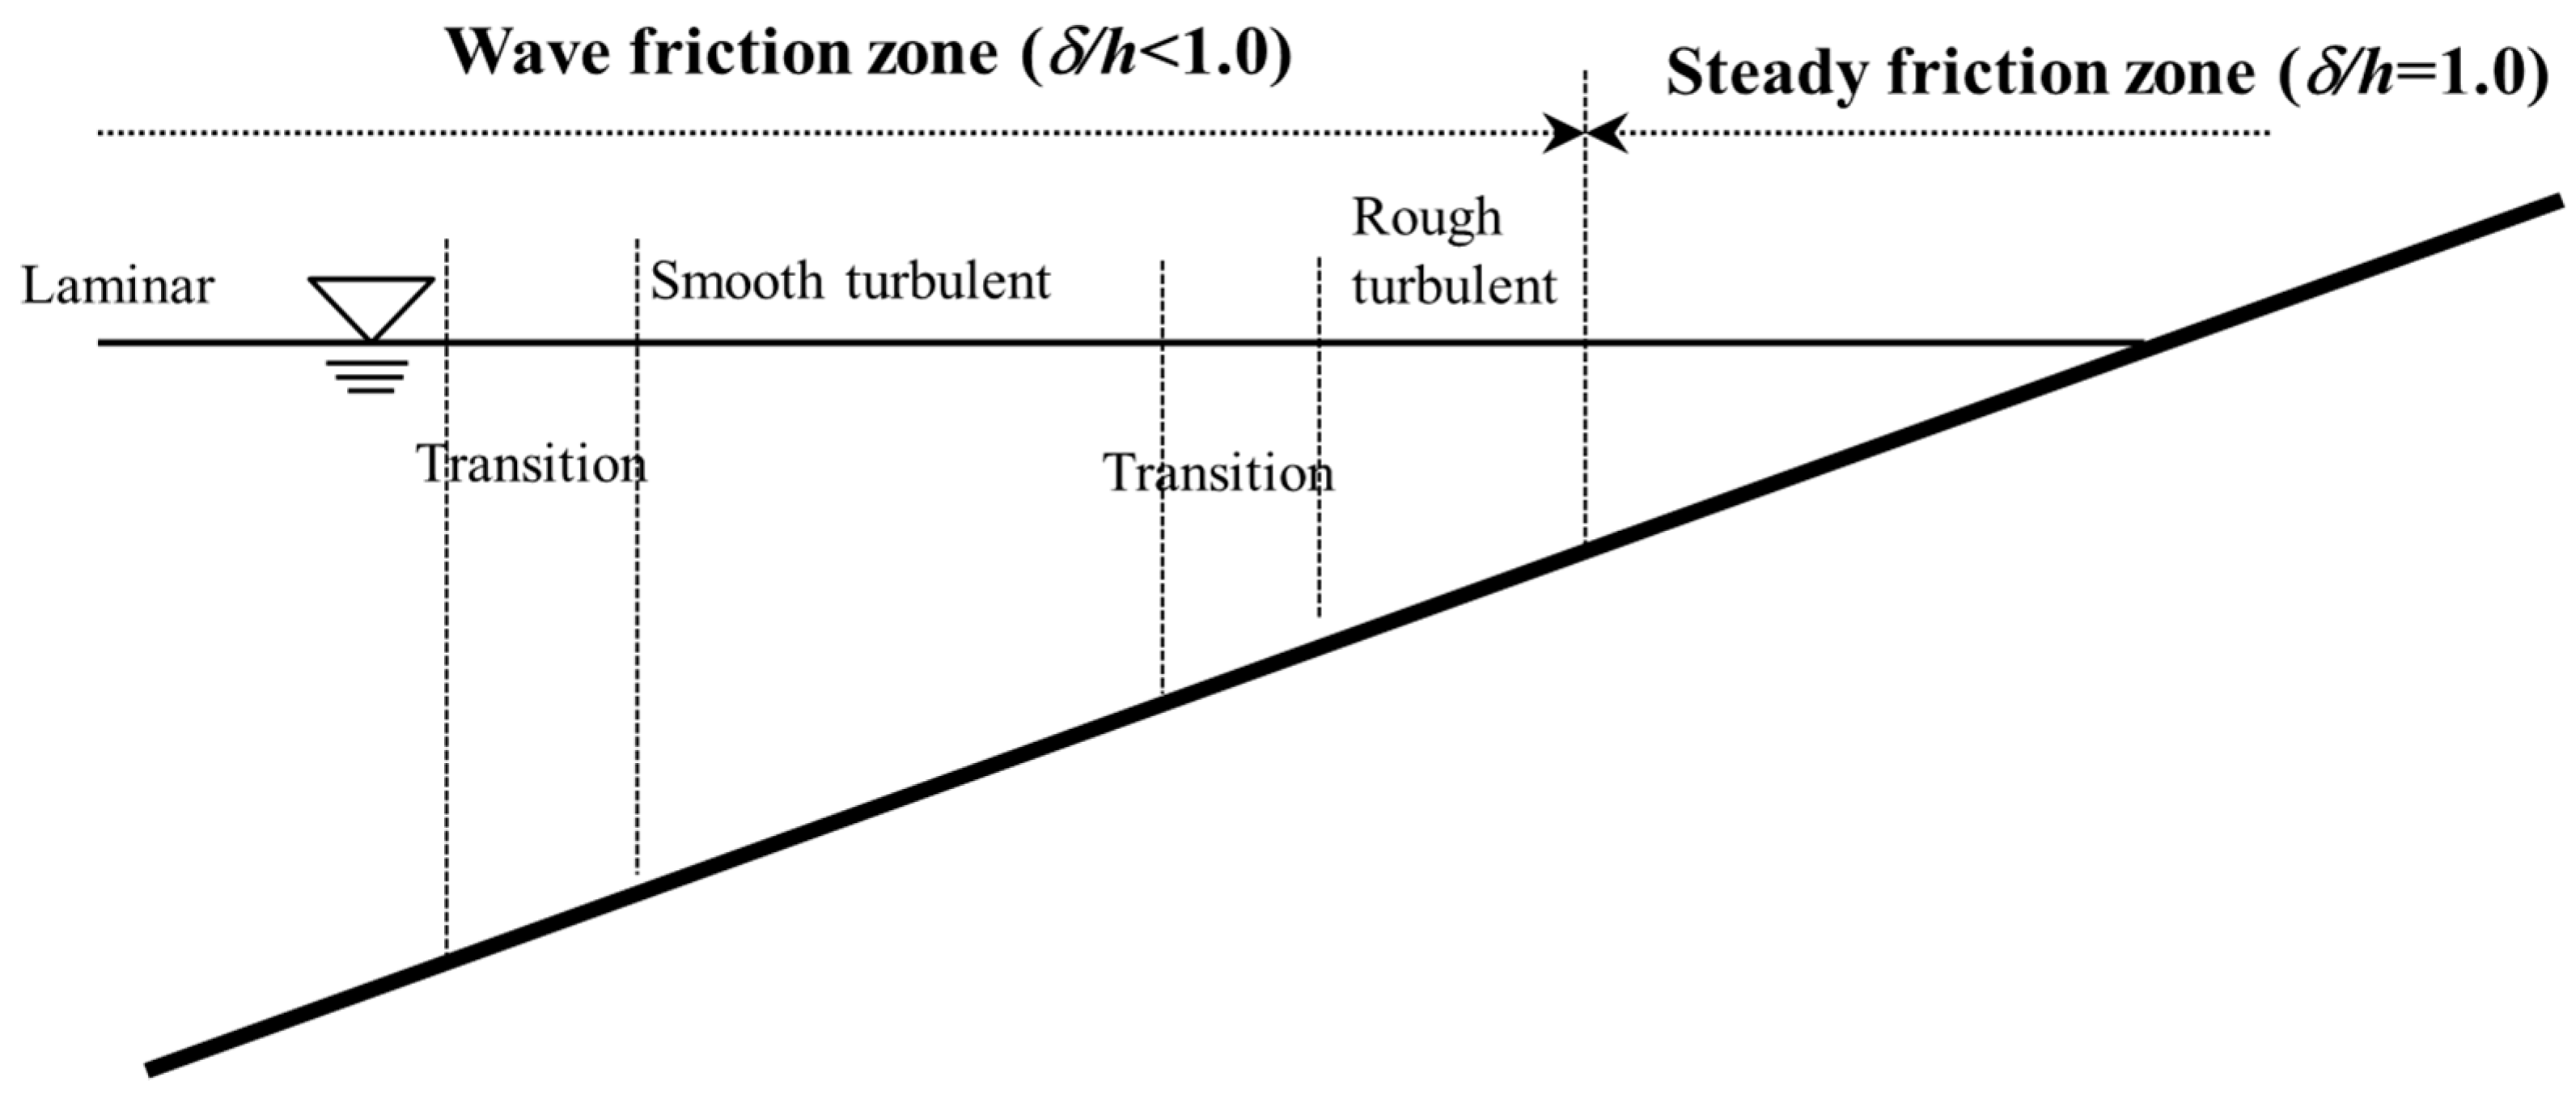
Figure 9 indicates the transitional flow regime under the tsunami considered in the present study. As clarified by Tanaka et al. [4] and Tinh and Tanaka [9], depending on δ / h value, there is a transition with respect to the friction law, regardless of whether it is a wave friction zone or a steady friction zone. Moreover, according to the present study, the former can be classified into laminar, laminar-to-smooth turbulent transition, smooth turbulent regime, smooth–rough transition, and rough turbulent regime. For precise evaluation of the decay of tsunami waves, it is necessary to include such transitional behavior of bottom friction in tsunami numerical simulations.

5. Conclusions

In this study, development of a bottom boundary layer under shoaling tsunamis is investigated. In the previous study of Tinh and Tanaka [9], the flow condition was considered to be rough turbulent flow. However, this study revealed that transitional behavior prevails during the tsunami shoaling process. The most interesting outcome of the present study is that the boundary layer in the tsunami source region is located in the laminar regime, contrary to a common assumption of fully turbulent boundary layers existing in the entire range of depths. Then, as the wave propagates in the onshore direction, transition occurs from the laminar to the smooth turbulent regime. Under the condition of a hypothetical tsunami in this study, a fully rough bottom regime cannot be attained. When we evaluate wave height attenuation and sediment movement during tsunami propagation, precise identification of such behavior of the bottom boundary layer characteristic is highly required.

Author Contributions

H.T. wrote of the manuscript and contributes to the interpretation of the results. N.X.T. and A.S. performed the experimental data analysis and numerical simulation as well as preparation of the figures. All authors have read and agreed to the published version of the manuscript.

Funding

This research was funded by the Taisei Foundation.

Acknowledgments

The authors would like to express their sincere gratitude to the financial support from the Taisei Foundation.

Conflicts of Interest

The authors declare no conflict of interest.

References

  1. Imamura, F. Review of Tsunami Simulation with a Finite Difference Method. In Long-Wave Runup Models; World Scientific: Singapore, 1996; pp. 25–42. [Google Scholar]
  2. Liu, P.L.F.; Woo, S.B.; Cho, Y.S. Computer Programs for Tsunami Propagation and Inundation; Technical report; Cornell University: Ithaca, NY, USA, 1998. [Google Scholar]
  3. Lynett, P.J.; Gately, K.; Wilson, R.; Montoya, L.; Arcas, D.; Aytore, B.; Bai, Y.; Bricker, J.D.; Castro, M.J.; Cheung, K.F.; et al. Inter-model analysis of tsunami-induced coastal currents. Ocean Model. 2017, 114, 14–32. [Google Scholar] [CrossRef]
  4. Tanaka, H.; Sana, A.; Kawamura, I.; Yamaji, H. Depth-limited oscillatory boundary layers on a rough bottom. Coast. Eng. J. 1999, 41, 85–105. [Google Scholar] [CrossRef]
  5. Lacy, J.R.; Rubin, D.M.; Buscombe, D. Currents, drag, and sediment transport induced by a tsunami. J. Geophys. Res. 2012, 117, C9. [Google Scholar] [CrossRef]
  6. Williams, I.A.; Fuhrman, D.R. Numerical simulation of tsunami-scale wave boundary layers. Coast. Eng. 2016, 110, 17–31. [Google Scholar] [CrossRef] [Green Version]
  7. Sumer, M.B.; Fuhrman, D.R. Turbulence in Coastal and Civil Engineering; World Scientific: Singapore, 2020; 758p. [Google Scholar]
  8. Larsen, B.E.; Arbøll, L.K.; Kristoffersen, S.F.; Carstensen, S.; Fuhrman, D.R. Experimental study of tsunami-induced scour around a monopile foundation. Coast. Eng. 2018, 138, 9–21. [Google Scholar] [CrossRef] [Green Version]
  9. Tinh, N.X.; Tanaka, H. Study on boundary layer development and bottom shear stress beneath a tsunami. Coast. Eng. J. 2019, 61, 574–589. [Google Scholar] [CrossRef]
  10. Jonsson, I.G. Wave Boundary Layers and Friction Factors. In Proceedings of the 10th International Conference on Coastal Engineering, Tokyo, Japan, 5–8 September 1966; ASCE: New York, NY, USA, 1966; pp. 127–148. [Google Scholar]
  11. Jonsson, I.G. A new approach to oscillatory rough turbulent boundary layers. Ocean Eng. 1980, 7, 109–152. [Google Scholar] [CrossRef]
  12. Kamphuis, J.W. Friction factor under oscillatory waves. J. Waterw. Port Coast. Ocean Eng. 1975, 101, 135–144. [Google Scholar]
  13. Myrhaug, D. A rational approach to wave friction coefficients for rough, smooth and transitional turbulent flow. Coast. Eng. 1989, 13, 11–21. [Google Scholar] [CrossRef]
  14. Tanaka, H.; Sana, A. Numerical Study on Transition to Turbulence in a Wave Boundary Layer. In Sediment Transport Mechanisms in Coastal Environments and Rivers; World Scientific: Singapore, 1994; pp. 14–25. [Google Scholar]
  15. Tanaka, H.; Shuto, N. Friction laws and flow regimes under wave and current motion. J. Hydraul. Res. 1984, 22, 245–261. [Google Scholar] [CrossRef]
  16. Christoffersen, J.B.; Jonsson, I.G. Bed friction and dissipation in a combined current and wave motion. Ocean Eng. 1985, 12, 387–423. [Google Scholar] [CrossRef]
  17. Myrhaug, D.; Slaattelid, O.H. A rational approach to wave-current friction coefficient for rough, smooth and transitional turbulent flow. Coast. Eng. 1990, 14, 265–293. [Google Scholar] [CrossRef]
  18. Tanaka, H.; Thu, A. Full-range equation of friction coefficient and phase difference in a wave-current boundary layer. Coast. Eng. 1994, 22, 237–254. [Google Scholar] [CrossRef]
  19. Schlichting, H. Boundary Layer Theory, 9th ed.; Springer: Berlin/Heidelberg, Germany, 1979; 805p. [Google Scholar]
  20. Sana, A.; Tanaka, H. Full-range equation for wave boundary layer thickness. Coast. Eng. 2007, 54, 639–642. [Google Scholar] [CrossRef]
  21. Sana, A.; Tanaka, H. Corrigendum to “Full-range equation for wave boundary layer thickness” [Coast. Eng. 54 (2007) 639–642]. Coast. Eng. 2019, 152, 103516. [Google Scholar] [CrossRef]
  22. Tanaka, H.; Tinh, N.X.; Sana, A. Improvement of the full-range equation for wave boundary layer thickness. J. Mar. Sci. Tech. 2020, 8, 573. [Google Scholar] [CrossRef]
  23. Jensen, B.L.; Sumer, B.M.; Fredsøe, J. Turbulent oscillatory boundary layers at high Reynolds numbers. J. Fluid Mech. 1989, 206, 265–297. [Google Scholar] [CrossRef] [Green Version]
  24. Sleath, J.F.L. Turbulent oscillatory flow over rough beds. J. Fluid Mech. 1987, 82, 369–409. [Google Scholar] [CrossRef]
  25. Yuan, J.; Madsen, O.S. Experimental study of turbulent oscillatory boundary layers in an oscillating water tunnel. Coast. Eng. 2014, 89, 63–84. [Google Scholar] [CrossRef]
  26. Jonsson, I.G.; Carlsen, N.A. Experimental and theoretical investigation in an oscillatory turbulent boundary layer. J. Hydraul. Res. 1976, 14, 45–60. [Google Scholar] [CrossRef]
  27. van der Dominic, A.A.; O’Donoghue, T.; Davies, A.G.; Ribberink, J.S. Experimental study of the turbulent boundary layer in acceleration-skewed oscillatory flow. J. Fluid Mech. 2011, 684, 251–283. [Google Scholar] [CrossRef] [Green Version]
  28. Chow, V.T. Open Channel Hydraulics; McGraw-Hill: New York, NY, USA, 1959; 700p. [Google Scholar]
  29. Larsen, B.E.; Fuhrman, D.R. Full-scale CFD simulation of tsunamis. Part 2: Boundary layers and bed shear stresses. Coast. Eng. 2019, 151, 42–57. [Google Scholar] [CrossRef]
Figure 1. Difference between (a) the current-type velocity profile and (b) the wave boundary layer.
Jmse 08 00700 g001
Figure 2. Results for hypothetical shoaling tsunamis. (a) Water depth, (b) wave height, (c) maximum velocity, (d) boundary layer thickness, (e) wave Reynolds number, and (f) steady flow Reynolds number.
Jmse 08 00700 g002
Figure 3. Transitional behavior of boundary layer thickness. (a) Case 1, Case 2 (d = 0.3 mm), (b) Case 3, Case 4 (d = 0.1 mm).
Jmse 08 00700 g003
Figure 4. Flow regime under shoaling tsunamis and oscillating tunnel experiments.
Jmse 08 00700 g004
Figure 5. Relationship between wave period T and the Reynolds number in the tsunami source area.
Jmse 08 00700 g005
Figure 6. Transition from smooth to rough turbulent regime.
Jmse 08 00700 g006
Figure 7. Transitional behavior of the friction coefficient. (a) Case 1, Case 2 (d = 0.3 mm), (b) Case 3, Case 4 (d = 0.1 mm).
Jmse 08 00700 g007
Figure 8. Comparison among Equations (11), (32) and (33). (a) Case 1, Case 2 (d = 0.3 mm). (b) Case 3, Case 4 (d = 0.1 mm).
Jmse 08 00700 g008
Figure 9. Transitional flow regime under the tsunami.
Jmse 08 00700 g009
Table 1. Input tsunami conditions.
QuantityInput Value
Water depth of tsunami source h0 = 4000 m
Tsunami height in the sourceH0 = 1 m
Case 1Wave periodT = 15 min
Sand diameterd = 0.3 mm
Case 2Wave periodT = 30 min
Sand diameterd = 0.3 mm
Case 3Wave periodT = 15 min
Sand diameterd = 0.1 mm
Case 4Wave periodT = 30 min
Sand diameterd = 0.1 mm
Table 2. Calculation conditions.
x
(km)
h
(m)
H
(m)
Um
(m/s)
a m / k s R e   =   U m a m / ν R   =   U m h / ν
Case 1Case 2Case 3Case 4Case 1, Case 3Case 2, Case 4
040001.000.0255.91 × 1031.18 × 1041.77 × 1043.54 × 1048.77 × 1041.75 × 1059.90 × 107
2535001.030.0276.53 × 1031.31 × 1041.96 × 1043.92 × 1041.07 × 1052.14 × 1059.57 × 107
5030001.080.0317.33 × 1031.47 × 1042.20 × 1044.40 × 1041.35 × 1052.70 × 1059.21 × 107
7525001.130.0358.41 × 1031.68 × 1042.52 × 1045.04 × 1041.78 × 1053.55 × 1058.80 × 107
10020001.190.0429.94 × 1031.99 × 1042.98 × 1045.96 × 1042.48 × 1054.96 × 1058.32 × 107
11517001.240.0471.12 × 1042.24 × 1043.37 × 1046.73 × 1043.17 × 1056.33 × 1057.99 × 107
12515001.280.0521.23 × 1042.47 × 1043.70 × 1047.40 × 1043.82 × 1057.64 × 1057.75 × 107
132.513501.310.0561.33 × 1042.67 × 1044.00 × 1048.01 × 1044.47 × 1058.95 × 1057.55 × 107
14012001.350.0611.46 × 1042.92 × 1044.37 × 1048.75 × 1045.34 × 1051.07 × 1067.33 × 107
15010001.410.071.67 × 1043.34 × 1045.01 × 1041.00 × 1057.02 × 1051.40 × 1067.00 × 107
1559001.450.0761.81 × 1043.62 × 1045.43 × 1041.09 × 1058.22 × 1051.64 × 1066.82 × 107
1608001.500.0831.98 × 1043.95 × 1045.93 × 1041.19 × 1059.81 × 1051.96 × 1066.62 × 107
1657001.550.0912.18 × 1044.37 × 1046.55 × 1041.31 × 1051.20 × 1062.40 × 1066.40 × 107
1706001.610.1032.45 × 1044.90 × 1047.35 × 1041.47 × 1051.51 × 1063.02 × 1066.16 × 107
1755001.680.1182.81 × 1045.62 × 1048.43 × 1041.69 × 1051.99 × 1063.97 × 1065.89 × 107
1804001.780.1393.32 × 1046.64 × 1049.97 × 1041.99 × 1052.77 × 1065.55 × 1065.57 × 107
1853001.910.1734.12 × 1048.25 × 1041.24 × 1052.47 × 1054.27 × 1068.54 × 1065.18 × 107
1902002.120.2345.59 × 1041.12 × 1051.68 × 1053.35 × 1057.85 × 1061.57 × 1074.68 × 107
1951002.520.3949.40 × 1041.88 × 1052.82 × 1055.64 × 1052.22 × 1074.44 × 1073.94 × 107
196802.660.4651.11 × 1052.22 × 1053.33 × 1056.67 × 1053.10 × 1076.20 × 1073.72 × 107
197.5502.990.6621.58 × 1053.16 × 1054.74 × 1059.48 × 1056.28 × 1071.26 × 1083.31 × 107
198.5303.400.9712.32 × 1054.64 × 1056.95 × 1051.39 × 1061.35 × 1082.70 × 1082.91 × 107
199203.761.3163.14 × 1056.28 × 1059.43 × 1051.89 × 1062.48 × 1084.96 × 1082.63 × 107
199.25154.041.6333.90 × 1057.80 × 1051.17 × 1062.34 × 1063.82 × 1087.64 × 1082.45 × 107
199.5104.472.2145.28 × 1051.06 × 1061.59 × 1063.17 × 1067.02 × 1081.40 × 1092.21 × 107
Table 3. Full-range equations for the wave friction coefficient and wave boundary layer thickness.
(a)
Wave Friction Coefficient
Tanaka and Thu [18]
(b)
Wave Boundary Layer Thickness
Tanaka et al. [22]
Full-range equation f w = f 2 { f 1 f w ( L ) + ( 1 f 1 ) f w ( S ) } + ( 1 f 2 ) f w ( R ) (11) δ a m = f 2 { f 1 δ ( L ) a m + ( 1 f 1 ) δ ( S ) a m } + ( 1 f 2 ) δ ( R ) a m   (18)
Equation for each flow regime f w ( L ) = 2 R e (12) δ ( L ) a m = 3 π 4 2 R e (19)
f w ( S ) = exp { 7.94 + 7.35 R e 0.0748 } (13) δ ( S ) a m = 0.331 f w ( S ) 2 = 0.234 exp { 3.97 + 3.68 R e 0.0748 } (20)
f w ( R ) = exp { 7.53 + 8.07 ( 30 a m k s ) 0.100 } (14) δ ( R ) a m = 0.331 f w ( R ) 2 = 0.234 exp { 3.77 + 4.04 ( 30 a m k s ) 0.100 } (21)
Weight function f 1 = e x p { 0.0513 ( R e 2.5 × 10 5 ) 4.65 } (15) f 1 = exp { 0.941 ( R e 2.5 × 10 5 ) 2.01 } (22)
f 2 = exp { 0.0101 ( R e R 1 ) 2.06 } (16)
R 1 = 25 ( a m k s ) 1.15 (17)