1. Introduction
The herein presented work is conducted in the frame of the Horizon 2020 European Research project “TrAM—Transport: Advanced and Modular”, which is a joint effort of 13 stakeholders (Kolumbus/Rogaland Prefecture, Norway (coordinator); Fjellstrand Yard, Norway; Hamburgische Schiffbau Versuchsanstalt (HSVA), Germany; Fraunhofer IEM, Germany; Hydro, Sweden; Leirvik, Norway; Nat. Tech. Univ. Athens (NTUA), Greece; Univ. of Strathclyde, United Kingdom; MBNA Thames Clippers, United Kingdom; Servogear, Norway; De Vlaamse Waterweg, Belgium; Wärtsilä Netherlands V.S., Netherlands; NCE Maritime CleanTech, Norway) of the European maritime industry [
1]. The aim of this project is to develop zero emission fast passenger vessels through advanced modular production, with the main focus on electrically powered vessels operating in coastal areas and inland waterways. The project is innovative for the introduced zero emission technology, the design and manufacturing methods, while it should prove that electric-powered vessels can be fast and competitive in terms of offered services, of the environmental impact and the life-cycle cost.
In the frame of this project, intensive research was carried out on the hydrodynamic optimization of a battery-driven catamaran’s hull form, in order to minimize power requirements and energy consumption, while introducing new propulsion and hull solutions related to the concept of electrically driven fast vessels. It should be noted that present replications of the battery-driven waterborne concept are limited to the lower and medium speed range. In that respect, hydrodynamic (and structural design) optimization is imperative for fast vessels and even more for battery driven vessels with a limited range of operation for the installed battery capacity.
Main authors of this paper have a long-standing experience in the optimization of fast twin-hull vessels—Papanikolaou et al., 1991 [
2] and 1996 [
3]; Zaraphonitis et al., 2003 [
4]; Skoupas et al., 2019 [
5]. The state of the art in the field is, however, longstanding and widely represented. Even though it is not the purpose of this paper to elaborate on this, some other representative and useful works dealing with the optimization of fast twin-hull vessels and their experimental verification can be found in the listed references—Insel, 1990 [
6]; Molland et al., 1994 [
7]; Brizzolara, 2004 [
8]; Bertram et al., 2017 [
9]. This list is not claimed to be exhaustive nor fully balanced.
The objective of this paper is to briefly present parts of the conducted numerical and experimental optimization study on the development of the hull form of the “Stavanger demonstrator”. Numerical studies were conducted by use of the Computer Aided Design (CAD) software platform CAESES
® and included the development of surrogate models for the ship’s resistance based on calculations for a large number of design variants using HSVA’s panel and Computational Fluid Dynamics (CFD) codes and the multi-objective global and local optimization by use of genetic algorithms. Obtained numerical results were verified by systematic model tests at the large towing tank of HSVA. A demonstrator of the presently studied catamaran concept will be built and also start operations in a multistop commuter route in the Stavanger area, Norway, before the end of the project in 2022 (
https://tramproject.eu/).
2. The Parametric Model
2.1. Background
Based on the preliminary lines plan of a reference vessel, a parametric model for the demihulls of the Stavanger demonstrator was developed by use of the CAESES
® software platform of Friendship Systems, Potsdam, Germany [
10,
11]. The developed parametric model offers the designer the possibility to control/specify the main particulars of the demihull along with the hull form details within a reasonable range of variation of the defined design variables, while at the same time, adequate quality (fairness) of the hull is ensured. The designer is enabled to explore the huge design space of automatically generated hull forms and decide on the most favorable ones on the basis of rational, holistic criteria [
12].
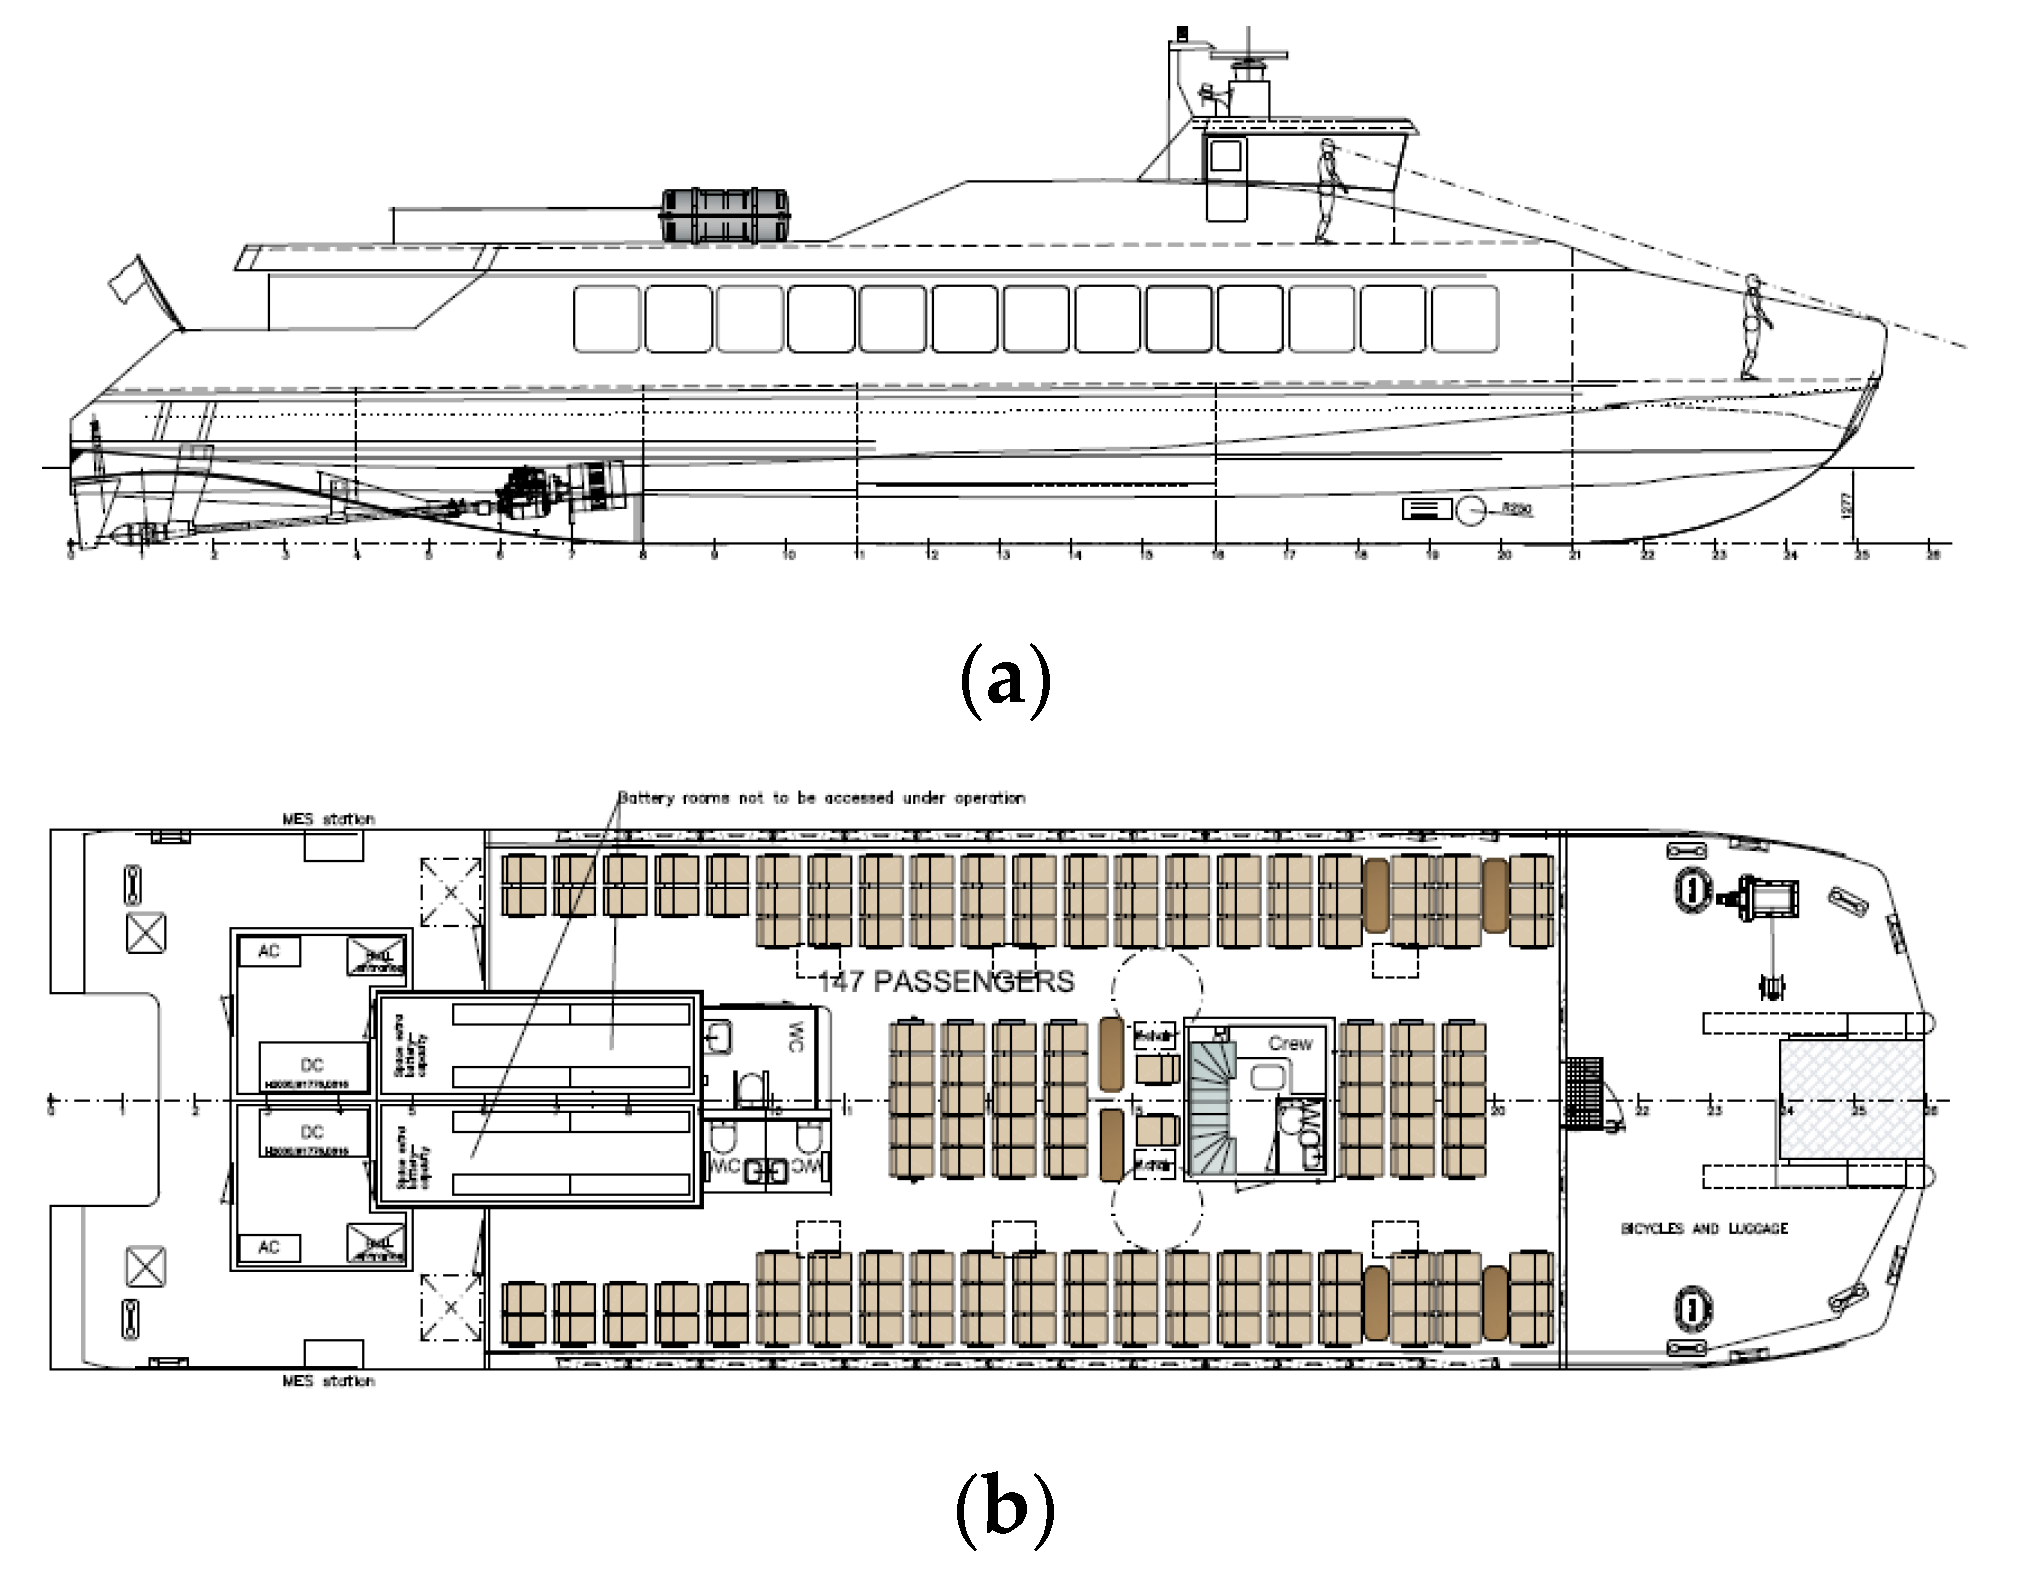
The external dimensions of the vessel providing the required passengers transport capacity were set equal to 31.0 m length overall by 9.0 m beam overall (
Figure 1). The vessel should be able to carry up to 147 passengers with a maximum operating speed of about 23–25 kn, depending on the loading condition and installed power of the propulsion e-motors. The overall length of each demihull was set equal to 30.6 m. Because of uncertainties in the weight calculations inherent in the early design stage of a prototype, it was decided that calm water predictions should be carried out for three different displacements (Δ1, Δ2 and Δ3).
2.2. Parametric Model
A set of 20 design variables was first specified, defining the main dimensions, as well as local hull details, such as the width, immersion and shape of the transom and the shape bow area of the vessel. From the set of 20 design parameters, the four most important referring to the catamaran’s main dimensions and the transom width were selected as design variables during the optimization studies (
Table 1). The overall beam of the catamaran is herein kept constant due to design/construction reasons (yard’s specification of deck superstructure module). It is of course acknowledged that increasing the separation distance of the demihulls would lead to lower wave resistance at some speeds, but the increase in lightweight and production cost is expected to outweigh this resistance benefit. It is also noted that the vessel’s operational Froude number will be close to 0.70, thus far beyond the last hump of wave resistance; thus, viscous resistance will be dominant at the catamaran’s service speed. The remaining 16 design parameters are kept constant at their default values. For the definition of the stern region, the most important parameters are the transom height at centerline and the height difference from centerline to the chine at transom. Negative values of the latter parameter indicate designs with the chine located lower than centerline, forming the propeller tunnel area. Another important parameter for stern definition is the x-coordinate of the maximum height of the tunnel at centerline. There is also a set of parameters for the definition of the bow area, such as the waterline fullness at the design draught and at deck height. The effect of the local design parameters is mainly of interest during the local hull form optimization.
Based on the specified values of the optimization variables, and the default values for the remaining design parameters, a grid of parametrically defined curves was created.
At first a set of primary definition curves was generated, such as the deck line, transom and centerline. Then a set of parametrically defined sections and diagonals was gradually added until the grid was completed. The creation of the primary definition curves was entirely based on the values of the optimization variables and the remaining design parameters. Subsequent curves were created using mostly reference points (making reference to previously defined curves) in order to ensure the consistency of the grid and to keep the necessary information for the elaboration of the hull form to the minimum. The sections were created using Interpolation Curves definition available in CAESES
® software, while the diagonals using 3D curves definition. A view of the parametrically defined grid is presented in
Figure 2a. Subsequently, a series of metasurfaces and lofted surfaces was generated, as presented in
Figure 2b. The metasurfaces were generated using a set of features, developed in CAESES
® software, exploiting the built-in scripting language.
After the initial hull definition, the hydrostatic values were calculated. A Lackenby transformation was then applied in order to obtain a demihull with a longitudinal center of buoyancy close to the expected longitudinal center of gravity. Additionally, the prismatic coefficient was adjusted in order to achieve a displacement close to the desired value. The Lackenby transformation parameters were considered constant during the optimization studies. The resulting hull form is illustrated in
Figure 2c.
It should be noted that the design variables were used for the definition of the initial hull form. The actual waterline length, beam and draught values of the demihull were calculated afterwards based on the final hull resulting from the Lackenby transformation for the immersed volume(s) specified by the user. This also included the hydrostatics for the initial draught and the set displacement volume. A tank top was assumed fitted at a certain height to protect the ship against raking damage, according to the definition of the areas vulnerable to raking damage provided in Chapter 2 of the International Maritime Organisation (IMO)’s High Speed Craft Code, for the maximum assumed displacement (Δ3). To ensure the availability of ample space for the installation and maintenance of the battery racks, the dimensions of the corresponding compartments were checked against the specified requirements/constraints.
The hydrodynamic assessment of each design alternative was based on HSVA’s in-house hydrodynamic tools, i.e., the panel code for wave resistance v-SHALLO [
13] and the RANSE code FreSCo
+ [
14]. Since these tools require considerable computing resources, it was decided to explore the possibility provided by CAESES
® to precompute data for later usage. To this end, a series of so-called Design of Experiments (DoE) were carried out, to obtain the resistance of a sufficiently large number (about 1000) of alternative hull forms. Based on the collected precomputed data, surrogate models were developed, enabling the sufficiently accurate estimation of the hydrodynamic quantities of interest during the optimization study in practically zero time (in our case, the calm water resistance of each design variant at various displacements and service speeds). Apart from drastically reducing the calculation time, surrogate models increased the robustness of the whole process by avoiding the need for remote computing.
3. Potential Flow Calculations
3.1. Theoritical Background
HSVA’s panel code v-SHALLO is a fully nonlinear, free surface potential CFD method computing the inviscid flow around a ship hull moving on the free water surface. The code is based on a superposition of a given free stream velocity with the flow induced by a number of 3D Rankine point sources on the ship’s hull and the free surface. v-SHALLO treats the nonlinear free surface boundary condition iteratively by a collocation method and uses a patch method for dealing with the body boundary condition and pressure integration [
13,
15]. The hull and the free surface were discretized by means of triangular and/or rectangular panels, and the individual source strengths were determined by solving a linear equation system resulting from the discretization of a Fredholm integral equation.
The applied panel mesh for the demihull of the catamaran is shown in
Figure 3 as an example. Trim and sinkage were estimated based on the vertical forces, and the body grid was moved accordingly. The wave elevation at the collocation points was computed from Bernoulli’s equation. A typical wave pattern computed for the Stavanger demonstrator at a speed of 23 kn is shown in
Figure 4.
3.2. Integration with the Parametric Model in CAESES®
v-SHALLO was the first of HSVA’s simulation tools that was fully integrated into the CAESES
® platform in the frame of the H2020 HOLISHIP project [
16]. The CAESES
® SoftwareConnector provides a platform for the integration of external simulation software in a user friendly and fast way. The panel mesh was generated directly in CAESES
® and saved as a pan file. The SoftwareConnector was directly connected with the parametric model of the catamaran’s demihulls in CAESES
®, which means that every geometrical change in the parametric model would be processed by v-SHALLO. Additionally, by keeping herein the overall beam of catamaran constant, the separation distance of the demihulls would be calculated automatically, while considering the maximum demihull beam, and v-SHALLO computed the interference between the wave systems of the two demihulls, which was especially important for the value of the wave resistance.
By configuring the optimization engine in CAESES®, different optimization strategies can be applied. Once the optimization strategy, the design variables as well as the objective functions and constraints have been decided, either the Design of Experiment (DoE) or other methods of design exploration/optimization can be carried out in CAESES® fully automatically. Results can be directly visualized and checked within CAESES®. In the meantime, a design table in ASCII format containing all the results as well as a folder including all the information related to each design is created. This design table can be read by other tools, such as Excel, for further analysis and processing of the results.
3.3. Design of Experiments (DoE)
Based on the operational profile of the Stavanger demonstrator, three speeds (21, 23 and 25 kn) and three displacements (Δ1, Δ2 and Δ3) were specified for the DoEs, which resulted in 9 design conditions in total. The SOBOL random sequence generator was selected to explore the design space, in which the user can specify a fixed number of design variants, and the SOBOL algorithm creates the distribution of the design variables to satisfactorily cover the entire design space. The required number of design variants was tested in the beginning, showing that 200 design variants per design condition seemed to be a good compromise with respect to accuracy and efficiency of the design exploration. The actual computing time on a desktop computer with four parallel processors took only a few hours, which was acceptable for the early design phase. While the results obtained with the potential theory code v-SHALLO were generally sufficient for the ranking of the explored designs, the values of selected designs were later finetuned by use of the more sophisticated RANSE code FreSCo+ of HSVA, which gave more accurate resistance levels.
4. Surrogate Models
Hydrodynamic performance calculation codes are usually time consuming and require increased memory and storage capabilities. Therefore, it was considered more efficient to replace CFD tools during the optimization process with the so-called surrogate models, providing a sufficiently accurate approximation of the hydrodynamic performance of each design variant at practically zero computing time. A surrogate model was created on the basis of a series of simulations, typically produced by means of a design-of-experiment (DoE) for a predefined set of free variables. This approach seeks to determine a relationship between the input variables and the response of the objective function. Based on the conducted DOE by use of v-SHALLO by HSVA, a series of response surfaces was created in CAESES® for the calculation of calm water resistance at three different speeds (21, 23 and 25 kn) and three displacements (Δ1, Δ2 and Δ3).
Various surrogate models were created and tested using software tools available in CAESES
®. The most accurate methods were MARS (Multivariate Adaptive Regression Splines) [
17] and Neural Networks [
18,
19]. The MARS method presented smaller differences with the v-SHALLO results and proved to be more accurate and faster (approximately 25%) than neural networks. Therefore, the response surfaces used during the optimization studies were developed using the MARS method with a training dataset of 200 samples. In
Figure 5, representative results obtained with the response surfaces are compared with those obtained with v-SHALLO. Almost all designs are between the dashed lines corresponding to 0.5% error. Thus, very good correlation between the calculated and the estimated results was observed in all cases, indicating that the developed surrogate models can safely replace the potential flow calculations during the optimization studies.
5. Global Optimization Studies
As a next step, a global optimization study was performed in order to identify the optimum combination of the selected design variables for the Stavanger demonstrator.
5.1. Optimization Settings
For the optimization studies, the catamaran’s length overall and beam overall were herein assumed to remain fixed at 31.0 and 9.0 m, respectively, by yard’s specification. The selected design variables are listed in
Table 1.
The range of variation of the design variables was as follows: length at waterline, from 29.0 to 30.2 m; halfbeam of demihull, from 1.0 to 1.3 m; initial draught, from 1.2 to 1.6 m; and transom width at chine, from 0.8 to 0.85 (nondimensional). The optimization study was carried out by employing the NSGAII algorithm [
20], already integrated in the CAESES
® environment. NSGAII has already been successfully applied by NTUA in various other similar studies during the last ten years (e.g., [
5]), and the experience gained from these studies verified its efficiency and suitability for the problem at hand. The population and generation size, mutation and crossover probabilities used during the optimization are presented in
Table 2.
The objective of the present study was to minimize the calm water resistance of the bare hull in a range of displacements and speeds, which mostly represent the operational profile of the Stavanger demonstrator. Therefore, it was decided to evaluate the calm water resistance of each design alternative at 21, 23 and 25 kn and at three displacements Δ1, Δ2 and Δ3 and based on the results, to evaluate a weighted average of the calm water resistance. The resulting weighted objective function used during the optimization studies is presented in the following:
A set of constraints was also applied in order to verify that each feasible design alternative provided sufficient space for the installation of the battery racks in the demihulls and large diameter propellers. The minimum demihull width and height around amidships for the batteries’ installation and the minimum height of transom stern tunnel at its centerline for the propeller installation were specified by the yard and controlled during optimization for compliance. Additionally, the minimum draft at the lightest displacement Δ1 should be greater than the tunnel height, so that the tunnel is fully immersed when the vessel is at rest. In a second design alternative with the battery racks place on deck, the minimum demihull width constraint was removed.
5.2. Global Optimization Settings
A large number of optimization studies were carried out as more knowledge and data for the problem at hand were gradually collected during the course of the project [
21]. In
Figure 6 and
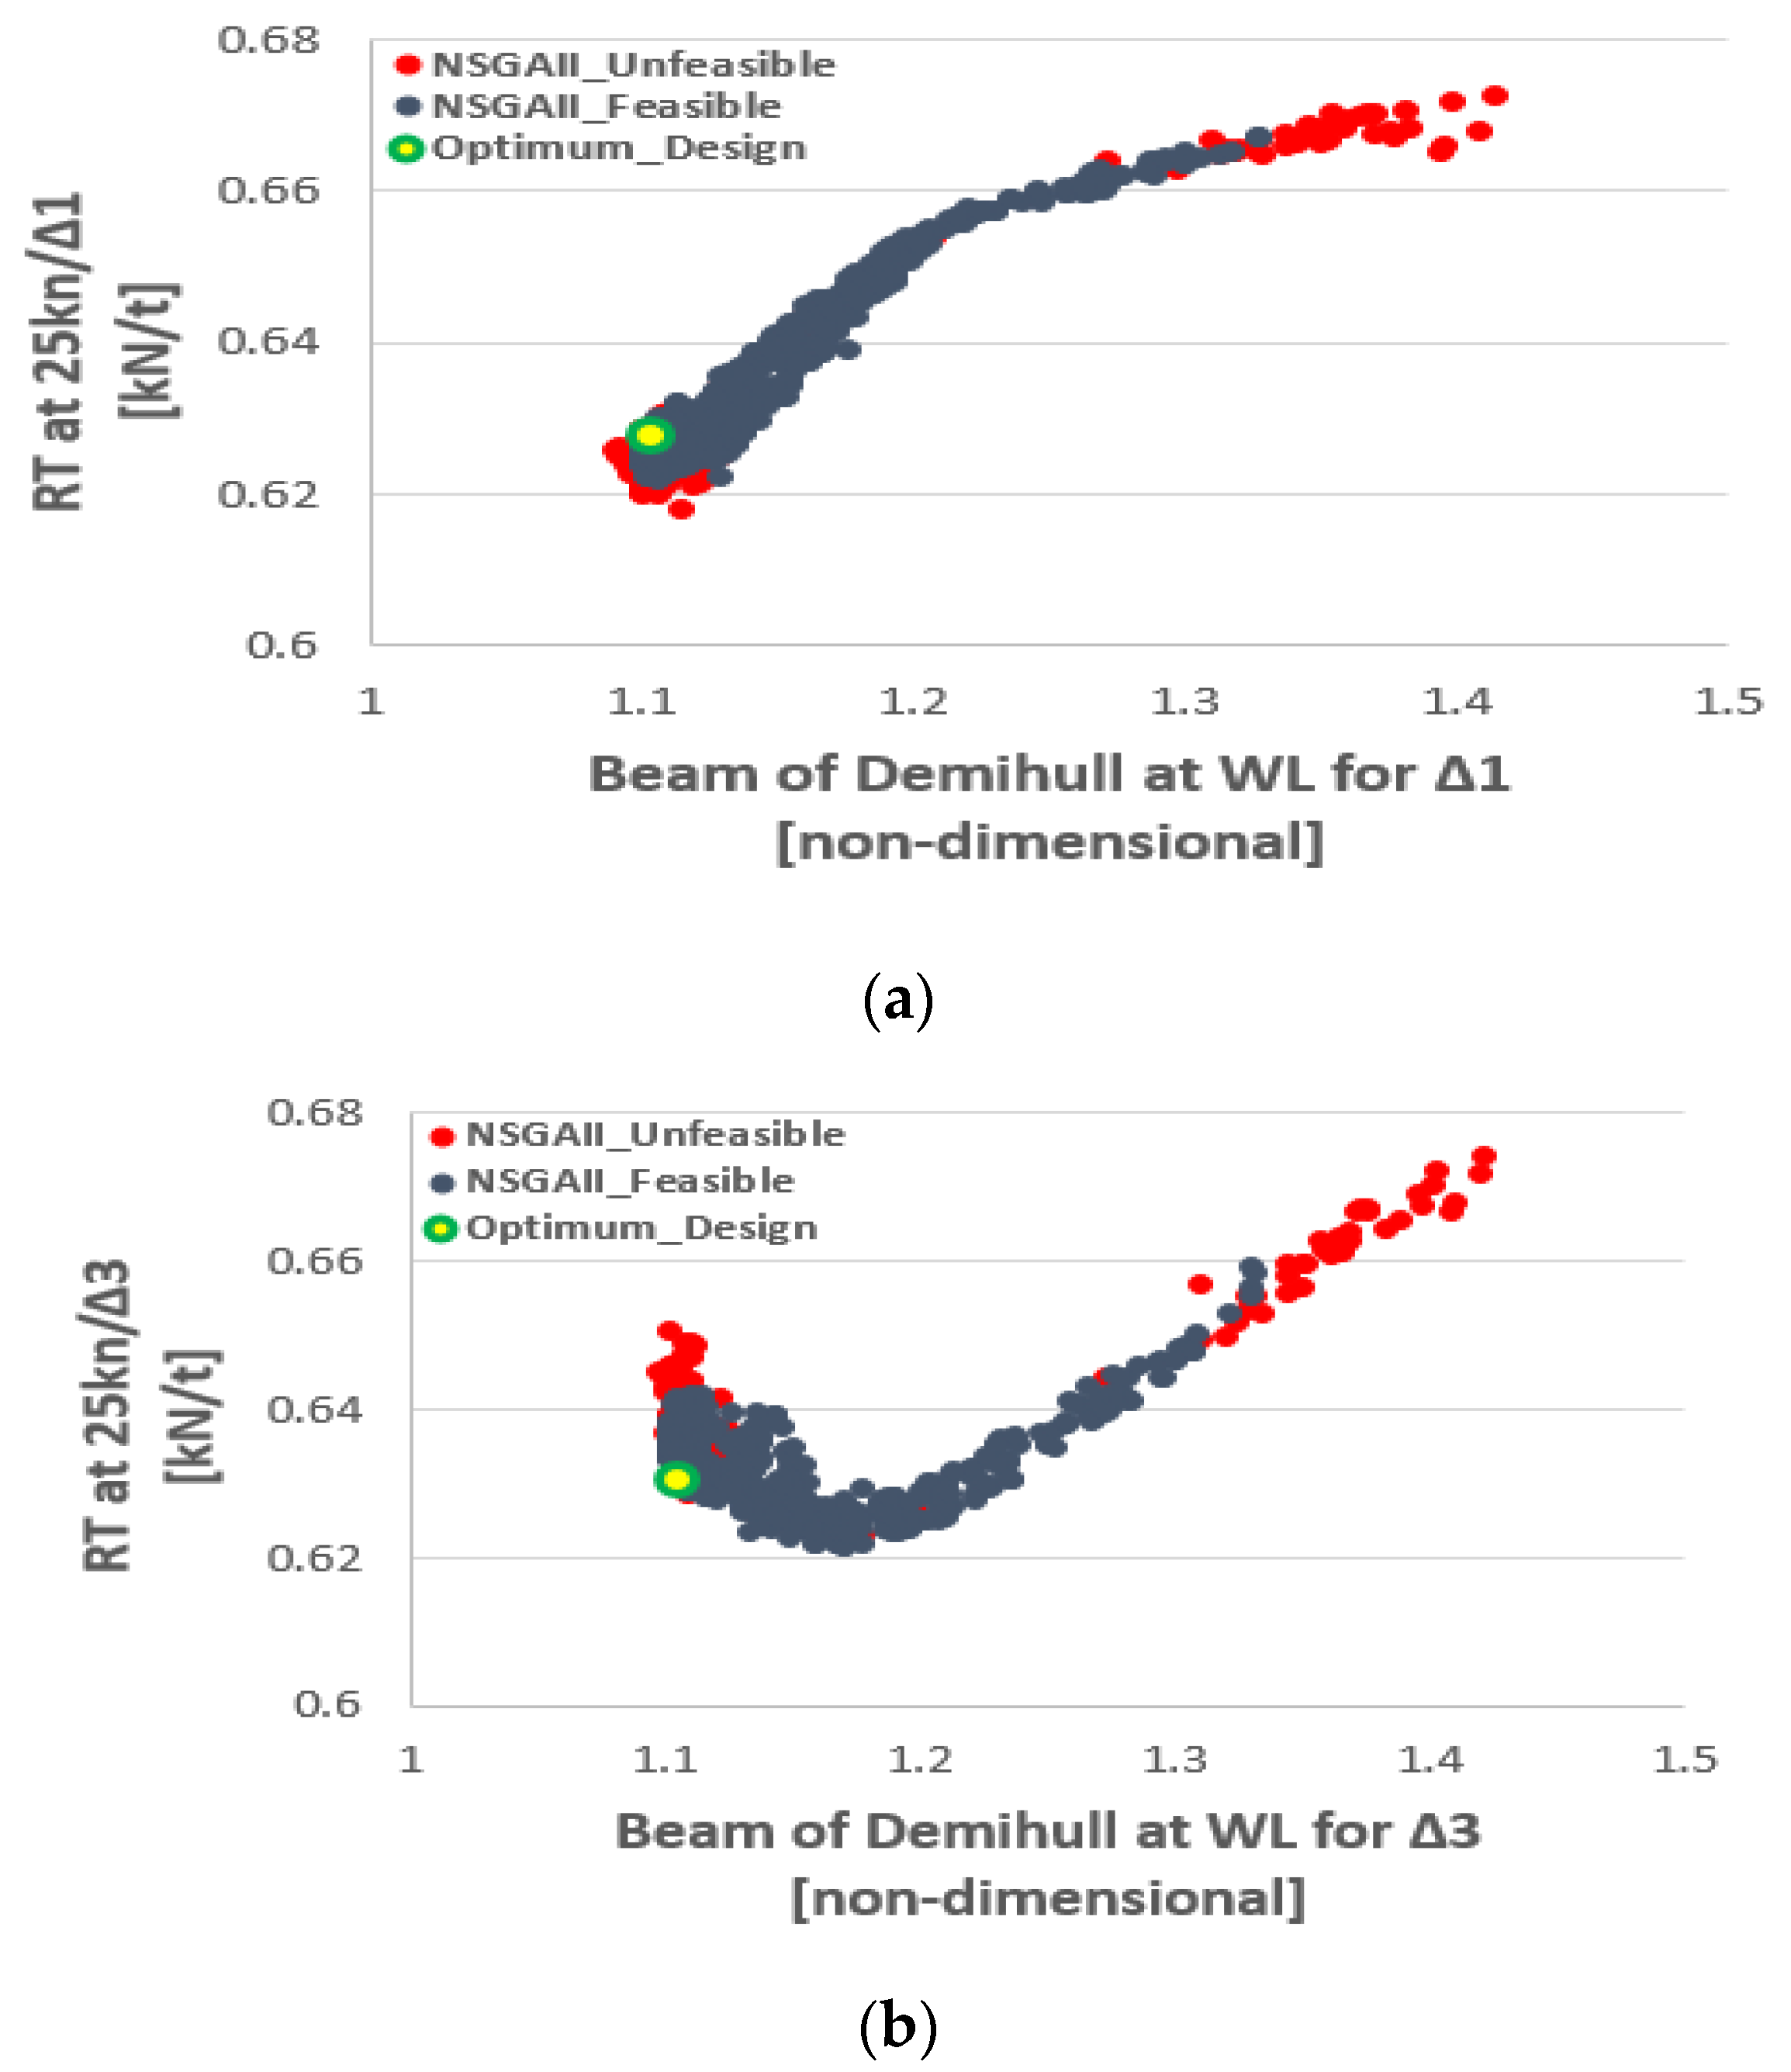
Figure 7, some representative results of the final optimization study are illustrated. Out of 1000 produced designs, 824 were feasible, whereas 176 violated at least one of the constraints. The optimum design is marked in the figures with a green circle. Based on the results, the overall optimum design had a very slender hull form with a length at the waterline (WL) close to the maximum, a beam close to the minimum and increased draught.
This section may be divided by subheadings. It should provide a concise and precise description of the experimental results, their interpretation as well as the experimental conclusions that can be drawn.
In addition, as can be observed from the figures, for the lightest displacement Δ1, hull forms with the smaller beam at WL were those with a lower calm water resistance. This is also true for the intermediate displacement Δ2 at 21 and 23 kn. At 25 kn however, hull forms with an approximately 10% larger beam at WL exhibited a lower calm water resistance. At the same speed and the highest displacement Δ3, this tendency became more pronounced. The designs with the best performance at higher displacement and higher speed had an increased beam of demihull, and their calm water resistance at lower displacement and lower speed increased by approximately 2% to 2.5% in comparison with the overall optimum. It should be noted that operational conditions characterized by higher displacement and higher speed were of particular importance because they determined the required power of the selected propulsion unit and the capacity of the batteries.
The characteristics of the finally promoted design along with its estimated calm resistance are illustrated in
Table 3. This design was further improved during the local hull form optimization study by use of the RANSE code FreSCO+ and was tank tested by HSVA in December 2019.
It should be noted that both due to safety reasons related to the storage of the batteries and for easier installation, inspection and maintenance of the battery racks, an alternative design option was developed by the shipbuilder (Fjellstrand), in which the battery racks were placed on deck (see
Figure 1). This allowed the removal of constraints on the demihull beam and led to a new hull form that proved significantly better than the originally optimized one, namely by more than 6% at 23 knots and even more than 10% at intermediate speeds, as elaborated in later sections (see later Figure 17).
Finally, it should be pointed out that during the global optimization, both single-objective and multi-objective optimizations were carried out. In the former case, the minimization of the weighted average of the total resistance, as defined earlier, was used as the objective function. In the latter case, nine optimization functions were introduced, each one corresponding to the calm water resistance at one combination of speed and displacement. Both studies resulted in practically identical results; therefore, the results of the single-objective optimization were used and are presented in this paper. This facilitated the quick assessment/visibility of the impact of the selection of alternative weights (for displacement and speed combinations) on the resistance (and powering) by the partners (end-users: yard and operator) and the identification of the overall optimal design alternative for the Stavanger scenario case.
6. Numerical Methods for the Local Optimization Study
The computational method applied to the local optimization of the globally optimized hull form for resistance and propulsion was the RANS method FreSCo+ code of HSVA. Though modeling the propeller in RANS is nowadays possible, the more practical approach is to simulate the propeller effect through a body-force model, as this allows the quick evaluation of a large number of design variants. The body forces were obtained from a Propeller Vortex Lattice Method (QCM), which was coupled iteratively to the RANS method to enable numerical self-propulsion simulations. More details of these methods are explained below.
6.1. RANSE Method
The HSVA in-house code FreSCo
+ is a finite volume fluid flow solver developed in cooperation with the Institute of Fluid Dynamics and Ship Theory (FDS) of the Hamburg University of Technology (TUHH) and the Hamburg Ship Model Basin (HSVA). The FreSCo+ code solves the incompressible, unsteady Navier-Stokes-equations (RANSE). The method is applied to fully unstructured grids using arbitrary polyhedral cells or hanging nodes. Additionally, features such as sliding interface or overlapping grid techniques have been implemented into the code [
14].
Various turbulence-closure models are available with respect to statistical (RANS), such as k-ε (Standard, RNG, Chen), k-ω (Standard, BSL, SST), Menter’s One Equation model and the Spalart-Allmaras turbulence model. In this paper, the k-ω SST was mainly used.
6.2. Propeller Vortex Lattice Method QCM
The HSVA QCM method is similar to the approaches published by [
22,
23,
24]. The chord wise arrangement of corner-points of the vortex–lattice is set up by the “Cosine-Spacing” as originally recommended by [
25]. The results for the loading distribution become identical with the exact solutions of the continuous theory for 2-dimensional thin profiles. Due to this property, the method was named the “Quasi-Continuous Method” (QCM). By using QCM, [
24] calculated open water characteristics of various propellers that were in good agreement with experimental results, and established a method for estimating open-water characteristics of unconventional propellers, e.g., contra-rotating, controllable pitch and tandem propellers. A typical vortex structure in the propeller wake as simulated in QCM is illustrated in
Figure 8.
6.3. Numerical Self-Propulsion Using RANS-QCM Coupling
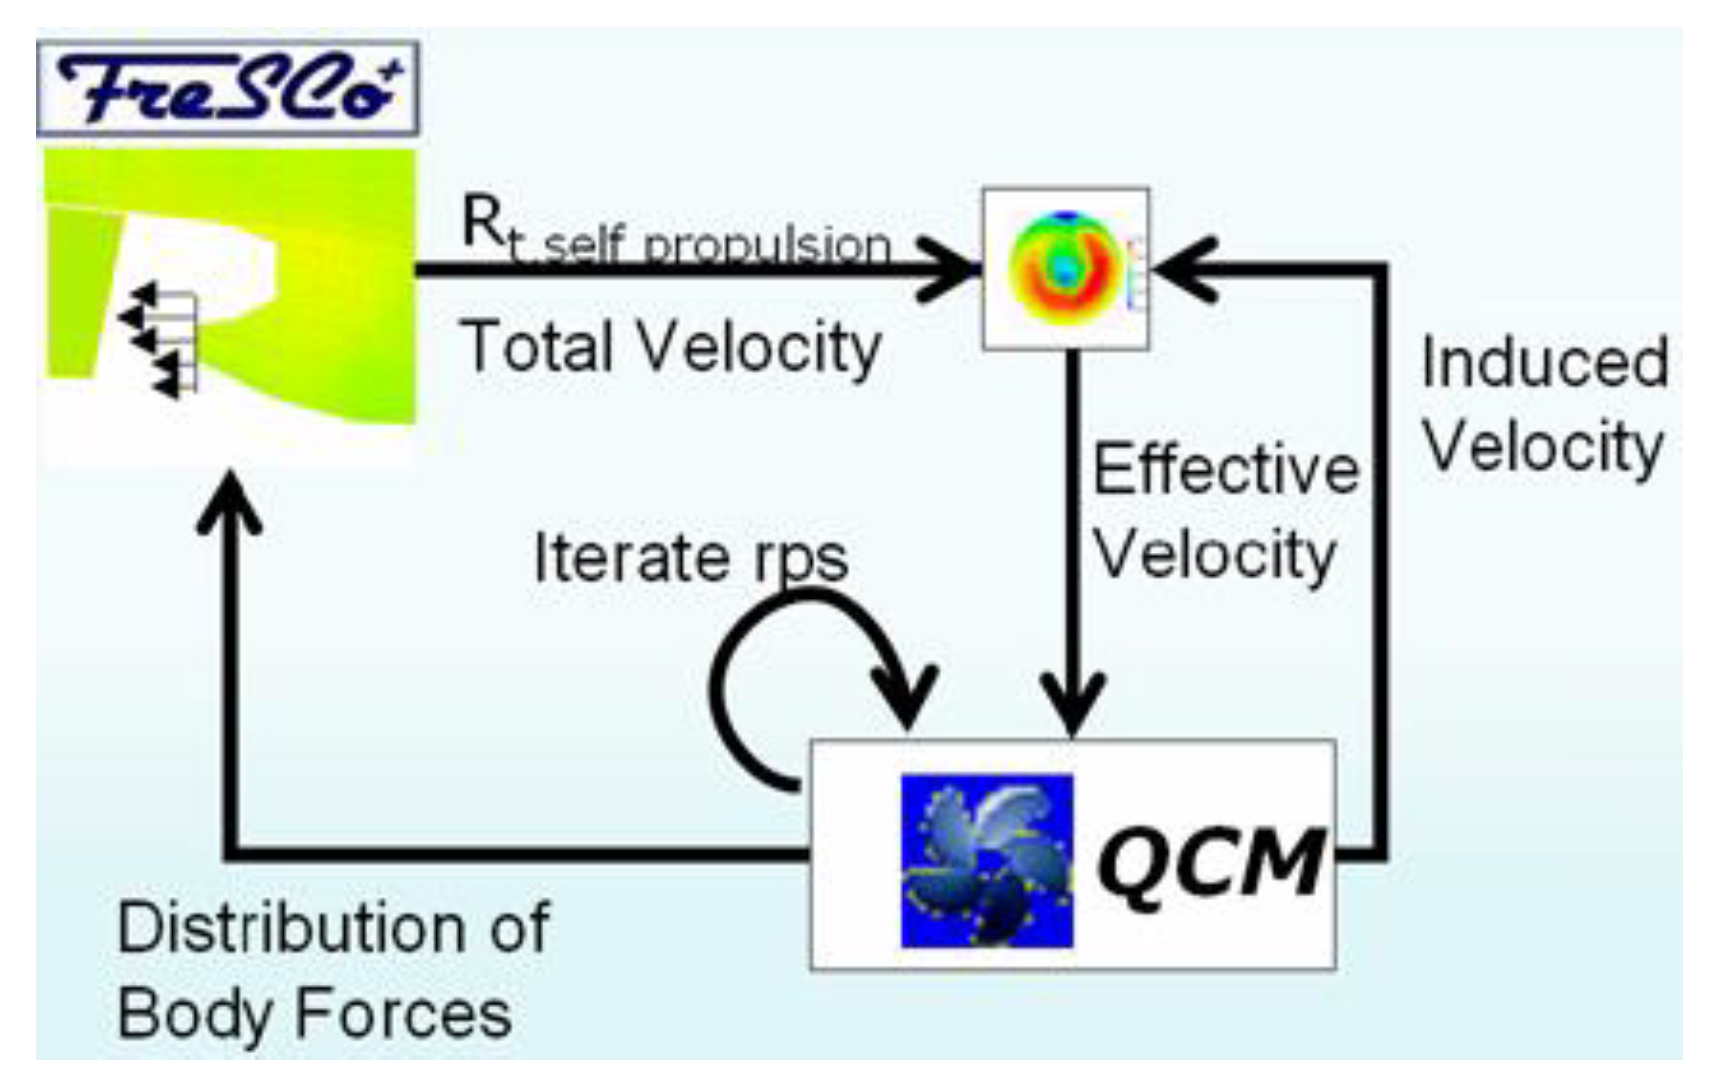
The present local hull form optimization studies aiming at very high propulsive efficiency have been performed using the RANS-QCM coupling approach of HSVA to numerically simulate the self-propulsion test. To this end, the code FreSCo+ is coupled with QCM for propeller analysis in an iterative fashion as sketched in
Figure 9.
At the start of the simulation, a nominal wake distribution is extracted from the converged RANS solution without the propeller effect. This velocity distribution and an estimated turning rate are used as an input for the QCM code to compute the forces on the propeller blades (thrust and torque). The turning rate is adjusted until the propeller thrust required to overcome the ship resistance (in propulsion mode) is obtained. The hydrodynamic forces of the propeller are converted in the form of 3D body forces (source terms) assigned to cells which are representing the propeller disk. More details of this method can be found in [
26].
7. Local Optimization Studies
While the global optimization referred to the determination of the main dimensions and integrated hull form characteristics minimizing the calm water resistance, the local hull form optimization takes into account not only the calm water resistance, but also the propulsive speed-power performance. In this respect, the local optimization study focused on the optimization of the stern tunnel area and the propulsive efficiency. The stern hull form area was mathematically captured by six local form parameters and in addition, four parameters were related to the main propeller characteristics, such as propeller diameter, position and shaft inclination. The ten local optimization variables are listed in
Table 4. The Dakota Optimization Toolkit of Sandia National Laboratories disposed in CAESES
® was utilized for the optimization. This toolkit allows a comprehensive exploration of the multiparametric design space by use of proper sampling methods, such as Latin hypercube sampling, orthogonal arrays and Box-Behnken designs, simultaneously allowing the implementation of the design constraints. Due to the fact that the ship will be actually built, a large number of design constraints related to the fitting of the propeller, its shaft and brackets in the tunnel area need to be considered as well. These constraints are mainly related either to class specification (induced vibrations) or to limitations from the practical and construction point of view. The defined design constraints are given in
Table 5. The benefit of such constraints integrated into the design optimization process is that only the designs fulfilling all the requirements and constraints will be further kept in the optimization process. The design and optimization process as such had two stages. In the first stage, the whole design space was explored (only limited to the available computational resource and available design time) for valid designs, which satisfied all the design requirements/constraints. Due to the very strict design constraints in this design case, only a relatively small number (around 2 percent) of the generated designs proved to be feasible.
Figure 10 shows some of the generated transom stern designs, which fulfill the design constraints as an example. In the second stage, the resulted valid designs were reviewed by experienced designers and propeller manufacturers to make a final check and select the final designs before performing the time-consuming RANS-QCM computations for the resistance and propulsion power prediction.
The most promising designs were then evaluated by use of the HSVA’s RANS-QCM coupled method as previously described. In this procedure, the free surface, free sinkage and trim of the catamaran were considered as well. The numerical mesh applied had around 5.3 million cells in total, including a refinement around the free surface field, the bow thruster tunnel area and the propeller/ship transom stern region, as shown in
Figure 11.
The identified best design with respect to the required delivered horsepower (DHP) was further fine-tuned to minimize the risk of air suction in the propeller tunnel. For the selection of the best hull form, a range of displacements and speeds was evaluated to assess the performance of the hull variants at various off-design conditions.
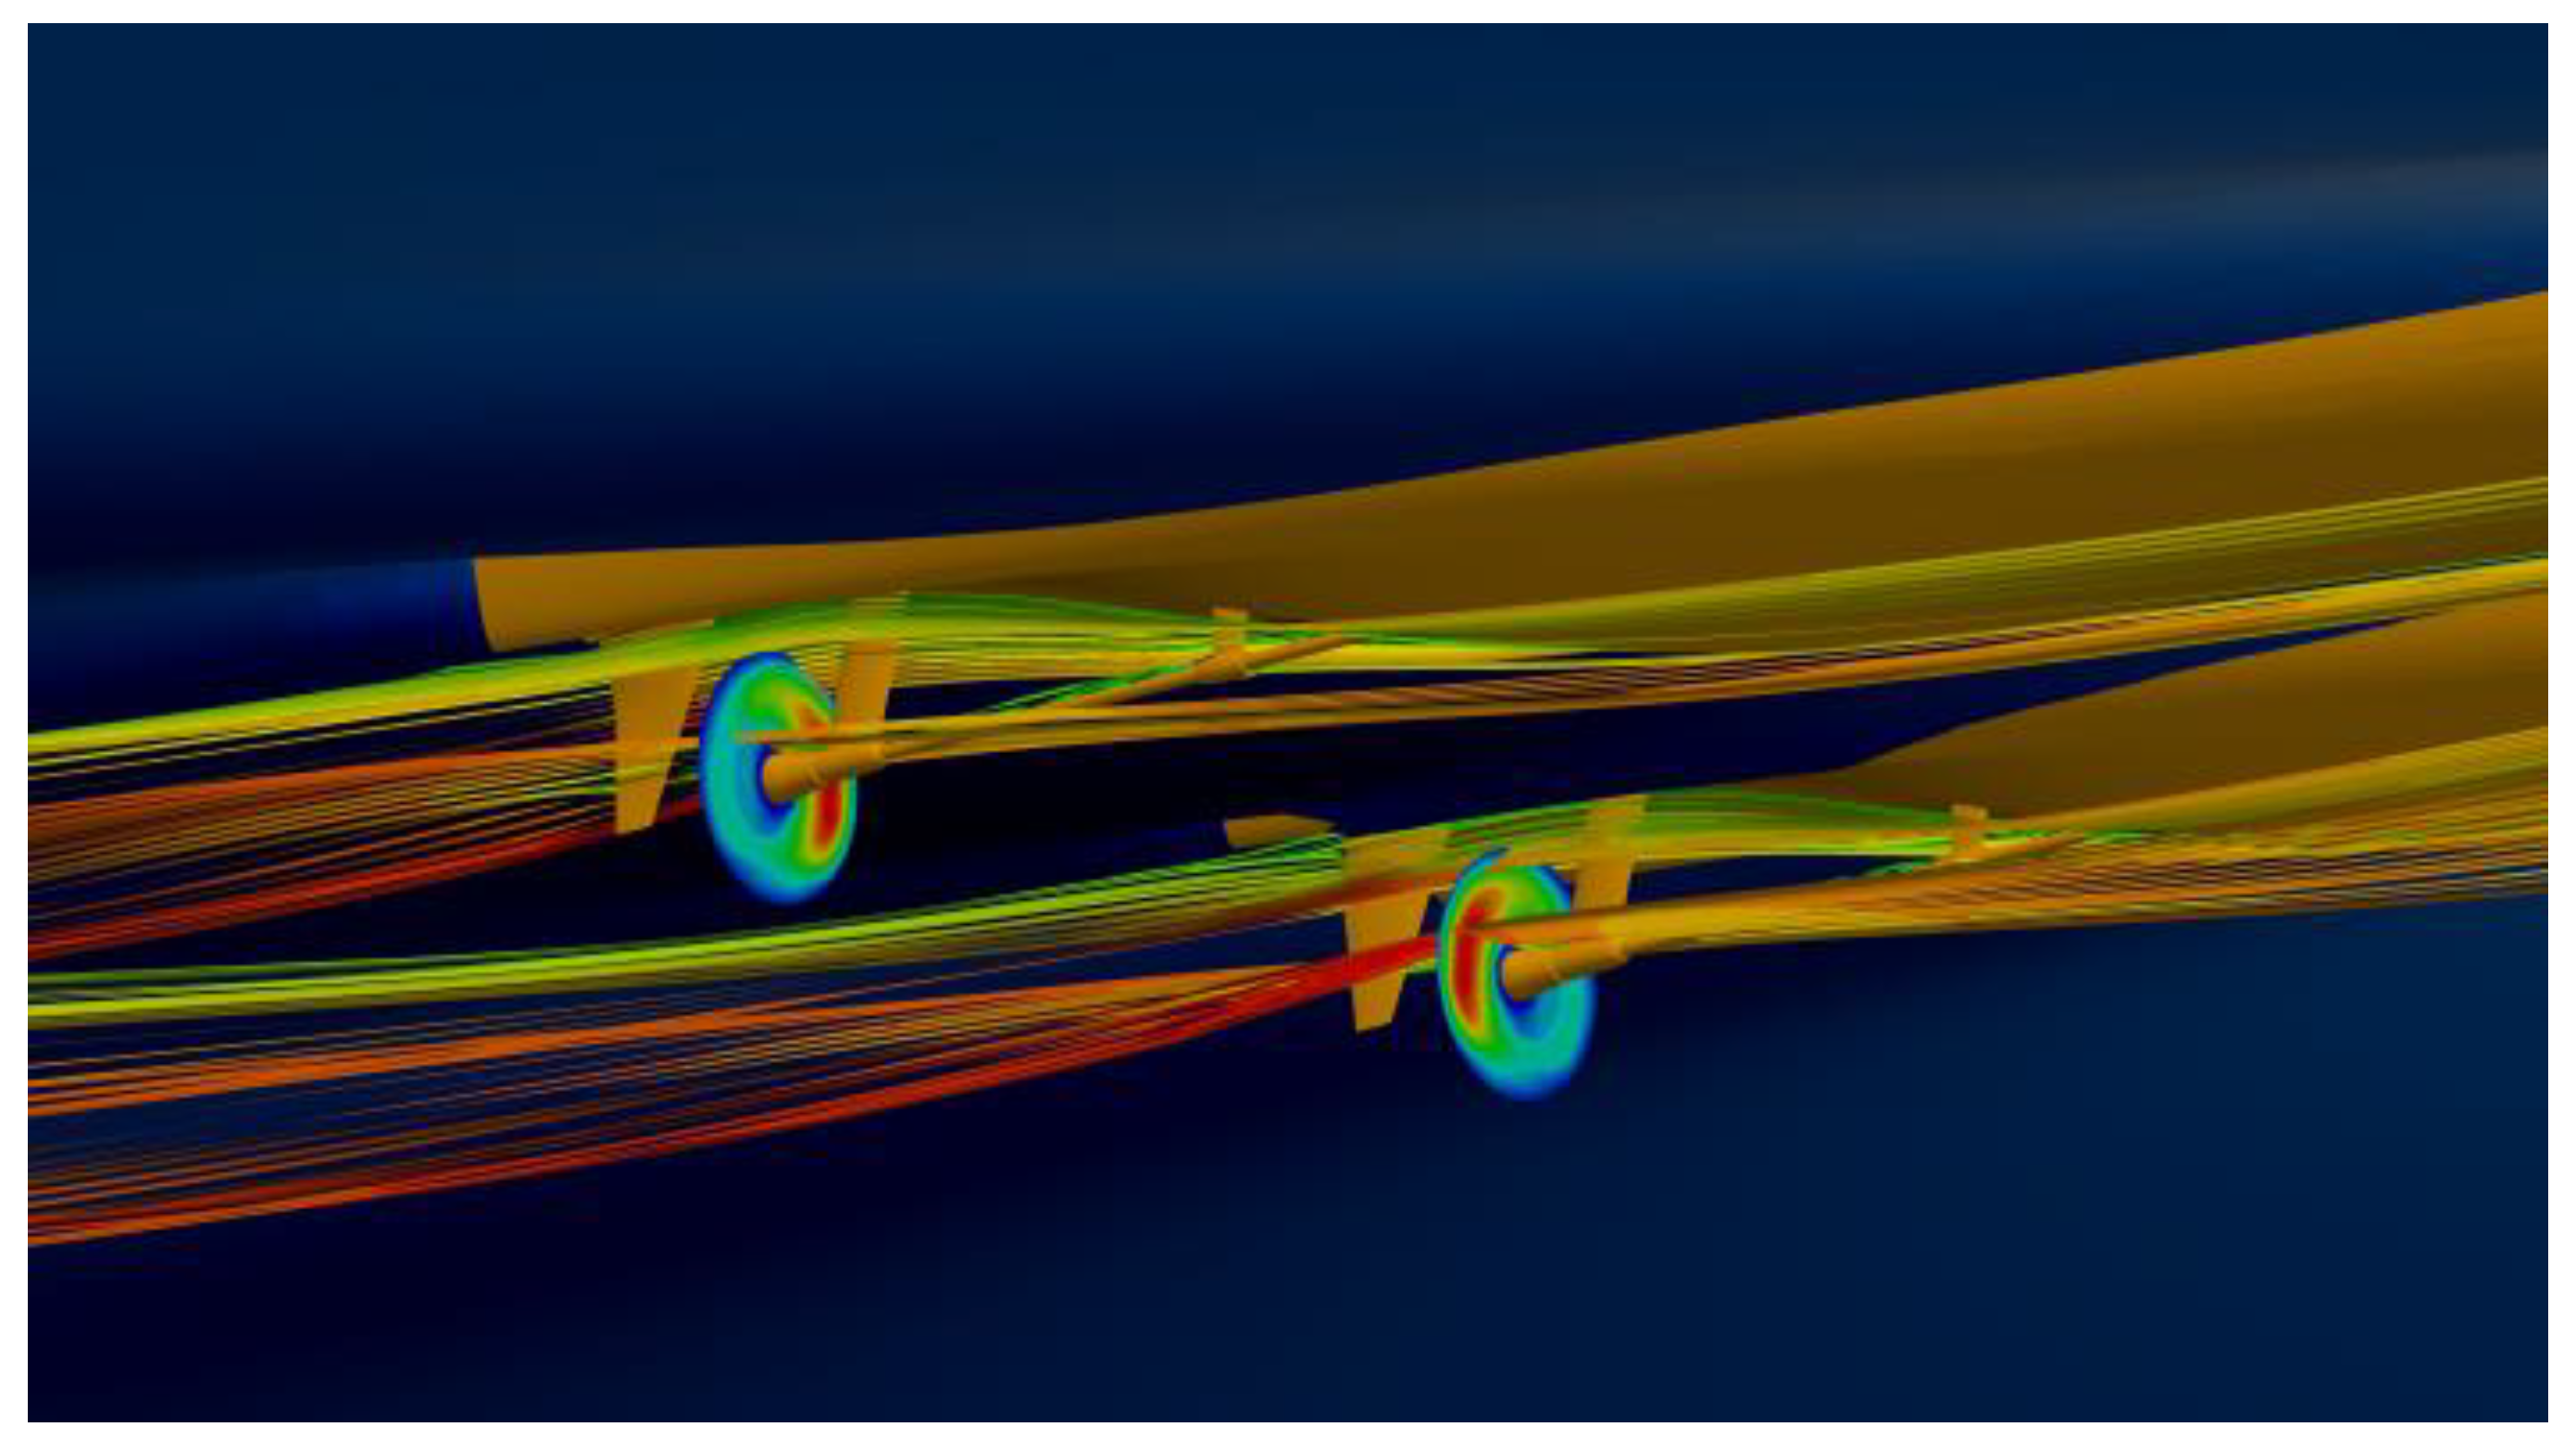
Figure 12 shows the computed Cp distribution. The propeller was simulated via a body force method, where the three-dimensional blade forces coming from the panel code QCM (RANS-BEM coupling) were incorporated, as can be better observed in
Figure 13, together with the streamlines passing through the propeller discs.
8. Experimental Verification
As an essential part of the design process of a highly complex and innovative ship, physical model tests play a crucial role considering the verification of the anticipated full-scale speed-power performance.
8.1. Tested Model
The determination of a suitable model scale ratio is one of the first and most important steps in the process of planning a model test campaign. The principle goal of minimizing scale effects by building a large model needs to be balanced with limiting factors such as basin constraints, carriage speed, estimated loads, measurement equipment and certainly building costs. For the TrAM model, a very good trade-off between these factors resulted in a scale ratio of 1/5.6, namely a 5.34 m long catamaran model. This allowed very precise measurements and minimized scale effects. The two separate demihull models were manufactured from wood and were coupled by high-strength metal beams. Proper alignment and positioning of the demihulls were ensured by special high precise measurement gauges individually designed for this test setup. A 3D wireframe and faired surface view of the numerically optimized hull is shown in
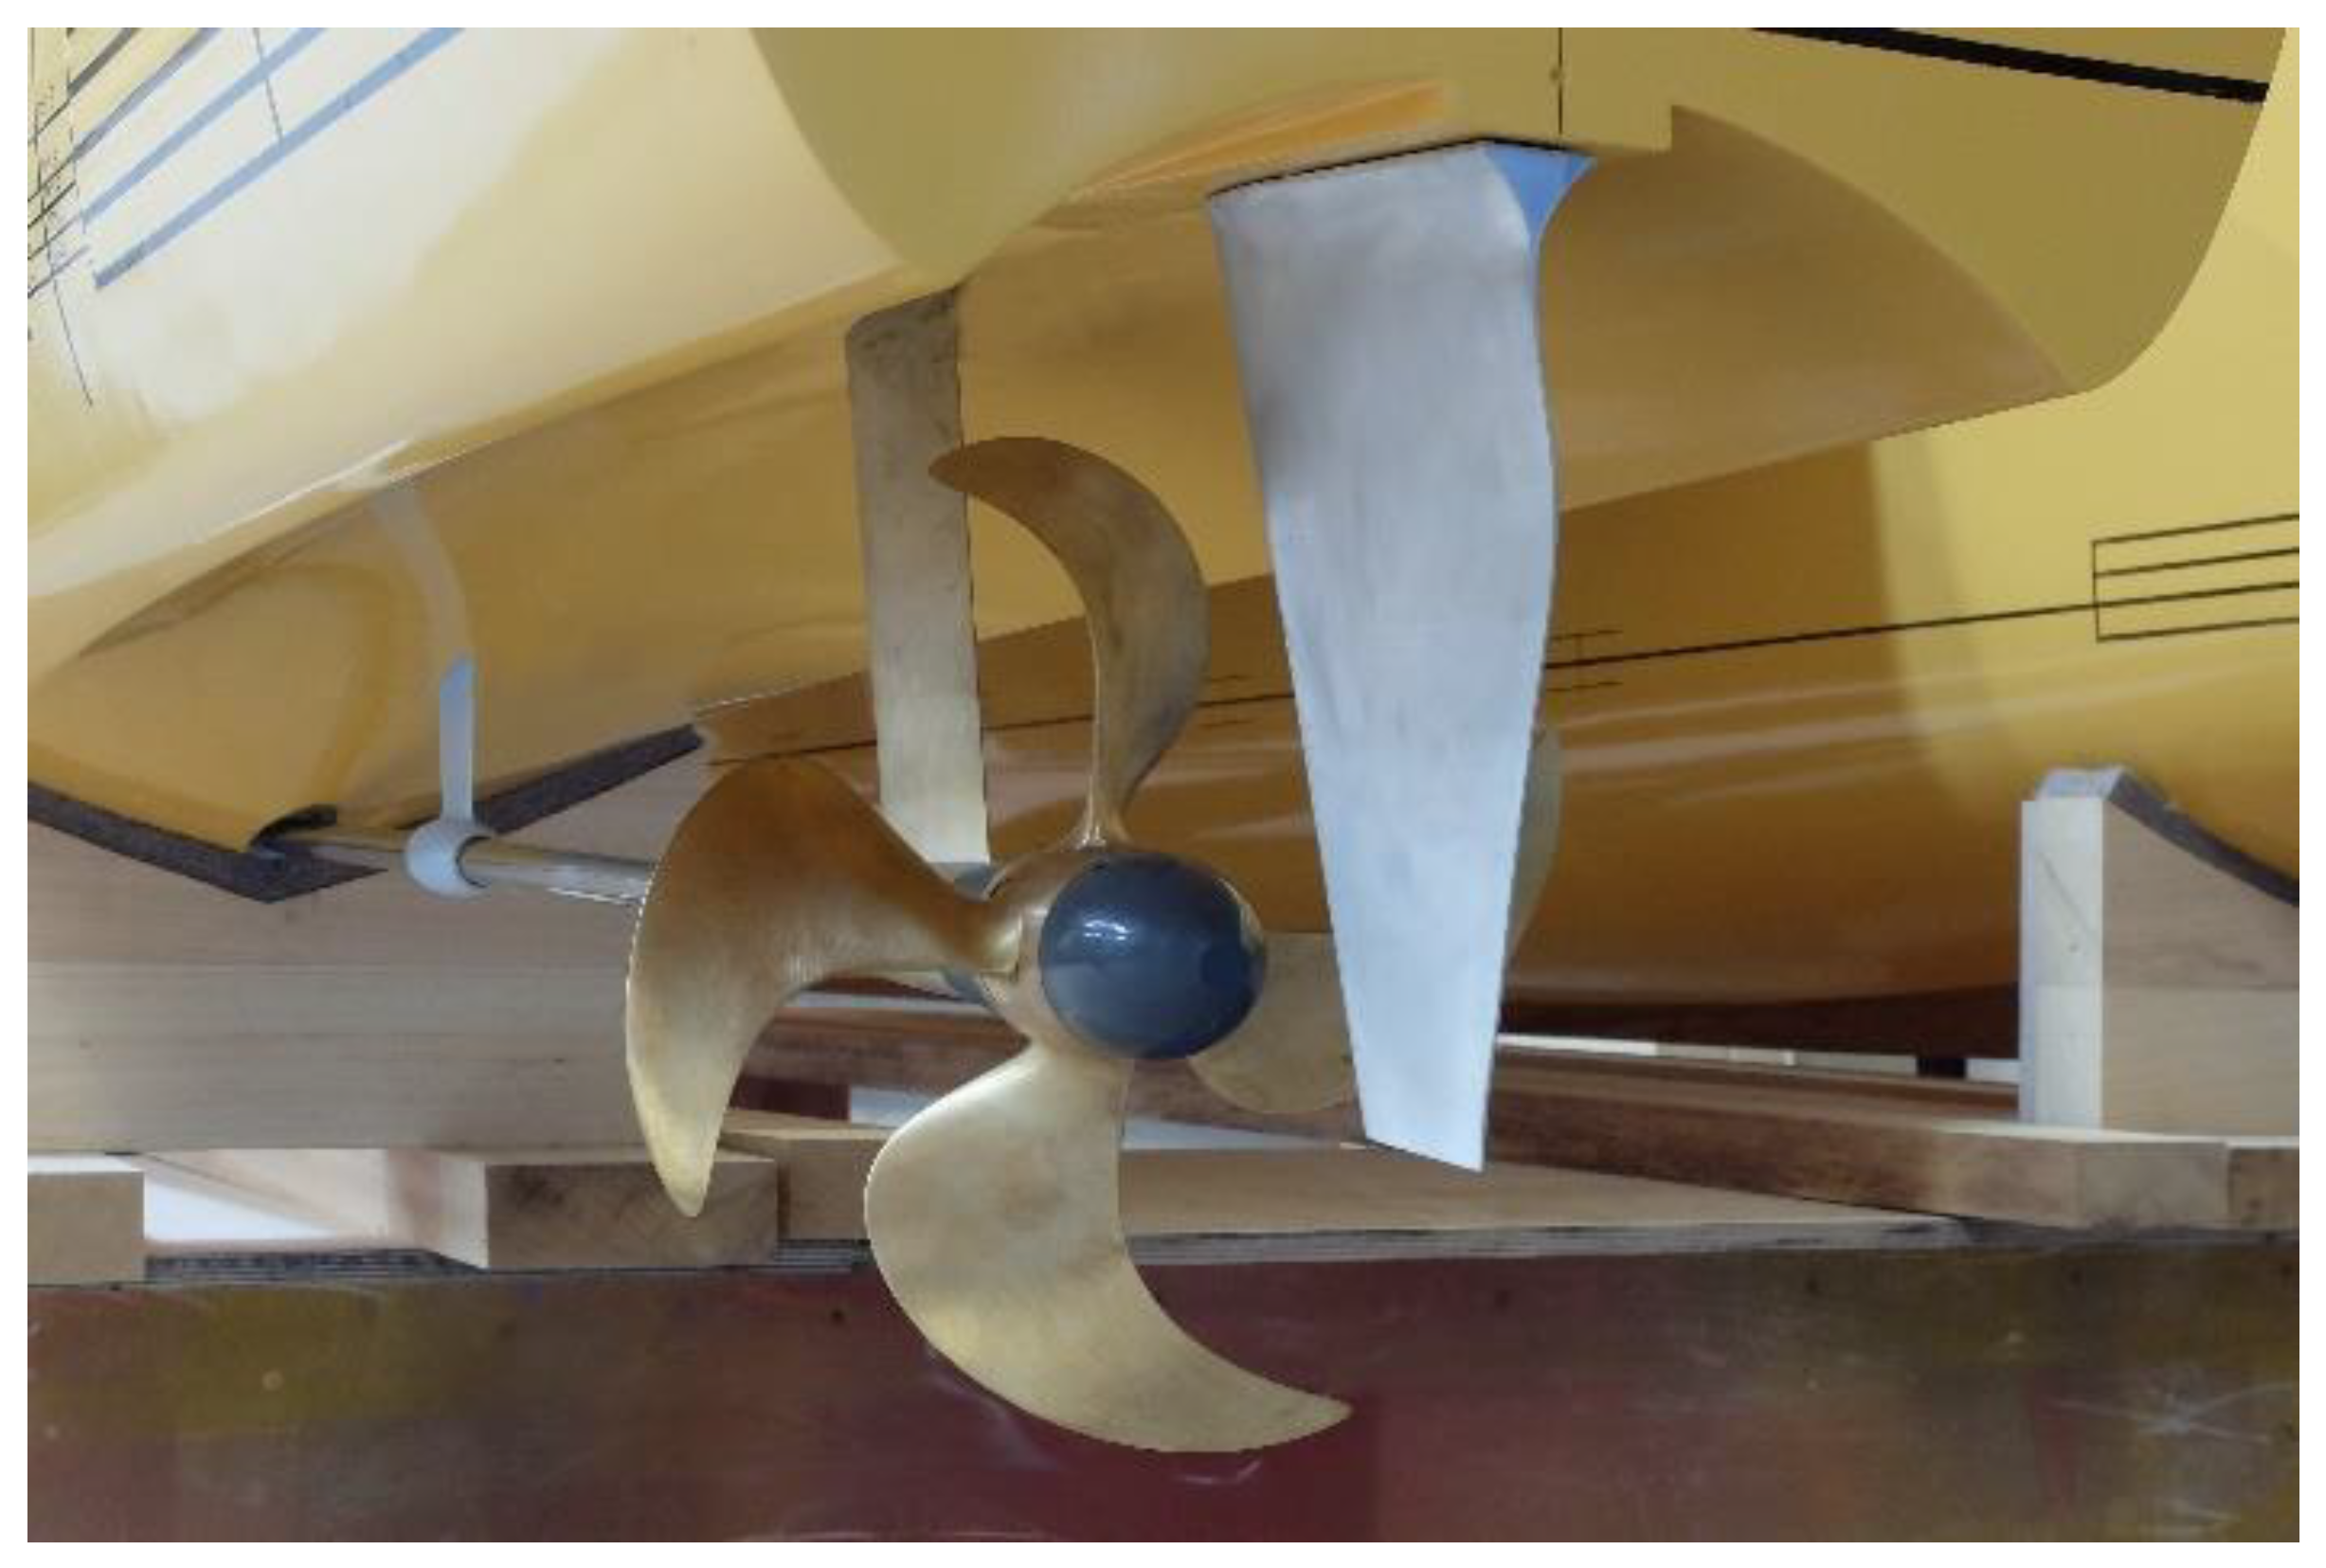
Figure 14, while a close-up of the stern area of the tested model with fitted CP propellers and (twisted) rudders is shown in
Figure 15.
8.2. Test Scope
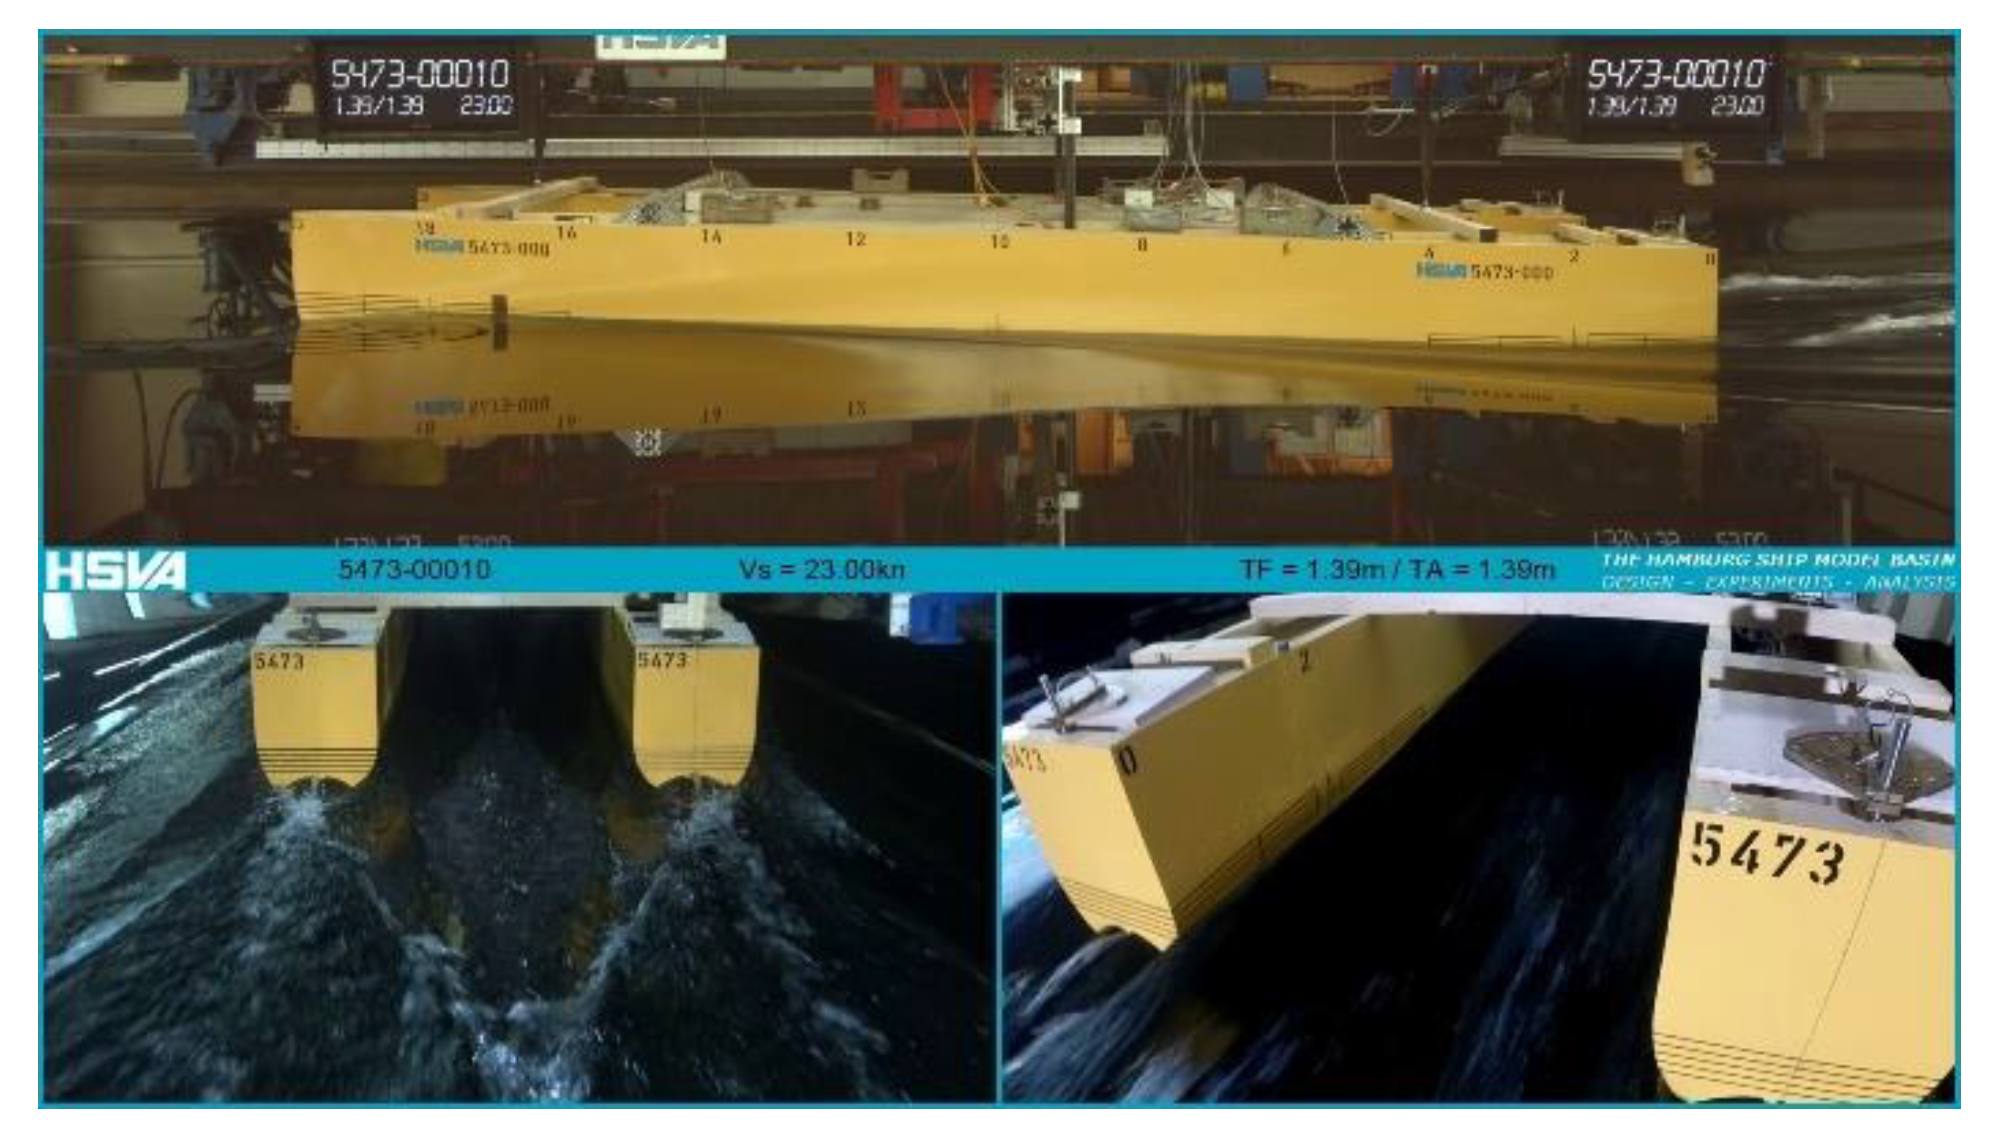
The calm water model tests were carried out in HSVA’s large basin, which is 300 m long, 18 m wide and 6 m deep. The speed of the model ranged from 1.5 to 6.5 m/s which corresponds to a ship speed of 8 to 29 knots (
Figure 16). During the test runs, all relevant forces and movements of the model were recorded, while also including wave profile measurements for the generated wave wash downstream. The test program included both towing resistance and self-propulsion tests for three different displacements—Δ1, Δ2, Δ3—and a range of trims. Besides the variation of the calm water resistance for tested conditions, special attention was paid to the propulsive efficiency of the fitted propulsion plant and the hull–propeller–rudder interaction (wake and thrust deduction fractions). It should be also noted that a first test campaign with the originally optimized hull form (battery racks placed in the demihulls) was conducted in December 2019, and a second campaign repeated the test series for the finally selected hull form in May 2020.
8.3. Test Results
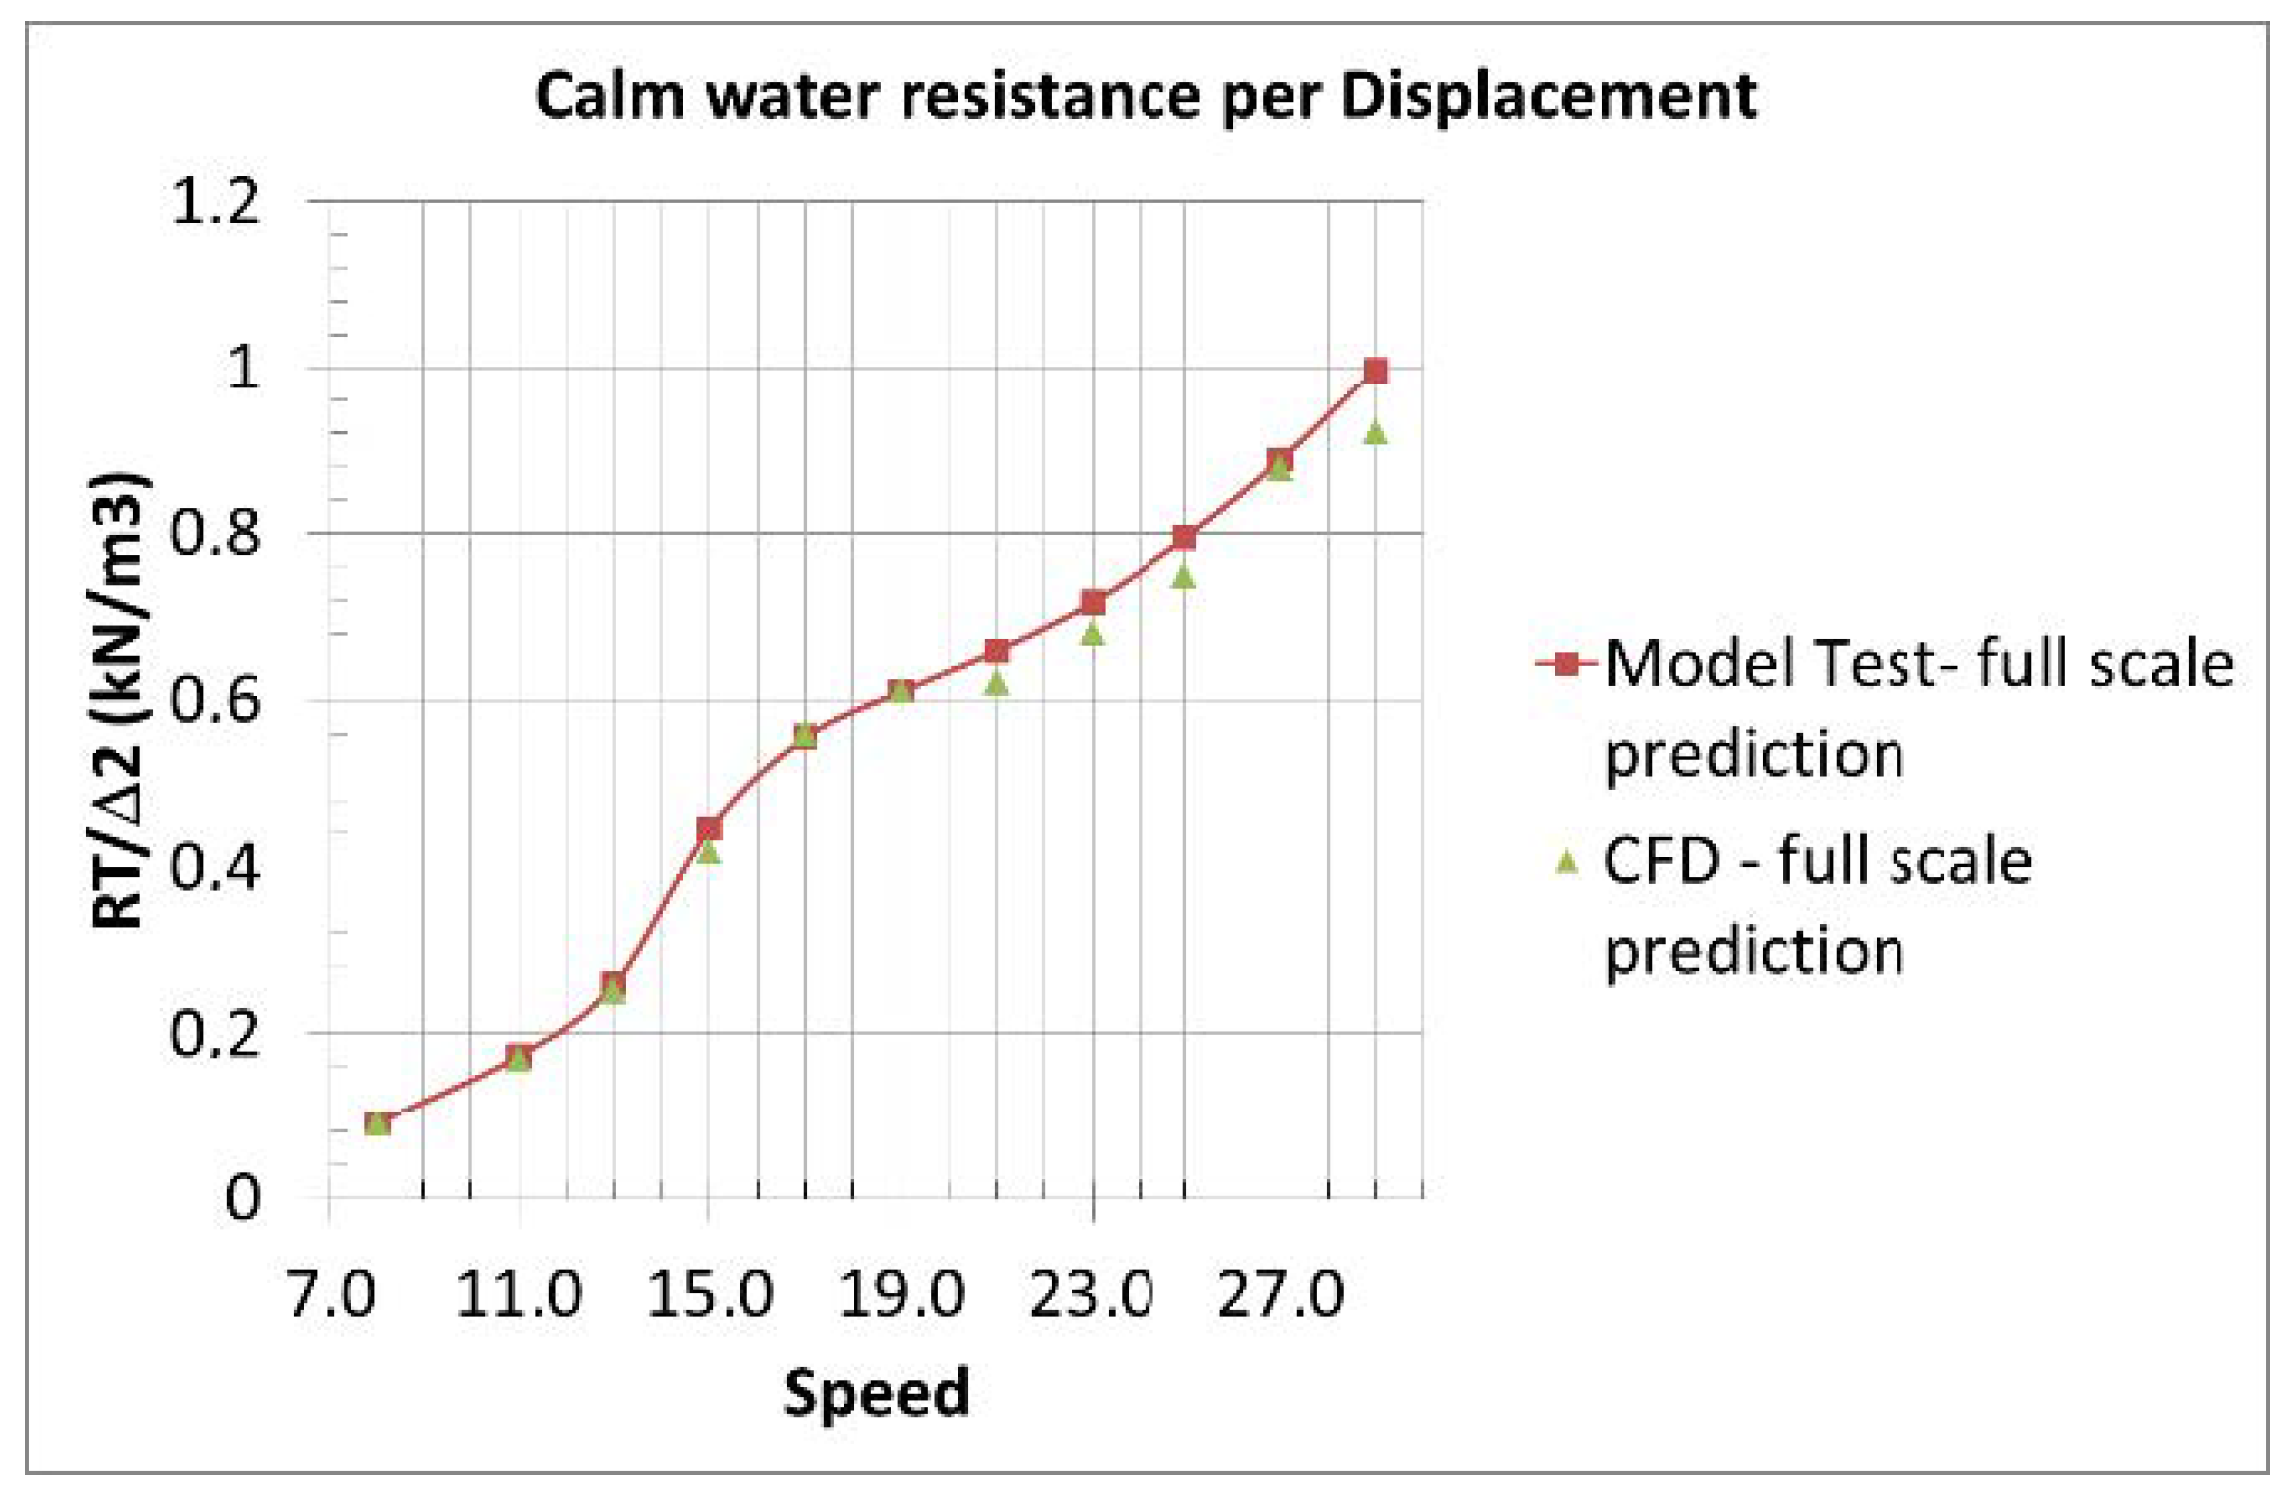
The numerically predicted model and full-scale values obtained by CFD simulations could be very well confirmed by the test campaigns. In the conducted second test series with the revised hull form (May 2020), the resistance and propulsion power could even be reduced significantly for the relevant speed range above 14 knots (see
Figure 17 and
Figure 18). A remarkable result of the model tests was the extraordinarily high propulsive efficiency that could be achieved by the refined local optimization of the transom stern and of the hull–propeller–appendices interaction (see
Table 6). The very low thrust deduction and wake fraction, on the one hand, and the achievement of a hardly disturbed propeller inflow condition, on the other hand (note that ETAR is even larger than 1.00 for speeds over 19.00 knots), resulted in a propulsion efficiency of up to 80% at higher speeds. A systematic variation of the static pretrim of the vessel delivered valuable information for a beneficial arrangement of the ship’s weight distribution in terms of power reduction. The entire test series was live-broadcasted (“live-stream”) and recorded by several cameras showing the model and the flow around it from different perspectives. This allowed a detailed observation of the vessel’s hydrodynamic behavior remotely and even after the tests, as necessary.
9. Summary and Conclusions
A two-stage parametric optimization of the hull form and propulsion plant of twin-hull vessels was developed and applied to the design of a fast catamaran vessel aiming to operate a multistop commuter route in the Stavanger area, the so called “Stavanger demonstrator”. The parametric model of the hull form was developed in CAESES® and offers the possibility to automatically generate smooth hull forms in the specified range of the main particulars of the demihulls along with the possibility to control and modify a series of important hull form details.
A large number of about 1000 alternative hull forms was elaborated and assessed with the potential theory 3D panel code v-SHALLO of HSVA to form the basis for the development of surrogate models (response surfaces) for the estimation of calm water resistance during the first-stage, global optimization studies. Global optimization studies were carried out using the NSGA-II optimization algorithm, and two of the most promising designs were selected for more refined optimization. These hull forms were further optimized using the same parametric model in CAESES® and HSVA’s CFD tool FreSCo+, while focusing on the unique stern-transom area and the propulsive efficiency, which reached a value of a remarkable 78.2% at a design speed of 23 knots (and even 80% at 27 knots).
The resulting hull form was model-tested at HSVA’s towing tank in December 2019 and obtained model test results verified the numerical predictions. A second design alternative was also considered, in which the battery racks were fitted on the deck area, rather than in the demihulls. This design option proved better than the first one, as could be expected, due to the relaxed constraints on the demihull’s minimum width, and will form the basis for the final selection of battery capacity and electric motors power for the desired speed profile of the Stavanger demonstrator.
The obtained results prove the feasibility of the TrAM zero emission, fast catamaran concept and will decisively support decisions in the final design of the Stavanger demonstrator, planned to enter service in the Stavanger area before the end of the TrAM project in the first half of 2022.
Author Contributions
Conceptualization, A.P.; methodology, A.P., G.Z. and Y.X.-K.; software, Y.X.-K. and A.K.; validation, Y.X.-K., A.K. and Johannes Strobel; formal analysis, A.P., G.Z. and Y.X.-K.; investigation, Y.X.-K., A.K. and J.S.; resources, Y.X.-K., A.K. and J.S.; data curation, Y.X.-K., A.K., J.S. and E.T.; writing—original draft preparation, A.P.; writing—review and editing, A.P. and E.T.; visualization, Y.X.-K., A.K. and J.S.; supervision, A.P., G.Z. and E.T.; project administration, Y.X.-K., G.Z. and E.T.; funding acquisition, A.P., G.Z. and E.T. All authors have read and agreed to the published version of the manuscript.
Funding
This research was funded by the European Union’s Horizon 2020 research and innovation program under grant agreement No 769303.
Acknowledgments
The authors acknowledge the support of a several of TrAM project partners in the presented research, particularly of Servogear (propeller designer) and Kolumbus (ship operator).
Conflicts of Interest
The authors declare no conflict of interest.
References
- TrAM—Transport: Advanced and Modular, H2020 EU Research Project, Grant Agreement No 769303, H2020. Available online: https://tramproject.eu/ (accessed on 25 August 2020).
- Papanikolaou, A.; Androulakakis, M. Hydrodynamic Optimization of High-Speed SWATH. In Proceedings of the 1st International Conference on Fast Sea Transportation (FAST’91), Trondheim, Norway, 17–21 June 1991. [Google Scholar]
- Papanikolaou, A.; Kaklis, Ρ.; Koskinas, C.; Spanos, D. Hydrodynamic Optimization of Fast Displacement Catamarans. In Proceedings of the 2lst International Symposium on Naval Hydrodynamics, ONR’96, Trondheim, Norway, 1 June 1996. [Google Scholar]
- Zaraphonitis, G.; Papanikolaou, A.; Mourkoyiannis, D. Hull Form Optimization of High-Speed Vessels with Respect to wash and Powering. In Proceedings of the 8th International Marine Design Conference (IMDC), Athens, Greece, 5–8 May 2003. [Google Scholar]
- Skoupas, S.; Zaraphonitis, G.; Papanikolaou, A. Parametric Design and Optimisation of High-Speed Ro-Ro Passenger Ships. Ocean Eng. 2019, 189, 106346. [Google Scholar] [CrossRef]
- Bertram, V.; Krebber, B.; Hochkirch, K.; Frers, G.; Flynn, M. Advanced simulation-based design for an advanced power trimaran. In Proceedings of the 11th Symposium on High Speed Marine Vehicles (HSMV), Naples, Italy, 25–26 October 2017. [Google Scholar]
- Molland, A.; Wellicome, J.; Couser, P. Resistance Experiments on a Systematic Series of High-Speed Displacement Catamaran Forms: Variation of Length-Displacement Ratio and Breadth-Draught Ratio; Ship Science Report No. 71; Department of Ship Science, University of Southampton: Southampton, UK, 1994. [Google Scholar]
- Insel, M. An Investigation into Resistance Components of High-Speed Displacement Catamarans. Ph.D. Thesis, Department of Ship Science, University of Southampton, Southampton, UK, 1990. [Google Scholar]
- Brizzolara, S. Parametric Optimization of SWATH Hull Forms by a Viscous-Inviscid Free Surface Method Driven by a Differential Evolution Algorithms. In Proceedings of the 25th Symposium on Naval Hydrodynamics, St. John’s, NL, Canada, 8–13 August 2004. [Google Scholar]
- CAESES® Software Platform. Friendship Systems. Available online: https://www.caeses.com/ (accessed on 25 August 2020).
- Abt, C.; Harries, S.; Wunderlich, S.; Zeitz, B. Flexible Tool Integration for Simulation-driven Design using XML, Generic and COM Interfaces. In Proceedings of the International Conference on Computer Applications and Information Technology in the Maritime Industries (COMPIT 2009), Budapest, Hungary, 10–12 May 2009. [Google Scholar]
- Papanikolaou, A. Holistic Ship Design Optimization. J. Comput. Aided Des. 2010, 42, 1028–1044. [Google Scholar] [CrossRef]
- Jensen, G.H.; Mi, Z.; Söding, X. Rankine source methods for numerical solutions of the steady wave resistance problem. In Proceedings of the 16th Symposium on Naval Hydrodynamics, Berkeley, CA, USA, 13–16 July 1986. [Google Scholar]
- Hafermann, D. Proceedings of the New RANSE Code FreSCo for Ship Application, Jahrbuch der Schiffbautechnischen Gesellschaft (STG), Hamburg, Germany, 9 October 2007; Volume 101.
- Gatchell, S.; Hafermann, D.; Jensen, G.; Marzi, J.; Vogt, M. Wave resistance computations—A comparison of different approaches. In Proceedings of the 23rd Symposium Naval Hydrodynamics (ONR), Val de Reuil, France, 17–22 September 2000. [Google Scholar]
- HOLISHIP: Holistic Optimisation of Ship Design and Operation for Life Cycle. Project Funded by the European Commission, H2020-DG Research, Grant Agreement 689074. Available online: http://www.holiship.eu (accessed on 25 August 2020).
- Friedman, J.H. Multivariate Adaptive Regression Splines. Ann. Stat. 1991, 19, 1–141. [Google Scholar] [CrossRef]
- Hagan, M.T.; Demuth, H.B.; Beale, M.H.; De Jesus, O. Neural Network Design, 2nd ed. 2014. Available online: https://www.google.com.hk/url?sa=t&rct=j&q=&esrc=s&source=web&cd=&ved=2ahUKEwjhxdru7rfrAhUXH3AKHTmQByoQFjABegQIAxAB&url=https%3A%2F%2Fhagan.okstate.edu%2FNNDesign.pdf&usg=AOvVaw0Bfkk6GUwTvySiX6_rUNJ0 (accessed on 25 August 2020).
- McCulloch, W.; Pitts, W. A logical calculus of the ideas immanent in nervous activity. Bull. Math. Biophys. 1943, 5, 115–133. [Google Scholar] [CrossRef]
- Srinivas, N.; Deb, K. Multiobjective function optimization using nondominated sorting genetic algorithms. Evol. Comput. J. 1994, 2, 221–248. [Google Scholar] [CrossRef]
- Kanellopoulou, A.; Xing-Kaeding, Y.; Papanikolaou, A.; Zaraphonitis, G. Parametric Design and Hydrodynamic Optimisation of a battery-driven fast catamaran vessel. In Proceedings of the RINA Conference on Sustainable and Safe Passenger Ships, Athens, Greece, 4 March 2020. [Google Scholar]
- Kerwin, J.E.; Lee, C.S. Prediction of Steady and Unsteady Marine Propeller Performance by Numerical Lifting-Surface Theory. SNAME Trans. 1978, 86, 1–30. [Google Scholar]
- Greeley, D.S.; Kerwin, J.E. Numerical Methods for Propeller Design and Analysis in Steady Flows. SNAME Trans. 1982, 90, 415–453. [Google Scholar]
- Nakamura, N. Estimation of Propeller Open-Water Characteristics Based on Quasi-Continuous Method. J. Soc. Nav. Archit. Jpn. 1985, 157, 95–107. [Google Scholar] [CrossRef]
- Lan, C.E. A Quasi-Vertex-Lattice Method in thin Wing Theory (E). J. Aircr. 1974, 11, 518–527. [Google Scholar] [CrossRef]
- Xing-Kaeding, Y.; Gatchell, S.; Streckwall, H. Towards Practical Design Optimization of Pre-Swirl Device and its Life Cycle Assessment. In Proceedings of the Fourth International Symposium on Marine Propulsors, SMP’15, Austin, TX, USA, 31 May–4 June 2015. [Google Scholar]
Figure 1.
Preliminary general arrangement of the Stavanger Demonstrator. (a) side profile (b) main deck plan.
Figure 1.
Preliminary general arrangement of the Stavanger Demonstrator. (a) side profile (b) main deck plan.
Figure 2.
Phases of development of the catamaran’s demihull form by CAESES—(a) definition grid, (b) resulting meta- and lofted surfaces and (c) final demihull after Lackenby transformation (c).
Figure 2.
Phases of development of the catamaran’s demihull form by CAESES—(a) definition grid, (b) resulting meta- and lofted surfaces and (c) final demihull after Lackenby transformation (c).
Figure 3.
Discretized demihull of the Stavanger demonstrator.
Figure 3.
Discretized demihull of the Stavanger demonstrator.
Figure 4.
Wave Pattern of the Stavanger demonstrator at 23 kts.
Figure 4.
Wave Pattern of the Stavanger demonstrator at 23 kts.
Figure 5.
Comparison of calm water resistance per ton of displacement obtained with the response surfaces and v-SHALLO for (a) speed 21 kn at displacement Δ2 and (b) speed 23 kn at displacement Δ3.
Figure 5.
Comparison of calm water resistance per ton of displacement obtained with the response surfaces and v-SHALLO for (a) speed 21 kn at displacement Δ2 and (b) speed 23 kn at displacement Δ3.
Figure 6.
Calm water resistance per ton of displacement against nondimensional beam at WL at 21 kn for (a) Δ1 and (b) Δ3.
Figure 6.
Calm water resistance per ton of displacement against nondimensional beam at WL at 21 kn for (a) Δ1 and (b) Δ3.
Figure 7.
Calm water resistance per ton of displacement against nondimensional beam at WL at 25 kn for (a) Δ1 and (b) Δ3.
Figure 7.
Calm water resistance per ton of displacement against nondimensional beam at WL at 25 kn for (a) Δ1 and (b) Δ3.
Figure 8.
Vortex structure in the propeller wake in QCM for a typical propeller in a homogeneous inflow.
Figure 8.
Vortex structure in the propeller wake in QCM for a typical propeller in a homogeneous inflow.
Figure 9.
Numerical self-propulsion test scheme.
Figure 9.
Numerical self-propulsion test scheme.
Figure 10.
Transom stern design alternatives generated by local optimization.
Figure 10.
Transom stern design alternatives generated by local optimization.
Figure 11.
Numerical mesh around the stern tunnel area for the local optimization of the Stavanger demonstrator.
Figure 11.
Numerical mesh around the stern tunnel area for the local optimization of the Stavanger demonstrator.
Figure 12.
Cp distribution on the demihulls at 23 knots.
Figure 12.
Cp distribution on the demihulls at 23 knots.
Figure 13.
Streamlines through propeller discs and propeller body force distribution at 23 knots.
Figure 13.
Streamlines through propeller discs and propeller body force distribution at 23 knots.
Figure 14.
3D wireframe and faired surface view of the numerically optimized Stavanger hull form.
Figure 14.
3D wireframe and faired surface view of the numerically optimized Stavanger hull form.
Figure 15.
Close-up of the stern area of the tested Stavanger model, with fitted propellers, shafts, brackets and rudders.
Figure 15.
Close-up of the stern area of the tested Stavanger model, with fitted propellers, shafts, brackets and rudders.
Figure 16.
Self-propulsion model of the Stavanger demonstrator at 23 knots full scale speed.
Figure 16.
Self-propulsion model of the Stavanger demonstrator at 23 knots full scale speed.
Figure 17.
Prediction of the rated full-scale calm water resistance for the Stavanger demonstrator on the basis of model experiments and CFD calculations by Hamburgische Schiffbau Versuchsanstalt (HSVA) (revised hull form, battery racks on deck).
Figure 17.
Prediction of the rated full-scale calm water resistance for the Stavanger demonstrator on the basis of model experiments and CFD calculations by Hamburgische Schiffbau Versuchsanstalt (HSVA) (revised hull form, battery racks on deck).
Figure 18.
Prediction of rated delivered horsepower under trail condition for the Stavanger demonstrator on the basis of model experiments and CFD calculations by HSVA (originally optimized and revised hull form).
Figure 18.
Prediction of rated delivered horsepower under trail condition for the Stavanger demonstrator on the basis of model experiments and CFD calculations by HSVA (originally optimized and revised hull form).
Table 1.
Optimization variables.
Table 1.
Optimization variables.
| LWL | Definition waterline length |
| HBDES | Demihull’s definition half beam |
| TINIT | Definition draught |
| CHINEY_ATS0 | Transom width definition |
Table 2.
Optimization Settings.
Table 2.
Optimization Settings.
| Genetic Algorithm | NSGA-II |
|---|
| Generations | 10 |
| Population size | 100 |
| Mutation probability | 0.01 |
| Crossover probability | 0.9 |
Table 3.
Obtained results for the selected design (battery racks in the demihulls).
Table 3.
Obtained results for the selected design (battery racks in the demihulls).
| | at Δ1 | at Δ2 | at Δ3 |
|---|
| LWL | 29.29 | 29.34 | 29.39 |
| Beam at WL | 2.442 | 2.442 | 2.444 |
| Draft | 1.226 | 1.272 | 1.317 |
| Rt_21 kn/Δ | 0.558 | 0.599 | 0.642 |
| Rt_23 kn/Δ | 0.588 | 0.620 | 0.663 |
| Rt_25 kn/Δ | 0.658 | 0.684 | 0.717 |
Table 4.
Local optimization variables.
Table 4.
Local optimization variables.
| CLZ_ATS0 | Z Coordinate of the Centerline at Transom |
| CLZ_ATX1_7m | Z Coordinate of the Centerline at Tunnel |
| CHINEDZ_ATS0 | Z Coordinate of the Chine relative to Centerline at Transom |
| CHINEZ_AST2 | Z Coordinate of the Chine relative to Centerline at Tunnel |
| CHINEY_ATS0 | Transom width definition |
| CHINEY_ATS2 | Tunnel width definition |
| D_Propeller | Propeller Diameter |
X_Propeller
Z_Propeller
Beta_Propeller | X Coordinate of the Propeller Position
Z Coordinate of the Propeller Position
Propeller Inclination angle |
Table 5.
Design constraints in local optimization stage.
Table 5.
Design constraints in local optimization stage.
| Propeller tip clearance | Greater than 20% of diameter of propeller |
Propeller shaft forward end above the hull
Propeller shaft entry above the hull | Greater than certain value to guarantee the propeller shaft, gearbox and El Motor installation
Greater than certain value to guarantee the propeller shaft, gearbox and El Motor installation |
| Propeller shaft inclination | Less than certain degrees value |
| Z_max_prop | Propeller submergence at smallest displacement |
| LWL at largest displacement | Less than certain value |
| Height of shaft bracket lead | Less than certain value to guarantee the propeller shaft installation |
| Height of shaft bracket tail | Less than certain value to guarantee the propeller shaft installation |
| Longitudinal position of El. Motor forward end | Less than certain value to guarantee the space for electromotors installation |
Table 6.
Experimentally measured hull and propulsive efficiencies for the design displacement of the Stavanger demonstrator (full scale)—V: speed in knots; Fn: Froude number; t: thrust deduction fraction; w: Taylor wake fraction; ETAH: hull efficiency; ETAO: open water propeller efficiency; ETAR: relative rotative efficiency; ETAD: propulsive efficiency.
| V | Fn | t | w | ΕΤAH | ΕΤAO | ΕΤAR | ETAD | Notes |
|---|
| kn | - | - | - | - | - | - | - | |
| 8.00 | 0.243 | 0.003 | 0.002 | 0.999 | 0.782 | 0.982 | 0.762 | |
| 10.00 | 0.334 | 0.021 | 0.006 | 0.985 | 0.785 | 0.974 | 0.753 | |
| 13.00 | 0.394 | 0.030 | 0.032 | 1.002 | 0.764 | 0.989 | 0.757 | |
| 15.00 | 0.455 | 0.015 | 0.016 | 1.001 | 0.744 | 0.994 | 0.741 | |
| 17.00 | 0.516 | 0.011 | 0.000 | 0.989 | 0.753 | 1.000 | 0.745 | |
| 19.00 | 0.576 | 0.017 | −0.003 | 0.980 | 0.765 | 1.006 | 0.755 | ETAR> 1.000 |
| 21.00 | 0.637 | 0.025 | 0.007 | 0.982 | 0.773 | 1.013 | 0.770 | ETAR > 1.000 |
| 23.00 | 0.698 | 0.036 | 0.020 | 0.983 | 0.777 | 1.024 | 0.782 | ETAR > 1.000
ETAD > ETAO! |
| 25.00 | 0.758 | 0.045 | 0.029 | 0.983 | 0.779 | 1.031 | 0.789 | ETAR > 1.000
ETAD > ETAO! |
| 27.00 | 0.819 | 0.053 | 0.038 | 0.985 | 0.780 | 1.039 | 0.798 | ETAR > 1.000
ETAD > ETAO! |
© 2020 by the authors. Licensee MDPI, Basel, Switzerland. This article is an open access article distributed under the terms and conditions of the Creative Commons Attribution (CC BY) license (http://creativecommons.org/licenses/by/4.0/).

 ,
, 


