Abstract
Three ocean reanalyzes including Simple Ocean Data Assimilation (SODA), Hybrid Coordinate Ocean Model, and the Navy Coupled Ocean Data Assimilation (HYCOM+NCODA) analysis, and the Ocean General Circulation Model for the Earth Simulator (OFES) are assessed about their ability of depicting the structure of North Equatorial Current (NEC) at 160° E. We found that these products could reflect the structure of NEC relatively well at the whole section, but not at the single point through comparing their results with mooring and cruising measurement, and the OFES is the best choice to study mesoscale processes versus the other two reanalyzes through comparing their results with satellite measurement.
1. Introduction
Ocean reanalyzes are widely used to investigate ocean phenomena nowadays. They are regarded by many oceanographers as the realistic representations of ocean. Therefore, the work about assessing ocean reanalyzes is really important for an analysis or forecast in the field of operational oceanography. However, due to relative scarcity of in situ observations, the occasions for assessing these ocean reanalyzes are rare [1].
Zhai et al. [2] used satellite altimetry data to evaluate multiple ocean products in the region of North Equatorial Current (NEC) through comparing annual mean horizontal currents and calculating linear correlations at six tidal gauge stations. However, since their assessment was based on the offshore or single station data, the effectiveness of these products about open sea or large section cannot be ensured. Zhai et al. [3] also compared a high-resolution data assimilation with altimetry observations and current measurements, but the problem mentioned is still unresolved.
Three ocean reanalyzes including Simple Ocean Data Assimilation (SODA) version 3.4.2, Hybrid Coordinate Ocean Model (HYCOM) GLBu 0.08, and the Navy Coupled Ocean Data Assimilation (NCODA) analysis, and Ocean General Circulation Model (OGCM) for the Earth Simulator (OFES) are commonly used for analyzing currents. SODA and OFES reanalyzes are built on the Modular Ocean Model ocean developed at the Geophysical Fluid Dynamics Laboratory/the National Oceanic and Atmospheric Administration (GFDL/NOAA) [4,5,6,7]. As the US Navy’s current operational ocean model, HYCOM is developed from the Miami Isopycnic Coordinate Ocean Model (MICOM) [1,8,9].
In this work, we use mooring, ship, and satellite observation data to evaluate the three ocean reanalyzes about NEC at 160° E section. This paper is organized as follows. Section 2 describes the data and methods used; Section 3 shows the results and analysis of assessment; Section 4 offers the conclusion and discussion.
2. Materials and Methods
A subsurface mooring was deployed in June 2014 and retrieved in May 2016 at 160° E, 15° N. The details about instruments, data processing, and bathymetry of the study areas could be found in Wang et al. [10]. In this paper, we only use the velocity data from 30 to 126 m with 8-m intervals measured by 300 kHz Acoustic Doppler Current Profiler (ADCP). Besides, a cruising observation was carried out in May 2016. The current data were obtained through observing 150 kHz and 38 kHz Shipboard Acoustic Doppler Current Profiler (SADCP), whose bin sizes were 8 m and 24 m, respectively. In order to obtain higher-quality flow field data, we merged and processed the data of both SADCPs. Moreover, the daily data of sea surface geostrophic velocities with 1/4° × 1/4° resolution distributed by the Archiving, Validation, and Interpretation of Satellite Oceanographic (AVISO) product were used. We processed them into monthly data. The above data were used to assess ocean reanalyzes.
Three ocean reanalyzes were from SODA version 3.4.2, HYCOM GLBu 0.08+NCODA analysis, and OFES. Their spatial resolutions were 1/4° × 1/4°, 1/12° × 1/12° and 1/10° × 1/10°, respectively. Their temporal resolutions were monthly, daily, and monthly, respectively. The HYCOM and OFES data came from hindcast products. These reanalyzes are frequently used in the research of NEC [2,3,11,12,13].
3. Results and Analysis
We compared zonal velocities from ocean reanalyzes with those measured by ADCP at the mooring site, as shown in Figure 1. Generally, the daily data from HYCOM could not reflect the real current effectively. However, from September 2015 to January 2016, the product seemed to agree well with the observation. The correlation coefficient between the daily zonal velocities from ADCP and those from HYCOM during the whole observation period was 0.29, and was 0.59 during September 2015 to January 2016, both of them above the 95% confidence level; the root mean square errors are 103.03 cm and 4.98 cm, respectively. The correlation coefficient between the monthly zonal velocities from ADCP and those from HYCOM/SODA/OFES is 0.49/0.36/-0.03, but the latter two are below the 95% confidence level; the root mean square error is 18.37/7.00/12.72. Therefore, the ocean reanalyzes have a poor ability to depict NEC at 160° E, 15° N. The assimilated velocity fields from ocean analyzes are unsuitable to analyze NEC at a single point.
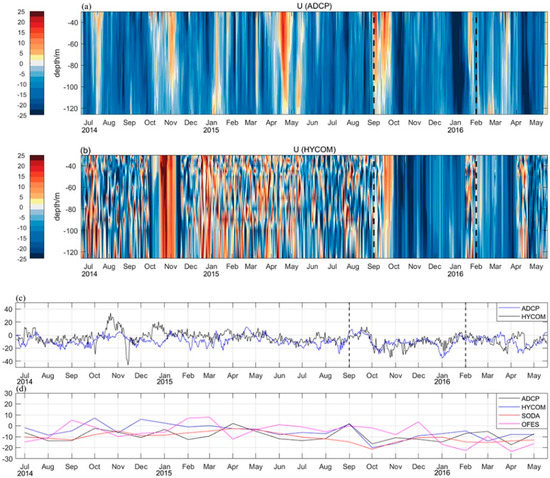
Figure 1.
Daily zonal velocities from Acoustic Doppler Current Profiler (ADCP) (a) and Hybrid Coordinate Ocean Model (HYCOM) (b), the vertically averaged daily zonal velocities from ADCP and HYCOM (c), and monthly zonal velocities from ADCP, HYCOM, Simple Ocean Data Assimilation (SODA), and Ocean General Circulation Model for the Earth Simulator (OFES) (d) at the mooring site during the period of June 2014 to May 2016.
The cruising observation reveals that the westward NEC’s range is from 9.5° N to 17° N and its depth varied with latitudes at 160° E section in May 2016 (Figure 2a). Below the NEC, the eastward North Equatorial Undercurrent (NEUC) is strong, particularly from 11° N to 14.5° N. Although non-temporal SODA data have relatively low resolution of 1/4° N, the depiction is acceptable (Figure 2b). For example, the range of NEC in SODA data is from 9.5° N to 17° N and the NEUC is strong from 11° N to 14.5° N, which agrees well with in situ observation.
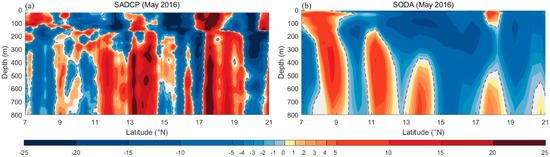
Figure 2.
Zonal velocities from Shipboard Acoustic Doppler Current Profiler (SADCP) (a) and SODA (b) at 160° E section in May 2016.
Because of the lack of long-term cruising observation, we used SODA data to evaluate HYCOM and OFES data [5]. As mentioned before, HYCOM corresponds with mooring measurement from September 2015 to January 2016 at a single point. Firstly, we compared the data during the same period (Figure 3). In general, the major currents simulated by the HYCOM and OFES agreed well with those derived from the SODA. We could find that the core of NEC is greater than 300 m. Using the two reanalyzes to study the structure of NEC at 160° E section during September 2015 to January 2016 is reliable. However, the NEUC seems to appear as a different structure, which is the insufficiency of products.
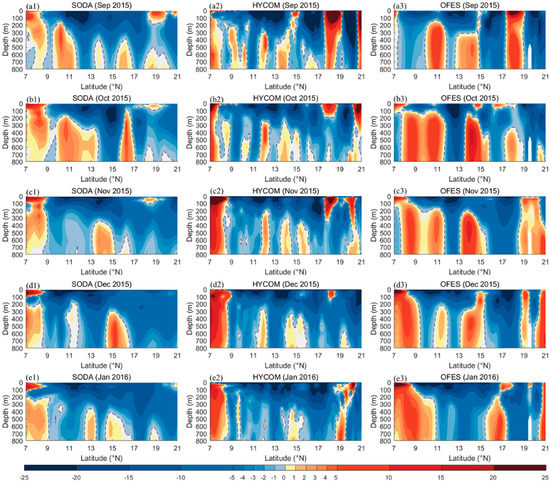
Figure 3.
Monthly zonal velocities from SODA (a1–e1), HYCOM (a2–e2) and OFES (a3–e3) at 160° E section during September 2015 to January 2016. Wrong HYCOM data from 1–15 September 2015 and from 16–31 January 2016 are removed.
In order to assess these reanalyzes further, we compared their sea surface data with satellite altimetry data, as shown in Figure 4. The low resolution of SODA data (1/4° × 1/4°) restricts their ability to study mesoscale processes such as mesoscale eddies. Although the HYCOM data have high resolution (1/12° × 1/12°), their ability to identify eddies is poor. The OFES data could reflect the sea surface eddies generally and have relative high resolution (1/10° × 1/10°), but the difference still exists between them and AVISO data, such as the eddies’ locations and sizes. Improving spatial resolution and accuracy of ocean reanalyzes is one of the challenges mentioned in a previous study [14].
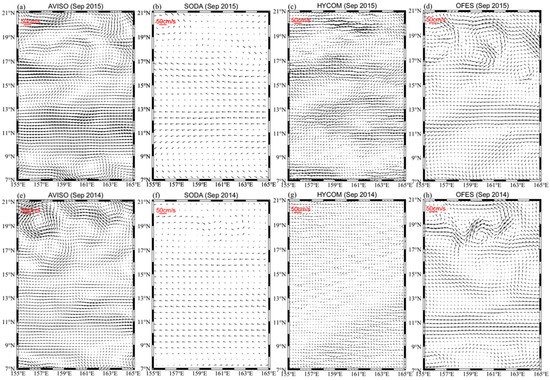
Figure 4.
Monthly surface currents from Archiving, Validation, and Interpretation of Satellite Oceanographic (AVISO) (a,e), SODA (b,f), HYCOM (c,g), and OFES (d,h) in September 2015 and September 2014.
4. Conclusion and Discussion
In this paper, we assess several ocean reanalyzes including SODA, HYCOM, and OFES about their ability of depicting the structure of NEC at 160° E from July 2014 to May 2016. These products agree badly with mooring measurement at single point in general, although the HYCOM data correspond well during September 2015 to January 2016. At 160°E section, the three analyzes could reflect the structure of NEC well but not NEUC. As for the sea surface status, SODA and HYCOM could not identify mesoscale eddies well, but OFES could identify mesoscale eddies well.
We verified the validity of the three ocean reanalyzes about NEC at 160° E section during September 2015 to January 2016. Actually, we also assessed the products in other periods of time, as shown in Figure 5. We found that there are many wrong values in HYCOM+NCODA data during September 2014 to January 2015, except October 2014. This indicates that the HYCOM+NCODA data used in this paper are not always applicable. The ocean reanalyzes still have many limitations [14]. Before using these products, we should validate them first, to ensure their effectiveness during a certain period of time.
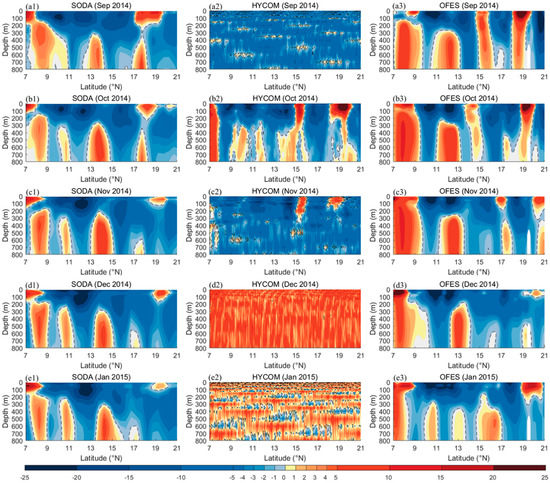
Figure 5.
Monthly zonal velocities from SODA (a1–e1), HYCOM (a2–e2), and OFES (a3–e3) at 160° E section during September 2014 to January 2015.
Author Contributions
X.C. and K.M. collected the in situ observational data. J.W. treated and analyzed the data. J.W., X.C., and K.M. interpreted and discussed the results. J.W. wrote the paper. All authors have read and agreed to the published version of the manuscript.
Funding
This research was funded by the National Science Foundation of China (11572351).
Acknowledgments
The authors thank all the crew members who participated in the ship cruising observation. Outputs of AVISO are obtained from http://marine.copernicus.eu/services-portfolio/access-to-produts/, outputs of HYCOM+NCODA are downloaded from http://hycom.org, and outputs of SODA and OFES are from http://apdrc.soest.hawaii.edu/data/data.php.
Conflicts of Interest
The authors declare no conflict of interest.
References
- Savage, J.A.; Tokmakian, R.T.; Batteen, M.L. Assessment of the HYCOM velocity fields during Agulhas Return Current Cruise 2012. J. Oper. Oceanogr. 2015, 8, 11–24. [Google Scholar] [CrossRef]
- Zhai, F.; Wang, Q.; Wang, F.; Hu, D. Decadal variations of Pacific North Equatorial Current bifurcation from multiple ocean products. J. Geophys. Res. Ocean. 2014, 119, 1237–1256. [Google Scholar] [CrossRef]
- Zhai, F.; Wang, Q.; Wang, F.; Hu, D. Variation of the North Equatorial Current, Mindanao Current, and Kuroshio Current in a high-resolution data assimilation during 2008–2012. Adv. Atmos. Sci. 2014, 31, 1445–1459. [Google Scholar] [CrossRef]
- Carton, J.A.; Chepurin, G.A.; Chen, L. SODA3: A new ocean climate reanalysis. J. Clim. 2018, 31, 6967–6983. [Google Scholar] [CrossRef]
- Wang, C.; Lan, J.; Wang, G. Climatology and seasonal variability of the Mindanao Undercurrent based on OFES data. Acta Oceanol. Sin. 2013, 32, 14–20. [Google Scholar] [CrossRef]
- Carton, J.A.; Giese, B.S. A reanalysis of ocean climate using simple ocean data assimilation (SODA). Mon. Weather Rev. 2008, 136, 2999–3017. [Google Scholar] [CrossRef]
- Masumoto, Y.; Sasaki, H.; Kagimoto, T.; Komori, N.; Ishida, A.; Sasai, Y.; Miyama, T.; Motoi, T.; Mitsudera, H.; Takahashi, K. A fifty-year eddy-resolving simulation of the world ocean: Preliminary outcomes of OFES (OGCM for the Earth Simulator). J. Earth Simul. 2004, 1, 35–56. [Google Scholar]
- Bleck, R. An oceanic general circulation model framed in hybrid isopycnic-Cartesian coordinates. Ocean Model. 2002, 4, 55–88. [Google Scholar] [CrossRef]
- Costa, F.B.; Tanajura, C.A.S. Assimilation of sea-level anomalies and Argo data into HYCOM and its impact on the 24 hour forecasts in the western tropical and South Atlantic. J. Oper. Oceanogr. 2015, 8, 52–62. [Google Scholar] [CrossRef]
- Wang, J.; Chen, X.; Mao, K. Measurement of the North Equatorial Current/Undercurrent by a subsurface mooring at 160° E. J. Oper. Oceanogr. 2020. [Google Scholar] [CrossRef]
- Yan, Q.; Hu, D.; Zhai, F. Seasonal variability of the North Equatorial Current transport in the western Pacific Ocean. Chin. J. Oceanol. Limnol. 2014, 32, 223–237. [Google Scholar] [CrossRef]
- Meng, Q.; Wang, F.; Liu, N. Low-frequency variability of the North Equatorial Current bifurcation in the past 40 years from SODA. Acta Oceanol. Sin. 2011, 30, 14–19. [Google Scholar] [CrossRef]
- Chen, Z.; Wu, L. Long-term change of the Pacific North Equatorial Current bifurcation in SODA. J. Geophys. Res. Ocean. 2012, 117, C6. [Google Scholar] [CrossRef]
- Storto, A.; Alvera-Azcarate, A.; Balmaseda, M.A.; Barth, A.; Chevallier, M.; Counillon, F.; Domingues, C.M.; Drevillon, M.; Drillet, Y.; Forget, G. Ocean reanalyses: Recent advances and unsolved challenges. Front. Mar. Sci. 2018, 6, 418. [Google Scholar] [CrossRef]
© 2020 by the authors. Licensee MDPI, Basel, Switzerland. This article is an open access article distributed under the terms and conditions of the Creative Commons Attribution (CC BY) license (http://creativecommons.org/licenses/by/4.0/).