Article

Analysis and Optimization of Atmospheric Drain Tank of Lng Carrier Steam Power Plant

1
Department of Maritime Sciences, University of Zadar, Mihovila Pavlinovića 1, 23000 Zadar, Croatia
2
Faculty of Engineering, University of Rijeka, Vukovarska 58, 51000 Rijeka, Croatia
*
Author to whom correspondence should be addressed.
J. Mar. Sci. Eng. 2020, 8(8), 568; https://doi.org/10.3390/jmse8080568
Submission received: 3 June 2020 / Revised: 25 July 2020 / Accepted: 25 July 2020 / Published: 28 July 2020
(This article belongs to the Special Issue Marine Power Systems)

Abstract

:
The atmospheric drain condensate system of a marine steam power plant is described and evaluated from the energetic and exergetic point of view at a conventional liquefied natural gas (LNG) carrier. Energy loss and exergy destruction rate were calculated for individual stream flows joined in an atmospheric drain tank with variations of the main turbine propulsion speed rate. The energy efficiency of joining streams was noted to be above 98% at all observed points as the atmospheric drain tank was the direct heater. The exergy efficiency of the stream flows into the drain tank was in the range of 80% to 90%. The exergy stream flow to the tank was modeled and optimized by the gradient reduced gradient (GRG) method. Optimization variables comprised contaminated and clean condensate temperature of the atmospheric drain tank and distillate water inlet to the atmospheric drain tank with respect to condensate outlet temperature. The optimal temperatures improves the exergy efficiency of the tank as direct heater, to about 5% in port and 3% to 4% when the LNG carrier was at sea, which is the aim of optimizing. Proposals for improvement and recommendations are given for proper plant supervision, which may be implemented in real applications.

Graphical Abstract

1. Introduction

There have been a number of studies on stationary steam power plant feed water regenerative groups, their exergy and energy efficiency and possible feed water heater optimization. The importance of the feed water temperature at the entrance of the main boilers is related to fuel consumption, as the feed water temperature is lower, fuel consumption to the main boilers is higher and vice versa. The regenerative feed water cycle usually consists of seven or more regenerative heaters, which may be direct or indirect steam heaters. The selected papers were divided into three groups connected by the same problem.
The first group of authors studied the amount of exergy destruction for the regenerative feed water group, which is relatively low compared to the total exergy destruction of the steam power plant. Aljundi [1] carried out an energy and exergy analysis of the Al-Hussein power plant in Jordan, showing exergy destruction of individual components in the plant. According to the studies, exergy destruction of the feed water heating group, which consists of two low-pressure heaters, a deaerator and two high-pressure heaters, is 0.19% to 0.28% of total exergy destruction. Similarly, Sengupta et al. [2] analyzed a 210 MW thermal power plant and concluded that the contribution of exergy destruction to the regenerative feed water cycle of all feed water heaters and pumps was the lowest of all major components analyzed in the steam cycle. Comprehensive studies of Turkish power plants were made by Erdem et al. [3], in which nine thermal power plants were systematically analyzed with their exergy destruction and efficiency rates of the regenerative feed water groups. In that study, the low-pressure feed water heater group contributed 0.02% to 0.46% to the total exergy destruction of the system. The contribution of the high-pressure feed water group to total exergy destruction was in the range of 0.01% to 0.54%. Conventional analyses of the supercritical 200 MW Shahid Montazeri Power Plant in Iran with installed power capacity of 671 MW gave similar results to previous research according to Wang et al. [4] and Ahmadi and Toghraie [5].
The second group of selected papers is related to the optimization of feed water regeneration. The aim of the optimization is to decrease the fuel consumption of a stationary power plant. Ataei and Yoo [6] optimized ΔT of a thermal plant, combining feed water heaters for exergy and the pinch method by the cycle–tempo simulator, succeeding in decreasing fuel consumption by 5.3%. Modeling of a 312 MW thermal plant showed that increasing the feed water at the steam generator inlet reduced fuel consumption in the steam generators. Toledo et al. [7] conducted an exergy analysis of two 160 MW power plants with six and seven regenerative feed water heaters and the authors concluded that the seventh regenerative feed water heater contributed to decreased specific steam and fuel oil consumption by only 0.5%. Mehrabani et al. [8] optimized a thermal plant for electricity generation in Shahid Rajaei, India, by introducing a feed water heater and new power unit into the system. They used the genetic algorithm to find the optimal amount of turbine extraction steam. The efficiency of the plant with this approach increased by 5%, however a retrofit investment is required for practical realization of that idea. Espatolero et al. [9] optimized a 770 MWe power plant with the addition of one new LP heater, two drain pumps and an indirect flue gas heat recovery system with double-stage integration in the cycle, increasing plant efficiency by 0.7%.
The third group of selected papers is related to research combining the feed water regenerative cycle with solar field collectors and showed the following results. Adibhatla and Kaushik [10] tried to combine feed water regenerative groups to incorporate solar-aided feed water heating for a 500 MWe thermal power plant, but exergy efficiency of such a setup was lower than the classical Rankine regenerative cycle that is associated with exergy destruction in the collector–receiver system. Another study was carried out by Ahmadi et al. [11], integrating a solar field instead of the feed regeneration group [11]. It gained benefits by replacing high-pressure feed water preheaters with a solar farm, resulting in increased energy and exergy efficiencies of the power plant by 18.3%. Following a similar idea, Mohammadi et al. [12] incorporated a solar heating collector upgraded with a thermal storage system, as that system can be used at night, resulting in increased net generated power by 8.14%. The main problem with solar field heat generation is high capital cost, which is a problem with such concepts, but it saves fuel and reduces pollution [13]. The payback time, which varies according to the size and position of the plant, can be about 4.5–5.5 years, according to Bakos and Tsechelidou [14] or 5.13–6.21 years if thermal storage is included in the system [15].
A marine plan analysis carried out by Koroglu and Sogut [16] concluded that a feed water heater’s efficiency could be improved externally only as a result of improvements to other components, such as turbine, boiler, condenser and pump equipment. As a marine steam propulsion plant is slightly different compared to a stationary plant, the return of condensate to the feed water system has not yet been evaluated in the scientific literature. Taking this into consideration, a case study of a specific condensate system of a 30 MW marine steam plant is explained and elaborated in this paper. The main difference between the marine condensate system and a stationary steam plant is the condensate cycle loop, which is divided into two groups and is joined together in the atmospheric drain tank. The temperature of the returned condensate in the atmospheric drain tank affects the temperature of the feed water before entering the deaerator as these two streams join before it. As the deaerator is a direct feed water heater, lower feed water temperature will require more steam consumption to heat the feed water to the saturated temperature, which results in higher fuel consumption of the marine power plant.
The paper is divided into two parts. The first part describes the calculation of energy and exergy efficiency of joining condensate water in the atmospheric drain tank as the direct heater, where stream flows from the condensate system are measured. The second part describes the optimization of the obtained exergy results with the adjusted stream flow temperatures in order to improve the efficiency of the joined streams in the direct heater, i.e., the atmospheric drain tank. As the efficiency of the atmospheric drain tank has an impact on the main feed water line temperature before the deaerator since it is mixed with the same. It is important to maintain it at the optimized level. The optimized temperature will save fuel consumption of the plant, which is the motivation for this work.

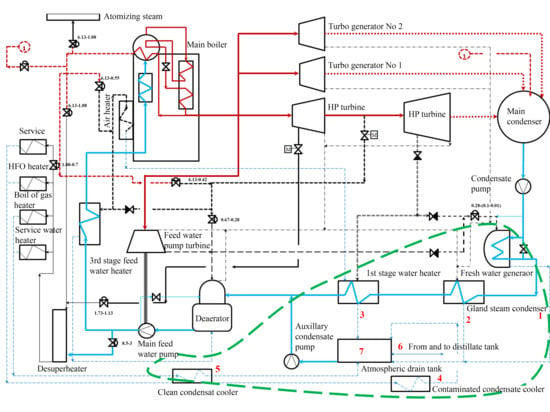
2. Feed Water and Steam Condensate System

A steam turbine vessel’s main condensate system, as part of the closed feed water cycle, allots circulating feed water from the main condenser to the main boilers. Condensed water is taken from the main condenser and passed through the fresh water generator, gland steam condenser and first-stage heater and goes towards the deaerator, main feed water pump and third-stage feed water heater before entering the main boilers (Figure 1). In that feed water line, all heaters are indirect heaters and the deaerator is a direct heater.
During that process, feed water is taken from the main condenser, where the steam outlet from the main turbine and turbo generators condenses at saturated steam pressure. The temperature of the condensate water depends on the vacuum and seawater cooling temperature and varies from 30 to 40 °C. Condensed water is taken from the main condenser well and passes a group of heaters, whereupon it comes to the main boilers preheated to about 140 °C in the liquid state due to the high pressure of the main boiler water drum, which is maintained at about 6.3 MPa. Section heaters of the mentioned allotment are divided into extraction steam heaters or regenerative heaters and non-extraction or system heaters. Regenerative steam heaters get steam from the main propulsion turbine, which includes first-stage feed water heater, deaerator and third-stage feed water heater, where the fresh water generator, when it is heated from the main turbine extraction, acts as a regenerative feed water heater; otherwise it is a system feed water heater that consumes steam from the system. The condensate section is drawn with a blue line in Figure 1.
Condensate from the service system (5 in Figure 1), fresh water generator (1), gland condenser cooler (2) and first-stage heater (3) collects in an atmospheric drain tank, where it is mixed with distillate makeup water (6) taken from the distillate tanks. Distillate water makes up all water losses in the system, which, if there are no steam leaks, mainly must be refilled to the system due to the atomizing steam and soot blow losses inside the main boilers. Condensate from the service line is drawn with a dashed blue line in Figure 1. In the marine steam turbine plant, the service group is connected to the main propulsion plant system via the atmospheric drain tank. Service steam is used for the various heavy fuel oil (HFO) heaters, boil off gas (BOG) heaters and accommodation service. BOG heaters are used for heating and vaporizing liquefied natural gas (LNG), which is taken from the cargo tank when there is not enough methane vapor from the tank. The amount of steam for the BOG heaters is controlled by the cargo and boiler management system which controls the cargo tank pressure, as described in [17].
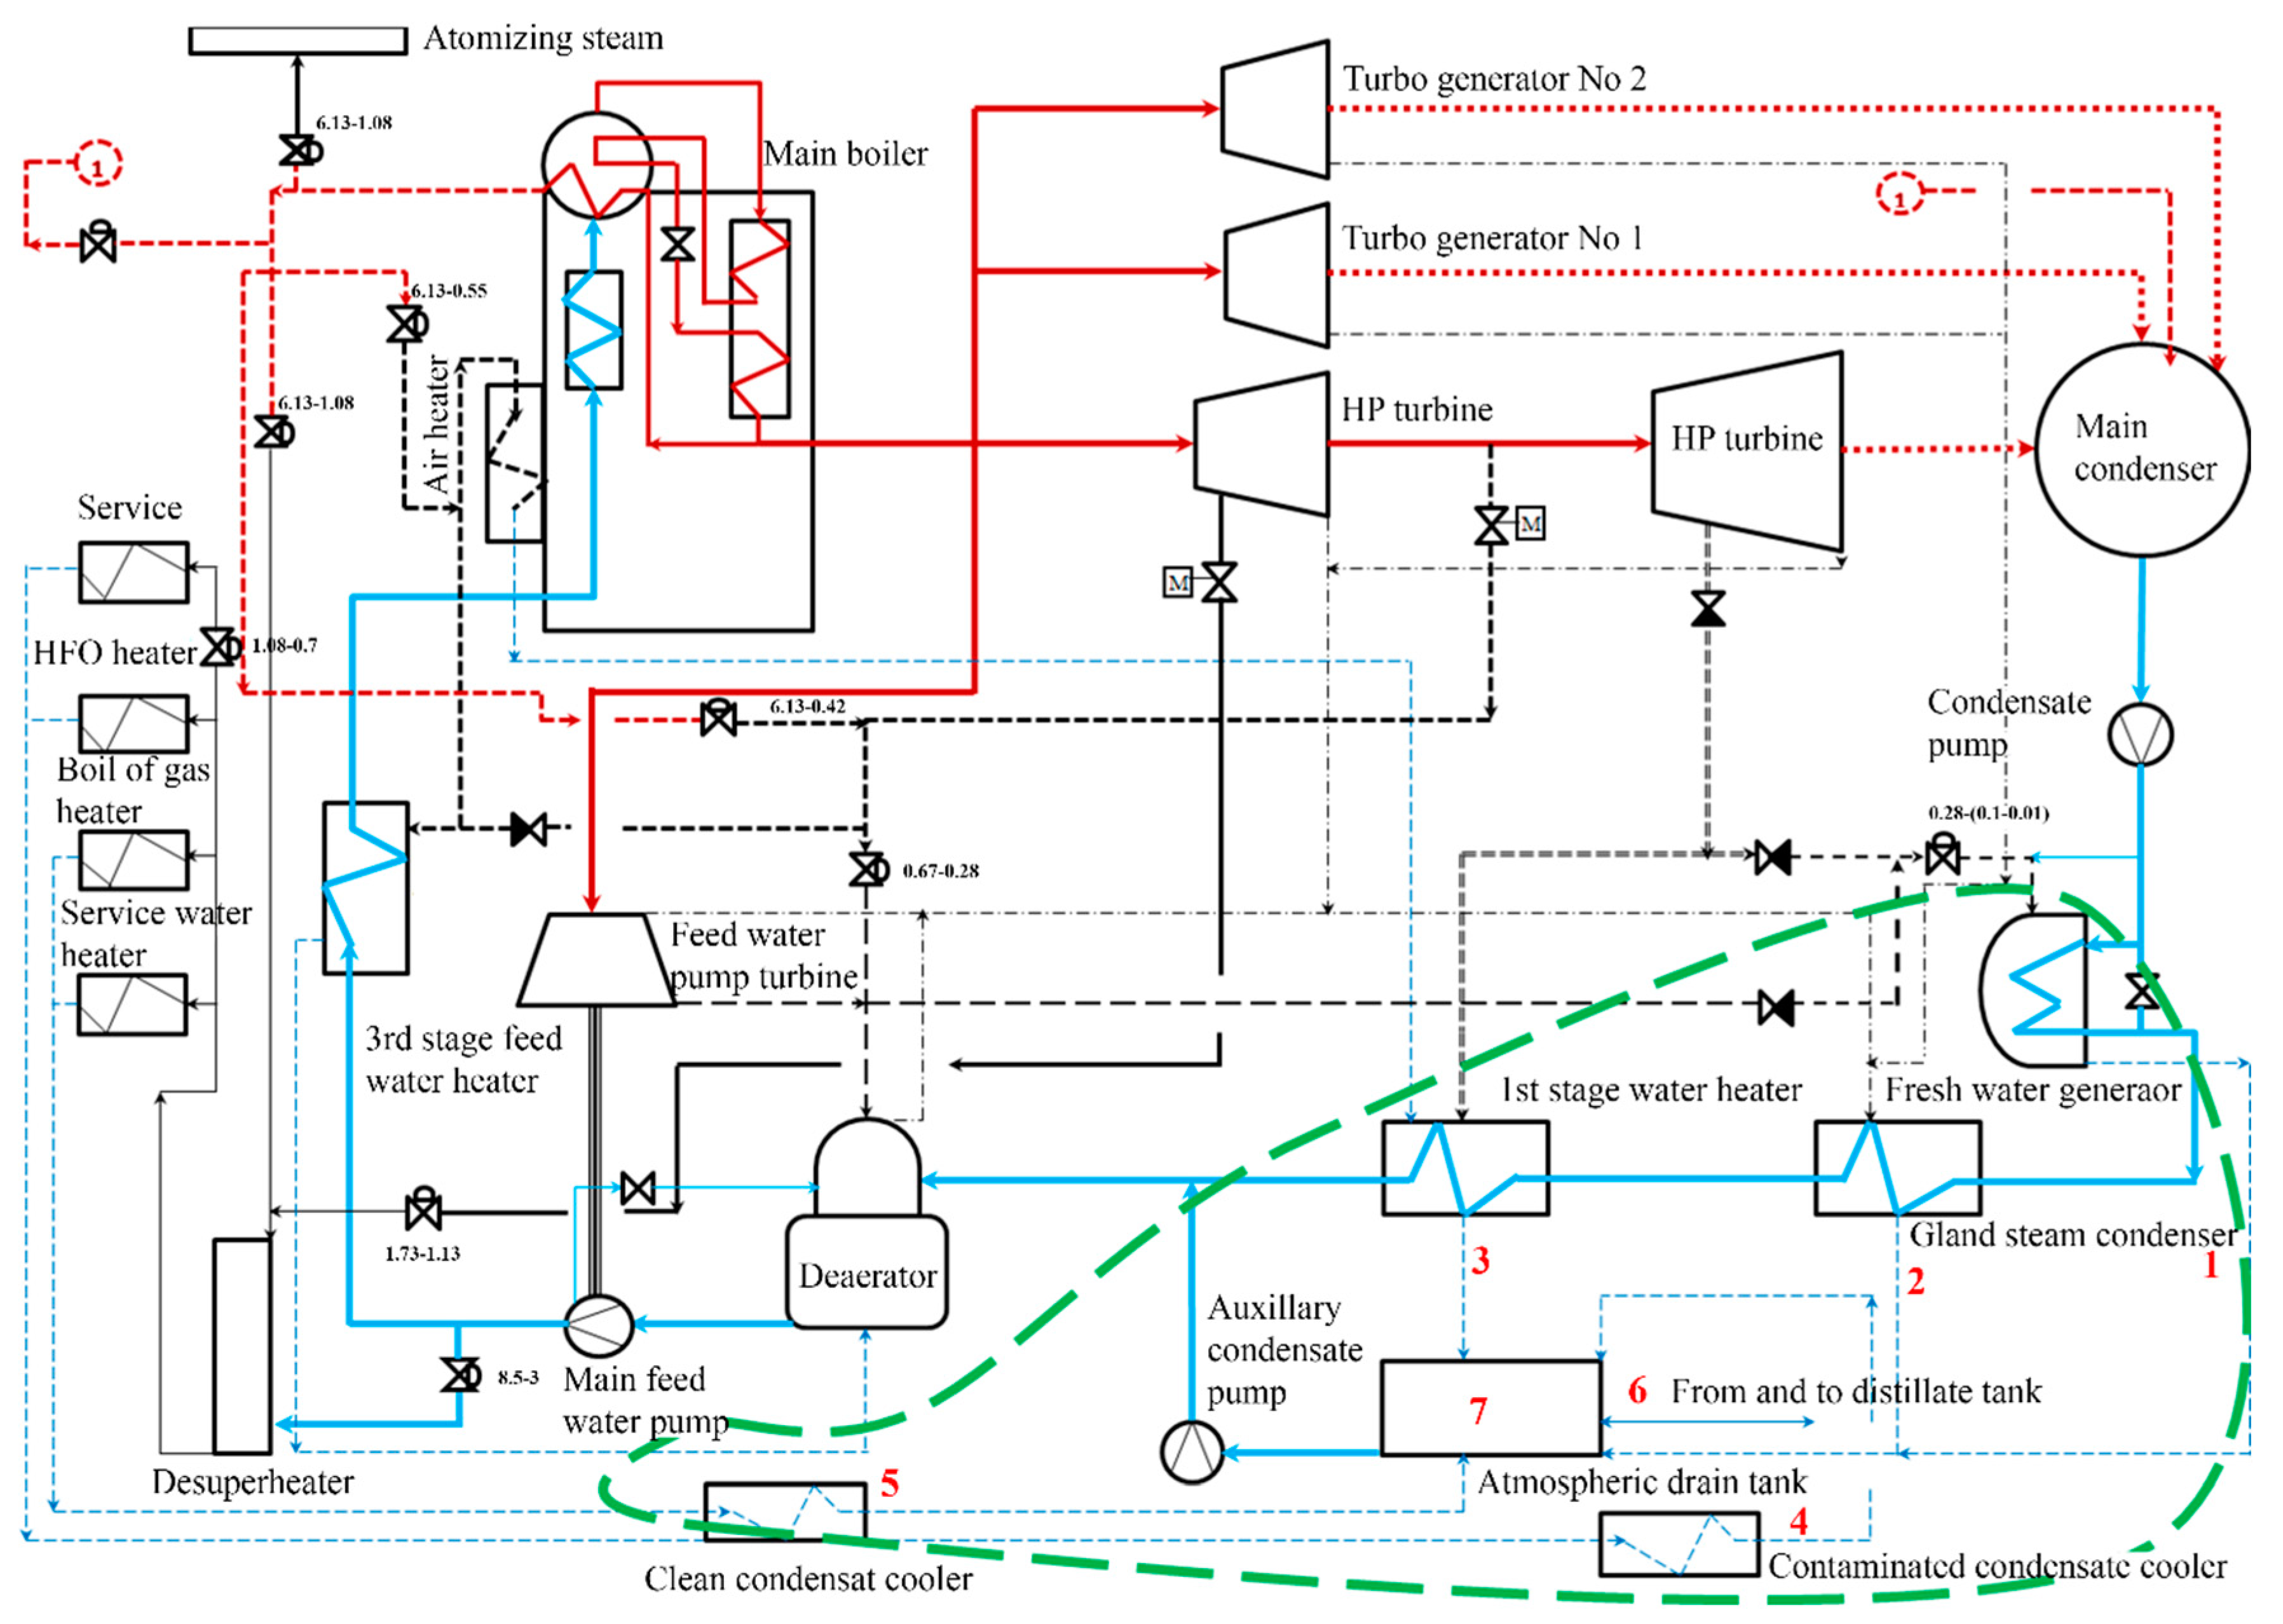
The atmospheric drain tank is the collecting node for both contaminated condensate (4) and clean condensate (5) (Figure 2). These two condensate streams arise from the auxiliary steam system, while contaminated condensate is part of various HFO and lube oil heaters. In order to prevent contamination of the system, condensate from these heaters first passes through analyzing and treating units, which set off an alarm of contaminant is detected in the water, such as fuel oil or lube oil, that may destroy the main boiler tubes by depositing into it, causing local overheating [18].
The clean condensate inlet from the system, which is not in contact with hydrocarbon substances, also enters the atmospheric drain tank, but directly without monitoring and is mixed with the monitored contaminated condensate. Both streams, along with the distillate water stream in the atmospheric drain tank, are again returned back to the system.
As the steam propulsion plant system is dynamic, an additional role of the atmospheric drain tank is to amortize excess and make up the feed water in the system with the spilled feed water back to the distillate tanks or extract it from the distillate tanks again to the system with a change of the plant load. Basic LNG carrier power propulsion plant characteristics for maximal power, vacuum and flow are given in Table 1 [19,20].

3. Data Collection

A main propulsion turbine run test was carried out with step-by-step increase of the main propulsion shaft revolutions in order to collect the required data. The distilled water inlet to the atmospheric drain tank is the sum of the atomizing steam consumption plus steam losses. Losses are normally calculated for marine steam plants according to the recommendation in [21]. For the purpose of this study, feed water consumption in the tank is listed according to measured consumption from the flow meter described in [22]. Pressure, temperature and main propulsion shaft revolutions taken with standard engines measuring equipment are given in Table 2.
Measurement results for all fluid streams are presented in Table A1, Table A2 and Table A3. All operating parameters were measured by varying the propeller revolutions. Propeller revolutions are increased by a main propulsion turbine which is coupled to the main propeller shaft by reduction gear. As the main turbine is increasing main propeller shaft speed, it is consuming more steam. The consumption of the steam increases the turbine load which must be made up by steam generators and that corresponds to increased steam plant thermal power production. The atmospheric drain condenser was under slight overpressure below ~0.11 MPa.

4. Thermodynamic Analysis

For the presented model, the required enthalpies and entropies were calculated from measured pressures and temperatures for every stream flow by using NIST REFPROP software [31]. Mass, energy and exergy flow stream balances were calculated according to the following [32,33]:
In the steady-state process, the mass balance of control volume is:
I N m ˙ i = O U T m ˙ o .
The energy balance of the control volume system is written as:
I N E ˙ i + Q ˙ = O U T E ˙ o + W ˙ .
In general, energy efficiency is a ratio of useful and used energy rates in the process [34,35]:
η I = E ˙ O U T E ˙ I N = 1 E ˙ l E ˙ I N .
Energy loss:
m ˙ 1 · h 1 + m ˙ 2 · h 2 + m ˙ 3 · h 3 + m ˙ 4 · h 4 + m ˙ 5 · h 5 + m ˙ 6 · h 6 = m ˙ 7 · h 7 + E ˙ l .
Energy efficiency:
η I = m ˙ 7 · h 7 m ˙ 1 · h 1 + m ˙ 2 · h 2 + m ˙ 3 · h 3 + m ˙ 4 · h 4 + m ˙ 5 · h 5 + m ˙ 6 · h 6 .
The entropy balance of the control volume system is:
I N S ˙ + I N Q ˙ T + S ˙ g e n = O U T S ˙ + O U T Q ˙ T .
The exergy balance of the control volume system is written as:
I N E ˙ x i + k ( 1 T T k ) · Q ˙ k = O U T E ˙ x o + W + E ˙ x d .
where exergy rate of the stream is:
E ˙ x = m ˙ · e x .
The specific exergy from Equation (8) at standard ambient state of 0.1 MPa and 25 °C is taken as per the recommendations in [36,37,38]:
e x = ( h h 0 ) T 0 · ( s s 0 ) .
Exergy efficiency:
η I I = 1 E ˙ x d E ˙ x I N = E ˙ x O U T E ˙ x I N .
Exergy destruction:
m ˙ 1 · e x 1 + m ˙ 2 · e x 2 + m ˙ 3 · e x 3 + m ˙ 4 · e x 4 + m ˙ 5 · e x 5 + m ˙ 6 · e x 6 = m ˙ 7 · e x 7 + E ˙ x d .
Exergy efficiency:
η I I = m ˙ 7 · e x 7 m ˙ 1 · e x 1 + m ˙ 2 · e x 2 + m ˙ 3 · e x 3 + m ˙ 4 · e x 4 + m ˙ 5 · e x 5 + m ˙ 6 · e x 6 .

5. Energy and Exergy Analysis Results

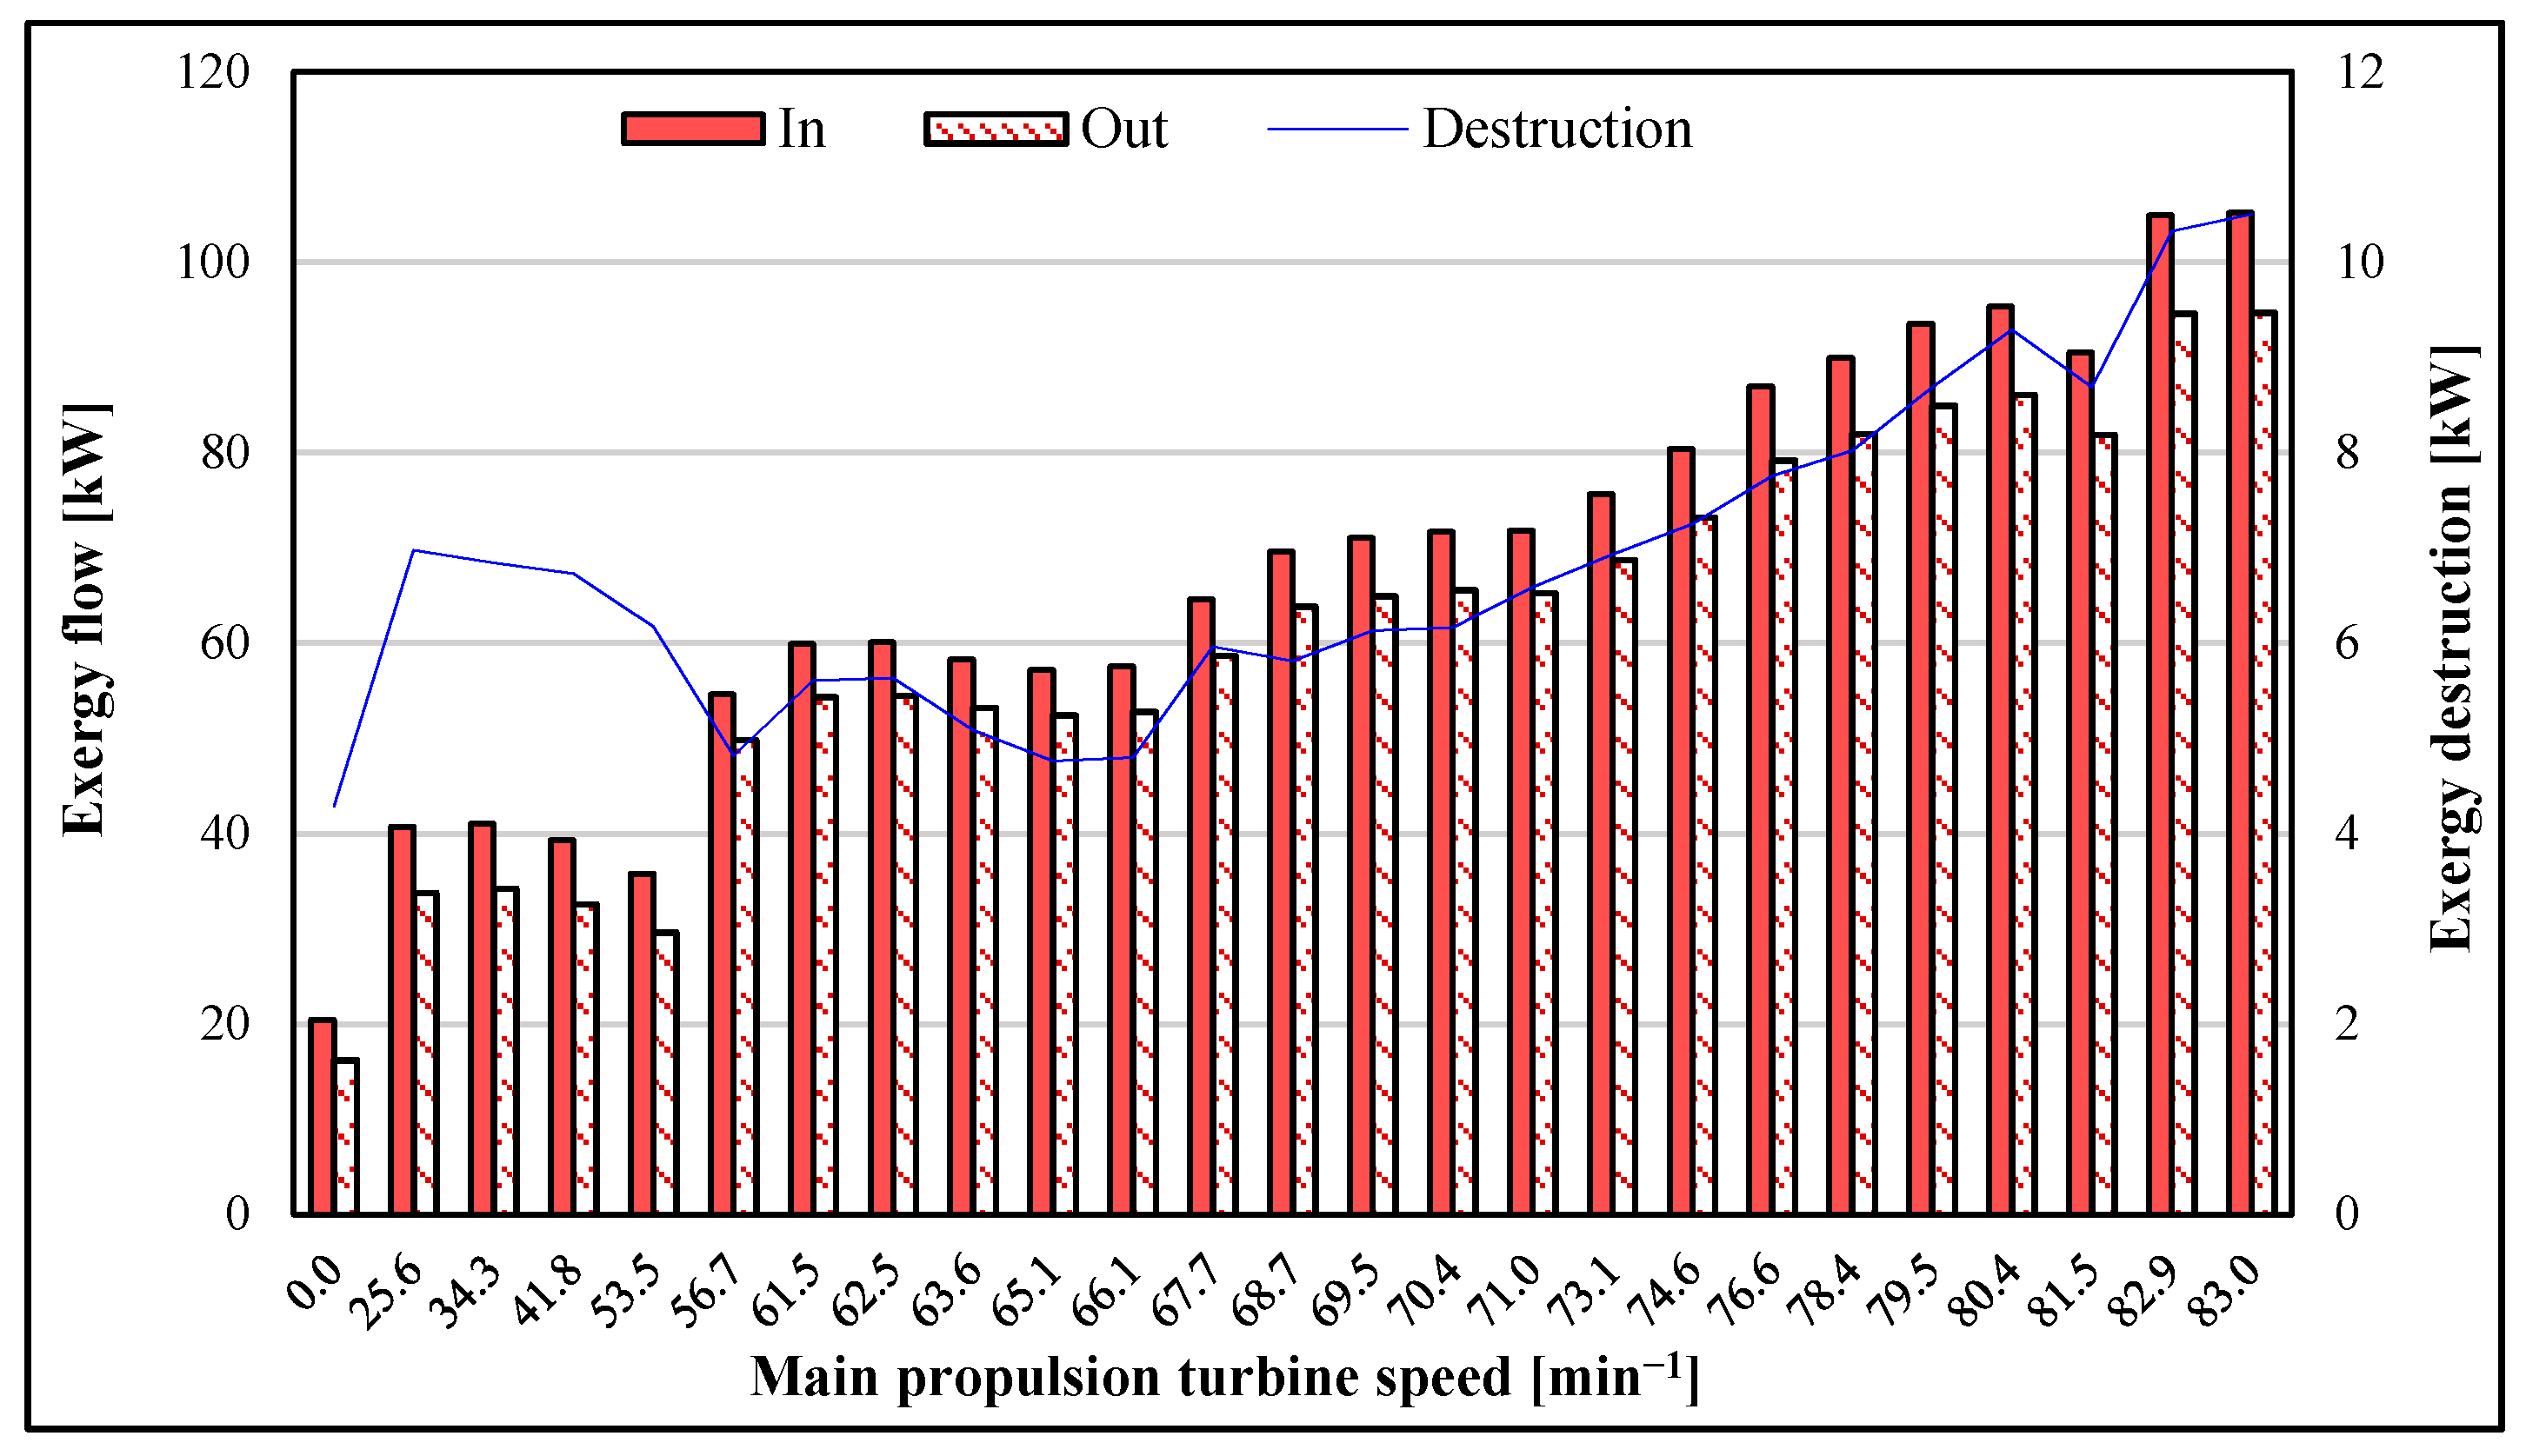
Atmospheric drain tank energy flow streams show that at lower loads of the main propulsion turbine, total energy loss in the atmospheric drain tank is higher compared to higher load ranges, as seen in Figure 3. The energy loss in the maneuvering range is the result of an accumulating function of the drain tank, where load changes in the system are compensated by adding feed water to the tank. After passing the maneuvering range of the steam propulsion plant, 0.0 to 53.5 min−1 and reaching a ship speed of about 13 knots, the main sea water circulating pumps are stopped and cooling of the main condenser is taken over by the scoop system, which collects sea water according to the ship’s speed.
The opening of the scoop system corresponds to about 61.5 min−1, after which energy losses become lower and are distributed more equally through the upper range of the load range. Exergy flow losses of the atmospheric drain tank have an opposite trend to energy losses and increase even with the increased main propulsion turbine load (Figure 4). Exergy destruction amplitude is about 10 kW at the highest load, which is almost double compared to energy losses. The increment of exergy destruction with increased load is typical for disturbances in the system that may be connected to some equipment, under capacitance or similar construction design failure. The observed shortcoming may be improved by optimizing the respective component flow streams. The moment of decreasing exergy destruction trend at higher loads is at 1.5 min−1, where extraction of steam from the high-pressure turbine begins. The extracted steam is used for ship services. This moment obviously acts positively on the exergy destruction of the atmospheric drain tank.
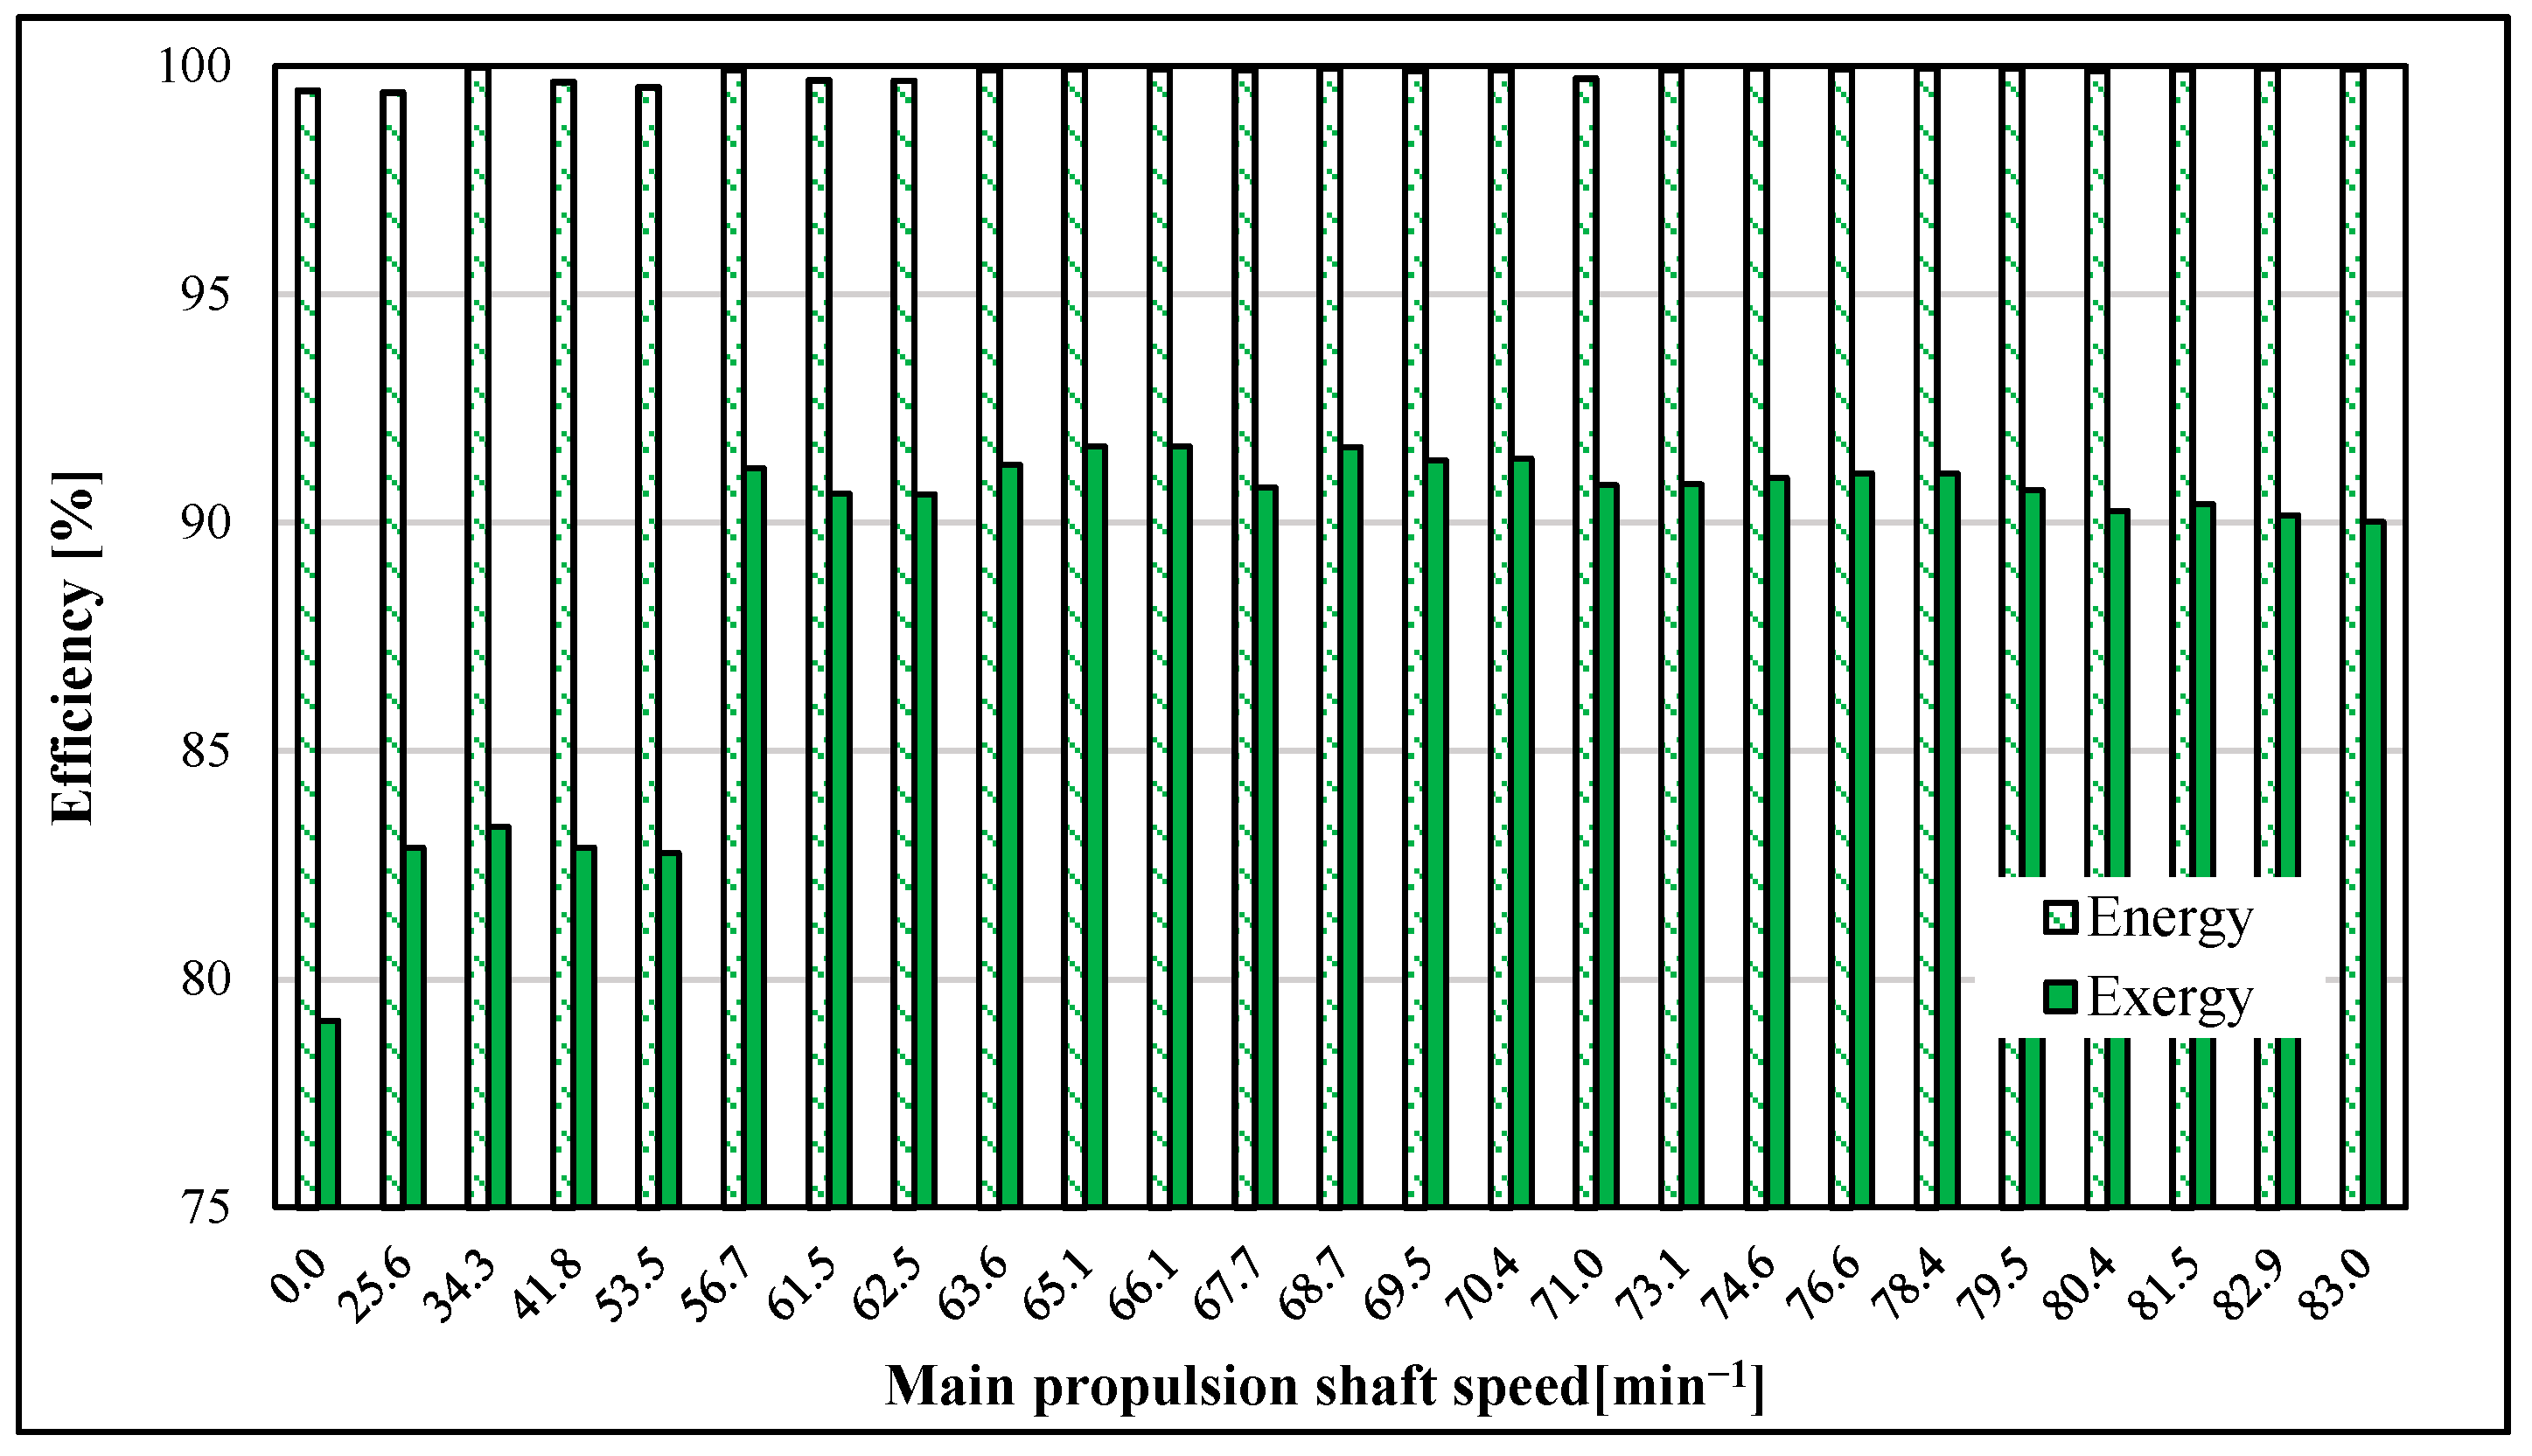
A comparison of energy and exergy efficiency is given in Figure 5. Energy efficiency of the joined streams in the atmospheric drain tank was very high, above 98% at all measured ranges. On the other side, results of exergy analysis indicate that exergy efficiency of the joined streams inside the atmospheric drain tank was somewhat worse when the main propulsion turbine was not running and throughout the maneuvering range. The exergy efficiency of the joined streams in the port was below 80% and after passing the maneuvers zone it stabilized to about 90%.
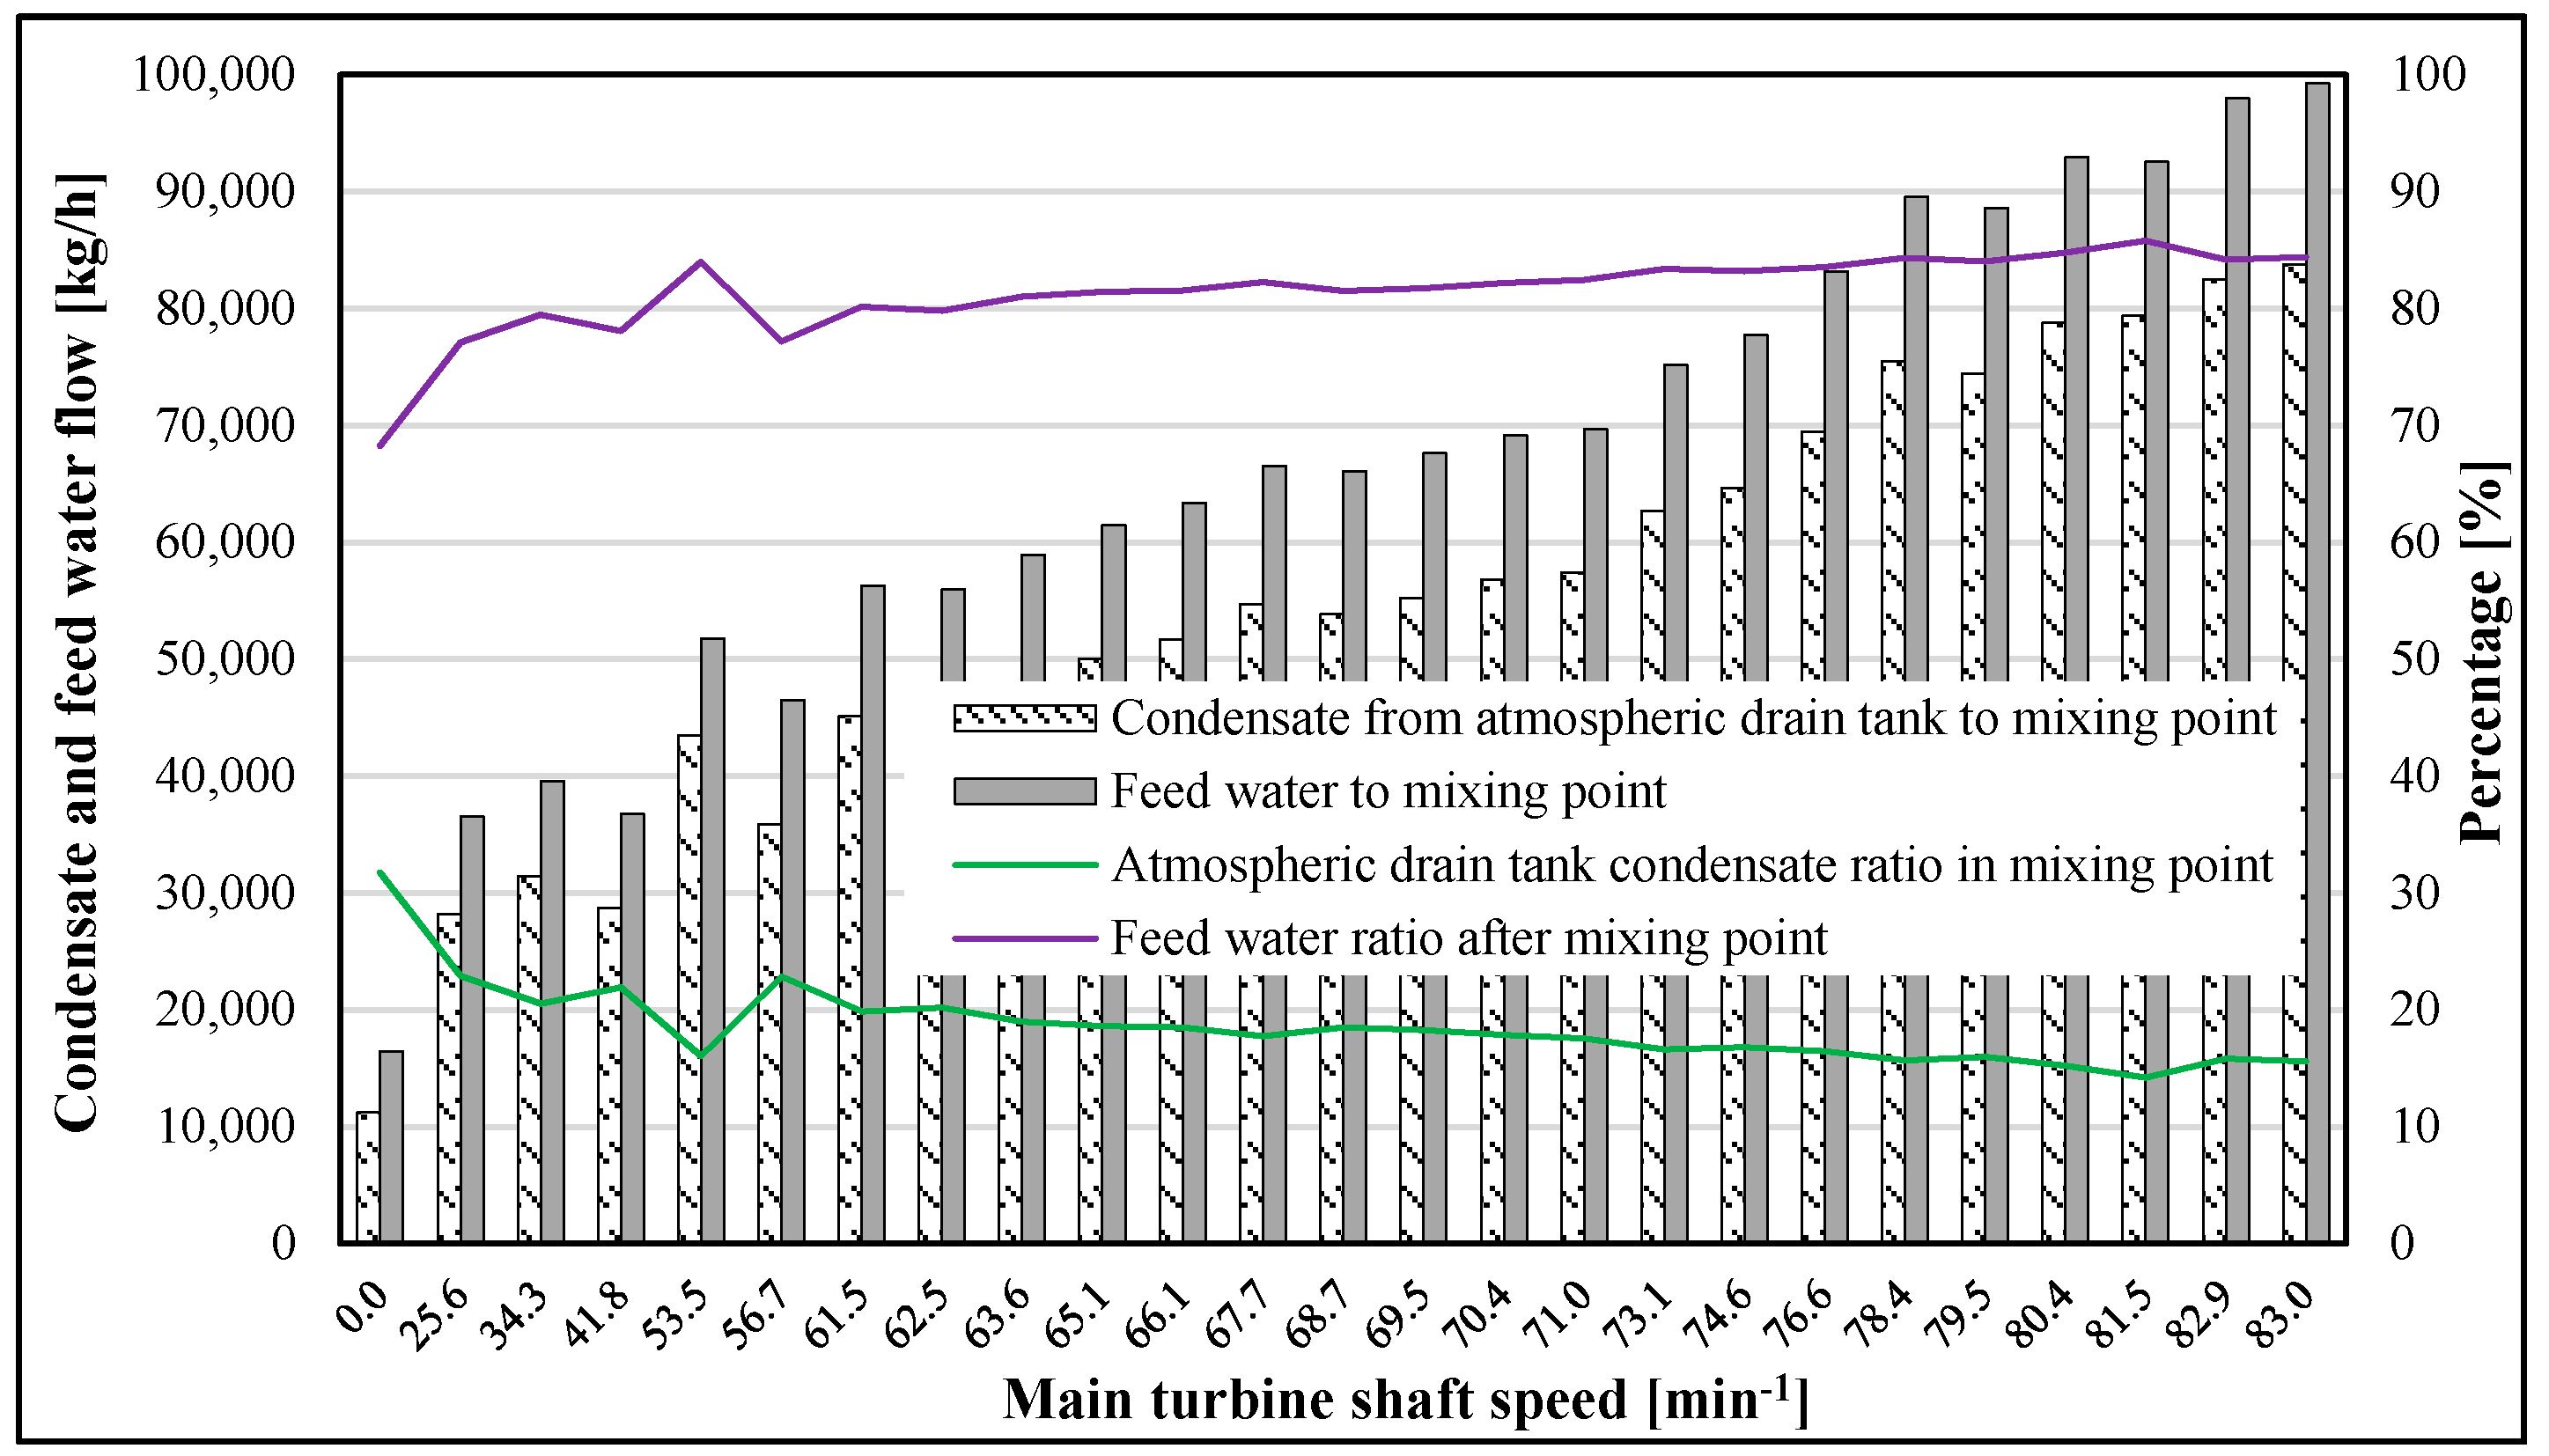
Figure 6 shows the condensate mass share from the atmospheric drain tank versus the amount of feed water passing the first-stage heater at their mixing point. When a ship is alongside for a cargo operation, part of the condensate coming from the drain tank to the common feed water line is over 30%, while when maneuvering the vessel and with further increased main propulsion turbine load, that ratio drops down to about 15%. Accordingly, the temperature at atmospheric condenser outlet has an influence on the feed water temperature after the mixing point of the two feed water lines. By decreasing the feed water temperature after the mixing point, deaerator losses are increased, as it will be required to lead more steam onto the deaerator in order to bring feed water to saturation temperature, which is required in order to release various dissolved gasses from the feed water [39].
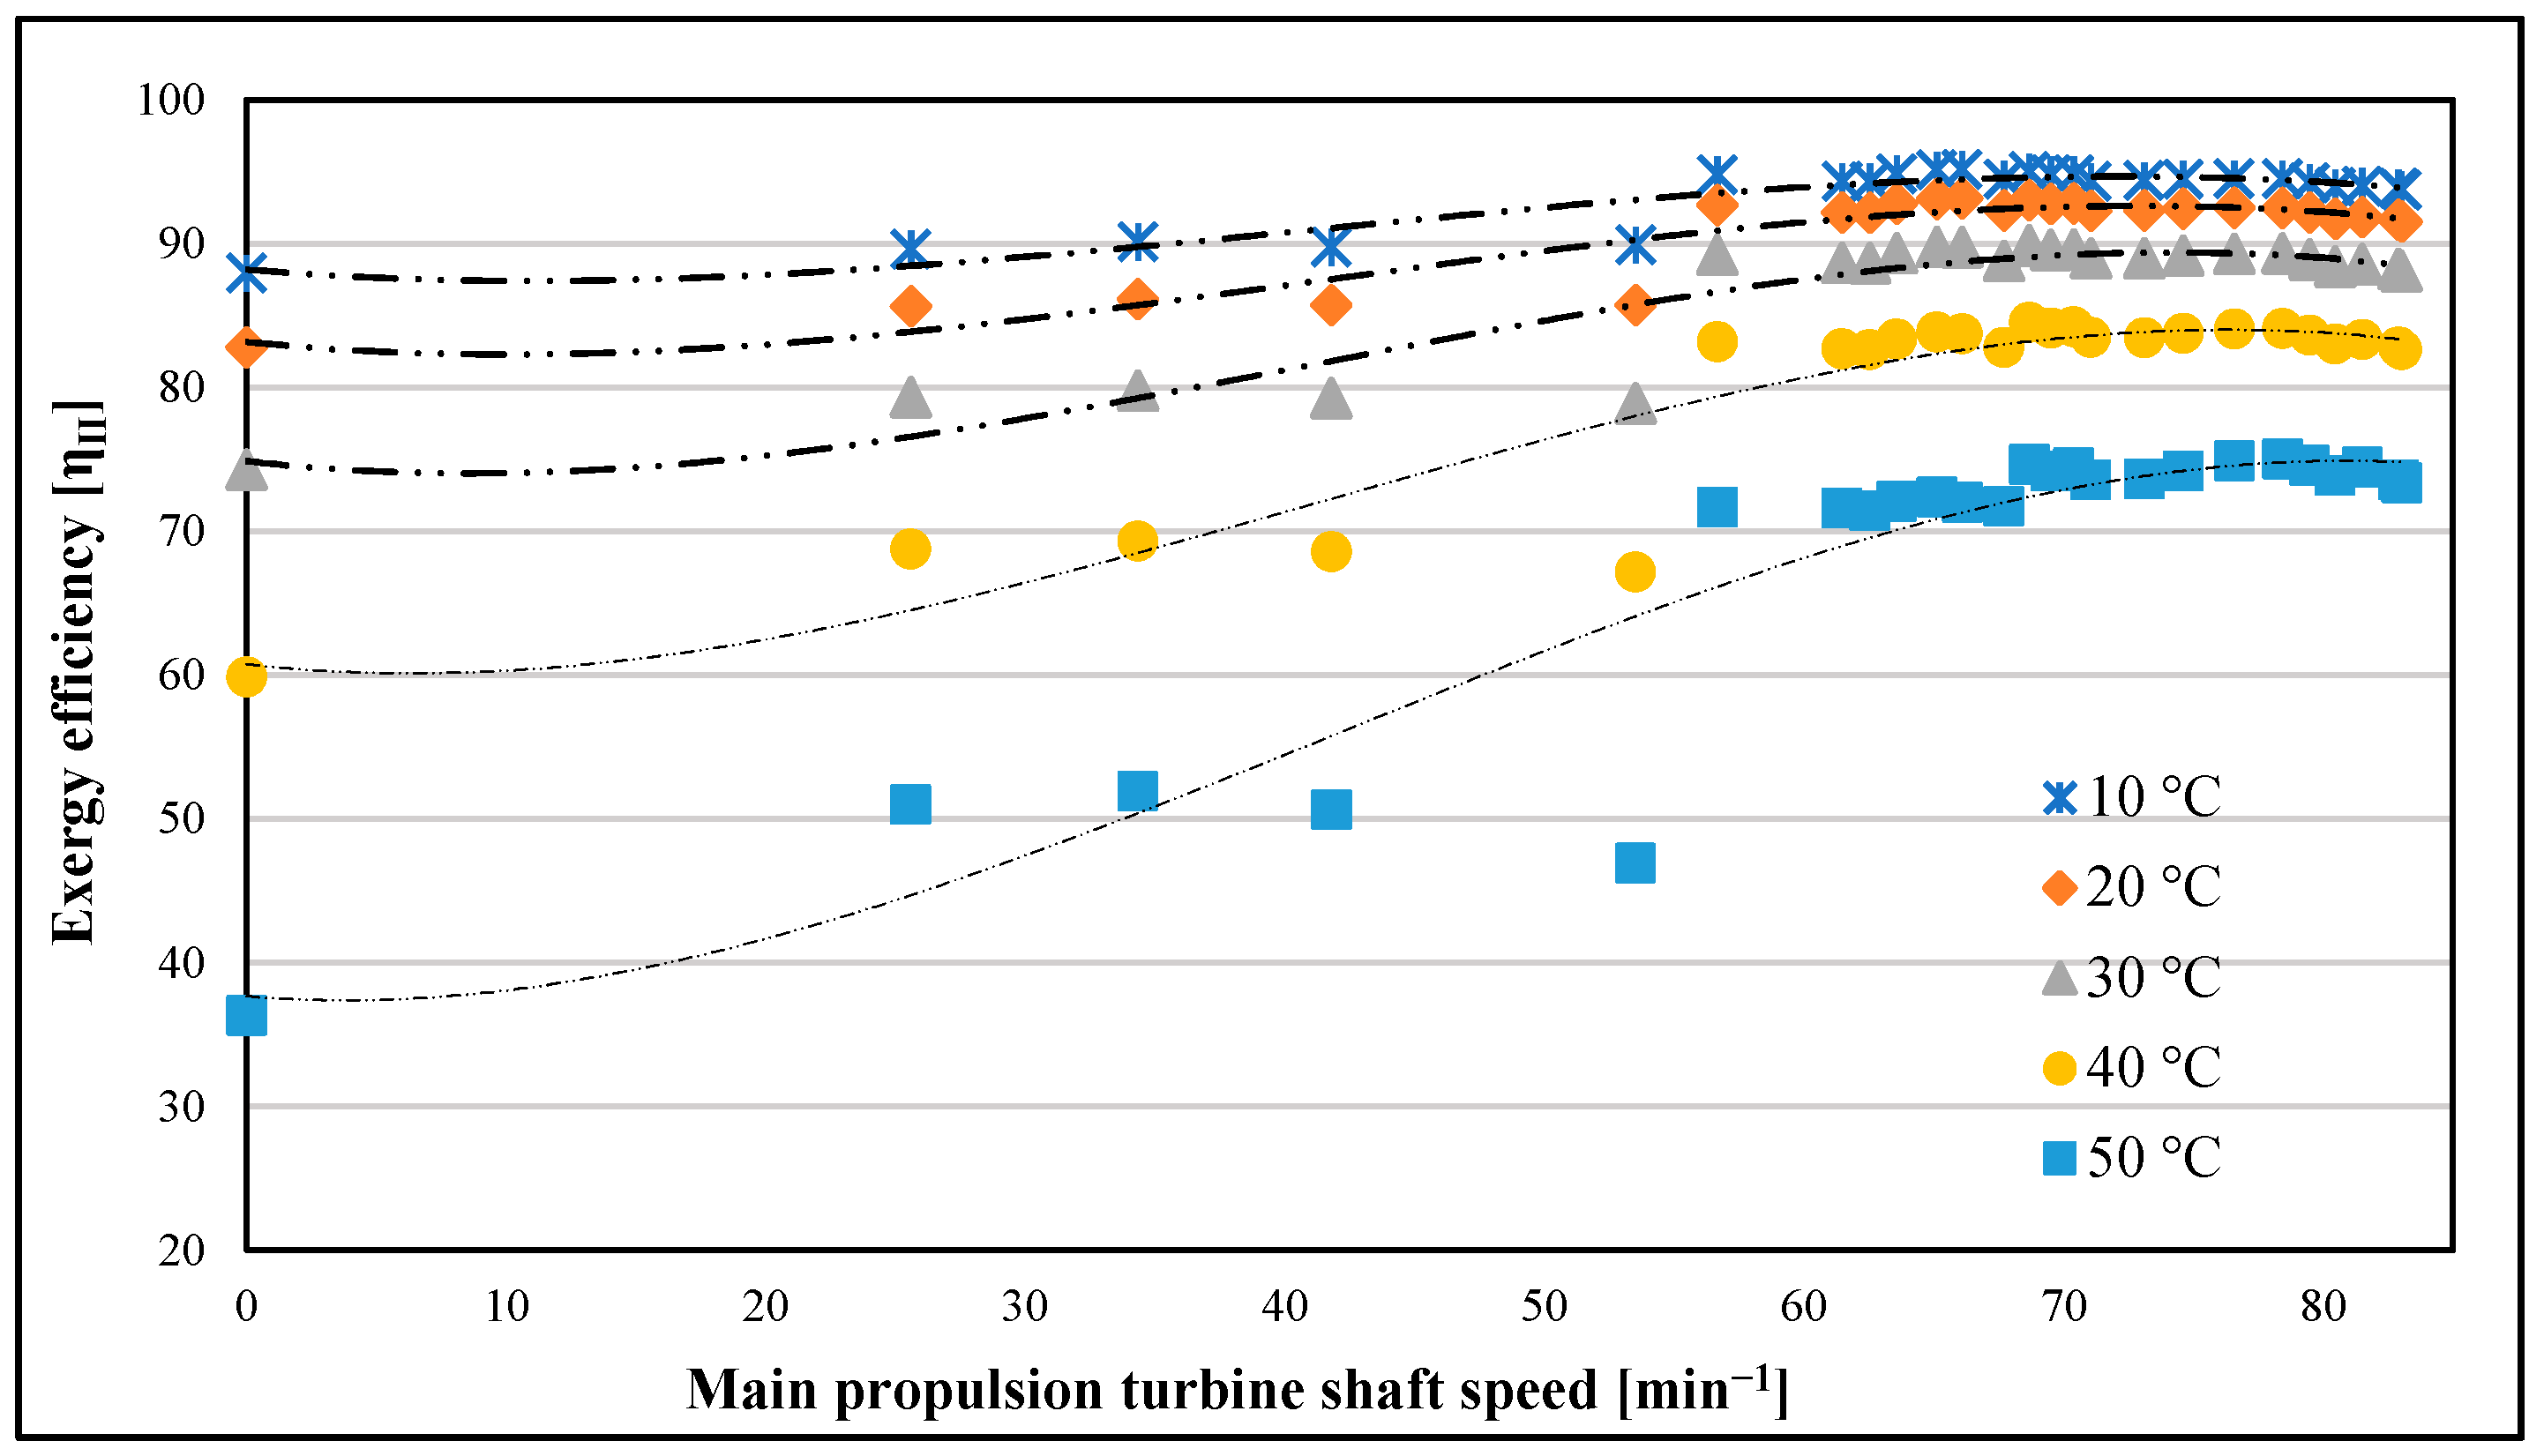
Exergy efficiency variation with changing ambient temperature is given in Figure 7 and was assessed according to the recommendations in [40,41]. This measurement gives a good outlook on the effect of ambient temperature on exergy efficiency in various sailing destinations where the LNG carrier is operating. The selected range of exergy variation is surrounding temperature from 10 to 50 °C. The reference temperature is 25 °C and 0.1 MPa. The results of exergy efficiency variation show that it decreases with rising temperature, especially between 40 and 50 °C. Degradation of exergy efficiency is more conspicuous in port. In the upper loads of the steam plant, the difference in exergy efficiency is smaller. Such high discrepancy in exergy efficiency is mainly caused by the condensate temperature from the fresh water generator. The spray water for cooling the steam remains open even when the fresh water generator is not producing the water in the port and lower loads. A cold stream of water reduces the temperature in the atmospheric tank and decreases exergy efficiency.

6. Mathematical Formulation of Atmospheric Drain Tank Optimization Problem

As an optimizing tool, a fourth-degree polynomial with one variable is used to calculate specific exergy according to data taken from [42] to achieve more accurate optimization results. The common polynomial of kth order according to [43,44] is:
P ( x ) = a 0 + a 1 · x + + a k · x k .
The sum of residue squares when approximated by value yi of polynomial P(xi), i = 1, …, n is:
R 2 = i = 1 n [ y i ( a 0 + a 1 · x i + + a k · x i k ) ] 2 .
A partial differential of Equation (15) yields the following set of equations for extrema:
( R 2 ) a 0 = 2 i = 1 n [ y i ( a 0 + a 1 · x i + + a k · x i k ) ] = 0 ,
( R 2 ) a 1 = 2 i = 1 n [ y i ( a 0 + a 1 · x i + + a k · x i k ) ] · x i = 0 ,
,
( R 2 ) a k = 2 i = 1 n [ y i ( a 0 + a 1 · x i + + a k · x i k ) ] · x i k = 0 .
The previous system of equations is equivalent to the following:
a 0 · n + a 1 i = 1 n x i + + a k i = 1 n x i k = i = 1 n y i ,
a 0 i = 1 n x i + a 1 i = 1 n x i 2 + + a k i = 1 n x i k + 1 = i = 1 n x i · y i ,
a 0 i = 1 n x i k + a 1 i = 1 n x i k + 1 + + a k i = 1 n x i 2 k = i = 1 n x i k · y i .
The same in matrix notation reads as:
[ n i = 1 n x i i = 1 n x i k i = 1 n x i i = 1 n x i 2 i = 1 n x i k + 1 i = 1 n x i k i = 1 n x i k + 1 i = 1 n x i 2 k ] · [ a 0 a 1 a k ] = [ i = 1 n y i i = 1 n x i · y i i = 1 n x i k · y i ] .
The matrix system in (21) is equivalent to the following system with a Vandermonde matrix [45]:
[ n i = 1 n x i i = 1 n x i k i = 1 n x i i = 1 n x i 2 i = 1 n x i k + 1 i = 1 n x i k i = 1 n x i k + 1 i = 1 n x i 2 k ] · [ a 0 a 1 a k ] = [ i = 1 n y i i = 1 n x i · y i i = 1 n x i k · y i ] .
Let the Vandermonde matrix from (22) be denoted by X and the vector with the coefficients ai, i = 0, …, k be denoted by a. The solution to (21) and (22) can be found by multiplying system (23) by the inverse of X:
a = X 1 · y .
The procedure described by (14)–(23) was used on data taken from [42], which yielded polynomials for specific exergy at various temperatures and pressures. The polynomials, as a function of temperature at given pressure f (t, p), are listed below; a complete list of the used polynomials is given in the appendix.
Atmospheric tank specific exergy outlet and distillate water inlet to the tank:
30 < f ( t ) < 100   ° C ,
p = 0.11   MPa ,
e x f ( t , p ) = 2.8714 · 10 8 · t 4 1.7549625 · 10 5 · t 3 + 8.1833784 · 10 3 · t 2 + 0.3776049 · t + 4.5966608 , R 2 = 0.999999999461
Contaminated condensate cooler specific exergy outlet and clean condensate cooler outlet:
30 < f ( t ) < 100   ° C ,
p = 0.55   MPa ,
e x f ( t , p ) = 2.8752 · 10 8 · t 4 1.7560712 · 10 5 · t 3 + 8.1832649 · 10 3 · t 2 + 0.3776048 · t + 5.0382725 , R 2 = 0.999999999544
30 < f ( t ) < 100   ° C ,
p = 0.65   MPa ,
e x f ( t , p ) = 2.8767 · 10 8 · t 4 1.7512137 · 10 5 · t 3 + 8.1784348 · 10 3 · t 2 + 0.3774153 · t + 5.1359903 , R 2 = 0.999999999434
The optimization function is used to achieve maximum exergy efficiency of the joined exergy streams in the atmospheric drain tank by the calculated exergy fourth-degree polynomial functions:
max η I I ( t 4 , t 5 , t 6 ) = m ˙ 7 · e x 7 m ˙ 1 · e x 1 + m ˙ 2 · e x 2 + m ˙ 3 · e x 3 + m ˙ 4 · e x 4 + m ˙ 5 · e x 5 + m ˙ 6 · e x 6 .
The optimization variables are:
  • Contaminated condensate cooler temperature outlet t4;
  • Clean condensate cooler temperature outlet t5;
  • Distillate temperature t6.
Fixed conditions are:
  • Exergy of stream inlet to atmospheric drain tank from fresh water generator ex1;
  • Contaminated condensate cooler temperature outlet t4;
  • Exergy of stream inlet to atmospheric drain tank from gland steam condenser ex2;
  • Exergy of stream inlet to atmospheric drain tank from first-stage feed water heater ex3;
  • Mass flow inlet to atmospheric drain tank from m1 to m6 are fixed;
  • Pressure from p1 to p6 is fixed.
With following conditions:
  • Conservation of mass flow:
    m ˙ 1 + m ˙ 2 + m ˙ 3 + m ˙ 4 + m ˙ 5 + m ˙ 6 = m ˙ 7 .
    t7 is determined by partial temperature ratios of all mass flow participants:
    m ˙ 1 · t 1 + m ˙ 2 · t 2 + m ˙ 3 · t 3 + m ˙ 4 · t 4 + m ˙ 5 · t 5 + m ˙ 6 · t 6 = m ˙ 7 · t 7 .
Under given constraints:
  • Contaminated condensate cooler temperature outlet:
    30 t 4 140 .
  • Clean condensate cooler temperature outlet:
    30 t 5 140 .
  • Distillate water temperature from the tank:
    20 t 6 40 .
  • Energy efficiency of joining streams to atmospheric drain tank:
    0 η I 1   or   0 m ˙ 7 · h 7 m ˙ 1 · h 1 + m ˙ 2 · h 2 + m ˙ 3 · h 3 + m ˙ 4 · h 4 + m ˙ 5 · h 5 + m ˙ 6 · h 6 1 .
Optimization was performed with the gradient reduced gradient method (GRG) from Excel’s solver analysis packet [46]. The options were adjusted as follows:
  • Constraint precision: 0.000001;
  • Convergence: 0.0001;
  • Derivatives: forward;
  • Bounds on the variables: require;

7. Optimization Results

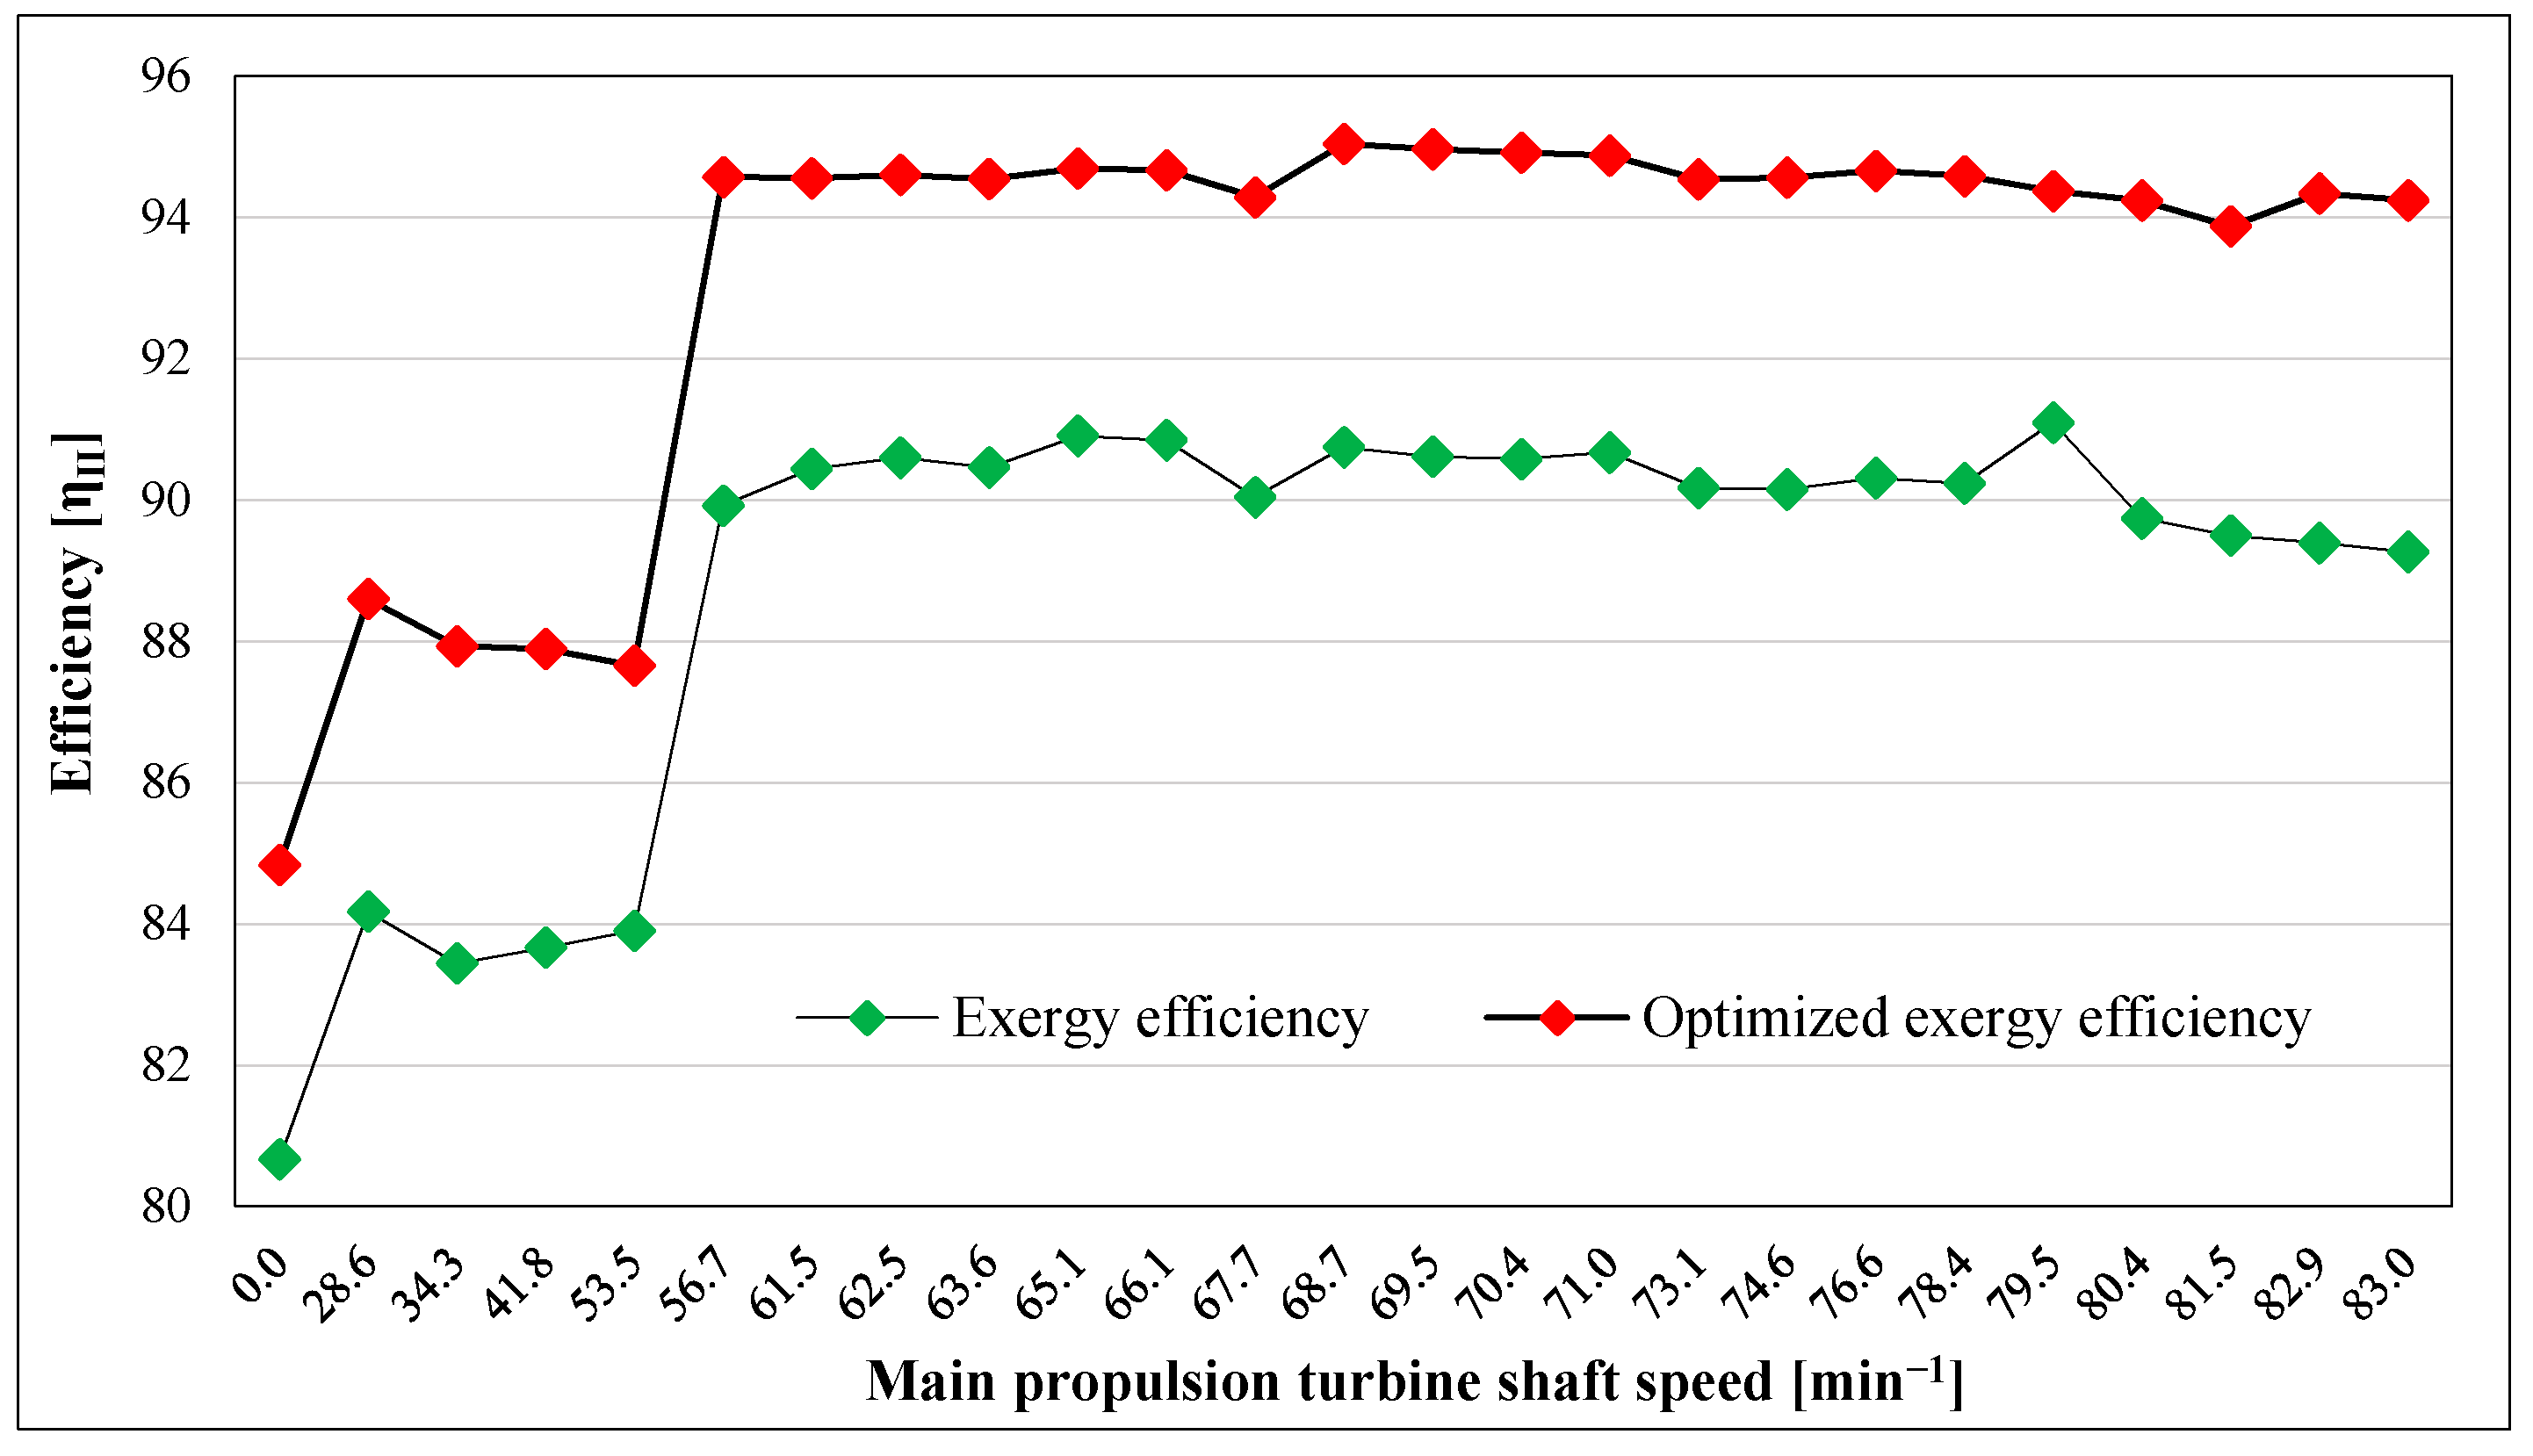
The optimized exergy efficiency of the atmospheric drain tank joining streams is given in Figure 8. The aim of optimization is to achieve the maximum exergy efficiency of the joined exergy streams in the drain tank by calculated exergy fourth-degree polynomial functions. As per the results, better exergy efficiency of the atmospheric drain tank joining streams was achieved in all running ranges of the marine steam propulsion plant. At the maneuvering load of the main propulsion turbine, exergy efficiency increased by about 5%. From 56.7 to 83 min−1 at the main propulsion shaft, exergy efficiency increased by 3% to 4%.
Optimization results indicate that maintaining distillate temperature at the atmospheric drain tank inlet as high as possible is required (Appendix A, Table A4). Maintaining a higher distillate temperature requires consuming distillate from the tank where it is stored from the fresh water generator, as its temperature from the fresh water generator is ~45 °C. This action is avoided in the operation of the marine steam plant due to safety, which means that if the salinity of the distillate water at the fresh water generator increases and the salinity sensor fails, such higher-salinity distillate will be mixed with the distillate in the tank and could cause damage to the main boiler pipes. According to the Unitor guide [47], for medium-pressure boilers, 3–6 MPa chloride content should be less than 30 ppm. The main boiler maker has even stiffer standards; according to Mitsubishi chloride content should be 20 ppm or less [48]. Normal chloride content when the fresh water generator is producing distillate is below 5 ppm. However, a permanent monitoring system is installed for the boiler water onboard the ship, and there is no harm if boiler water is consumed from the distilled tank, where fresh water is coming directly from the fresh water generator. The recommendation is that this method become the norm.
The steam pressure of the contaminated service system is 0.7 MPa and clean condensate system 1 MPa. The ideal temperature of the contaminated condensate steam is 126 °C and clean condensate system 143 °C after phase change. If the service system is overloaded temperatures are lower due to additional cooling of the steam in the heat exchangers. As the temperature of contaminated and clean condensate outlet flow streams is still higher it should not be cooled at 70 °C but should be maintained at a higher temperature of about 90 °C after cooler. Maintaining the higher temperature increase exergy efficiency of the atmospheric drain tank as a direct heater. The control of the condensate temperature after the cooler is simply achieved by throttling the cooling water inlet to the condensate coolers.

8. Conclusions

According to an exergy analysis in port and at lower loads, it is clear that desuperheating water at the fresh water generator line, which comes from the main condenser feed water line, should be kept closed as fresh water generator is not in service and there is no steam for cooling down the fresh water generator. That part of the feed water is led back to the atmospheric drain tank and cools down the condensate inside the tank.
Optimized parameters clearly show that distillate water should be filled in the atmospheric drain tank from the tank that is in use, as optimized temperature is kept all the way at the upper constraint of 40 °C.
Clean and contaminated condensate temperature follow each other under the proposed optimization setup without regard to condensate mass flow, and they should be kept at the condenser outlet at 90 °C, which can be done simply by throttling the cooling water amount to the condensers or fixing an automatic control valve for temperature control at the condenser outlet.
The benefit of such a procedure is that condensate water will enter into the main feed water line with higher exergy potential, which will increase the efficiency of the power plant and save on fuel consumption. Optimizing the atmospheric condenser drain tank is the first step in the process of optimizing the whole feed water section, which will require investigating the interactions of optimized components in real application conditions, which is planned for future research work.

Author Contributions

Conceptualization, I.P. and V.M.; methodology, I.P.; software, I.P.; validation, I.P.; formal analysis, I.P.; investigation, T.B.; resources, T.B.; data curation, I.P.; writing—original draft preparation, I.P.; writing—review and editing, T.B.; visualization, V.M.; supervision, J.O.; project administration, J.O.; funding acquisition, T.B. All authors have read and agreed to the published version of the manuscript.

Funding

This research was supported by the Croatian Science Foundation under project IP-2018–01–3739, CEEPUS network CIII-HR-0108, European Regional Development Fund under grant KK.01.1.1.01.0009 (DATACROSS), project CEKOM under grant KK.01.2.2.03.0004, University of Rijeka scientific grant uniri-tehnic-18-275-1447, University of Rijeka scientific grant uniri-tehnic-18-18-1146 and University of Rijeka scientific grant uniri-tehnic-18-14.

Conflicts of Interest

The authors declare no conflicts of interest.

Nomenclature

E ˙ energy flow, kW
E ˙ L energy loss, kW
S ˙ entropy flow rate, kW/K
e x specific exergy, kJ/kg
E ˙ x exergy flow, kW
E ˙ x d exergy destruction, kW
henthalpy, kJ/k
m ˙ mass flow rate, kg/s
p pressure, Pa
Q ˙ heat flow rate, kW
t temperature, °C
T temperature, K
W ˙ power, kW

Subscript

iinlet
kboundary temperature
ooutlet
0referent temperature

Greek Letter

η I energy efficiency
η I I exergy efficiency

Abbreviations

BOGboil-off gas
HChydrocarbon
HFOheavy fuel oil

Appendix A

Table A1. Fresh water generator condensate, gland steam condenser and first-stage heater pressure condensate, temperature and mass data.
Main Turbine Propulsion Shaft SpeedFresh Water GeneratorGland Steam Condenser1st Stage Feed Water Heater
n (min−1)t (°C)p (MPa) [kg/h]t (°C)p (MPa) (kg/h)t (°C)p (MPa) (kg/h)
0.036.80.7572098.830.097319686.00.5501578
25.634.30.7572098.830.097341790.00.5493351
34.333.30.7572098.830.097346892.00.4523291
41.832.50.7572098.830.097347689.00.5503391
53.533.30.7572098.830.097341083.00.5493522
56.778.70.2284598.830.097341088.00.5493688
61.578.70.2309998.830.097341090.00.5484083
62.578.70.2306098.830.097341090.00.5514013
63.678.70.2302698.830.097341088.00.5484142
65.178.70.2330998.830.097341085.00.5474197
66.178.70.2334298.830.097341084.00.5464296
67.778.70.2332898.830.097341092.00.5464260
68.778.70.2344098.830.097341094.00.0824699
69.578.70.2350098.830.097341095.00.0854652
70.478.70.2355098.830.097341095.50.0874692
71.078.70.2345498.830.097341096.00.0884699
73.178.70.2357098.830.097341097.80.0944893
74.678.70.2375698.830.097341098.70.0975161
76.678.70.2372698.830.097341099.60.1005712
78.478.70.2390698.830.097341099.80.1015952
79.578.70.2385798.830.0973410102.00.1105984
80.478.70.2363998.830.0973410103.00.1146083
81.578.70.2381398.830.0973410103.00.1145887
82.978.70.2375398.830.0973410104.70.1206362
83.078.70.2384798.830.0973410105.00.1216336
Table A2. Contaminated condensate cooler, condensate cooler and distillate water, temperature and mass data.
Main Turbine Propulsion Shaft SpeedContaminated Condensate Cooler FlowCondensate Cooler FlowDistillate Water
n (min−1)t (°C)p (MPa) (kg/h)t (°C)p (MPa) (kg/h)t (°C)p (MPa) (kg/h)
0.0700.55840700.551327290.11561
25.6700.651610700.651607290.11663
34.3700.651540700.651418290.11695
41.8700.651610700.651211290.11653
53.5700.651610700.651294290.11745
56.7700.651610700.651303290.11764
61.5700.651680700.651118290.11793
62.5700.651610700.651425290.11789
63.6700.651680700.651122290.11815
65.1700.651680700.651012290.11822
66.1700.651680700.651128290.11852
67.7700.651680700.651243290.11876
68.7700.651680700.651133290.11865
69.5700.651680700.651249290.11868
70.4700.651680700.651134290.11867
71.0700.651680700.651135290.11861
73.1700.651680700.651021290.11922
74.6700.651680700.651120290.11933
76.6700.651680700.651231290.11939
78.4700.651680700.651122290.11977
79.5700.651680700.651237290.11978
80.4700.651680700.651346290.111000
81.5700.651680700.65358290.111002
82.9700.651610700.652350290.111022
83.0700.651610700.652244290.111032
Table A3. Atmospheric drain tank joining streams.
Main Turbine Propulsion Shaft SpeedAtmospheric Drain Tank Joined Streams
n (min−1)t (°C)p (MPa) (kg/h)
0.0670.115223
25.6730.118349
34.3740.118108
41.8730.118043
53.5700.118302
56.7770.119050
61.5780.1110,290
62.5780.1110,448
63.6780.1110,369
65.1760.1110,325
66.1760.1110,566
67.7780.1110,665
68.7800.1111,051
69.5800.1111,113
70.4810.1111,035
71.0810.1111,035
73.0820.1111,171
74.6820.1111,564
76.6830.1112,220
78.4840.1112,393
79.5850.1112,552
80.4850.1112,777
81.5860.1111,597
82.9850.1114,020
83.0850.1113,961
Table A4. Optimized temperature from contaminated condensate cooler outlet, clean condensate cooler outlet and distillate tank outlet to atmospheric drain tank.
Main Turbine Propulsion Shaft SpeedContaminated Condensate Cooler FlowCondensate Cooler FlowDistillate Water
n (min−1)t (°C)p (MPa) (kg/h)t (°C)p (MPa) (kg/h)t (°C)p (MPa) (kg/h)
0.084.640.5584084.640.551327400.11561
25.690.830.65161090.830.651607400.11663
34.392.570.65154092.570.651418400.11695
41.890.300.65161090.300.651211400.11653
53.584.820.65161084.820.651294400.11745
56.785.750.65161085.750.651303400.11764
61.586.850.65168086.850.651118400.11793
62.586.900.65161086.900.651425400.11789
63.685.740.65168085.740.651122400.11815
65.183.840.65168083.840.651012400.11822
66.183.290.65168083.290.651128400.11852
67.787.860.65168087.860.651243400.11876
68.788.530.65168088.530.651133400.11865
69.589.090.65168089.090.651249400.11868
70.489.370.65168089.370.651134400.11867
71.089.810.65168089.810.651135400.11861
73.190.930.65168090.930.651021400.11922
74.691.550.65168091.550.651120400.11933
76.692.660.65168092.660.651231400.11939
78.492.730.65168092.730.651122400.11977
79.594.380.65168094.380.651237400.11978
80.495.450.65168095.450.651346400.111000
81.594.910.65168094.910.65358400.111002
82.996.910.65161096.910.652350400.111022
83.096.960.65161096.960.652244400.111032

Appendix B

exf(30–100, 0.55) = 0.000000028752·t4 − 0.000017560712·t3 + 0.008183264951·t2 − 0.377604877762·t + 5.038272554766
R2 = 0.999999999544
exf(30–94.151, 0.082) = 0.000000029449·t4 − 0.000017724546·t3 + 0.008198483260·t2 − 0.378158562476·t + 4.575836547896
R2 = 0.999999999420
exf(30–95.444, 0.086) = 0.000000029237·t4 − 0.000017674814·t3 + 0.008194275370·t2 − 0.378007050602·t + 4.577893162052
R2 = 0.999999999452
exf(30–95.759, 0.087) = 0.000000029173·t4 − 0.000017659707·t3 + 0.008192987671·t2 − 0.377960479895·t + 4.578292957558
R2 = 0.999999999452
exf(30–96.071, 0.088) = 0.000000029118·t4 − 0.000017646885·t3 + 0.008191909080·t2 − 0.377921808781·t + 4.578797824676
R2 = 0.999999999455
exf(30–97.885, 0.094) = 0.000000028969·t4 − 0.000017612085·t3 + 0.008188960776·t2 − 0.377816106864·t + 4.583459267439
R2 = 0.999999999472
exf(30–98.757, 0.097) = 0.000000028718·t4 − 0.000017550696·t3 + 0.008183545317·t2 − 0.377613475150·t + 4.583763019346
R2 = 0.999999999433
exf(30–99.606, 0.1) = 0.000000028618·t4 − 0.000017526578·t3 + 0.008181456140·t2 − 0.377536693237·t + 4.585760948106
R2 = 0.999999999452
exf(30–99.884, 0.101) = 0.000000028648·t4 − 0.000017533970·t3 + 0.008182090496·t2 − 0.377559797341·t + 4.587064973324
R2 = 0.999999999442
exf(30–100, 0.11) = 0.000000028714·t4 − 0.000017549625·t3 + 0.008183378488·t2 − 0.377604963571·t + 4.596660891228
R2 = 0.999999999461
exf(30–100, 0.114) = 0.000000028688·t4 − 0.000017543499·t3 + 0.008182856108·t2 − 0.377586423719·t + 4.600440241904
R2 = 0.999999999449
exf(30–100, 0.12) = 0.000000028701·t4 − 0.000017547513·t3 + 0.008183249124·t2 − 0.377603071989·t + 4.606707460725
R2 = 0.999999999451
exf(30–100, 0.121) = 0.000000028681·t4 − 0.000017542259·t3 + 0.008182768307·t2 − 0.377584755059·t + 4.607463940507
R2 = 0.999999999461

References

  1. Aljundi, I.H. Energy and exergy analysis of a steam power plant in Jordan. Appl. Therm. Eng. 2009, 29, 324–328. [Google Scholar] [CrossRef]
  2. Sengupta, S.; Datta, A.; Duttagupta, S. Exergy analysis of a coal-based 210MW thermal power plant. Int. J. Energy Res. 2007, 31, 14–28. [Google Scholar] [CrossRef]
  3. Erdema, H.H.; Akkaya, A.V.; Cetin, B.; Dagdas, A.; Sevilgen, S.H.; Sahin, B.; Teke, I.; Gungor, C.; Atas, S. Comparative energetic and exergetic performance analyses for coal-fired thermal power plants in Turkey. Int. J. Therm. Sci. 2009, 48, 2179–2186. [Google Scholar] [CrossRef]
  4. Wang, L.; Yang, Y.; Morosuk, T.; Tsatsaronis, G. Advanced thermodynamic analysis and evaluation of a supercritical power plant. Energies 2012, 5, 1850–1863. [Google Scholar] [CrossRef]
  5. Ahmadi, G.R.; Toghraie, D. Energy and exergy analysis of Montazeri Steam Power Plant in Iran. Renew. Sustain. Energy Rev. 2016, 56, 454–463. [Google Scholar] [CrossRef]
  6. Ataei, A.; Yoo, C.K. Combined pinch and exergy analysis for energy efficiency optimization in a steam power plant. Int. J. Phys. Sci. 2010, 5, 1110–1123. [Google Scholar]
  7. Toledo, M.; Abugaber, J.; Lugo, R.; Salazar, M.; Rodríguez, A.; Rueda, A. Energetic analysis of two thermal power plants with six and seven heaters. Open J. Appl. Sci. 2014, 4, 6–12. [Google Scholar] [CrossRef] [Green Version]
  8. Mehrabani, K.M.; Yazdi, S.S.F.; Mehrpanahi, A.; Abad, S.N.N. Optimization of exergy in repowering steam power plant by feed water heating using genetic algorithm. Indian J. Sci. Res. 2014, 1, 183–198. [Google Scholar]
  9. Espatolero, S.; Romeo, L.M.; Cortes, C. Efficiency improvement strategies for the feed water heaters network designing in supercritical coal-fired power plants. Appl. Therm. Eng. 2014, 73, 449–460. [Google Scholar] [CrossRef]
  10. Adibhatlaa, S.; Kaushik, S.C. Exergy and thermoeconomic analyses of 500 MWe sub critical thermal power plant with solar aided feed water heating. Appl. Therm. Eng. 2017, 123, 340–352. [Google Scholar] [CrossRef]
  11. Ahmadia, G.; Toghraieb, D.; Akbari, O.A. Solar parallel feed water heating repowering of a steam power plant: A case study in Iran. Renew. Sustain. Energy Rev. 2017, 77, 474–485. [Google Scholar] [CrossRef]
  12. Mohammadi, A.; Ahmadi, M.H.; Bidi, M.; Ghazvini, M.; Ming, T. Exergy and economic analyses of replacing feedwater heaters in a Rankine cycle with parabolic trough collectors. Energy Rep. 2018, 4, 243–251. [Google Scholar] [CrossRef]
  13. Jamel, M.S.; Rahman, A.A.; Shamsuddin, A.H. Advances in the integration of solar thermal energy with conventional and non-conventional power plants. Renew. Sustain. Energy Rev. 2013, 20, 71–81. [Google Scholar] [CrossRef]
  14. Bakos, G.C.; Tsechelidou, C. Solar aided power generation of a 300 MW lignite fired power plant combined with line-focus parabolic trough collectors field. Renew. Energy 2013, 60, 540–547. [Google Scholar] [CrossRef]
  15. Adibhatla, S.; Kaushik, S.C. Energy, exergy, economic and environmental (4E) analyses of a conceptual solar aided coal fired 500 MWe thermal power plant with thermal energy storage option. Sustain. Energy Technol. 2017, 21, 89–99. [Google Scholar] [CrossRef]
  16. Koroglu, T.; Sogut, O.S. Conventional and advanced exergy analyses of a marine steam power plant. Energy J. 2018, 163, 392–403. [Google Scholar] [CrossRef]
  17. Poljak, I.; Glavan, I.; Orović, J.; Mrzljak, V. Three approaches to low-duty turbo compressor efficiency exploitation evaluation. Appl. Sci. 2020, 10, 3373. [Google Scholar] [CrossRef]
  18. Problems Caused by Oil in Boiler Feed Water System. Available online: http://www.gard.no/web/updates/content/51933/problems-caused-by-oil-in-boiler-feed-water-system (accessed on 30 May 2020).
  19. Available online: http://www.duivendijk.net/gas/grace_b1.htm (accessed on 1 April 2020).
  20. Poljak, I.; Grace, B. Machinery Instruction Manual; Hyundai Heavy Industries Ltd.: Caloocan, Philippines, 2007. [Google Scholar]
  21. Holm, J.T. Technical and Research Bulletin 3-11, Marine Steam Power Plant Heat Balance Practices; The Society of Naval Architects and Marine Engineers: Alexandria, VA, USA, 1971; p. 11. [Google Scholar]
  22. ELSTER Messtechnik GmbH, M 100/M 110 Multi-Jet Water Meter Traditional Meter Bodies, for Horizontal Installation, for Risers. Available online: https://www.elster.com/assets/products/products_elster_files/M100_M110 (accessed on 1 April 2020).
  23. Available online: http://www.ic72.com/pdf_file/-/87315.pdf (accessed on 30 May 2020).
  24. Available online: http://www.krtproduct.com/krt_Picture/sample/1_spare%20part/yamatake/Fi_ss01/SS2-DST100-0100.pdf (accessed on 30 May 2020).
  25. Available online: https://www.priggen.com/GTF-601-Pt100-Sheath-Element-Immersion-Probe-for-Liquids-and-Gases-200-to-600C_1 (accessed on 30 May 2020).
  26. Available online: http://hwt0346.51software.net/uploadfiles/2011112919581355.pdf (accessed on 30 May 2020).
  27. Available online: https://www.sika.net/en/products/sensors-and-measuring-instruments/industrial-thermometers/sika-thermometers-industry-and-marine.html (accessed on 30 May 2020).
  28. Available online: https://www.sika.net/en/measuring-by-categories/pressure/mechanical-pressure-gauges/bourdon-tube-pressure-gauges.html (accessed on 30 May 2020).
  29. Zenner International GmbH & Co. KG. Available online: https://partners.sigfox.com/products/edc-sigfox-868-dv (accessed on 30 May 2020).
  30. Available online: https://ashcroft.com/products/pressure_gauges/process_gauges/1259-duragauge.cfm (accessed on 30 May 2020).
  31. Lemmon, E.W.; Huber, M.L.; Mc Linden, M.O. NIST Reference Fluid Thermodynamic and Transport Properties-REFPROP, Version 8.0; User’s Guide: Boulder, CO, USA, 2007. [Google Scholar]
  32. Moran, M.J.; Shapiro, H.N.; Boettner, D.D.; Bailey, M.B. Fundamentals of Engineering Thermodynamics, 7th ed.; John Wiley & Sons: Hoboken, NJ, USA, 2011; pp. 210, 249, 334, 403. [Google Scholar]
  33. Cengel, Y.A.; Boles, M.A. Thermodynamics an Engineering Approach, 8th ed.; McGraw-Hill Education: New York, NY, USA, 2015; pp. 251, 311, 395, 396, 467–468. [Google Scholar]
  34. Kaushik, S.C.; Reddy, V.S.; Tyagi, S.K. Energy and exergy analyses of thermal power plants: A review. Renew. Sustain. Energy Rev. 2011, 15, 1857–1872. [Google Scholar] [CrossRef]
  35. Adibhatla, S.; Kaushik, S.C. Energy and exergy analysis of a super critical thermal power plant at various load conditions under constant and pure sliding pressure operation. Appl. Therm. Eng. 2014, 73, 51–65. [Google Scholar] [CrossRef]
  36. Mrzljak, V.; Poljak, I.; Medica-Viola, V. Dual fuel consumption and efficiency of marine steam generators for the propulsion of LNG carrier. Appl. Therm. Eng. 2017, 119, 331–346. [Google Scholar] [CrossRef]
  37. Mrzljak, V.; Poljak, I.; Mrakovčić, T. Energy and exergy analysis of the turbo-generators and steam turbine for the main feed water pump drive on LNG carrier. Energy Convers. Manag. 2017, 140, 307–323. [Google Scholar] [CrossRef]
  38. Poljak, I.; Orović, J.; Mrzljak, V.; Bernečić, D. Energy and exergy evaluation of a two-stage axial vapour compressor on the LNG carrier. Entropy 2020, 22, 115. [Google Scholar] [CrossRef] [Green Version]
  39. Tolgyessy, J. (Ed.) Part of volume chemistry and biology water. In Studies in Environmental Science; Elsevier Science Publishers: Amsterdam, The Netherlands, 1993; pp. 31–32. [Google Scholar] [CrossRef]
  40. Haseli, Y.; Dincer, I.; Naterer, G.F. Optimum temperatures in a shell and tube condenser with respect to exergy. Int. J. Heat Mass Transf. 2008, 51, 2462–2470. [Google Scholar] [CrossRef]
  41. Bilgili, M.; Ozbek, A.; Yasar, A.; Simsek, E.; Sahin, B. Effect of atmospheric temperature on exergy efficiency and destruction of a typical residential split air conditioning system. Int. J. Exergy 2016, 20, 66–84. [Google Scholar] [CrossRef]
  42. Wagner, W.I.; Pruss, A. The IAPWS Formulation 1995 for the thermodynamic properties of ordinary water substance for general and scientific use. J. Phys. Chem. Ref. Data 2002, 31, 387–535. [Google Scholar] [CrossRef] [Green Version]
  43. Weisstein, E.W. “Least Squares Fitting—Polynomial.” From MathWorld—A Wolfram Web Resource. Available online: https://mathworld.wolfram.com/LeastSquaresFittingPolynomial.html (accessed on 1 April 2020).
  44. Kenney, J.F.; Keeping, E.S. Linear of statistics and correlation. In Mathematics of Statistics, 3rd ed.; Princeton: Princeton, NJ, USA, 1962; Available online: https://mathworld.wolfram.com/LeastSquaresFitting.html (accessed on 1 April 2020).
  45. Aldrovandi, R. Special Matrices of Mathematical Physics: Stochastic, Circulant and Bell Matrices; World Scientific: Singapore, 2001; p. 193. [Google Scholar]
  46. Fylstra, D.; Lasdon, L.; Watson, J.; Waren, A. Design and use of the microsoft excel solver. INFORMS J. Appl. Anal. 1998, 28, 29–55. [Google Scholar] [CrossRef] [Green Version]
  47. Water Treatment Handbook a Practical Application Manual, 1st ed.; UNITOR: Oslo, Norway, 1996; p. 45. Available online: http://slidepdf.com/reader/full/wilhemsen-water-treatment-handbook (accessed on 1 April 2020).
  48. Nakano, K. Boiler Instruction and Maintenance Manual I; Mitsubishi Heavy Industries LTD: Tokyo, Japan, 2005; Internal vessel document; p. 28. [Google Scholar]
Figure 1. Marine steamship steam plant with highlighted condensate section.
Jmse 08 00568 g001
Figure 2. Feed water allotment with atmospheric drain tank.
Jmse 08 00568 g002
Figure 3. Energy flow of atmospheric drain tank with main turbine load variation.
Jmse 08 00568 g003
Figure 4. Exergy flow of atmospheric drain tank with main turbine load variation.
Jmse 08 00568 g004
Figure 5. Exergy flow of atmospheric drain tank with main turbine load variation.
Jmse 08 00568 g005
Figure 6. Atmospheric drain tank condensate ratio in mixing point with feed water with main turbine load variation.
Jmse 08 00568 g006
Figure 7. Exergy efficiency with surrounding temperature changes.
Jmse 08 00568 g007
Figure 8. Optimized exergy efficiency of the atmospheric drain tank joining streams.
Jmse 08 00568 g008
Table 1. Steam propulsion plant main characteristics.
EquipmentSize
Main turbine power29,420 kW
Main condenser vacuum38 mm Hg, at 27 °C of seawater
Turbo generator2 × 3850 kW
Feed pump570 kW
Main boiler, steam generation2 × 70,000 kg/h
Table 2. Standard marine data collecting equipment.
ComponentMeasuring Equipment
1. Desuperheating outlet steam pressure1. Pressure transmitter Yamatake STG940 [23]
2. Steam mass flow2. Differential pressure transmitter Yamatake JTD960A [24]
3. Desuperheating steam outlet temperature3. Greisinger GTF 601-Pt100-immersion probe [25]
4. Main propulsion turbine shaft power and rpm4. Kyma shaft power meter, Model KPM-PFS [26]
5. First-stage feed heater temperature5. SIKA thermometers for industry and marine sector [27]
6. Gland seal condenser temperature6. SIKA thermometers for industry and marine sector [27]
7. Gland seal condenser pressure7. Differential pressure transmitter Yamatake JTD960A [24]
8. Distillate water temperature gauge8. SIKA thermometers for industry and marine sector [27]
9. Fresh water generator temperature gauge9. SIKA thermometers for industry and marine sector [27]
10. Contaminated and clean condensate temperature gauge10. SIKA thermometers for industry and marine sector [27]
11. Atmospheric drain tank temperature11. SIKA thermometers for industry and marine sector [27]
12. 1st stage feed water pressure gauge12. SIKA pressure gauges, type MRE-M and MRE-g [28]
13. Fresh water generator distillate flow meter13. Zenner international GmbH [29]
14. Fresh water generator pressure gauge14. Type 1259 Process Pressure Gauge—Ashcroft [30]

