Article

Physico-Chemical Characterization of Two Portuguese Coastal Systems: Ria de Alvor and Mira Estuary

Centre for Environmental and Marine Studies, Physics Department, University of Aveiro, 3810-193 Aveiro, Portugal
*
Author to whom correspondence should be addressed.
J. Mar. Sci. Eng. 2020, 8(7), 537; https://doi.org/10.3390/jmse8070537
Submission received: 1 July 2020 / Revised: 16 July 2020 / Accepted: 17 July 2020 / Published: 19 July 2020
(This article belongs to the Section Physical Oceanography)

Abstract

:
The present study aims to research the physico-chemical processes in two under-researched coastal systems located on the west and south Portuguese coast—Mira Estuary and Ria de Alvor—through the development and exploitation of dedicated coupled physical and water quality models. Both systems are highly dynamic, supporting a wide range of biological diversity; however, they are characterized by distinct environmental and oceanographic conditions, enhancing the importance of a comparative approach. In this context, the Delft3D modeling suite was implemented and successfully calibrated and validated for both systems, accurately reproducing their hydrodynamic, hydrographic, and chemical features. A broad characterization of Mira Estuary and Ria de Alvor was carried out. Results show that the tidal wave interacts differently with the different geomorphology of each estuary. The tidal wave amplitude decreases as it propagates upstream for both estuaries; however, the magnitude for Ria de Alvor is higher. A flood tidal dominance was found for Mira Estuary, allowing the transport of well-oxygenated water into the estuary, contributing to high residence times in the middle estuary and therefore to poor dissolved oxygen (DO) replenishment. Ria de Alvor shifts from ebb dominance at the central area to flood dominance upstream with low residence times, allowing an effective exchange of water properties. Results also reveal that the water temperature is the dominant driver of seasonal dissolved oxygen variations in both estuaries, with the lowest levels occurring during the late summer months when the water temperature is highest. In addition, pH is influenced by biological activity and freshwater inflow.

1. Introduction

Coastal systems are very important interface areas between land and open sea, supporting productive ecosystems. These systems are highly dynamic and have high biological diversity, providing valuable ecosystem services including nutrient recycling, natural conditions for aquaculture practices, nursery (especially for fish species), and the removal of pollutants [1,2].
Nowadays, there is a growing interest in studying estuarine systems, especially their functioning and evolution, using novel dedicated coupled physical–biological models [3,4]. These models constitute valuable tools that complement observational gaps and provide continuous estimates and forecasts of the water state. Indeed, assessing coastal systems’ water quality is an increasingly important area of scientific, socio-economic, and political interest, providing crucial information for decision-makers.
Several estuarine systems located on the Portuguese coast have been widely studied in the past with a focus on processes inherent to different scientific areas, such as Tagus estuary [5,6], Minho and Lima estuaries [7], and Ria de Aveiro [8,9,10], among others. However, the study of the smallest estuarine systems has been neglected, despite its extreme importance as valuable local resources, such as Mira Estuary and Ria de Alvor. These coastal systems are located on the Portuguese west (Alentejo) and south (Algarve) coasts, respectively, and therefore, they are subjected to different environmental and oceanographic forcing conditions. According to the European Water Framework Directive, Mira Estuary is classified as a transitional system, since it is partly saline due to the proximity of coastal waters but is substantially influenced by freshwater flows. It is considered a mesotidal well-mixed estuary, and three water bodies were identified. This estuary is located in a region with relatively low anthropogenic pressure [11] and constitutes part of the Sudoeste Alentejano and Costa Vicentina Natural Park protected area. Ria de Alvor, due to the low freshwater input, is considered a coastal system with a single water body and a mesotidal shallow lagoon. Unlike Mira Estuary, Ria de Alvor is exposed to strong anthropogenic pressures, due to the growing tourism, urban, and industrial development. Ria de Alvor is considered a priority area for conservation, being a Ramsar site (Ramsar Convention: https://www.ramsar.org/) since 1996 and is part of the European Ecological Network, Natura 2000, as a Special Area of Conservation [2]. Therefore, the study of such different estuaries with their proper characteristics and consequent distinct physico-chemical processes becomes relevant to understand not only their functioning but also to give important hints about the understanding of the smallest estuarine systems. Mira Estuary has been studied in biological terms through the analysis of saltmarshes and seagrass beds processes [11,12], although there is an evident lack of information regarding physical properties. Bearing in mind the dependence of biological/chemical processes on physical interactions, it is crucial to understand and connect these processes with the estuaries’ dynamics.
The Ria de Alvor has only been the subject of a limited number of published studies [1,2,13], with none considering simultaneously its physical, biogeochemical, and ecological features.
The high dependence of biological, chemical, and geological processes on the hydrodynamics of these systems requires extensive databases on water quality parameters and physical properties for their integrated study to be possible.
Portraying the need to fill these gaps, this work intends to deepen the importance of numerical tools to perform studies that bring together the physical and chemical processes where observational data is scarce, especially in poorly studied estuarine systems, such as Mira Estuary and Ria de Alvor (Figure 1). In this context, a coupled physico-chemical model was implemented, calibrated, and validated for each system, to perform a broader characterization of Mira Estuary and Ria de Alvor, in terms of their tidal, hydrographic, and water quality components and thus contribute to improve the current understanding about the functioning of these systems. In the frame of this study, field data were collected in each system for model calibration and validation purposes.

2. Study Area

2.1. Mira Estuary

The Mira Estuary (Figure 1A) is a small shallow system (2 km2) located in the south region of the Portuguese western coast, extending between Vila Nova de Milfontes at the mouth and Odemira at its upper limit. It is a narrow-entrenched system, that stretches over 40 km inland on a single channel [13]. Mira Estuary has an average depth of 6 m, with the maximum depths of approximately 20 m observed at the Vila Nova de Milfontes bridge (2 km from the mouth) and between 8 and 10 m upstream [14]. Tides are semidiurnal, with an amplitude of about 1 m during neap tides and 3 m during spring tides [12,15].
The discharge of the Mira River is highly seasonal and controlled mainly by the Santa Clara dam, which is located 60 km upstream. Since the construction of the dam, sediment of marine origin has tended to occur in the estuary lower reaches [14]. The river discharge ranges from 18 m3/s in winter and 1 m3/s in summer, according to the climatology (30 years) performed through data provided by the Swedish Meteorological and Hydrological Institute (SMHI) for the Mira watershed.
The Mira Estuary comprises an area of 258 ha of salt marsh, of which 250 have been proposed for aquaculture [12]. It has high conservation status, since the entire estuary is part of a protected nature area (Parque Natural do Sudoeste Alentejano e Costa Vicentina), which limits fishing activities.

2.2. Ria de Alvor

The Ria de Alvor is a shallow estuary located on Lagos Bay, Portugal’s southern coastal region (Algarve), and in comparison with Mira Estuary, it occupies a wider area (15 km2) [2]. The average depth of the lagoon is 10 m; however, outside of the navigation channel, the Ria has a maximum depth of 2 m (Figure 1B). The Ria de Alvor bathymetry is more uniform when compared with the lower Mira Estuary bathymetry, once the main channel of Ria de Alvor is extensively dredged to maintain navigability to the recreational and fishing port of Alvor. Tides are semidiurnal, with a mean spring tidal range of 2.8 m in Lagos Bay [2].
Ria de Alvor is a tidally dominated lagoon, being classified as a mesotidal system (2–4 m of amplitude) with reduced inflow of freshwater [2,13] from four tributaries: Ribeira Farelo and Ribeira Torre, which drain at the east margin, and Ribeira de Odiáxere and Rio Arão, which drain at the west margin. According to the climatology computed from the data provided by the SMHI, the freshwater input in Ria de Alvor is 2.1 (3.2) m3/s in winter and 0.02 (0.04) m3/s in summer at the east (west) branch. The system is considered euhaline, since salinity values range from 30 to < 40 [2], conversely to Mira Estuary, whose salinity ranges from 0 (freshwater) at the upper estuary to >30 (euhaline) near the estuary mouth [16].

3. Methods and Data

3.1. Field Data Acquisition

In situ monitoring was collected in the frame of this study in each estuary in order to obtain the data required for model calibration and validation purposes. For Mira Estuary, a two-day (25–26 September 2019) sampling field survey was carried on to collect physico-chemical parameters (water level, salinity, water temperature, dissolved oxygen (DO), and pH), with hourly measurements during a tidal cycle. Three stations were considered to represent the spatial variability of the parameters collected: Marina (M1), Moinho da Asneira (M2), and Casa Branca (M3), whose locations are represented in Figure 1A. For the Ria de Alvor, a sampling survey was performed during a tidal cycle on 25 October 2018 at two stations: Cais Quinta da Rocha (A1) and Vila de Alvor (A2) (Figure 1B). The parameters measured were water level, current velocity (u and v components), salinity, water temperature, oxygen, and pH.
According to the instruments’ availability, the parameters were measured either on the surface or along the water column. DO and pH are surface measurements for all sampling stations. At stations A2, M1, and M3, the water temperature and salinity were measured along the water column as the current velocity for station A1. Finally, at A1 and M2, the salinity and water temperature were measured at the surface. The properties collected along the water column were revealed to be homogeneous, and therefore, a depth-averaged value was assumed for comparison with model predictions.

3.2. Model Description and Set Up

The Delft3D modeling suite, developed by WL|Delft Hydraulic (in cooperation with the Delft University of Technology) was implemented in Mira Estuary and Ria de Alvor to characterize both coastal systems in terms of their physico-chemical parameters. The model consists of several integrated modules simulating the hydrodynamic flow (shallow water assumption), the transport of heat, salt, and tracers, and the modeling of ecological processes and water quality parameters. Delft3D-FLOW is the hydrodynamic module and solves the 3D baroclinic Navier-Stokes and transport equations under the Boussinesq assumption. A detailed description of this model can be found in [17]. Delft3D-WAQ is the water quality module and computes the mass balance of selected substances (i.e., state variables), for each computational cell, assuring the mass conservation principle [18]. It considers mass-driven transport by advection and dispersion, as the last is derived from the Delft3D-FLOW hydrodynamic model. The present work applied both hydrodynamics with heat, salt, and tracers transport (Delft3D-FLOW) and water quality (Delft3D-WAQ) modules.
Curvilinear grids were developed for both systems allowing a variable resolution, depending on the region of interest. For Mira Estuary, the grid has a coarser resolution at the offshore boundary (100–450 m) and a finer resolution inside the estuary (10–50 m). For Ria de Alvor, the grid resolution ranges from 50 to 300 m at the offshore boundary and between 20 and 40 m inside the estuary. The implementations consider a 2D depth-averaged approximation, since both systems are usually considered vertically homogeneous [2,14].
The offshore bathymetries result from the interpolation of the Digital Model Terrain, EMODnet data, with a resolution of approximately 115 × 115 m, while inside the estuaries, the bathymetric data come from the application of LIDAR technology for Ria de Alvor and from a joint survey carried out by Hidromod (https://hidromod.com/home-pt/ [19]) and Maretec (http://www.maretec.org/ [20]) for Mira Estuary.
At the ocean open boundary of each estuarine implementation, the model uses 13 harmonic constituents gathered from OSU TOPEX/Poseidon Global Inverse Solution (https://sealevel.jpl.nasa.gov/missions/topex/ [21]) along with water temperature, salinity, pH, chlorophyll, nutrients, and DO concentration from the Atlantic Iberian Biscay Irish Ocean model provided by Copernicus Marine Environment Monitoring Service (CMEMS - https://marine.copernicus.eu/ [22]).
For Mira Estuary, the model developed considers one freshwater source, the Mira River, while for Ria de Alvor, it considers four freshwater sources: Ribeira Farelo, Ribeira Torre, Ribeira de Odiáxere, and Rio Arão. The discharges and water properties considered correspond to the climatology computed for 30 years provided by the watershed model of the SNIRH (https://snirh.apambiente.pt/ [23]).
The atmospheric forcing imposed at the air–sea interface in both cases consists of surface air temperature, relative humidity, and net solar radiation gathered from the European Centre for Medium-Range Weather Forecasts (ECMWF, www.ecmwf.int [24]), which provides global reanalysis.
Regarding the FLOW module, computational time steps of 0.25 and 0.5 min were chosen for Mira Estuary and Ria de Alvor, respectively, to guarantee the stability and accuracy of the numerical results. For the WAQ module, a time step of 5 min was used for both systems.

3.3. Model Calibration and Validation

To evaluate the model’s performance and guarantee its accuracy in reproducing the physical and chemical features of both estuaries, several simulations were set up testing the model-free parameters until achieving stable and reliable model solutions. Afterwards, a large number of simulations were done, changing the bottom roughness, until the best fit is found between model results and the in situ data acquired in the sampling surveys. Finally, the model accuracy was quantified using the root mean square error (RMSE) metrics. Attending to the focus of this research, only the results enforcing the model skill in reproducing the observed variables will be further discussed.
Regarding the FLOW module, the bottom roughness was the main parameter used to optimize the fitting between model results and in situ data. At Ria de Alvor, a constant manning value of 0.024 was assumed for bottom roughness, while for Mira Estuary, the bottom roughness was estimated with a dynamic coefficient of friction [25], which is determined at each model time step. Two distinct bottom roughness methodologies were applied due to the different geomorphologic characteristics of both estuaries. Mira Estuary has a more complex bathymetry than Ria de Alvor, with sandbanks and deep regions in the lower part of the estuary; therefore, dynamic friction coefficient produces better agreement with the observed data.
For the WAQ module, the main parameters used to obtain the best model results accuracy are listed in Table 1, as well as the value selected to represent each study region.

3.4. Estuaries Characterization

The model was used to characterize both estuaries in terms of astronomical tide propagation through the determination of their main harmonic constituents (M2, S2, K1, O1, M4 and M6), tidal asymmetry and tidal prism, residence time, freshwater fraction, and variability of physico-chemical parameters.
The harmonic analysis procedure was performed using the t_tide matlab® package of Pawlowicz [26]. The relative importance of diurnal and semidiurnal constituents is determined through the Form Factor ( FF = ( AO 1 + AK 1 ) / ( AM 2 + AS 2 ) , which is derived from the harmonic analysis results [27] where AO 1 , AK 1 , AM 2 and AS 2 are the amplitude in meters of the correspondent constituents.
The tidal asymmetry was evaluated through the Amplitude Ratio ( Ar = AM 4 / AM 2 ), which reflects the magnitude of the tidal distortion generated within the estuary, and the Relative Phase ( φ = 2 θ M 2 θ M 4 ), which determines the type of tidal distortion (flood or ebb dominance). AM 2 AM 2 and AM 4 AM 4 are the amplitude of M2 and M4, and θ M 2 and θ M 4 are the respective phases. Both variables were computed for Ria de Alvor and Mira Estuary throughout the channels axis, as tidal levels exhibit very small variations across the channels. This methodology was based on [28], which computed the tidal asymmetry parameters for Ria de Aveiro throughout the axis of the four main channels of the lagoon. The tidal prism was also computed and corresponds to the volumetric flux passing through a cross-section located at the estuaries mouth in a flooding/ebbing cycle, during spring and neap tides.
The mean residence time and the freshwater fraction were computed and mapped in each grid cell for winter (December, January, February: DJF) and summer (June, July, and August: JJA) seasons. The mean residence time represents the necessary time for the conservative tracers’ concentration, in the interest domain, to decrease to 1/e (approximately 37%) of its initial concentration [29,30], either by moving from the original location or exporting to the ocean. According to [31], releasing the tracers during low tide in the model resulted in a higher residence time compared to high tide. Therefore, for a better comparison among seasons, both simulations considered initial high tide conditions.
The freshwater fraction ( F = ( S 0 S ) / S 0 ) is calculated by comparing the estuarine salinity (S) with the salinity of seawater (S0) [32]. The salinity of seawater used herein corresponds to the average values imposed in the open boundaries provided by CMEMS. The physico-chemical characterization was performed through the assessment of the seasonal and annual variability of water temperature, salinity, DO, and pH. Therefore, the monthly mean of these variables was computed for both estuaries at the red dots represented in Figure 1. The annual mean was also computed for each variable in every grid cell. Moreover, the relation between DO content and residence time was accessed for the black dots presented in Figure 1.

4. Results

4.1. Model Calibration and Validation

As previously referred, only the results representing the best fit between model results and observations are presented in this section.
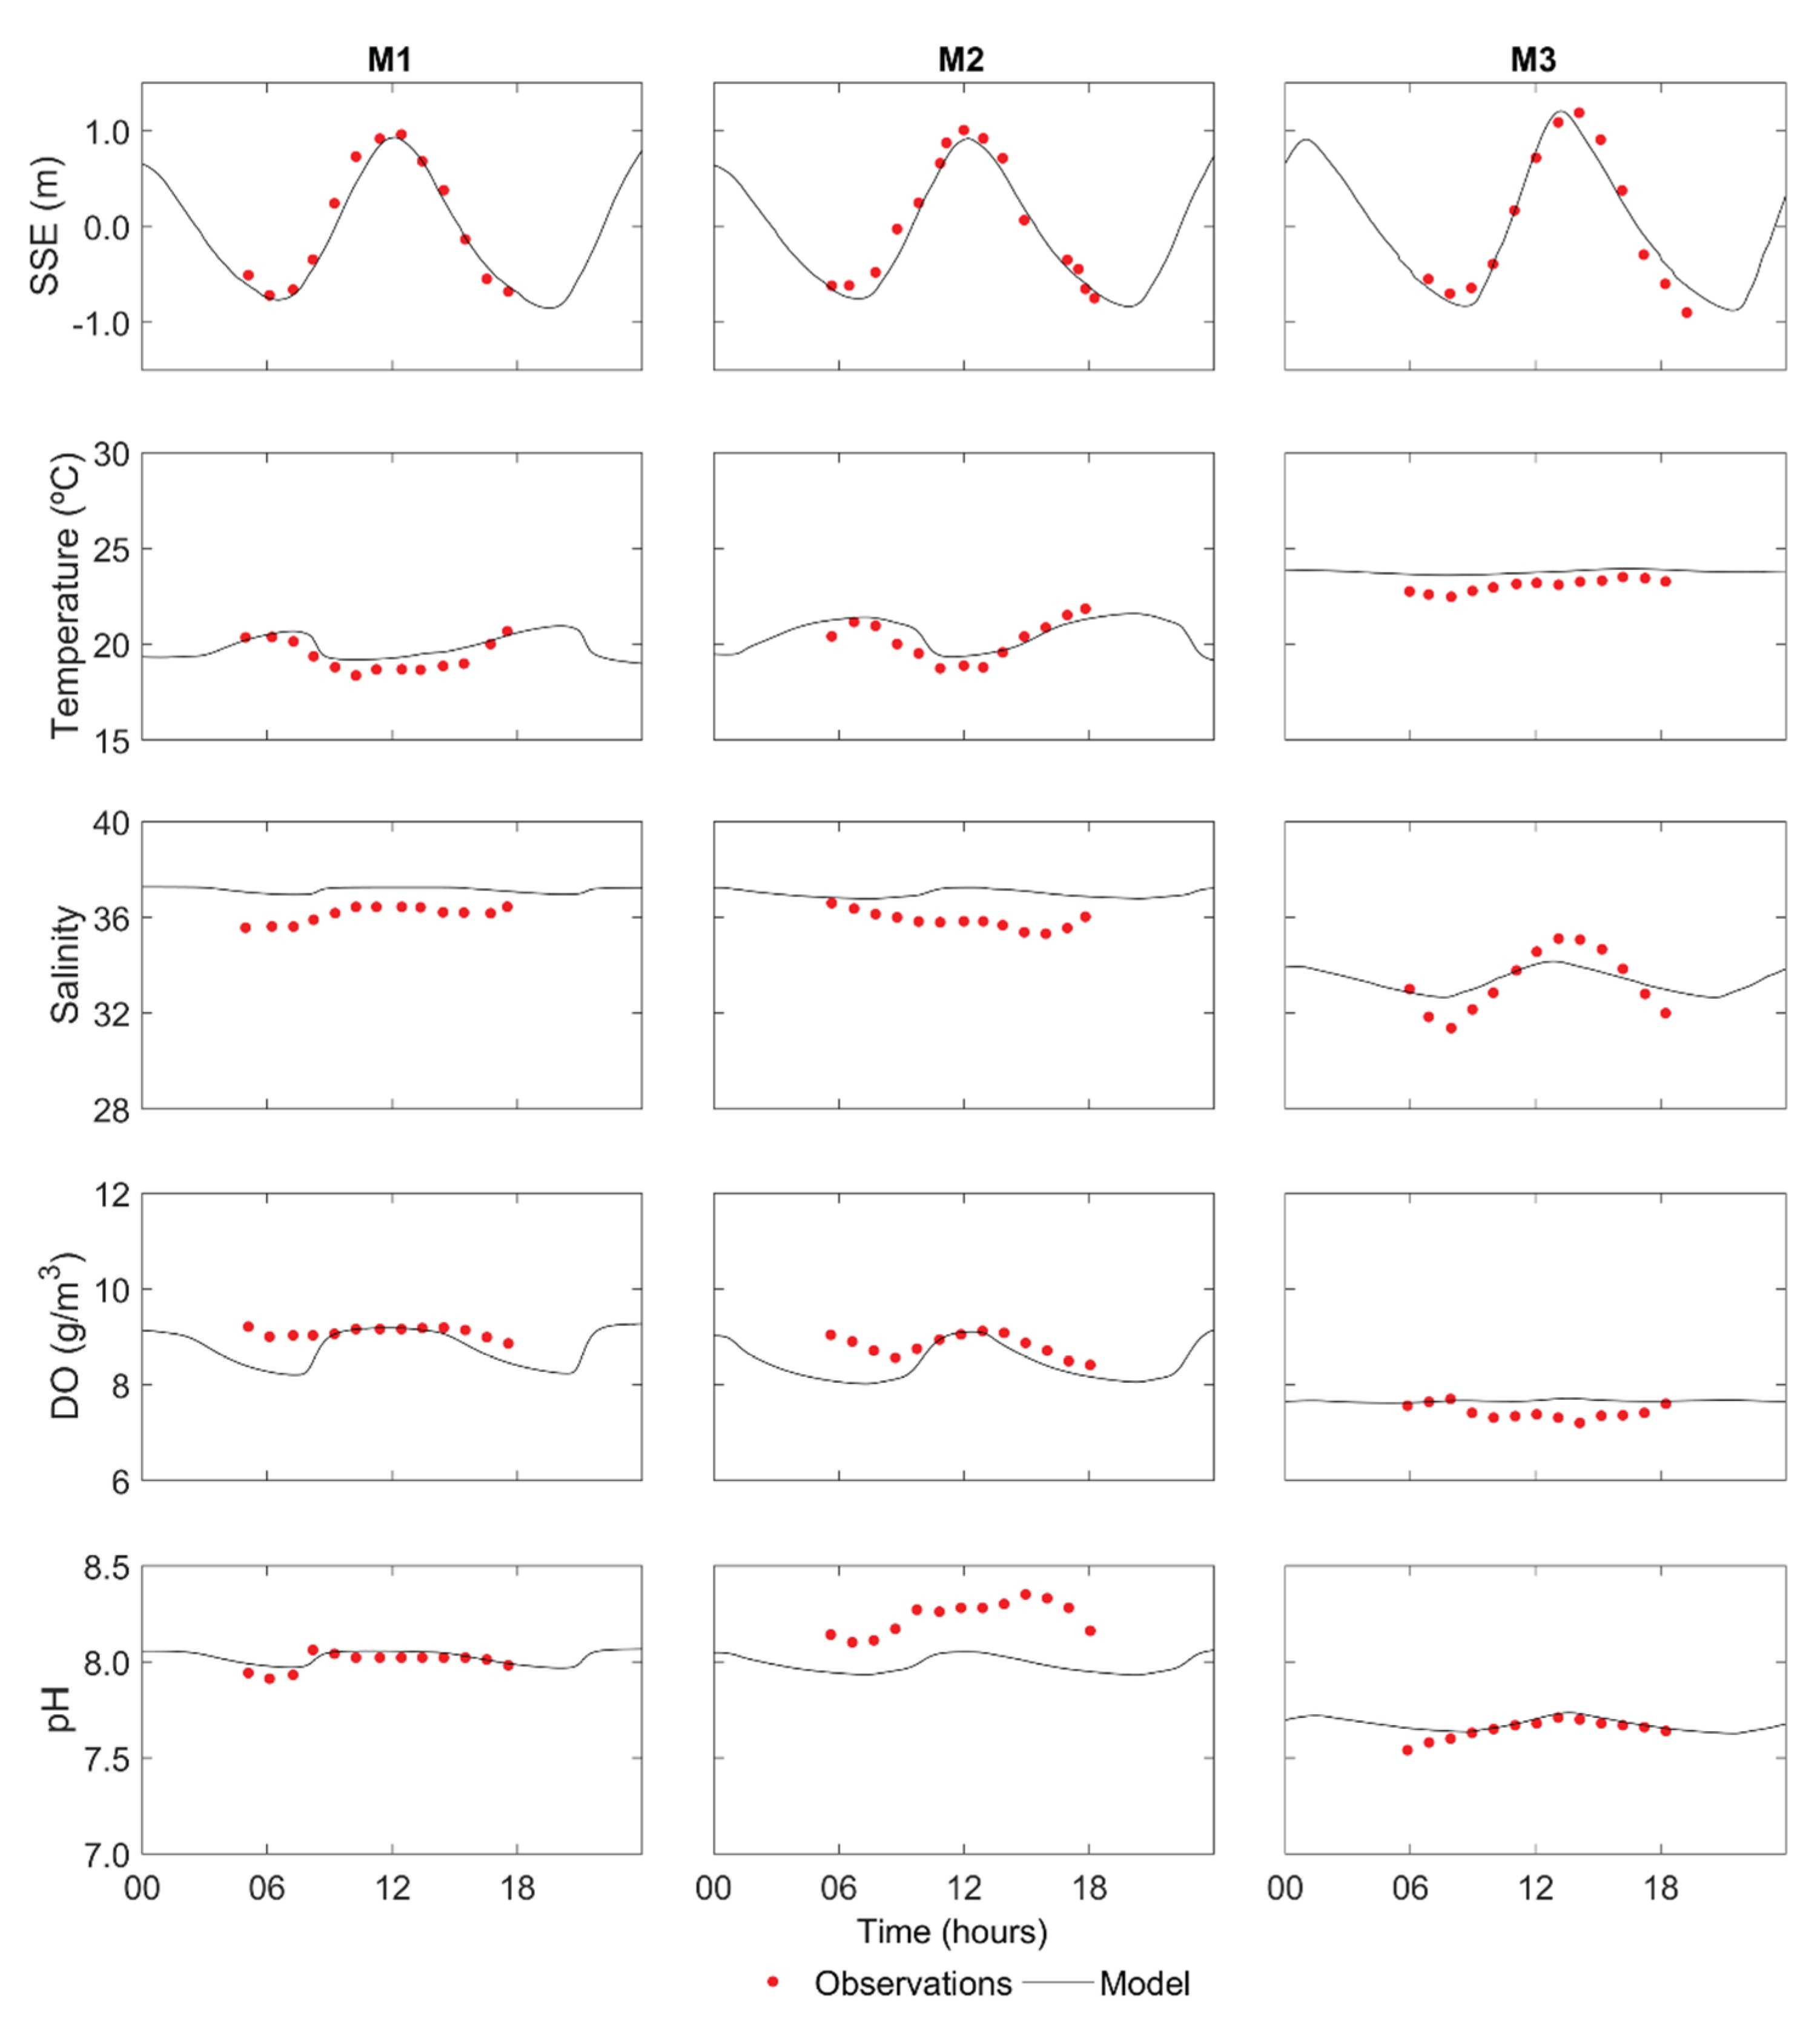
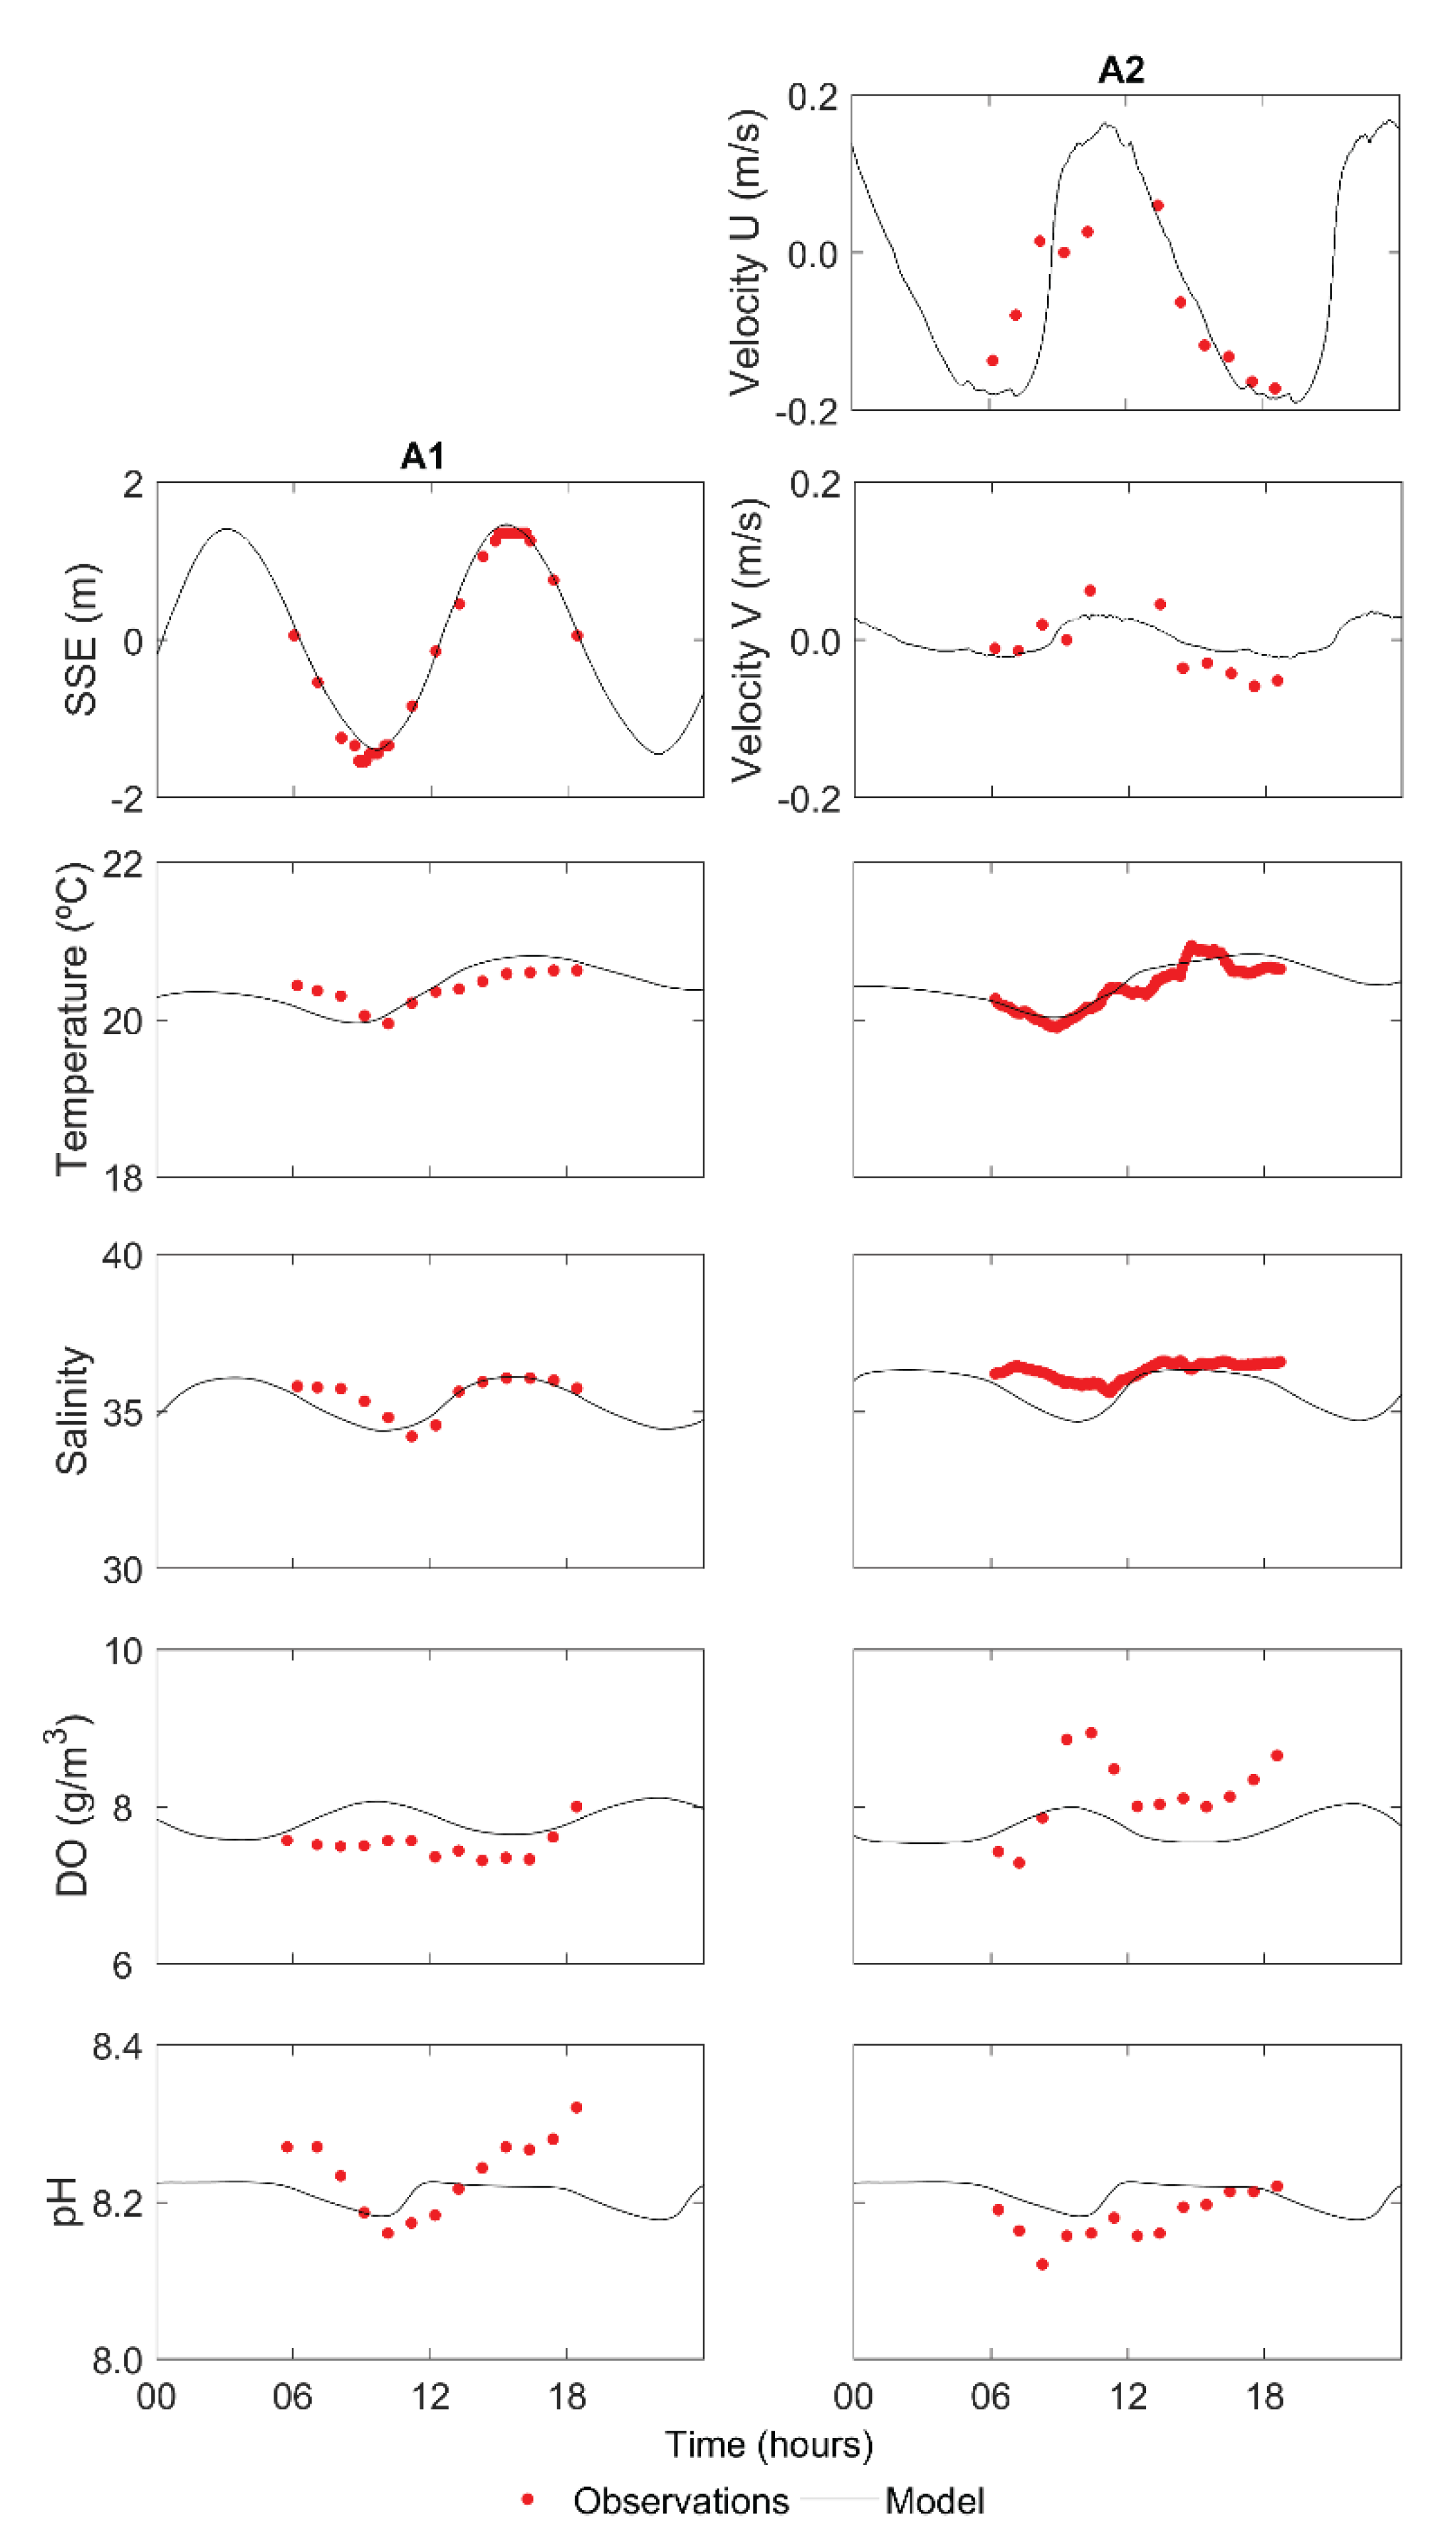
The results for Mira Estuary and Ria de Alvor are portrayed in Figure 2 and Figure 3, respectively, considering hydrodynamic (sea surface elevation (SSE) and current velocity—u and v components), salt and heat (salinity and water temperature) and water quality (DO and pH) parameters. The RMSE between model results and observed variables are shown in Table 2.
For Mira Estuary (Figure 2), the results suggest a good agreement between model results and observed SSE at all stations, both in amplitude and phase, with RMSE values between 0.13 m near the mouth and 0.16 m upstream, which represents approximately 6% to 8% of the local tidal range, respectively. For water temperature, a very good agreement was achieved, with an RMSE lower than 0.8 °C at all the stations. Salinity follows the general trend of the field data, and the highest RMSE was 1.21 at M2 station.
For water quality parameters, an RMSE lower than 0.50 g/m3 was achieved for the DO at all stations, which reveals good agreement between model results and observations. An excellent agreement was found for pH at stations M1 and M3 with a RMSE of 0.04, whereas a good agreement at station M2 was obtained with an RMSE of 0.26.
Regarding Ria de Alvor (Figure 3), the model accurately reproduces SSE, with an RMSE of 0.13 m (4% of the local tidal range) and both components of current velocity, with an RMSE of 0.13 m/s and 0.03 m/s for u and v components, respectively. The results also suggest a very good fit between water temperature and salinity for both stations, the RMSE being lower than 0.5 °C for the temperature and lower than 1 for salinity. For the water quality parameters, a very good agreement was found for DO, with RMSE values of 0.38 and 0.62 for A1 and A2 stations, respectively. For pH, an excellent agreement was found, with errors around 0.05 for both stations.
Overall, the models were successfully implemented, calibrated, and validated for both estuaries, being able to accurately reproduce the tidal cycle evolution of all variables under analysis.

4.2. Tidal Characterization

4.2.1. Tidal Constituents

To characterize the tidal propagation at Mira Estuary and Ria de Alvor, the main tidal constituents observed at the Portuguese coast [33] and the Form Factor (FF) were computed in every grid cell and presented in Table 3 for several points located at the axis of the navigation channels of each estuary (blue dots in Figure 1).
For Mira Estuary, at the mouth, the principal lunar semidiurnal constituent (M2) has an amplitude of approximately 0.64 m, which slightly decreases upstream, reaching 0.51 m at the far end of the channel. The phase increases from 82° at the mouth to 128° upstream, meaning a delay of approximately 95 min. Relative to the principal solar semidiurnal constituent (S2), its amplitude decreases from 0.18 m at the mouth to 0.14 m upstream, and a phase lag of approximately 107 min is observed.
For both diurnal constituents, K1 and O1, it is observed that their amplitude is almost constant throughout the estuary, 0.07 and 0.05, respectively. Additionally, a delay of more than 100 min is found for both constituents, from the lower to the upper estuary. The M4 constituent amplitude is almost constant throughout the estuary (0.10 m), and a phase lag of 68 min is detected between the estuary mouth and the end of the channel. Lastly, for the M6 constituent, the amplitude is almost constant throughout the estuary (0.01 m), only increasing to 0.02 m in the upper estuary. In addition, over 200 min of delay is observed upstream. It is noteworthy that for the M2, M4, and S2, the amplitude slightly decreases at PM2 in the surrounding region, increasing at PM3.
For Ria de Alvor, the amplitude of the M2 constituent is approximately 1 m in the central region, decreasing to 0.67 m at the far end of the west channel (PA4) and to 0.97 m at the far end of the east channel (PA6). A slight phase delay is also observed between the Ria de Alvor mouth and the upstream regions: 11 min for the west branch and 19 min for the east branch. A similar pattern is observed for S2 constituent, with a decrease in the amplitude of 0.03 m (0.02 m) and in the phase of 16 min (27 min) from the mouth to the west branch (east branch) of Ria de Alvor. As in Mira Estuary, the amplitude of the diurnal constituents remains constant throughout the estuary (0.08 m for K1 and 0.06 m for O1), and the phase decrease 31 min (40 min) for K1 and 38 min (44 min) for O1 for the west branch (east branch). The amplitude of the M4 constituent increases from 0.02 m at the mouth to 0.04 m at the west branch and 0.07 m for the east branch. Moreover, a phase delay of approximately 65 min is observed from the mouth to the end of both west and east channels. Relative to the M6 constituent, its amplitude is 0.001 m at the mouth increasing upstream to 0.009 and 0.017 m at PA4 and PA6, respectively, and a phase delay of more than 190 min is observed.
According to the Form Factor results (Table 2), both estuaries are considered semidiurnal since 0 < FF < 0.25 [27].

4.2.2. Tidal Asymmetry and Tidal Prism

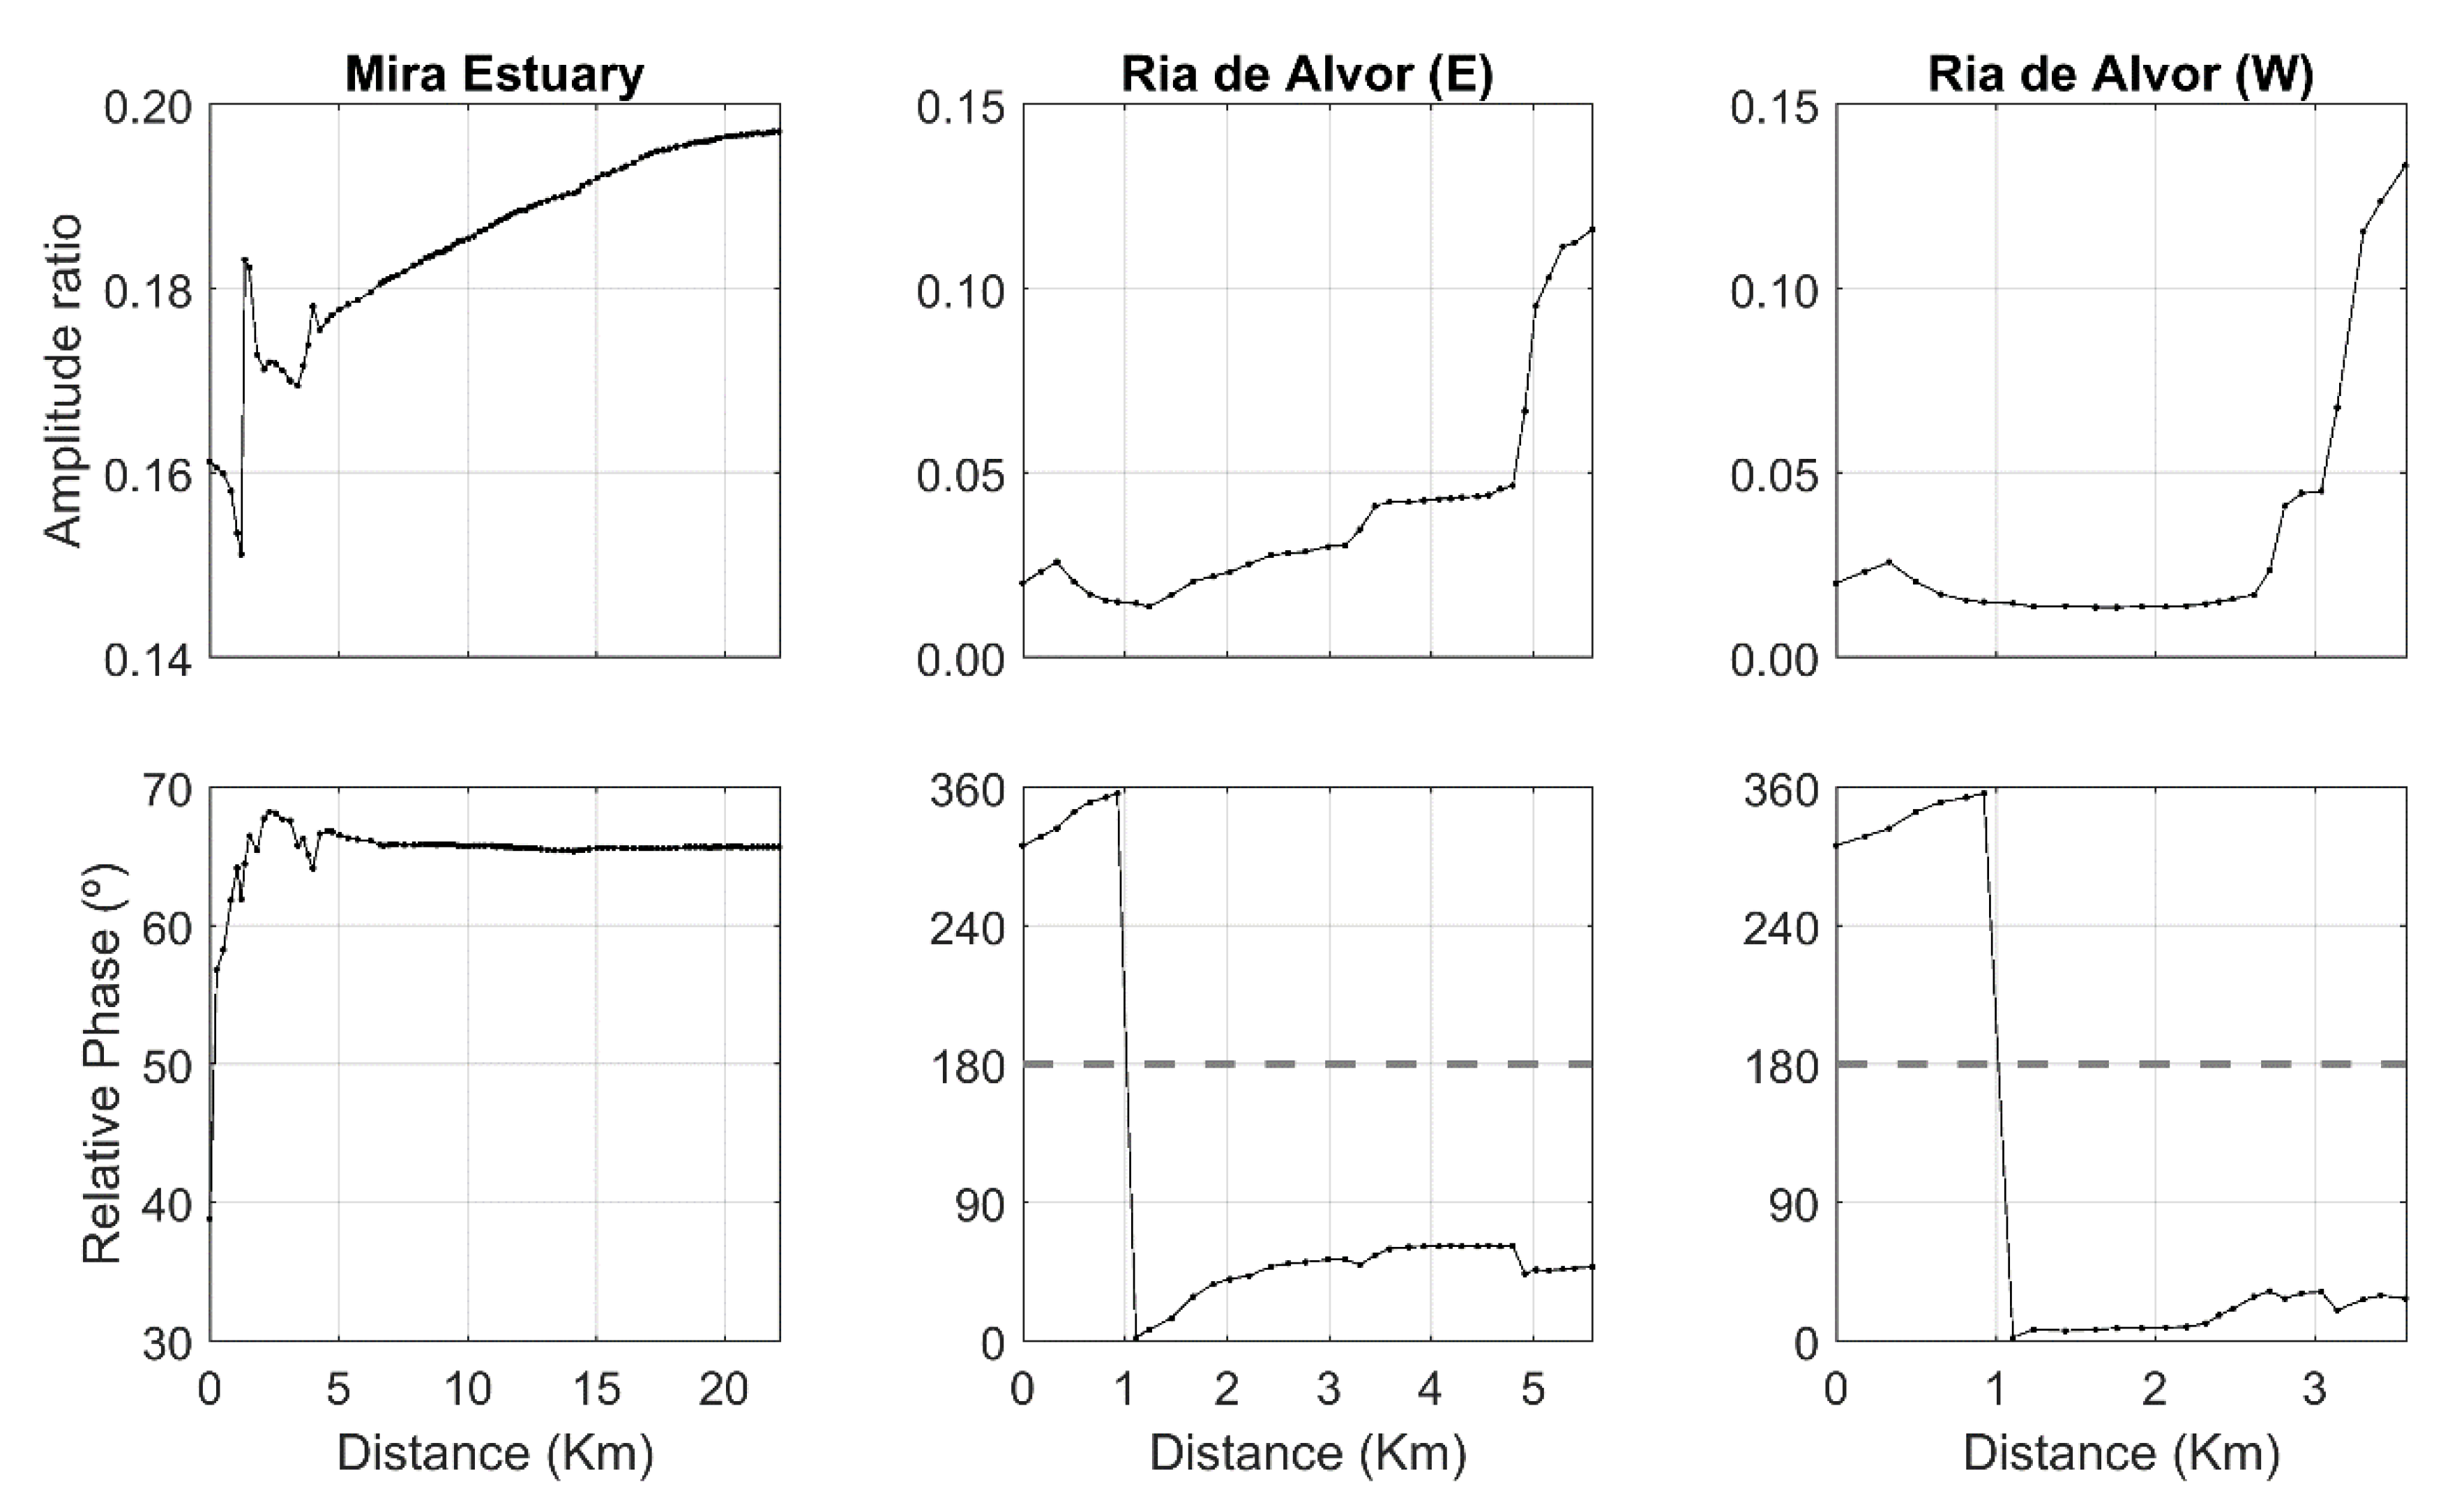
To evaluate the tidal asymmetry for Mira Estuary and Ria de Alvor, the amplitude ratio and the relative phase were computed throughout the axis of the main channels (Figure 4). Results suggest that the tidal distortion increases upstream for both Mira Estuary and Ria de Alvor. For Mira Estuary, the amplitude ratio at the mouth is quite high (0.16), growing toward the upper estuary (0.20). The relative phase shows that the system is flood-dominant, since the relative phase is between 0 and 180°.
Relatively to Ria de Alvor, the amplitude ratio is quite low close to the mouth (0.02), increasing to more than 0.10 for both western and eastern branches. The relative phase results suggest that the system shifts from ebb-dominant at the mouth to flood-dominant upstream.
The tidal prism results are presented in Table 4 and corroborate the tidal asymmetry results. Indeed, for Mira Estuary, the flood tidal prism is 1.8 times greater than the ebb for the spring tide and 1.5 times greater than the ebb for the neap tide. For Ria de Alvor, the ebb tidal prism is 1.1 times greater than that of the flood, both for spring and neap tides. Through the tidal prism results, it is observed that Ria de Alvor presents a more significant exchange of water at each tidal cycle than Mira Estuary, contributing to the renewal of the water volume and reducing the potential effect of nutrient-enrichment/pollutants in the estuary.

4.3. Water Renewal Timescales: Residence Time and Freshwater Fraction

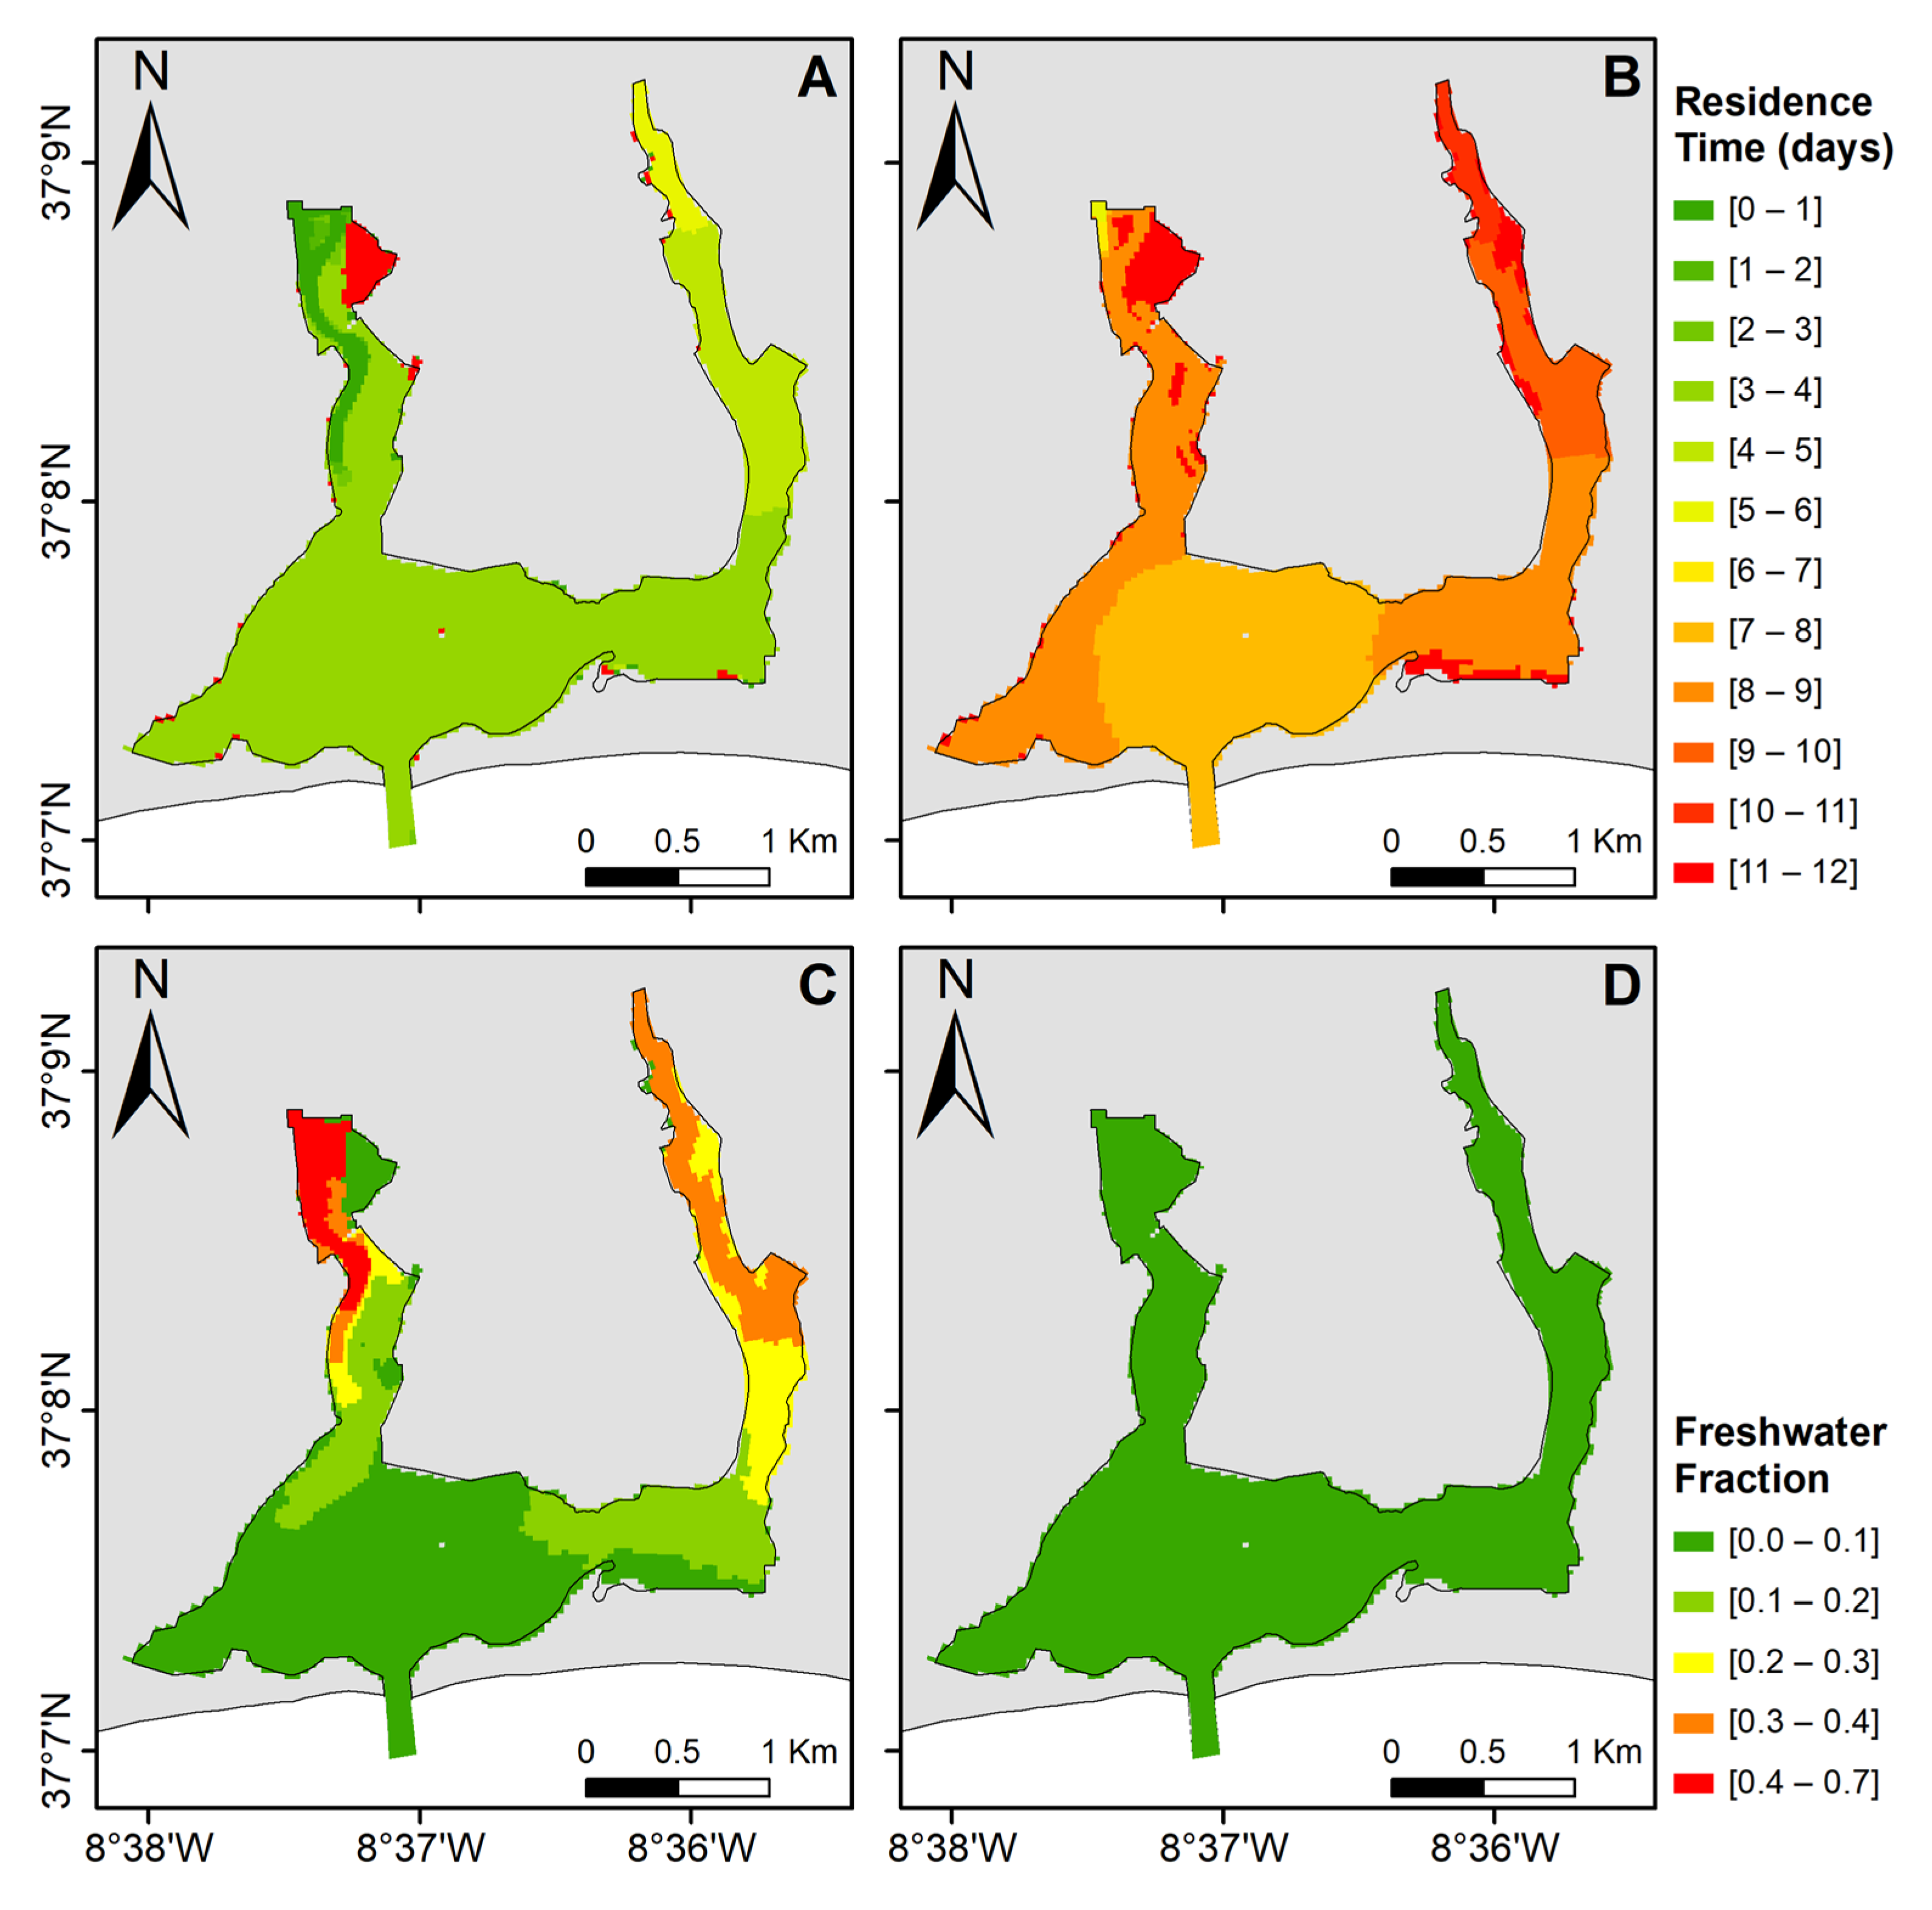
In order to evaluate the water renewal in both estuaries and to understand whether the tidal or river flushing is dominant considering the wet and dry season, the residence time and freshwater fraction for Mira Estuary and Ria de Alvor were computed and are presented in Figure 5 and Figure 6, respectively. Intuitively, for both estuaries, the residence time (freshwater fraction) is lower (higher) during winter than during summer.
For Mira Estuary, the residence time is approximately 6 days in the lower estuary region for both seasons, which means that after this period, the tracer concentration remaining in this region of the estuary is 37% of the initial concentration. In the upper estuary, for winter, the residence time is approximately 2.5 days, while for summer, it increases for more than 11 days, revealing the importance of river discharge for the water renewal. In fact, the system does not receive significant freshwater during summer months, contrasting with the winter season, which could be corroborated by the freshwater fraction maps (Figure 5C,D). Indeed, the river influence is strongly detected at the upper and middle estuaries during winter, with values of 0.32. Contrarily, for summer, the river influence is only detected in the lower estuary, with a freshwater fraction close to 0.25.
The highest residence times are found in the middle estuary, where it can reach up to 12 days during winter and 50 days during summer, acting as a retaining area that is located between the oceanic flow and river discharge.
For Ria de Alvor, the highest calculated residence time is found during summer months, being specifically higher on the east branch, reaching 10 days. During winter, the values drop to 5 days. The west branch presents the lowest residence time of approximately 6 h in winter and 7 days in summer, which reflects the river flow impact dispersing pollutants, nutrients, or sediments that influence the DO and pH distribution. Indeed, the river flow during summer is negligible with freshwater fractions close to zero in the entire estuary, while during winter, the freshwater fraction reaches 0.5. In the central area, the residence time is approximately 3 days in winter, increasing to 7 days in summer.

4.4. Physico-Chemical Characterization

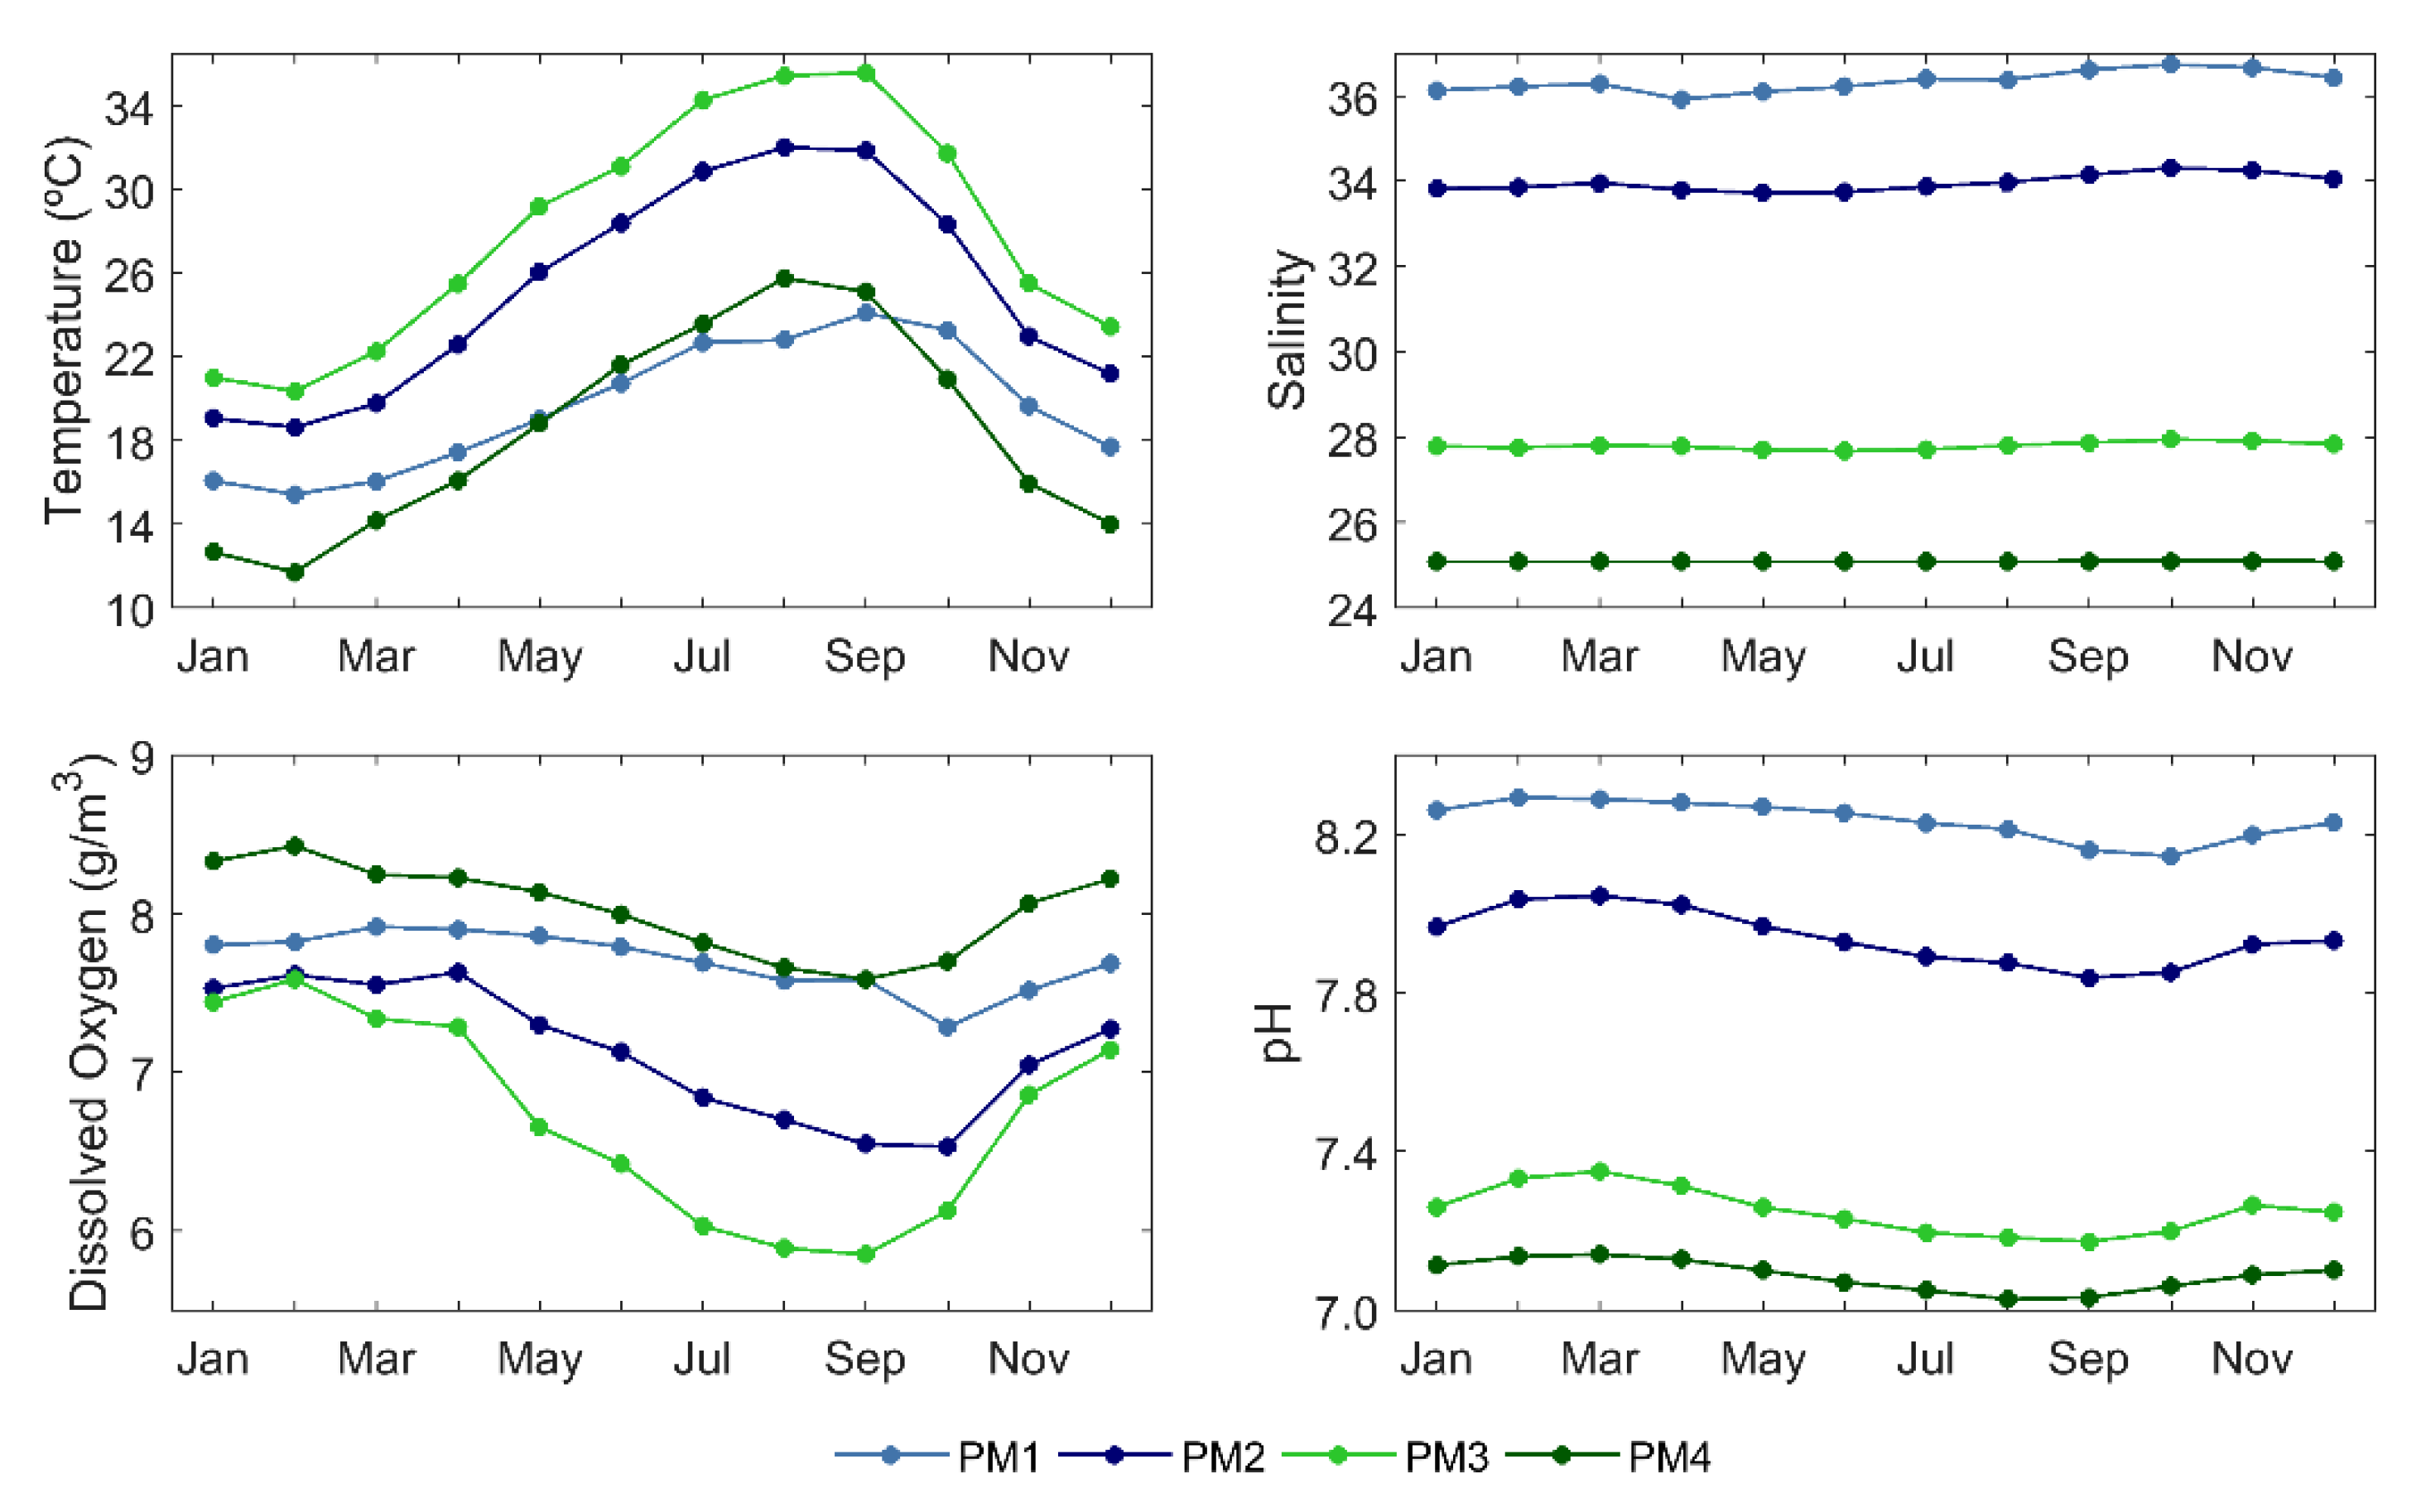
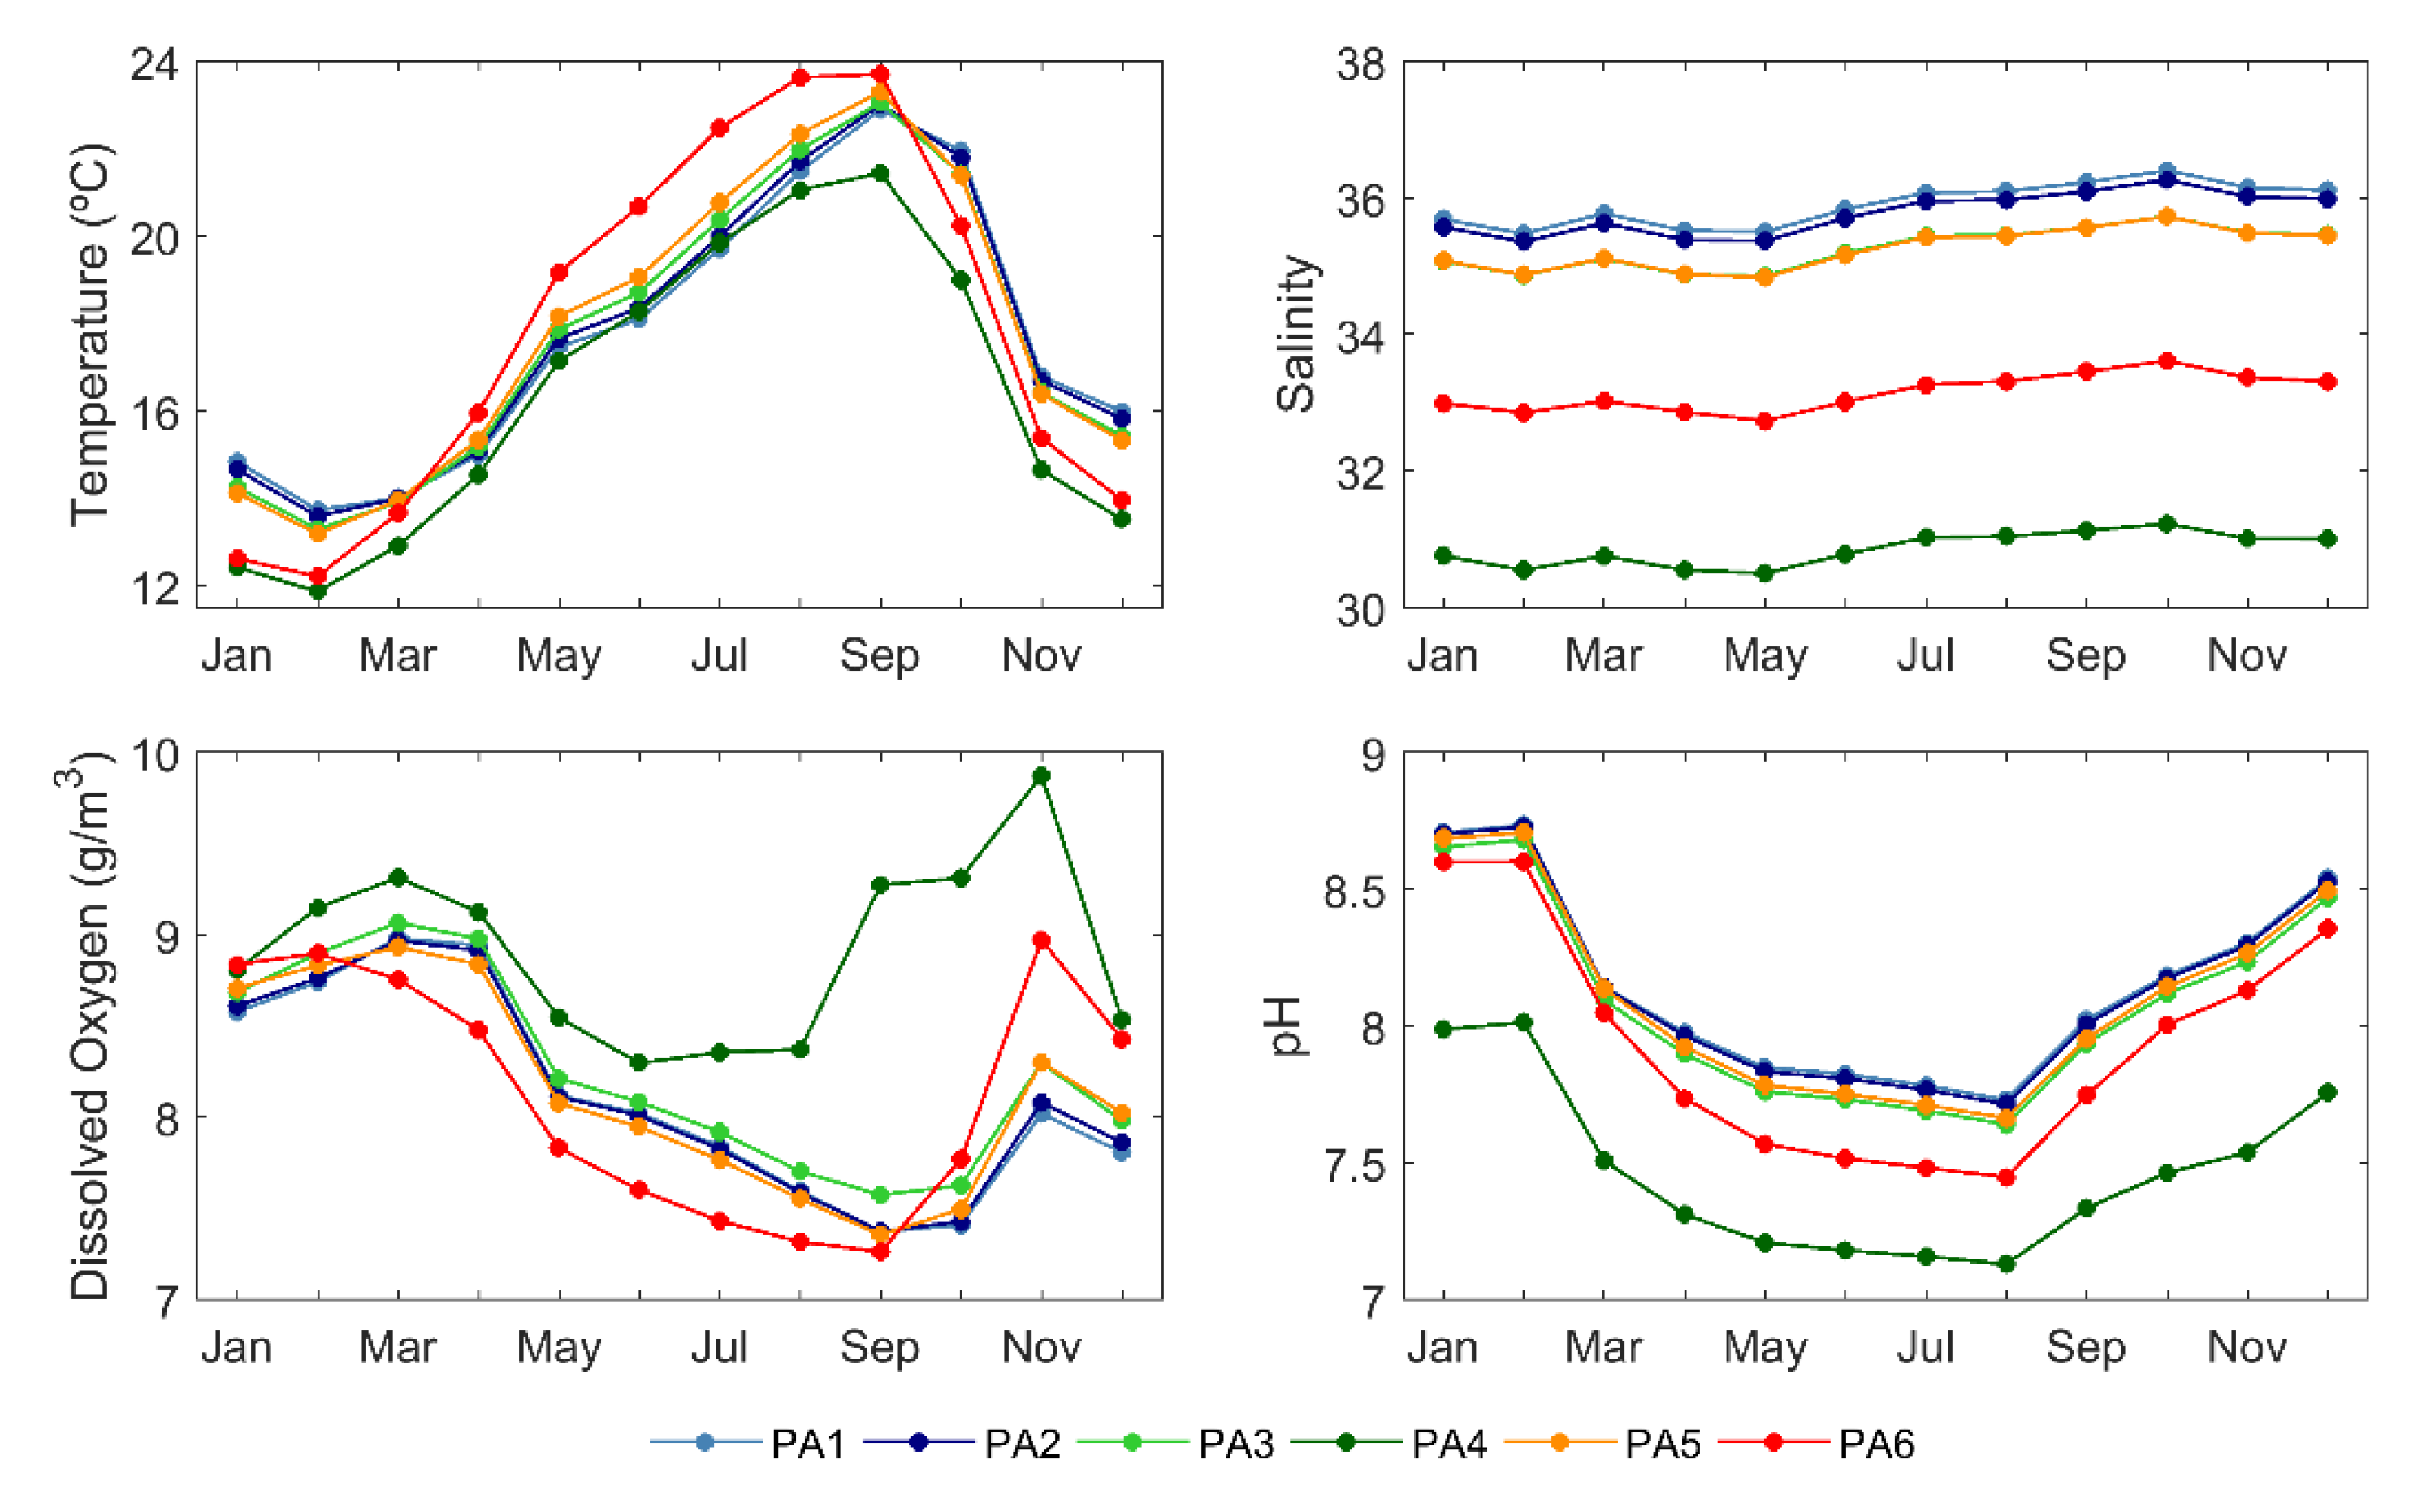
To characterize both estuaries in terms of their physico-chemical characteristics, the monthly mean of water temperature, salinity, pH, and DO (Figure 7 and Figure 8) was computed for both estuaries at the blue dots represented in Figure 1.
For both Mira Estuary and Ria de Alvor, water temperature presents a strongly marked seasonal pattern, showing the characteristic succession of winter minima and summer maxima. For Mira Estuary, the average water temperature for winter at the lower (middle) estuary is about 18 °C (24 °C), while for summer, it is 21 °C (31 °C). The upper estuary registered a mean of 15 °C in winter and 22 °C in summer. For Ria de Alvor, near the mouth, the mean water temperature in winter is 16 °C, decreasing to approximately 14 °C at both eastern and western branches. Generally, the summer maxima temperatures induce a decrease in DO availability, which is observed for both estuaries. Indeed, DO is minima between July and September, with mean values for Ria de Alvor of about 7 g/m3 at the mouth and east branch and 8.5 g/m3 at the west branch. For Mira Estuary, between July and September, the mean DO is 7.5 g/m3 in the lower and upper estuary and 6 g/m3 in the middle estuary.
Salinity remains almost constant throughout the year, decreasing from the mouth toward the channels heads. For Mira Estuary, the salinity ranges from 25 in the upper estuary to 36 at the mouth, while for Ria de Alvor, the salinity values are between 30 at the end of the west branch and 36 near the mouth. pH shows clear seasonal variations, with lower values during summer months, in opposition to water temperature, being more pronouced for Ria de Alvor.
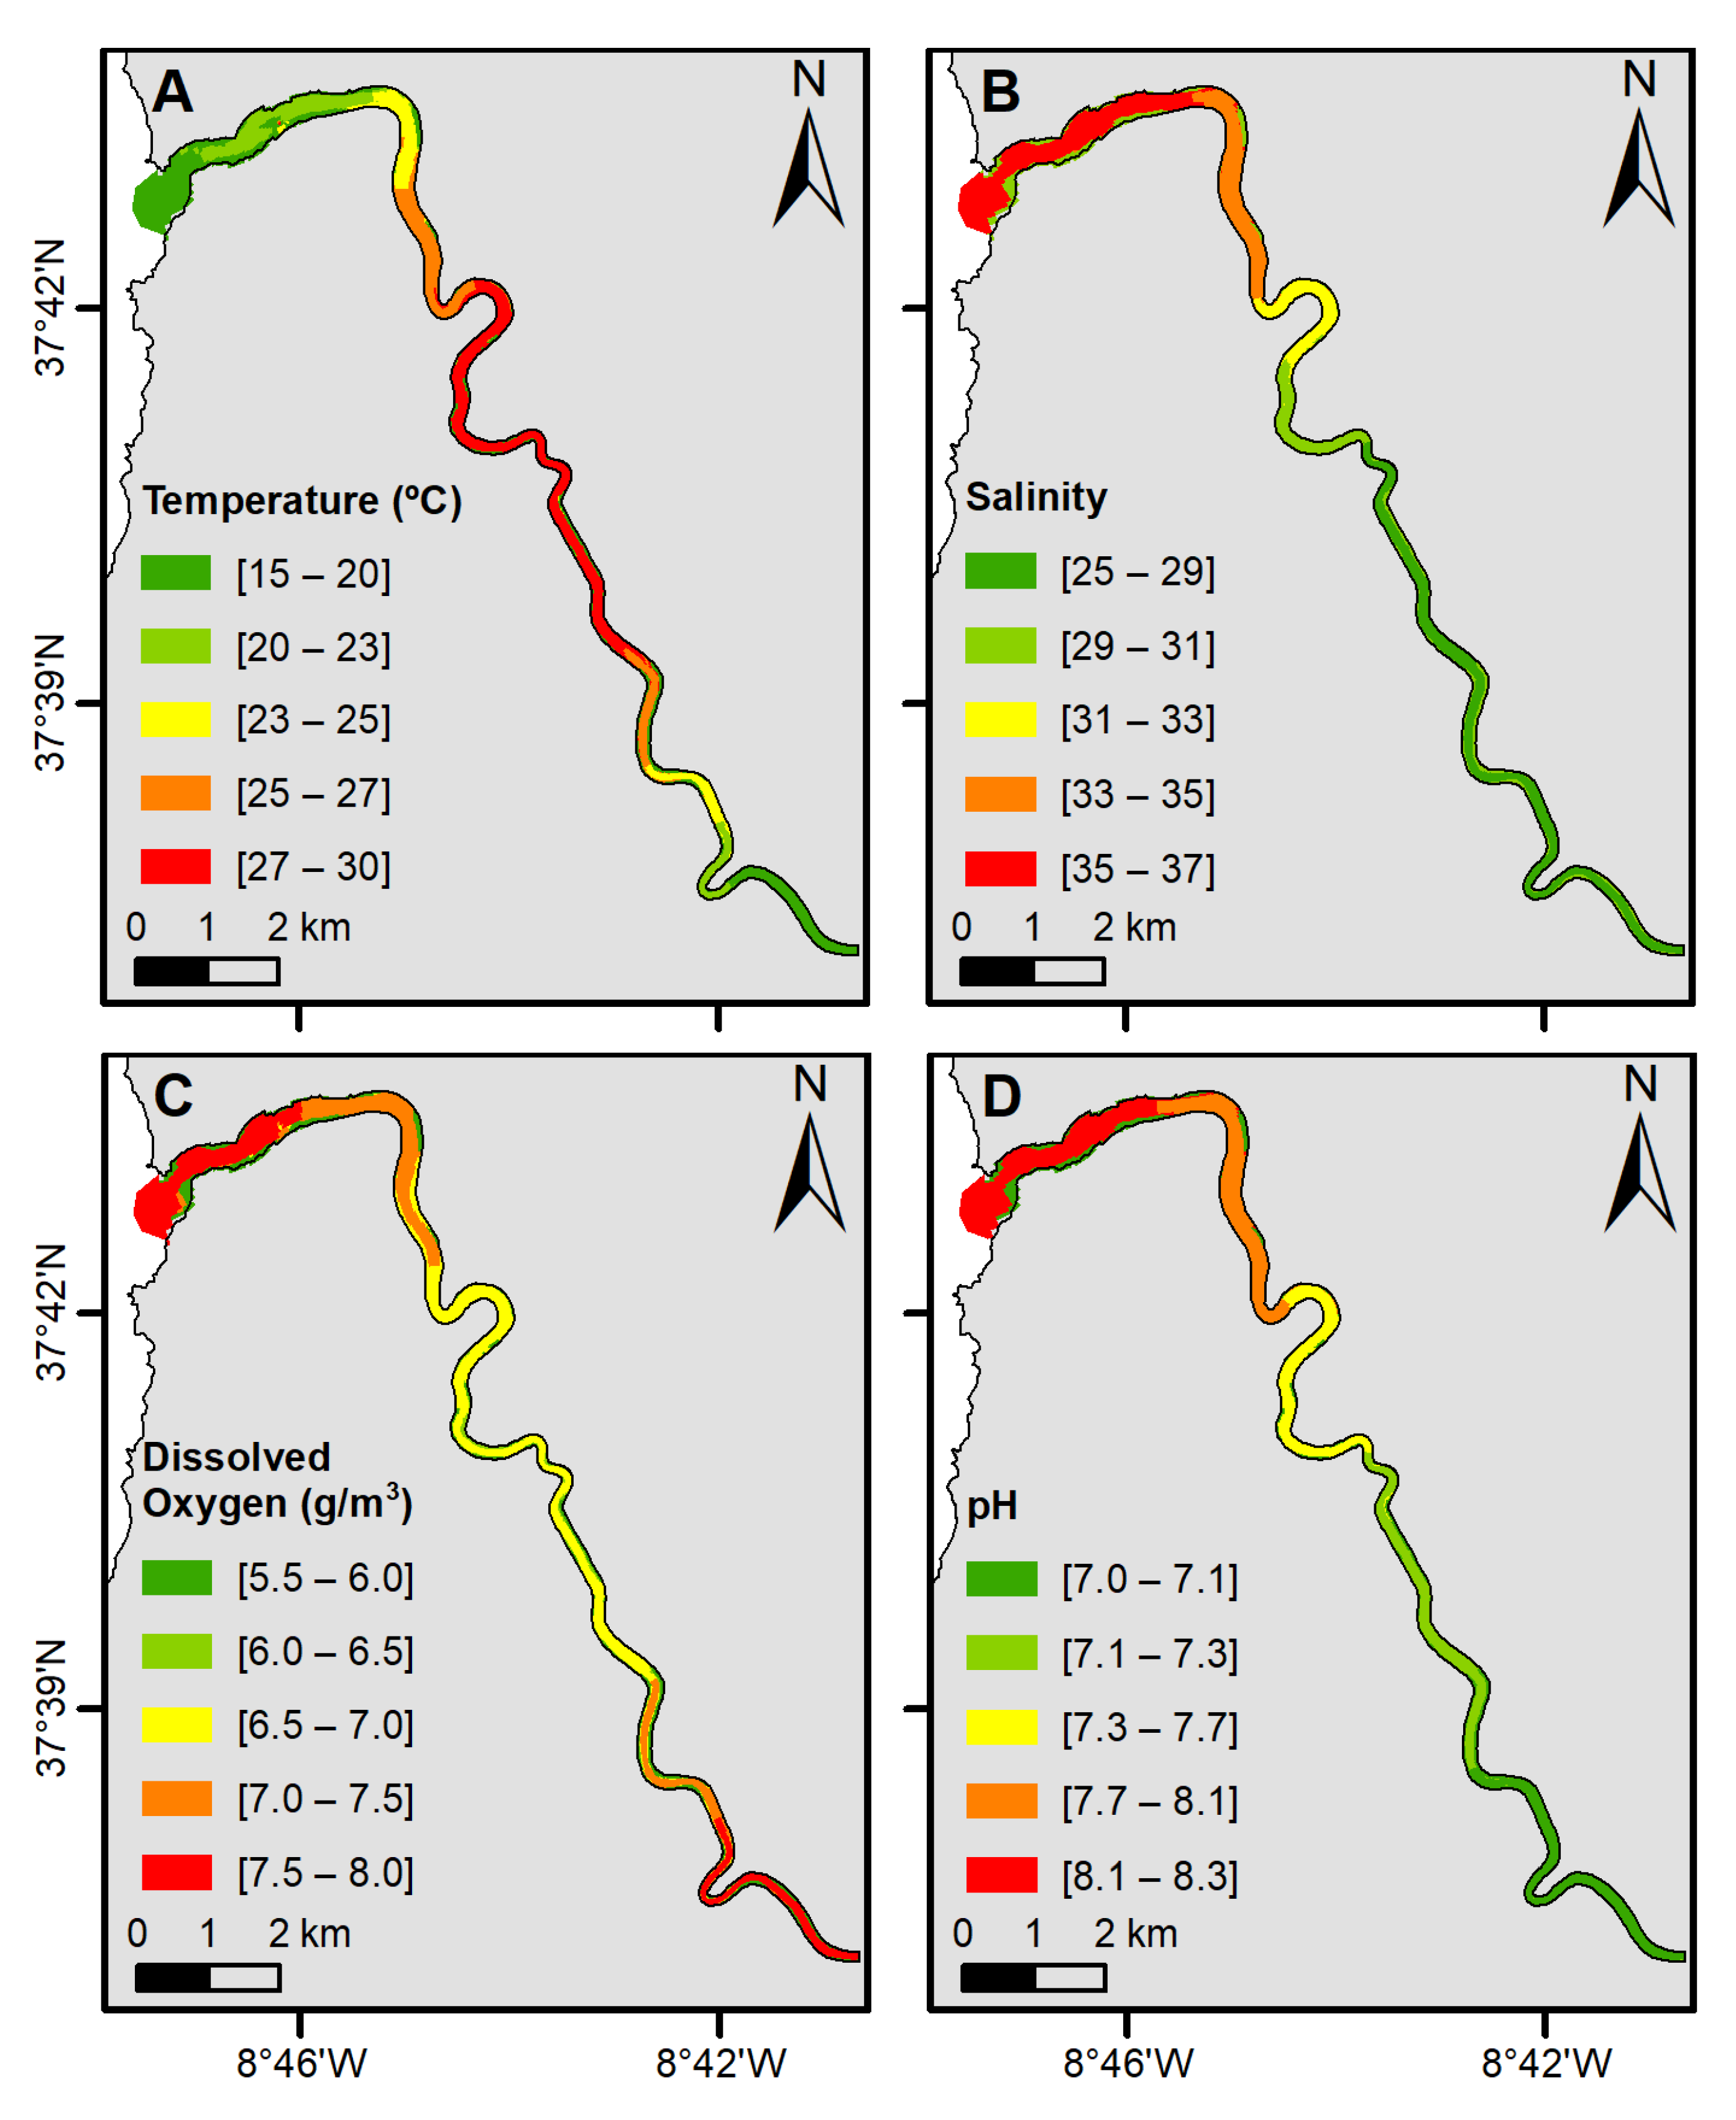
The annual mean water temperature, salinity, DO, and pH were mapped and are represented in Figure 9 and Figure 10 for Mira Estuary and Ria de Alvor, respectively.
Considering Mira Estuary, generally, the water temperature shows a positive gradient from the lower estuary (15–20 °C) until the middle estuary, where it reaches the maximum temperature (27–30 °C). From the middle estuary upon the upper area, a gradual decrease in water temperature is observed. The mean annual water temperature has a large range of 15 °C. Salinity shows the typical estuarine pattern, with values decreasing from the lower (35–37) to the upper estuary (25–29). At the lower and upper estuary, the DO present great concentrations (7.5–8.0), whilst minimum values are observed in the middle estuary (between 6.5 and 7.0). pH shows a gradient from 8.2, at the lower estuary, to 7.1 at the upper estuary.
Figure 10 shows that the mean annual water temperature is constant and approximately 18 °C in most of the Ria de Alvor, except for the western branch, where the water temperature ranges from 16 to 17 °C. Overall, the mean annual water temperature at Ria de Alvor has a small variation, ranging around 3 °C. A typical estuarine salinity pattern was found, with the highest values observed at the Ria de Alvor mouth (between 36 and 37) and the lowest values nearby fluvial discharges. There is a noteworthy difference regarding each branch: the western branch shows lower salinity values between 29 and 33, whilst the eastern branch ranges from 33 to 34.
The DO content is higher in the western branch, with values between 8.6 and 11.0 g/m3 throughout the main channel, while the surrounding intertidal areas present low DO concentration, between 6.7 and 7.8 g/m3. Further, at the eastern branch, DO concentration is between 8.2 and 8.6 g/m3, while at the entrance and central channel, the values are approximately 8.0 g/m3.
Ria de Alvor can be divided into three sections according to pH mean annual variation: the western branch that presents the lowest values (7.7–8.0), the eastern branch with the middle values (7.8–8.0), and the estuary mouth and central area with the higher pH values ranging from 8.1 to 8.2.

Residence Time vs. DO Variability

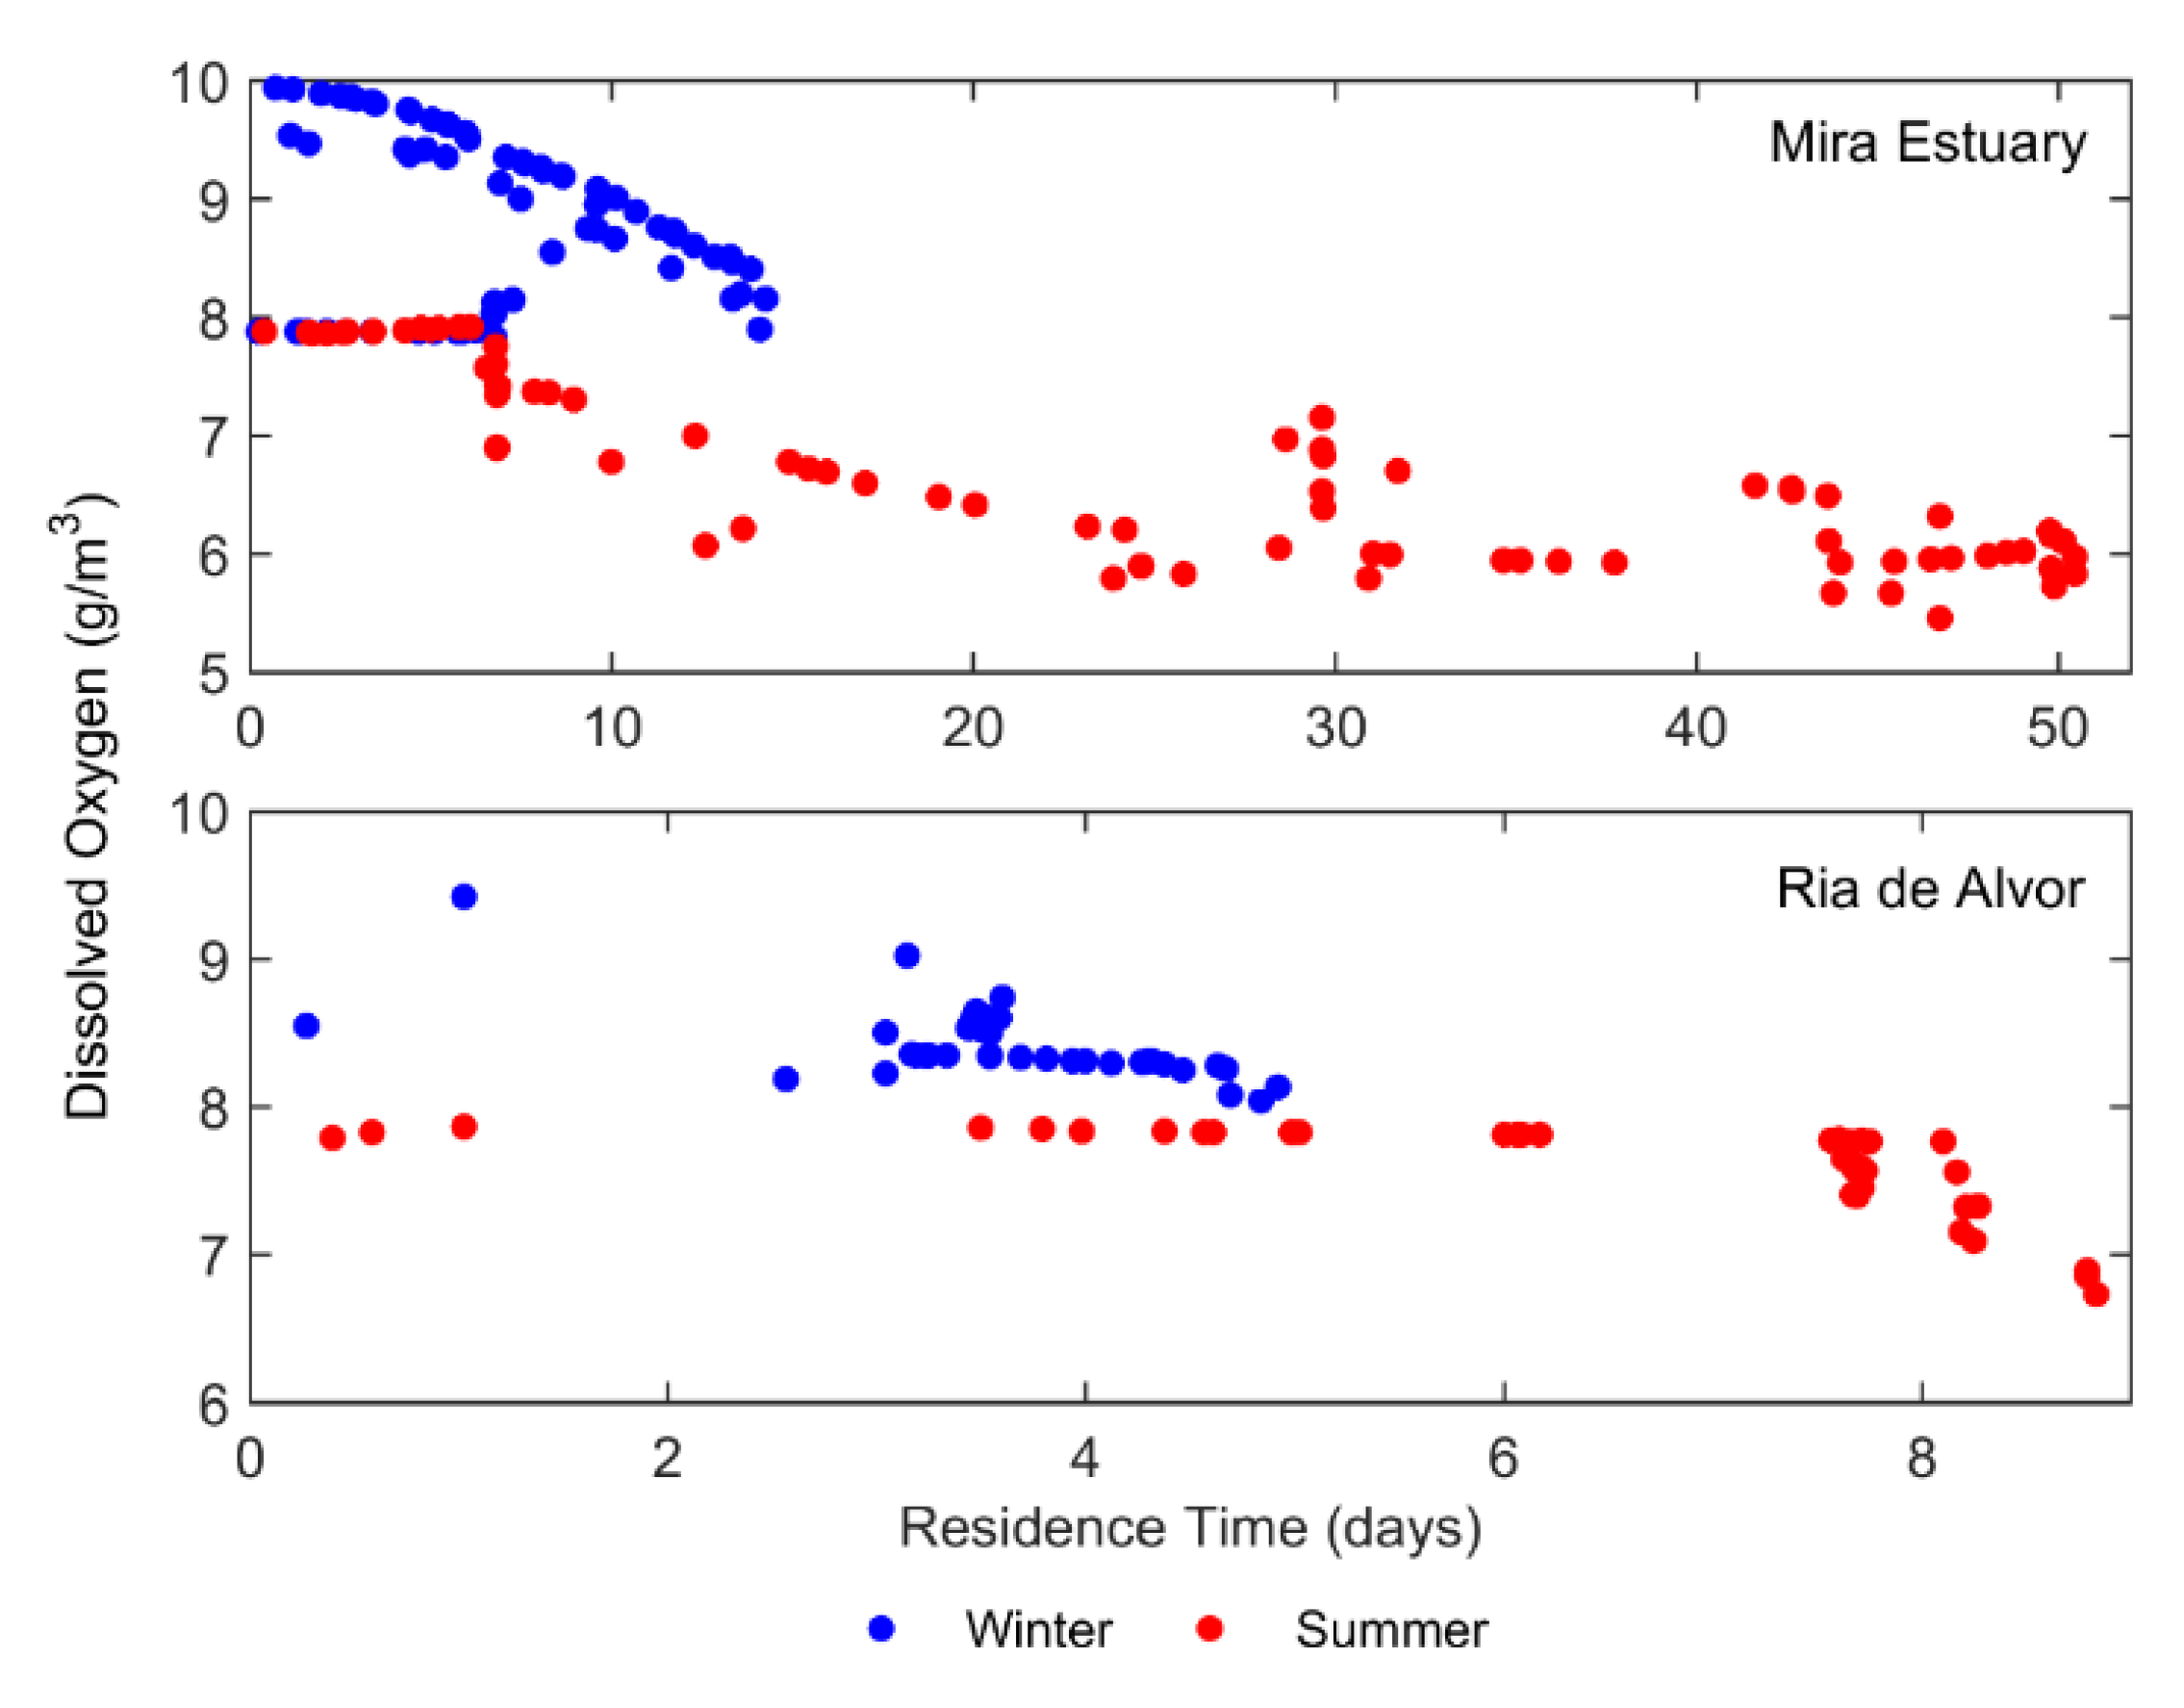
To understand the importance of residence time in the DO distribution, the relation between DO and residence time for Mira estuary and Ria de Alvor was accessed, and the results are portrayed in Figure 11. Since seasonality plays a major role in the physical drivers affecting the advection of estuarine properties, reflected by the distinct residence times, this analysis was performed considering winter and summer seasons.
In general, both estuarine systems present higher oxygen values and lower residence times in winter, conversely to the summer season. Additionally, for increasing the residence time, lower DO values are found. Comparing both systems, Mira estuary DO varies in a higher range (5–10 g/m3) in a 0–52 days timescale when compared with Ria de Alvor (7–9.5 g/m3) in 0–9 days.

5. Discussion

Studies regarding Mira Estuary and Ria de Alvor characterization are scarce and outdated. Moreover, the study of physical and chemical features of such different estuaries is of paramount importance to further comprehend the system’s functioning. On one hand, Mira Estuary is an almost undisturbed system [16] with a complex bathymetry at the mouth channel, a meander configuration, and a salinity gradient decreasing upstream. (Figure 9). On the other hand, the Ria de Alvor is a tidal flat bay under strong anthropogenic pressures [2], with a regular bathymetry at the central area and the presence of intertidal areas upstream and relatively low freshwater inputs that results in a salinity range of 33–37 (Figure 10).

5.1. Model Calibration and Validation

Intending to understand the main features of these distinct estuaries and fulfill the gap of studies regarding their physico-chemical characteristics, this work focuses on the implementation, calibration, validation, and exploration of a numerical model for both estuaries.
In this context, the FLOW and WAQ modules of Delft3D were successfully implemented, revealing their accurate performance in reproducing the physical and biological features of both study regions. The calibration and validation process is a very challenging task, mainly for the biochemical variables that depend on the interaction between physical and biological factors. Despite the scarce data available, a good fit between predictions and observed data was achieved for both estuaries.
Specifically, for Mira Estuary, the SSE errors were found lower than 8% of the local tidal range. Indeed, the bathymetry of the estuary is quite complex at the mouth with sandbanks and deep regions that are difficult for model representation, generating inherent errors. Besides, there are bathymetric data and fluvial input uncertainties. For Ria de Alvor, the SSE error represents 4% of the tidal range. Here, the depth is almost constant throughout the main channel that is extensively dredged to maintain navigability, and therefore tidal propagation is easier to represent.
These results match with those reported for other similar systems, for example [34] obtained RMSE values between 0.09 and 0.34 m for Ria de Aveiro with the numerical model MOHID [35] calibrated the MOHID for Tagus Estuary and RMSE values between 0.015 and 0.705 were obtained. With Delft3D [36] obtained RMSEs lower than 0.08 m for stations located at the mouth of Ria de Aveiro, Douro, Lima, and Minho estuaries and Rías Baixas. It should be noted that in the above-mentioned works, larger datasets (30 days) were used for the comparison of predicted and observed SSE, which reduce the errors.
Water temperature and salinity are strongly influenced by freshwater input, being the water temperature also influenced by the heat exchange through the water–air interface. Therefore, the differences obtained between model results and observations are mainly due to the lack of freshwater continuous data. Notwithstanding, for both estuaries studied herein, the results show that the heat and salt transport are well represented by the model. Indeed, similar RMSEs were found for the Ria de Aveiro, Douro, and Minho estuaries by [36].
DO is particularly difficult to predict, since it depends on the interaction between physical and biological factors, including vertical mixing, air–sea exchange, oxygen release by primary production, and oxygen consumption by respiration/mineralization. In the present work, the WAQ module implemented in the study area only considers algae as primary producers, neglecting the bacteria, fungi, and other decomposer organisms that reduce DO levels in estuaries as oxygen consumers decompose organic matter. The absence of these organisms in the model configuration justifies the differences between predicted and observed DO. Despite these limitations, results show that the model is robust enough to produce good results. Indeed, at all stations, the RMSE between predictions and observations represents less than 8% of the mean local value. Results are better than those achieved for Minho and Lima estuaries by [7].
The pH inside both estuaries mainly depends on the oceanic, atmospheric, and fluvial inputs. Under these circumstances, the calibration and validation results show a great agreement between predictions and observations. The worst result occurred for the M2 station, which is located at Mira Estuary, with an RMSE of 0.26. This error corresponds to approximately 3% of the mean local value. For the remaining stations, this percentage falls below 1% (this includes the stations of Mira Estuary and Ria de Alvor). Results are similar to those obtained by [37] with the same model, for Ria de Aveiro.

5.2. Tidal Characterization

5.2.1. Tide Propagation

In shallow coastal systems, nonlinear forces and processes such as friction and advection become responsible for tidal dynamics. For this reason, the tidal signal is complex, and it cannot be represented by a simple linear superposition of semidiurnal and diurnal components as in the deep ocean. Therefore, in this work, the amplitude and phase of six tidal constituents (M2, S2, O1, K1, M4, and M6) were computed for all grid points and are represented in key points throughout the axis of the main channels of each estuary (Figure 1).
As both systems are mesotidal and tides are primarily semidiurnal, M2 and S2 amplitudes are significantly higher when compared with diurnal constituents O1 and K1. However, the amplitude of semidiurnal constituents is quite different for each estuary: at the mouth of Ria de Alvor, their amplitude is higher than for Mira Estuary, decreasing as the tidal wave propagates further upstream (due to friction and nonlinear transfers of energy). The significant difference between the amplitude of semidiurnal constituents of both estuaries is attributed to their different geometry and geomorphology that interact differently with the tidal wave.
The shallow water M4 and M6 constituents are originated from M2, representing distortions of the tidal level’s normal harmonic variations, which are induced by advection and bottom friction effects, respectively. For Mira Estuary, these constituents are one order of magnitude higher than for Ria de Alvor. Throughout Mira Estuary, these constituents remain approximately constant, due to the regular geomorphology after the first 3 km, while for Ria de Alvor, an intensification upstream (at both branches) is observed, which is due to the appearance of intertidal areas. These results reveal the extreme importance of local geomorphology in these constituent’s evolution. Some of these differences also might be due to the mouth configuration. In Mira Estuary, there is tidal wave distortion, which rapidly interacts with bottom friction. Indeed, Mira Estuary has a very complex bathymetry at the first 3 km that simplifies upstream, which facilitates the tidal penetration, and therefore M4 and M6 have a great expression. At Ria de Alvor, the depth is approximately constant at the central region joint with a wider mouth configuration, and the highest amplitudes of M4 and M6 are found when significant bathymetric differences occur.

5.2.2. Tidal Asymmetry and Tidal Prism

The distortion of the tidal wave propagating on the coastal shelf when entering bays and estuaries is widely known [38]. According to the geometry of the systems, the tidal wave will interact differently both with bottom friction and margins restraint, either by amplifying or distorting its wave signal. Computing tidal asymmetry, it is possible to infer the magnitude of tidal distortion and the flood or ebb dominance of an estuarine system. Tidal asymmetry in estuaries and lagoons controls residual sediment transport and, therefore quantifying tidal asymmetry is important for understanding local morphological changes [39].
For both estuaries studied herein, the magnitude of tidal asymmetry increases upstream, being quite higher at Mira Estuary than at Ria de Alvor. That is an expected result, since the amplitude of the M4 constituent is also higher at Mira Estuary (Figure 4). The Relative Phase results reveal that Mira Estuary is strongly flood-dominant, which means that the effects of the flood currents are higher than those of ebb currents, and therefore the system is prone to accretion and property retention (DO and pH). Indeed, the flood tidal prism at the mouth is 1.8 times greater than the ebb tidal prism. Otherwise, Ria de Alvor is mildly ebb-dominant in the central area (ebb tidal prism 1.1 times greater than flood), revealing ebb currents effects that are higher than those from flood currents; therefore, it has potential to export sediments and other property from this region to the nearby ocean and is strongly flood-dominant upstream, revealing the potential to retain properties.
The difference between both estuaries may rely on several factors, such as the width of the estuary mouth, influence of channel curvature or constraint, and the presence of secondary channels. Indeed, the systems present very distinct geometry configurations: both comprise intertidal areas, while Mira Estuary presents a meander geometry, while Alvor consists of a tidal flat bay, which bifurcates into two branches at the upstream area. Despite Mira Estuary’s complex meandering geometry, it happens in all extensions, which may explain the constant flood dominance together with the approximately constant depth upstream. Conversely, the morphology of Ria de Alvor presents a regular pattern in the central region and intertidal areas upstream, resulting in a varying type of tide distortion. A similar pattern was found for Ria de Aveiro (Portugal) by [28] and for Tijuana River Estuary and Tomales Bay (California) by [40]. The enhancement of ebb dominance with the presence of the intertidal areas is consistent with theoretical evidence [41].

5.3. Water Renewal Time Scales

Estimating the estuarine water replacement rate can be useful for determining the system’s sensitivity to the dispersal of pollutants, nutrients, or sediments, acting as a baseline for understanding the estuarine hydrodynamics [42] and water quality processes within the system. Therefore, some physical metrics were accessed to physically characterize the estuarine systems, namely residence time and freshwater fraction.
It is important to mention the great dependence of residence time on seasonal conditions (e.g., river flow, wind regime) and tides. Therefore, a study specifying seasonality allows a more accurate knowledge of these water timescales parameters, specifically regarding the distinct discharge flow or wind regime characterized by each season.
Despite the great difference in the residence time between Mira Estuary and Ria de Alvor, their general behavior is similar (greater residence time in summer and higher freshwater fraction near the river area). The distinct residence time reflects not only geomorphologic features such as the estuary depth and area (width and length) but also the freshwater input contribution, which also demonstrates the distinct freshwater fraction of the systems.
The middle Mira Estuary presents the highest residence time, mainly during summer, retaining water properties in this region. This could be justified by the strong flood dominance and high flood tidal prism that transport oceanic waters into the estuary, converging with river water. Therefore, high residence times waters experience DO depletion if oxygen-consuming organic matter is available. The wind pattern also influences the water renewal in an estuary by changing circulation patterns. The effect of wind is mainly noticeable at the central region of Ria de Alvor, since the fluvial discharge has no significant influence on the mouth region for both seasons (Figure 6C,D) and both simulations considered high tide initial conditions. Indeed, the wind speed during winter was frequently above 5 m/s and predominantly from the northeast, affecting the general/superficial flush, while during summer, the wind blows from the northwest with a speed of approximately 3 m/s. Otherwise, for Mira Estuary, the wind pattern is similar for both seasons (approximately 2.5 m/s wind speed, predominantly from the northwest) and therefore, the residence time near the mouth is similar. The results have proven that the residence time is dependent on wind forcing conditions (speed and direction).

5.4. Physico-Chemical Characterization

A physico-chemical characterization of Mira Estuary and Ria de Alvor was performed taking advantage of the numerical applications developed with Delft3D. The monthly mean water temperature, salinity, DO, and pH were computed at several points throughout the axis of the main channels of each estuary (Figure 7 and Figure 8). In addition, the annual average of the same variables was computed and mapped (Figure 9 and Figure 10).
The results suggest that despite the different features of both estuaries, water temperature appears to be the dominant driver of seasonal DO variations. It is well known that temperature can affect DO levels by influencing biological and physical processes [43]. Indeed, the water temperature enhances oxygen consumption processes, i.e., respiration [44], but it can also intensify oxygen production processes, i.e., photosynthesis [45]. In the case of Mira Estuary and Ria de Alvor, the seasonality of DO concentration is well evident, with the lowest levels occurring during the late summer months, when the water temperature is highest (Figure 7 and Figure 8). Besides, the regions with the highest water temperature coincide with the regions of low DO levels (Figure 9 and Figure 10) and higher residence times (Figure 5 and Figure 6), revealing that oxygen consumption processes are superimposed to the production processes. Waters with high residence times in areas of restricted exchange may experience considerable DO depletion if oxygen-consuming organic matter is present.
However, even when the water temperature is high, the mean DO levels never drop below 5 g/m3. This is justified by the fact that both systems are shallow, and light is able to penetrate the water column, promoting photosynthesis. On one hand, due to the Northwest–Southeast orientation of Mira Estuary, which confers upon it a favorable exposure to predominant northwest winds, the water column is well mixed and oxygenated. On the other hand, the hydrodynamic regime of Ria de Alvor limits sediment resuspension [2], and therefore, there are optimal conditions for light penetration in the water column. Despite the similar trend of the seasonal DO at both estuaries, due to the higher water temperature and residence times observed at Mira Estuary, the DO content here is lower than in Ria de Alvor. The river discharge has also been reported to have paramount importance on the DO seasonality in some nearshore coastal and estuarine systems [43]. However, despite the higher fluvial discharge in Mira Estuary than in the Ria de Alvor, the seasonal variations of DO were similar in both estuaries (Figure 7 and Figure 8).
According to Figure 9 and Figure 10, the oxygen contents are higher in lower and upper estuaries, where there is a greater influence of more oxygenated marine and fluvial waters than in the middle estuary. In addition, near the freshwater sources, the oxygen levels are higher than near the mouths of both estuaries, because the solubility of oxygen in water decreases as the temperature and salinity increase [46].
The pH value is governed by changes in dissolved carbon dioxide concentrations, alkalinity, and hydrogen ion concentrations, which are highly influenced by biological activity [47] through photosynthesis. Regarding the monthly mean of DO and pH for both estuaries, it can be observed that generally, when the DO levels increase, the pH increases, and the water becomes more alkaline. In fact, through photosynthesis, algae remove carbon dioxide from the water column to produce oxygen. When dissolved in water, the carbon dioxide acidifies and its removal result in a higher pH. The pH slightly decreases upstream, which is due to the freshwater discharge influence. Thus, the pH is a balance equation between biological processes (photosynthesis) and freshwater inflow.
Finally, some features should be pointed out, particularly for Ria de Alvor. Several differences in the physico-chemical parameters’ spatial distribution between western and eastern branches are observed. For instance, the water temperature and DO are higher and salinity and pH values are lower over the western branch than the eastern branch. These differences must rely on different fluvial discharges (higher in the western branch), bathymetric differences, channel geometry, tidal influence, and associated biogeochemical processes inherent to these areas. According to [2], during high tide, the central area (including the intertidal area) of Ria de Alvor is submerged with oceanic waters and therefore does not reach the upstream branches. Conversely, during low tide, oceanic water reaches both upstream areas of the estuary (both branches) but does not flood the central area.

Water Timescales Effect on the DO Variability

The seasonal variation of physical parameters reflects the relative importance of wet and dry seasons on the estuarine systems water quality status. The knowledge of the seasonal residence time provides valuable information regarding both biological and chemical processes on coastal systems. In the scope of this research, the combination of several physical parameters was accessed to understand its impact on the physico-chemical properties of both estuaries, specifically DO, as one of the most important environmental variables of water quality [48].
The highest DO concentrations (between 9 and 10 g/m3 for winter and 8 g/m3 for summer) occur at Mira Estuary near the mouth due to the strong flood currents (flood dominance of the estuary and higher flood tidal prism) and near riverine input that transports well-oxygenated waters into the estuary, reflecting low residence time (between 1 and 3 days for winter and summer). Otherwise, it also presents the lowest DO values (8 g/m3 for winter and between 5.5 and 6 g/m3 for summer), which are located in the middle estuary, where the residence time is high (8 days for winter and over 50 days for summer). Therefore, the middle estuary could be considered as a convergence zone of the oceanic and river waters with restricted exchange presenting the highest residence times and experiencing poor DO replenishment.
The DO content at Ria de Alvor is more homogeneous, and the residence time is lower when compared with Mira Estuary, which could be related to the ebb dominance of the central area and higher ebb tidal prism. An effective replenishment of the DO occurs and minimum values never drop below 6.5 g/m3, even in summer.

6. Conclusions

Mira Estuary and Ria de Alvor have an irrefutable high ecological and economic importance in Alentejo and Algarve, respectively. However, these systems are under-researched, unlike other Portuguese systems; therefore, this paper aimed to fill this scientific gap. In addition, the different features of both estuaries become a challenge for the understanding of their physico-chemical characteristics. In this context, the characterization of both estuaries was performed, taking advantage of the implementation of physical and water quality coupled models. The models accurately reproduce the data; however, a deeper model validation using independent datasets would be of great importance to reinforce the quality of the results obtained. This would require continuous field data covering several regions throughout both estuaries. Notwithstanding, the comparisons between model predictions and observations are quite good, and therefore, the models developed for both estuaries are realistic tools for their tidal and water quality characterization.
The main results show that the distinct geomorphologic characteristics of each estuary influence the tidal propagation and amplitude. Indeed, the amplitude of the principal lunar semidiurnal constituent is higher for Ria de Alvor than for Mira Estuary, and consequently, the amplitude of shallow water constituents gain a great expression at Mira Estuary. Subsequently, Mira Estuary revealed a strong flood dominance, with a flood tidal prism at the mouth that is 1.8 times greater than the ebb, which means that the estuary tends toward an accretion and retention of properties. This together with the riverine input makes the middle estuary a retaining area, with high residence times and subsequently low DO levels. Otherwise, Ria de Alvor is found to be ebb-dominant in the central area and flood-dominant upstream, with an ebb tidal prism at the mouth channel that is 1.1 times greater than the flood. Therefore, the residence time in Ria de Alvor is low, and the water renewal is more effective than that for Mira Estuary. Besides these differences along with the freshwater input, which is lower at Ria de Alvor, the hydrographic and biological variability is fairly similar for both estuaries. Indeed, DO shows a strong dependence on water temperature, with the lowest DO levels occurring in regions with low water temperature. Moreover, the pH is a balanced equation between biological processes (photosynthesis) and freshwater inflow.
Both estuaries support aquaculture exploitations; therefore, continuous studies regarding their water quality, through both field data monitoring and modeling are quite important, providing useful information for decision-makers and allowing the expansion of aquaculture activity without compromising other natural resources.

Author Contributions

Conceptualization–A.P., J.M., R.R. and J.M.D.; methodology—A.P.; software, A.P.; validation—A.P., formal analysis—A.P., J.M., R.R.; investigation—A.P., J.M., R.R.; resources—J.M.D.; data curation A.P., J.M., R.R., J.P.; writing—original draft preparation—A.P., J.M.; writing—review and editing—A.P., J.M., R.R., J.P. and J.M.D.; visualization—A.P., J.M., R.R.; supervision -J.M.D.; project administration—J.M.D.; funding acquisition—J.M.D. All authors have read and agreed to the published version of the manuscript.

Funding

This work was developed and funded under the scope of the project AquiMap (MAR-02.01.01-FEAMP-0022) co-financed by MAR2020 Program, Portugal 2020 and European Union through the European Maritime and Fisheries Fund. Thanks are due to FCT/MCTES for the financial support to CESAM (UIDP/50017/2020+UIDB/50017/2020), through national funds.

Acknowledgments

Thanks are due to Hidromod and Maretec for providing Mira Estuary bathymetric data. Authors also thanks to Henrique Queiroga and Helena Silva from the Department of Biology and to Diana Patoilo from the Department of Environment and Planing, all from University of Aveiro for borrowing the CTD, pH and DO sensors. Thanks to Liliana Costa and to Humberto Pereira from University of Aveiro for their help in the field data acquisition task. Finally, authors would like to thanks to Nuno Pinto, manager of Dunas Capital, for providing the access to Cais Quinta da Rocha at Ria de Alvor for data acquisition.

Conflicts of Interest

The authors declare no conflict of interest. The funders had no role in the design of the study; in the collection, analyses, or interpretation of data; in the writing of the manuscript, or in the decision to publish the results.

References

  1. Brito, A.C.; Quental, T.; Coutinho, T.P.; Branco, M.A.C.; Falcão, M.; Newton, A.; Icely, J.; Moita, T. Phytoplankton dynamics in southern Portuguese coastal lagoons during a discontinuous period of 40 years: An overview. Estuar. Coast. Shelf Sci. 2012, 110, 147–156. [Google Scholar] [CrossRef]
  2. Mateus, M.; Almeida, D.; Simonson, W.; Felgueiras, M.; Banza, P.; Batty, L. Conflictive uses of coastal areas: A case study in a southern European coastal lagoon (Ria de Alvor, Portugal). Ocean Coast. Manag. 2016, 132, 90–100. [Google Scholar] [CrossRef]
  3. Xu, J.; Hood, R.R. Modeling biogeochemical cycles in Chesapeake Bay with a coupled physical-biological model. Estuar. Coast. Shelf Sci. 2006, 69, 19–46. [Google Scholar] [CrossRef]
  4. Xue, H.; Chai, F. Coupled physical-biological model for the Pearl River estuary: A phosphate limited subtropical ecosystem. In Proceedings of the Estuarine and Coastal Modeling (2001), Saint Petersburg, FL, USA, 5–7 November 2001; Malcolm, L.S., Ed.; American Society of Civil Engineers: Reston, VA, USA, 2002; pp. 913–928. [Google Scholar]
  5. Vaz, N.; Mateus, M.; Plecha, S.; Sousa, M.C.; Leitão, P.C.; Neves, R.; Dias, J.M. Modeling SST and chlorophyll patterns in a coupled estuary-coastal system of Portugal: The Tagus case study. J. Mar. Syst. 2015, 147, 123–137. [Google Scholar] [CrossRef]
  6. Mateus, M.; Neves, R. Evaluating light and nutrient limitation in the Tagus estuary using a process-oriented ecological model. J. Mar. Eng. Technol. 2014, 7, 43–54. [Google Scholar] [CrossRef]
  7. Oliveira, V.H.; Sousa, M.C.; Morgado, F.; Dias, J.M. Modelling the impact of extreme river discharge on the nutrient dynamics and dissolved oxygen in two adjacent estuaries (Portugal). J. Mar. Sci. Eng. 2019, 7, 412. [Google Scholar] [CrossRef] [Green Version]
  8. Lencart e Silva, J.D.; Azevedo, A.; Lillebø, A.I.; Dias, J.M. Turbidity under changing physical forcing over two contrasting locations of seagrass meadows. J. Coast. Res. 2013, 165, 2023–2028. [Google Scholar] [CrossRef]
  9. Lopes, C.L.; Azevedo, A.; Dias, J.M. Flooding assessment under sea level rise scenarios: Ria de Aveiro case study. J. Coast. Res. 2013, 165, 766–771. [Google Scholar] [CrossRef]
  10. Rodrigues, M.; Oliveira, A.; Queiroga, H.; Fortunato, A.B.; Zhang, Y.J. Three-dimensional modeling of the lower trophic levels in the Ria de Aveiro (Portugal). Ecol. Modell. 2009, 220, 1274–1290. [Google Scholar] [CrossRef]
  11. Duarte, B.; Manjate, E.; Caçador, I. Baseline survey on the accumulation of microdebris in the intertidal sediments of a reference estuarine system (Mira Estuary, Portugal). Ocean 2020, 1, 47–55. [Google Scholar] [CrossRef]
  12. Costa, M.J.; Catarino, F.; Bettencourt, A. The role of salt marshes in the Mira estuary (Portugal). Wetl. Ecol. Manag. 2001, 9, 121–134. [Google Scholar] [CrossRef]
  13. Silva, I.C.; Dinis, A.M.; Francisco, S.M.; Flores, A.A.V.; Paula, J. Longitudinal distribution and lateral pattern of megalopal settlement and juvenile recruitment of Carcinus maenas (L.) (Brachyura, Portunidae) in the Mira River Estuary, Portugal. Estuar. Coast. Shelf Sci. 2006, 69, 179–188. [Google Scholar] [CrossRef]
  14. Queiroga, H.; Almeida, M.; Alpuim, T.; Flores, A.; Francisco, S.; Gonzàlez-Gordillo, I.; Miranda, A.; Silva, I.; Paula, J. Tide and wind control of megalopal supply to estuarine crab populations on the Portuguese west coast. Mar. Ecol. Prog. Ser. 2006, 307, 21–36. [Google Scholar] [CrossRef]
  15. Almeida, D.; Neto, C.; Esteves, L.S.; Costa, J.C. The impacts of land-use changes on the recovery of saltmarshes in Portugal. Ocean Coast. Manag. 2014, 92, 40–49. [Google Scholar] [CrossRef] [Green Version]
  16. Alves, A.S.; Adão, H.; Patrício, J.; Neto, J.M.; Costa, M.J.; Marques, J.C. Spatial distribution of subtidal meiobenthos along estuarine gradients in two southern european estuaries (Portugal). J. Mar. Biol. Assoc. United Kingd. 2009, 89, 1529–1540. [Google Scholar] [CrossRef]
  17. Deltares, D.F. Simulation of multi-dimensional hydrodynamic flows and transport phenomena, including sediments. User Man. 2014, 684. [Google Scholar]
  18. Deltares, D.F. Versatile water quality modelling in 1D, 2D or 3D systems including physical, (bio)chemical and biological processes. User Man. 2020, 210. [Google Scholar]
  19. HIDROMOD. Available online: https://hidromod.com/home-pt/ (accessed on 2 April 2020).
  20. MARETEC. Available online: http://www.maretec.org/ (accessed on 2 April 2020).
  21. TOPEX. Available online: https://sealevel.jpl.nasa.gov/missions/topex/ (accessed on 2 April 2020).
  22. COPERNICUS. Available online: https://marine.copernicus.eu/ (accessed on 2 April 2020).
  23. SNIRH. Available online: https://snirh.apambiente.pt/ (accessed on 2 April 2020).
  24. ECMWF. Available online: www.ecmwf.int (accessed on 2 April 2020).
  25. van Rijn, L.C.; Walstra, D.-J.R.; van Ormondt, M. Unified view of sediment transport by currents and waves. IV: Application of morphodynamic. Model. J. Hydraul. Eng. 2007, 133, 776–793. [Google Scholar] [CrossRef]
  26. Pawlowicz, R.; Beardsley, B.; Lentz, S. Classical tidal harmonic analysis including error estimates in MATLAB using T_TIDE. Comput. Geosci. 2002, 28, 929–937. [Google Scholar] [CrossRef]
  27. Pugh, D.T. Changing Sea Levels: Effects of Tides, Weather and Climate; Cambridge University Press: Cambridge, UK, 2004; p. 265. [Google Scholar]
  28. Picado, A.; Dias, J.M.; Fortunato, A.B. Tidal changes in estuarine systems induced by local geomorphologic modifications. Cont. Shelf Res. 2010, 30, 1854–1864. [Google Scholar] [CrossRef] [Green Version]
  29. Monsen, N.E.; Cloern, J.E.; Lucas, L.V.; Monismith, S.G. A comment on the use of flushing time, residence time, and age as transport time scales. Limnol. Oceanogr. 2002, 47, 1545–1553. [Google Scholar] [CrossRef] [Green Version]
  30. Abdelrhman, M.A. Modeling how a hurricane barrier in New Bedford Harbor, Massachusetts, affects the hydrodynamics and residence time. Estuaries 2002, 25, 177–196. [Google Scholar] [CrossRef]
  31. Marsooli, R.; Orton, P.M.; Fitzpatrick, J.; Smith, H. Residence time of a highly urbanized estuary: Jamaica Bay, New York. J. Mar. Sci. Eng. 2018, 6, 44. [Google Scholar]
  32. Dyer, K.R. Estuaries: A Physical Introduction, 2nd ed.; John Wiley and Sons: London, UK, 1997; p. 210. [Google Scholar]
  33. Marta-Almeida, M.; Dubert, J. The structure of tides in the Western Iberian region. Cont. Shelf Res. 2006, 26, 385–400. [Google Scholar] [CrossRef]
  34. Vargas, C.I.C.; Vaz, N.; Dias, J.M. An evaluation of climate change effects in estuarine salinity patterns: Application to Ria de Aveiro shallow water system. Estuar. Coast. Shelf Sci. 2017, 189, 33–45. [Google Scholar] [CrossRef]
  35. Dias, J.M.; Valentim, J.M.; Sousa, M.C. A numerical study of local variations in tidal regime of tagus Estuary, Portugal. PLoS ONE 2013, 8, 13. [Google Scholar] [CrossRef]
  36. Sousa, M.C.; Ribeiro, A.S.; Des, M.; Mendes, R.; Alvarez, I.; Gomez-Gesteira, M.; Dias, J.M. Integrated high-resolution numerical model for the NW Iberian Peninsula coast and main estuarine systems. J. Coast. Res. 2018, 85, 66–70. [Google Scholar] [CrossRef]
  37. Vaz, L.; Frankenbach, S.; Serôdio, J.; Dias, J.M. New insights about the primary production dependence on abiotic factors: Ria de Aveiro case study. Ecol. Indic. 2019, 106, 105555. [Google Scholar] [CrossRef]
  38. Dronkers, J. Tidal asymmetry and estuarine morphology. Netherlands J. Sea Res. 1986, 20, 117–131. [Google Scholar] [CrossRef]
  39. Guo, L.; Brand, M.; Sanders, B.F.; Foufoula-Georgiou, E.; Stein, E.D. Tidal asymmetry and residual sediment transport in a short tidal basin under sea level rise. Adv. Water Resour. 2018, 121, 1–8. [Google Scholar] [CrossRef]
  40. Nidzieko, N.J. Tidal asymmetry in estuaries with mixed semidiurnal/diurnal tides. J. Geophys. Res. 2010, 115, 1–13. [Google Scholar] [CrossRef] [Green Version]
  41. Friedrichs, C.T.; Aubrey, D.G. Non-linear tidal distortion in shallow well-mixed estuaries: A synthesis. Estuar. Coast. Shelf Sci. 1988, 27, 521–545. [Google Scholar] [CrossRef]
  42. Sheldon, J.E.; Alber, M. The calculation of estuarine turnover times using freshwatre fraction and tidal prism models: A critical evaluation. Estuaries Coasts 2006, 29, 133–146. [Google Scholar] [CrossRef]
  43. Iriarte, A.; Aravena, G.; Villate, F.; Uriarte, I.; Ibáñez, B.; Llope, M.; Stenseth, N.C. Dissolved oxygen in contrasting estuaries of the Bay of Biscay: Effects of temperature, river discharge and chlorophyll a. Mar. Ecol. Prog. Ser. 2010, 418, 57–71. [Google Scholar] [CrossRef] [Green Version]
  44. Sampou, P.; Kemp, W.M. Factors regulating plankton community respiration in Chesapeake Bay. Mar. Ecol. Prog. Ser. 1994, 110, 249–258. [Google Scholar] [CrossRef]
  45. Davison, I.R. Environmental effects on algal photosynthesis: Temperature. J. Phycol. 1991, 27, 2–8. [Google Scholar] [CrossRef]
  46. Lange, R.; Staaland, H.; Mostad, A. The effect of salinity and temperature on solubility of oxygen and respiratory rate in oxygen-dependent marine invertebrates. J. Exp. Mar. Bio. Ecol. 1972, 9, 217–229. [Google Scholar] [CrossRef]
  47. Howland, R.J.M.; Tappin, A.D.; Uncles, R.J.; Plummer, D.H.; Bloomer, N.J. Distributions and seasonal variability of pH and alkalinity in the Tweed Estuary, UK. Sci. Total Environ. 2000, 251, 125–138. [Google Scholar] [CrossRef]
  48. Newton, A.; Oliveira, P.S.; Icely, J.D.; Foster, P.A. Monitoring of oxygen condition in the Ria Formosa coastal lagoon, Portugal. J. Environ. Monit. 2010, 12, 355–360. [Google Scholar] [CrossRef]
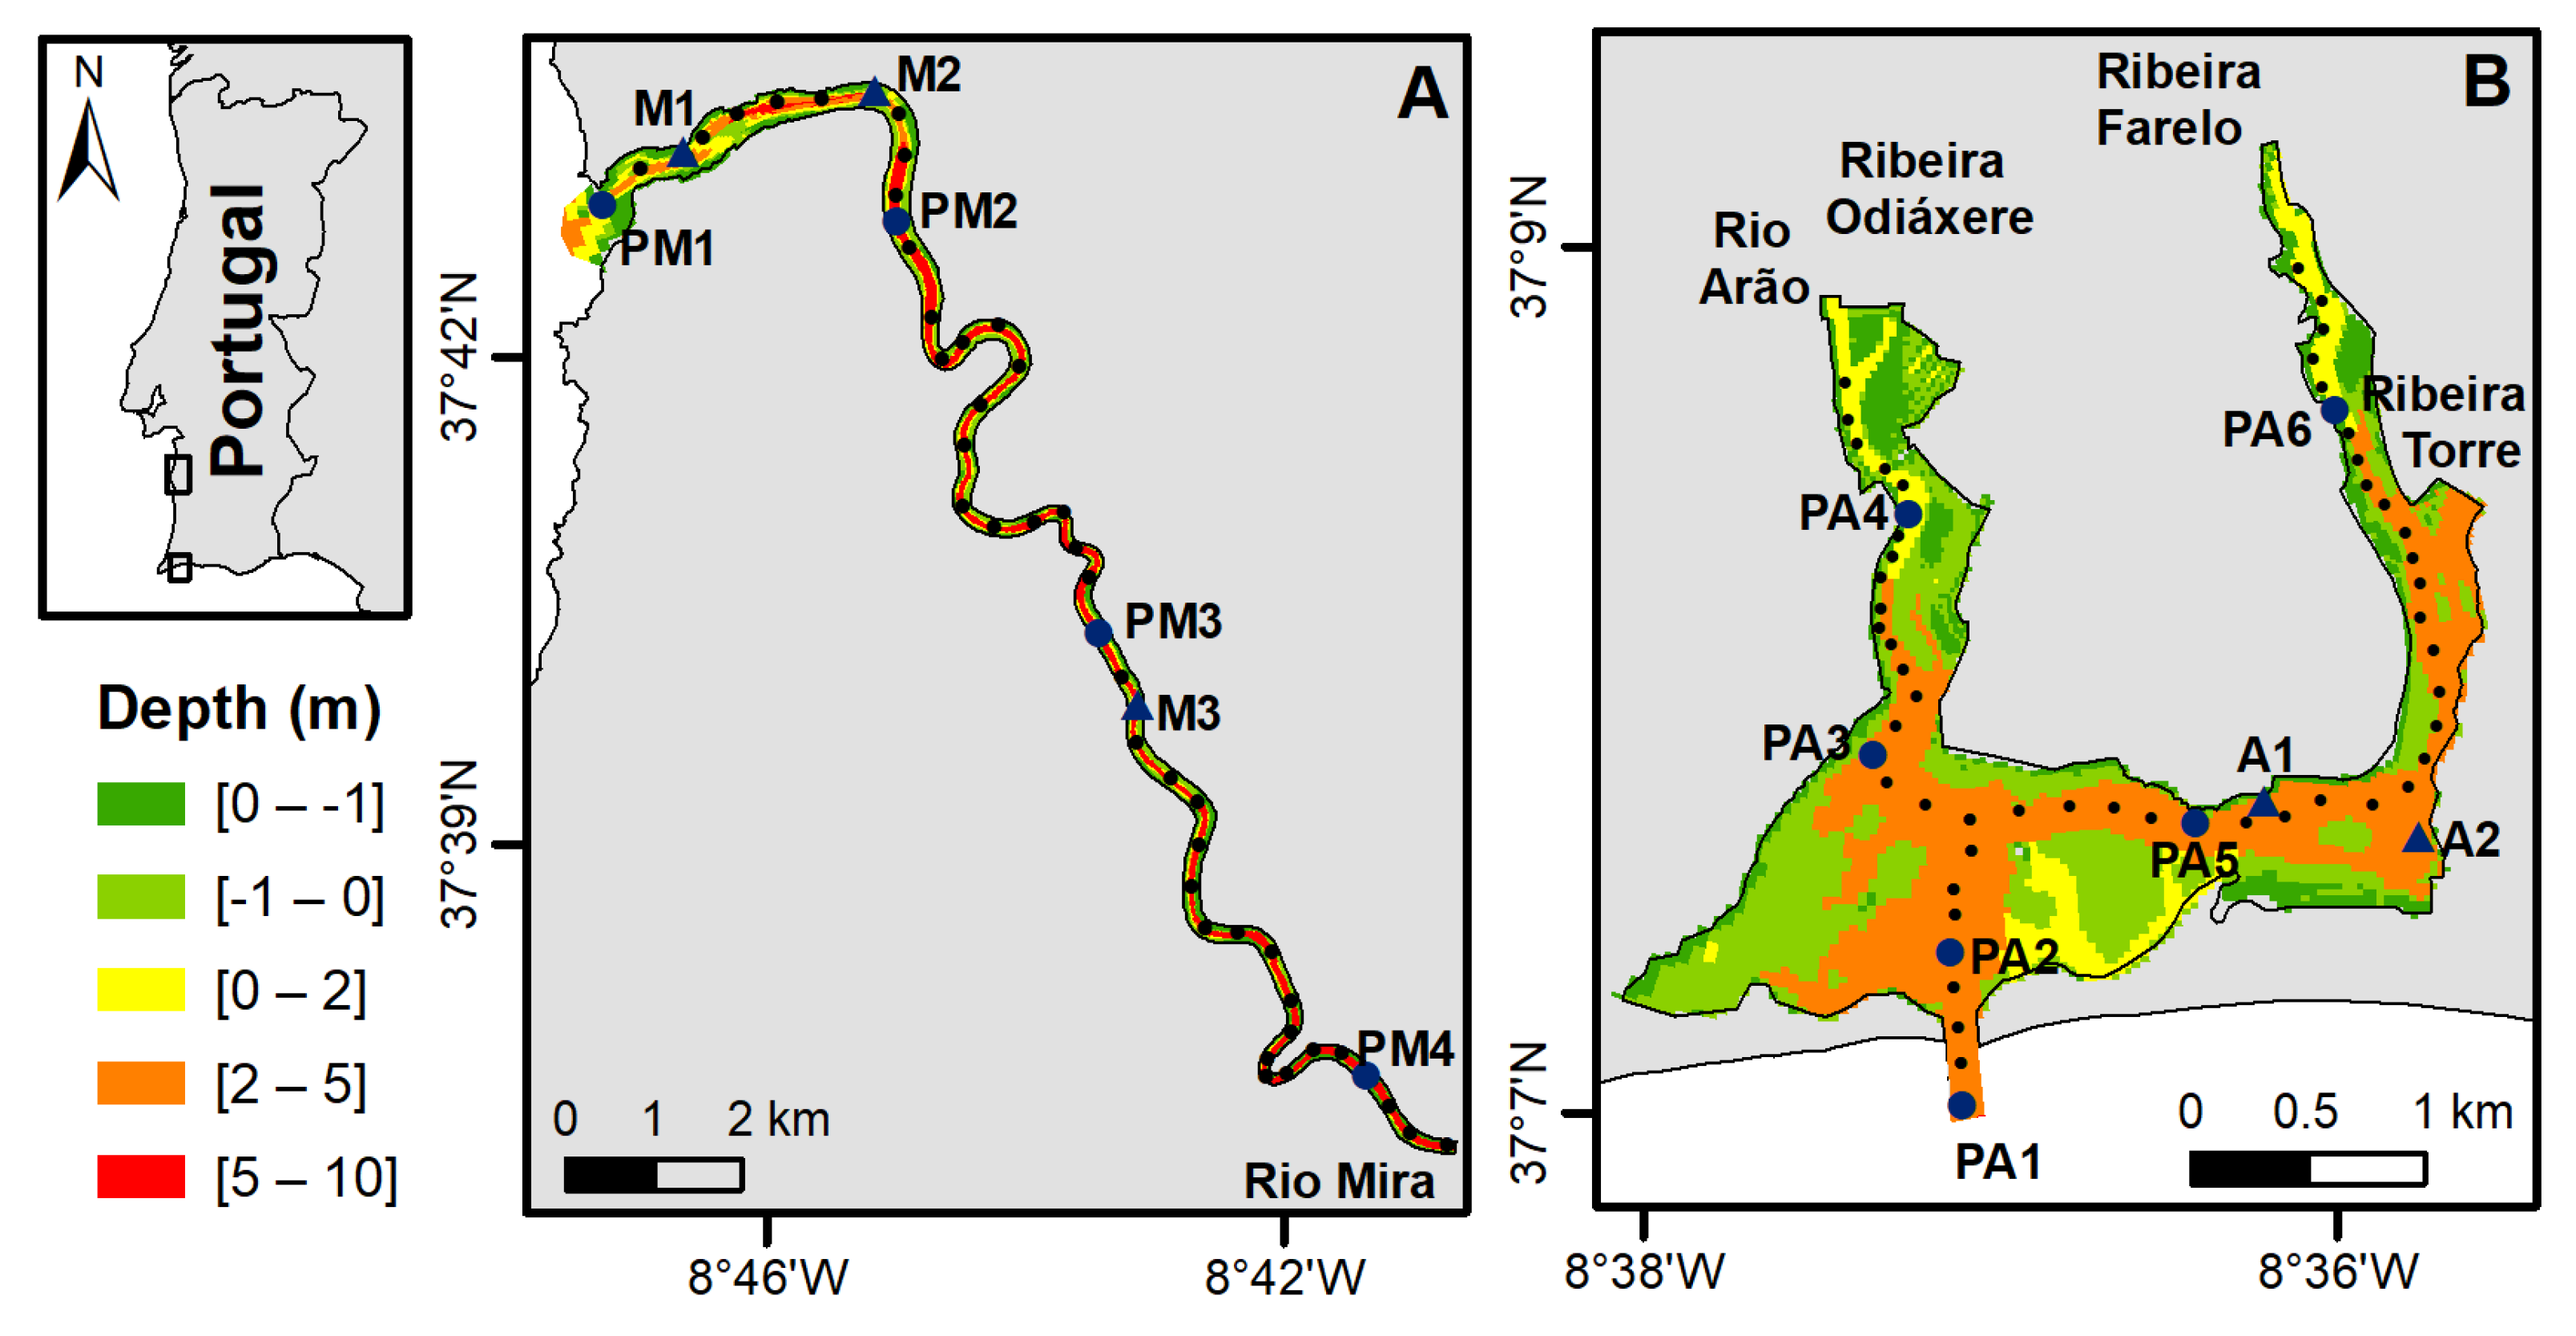
Figure 1. Bathymetry of Mira Estuary (A) and Ria de Alvor (B), with the location of the sampling stations (blue triangles), the points where the harmonic analysis and tidal asymmetry were computed (black dots), and the points where seasonal analysis of physico-chemical parameters was performed (blue dots).
Jmse 08 00537 g001
Figure 2. Observed and predicted sea surface elevation (SSE), water temperature, salinity, dissolved oxygen (DO) and pH for M1, M2, and M3 stations located at Mira Estuary on 25th (M1 and M2) and 26th (M3) September 2019.
Jmse 08 00537 g002
Figure 3. Observed and predicted SSE, current velocity (components u and v), water temperature, salinity, DO, and pH for (A1) and (A2) stations located at Ria de Alvor on 25 October 2018.
Jmse 08 00537 g003
Figure 4. Amplitude ratio and relative phase (°) throughout the axis of the Mira and Ria de Alvor channels (see Figure 1).
Jmse 08 00537 g004
Figure 5. Mira Estuary residence time (days) and freshwater fraction for winter (A,C) and summer (B,D) conditions.
Jmse 08 00537 g005
Figure 6. Ria de Alvor residence time (days) and freshwater fraction for winter (A,C) and summer (B,D) conditions.
Jmse 08 00537 g006
Figure 7. Monthly mean of water temperature (°C), salinity, DO (g/m3), and pH at four points throughout Mira Estuary (red dots in Figure 1A).
Jmse 08 00537 g007
Figure 8. Monthly mean of water temperature (°C), salinity, DO (g/m3), and pH at six points throughout the Ria de Alvor (red dots in Figure 1B).
Jmse 08 00537 g008
Figure 9. Annual mean water temperature (°C) (A), salinity (B), DO (g/m3) (C), and pH (D) for Mira Estuary.
Jmse 08 00537 g009
Figure 10. Annual mean water temperature (°C) (A), salinity (B), DO (g/m3) (C), and pH (D) for Ria de Alvor.
Jmse 08 00537 g010
Figure 11. Relation between dissolved oxygen concentration (g/m3) and the residence time throughout Mira Estuary and Ria de Alvor, for winter (blue dots) and summer (red dots).
Jmse 08 00537 g011
Table 1. Parameters used in the WAQ module.
ParameterValueUnit
MiraAlvor
Maximum production rate greens 123d−1
Maintenance respiration greens 10.050.045d−1
Growth respiration factor greens 10.150.15-
Mortality rate constant greens 10.350.35d−1
1 Greens refer to Algae (non-diatoms).
Table 2. Root mean square error (RMSE) for Mira estuary (M1, M2, M3) and Ria de Alvor (A1, A2) stations.
VariableM1M2M3A1A2
SSE (m)0.130.130.160.13-
Velocity u (m/s)----0.13
Velocity v (m/s)----0.03
Water temperature (˚C)0.610.630.730.200.14
Salinity1.051.210.790.450.71
DO (g/m3)0.450.470.260.380.62
pH0.040.260.040.050.05
Table 3. Amplitude and phase of the main tidal constituents and Form Factor (FF) for Mira Estuary and Ria de Alvor.
Mira EstuaryRia de Alvor
ConstituentPM1PM2PM3PM4PA1PA2PA3PA4PA5PA6
Amplitude (m)M20.640.490.510.511.001.001.000.671.000.97
S20.180.130.140.140.340.340.340.310.340.32
K10.070.070.070.070.080.080.080.080.080.08
O10.050.050.050.050.060.060.060.050.060.06
M40.100.090.100.100.020.020.010.040.030.07
M60.010.010.010.020.0010.0040.0030.0090.0010.017
Phase (°)M281.8121.5126.5128.351.954.855.257.457.061.1
S2115.6161.5166.9169.188.993.093.696.996.3102.3
K196.5119.6122.8124.261.864.264.669.666.271.8
O1346.97.510.311.5307.6310.1310.6316.4311.9317.8
M4124.7176.2187.6191.0141.7119.2102.183.771.578.4
M6349.9304.4326.3331.8130.4107.0118.2349.8101.638.0
FF0.150.180.180.180.100.100.100.100.100.10
Table 4. Tidal prism (m3) computed at the mouth channel section for Mira Estuary and Ria de Alvor.
TideMira EstuaryRia de Alvor
FloodEbbFloodEbb
Spring Tide10.65 × 1065.78 × 1067.84 × 1068.68 × 106
Neap Tide5.91 × 1063.83 × 1064.23 × 1064.72 × 106