Article

Investigating the Erosion Resistance of Different Vegetated Surfaces for Ecological Enhancement of Sea Dikes

by
Babette Scheres
* and
Holger Schüttrumpf
Institute of Hydraulic Engineering and Water Resources Management, RWTH Aachen University, Mies-van-der-Rohe-Straße 17, 52056 Aachen, Germany
*
Author to whom correspondence should be addressed.
J. Mar. Sci. Eng. 2020, 8(7), 519; https://doi.org/10.3390/jmse8070519
Submission received: 31 May 2020 / Revised: 24 June 2020 / Accepted: 10 July 2020 / Published: 15 July 2020
(This article belongs to the Special Issue Hydraulic Model Testing Techniques)

Abstract

:
Dense grass covers are generally recommended for surface protection of sea dikes against mild and moderate hydraulic loads. The standard seeding mixtures were composed to meet the technical requirements and ensure dike safety. These mixtures are, however, limited in their species diversity. In the present study, four differently vegetated surfaces were tested regarding their erosion resistance against wave impacts and overflow. The test vegetations ranged from a species-poor grass-dominated reference mixture to species-rich herb-dominated mixtures. Two vegetations were reinforced with a three-dimensional geogrid. For the unreinforced vegetations, the erosion rate due to wave impacts decreased exponentially with increasing root density and root length density. The geogrid reinforcements functioned as additional protection when the upper vegetation layer was eroded and led to slightly decreasing erosion rate with depth. In overflow simulations, the relatively densely-vegetated grass-dominated mixture experienced least erosion. Erosion was mainly initiated at bare spots emphasizing the major role of a closed vegetation cover and dike maintenance. The present results give new insights into erosion patterns of unreinforced and reinforced vegetated dike covers and the relation between vegetation parameters and hydraulic resistance to wave impacts and overflow.

1. Introduction

Rising global mean sea water levels [1,2] and, relating thereto, changes in storm surge water levels [3] and wave heights [4] are expected due to climate change resulting in increased design heights for coastal protection [5]. In addition to increasing loads due to climate change, altering of infrastructure and growing environmental awareness require adaptations of coastal protection, especially towards more natural or nature-based solutions [6,7,8]. Coastal ecosystems, e.g., reefs, salt marshes, or mangrove forests, have proven to provide valuable ecosystem services, amongst others coastal protection services, such as wave damping effects or sediment stabilization [9,10,11]. Still, hard coastal protection infrastructure, i.e., dikes, seawalls, breakwaters etc., continue to be necessary in cases of high hydrodynamic loads, restricted space availability or high value of protected objects and goods [12]. These artificial structures can be ecologically enhanced to conserve or promote ecosystem services, e.g., with structural adaptations that support the colonization with fauna or establishment of vegetation on the structure [13,14,15]. Potential nature-based adaptations for sea dike systems were found by (i) promoting foreshore ecosystems and (ii) enhancing the ecological value of the dike structure itself, e.g., by adapting the seeding mixtures of vegetated dike covers towards ecologically more valuable vegetation [16].

1.1. Vegetated Clay Layers as Dike Cover

Sea dikes are commonly built from a sand core covered with a clay layer. This shore-parallel structure forms a barrier between land and sea; thus, protecting the hinterland from flooding. To prevent external erosion due to hydraulic loads, dense grass covers or, for highly loaded dike sections, hard revetments are applied for dike surface protection [17]. Scheres and Schüttrumpf (2019) [16] give an overview on the structure, function and current design practice of vegetated clay layers. The recommended seeding mixtures for sea dike vegetation on German dikes consist of different grasses and optionally a small percentage of herbs [18]. These mixtures are known to provide surface protection against erosion caused by moderate hydraulic, mechanical, and climatic impacts.

1.2. Erosion on the Seaward Dike Slope Due to Wave Impacts

When a plunging breaker impinges the seaward dike slope, a wave impact of high pressure, although temporally and spatially limited, occurs [19,20,21,22]. Due to stochastic processes during wave breaking and wave–wave interaction, each wave impact results in a different load pattern with variations in space and pressure height, even for regular waves [23]. The main impact forces on sloped structures can be expected at a depth of approximately 0.5·HS below still water level [19,23].
A limited number of experimental studies on the erosion of vegetated slopes due to wave impacts exists. Overall, it was concluded in TAW (1997) that no damage has to be expected due to waves of 0.75 m height for good erosion-resistant grass covers. Very good grass covers on a 1:3 or 1:4 slope and erosion-resistant undersoil can withstand waves up to 1.0 m for at least one day [24]. Similar results were obtained by Piontkowitz (2012) where minor damage of the good quality grass cover resulted from waves with HS = 0.7 m and significant damage from HS = 0.9 m [25].
Strongest erosion was found within a depth of 0.3·HS to 0.6·HS below still water level [26]. Locally the erosion rate varied and deeper erosion holes evolved [26]. The erosion process accelerated when the well-rooted turf has eroded and the root density decreased [27].
Preliminary erosion models were developed by Seijffert and Verheij (1998) and van Steeg et al. (2015) relating the erosion rate to the significant wave height [27,28], see Table 1. In both models, relevant parameters, such as the root density, root length, wave steepness, or slope, were not directly incorporated, but considered by erosion coefficients for the investigated situations. Van Steeg et al. (2015) included a threshold wave height of 0.5 m below which no erosion has to be expected based on full-scale laboratory tests on grass slopes with initial damage [28].

1.3. Erosion on the Landward Dike Slope Due to Wave Overtopping and Overflow

If the water level exceeds the height of a coastal structure, steady overflow occurs. In contrast, wave overtopping refers to the intermittent process of single waves passing over a coastal structure. Both processes occuring at the same time is called combined wave and surge overtopping. Wave overtopping and overflow are generally described by means of the water volume flowing over the structure per time unit and unit width, i.e., m³/(sm) or m²/s. To consider the unsteady nature of wave overtopping, mean overtopping discharges are indicated in design formulas.
Water flowing over the crest and landward slope of a coastal structure can induce damage on the structure’s surface due to erosion. For steady overflow, Hewlett et al. (1987) [29] give limiting flow velocities for grass surfaces in good, average, and poor condition in connection with flow duration for which erosion remains acceptable. For wave overtopping, tolerable maximum mean overtopping discharges are recommended neglecting the load duration, e.g., qmean,max = 5 l/(sm) for maintained, closed grass covers, and significant wave heights of Hm0 = 1–3 m [30]. In most tests, the grass covers resisted higher mean overtopping discharges [25,31,32], but weak points, such as bare spots or mice holes, can reduce the erosion resistance significantly [30,33]. A detailed overview on existing laboratory and in situ studies on the erosion resistance of grass covers against overflow and wave overtopping is given in the appendix of Scheres and Schüttrumpf (2019) [16].
To include the effect of overtopping duration, Dean et al. (2010) developed an erosion model assuming that unacceptable erosion occurs when the cumulative excess flow work (proportional to the flow velocity ) exceeds a threshold value, the so-called erosion limit. Threshold velocities and erosion limits were calculated based on the data of Hewlett et al. (1987) for steady overflow [29] and the model was expanded for intermittent wave overtopping with the need for verification [34]. Further developments were pursued by Hughes and Thornton (2015) in terms of slowly time-varying overflow [35]. A similar model based on excess shear stress (proportional to ) and considering that the main damage is caused by the high velocities of the wave front was developed by van der Meer et al. (2010) [36].
Comparing the results from overflow and overtopping tests on similar grass covers, van Damme et al. (2016) found that, for equal shear stresses, damage due to intermittent wave overtopping is higher than due to steady overflow. Thus, shear stress cannot be the predominant factor for erosion during overtopping. In fact, damages were observed at the location where the wave reattached to the slope and induced normal forces [37]. Ponsioen et al. (2019) conceptualize and validate a corresponding wave impact method that allows to predict the time and location of damage initiation during wave overtopping [38].
The erosion resistance depends, amongst others, on the condition and properties of the grass cover. In above mentioned studies, often the condition of the grass cover is classified for reference, e.g., good, average, or poor condition [29]. Root parameters, e.g., the number of roots [39], can be used for classification. However, more specific knowledge on the direct relation between hydraulic resistance and vegetation properties is preferable. In this matter, Thornton et al. (2014) found a correlation between the cumulative overtopping volume at failure and the product of average root length and root volume [40]. Studies on the effect of roots on erosion during concentrated flows show that soil detachment ratios can be best estimated with the root length density [41].

1.4. Research Aims and Overall Research Methodology

The species diversity of the recommended seeding mixtures for sea dike vegetation [18] and the food sources for blossom-seeking insects of these mixtures are limited [42]. With the main objective being to increase the ecosystem services of sea dikes, possible adaptations of the seeding mixtures towards ecologically more valuable dike vegetation were investigated within the project EcoDike (“Ecologically Friendly Sea Dikes and Revetments for Coastal Protection”, grant number 03F0757 A-F) on condition that the erosion resistance of this vegetation equals or surpasses that of currently used vegetations. Species-rich mixtures can have positive effects on the biodiversity and ecological value of sea dikes [42]. However, the suitability of biodiverse mixtures with herbs for sea dike vegetation in terms of sufficient erosion protection cannot be scientifically assessed yet. Previous studies on the erosion resistance of vegetated dike covers (see Section 1.2 and Section 1.3) focused mainly on grass covers or did not further explore the vegetation composition. Regarding rainfall loads, an increase of soil erosion resistance was found with increasing vegetation diversity [43]. Against this background, the study at hand presents results of experimental wave impact and overflow simulations with different grass-, grass-herb-, and herb-mixtures to investigate (i) the erosion resistance of differently diverse and ecologically valuable vegetation compositions and (ii) the relation between hydraulic resistance and vegetation properties.

2. Materials and Methods

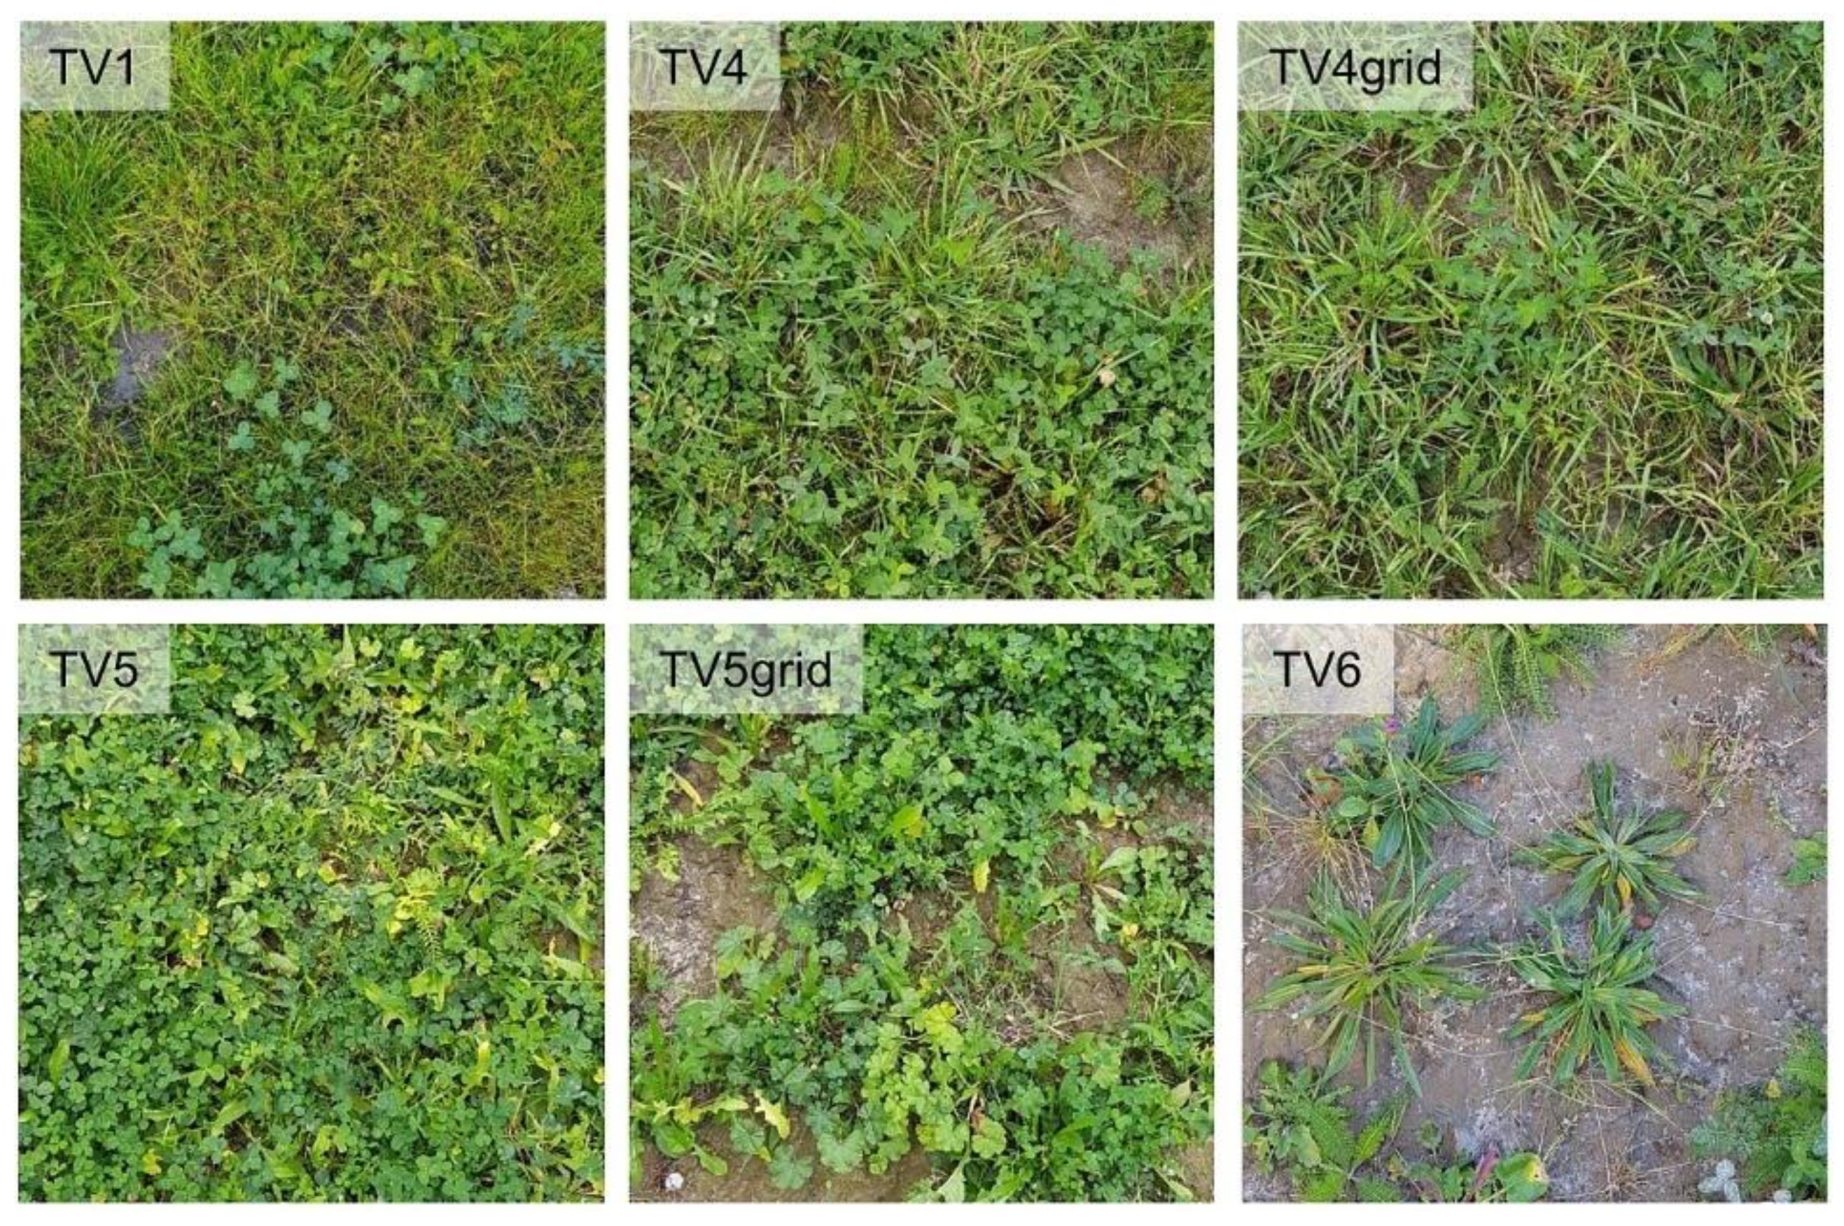
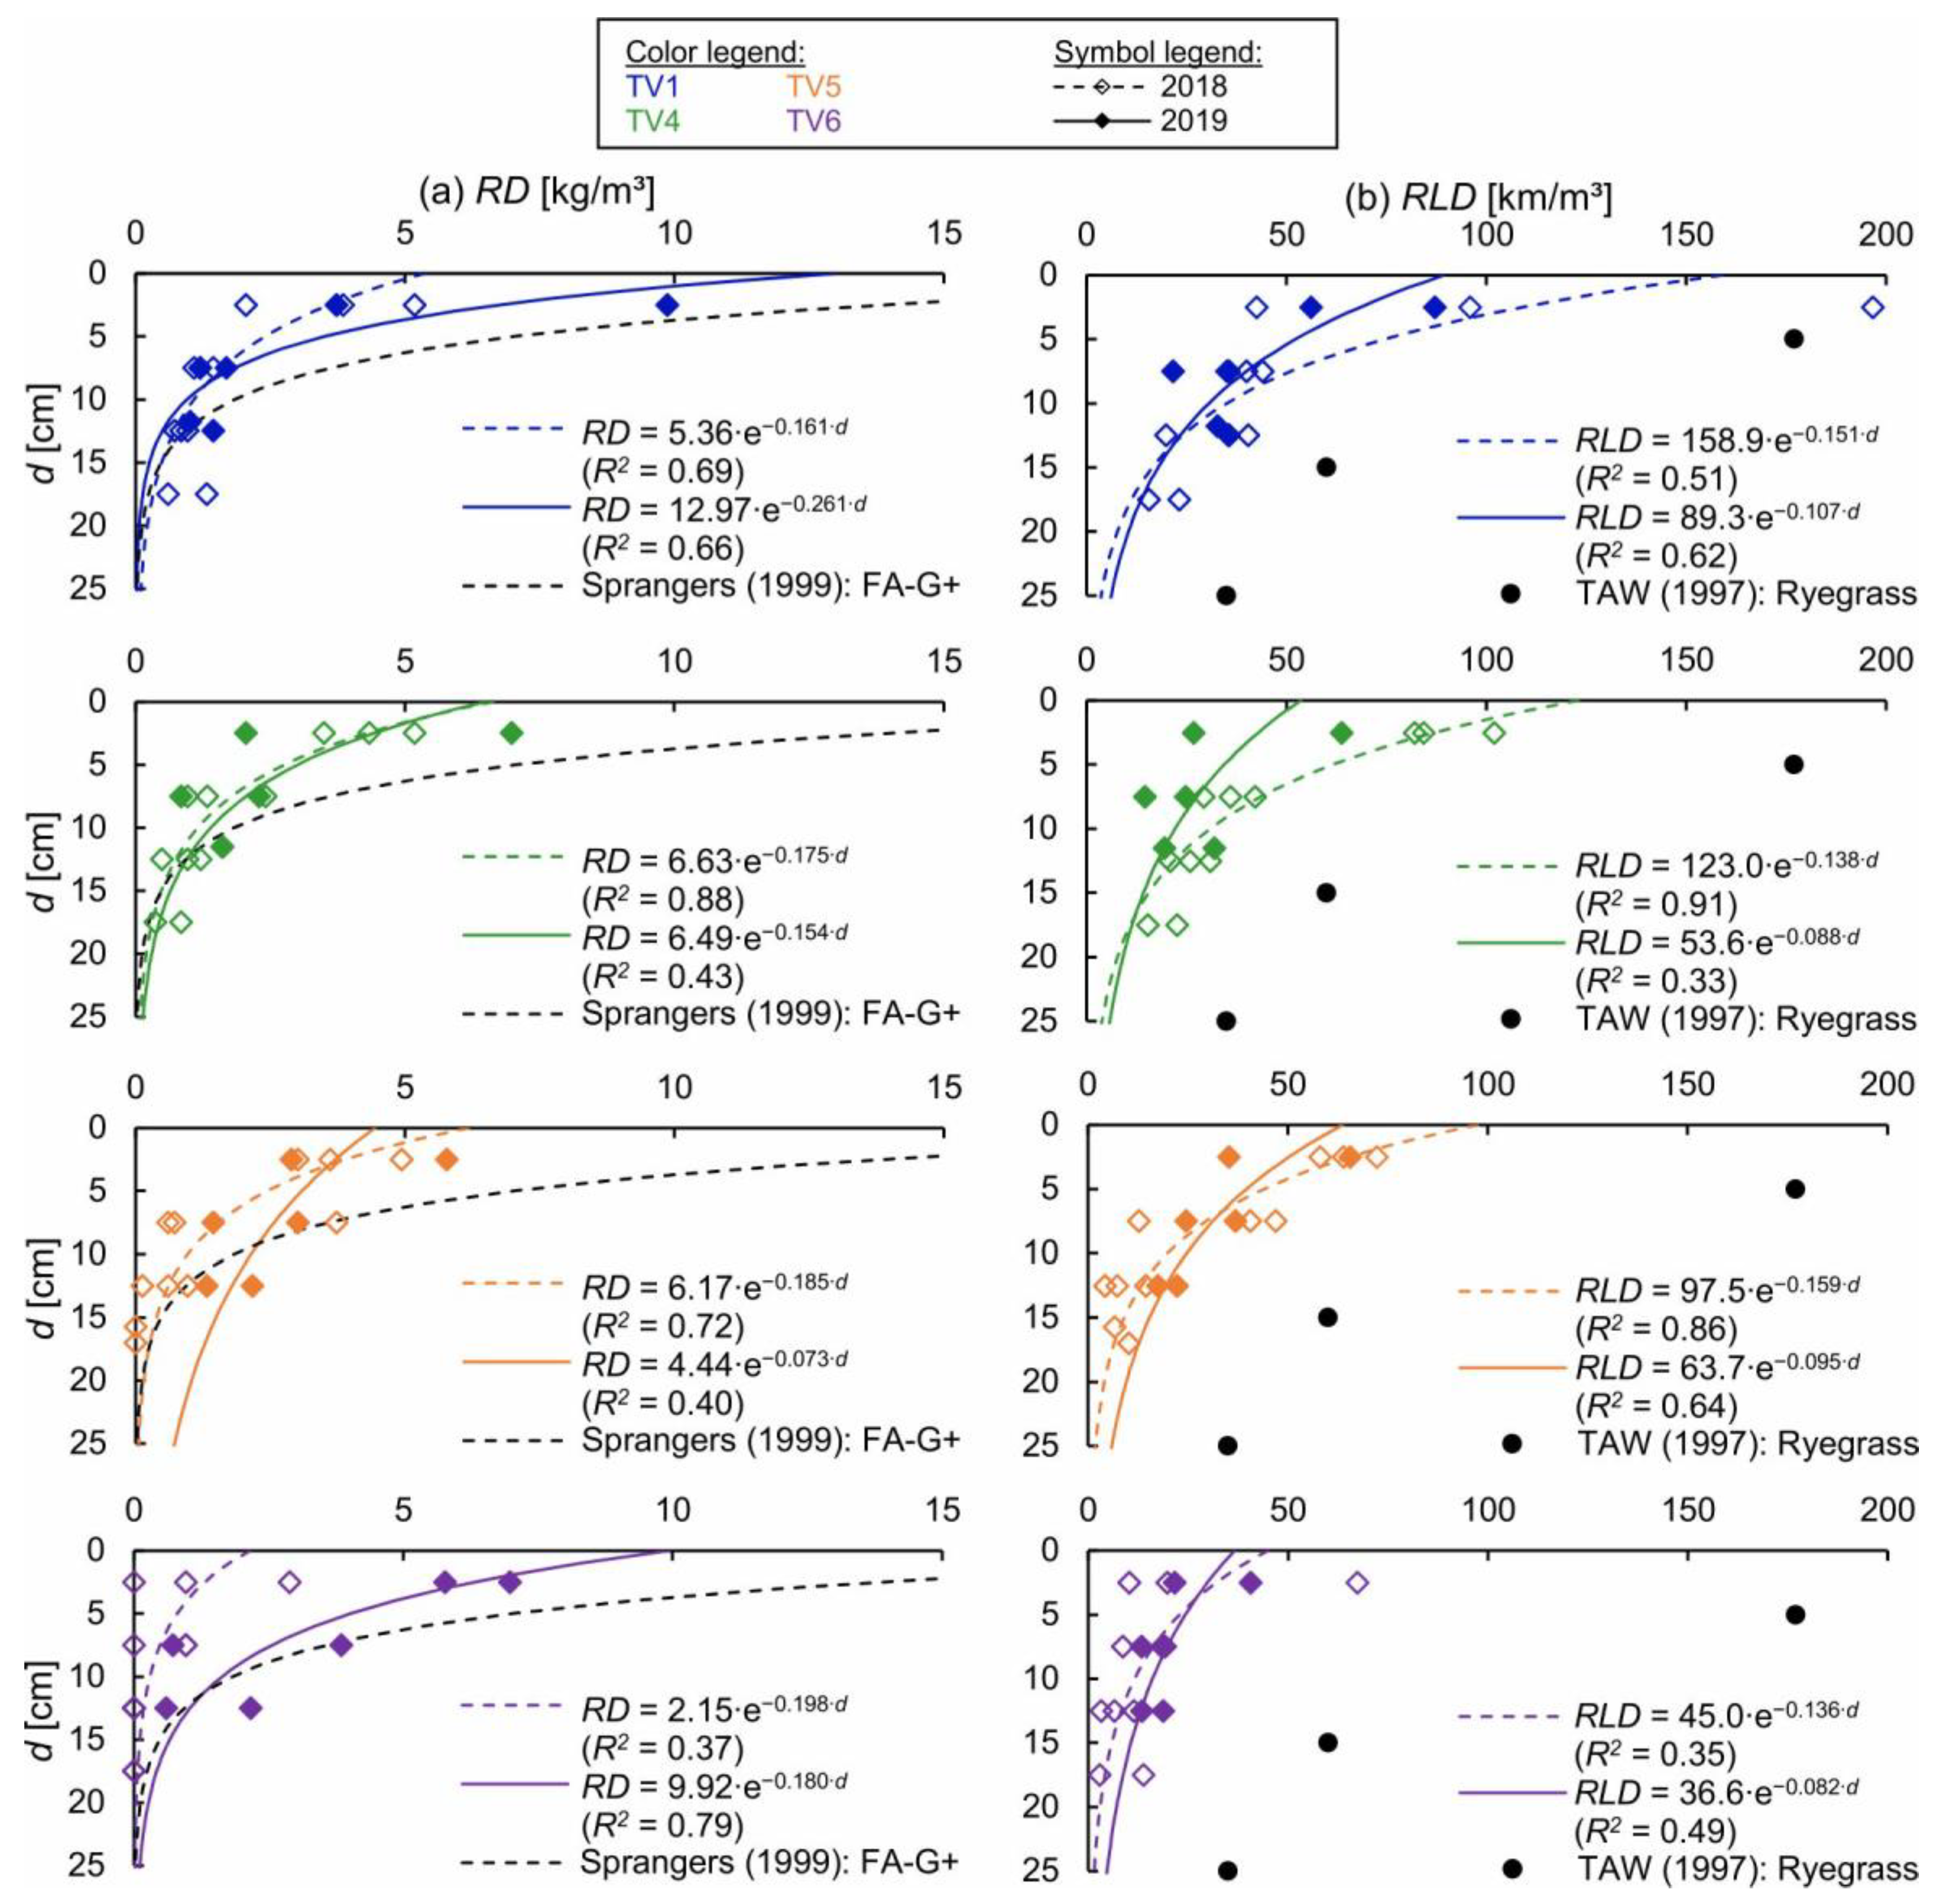
2.1. Test Vegetations and Botanical Analyses

Six differently vegetated and reinforced surfaces were investigated during hydraulic model tests. The composition of the test vegetations (TVs) resulted from analyses of the ecological value under consideration of dike safety [42]:
(1)
TV1: species-poor grass-dominated reference mixture (4 species, standard mixture after [18]),
(2)
TV4: grass-herb mixture (10 species) [42],
(3)
TV5: species-rich herb-dominated EcoDike mixture (18 species) [42], and
(4)
TV6: species-rich herb-dominated ready-mix (20 species) [42].
The test vegetations TV4 and TV5 were additionally reinforced with the three-dimensional soil reinforcement geogrid Fortrac® 3D by HUESKER. Test vegetations TV2 and TV3 (see [42]) were not tested due to spatial restrictions during vegetation establishment. All test vegetations were established in the courtyard of the Institute of Hydraulic Engineering and Water Resources Management, RWTH Aachen University (IWW), in 0.3 m high planter trays filled with clay suitable for sea dike covers. Prior to sawing in April 2018, the soil was fertilized with an organo-mineral compound fertilizer. A second fertilization took place four months after sawing. To prevent the seeds from drying out and to promote germination, the planter trays were watered in the beginning. Additional sprinkling was necessary during the exceptional heat wave in summer 2018. A cupping cut was performed three months after sawing to support the development of a closed sward and lateral shoots and to curb weeds. The vegetations were mowed again two months later (TV1 and TV4) and three months later (TV5 and TV6). Sea water spray simulations with 0.01 L salt water per m² and 3.5% salt concentration took place in September and October 2018, using a pressure spray device to simulate coastal conditions. After a vegetation period of around six months, the vegetated clay elements were transported into the adjacent hydraulics laboratory and installed into the testing facilities. Figure 1 illustrates the investigated dike covers prior to testing in autumn 2018.
The vegetation establishment was documented weekly via determination of the average grade of vegetation coverage cveg estimated with the auxiliary tables of Gehlker (1977) [45]. To determine the root parameters, soil samples with a depth of 0.15 m were taken using a steel cylinder of 0.05 m diameter. After removing the upper part of the sod, i.e., the aboveground vegetation and about 0.5 cm below soil surface, the samples were divided into layers of 0.05 m and stored in water for 24 h to facilitate the separation of roots and soil. The roots were scanned and analyzed using the semi-automated image analysis software SmartRoot [46]. The root length density RLD per layer results as the ratio of the total length of all roots within this layer and the volume of the layer. After drying the root samples at 105° C for 12 h, the root weight was measured. The root density RD per layer results as the ratio of the dry root weight within this layer and the volume of the layer. In 2018, three root samples were taken per test vegetation. In 2019, two root samples were taken per test vegetation. The test vegetations with geogrid reinforcement were not analyzed.

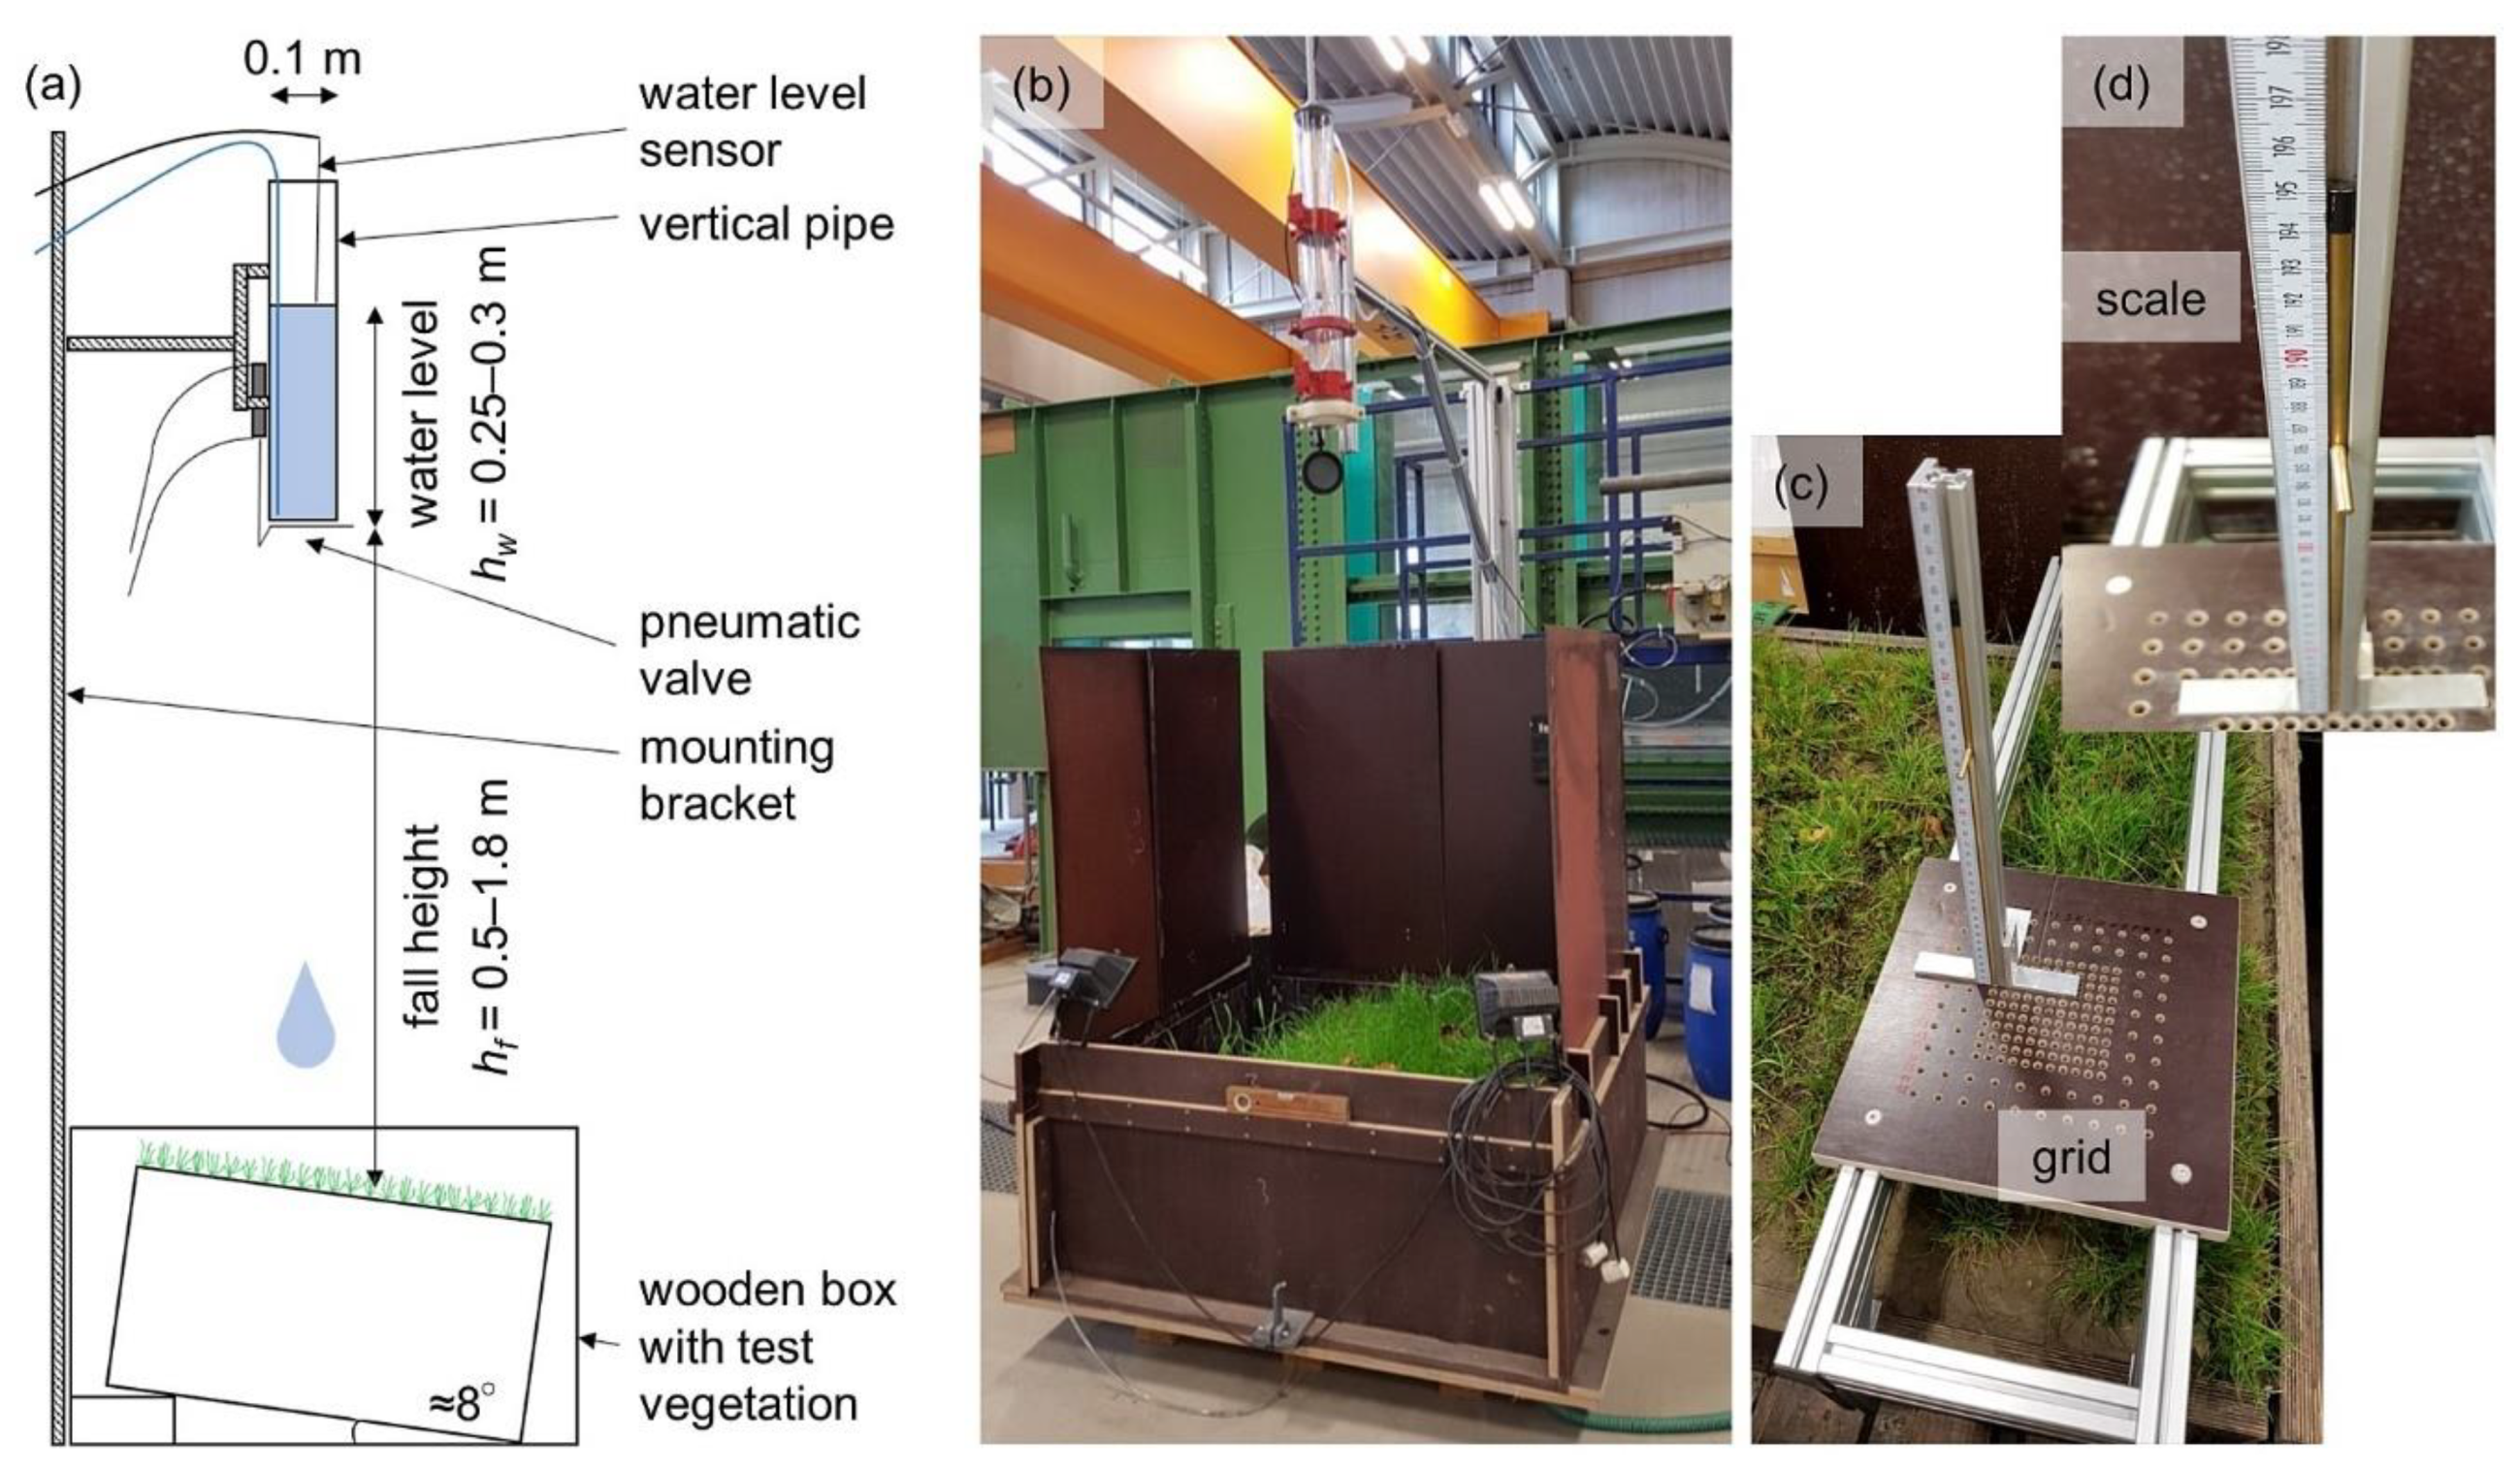
2.2. Wave Impact Simulations

For generation of reproducible wave-like impacts, the wave impact simulator by Stanczak (2008) [47] was used (Figure 2a,b). This test setup comprises a vertical water pipe of 0.1 m diameter which is mounted in a given height above the test object. A pneumatic-steered valve allows to seal the pipe. After filling water into the sealed pipe to a pre-defined water level, the valve is opened. The water mass is suddenly released and drops onto the test object simulating a wave impact.
The impact pressure depends on the fall height of the water mass hf and the water level in the pipe hw. For determination of the maximum impact pressures pmax, tests with a high precision pressure transmitter in the impact zone were performed (STS ATM.1ST accuracy ± 0.4 mbar and, only for hf = 1.8 m and hw = 0.3 m, WIKA P-31 accuracy ± 6 mbar). Figure 3a shows a typical signal of a wave impact simulation highlighting the very short impact duration and resemblance to real wave impacts. Figure 3b shows the maximum impact pressures measured for different fall heights and water levels in the pipe. Maximum wave-like impact pressures of 47.7 kPa were achieved with a fall height of 1.8 m and a water level in the pipe of 0.3 m. For comparison: Regular waves with a wave height of Hreg = 2.1 m and a wave period of Treg = 5.83 s result in a mean impact pressure of 35.1 kPa [48].
Four test series were performed per test vegetation: two in late autumn 2018 after a vegetation period of approx. six months, two in late autumn 2019 after a vegetation period of approx. 18 months. Within each test series, the impact pressure was increased after every 10 impacts by increasing the fall height from 0.5 to 1.8 m and water level from 0.25 to 0.3 m, respectively. Tests were stopped when an erosion depth of approximately 0.15 m was reached. The erosion depth was documented using a pin-profiler with a 0.01 m grid in the center and a 0.02 m grid in the outer area (Figure 2c,d). During the vegetation tests, the wave impact pressures could not be directly measured. Thus, the pressures measured during the tests with the load cell were used for subsequent analyses.

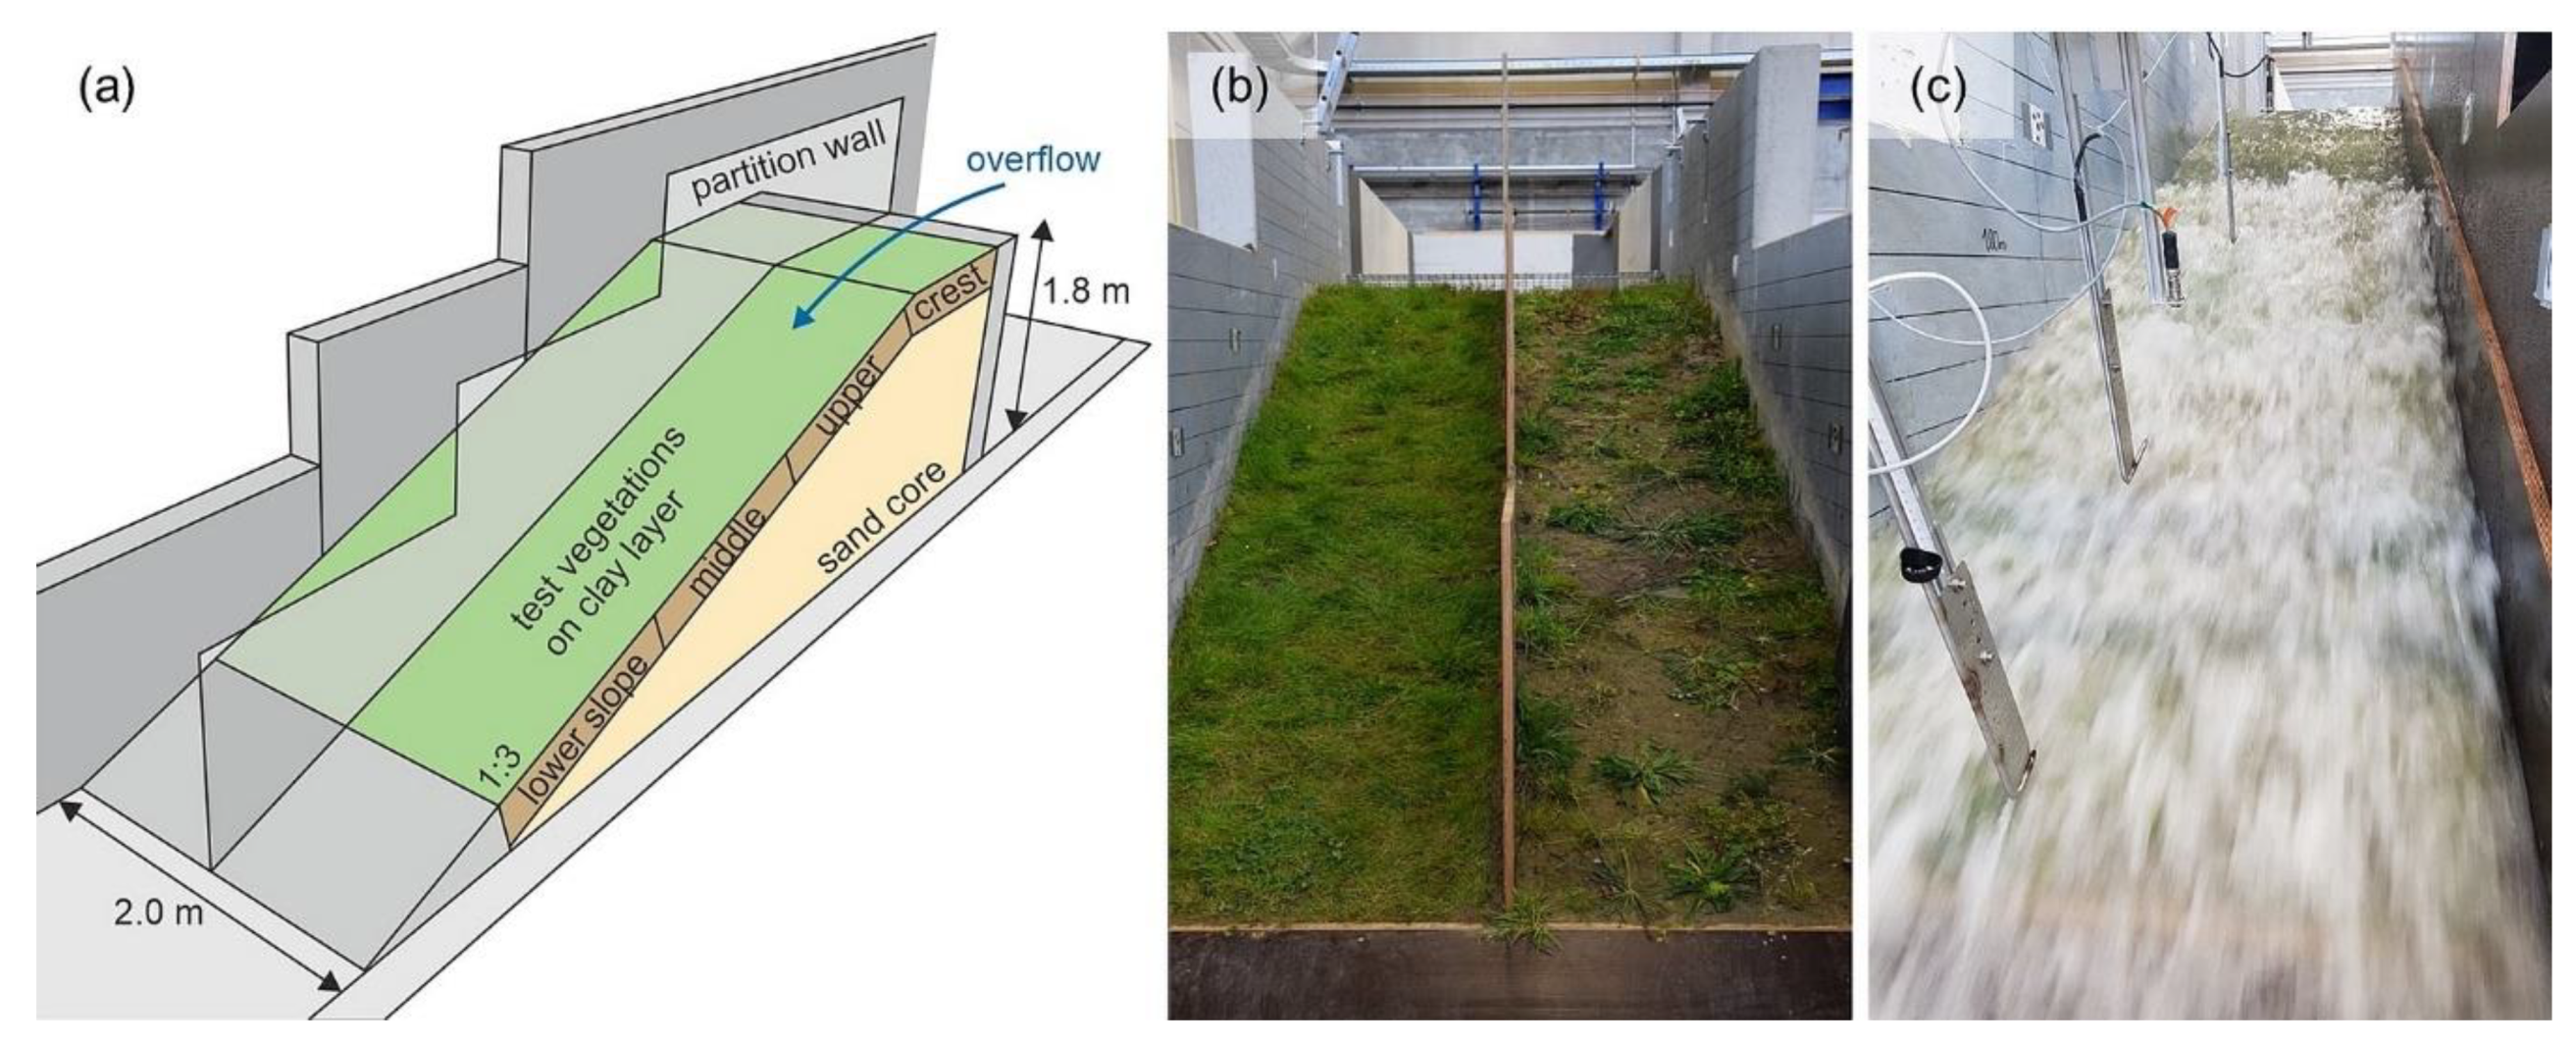
2.3. Overflow Simulations

Overflow simulations were performed on a 1.8 m high dike model with 1:3 landward slope constructed in the 2 m wide, 20 m long, and up to 3 m high flume of IWW (Figure 4a). The dike model consisted of a sand core covered with the test vegetations (Figure 4b) built against an impermeable supporting body. The dike cover was composed of four vegetation elements of 1.5 m length each (crest, upper, middle, and lower slope, see Figure 4a). The seaward slope was omitted. A partition wall centered in the flume divided the channel into two test sections of approximately 1 m width each. A sealing element at the upstream end of the dike model allowed for separate testing of each test section.
Steady water inflow was supplied by pipes connected to an elevated tank with a constant water level. The flow rates were controlled via the water level upstream of the dike crest. Measurements with double-tip conductivity probes from UNSW Water Research Laboratory (WRL) at three positions along the dike slope allowed the determination of flow velocities, clear water depths and shear stresses (Figure 4c). Details on the instrumentation and data processing are given in Scheres et al. (2020) [44].
The flow rates were incrementally increased, keeping a constant overflow for 45 minutes for the first four discharges (qw ≈ 0.01, 0.02, 0.035, and 0.045 m²/s) and 30 minutes for all larger discharges (qw ≈ 0.07, 0.09, 0.105, 0.135, and 0.195 m²/s). The experiments were stopped when the erosion reached the sand core which generally only occurred due to model effects at the flume walls where minor joints were closed with clay. The erosion progress was documented after each discharge level by estimations of the percentage of eroded area, measurements of the erosion depth along four cross sections with a pin-profiler, and photographs.

3. Results and Discussion

3.1. Vegetation Establishment

Figure 5 shows the root density RD (a) and root length density RLD (b) as function of the depth under surface d for all test vegetations without geogrid reinforcement. The data points are illustrated by diamonds; the corresponding regression analyses by lines.
Overall, RD and RLD decreased with increasing d. The functional relation can be described with an exponential function given in the graphs. In mean, TV1 resulted in the largest root length density within 0–5 cm depth, TV6 showed the lowest root length density (Figure 5b). A similar, but less pronounced tendency was found for the root density (Figure 5a), though an increase of RD for TV6 from 2018 to 2019 was noticed. No consistent change in RD or RLD can be observed comparing the measurements in autumn 2018 after a vegetation period of six months to the measurements in autumn 2019, i.e., the root density and root length density did not generally develop further in the second vegetation period. For TV1 and TV4, the mean RLD in the upper soil layer even decreased significantly from 2018 to 2019. It is assumed that the extreme summer in 2019 might have affected the vegetation establishment. The present root analyses were compared to data of previous in situ studies, see black dashed line and black circles in Figure 5. In general, lower root densities and lower root length densities were found for the present test vegetations in comparison to the measurements on real dikes with older vegetation [24,49]. This concurs with the fact that the development of a dense, deeply-rooted vegetation cover requires three to five years [27].

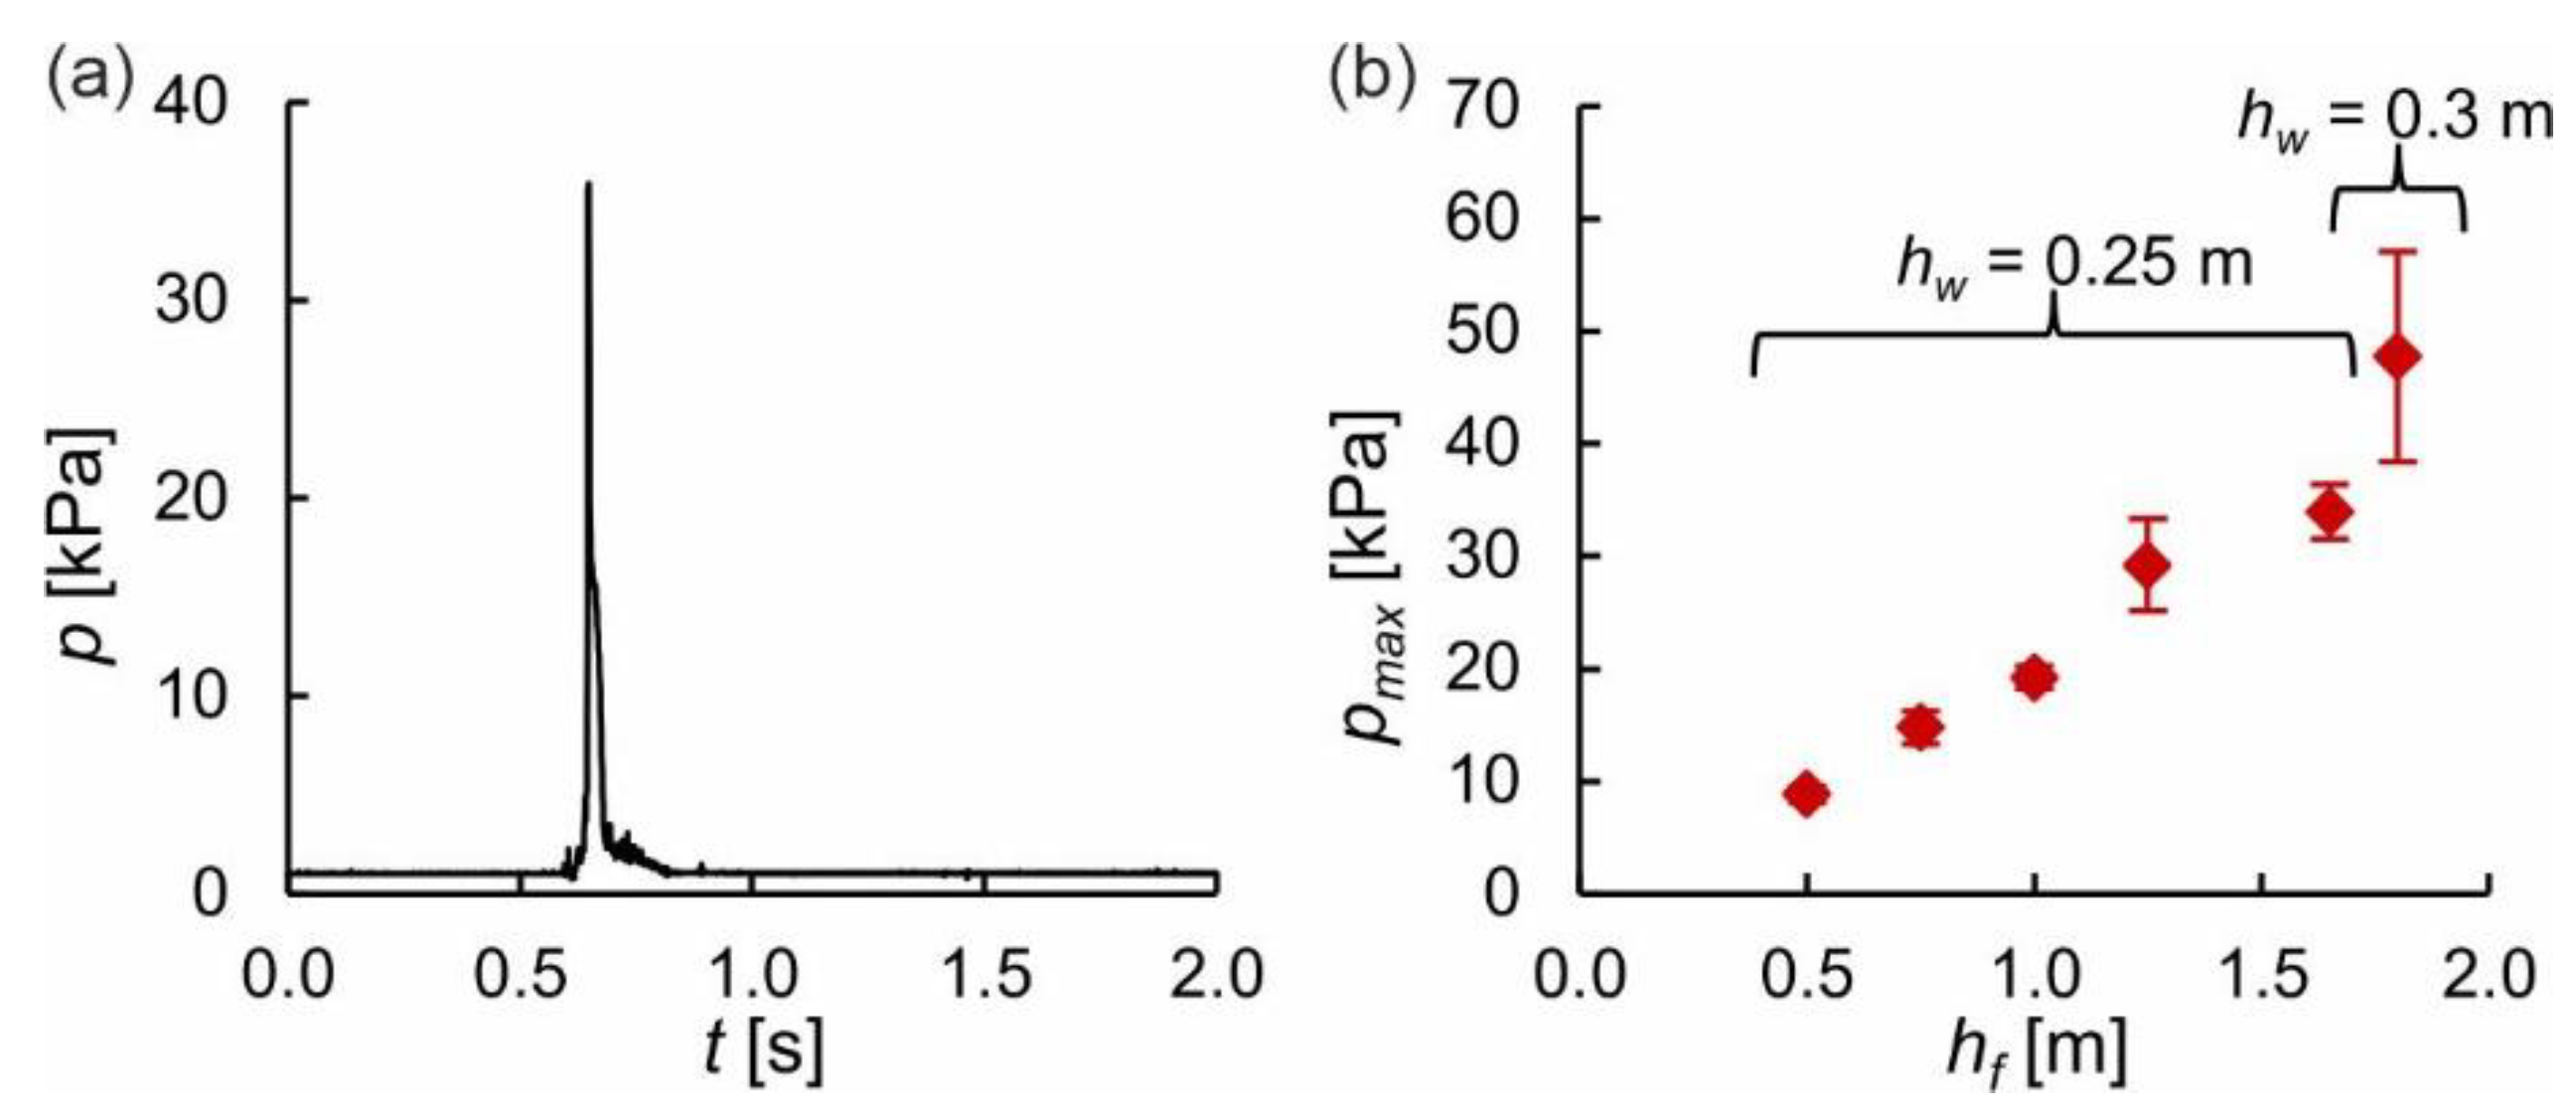
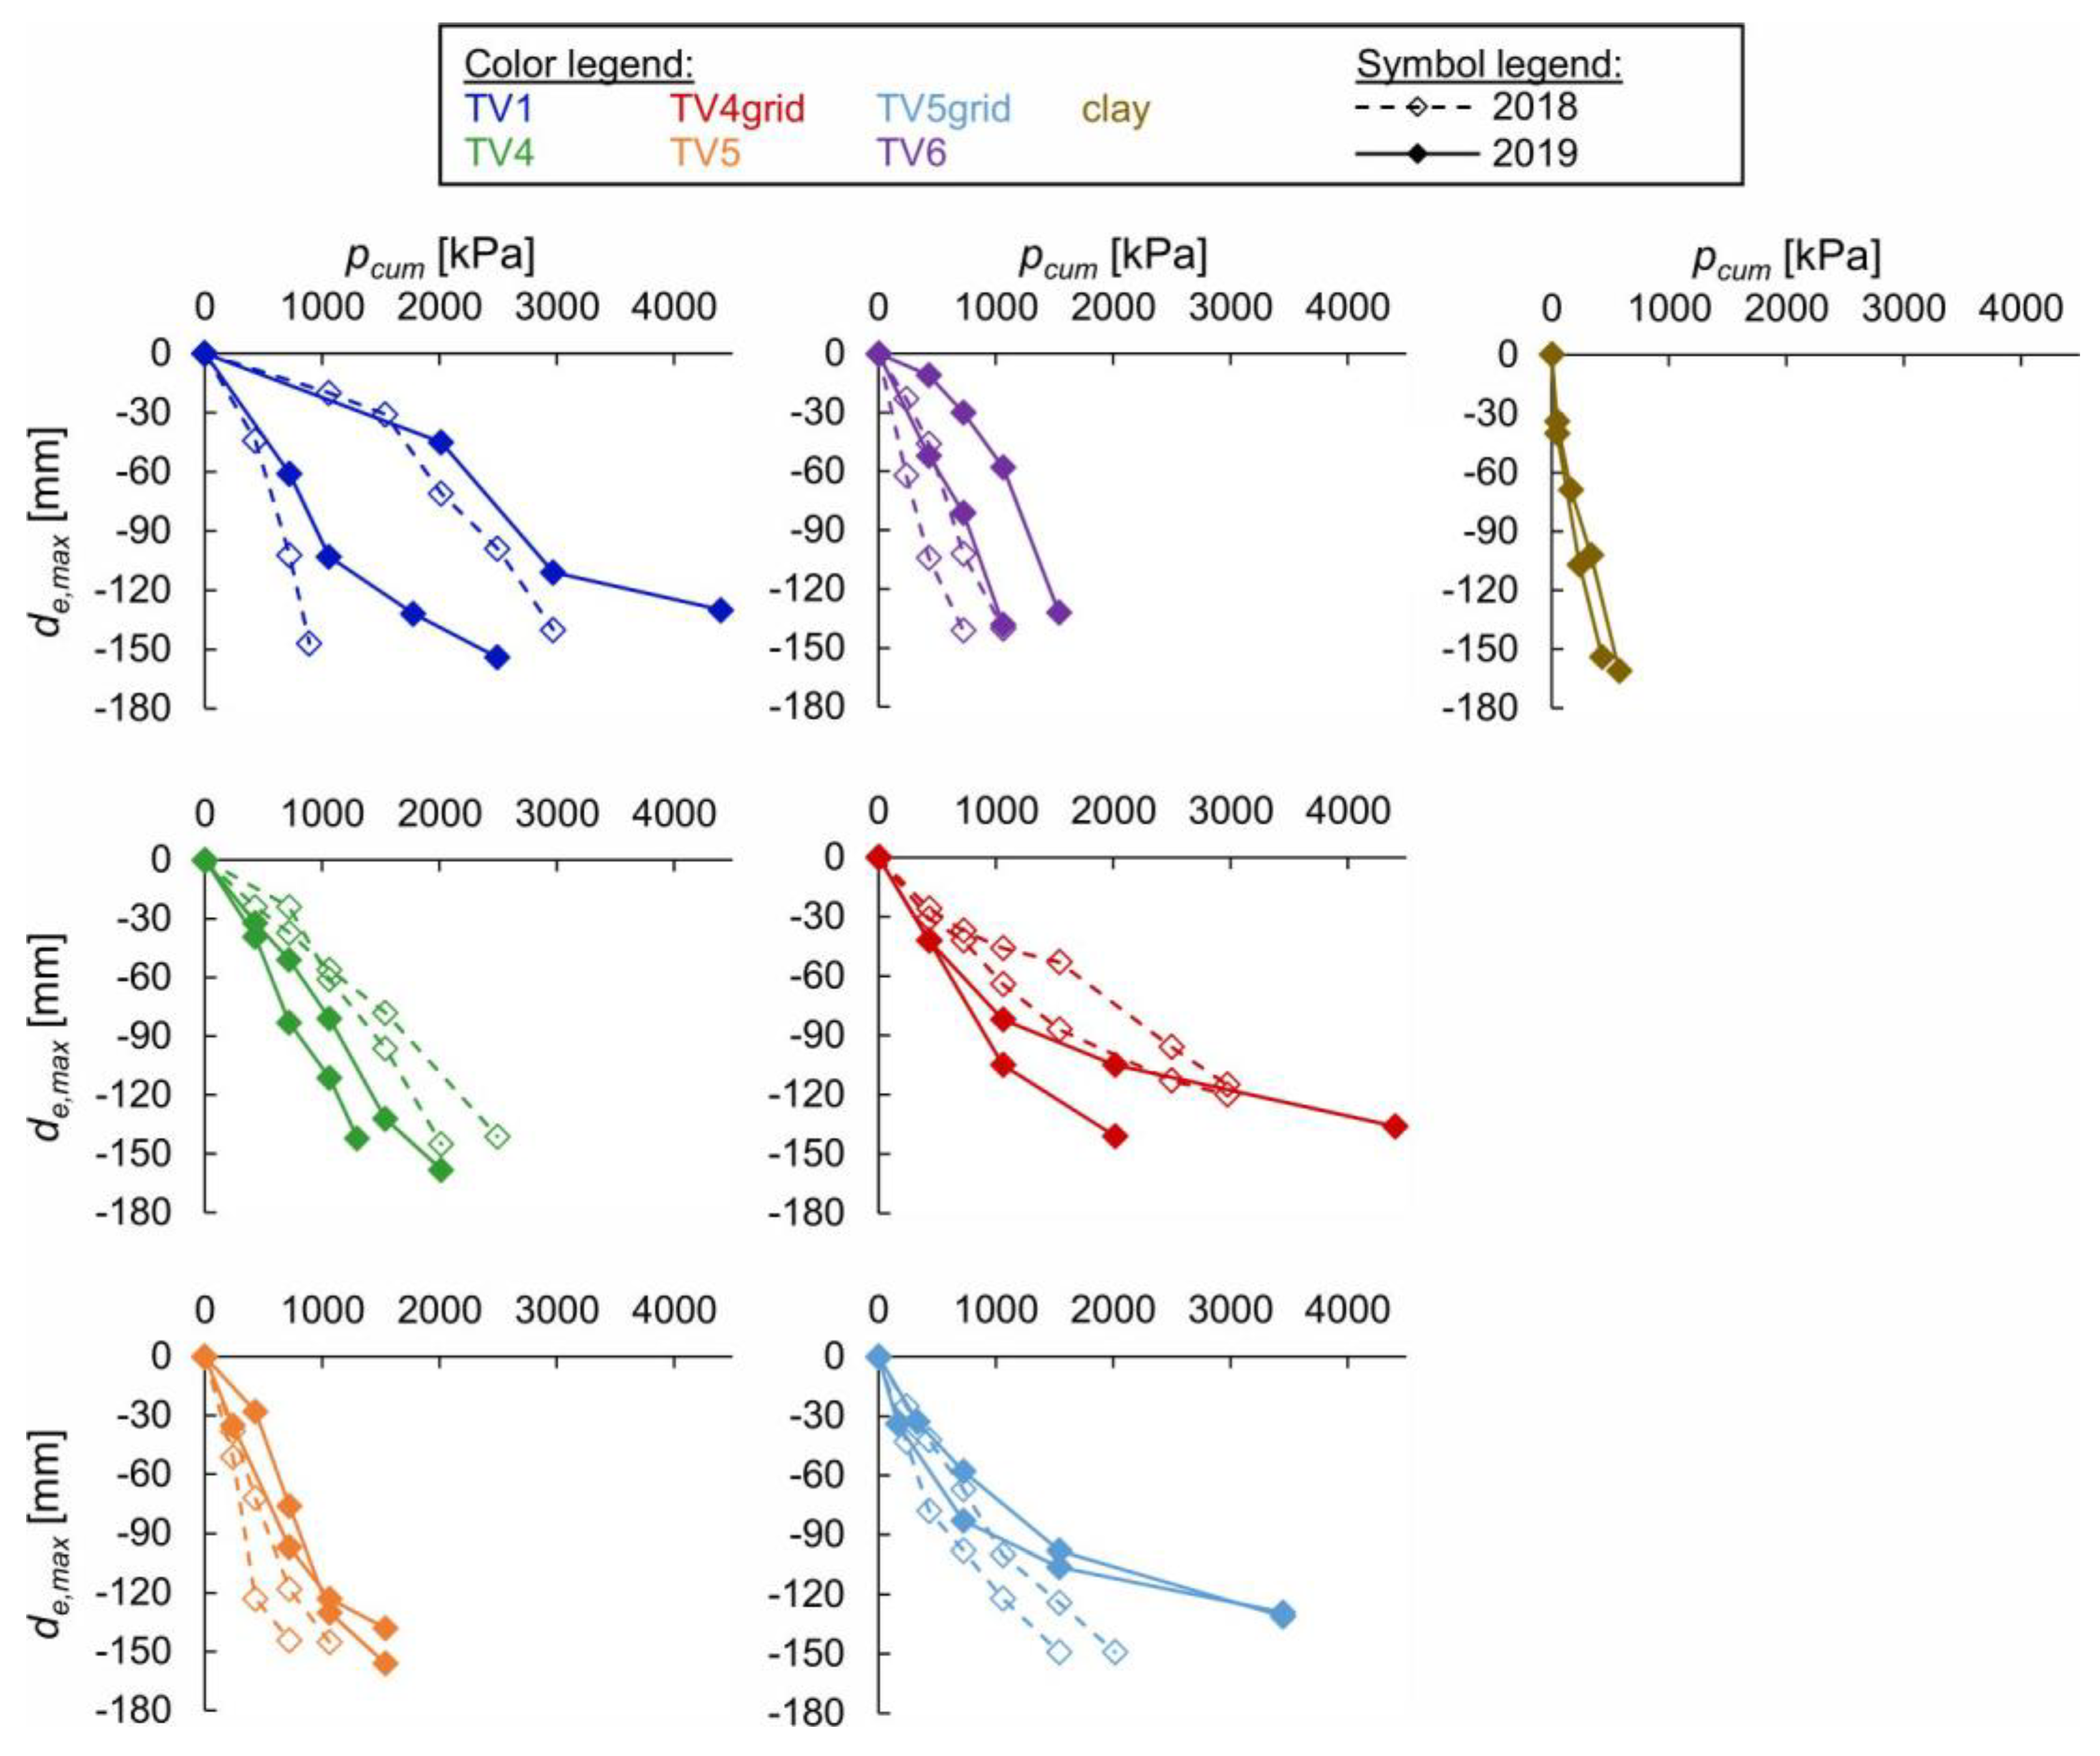
3.2. Wave Impact Simulations

3.2.1. Erosion Patterns
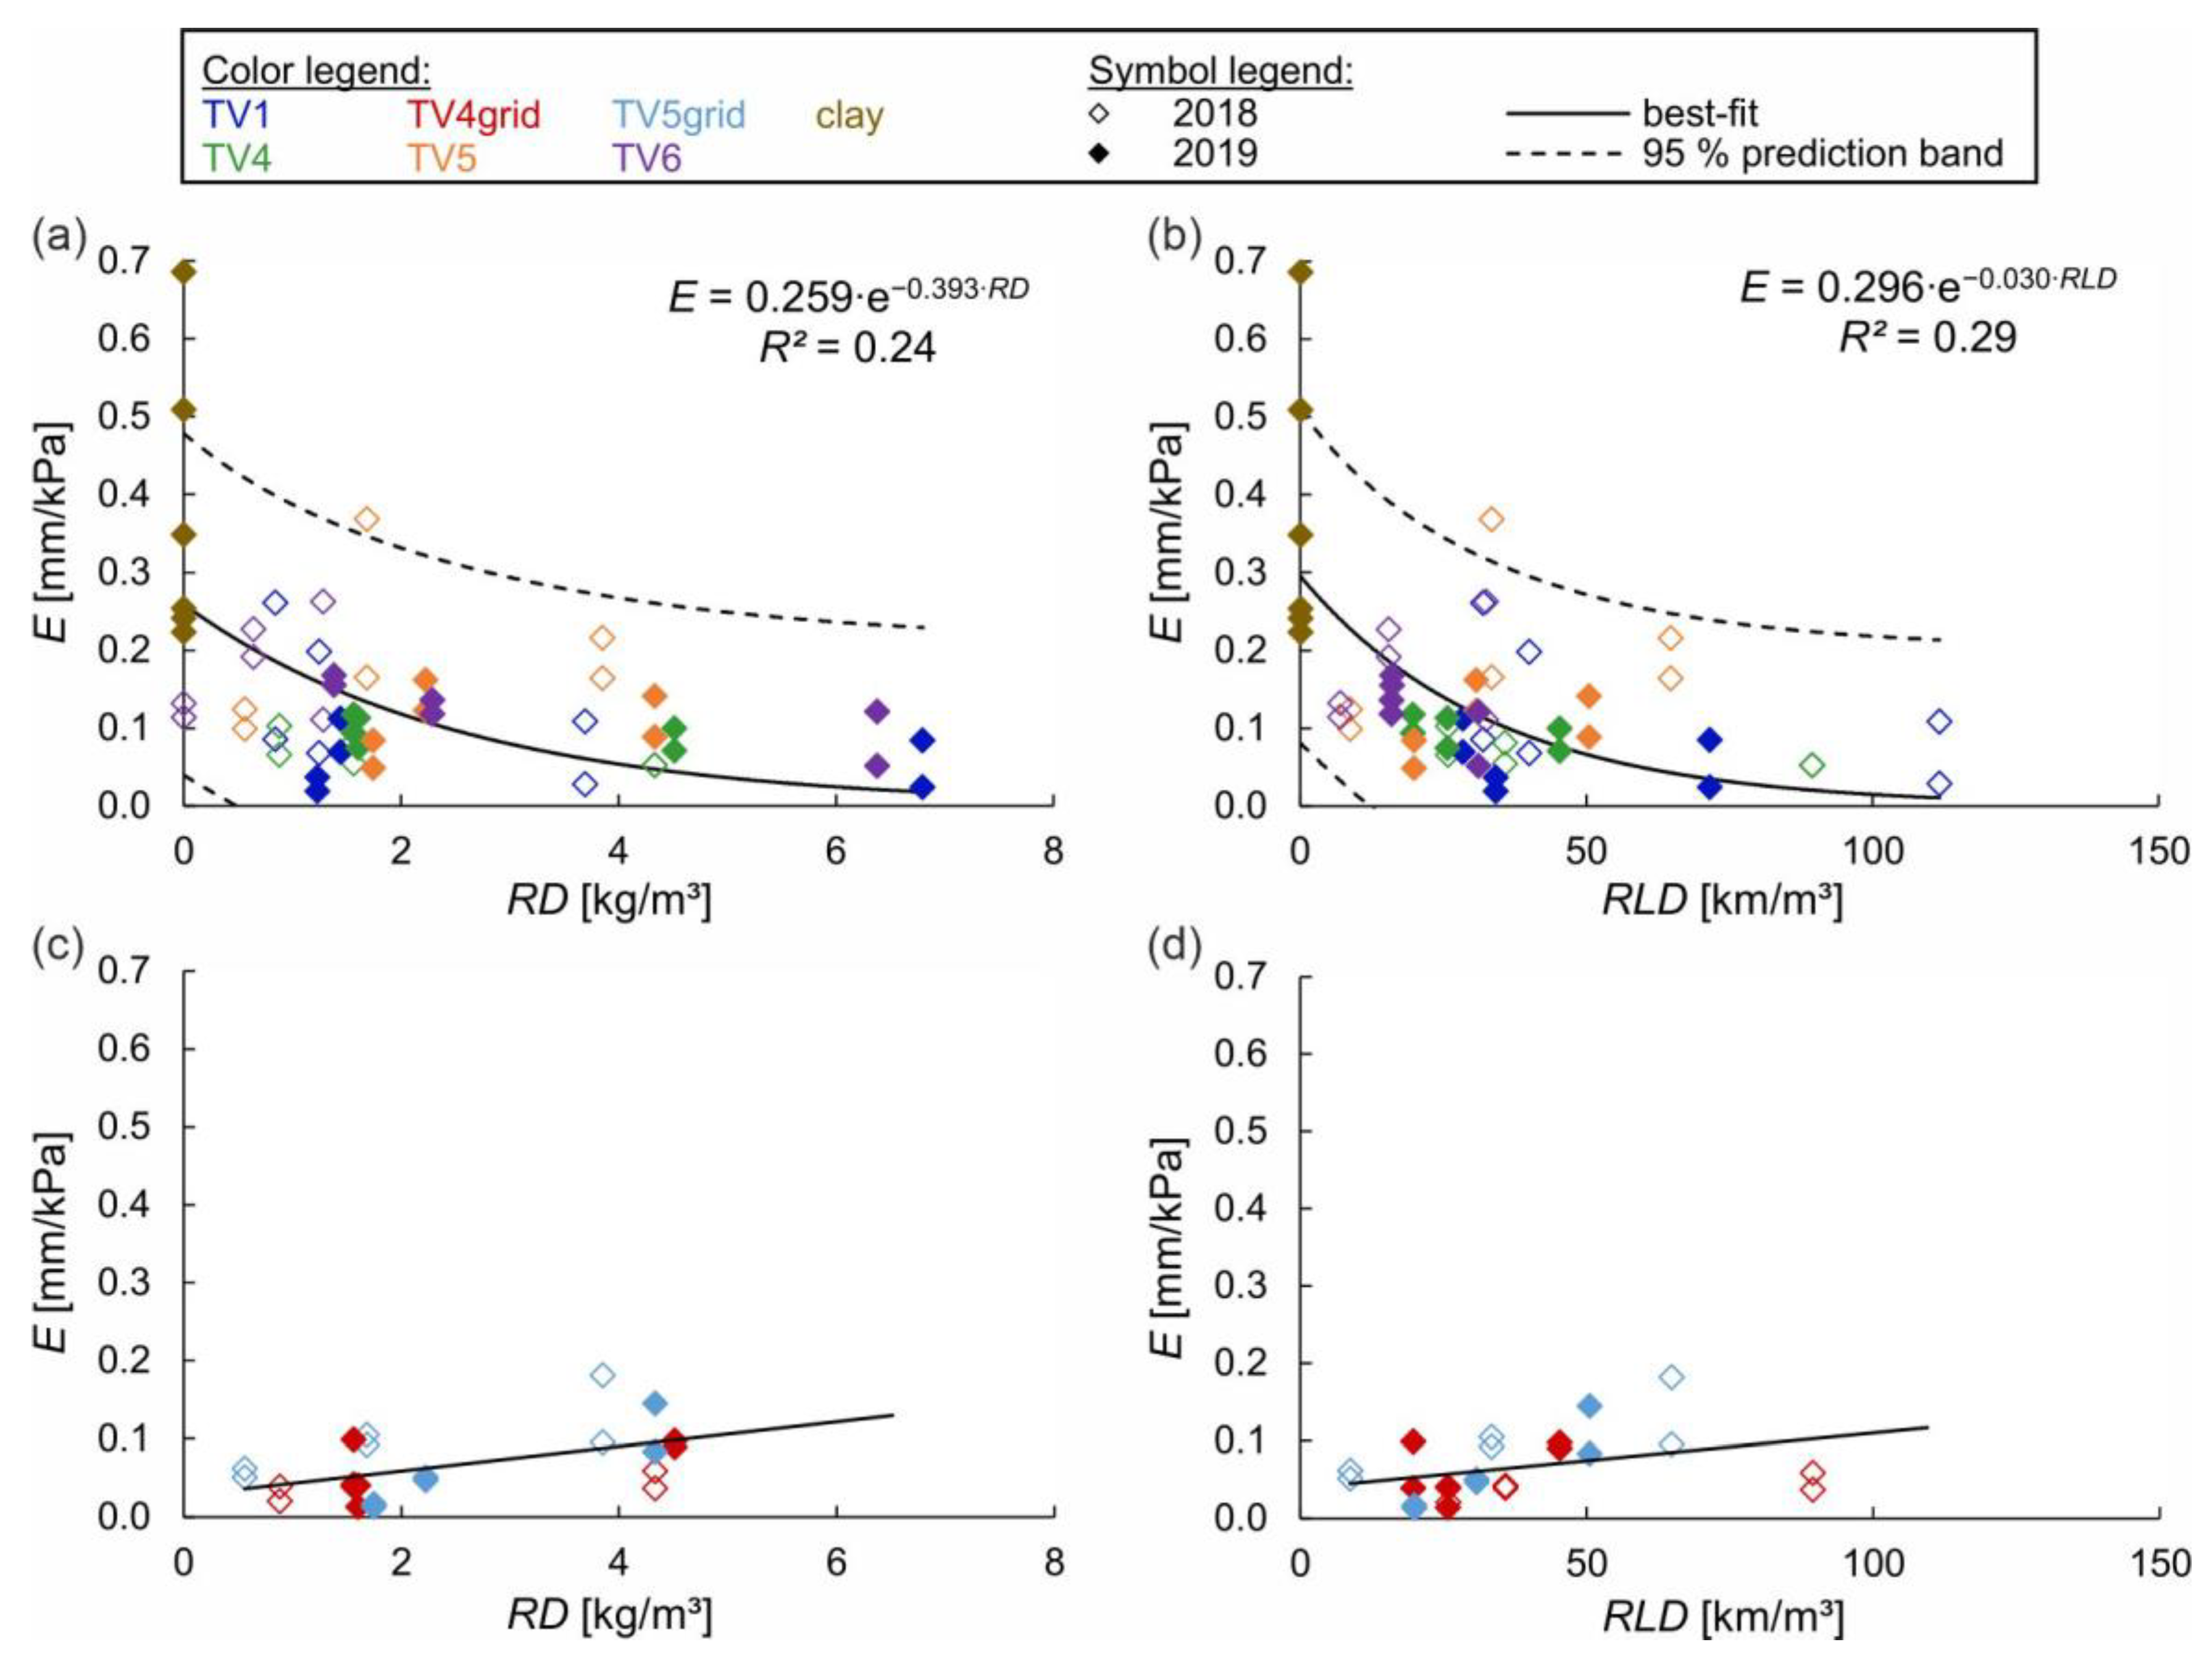
Pronounced erosion holes developed in the impact zone during the wave impact simulations. Figure 6 shows selected test surfaces before and after testing. The erosion progress varied for the different test vegetations and within the test vegetations. The densely vegetated test area of the grass-dominated mixture TV1 developed a floating root-vegetation net above the erosion hole that provided protection of the underlying soil (Figure 6a). With weak spots in the test area, the same test vegetation eroded much faster (Figure 6b). A distinctive root net appeared also during testing of the herb-dominated EcoDike mixture TV5. However, wave impacts induced circular damage to this root net, revealing bare clay below (Figure 6c). The geogrid reinforcement provided additional protection and damping of the impacts after erosion of the upper vegetated layer (Figure 6d).

3.2.2. Analysis

The erosion progress during the wave impact simulations was surveyed regularly with a pin-profiler covering in total 185 measuring points (see Section 2.2). Figure 7 shows the maximum erosion depth de,max of each pin-profiling as function of the cumulative wave impact pressure pcum for the different vegetated covers. The results show differences between the single test vegetations, but also variations within the test vegetations. The highest erosion resistance was found for one of the test series of the grass-dominated mixture TV1 where the highest loads were necessary to reach the final erosion depth (de,max = 130 mm for pcum = 4403 kPa). The reinforced grass-herb mixture TV4grid and reinforced herb-dominated EcoDike mixture TV5grid showed similar maximum erosion resistance. Considerably lower loads were necessary to reach the final erosion depth for TV5 without reinforcement and for the herb-dominated ready-mix TV6. For comparison, the results of tests on an unvegetated clay surface are shown in Figure 7. Maximum erosion depths of 154 mm and 161 mm were measured after a cumulative impact pressure of 429 kPa and 575 kPa, respectively. All vegetated surfaces experienced slower erosion compared to the unvegetated clay surface. Looking at the results of TV5 and TV6 in 2018, these differences were, however, not very big. With exception of TV1, only slight differences between the single test series of each vegetated cover were found. The big differences in the results of TV1 are attributed to influences of weak spot testing (see Section 3.2.1). No consistent temporal development of the erosion resistance can be found comparing the measurements in autumn 2018 after a vegetation period of six months to the measurements in autumn 2019. While the erosion resistance slightly increased for TV1, TV5, and TV6, it decreased for TV4.
Figure 8 shows the erosion rate E plotted against the root density RD (left) and root length density RLD (right), separately for the unreinforced vegetated covers (upper figures) and for the vegetated covers reinforced with a three-dimensional geogrid (lower figures). The erosion rate was calculated for layers of 0.05 m assuming a linear erosion progression to allow analyses in connection with the root parameters which were also determined for 0.05 m thick layers (see Section 2.1 and Section 3.1). Data of the root density and root length density are mean values of the measurements per layer and test year. Decreasing erosion rates were found with increasing root density and root length density for the unreinforced vegetated covers, similar to results from studies on the soil detachment rate due to concentrated flows [41] (Figure 8a,b). The relationship between E and RD or RLD was further investigated by means of a non-linear regression analysis. The best-fit exponential regression functions, 95% prediction bands and coefficients of determination are given in the figures. The regression analysis of E and RLD shows a slightly better fit. Overall, a high variability in the data is found, comparable to studies on the soil detachment rate due to concentrated flows [41]. Erosion rates of deeper layers might be influenced by the protective root net that evolved for some test vegetations (see Section 3.2.1).
A different trend was found for the reinforced vegetated covers (Figure 8c,d). The erosion rate slightly decreased with decreasing root density and root length density. Erosion progressed more slowly in deeper layers where the root parameters were lower. This effect is attributed to the protective function of the geogrid reinforcement. It can be concluded that after erosion of the soil above the geogrid, the geogrid provides protection against the wave impacts and reduces erosion.

3.2.3. Discussion of the Methodology and Results of the Wave Impact Simulations

The use of the pin-profiler allowed to measure the erosion depth with minimum distortion of the data due to vegetation or the geogrid as the pin generally slid along the obstacles directly to the ground representing the actual erosion depth. Although it is a very time-consuming method with a reading accuracy of around 1 mm, it was possible to get new insights, e.g., into the erosion depth and progress below the geogrid. In some cases, the measuring area did not cover the fringes of the erosion hole. As the presented analyses were based on the maximum erosion depth, generally located in the center of the erosion hole, no influence on the results is expected due to this restriction. The erosion volume, however, cannot be analyzed precisely.
The wave impact simulator used in the present study represents a handy and cost-effective method for generating wave-like impacts, i.e., impacts of short duration but high pressure on a small area. While previous erosion models relate the erosion rate to the significant wave height [27,28], the present tests allow to combine erosion directly with the impact pressure acting on the surface. There are, however, several characteristics of natural wave impacts that cannot be reproduced, e.g., air inclusion during the breaking process or wave run-up and run-off including back-rush water. The stochastic characteristics of the sea state, e.g., the spatial distribution and the distribution in magnitude of impact pressures, are not considered. The given reproducibility of impact pressures is, however, a major benefit of the test setup used.
The number of root samples was limited to three (2018) and two (2019) samples, respectively. No root samples were taken of the reinforced test vegetations. Test results of the reinforced covers were correlated to the root parameters of the corresponding unreinforced cover, ignoring possible influences of the geogrid on vegetation establishment. The vegetated covers showed generally a heterogeneous vegetation distribution which might also influence the root parameters. For statistical analyses, a higher number of root samples would be preferable. However, the consistency in results, especially in the correlation of the erosion rate to the root parameters, gives insights on the overall relation between hydraulic resistance to wave impacts and vegetation parameters.

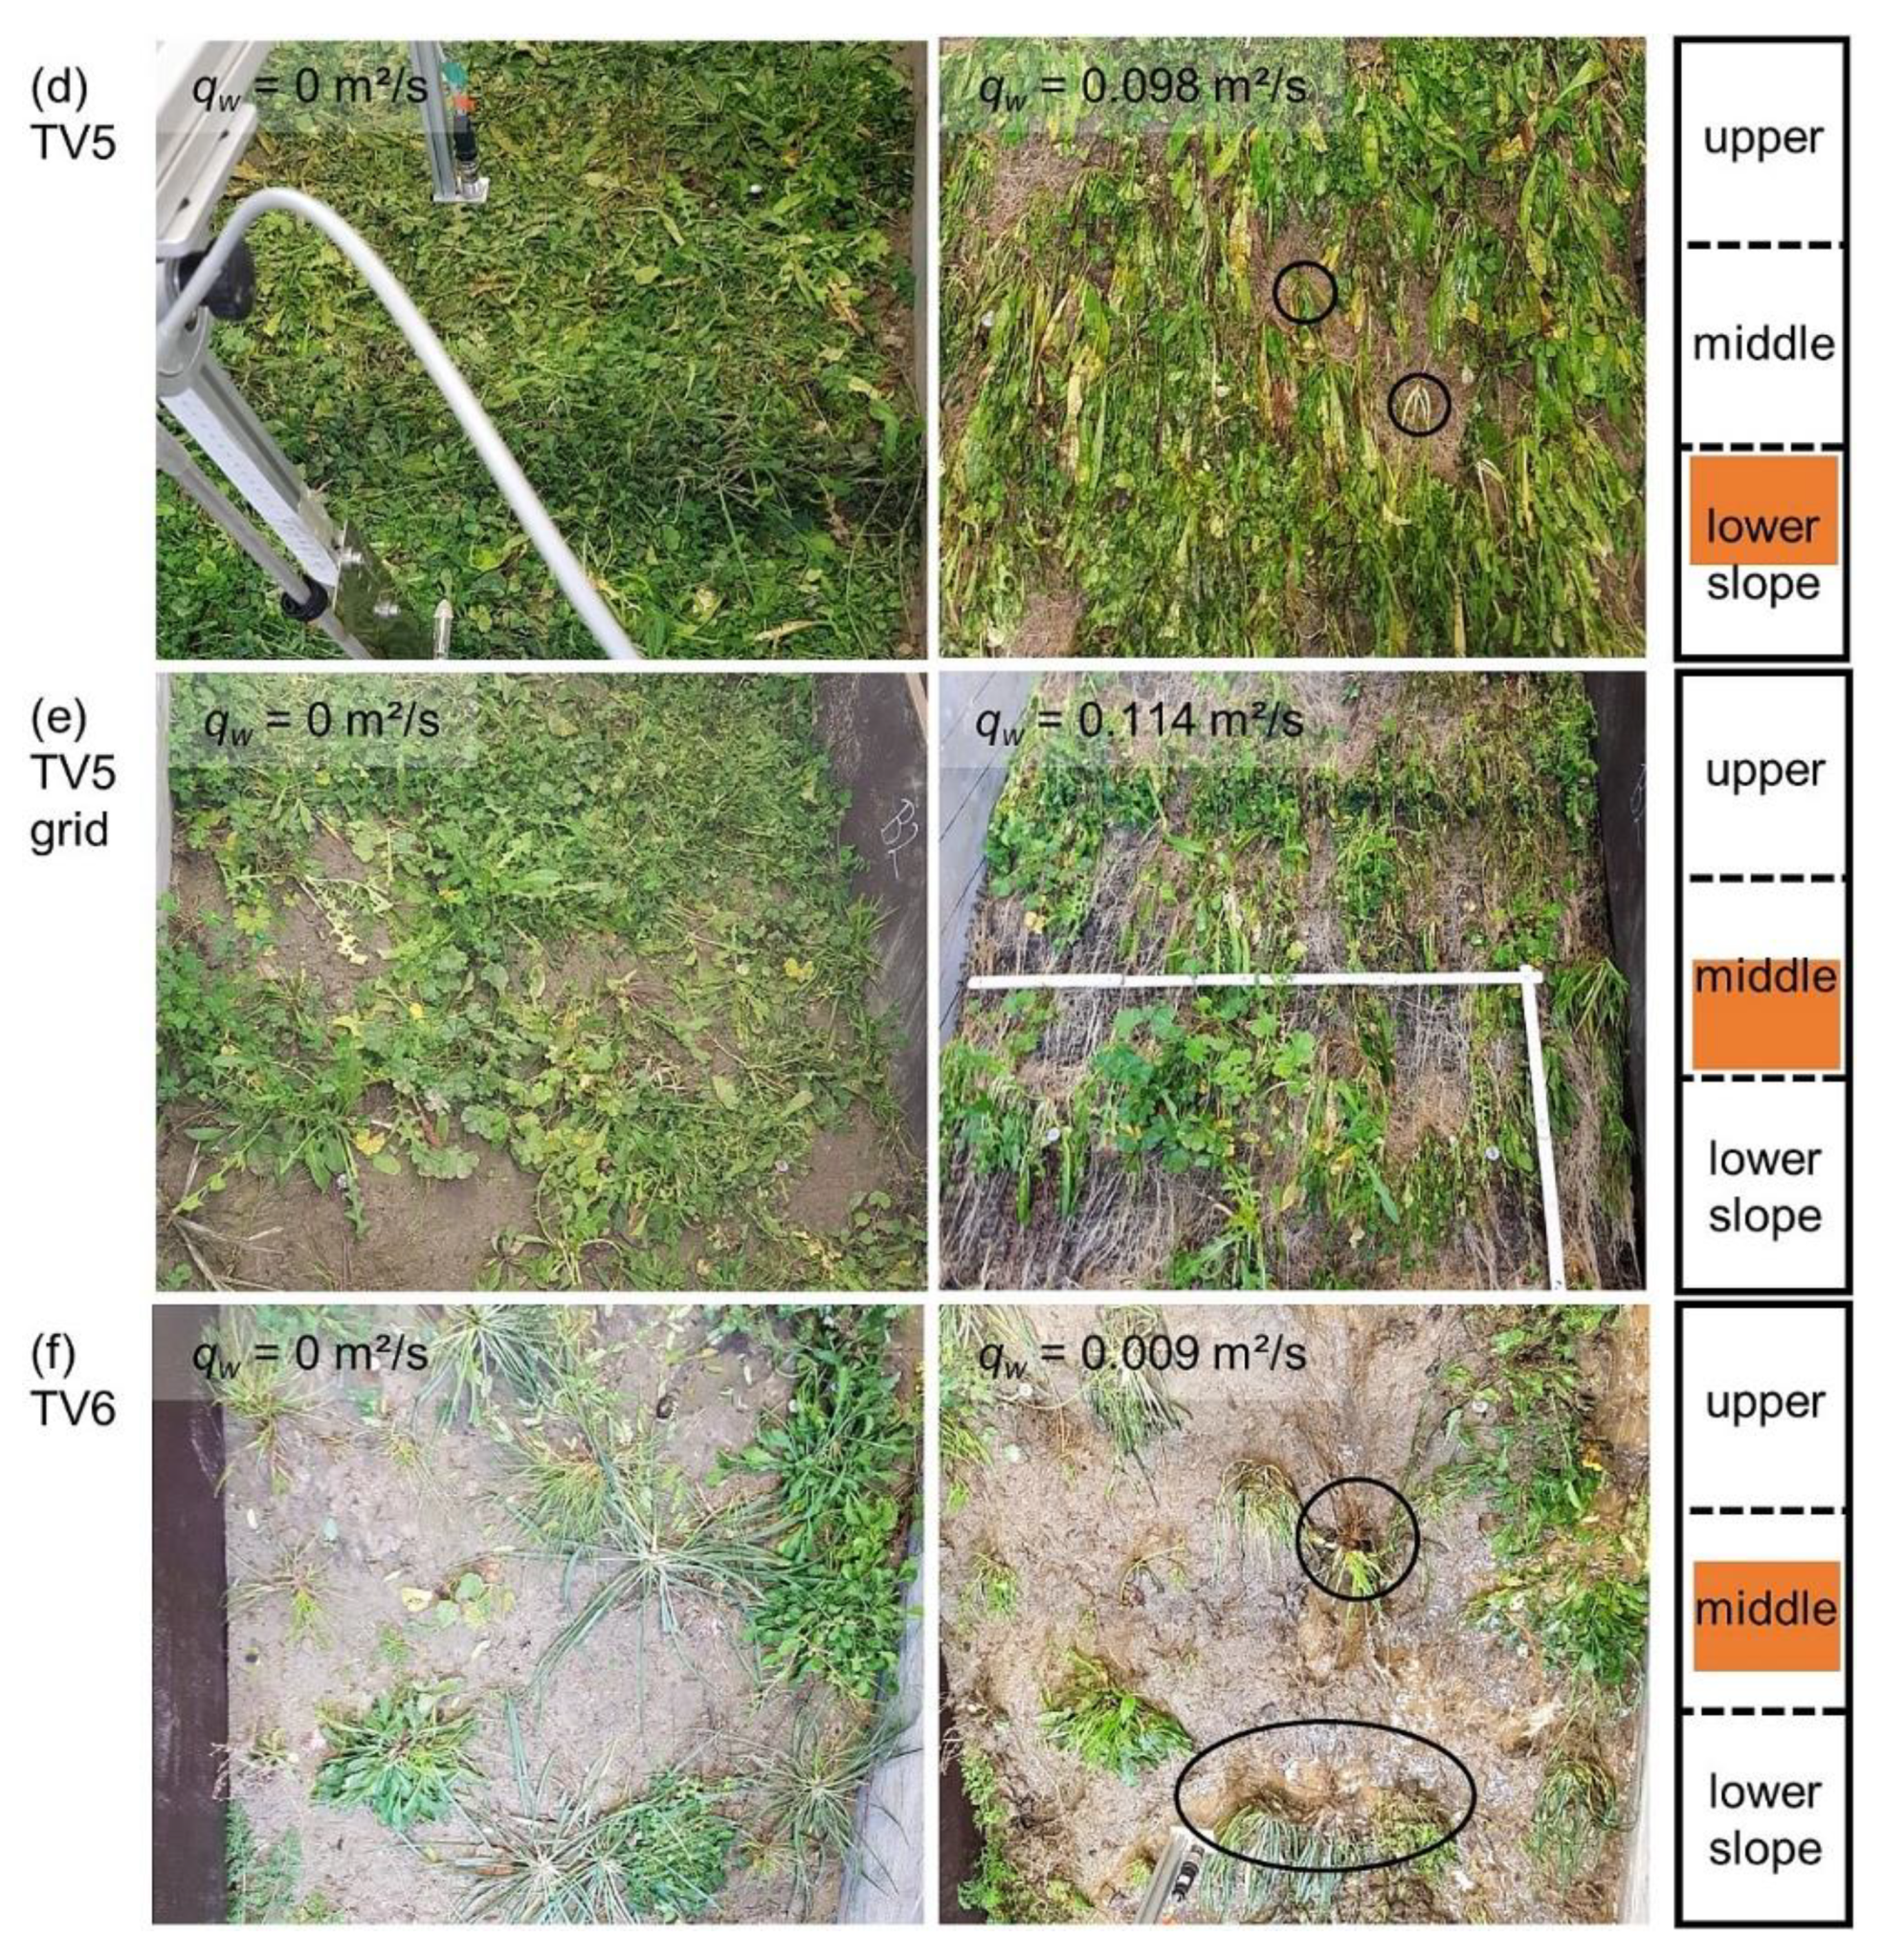
3.3. Overflow Simulations

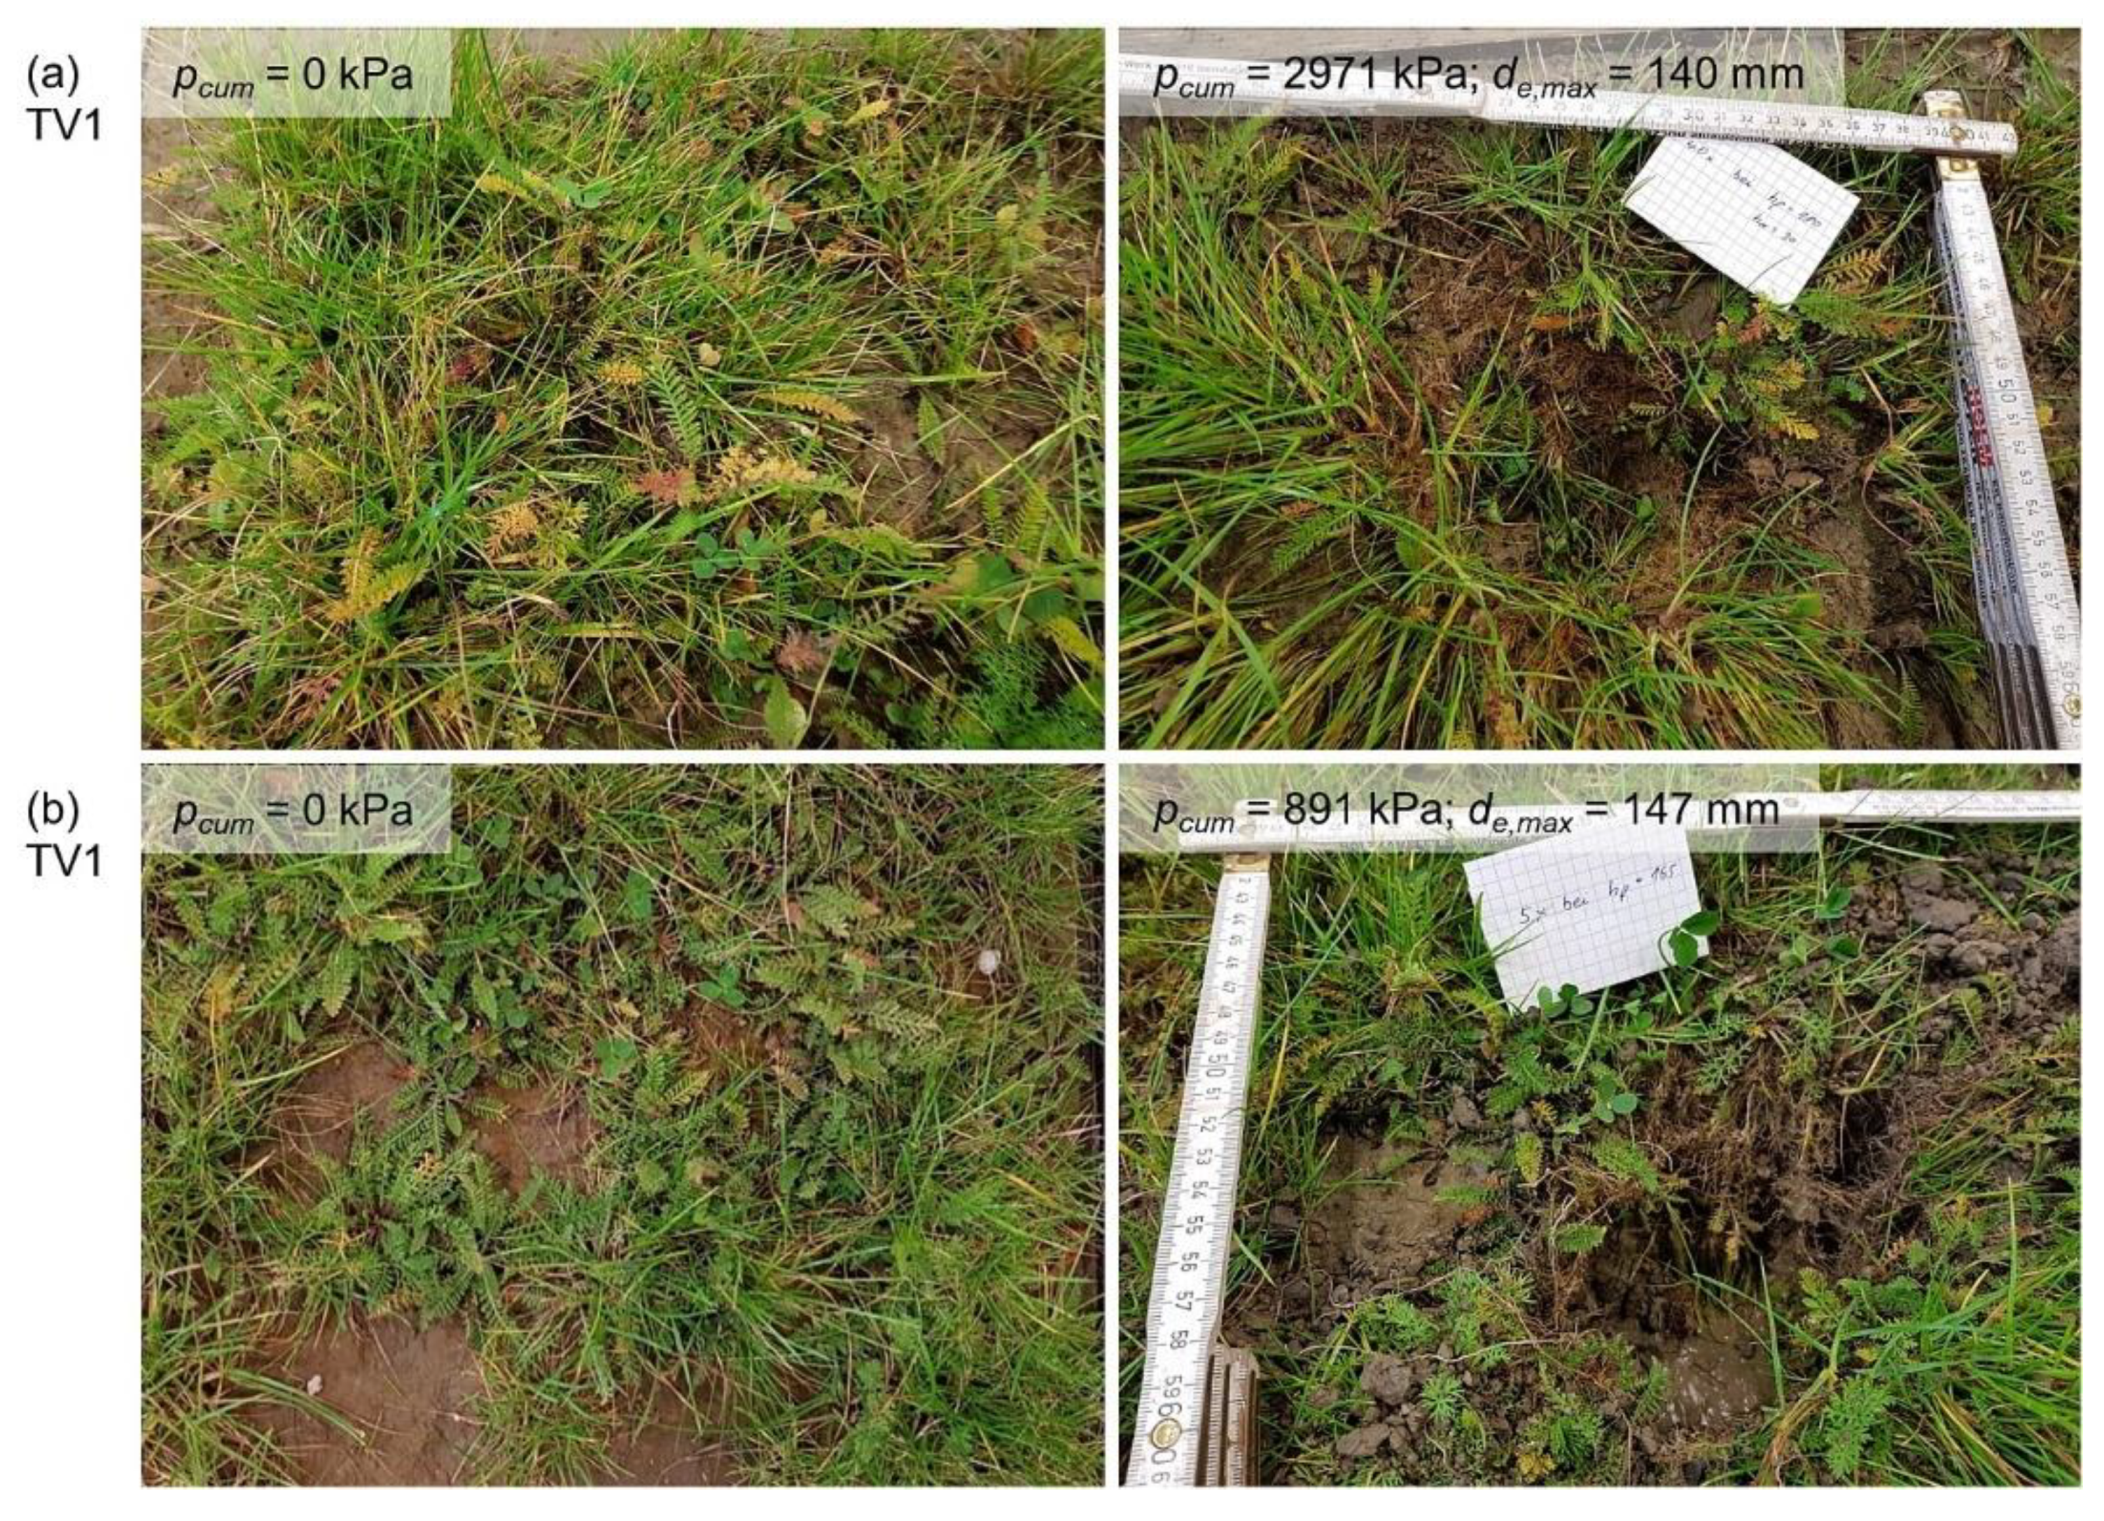
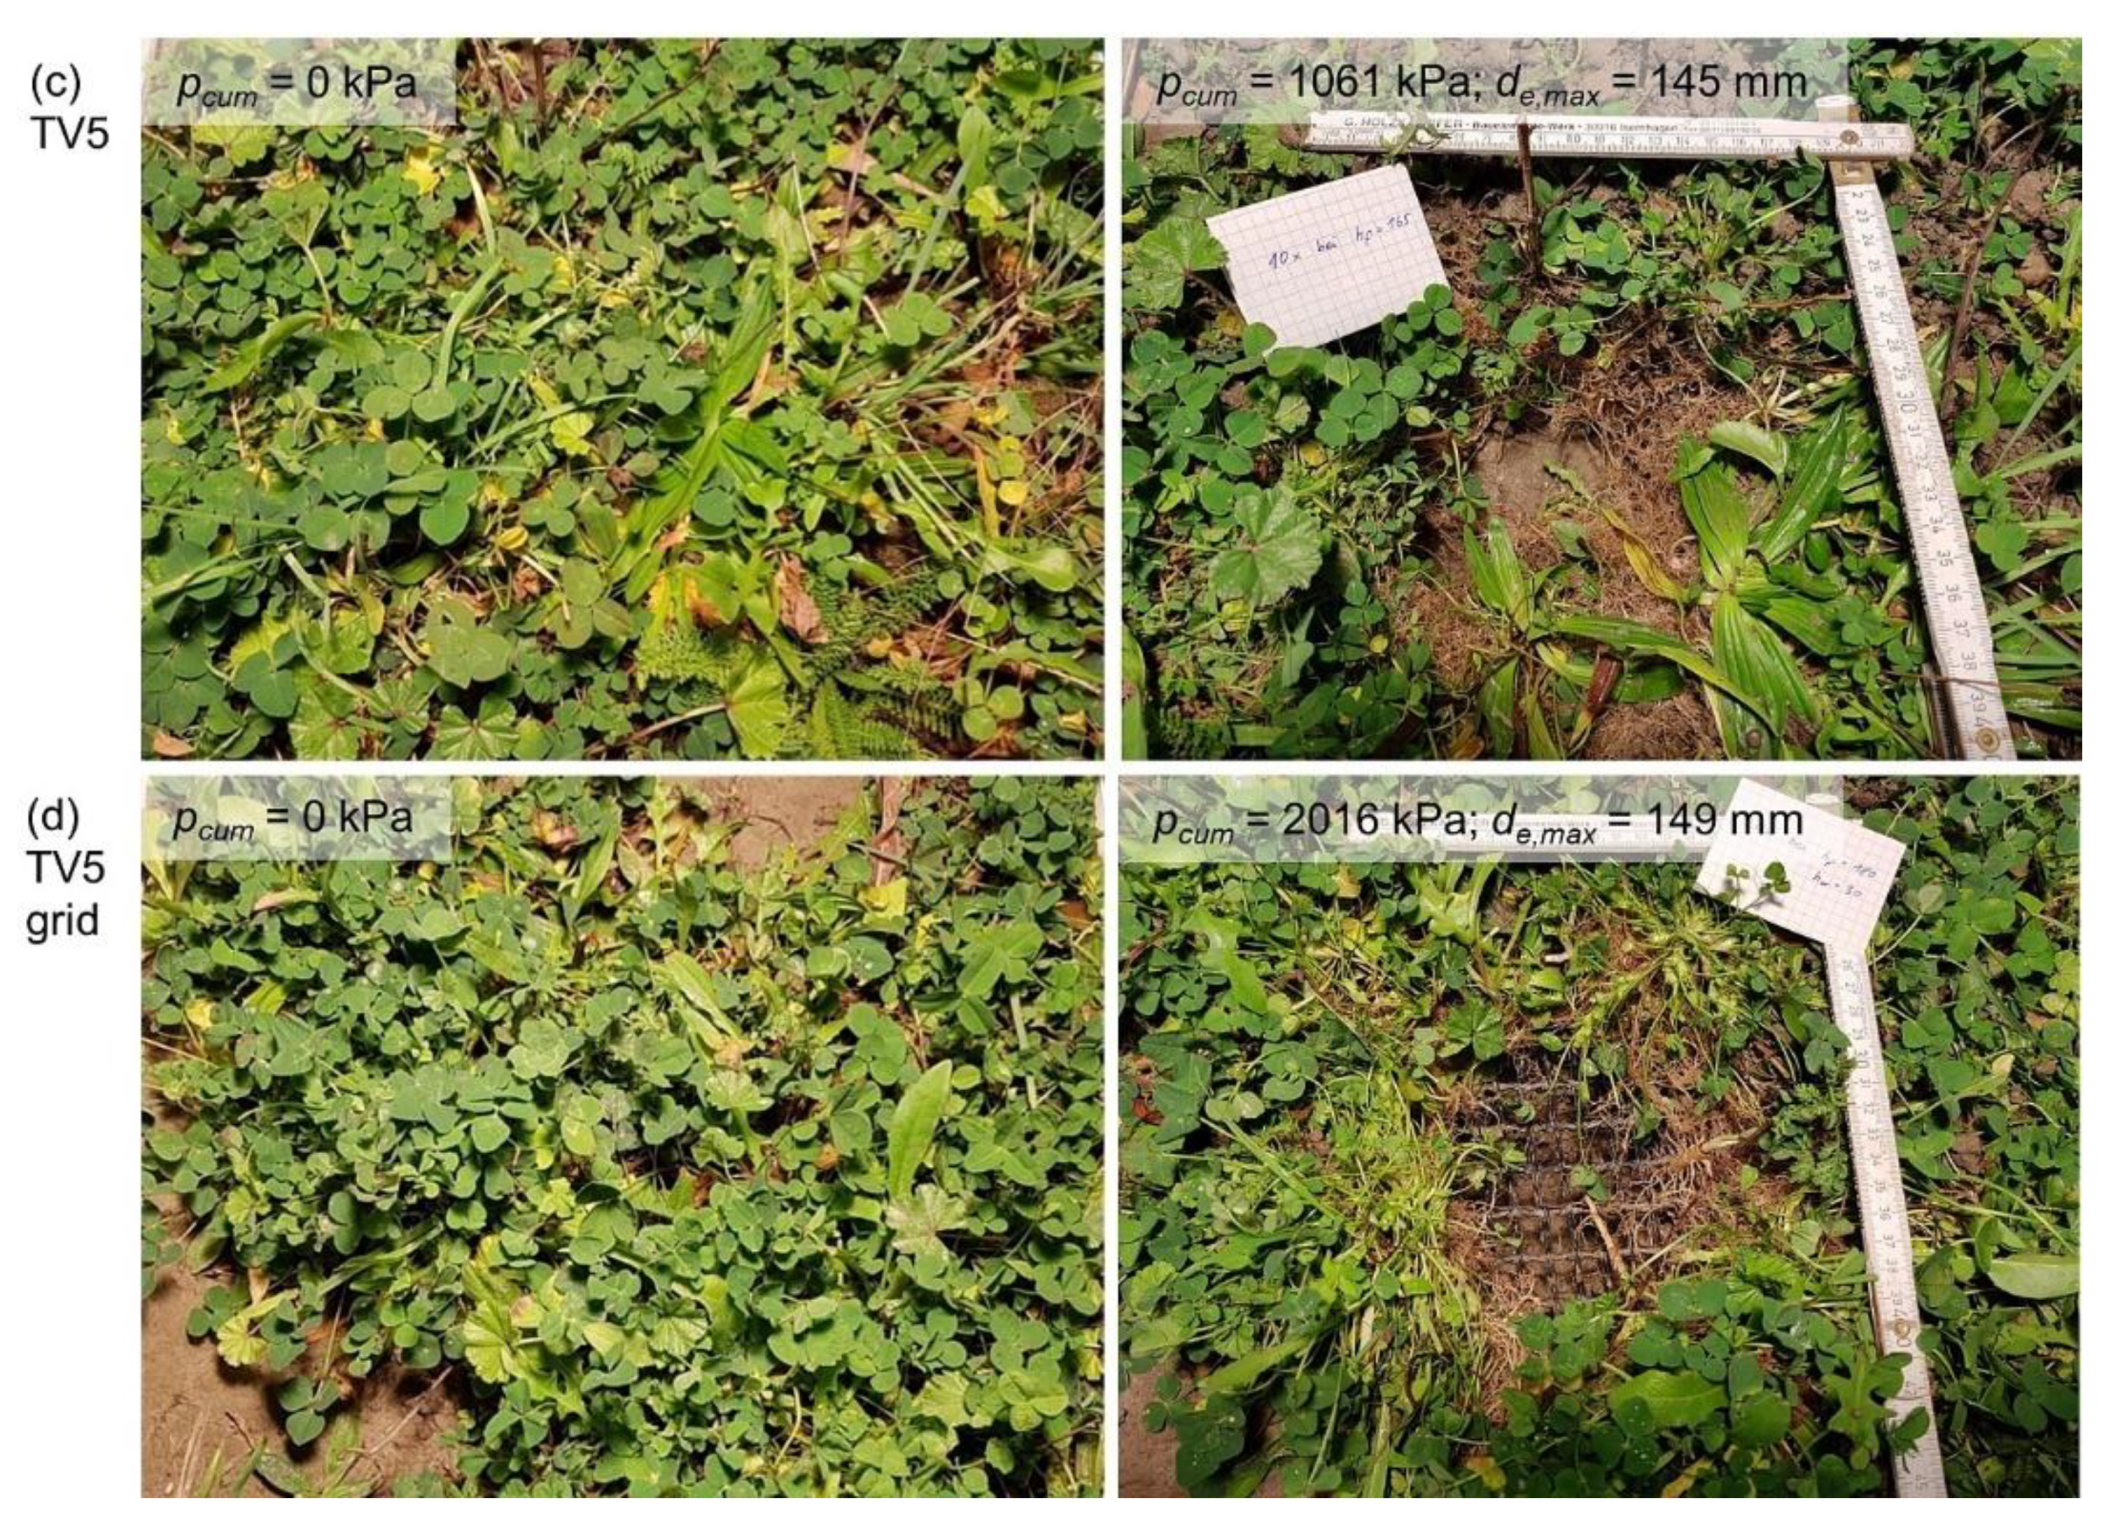
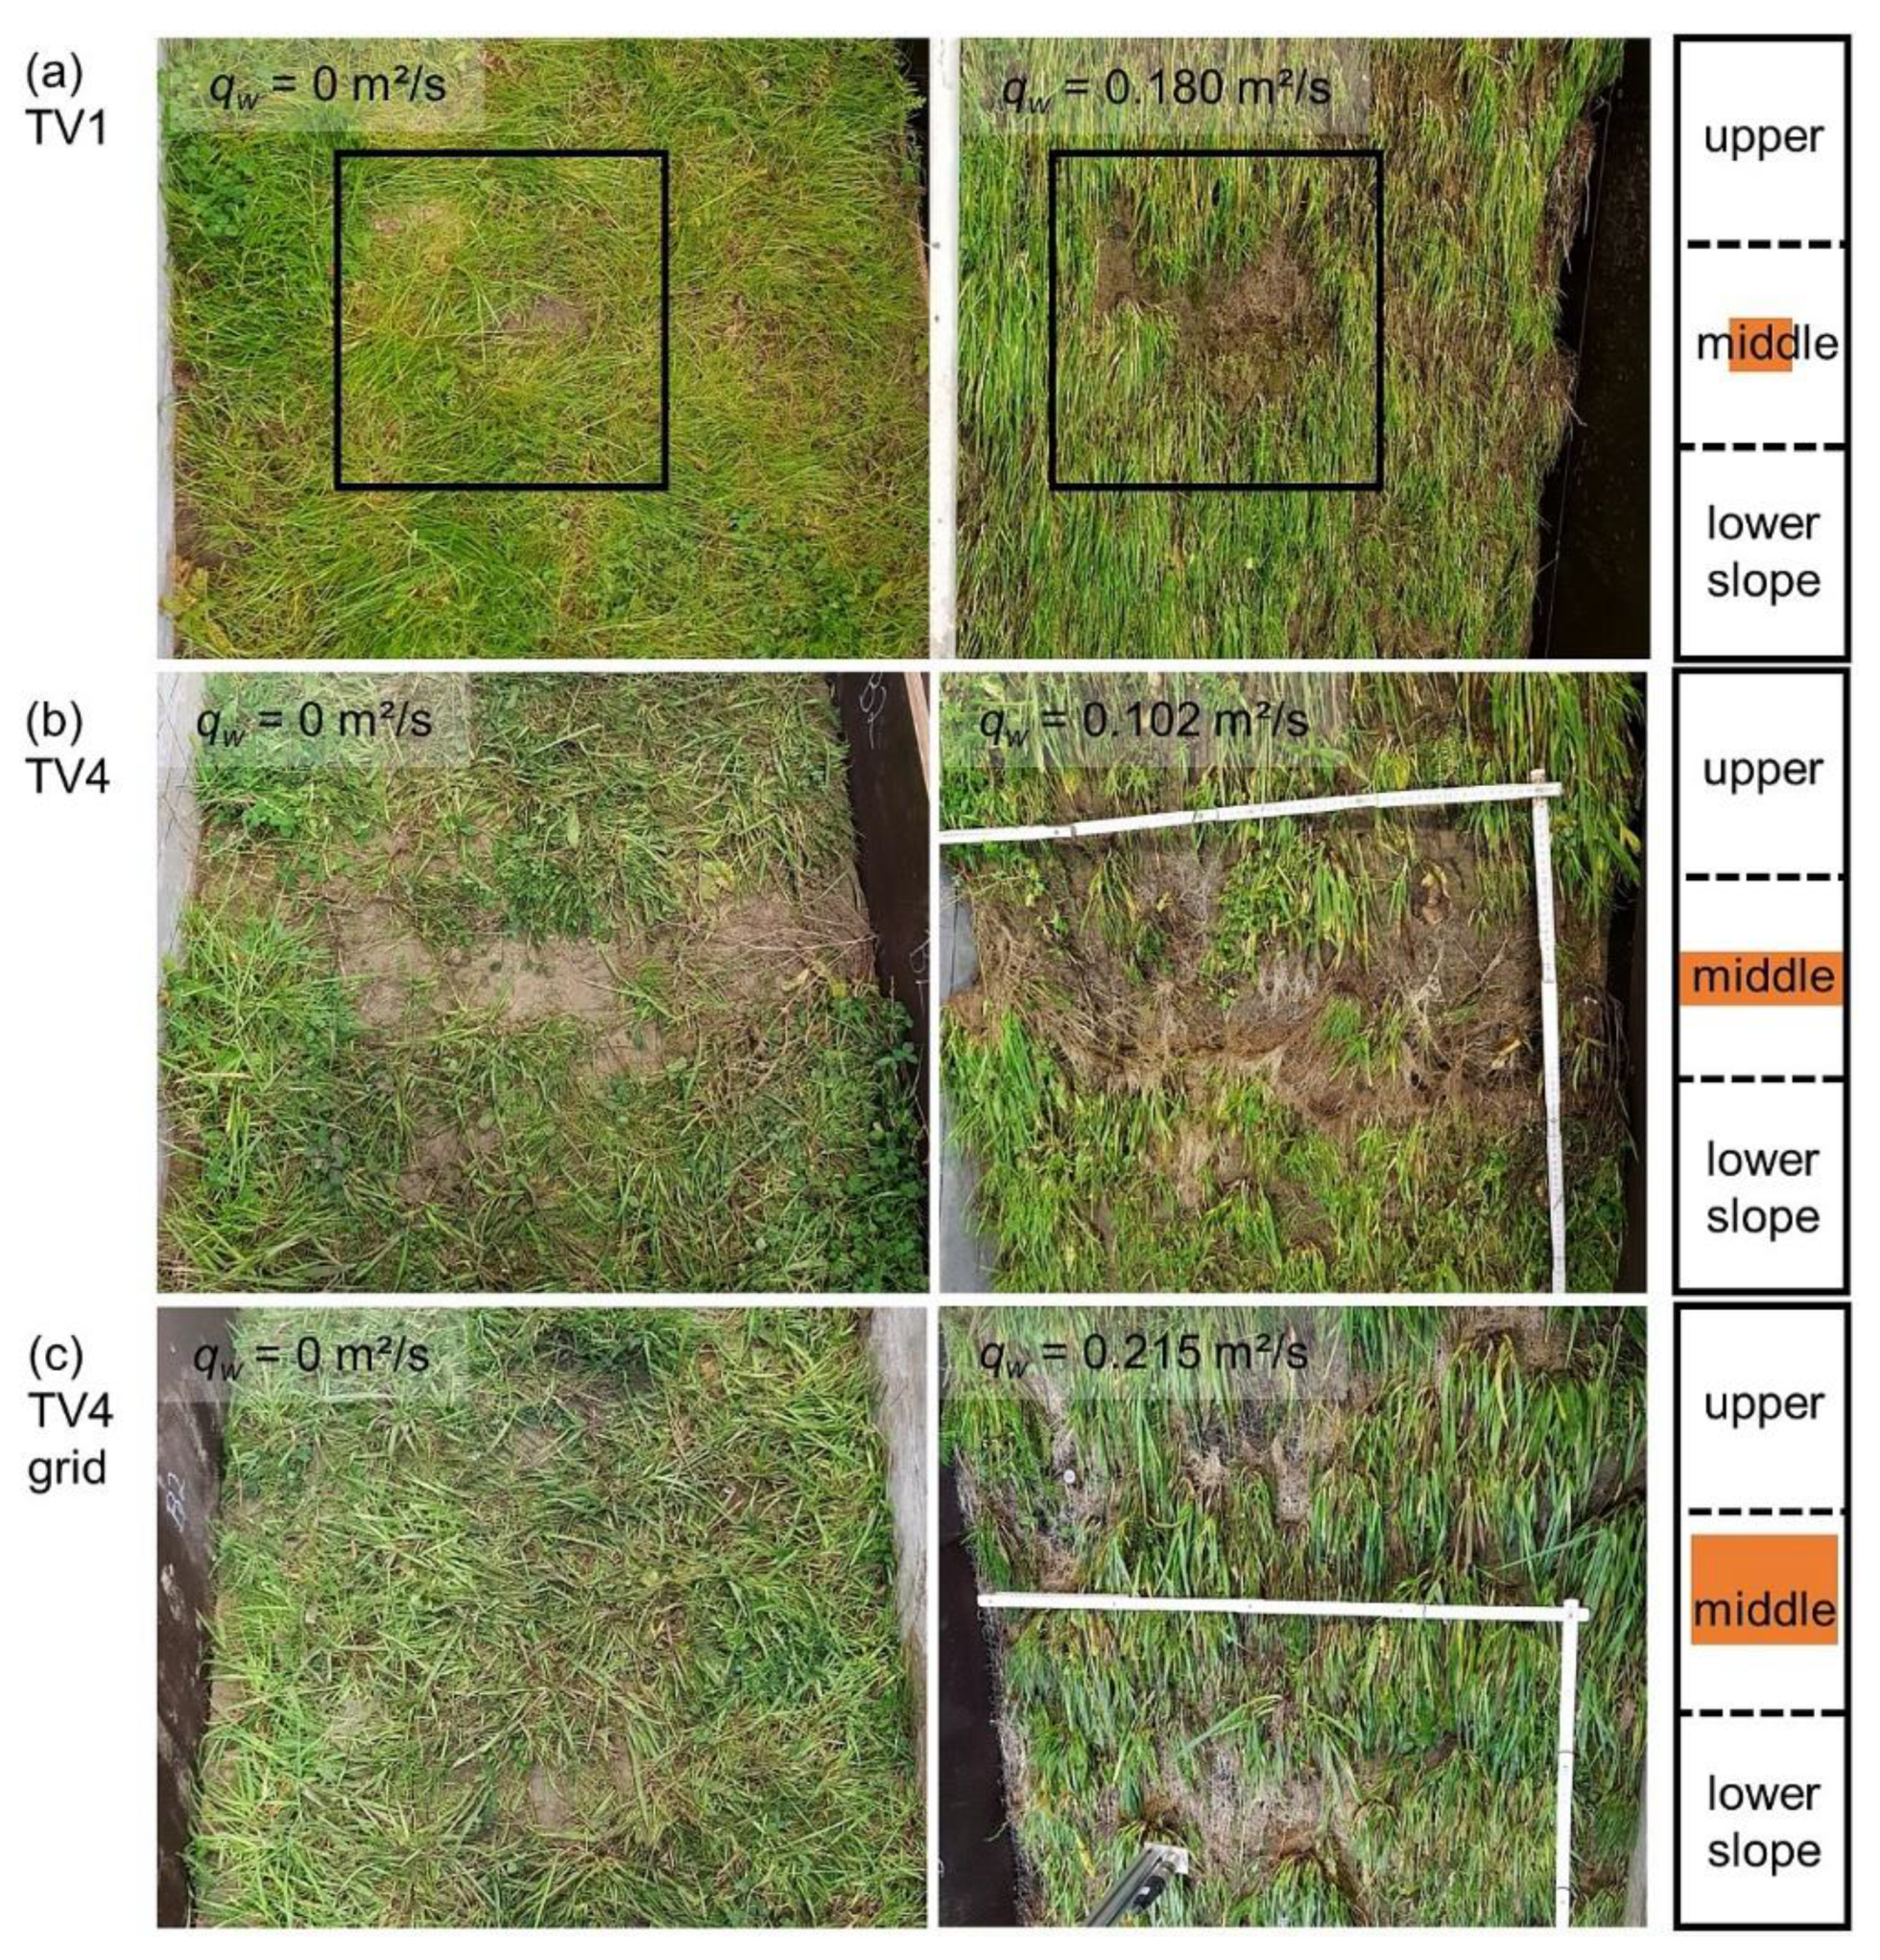
3.3.1. Erosion Patterns
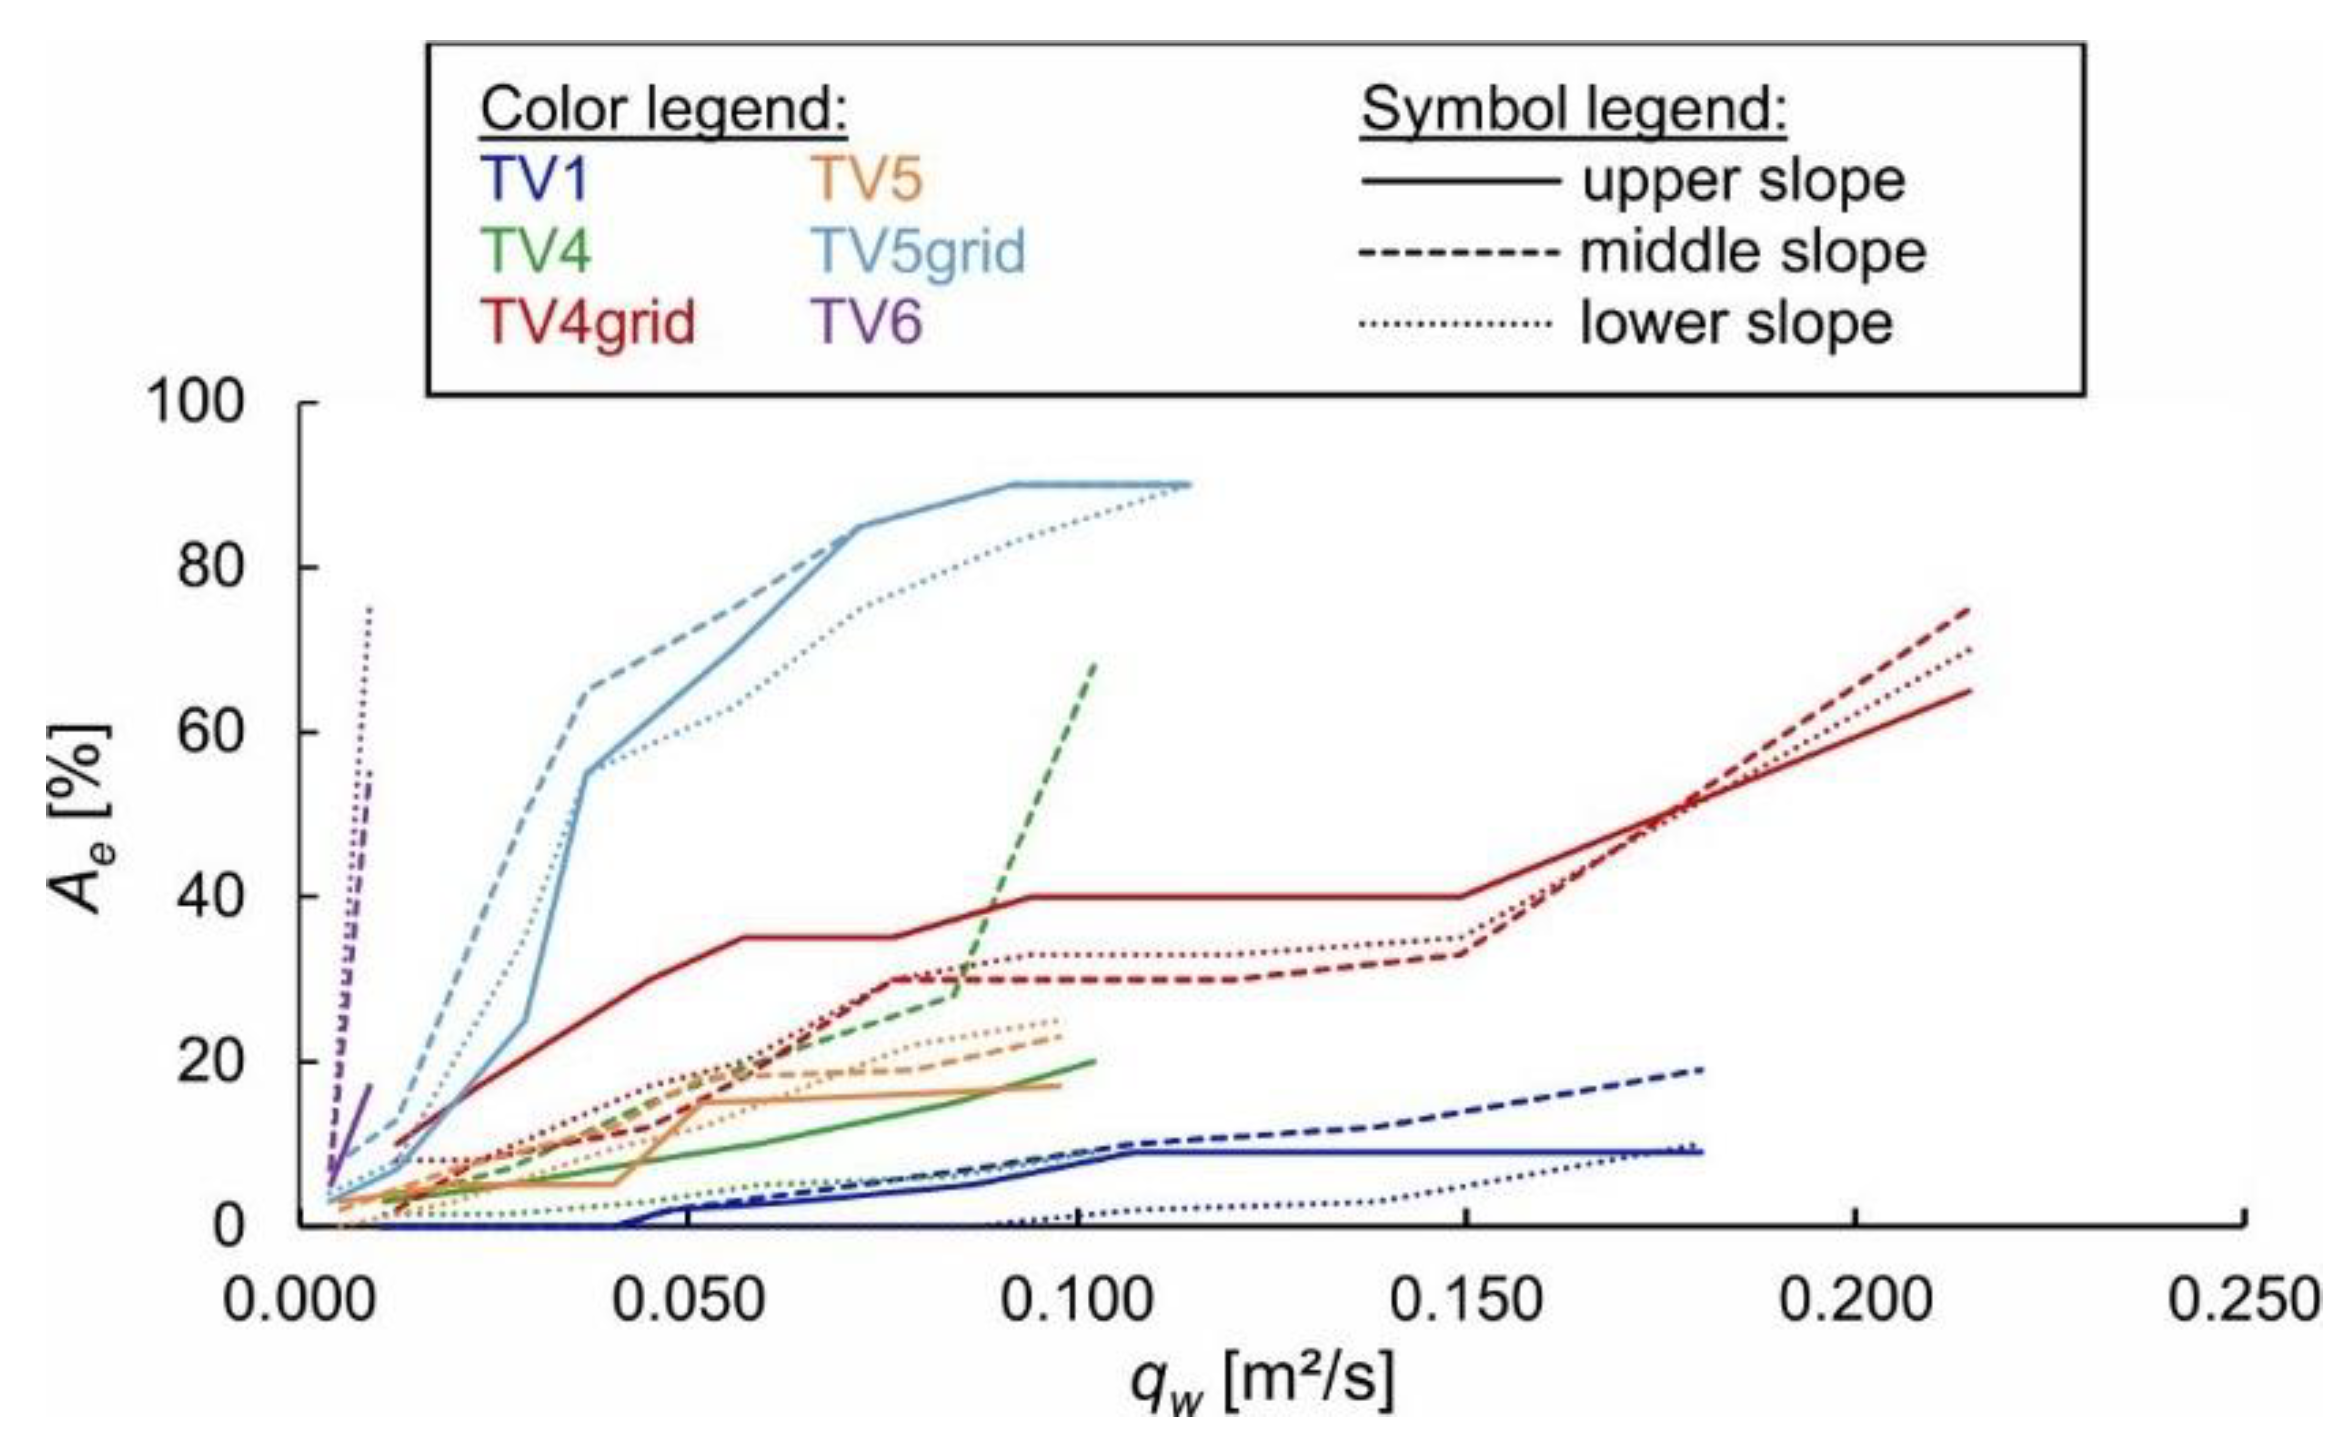
Progressing erosion was observed during the overflow simulations for all vegetated covers. Figure 9 shows sections of the test surfaces before and after testing. Erosion initiation and magnitude varied depending on the test vegetation. In none of the tests, a failure of the dike cover occurred, i.e., erosion did not reach the sand core (except for model effects at the flume walls). Mostly, erosion was initiated at bare spots. Almost no erosion occurred on the dike crest. In the following, typical erosion patterns along the dike slope are described for the different vegetated covers. Erosion that was regarded a model effect was not considered in subsequent analyses.
The relatively densely-vegetated grass-dominated mixture TV1 showed little erosion which was generally initiated at bare spots (Figure 9a). Spreading of the erosion was limited. Strong erosion (W × H × D approximately 1.0 m × 0.4 m × 0.13 m) with undermining of roots and roll-up of the vegetation was observed for the grass-herb mixture TV4, which showed a cross-sectional bare stripe at the beginning of the tests favoring the erosion progress (Figure 9b). For the reinforced vegetation TV4grid in contrast, a network of roots intertwined with the geogrid remained after the overflow simulations providing a protection against deformation of the slope (Figure 9c). Root undermining and single plant losses occurred on the originally dense herb-dominated EcoDike mixture TV5 (Figure 9d). Parts of the surface were protected by the flattened leaves. At weak spots, damage was initiated, and erosion spots developed, often with individual, more resistant plants at the center. The surface of the reinforced vegetation TV5grid after testing was dominated by exposed roots intertwined with the geogrid (Figure 9e), similar to TV4grid. Although the geogrid was undermined by up to 4 cm, it still provided protection for the dike cover. Gully erosion was observed for the herb-dominated ready-mix TV6 (Figure 9f). When water hit the sparsely distributed vegetation, deeper erosion holes developed exposing the roots and destabilizing the vegetation. Photos of the complete slopes after failure can be found in the supporting information to Scheres et al. (2020) [44].

3.3.2. Analysis

The erosion progress was quantified after each experimental phase (characterized by constant discharge level) by means of measurements with a pin-profiler along four cross sections and estimations of the percentage of eroded area. Analysis of the pin-profiling data revealed that the number and distribution of measurements is not sufficient to give representative findings on the erosion. Erosion did not occur evenly across the dike, but rather locally restricted. Often the erosion spots were not covered by the pin-profiling measurements. Thus, presentation of the pin-profiling data is omitted herein.
The percentage of eroded area Ae estimated after each discharge level is shown as function of the overflow rate qw in Figure 10 for the different vegetated covers. Data is given for the upper, middle, and lower slope (see Section 2.3). Data for the dike crest is omitted as erosion was very limited with Ae = 6% at maximum. The slowest erosion progress was observed for the species-poor grass-dominated mixture TV1 with relatively good coverage (cveg,mean = 82%). After tests with qw = 0.180 m²/s, in mean 13% of the slope surface of TV1 was affected by erosion. The other vegetated covers resulted in steeper erosion curves and, in total, higher percentage of eroded area. The highest percentage of eroded area Ae = 90% was found for the reinforced species-rich herb-dominated EcoDike mixture TV5grid with moderate coverage (cveg,mean = 60%) after qw = 0.114 m²/s. The sparsely grown species-rich herb-dominated ready-mix TV6 (cveg,mean = 37%) showed in mean 49% eroded area after tests with qw = 0.009 m²/s. Comparing Ae across the slope sections (upper, middle, lower slope), in general no big differences are found except for TV4 (severe erosion on the middle slope due to large bare spots) and TV6 (increase of erosion along the slope).
Figure 11a shows the cumulative overflow volume Vcum plotted against the testing time t for the different vegetated slopes. The reinforced grass-herb mixture TV4grid underwent the highest cumulative overflow volume (Vcum = 1369 m³/m), followed by the grass-dominated mixture TV1 (Vcum = 1322 m³/m). The present results are compared to wave overtopping data on dormant Bermuda grass on clay soil from tests with the Colorado State University wave overtopping simulator [40] (Figure 11a). The dormant Bermuda grass failed due to Vcum = 2175 m³/m. Healthy Bermuda grass showed no damage after wave overtopping with Vcum = 16522 m³/m [40]. In direct comparison, the present hydraulic loads are relatively small. However, please note that these hydraulic loads did not lead to failure of the vegetation covers.
In van der Meer et al. (2010) [31], grass covered slopes in good condition did not fail from erosion due to mean wave overtopping discharges up to 0.03 m²/s. Some test sections even resisted mean overtopping discharges up to 0.075 m²/s. Except for the sparsely-vegetated herb-dominated ready-mix TV6, all vegetated covers of the present study experienced maximum overflow rates > 0.095 m²/s (Figure 10), exceeding the reference of 0.03 m²/s [31], but when comparing results from overflow and overtopping tests, the different load mechanisms have to be considered (see Section 3.3.3).
In Figure 11b, the mean net percentage of eroded area Ae,mean,net, here defined as the eroded area under consideration of the vegetation coverage Ae,mean,net = Ae,mean−(100−cveg), is given as function of the cumulative overflow volume Vcum for the different vegetated covers. Under the assumption, that erosion first occurred at bare spots, Ae,mean,net depicts when the erosion exceeds the bare area, and thus is negative until Ae,mean is larger than the percentage of bare area (100–cveg). For the species-poor grass-dominated mixture TV1, Ae,mean,net is just below 0% at the end of testing, i.e., the percentage of eroded area was minimally lower than the percentage of bare spots. Accordingly, the applied hydraulic loads would not have caused damage to TV1 with a 100% vegetation cover. Judging from the results of Ae,mean,net, higher loads are necessary to cause erosion on the vegetated parts of the grass-herb mixture TV4 compared to the herb-dominated mixture TV5 (Figure 11b).

3.3.3. Discussion of the Methodology and Results of the Overflow Simulations

Due to model effects at the flume walls, the overflow tests had to be stopped before actual failure of the dike covers occurred. Thus, no conclusions on critical hydraulic parameters can be drawn. No failure has to be expected for the investigated hydraulic loads and similar dike covers, and even further resistance can be anticipated. The actual maximum tolerable hydraulic loads have to be determined in future studies.
All tested dike covers had a quite uneven and patchy vegetation coverage and erosion was generally initiated at bare spots. Previous studies revealed a correlation between root parameters and the point of failure or the soil detachment ratio respectively [40,41]. It is believed that this correlation applies primarily to surfaces with evenly distributed vegetation where the root system has the highest influence on the erosion progress. As soon as weak spots in the cover are present, these become the predominant factor for erosion initiation and the root system is of secondary importance, e.g., in terms of limiting the erosion spreading as observed for TV1. This confirms again that the maintenance of the dike cover with the objective of preserving a high vegetation coverage without weak points (bare spots, mice holes, etc.) plays a major role in dike safety.
Data of the percentage of eroded area and the grade of coverage are estimations from visual inspections. Even though the auxiliary tables of Gehlker (1977) [45] were used, the measurements are based on subjective assessment and may induce uncertainties to the analysis. Alternative methods that allow for objective assessment of erosion on large surfaces are required. Caution is called for when applying optimal methods, such as LiDAR (Light Detection And Ranging), as results can be influenced by vegetation, and erosion beneath reinforcement grids cannot be measured.
The present tests were performed with stationary overflow. The results are not directly transferable to the naturally occurring nonstationary hydraulic loads of sea dikes due to wave overtopping [37,38]. For equal shear stresses, damage due to intermittent wave overtopping is higher than due to steady overflow [37]. The tests give, however, new insights into erosion patterns and a first comparison of the erosion resistance of different grass and herb vegetations.

4. Conclusions

Wave impact and overflow simulations in combination with vegetation analyses were conducted on differently vegetated surfaces to investigate the correlation of the hydraulic resistance and vegetation properties. Root analyses revealed exponentially decreasing root density and root length density with increasing depth in agreement with previous studies. During wave impact simulations, all vegetated surfaces experienced slower erosion compared to the unvegetated clay surface. No consistent temporal development of the erosion resistance to wave impacts was found, similar to findings for the root parameters. The unreinforced vegetated covers revealed an exponential decrease of the erosion rate with increasing root density and root length density. New empirical descriptions of the correlation were achieved. Geogrid reinforcements provide additional protection when the upper vegetation layer is eroded and reduce the erosion rate over depth. For further verification of the results, in situ tests on real dikes with vegetations of different age, condition, management etc., are recommended. These would be possible with the presented wave impact simulator after slight modifications of the test-setup with in situ supply of water and compressed air. During overflow simulations, the relatively densely-vegetated grass-dominated standard mixture experienced least erosion. When weak spots are present in the cover, these become the predominant factor for erosion initiation.
An adaptation of the dike vegetation towards ecologically more valuable compositions can enhance the ecosystem services of dikes, especially biodiversity and food sources for blossom searching insects. The erosion resistance is, amongst others, influenced by the root characteristics, which again depend on the vegetation species. In previous studies, an increase of soil erosion resistance against rainfall was found with increasing vegetation diversity. The study at hand indicates that the investigated mixtures with a higher percentage of herbs and higher diversity lead in early development stages and under the tested conditions to lower erosion resistance compared to the standard grass-dominated mixture. The present tests were performed with very young vegetation, which were additionally stressed from heavy rainfall events and exceptional heat waves during summer. Erosion resistance may increase with time due to further development of the vegetation. The climatic boundary conditions might have influenced the vegetation development and thus erosion resistance. The results are only valid for similar boundary conditions (vegetation characteristics, condition, hydraulic loads, etc.). Tests with fully covered surfaces could reveal the full potential of the vegetations, especially of the grass-herb mixture. Studies over a longer period of time with a higher number of root analyses and large-area erosion measurements are necessary to consider long-term effects and the stochastic nature of vegetation development.

Author Contributions

Conceptualization, B.S. and H.S.; Methodology, B.S. and H.S.; Formal analysis, B.S.; investigation, B.S.; Resources, H.S.; data curation, B.S.; Writing—original draft preparation, B.S.; Writing—review and editing, H.S.; Visualization, B.S.; supervision, H.S.; Project administration, H.S.; And funding acquisition, H.S. and others. All authors have read and agreed to the published version of the manuscript.

Funding

This research was funded by the German Federal Ministry of Education and Research (BMBF) within the project EcoDike, grant number 03F0757 A.

Acknowledgments

The authors thank the technical staff and student assistants for their help with the model tests and Dipl.-Ing. Stefan Felder (WRL, UNSW Sydney) for provision of the double-tip conductivity probes and the support during performance and analysis of the overflow simulations. Additionally, burrowing of the wave impact simulator from LWI, TU Braunschweig, is acknowledged. The experimental data of the present study are publicly accessible at a data repository (https://doi.org/10.6084/m9.figshare.12387839).

Conflicts of Interest

The authors declare no conflict of interest. The funders had no role in the design of the study; in the collection, analyses, or interpretation of data; in the writing of the manuscript, or in the decision to publish the results.

References

  1. IPCC. IPCC Special Report on the Ocean and Cryosphere in a Changing Climate. 2019. Available online: https://www.ipcc.ch/srocc/ (accessed on 22 June 2020).
  2. Dangendorf, S.; Hay, C.; Calafat, F.M.; Marcos, M.; Piecuch, C.G.; Berk, K.; Jensen, J. Persistent acceleration in global sea-level rise since the 1960s. Nat. Clim. Chang. 2019, 9, 705–710. [Google Scholar] [CrossRef] [Green Version]
  3. Arns, A.; Wahl, T.; Dangendorf, S.; Jensen, J. The impact of sea level rise on storm surge water levels in the northern part of the German Bight. Coast. Eng. 2015, 96, 118–131. [Google Scholar] [CrossRef]
  4. Chini, N.; Stansby, P.; Leake, J.; Wolf, J.; Roberts-Jones, J.; Lowe, J. The impact of sea level rise and climate change on inshore wave climate: A case study for East Anglia (UK). Coast. Eng. 2010, 57, 973–984. [Google Scholar] [CrossRef]
  5. Arns, A.; Dangendorf, S.; Jensen, J.; Talke, S.; Bender, J.; Pattiaratchi, C. Sea-level rise induced amplification of coastal protection design heights. Sci. Rep. 2017, 7, 40171. [Google Scholar] [CrossRef]
  6. De Vriend, H.J.; van Koningsveld, M.; Aarninkhof, S.G.J.; de Vries, M.B.; Baptist, M.J. Sustainable hydraulic engineering through building with nature. J. Hydro Environ. Res. 2015, 9, 159–171. [Google Scholar] [CrossRef]
  7. Temmerman, S.; Meire, P.; Bouma, T.J.; Herman, P.M.J.; Ysebaert, T.; de Vriend, H.J. Ecosystem-based coastal defence in the face of global change. Nature 2013, 504, 79–83. [Google Scholar] [CrossRef]
  8. Sutton-Grier, A.E.; Gittman, R.K.; Arkema, K.K.; Bennett, R.O.; Benoit, J.; Blitch, S.; Burks-Copes, K.A.; Colden, A.; Dausman, A.; DeAngelis, B.M.; et al. Investing in natural and nature-based infrastructure: Building better along our coasts. Sustainability 2018, 10, 523. [Google Scholar] [CrossRef] [Green Version]
  9. Gutiérrez, J.; Jones, C.; Byers, J.E.; Arkema, K.; Berkenbusch, K.; Commito, J.; Duarte, C.M.; Hacker, S.; Lambrinos, J.; Hendriks, I.E.; et al. Physical ecosystem engineers and the functioning of estuaries and coasts. In Treatise on Estuarine and Coastal Science; Wolanski, E., McLusky, D.S., Eds.; Elsevier/Academic Press: Amsterdam, The Netherlands, 2011; pp. 53–81. ISBN 978-0-12-374711-2. [Google Scholar]
  10. Barbier, E.B.; Hacker, S.D.; Kennedy, C.; Koch, E.W.; Stier, A.C.; Silliman, B.R. The value of estuarine and coastal ecosystem services. Ecol. Monogr. 2011, 81, 169–193. [Google Scholar] [CrossRef]
  11. Narayan, S.; Beck, M.W.; Reguero, B.G.; Losada, I.J.; van Wesenbeeck, B.; Pontee, N.; Sanchirico, J.N.; Ingram, J.C.; Lange, G.-M.; Burks-Copes, K.A. The effectiveness, costs and coastal protection benefits of natural and nature-based defences. PLoS ONE 2016, 11, e0154735. [Google Scholar] [CrossRef] [Green Version]
  12. Schoonees, T.; Gijón Mancheño, A.; Scheres, B.; Bouma, T.J.; Silva, R.; Schlurmann, T.; Schüttrumpf, H. Hard structures for coastal protection, towards greener designs. Estuaries Coasts 2019, 42, 1709–1729. [Google Scholar] [CrossRef]
  13. Strain, E.M.A.; Olabarria, C.; Mayer-Pinto, M.; Cumbo, V.; Morris, R.L.; Bugnot, A.B.; Dafforn, K.A.; Heery, E.; Firth, L.B.; Brooks, P.R.; et al. Eco-engineering urban infrastructure for marine and coastal biodiversity: Which interventions have the greatest ecological benefit? J. Appl. Ecol. 2017, 55, 426–441. [Google Scholar] [CrossRef]
  14. Hall, A.E.; Herbert, R.J.H.; Britton, J.R.; Hull, S.L. Ecological enhancement techniques to improve habitat heterogeneity on coastal defence structures. Estuarine Coast. Shelf Sci. 2018, 210, 68–78. [Google Scholar] [CrossRef]
  15. Mohamed, T.A.; Alias, N.A.; Ghazali, A.H.; Jaafar, M.S. Evaluation of environmental and hydraulic performance of bio-composite revetment blocks. Am. J. Environ. Sci. 2006, 2, 129–134. [Google Scholar] [CrossRef] [Green Version]
  16. Scheres, B.; Schüttrumpf, H. Enhancing the ecological value of sea dikes. Water 2019, 11, 1617. [Google Scholar] [CrossRef] [Green Version]
  17. CIRIA. The International Levee Handbook; Construction Industry Research and Information Association (CIRIA): London, UK, 2013; ISBN 978-0-86017-734-0. [Google Scholar]
  18. EAK. Empfehlungen für Küstenschutzwerke: Korrigierte Ausgabe 2007. In Die Küste; Kuratorium für Forschung im Küsteningenieurwesen, Ed.; Bundesanstalt für Wasserbau (BAW): Karlsruhe, Germany, 2002. [Google Scholar]
  19. Führböter, A.; Dette, H.H.; Grüne, J. Response of Sea Dykes Due to Wave Impacts. Coastal Engineering 1976. In Proceedings of the 15th International Conference on Coastal Engineering, Honolulu, HI, USA, 11–17 July 1976; American Society of Civil Engineers: New York, NY, USA, 1977; pp. 2604–2622. ISBN 9780872620834. [Google Scholar]
  20. Witte, H.-H.R. Druckschlagbelastung durch Wellen in deterministischer und stochastischer Betrachtung. Ph.D. Thesis, Technische Universität Carolo-Wilhelmina zu Braunschweig, Braunschweig, Germany, 1988. [Google Scholar]
  21. Bölke, S.; Relotius, P.C. Über die wellenerzeugten Druckschlagbelastungen von Seedeichen im Böschungsbereich zwischen 1:4 und 1:6. In Mitteilungen Leichtweiss-Institut für Wasserbau der Technischen Universität Braunschweig; Leichtweiß-Institut für Wasserbau: Braunschweig, Germany, 1974; pp. 358–388. [Google Scholar]
  22. Führböter, A.; Sparboom, U. Shock Pressure Interactions on Prototype Sea Dykes Caused by Breaking Waves. In Proceedings of the SOWAS’88 (Modelling Soil-Water-Structure Interactions), Delft, The Netherlands, 29 August–2 September 1988; pp. 243–252, ISBN 90.6191.8154. [Google Scholar]
  23. Stive, R.J.H. Wave impact on uniform steep slopes at approximately prototype scale. In Symposium on Scale Effects in Modelling Hydraulic Structures; IAHR: Esslingen, Germany, 1984. [Google Scholar]
  24. Technical Advisory Committee for Flood Defence (TAW). Erosion Resistance of Grassland as Dike Covering; Technical Report; TAW: Delft, The Netherlands, 1997.
  25. Piontkowitz, T. EroGRASS. Failure of Grass Cover Layers at Seaward and Shoreward Dike Slopes. Performance, Results and Conclusions. 2012. Available online: http://www.masterpiece.dk/UploadetFiles/10852/36/EroGrassreportB.pdf (accessed on 18 June 2020).
  26. Smith, G.M.; Seijffert, J.W.W.; van der Meer, J.W. Erosion and overtopping of grass dike large scale model tests. Coast. Eng. 1994, 2639–2652. [Google Scholar]
  27. Seijffert, J.W.; Verheij, H. Grass covers and reinforcement measures. In Dikes and Revetments: Design, Maintenance and Safety Assessment; Pilarczyk, K.W., Ed.; Balkema: Rotterdam, The Netherlands, 1998; pp. 289–302. ISBN 9781315141329. [Google Scholar]
  28. van Steeg, P.; Klein Breteler, M.; Labrujere, A. Use of wave impact generator and wave flume to determine strength of outer slopes of grass dikes under wave loads. Int. Conf. Coast. Eng. 2015. [Google Scholar] [CrossRef]
  29. Hewlett, H.W.M.; Boorman, L.A.; Bramley, L.A. Design of Reinforced Grass Waterways; Construction Industry Research and Information Association (CIRIA): London, UK, 1987; ISBN 9780860172857. [Google Scholar]
  30. Van der Meer, J.W.; Allsop, N.W.H.; Bruce, T.; de Rouck, J.; Kortenhaus, A.; Pullen, T.; Schüttrumpf, H.; Troch, P.; Zanuttigh, B. EurOtop. Manual on Wave Overtopping of Sea Defences and Related Structures. An Overtopping Manual Largely Based on European Research, but for Worldwide Application. 2018. Available online: www.overtopping-manual.com (accessed on 31 May 2020).
  31. Van der Meer, J.; Schrijver, R.; Hardeman, B.; van Hoven, A.; Verheij, H.; Steendam, G.J. Guidance on Erosion Resistance of Inner Slopes of Dikes from Three Years of Testing with the Wave Overtopping Simulator. In Coasts, Marine Structures and Breakwaters: Adapting to Change; Allsop, W., Ed.; Thomas Telford Ltd.: London, UK, 2010; pp. 460–473. ISBN 0-7277-4159-4. [Google Scholar]
  32. Trung, L.H. Overtopping on Grass Covered Dikes: Resistance and Failure of the Inner Slopes. Ph.D. Thesis, Technische Universiteit Delft, Delft, The Netherlands, 2014. [Google Scholar]
  33. Le, H.T.; Verhagen, H.J.; Vrijling, J.K. Damage to grass dikes due to wave overtopping. Nat. Hazards 2017, 86, 849–875. [Google Scholar] [CrossRef]
  34. Dean, R.G.; Rosati, J.D.; Walton, T.L.; Edge, B.L. Erosional equivalences of levees: Steady and intermittent wave overtopping. Ocean Eng. 2010, 37, 104–113. [Google Scholar] [CrossRef]
  35. Hughes, S.; Thornton, C. Tolerable time-varying overflow on grass-covered slopes. JMSE 2015, 3, 128–145. [Google Scholar] [CrossRef] [Green Version]
  36. Van der Meer, J.W.; Hardeman, B.; Steendam, G.J.; Schuttrumpf, H.; Verheij, H. Flow depths and velocities at crest and landward slope of a dike, in theory and with the wave overtopping simulator. Int. Conf. Coastal. Eng. 2010, 1, 10. [Google Scholar] [CrossRef] [Green Version]
  37. Van Damme, M.; Ponsioen, L.; Herrero, M.; Peeters, P.; Lang, M.; Klijn, F.; Samuels, P. Comparing overflow and wave-overtopping induced breach initiation mechanisms in an embankment breach experiment. In Proceedings of the FLOODrisk 2016—3rd European Conference on Flood Risk Management, Lyon, France, 17–21 October 2016. [Google Scholar]
  38. Ponsioen, L.; van Damme, M.; Hofland, B.; Peeters, P. Relating grass failure on the landside slope to wave overtopping induced excess normal stresses. Coast. Eng. 2019, 148, 49–56. [Google Scholar] [CrossRef]
  39. VTV. Voorschrift Toetsen op Veiligheid Primaire Waterkeringen; Ministerie van Verkeer en Waterstaat: The Hague, The Netherlands, 2007; ISBN 978-90-369-5762-5.
  40. Thornton, C.; Hughes, S.; Scholl, B.; Youngblood, N. Estimating grass slope resiliency during wave overtopping: Results from full-scale overtopping simulator testing. Int. Conf. Coast. Eng. 2014, 1. [Google Scholar] [CrossRef] [Green Version]
  41. Vannoppen, W.; Vanmaercke, M.; de Baets, S.; Poesen, J. A review of the mechanical effects of plant roots on concentrated flow erosion rates. Earth Sci. Rev. 2015, 150, 666–678. [Google Scholar] [CrossRef] [Green Version]
  42. Graunke, A.; Wrage-Mönnig, N. Grüne Seedeiche für den Küstenschutz. In Leistungen von Gras und Klee-Gras auf Acker und Grünland, Proceedings of the 62. Jahrestagung der AGGF 2018 in Kiel, Germany, 30 August–1 September 2018; Institut für Pflanzenbau und Pflanzenzüchtung, Christian-Albrechts-Universität zu Kiel: Kiel, Germany, 2018; pp. 95–99. ISBN 978-3-00-060516-1. [Google Scholar]
  43. Berendse, F.; van Ruijven, J.; Jongejans, E.; Keesstra, S. Loss of plant species diversity reduces soil erosion resistance. Ecosystems 2015, 18, 881–888. [Google Scholar] [CrossRef]
  44. Scheres, B.; Schüttrumpf, H.; Felder, S. Flow resistance and energy dissipation in supercritical air-water flows down vegetated chutes. Water Resour. Res. 2020. [Google Scholar] [CrossRef] [Green Version]
  45. Gehlker, H. Eine Hilfstafel zur Schätzung von Deckungsgrad und Artmächtigkeit. In Mitteilungen der Florist.-Soziol. Arbeitsgemeinschaft NF; Floristisch-soziologischen Arbeitsgemeinschaft e.V.: Göttingen, Germany, 1977; Volume 19, pp. 427–429. [Google Scholar]
  46. Lobet, G.; Pagès, L.; Draye, X. A novel image-analysis toolbox enabling quantitative analysis of root system architecture. Plant Physiol. 2011, 157, 29–39. [Google Scholar] [CrossRef] [PubMed] [Green Version]
  47. Stanczak, G. Breaching of Sea Dikes Initiated from the Seaside by Breaking Wave Impacts. Ph.D. Thesis, University of Braunschweig, Braunschweig, Germany, University of Florence, Florence, Italy, 2008. [Google Scholar]
  48. Führböter, A. Model and prototype tests for wave impact and run-up on a uniform 1:4 slope. Coast. Eng. 1986, 10, 49–84. [Google Scholar] [CrossRef]
  49. Sprangers, H. Vegetation Dynamics and Erosion Resistance of Sea Dyke Grassland. Ph.D. Thesis, Wageningen Agricultural University, Wageningen, The Netherlands, 1999. [Google Scholar]
Figure 1. Test vegetations prior to testing in autumn 2018 (see also [44]). TV1 = species-poor grass-dominated mixture, TV4 = grass-herb mixture, TV5 = species-rich herb-dominated EcoDike mixture, TV6 = species-rich herb-dominated ready-mix, and grid = geogrid reinforcement.
Jmse 08 00519 g001
Figure 2. (a) Schematic sketch and (b) photo of the experimental test setup for simulating wave impacts by Stanczak (2008) [47]; (c) pin-profiler for documentation of the erosion depth, and (d) detail photo of the scale and measuring bar (photos: Delfino, 2018).
Jmse 08 00519 g002
Figure 3. (a) Typical signal (pressure p over time t) of a wave impact simulation from tests with a pressure load cell in the impact zone (fall height hf = 1.65 m and water level in the pipe hw = 0.25 m). (b) Maximum impact pressures pmax measured for different fall heights hf and water levels in the pipe hw. Error indicators showing the standard deviation.
Jmse 08 00519 g003
Figure 4. (a) Schematic sketch of the overflow test setup, (b) photo of the dike model with test vegetation TV1 (left) and TV6 (right) (view from toe of the dike) (photo: Holle, 2018), and (c) measuring instrumentation during tests (view from toe of the dike).
Jmse 08 00519 g004
Figure 5. Root density RD (a) and root length density RLD (b) of different vegetated covers as function of the depth under surface d. TV1 = species-poor grass-dominated mixture, TV4 = grass-herb mixture, TV5 = species-rich herb-dominated EcoDike mixture, TV6 = species-rich herb-dominated ready-mix, and grid = geogrid reinforcement. Comparison of data with previous studies [24,49], where FA-G+ corresponds to a fertilized, periodically grazed ryegrass dike section in Friesland-Boonweg [49].
Jmse 08 00519 g005
Figure 6. Erosion patterns during the wave impact simulations: Test surfaces of TV1 (a,b), TV5 (c), and TV5grid (d) before (left) and after testing (right). TV1 = species-poor grass-dominated mixture, TV5 = species-rich herb-dominated EcoDike mixture, and grid = geogrid reinforcement (photos: Delfino, 2018).
Jmse 08 00519 g006aJmse 08 00519 g006b
Figure 7. Maximum erosion depth de,max as function of the cumulative wave impact pressure pcum for different vegetated covers. TV1 = species-poor grass-dominated mixture, TV4 = grass-herb mixture, TV5 = species-rich herb-dominated EcoDike mixture, TV6 = species-rich herb-dominated ready-mix, and grid = geogrid reinforcement.
Jmse 08 00519 g007
Figure 8. Erosion rate E as function of the root density RD (left) and root length density RLD (right) for different vegetated covers. (a) and (b) show data of unreinforced vegetated covers; (c) and (d) show data of vegetated covers reinforced with a three-dimensional geogrid. TV1 = species-poor grass-dominated mixture, TV4 = grass-herb mixture, TV5 = species-rich herb-dominated EcoDike mixture, TV6 = species-rich herb-dominated ready-mix, and grid = geogrid reinforcement.
Jmse 08 00519 g008
Figure 9. Erosion patterns during the overflow simulations: Sections of the test surfaces of TV1 (a), TV4 (b), TV4grid (c), TV5 (d), TV5grid (e), and TV6 (f) before (left) and after testing (middle). Positions of the sections along the slope (right). TV1 = species-poor grass-dominated mixture, TV4 = grass-herb mixture, TV5 = species-rich herb-dominated EcoDike mixture, TV6 = species-rich herb-dominated ready-mix, and grid = geogrid reinforcement.
Jmse 08 00519 g009aJmse 08 00519 g009b
Figure 10. Percentage of eroded area Ae along the 1:3 slope as function of the overflow rate qw for different vegetated covers. TV1 = species-poor grass-dominated mixture, TV4 = grass-herb mixture, TV5 = species-rich herb-dominated EcoDike mixture, TV6 = species-rich herb-dominated ready-mix, and grid = geogrid reinforcement.
Jmse 08 00519 g010
Figure 11. (a) Cumulative overflow volume Vcum plotted against the testing time t for the different vegetated slopes with comparison to data on dormant Bermuda grass on clay soil from literature (black lines) [40], arrows indicate that no failure of the dike cover occurred. (b) Mean net percentage of eroded area Ae,mean,net, defined as the percentage of eroded area under consideration of the vegetation coverage Ae,mean,net = Ae,mean−(100−cveg), as mean value along the 1:3 slope as function of the cumulative overflow volume Vcum for the different vegetated covers. TV1 = species-poor grass-dominated mixture, TV4 = grass-herb mixture, TV5 = species-rich herb-dominated EcoDike mixture, TV6 = species-rich herb-dominated ready-mix, and grid = geogrid reinforcement.
Jmse 08 00519 g011
Table 1. Erosion models to describe the erosion on the seaward slope due to wave impacts.
Erosion ModelNotation
Seijffert and Verheij (1998) [27]
E = c E · H S 2
E: erosion rate (mm/h)
cE: erosion coefficient (1/(ms)), see [27]
HS: significant wave height (m)
van Steeg et al. (2015) [28]
E = 0   for   H S < 0.5   m
E = a x · ( H S 0.5 )   for   H S 0.5   m
E: erosion rate (mm/h or m²/h)
ax: erosion coefficient (mm/(hm) or m²/(hm)), see [28]
HS: significant wave height (m)

