Article

On the Use of the Hybrid Causal Logic Methodology in Ship Collision Risk Assessment

1
School of Logistics Engineering, Wuhan University of Technology, Wuhan 430063, China
2
Intelligent Transport Systems Research Center, Wuhan University of Technology, Wuhan 430063, China
3
National Engineering Research Center of Water Transport Safety (WTSC), Wuhan 430063, China
4
Department of Nuclear Engineering, North Carolina State University, Raleigh, NC 27695, USA
5
B. John Garrick Institute for the Risk Sciences, University of California Los Angeles, Los Angeles, CA 90095, USA
*
Author to whom correspondence should be addressed.
J. Mar. Sci. Eng. 2020, 8(7), 485; https://doi.org/10.3390/jmse8070485
Submission received: 15 May 2020 / Revised: 18 June 2020 / Accepted: 26 June 2020 / Published: 30 June 2020

Abstract

:
A ship collision accident is one of the most dangerous and common types of maritime accidents. Traditional probabilistic risk assessment (PRA) of ship collision accidents is a methodology that can be adopted to ensure maritime safety. Nevertheless, a need for better approaches to model human behavior, such as risk identification, communication, and decision-making, has been identified. Such advanced PRA methods require a more explicit way of taking human factors into consideration than the traditional risk assessment methods. Hybrid causal logic (HCL) is an advanced PRA method due to its unique three-level framework that includes event sequence diagrams, fault trees, and Bayesian networks, which makes it suitable for modeling human behavior that is important to ship collision accidents. This paper discusses the applicability of the HCL methodology for the ship collision accident. Firstly, the event sequences of typical ship collision accidents are summarized based on the study of 50 accident investigation reports. Then, fault trees for mechanical failure events and the Bayesian networks for human error events are constructed to analyze the events in a structured way at a more detailed level. Finally, the three main end-state types of ship collision avoidance scenario have been quantified. The result of the probability of a ship collision accident is verified by estimating the annual frequency of collision accidents in the Singapore Strait. Comparing with the historical data, the estimation results are quite near to the real case. By taking advantage of the HCL methodology, the modeling of ship collision scenarios can be carried out at a deep logical level. At the same time, it is possible to combine a detailed analysis of various primary events with a comprehensive analysis at the system level.

1. Introduction

As one of the main types of maritime accidents, ship collision accidents often result in catastrophic consequences, for instance casualties [1], huge property losses and environmental pollution [2,3]. Therefore, the research concerning ship collision accidents has been one of the hottest academic fields for decades. The prediction and prevention of ship collision accidents are the aims of ship collision research, and the risk-based approach is one of the main topics. Risk-based research has provided valuable information for decision-support in all stages of ship collision avoidance, including research and development of navigation equipment [4,5], risk identification [6], anti-collision decision-making [7], and operation [8].
With the deepening research on ship collision accidents, various methods are presented to try to predict collision accidents in advance, and then gave reasonable suggestions to reduce collision risk. Most of the onboard navigation equipment already has primary function of collision alart by calculating the closest point of approach (CPA). CPA, including the time to the CPA (TCPA) and distance to the CPA (DCPA), is a well-used method with a clear principle and simple calculation in ship collision risk assessment. Perera et al. [9] presented a fuzzy logic CA decision support system for two ships encounter situation based on CPA, and then developed it into a collision risk detection and quantification system in [10]. These methods based on CPA can be used as a good measure of risk, but hard to be used to reveal the evolution mechanism and internal logic of ship collision accident. A major problem of ship collision research is that the process of sailing is an activity with very high degree of freedom and large uncertainty. Using a system risk approach to study the consequences of collisions accidents between oil cargos, Floris et al. [11] found that the uncertainties of the scenario made a more accurate physical model impracticable. A large part of this uncertainty comes from human and organizational factors (HOFs). Some researchers have realized the decisive role of human factors in the process of ship collision avoidance [12], and quantitatively described human subjective intention in the methods [13]. However, this still does not reveal the interaction between HOFs and other factors and the influence of HOFs on the results.
Ship domain is another comprehensive model for describing ship collision risk [14] by proposing a special region around the sailing ship to characterize the collision risk in an encounter situation. Since ship domain can be seen as a two-dimensional representation of a risk situation, it is often used as a collision risk index [15] and risk level [16] to estimate the maritime risk in waterway risk analysis. Velocity obstacle algorithm [17] is another well used two dimensional risk representation model with prediction function. These risk-based description models based on geometric methods provide an integrated and rational framework of ship collision study to facilitate maritime safety analysis, and also convenient to introduce new risk-based models and decision-making methods to address uncertainty. However, these methods cannot analyse the ship collision scenario from the accident evolution aspect. At the same time, it does not have the capability to model mechanical performance and HOFs.
The Bayesian network (BN) model for modeling HOFs and other uncertain factors is also a common method for ship risk analysis. Goerlandt et al. [18] presented a maritime risk assessment framework, which applying BN for probabilistic risk quantification. Fan et al. [19] proposed a data-driven BN framework which can incorporate the HOFs into maritime accident analysis. These studies fully recognize the importance of uncertainties in maritime accidents, and try to model and analyze from different aspects. However, the development of maritime accidents is a dynamic process, all factors are changing with time. No matter the consequences of the accident, the development of the entire scenario follows a natural and fixed logical sequence. Ship collision accidents also have the characteristic of being able to be captured by only a few general types of scenarios since ships need to be operated in a strictly regulated environment. For instance, the anti-collision decision-making must be the subsequent event of risk identification and confirmation. BN does not have the ability to analyze the sequence of events.
To bridge these gaps, or at least to reduce them. An attempt is made to perform the ship collision accident risk analysis from all the three points by applying the hybrid causal logic (HCL) [20] methodology. The unique three-layer analysis structure of HCL makes this possible.
The HCL methodology is developed based on the principle of using appropriate methods to analyze the risks of different elements of the system. The technical system operated by an organization of people is one of the main applications of the HCL modeling and analysis, for instance, nuclear power plants, offshore operating platforms, and high-speed trains. Any assessment using the HCL methodology involves the development of a combination of three layers of models: event sequence diagrams (ESD), fault trees (FT), and Bayesian networks (BNs) [21]. Within this framework, the ship collision scenarios were modeled such that both the identification and decision-making activities of the own ship and target ship are explicitly captured. The first step was to build a general ESD describing the high-level collision avoidance scenarios. In the next step, FTs and BNs were constructed to explicitly model the events defined in the ESD. It should be noted that, depending on the type of ship involved in each event, the FTs and BNs of the same events in the ESD will be different. This is an important aspect of the assessment as the HCL methodology allows us to model the same high-level scenarios in the ESD layer with specific details in the FT and BN layers for each type of ship. Next, logically complete HCL models were built by linking the FTs and BNs to their corresponding events in the ESDs. Finally, the probabilistic data (e.g., conditional event probabilities) was added to the HCL models in order to run the quantification of scenario probabilities.
The remainder of the paper is organized as follows: Section 2 gives a short introduction of the HCL methodology and its software implementation. In Section 3, the ESD of ship collision scenarios is built using the general rules of collision avoidance and accident reports. In Section 4, the FTs and BNs of the events in ESD are determined. The results of risk assessment of ship collision accident scenarios are shown in Section 5. Finally, some discussions and conclusions are given in Section 6.

2. Overview of the HCL Methodology

In practice, the Boolean logic-based probabilistic risk assessment (PRA) methods such as FTs and ESDs or event trees (ETs) are widely used in analyzing risks of complex systems, while the human and organizational causal factors are usually modeled with BNs. The HCL methodology combines these to handle more complex scenarios. It is designed for socio-technical systems in which potential events such as equipment failures or human errors may lead to major accidents. These potential challenging events are found in many diverse industries (e.g., the transportation systems [22], offshore industries [23,24], and nuclear power [25]), however they share common characteristics like non-deterministic (i.e., soft) causal factors and lack of accident data which lead to the difficulty in appropriate modeling. To construct and quantify the HCL models, the Trilith software platform was used.

2.1. HCL Modeling Concept and Algorithm Overview

As depicted in Figure 1, the HCL methodology has an architecture of three layers to model each part with the most appropriate method. In this multi-layered model, ESDs form the first layer, followed by FTs and BNs.
ESDs capture all the possible end states and the related sequences of intermediate events emerging from the same initiating event, just like the ETs or flowcharts. Furthermore, intermediate events in ESDs include decision nodes to model the active sequence divergence according to, for example, the state of the systems or decision-making events. In the HCL methodology, ESDs make it possible to visualize the inner logic, dependencies, and time series of the causal factors of hazards or accidents, thereby enabling the causes of the different situations of the system to be analyzed intuitively. As some of the ESD events (e.g., mechanical failures) can be essentially decomposed into a set of physical elements, FTs are designed to create more detailed models of these kinds of events. The initiating or intermediate events of an ESD can be linked to the top event of an FT. The BN layer is the bottom layer in HCL methodology, and it is used to model the causal relationships explicitly. In an HCL diagram, the BNs nodes can be linked to any basic events in the FTs and any initial or intermediate events in the ESDs. This provides a practical and considerate way to model a complex system by building a three-layer logic structure based on the HCL methodology.
The HCL algorithm drives the quantification in the HCL methodology; the data required can be either point estimates or probability distributions of the events or nodes. The ESDs and FTs are converted into reduced ordered binary decision diagrams (ROBDDs) to obtain an exact solution [26]. Compared to top-down modeling procedure, the computing process is bottom-up. The results of the probability distributions of the ROBBDs are linked with the calculated results of the nodes in BNs. By determining the necessary parameters and state sets, all the states and details of the system modeled by HCL can be calculated, and then the risks can be obtained with the HCL-based risk management metric functions.
As the BNs in HCL include so many causal factors and may impact the whole model, the BNs can be no longer converted into binary decision diagrams (BDDs) in HCL methodology. A hybrid BDD/BN solution algorithm was developed by Groen and Mosleh [21] and Wang [20], and was further improved in a follow-up work by Diaconeasa [25].

2.2. HCL-Based Risk Management Metrics

The HCL algorithms not only calculate the cut sets of each end state of the risk scenarios and the probability of occurrence of these events, but also determine the factors which contribute most to the risks of the scenarios (i.e., importance measures) and the risks and performance indicators over time [27]. These functions make the HCL a decision supporting method more than a risk analysis tool since it can be used for risk-informed design too.
1. Importance measures. In most cases, the primary aim of risk analysis is to find the factors which contribute most significantly to the end state of concern or the whole risk scenario. In the HCL methodology, all the importance measures of the system hazards and the influence of the elements can be identified quantitatively. The HCL-based importance measures have four forms to analyze the different aspects of the events: the risk achievement worth (RAW), the diagnostic importance measure, the marginal importance measure, and the risk reduction worth (RRW).
(1) RAW or risk increase factor quantifies the change of the failure probability of a system given the failure of a component [28]. RAW can quantify the change of the failure probability of a system given the failure of a component. RAW is an important reference for system improvement. If the RAW of a component is close to 1, then its improvement will have little effect on the overall system.
(2) The diagnostic (or Fussell–Vesely) importance measure is the impact of components on the failure of the entire system [29]. The Fussell–Vesely importance measure quantifies the fractional decrease in the total risk level given the component is perfectly reliable.
RAW and Fussell–Vesely importance measure will be used in Section 6 to analyze the risk importance of basic events.
2. Risk indicators or safety monitoring: It is essential in a PRA methodology to monitor the states of the system and to track alteration in risk over time. This analysis is commonly done by specifying an event as a risk indicator and analyzing the ‘frequency’ and the ‘risk weight’ of this event. In HCL methodology, the range of risk indicator is expanded to the Pivotal Event (PE) in ESDs, gates and basic events in FTs, or variable state in BNs.
3. Precursor analysis and hazard ranking: In the HCL model, any event in the ESDs, FTs or BNs can be regarded as a precursor to risk. For instance, the event of ‘human decision error’ during navigation is a precursor to the undesired end state ‘ship collision accident.’ An interesting analysis can look at the relationship between these precursors and an undesirable end state, as well as how to avoid the accident even if these precursors happen. These questions can be answered by obtaining the cut sets and calculating the conditional probability of the end states given certain precursor events happening.
The Windows-only Trilith software platform was developed at the University of Maryland and expanded at the University of California, Los Angeles. The platform uses a cross-platform computational engine that has also been packaged into the integrated risk management system (IRIS) with different user interfaces and specific models developed for particular users, such as the United States Federal Aviation Administration. A cross-compatible command-line too named hybrid causal logic analyzer (HCLA) is also available for quantifying any time-dependent HCL model with uncertainties. Its main features cover risk model building functions, analysis tools, and other applications. The risk model building functions enable the user to construct and analyze HCL models with little or no training. Once the HCL model has been built, the analysis tools become available to output the minimal cut sets of every end state in ESDs, the sub-model results, and importance measures by setting a specific end state or category. Trilith also offers other advanced analysis features and visualization functions.

2.3. Methodological Framework

In this paper, a typical HCL model is developed for the ship collision risk analyses of general scenarios. The analysis procedure used in this section is a standard application of the HCL methodology accompanied by experience from traditional maritime risk analysis methods. The HCL methodology can be adopted for the ship collision accident by going through the following steps:
(1)
Define the risk influencing factors (RIF) and causal relationships of all the possible accident event sequences and form the ESD with the relevant intermediate events.
(2)
Model the events related to hardware failures by performing system decompositions using FTs.
(3)
Model the events that are influenced by human factors or other factors at a more detailed level by using BNs.
(4)
Assign relevant event probabilities in the ESDs and FTs, and the Conditional Probability Tables (CPTs) in the BNs.
(5)
Calculate the risk results.
The general strategy is to carry out the first four phases at one time and quantify the same ESD, FTs, and BNs for different conditions in phase 5 and 6. Examples of such conditions could be normal operation or emergency activities. Finally, the state of the RIFs for each operational end state can be evaluated and assigned.
In step 1, the RIFs and causal relationships are described, and the ESD is constructed with the relevant basic events following the logic of the evolution of accident. For quantification, the events in the ESD can either be given a probability or linked to an FT top event or BN node. Extensive domain specific knowledge of the ship collision accidents is required during the process of the description of the causal relationships. In most cases, extensive experience from different disciplines is necessary to obtain all the necessary information.
In steps 2 and 3, several RIFs in the ESD are analyzed at a more detailed level in FTs and BNs. Graphically, an ESD event is directly linked to the top gate of an FT and can be connected to any node in a BN. A basic event in a FT can also be connected to any BN node. Then, the fourth step is the assignment of the probabilities of the ESDs and FTs, and CPTs of the BNs. The HCL algorithms [28] are designed to capture all these dependencies explicitly.
The final step is the calculation of the results, including the events in ESD, FTs and the nodes in BNs. The algorithm of combining the FTs and BNs with ESDs [28] is an important part of the HCL methodology, and the algorithms guarantee a high computational efficiency for analyzing complex and large HCL models. It also should be noted that as the BNs are linked to the ESDs/FTs models, the ESD, FTs, and BNs cannot be quantified separately as the dependencies are modeled explicitly. In this paper, several HCL models are developed using the Trilith software platform.

3. Information Sources and Modeling Procedure

3.1. Accident Reports

In the study presented here, 50 ship collision accidents involving more than 100 vessels based on publicly available maritime accident reports were analyzed. Based on anticipated operational practice encounter situation of unmanned ships, only the events up to collision accidents were selected and analyzed. Although the immediate responses to collision accidents are regarded as vital to reducing the magnitude of consequences, the industry has not yet reached a consensus on how the unmanned ships would react immediately following the accident occurrence. Thus, the other phases of the collision accidents (e.g., secondary disasters) and their consequences were not considered in this work.
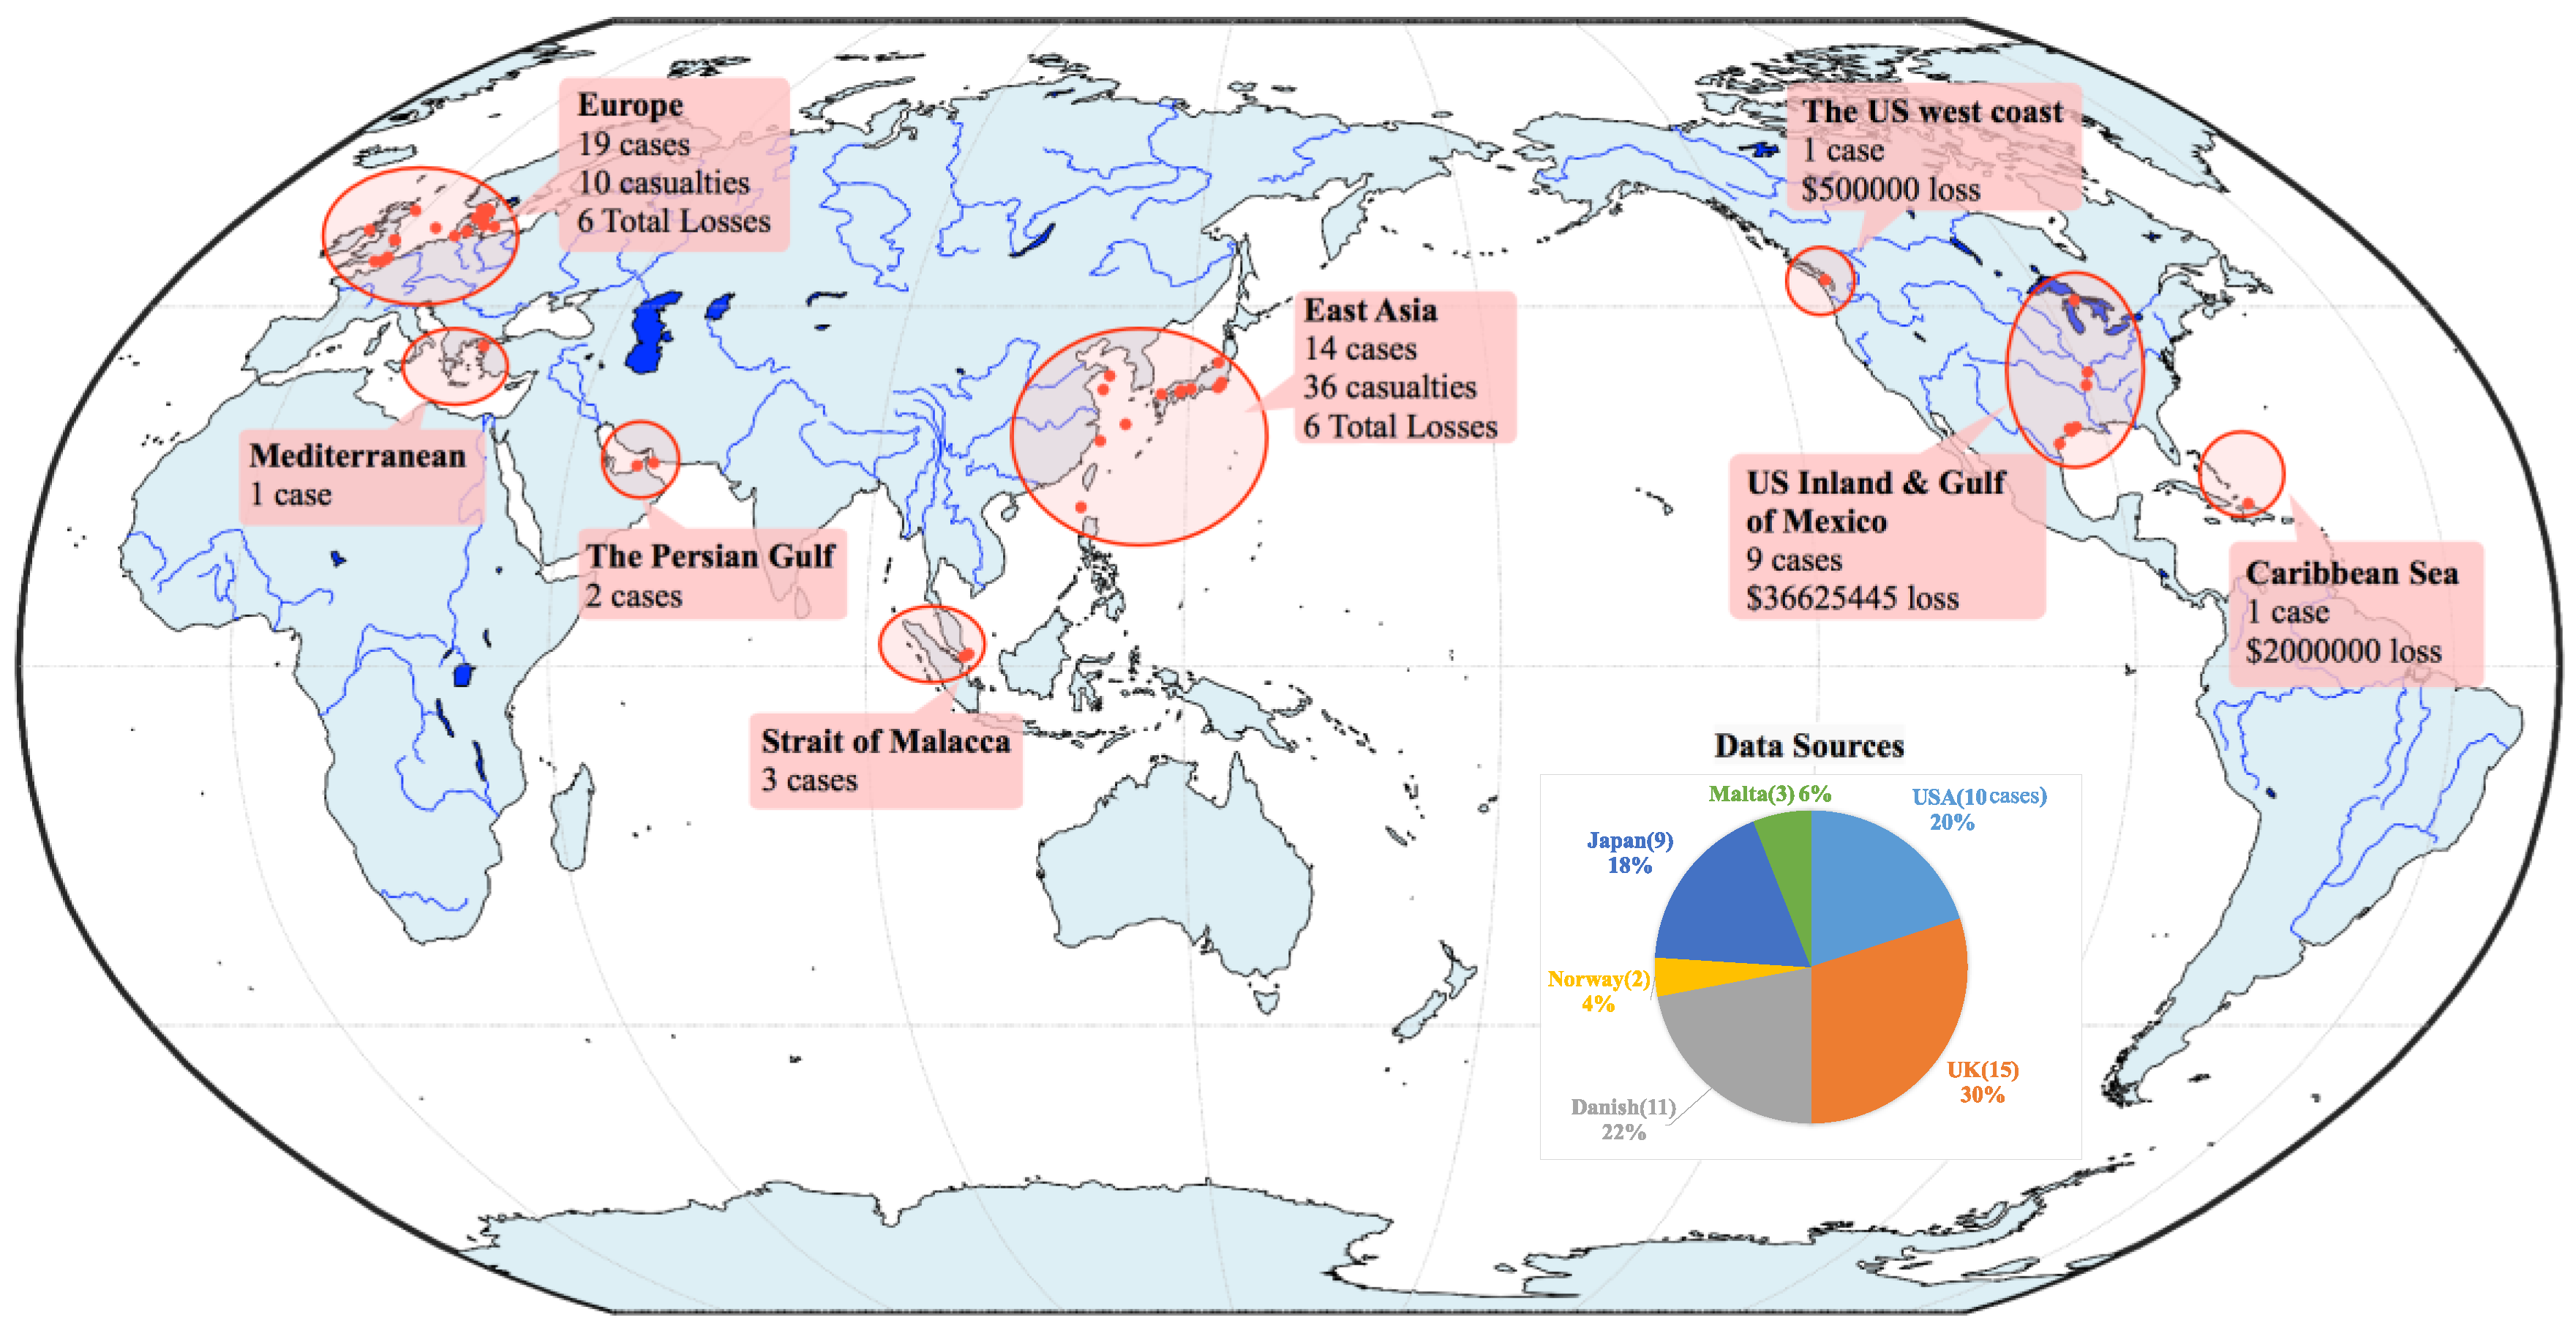
The accidents reports were collected from the following organizations: National Transportation Safety Board (USA)(10 cases) [30], Danish Maritime Accident Investigation Board (11 cases) [31], Marine Accident Investigation Branch (UK) (15 cases) [32], Japan Transport Safety Board (JTSB) (nine cases) [33], Accident Investigation Board Norway (AIBN) (two cases) [34], and Marine Safety Investigation Unit, Malta (three cases) [35]. The location information of the accidents can be seen in Figure 2.
All the information of the chosen accident is listed in Appendix A. In the accidents analyzed in this paper, 36 lives were lost, two lives were missed, and more than 13 people were injured. At least one ship was destroyed or heavily damaged per accident, and 10 vessels sank or were totally loss after collision. Several cases resulted in severe environmental damage, for instance, 12,500 L of diesel oil and 5500 L of lubricating oil leaked after the collision between cargo vessel MV SPRING BOK and liquid petroleum gas (LPG) tanker MV GAS ARCTIC in 24 March 2012 at 6 nautical mile (nm) south of Dungeness, UK (Appendix A). These accidents involved all kinds of normal ships, including cargo ships, Liquefied Natural Gas (LNG) ships, tanker, bulk carrier, vehicle carrier, and so on. Although fishing vessels were also mentioned in some of the investigation reports, the requirements and responsibilities of fishing vessels in International Regulations for Preventing Collisions at Sea (COLREGs) are different from those of the above-mentioned vessels. Therefore, this paper mainly focuses on the above-mentioned vessels, except fishing vessels. Most of the accidents happened in years 2010 through 2017 in various geographical regions around the world, include Asian, European, and North American waters. No particular association between ship age and the likelihood to become involved in the maritime accident has been observed.

3.2. Modeling Approach

The methodology of ESD analysis in HCL is different from the traditional post-accident analysis. The ESD and its associated FTs and BNs quantitively evaluates the impact of various causal factors on the particular event at a very detailed level. Thus, the logical sequence of events coming out historical accidents defines the basis for building the ESD.
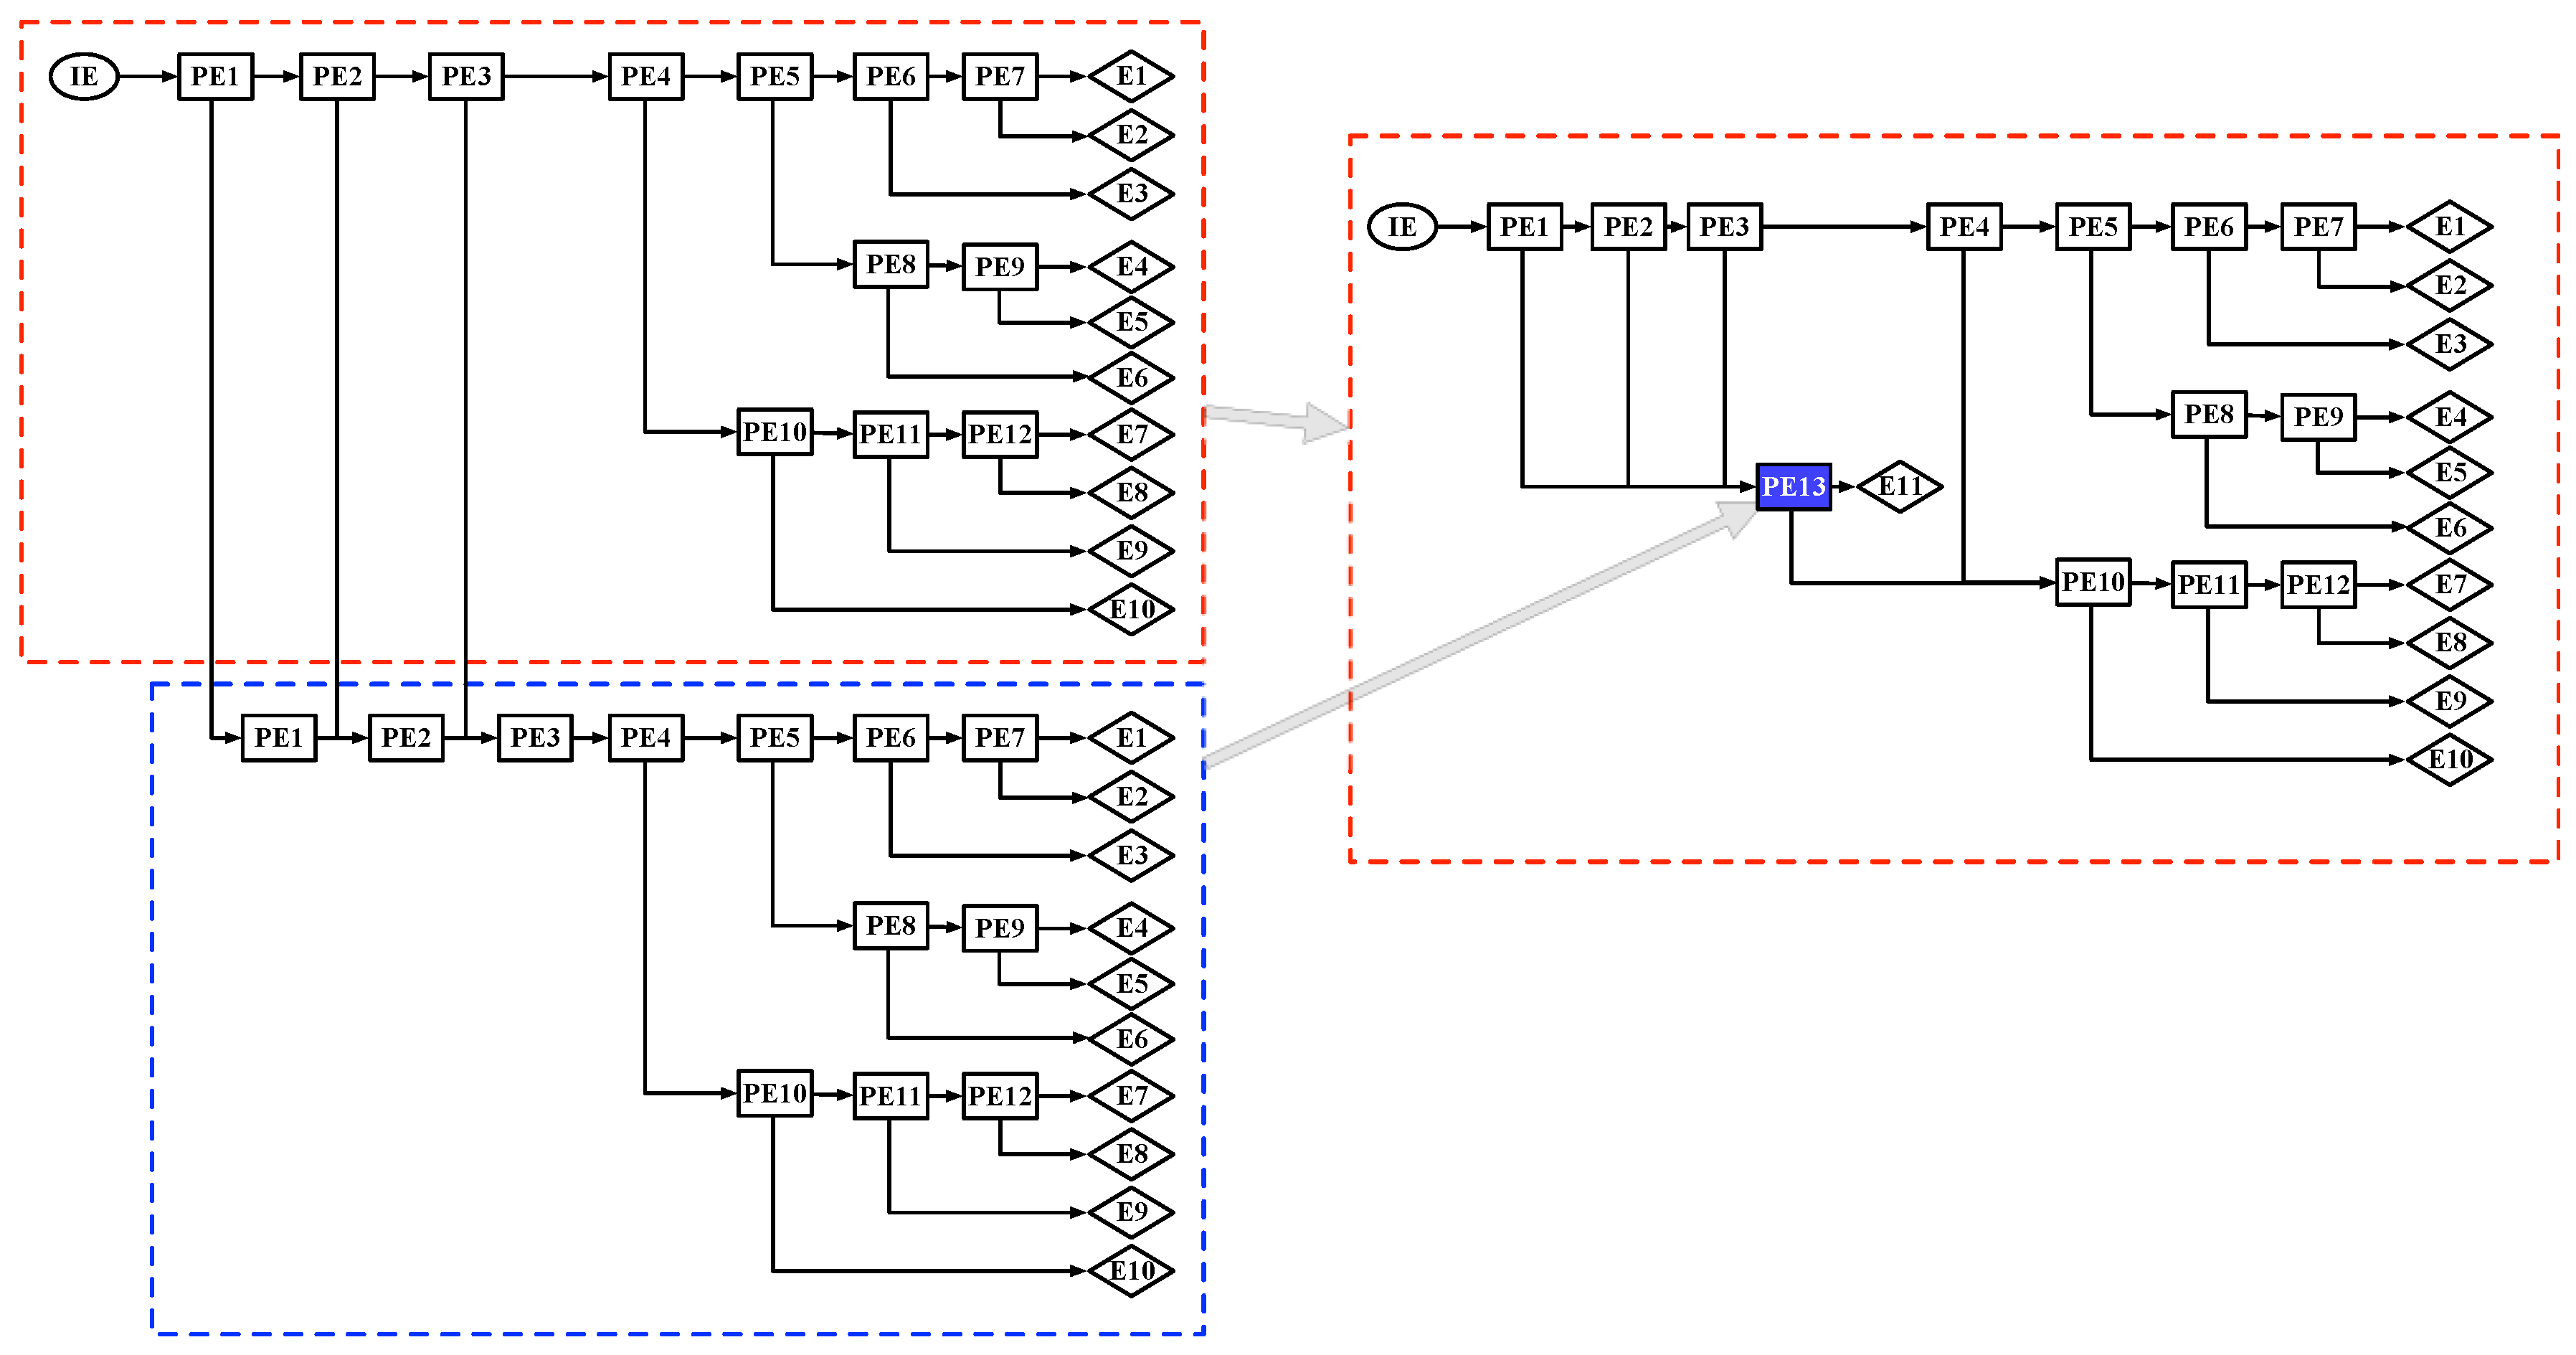
In addition, unlike the application of HCL in other fields (e.g., the offshore oil and gas industry, the high-speed railway, and the aircraft risk analysis [36]), both ships involved in a ship collision accident are liable subjects [37]. Even though there are different responsibilities according to ships’ maneuverability in COLREGs (Rule 18: Responsibilities between Vessels), essentially, both vessels involved are entirely independent actors in a ship collision accident. They have no affiliation relationships and neither belongs to a higher-level system. Furthermore, in most of the ship collision investigations, both ships are power-driven vessels, which means that they have the same capability to avoid collisions independently. There are two approaches for constructing HCL models for ship collision accidents under these conditions: modeling the events of both ships at the same time (namely multi-subject modeling) or choosing one ship as the main perspective. The traditional analysis of ship collision accidents generally engages the retrospective review analysis of every detail of the accident, which is a typical multi-subject analysis. While no matter which approach is adopted, the primary process of ship collision avoidance is the same. The main difference between these two approaches is that the ESD constructed using the first approach will exhibit a high degree of structural symmetry and dependency. However, the sequence structure of the ESD from the perspective of either of the ships is the same as the ESD used the second approach, as is depicted in Figure 3. The node NO. and related details are listed in Table 1. Another problem of modeling both sides at the same time is the structural redundancy and increased computational complexity of the entire HCL model. However, there are also several problems if the ESD is construction from the perspective of only one ship. For instance, the unbalanced perspectives during analysis, how to select the main perspective, how to design the status and behavior of another ship, etc.
Although the modeling approach of single subject is different from the traditional concept of ship collision accident analysis based on data and consequence, it is more compatible with the actual development of accidents. First of all, all actions done by the ships involved are modeled from their point of view. Only when communicating with the target ship (TS) can the TS affect the own ship (OS). Secondly, the decision of the OS always tends to trust the information obtained by themselves, although this information may be limited or even false. Only when the OS fails the recognition and confirmation of risks and does not have enough opportunities to avoid collision normally, will it rely on TS to take action to avoid collision or access the emergency procedures directly. Therefore, the modeling approach from a single subject point of view can replicate more realistic ship collision accident activities such as distributed decision-making and limited information acquisition. It can also highlight the OS’s position in ship collision accidents and facilitate a more efficient quantification analysis.
It is an important issue to decide which ship to be the OS in a single subject ESD modeling. In these scenarios, the logical sequence of accident development (i.e., the structure of ESD), the functional decomposition of systems (i.e., the structure of FTs), and the interdependence between the causal factors (i.e., the structure of BNs) are the same for both ships involved. Moreover, all the parameters of these models come from case report analysis, empirical data, and previous studies.

4. HCL Model for Ship Collision Risk Analyses of the Conventional Scenario

4.1. ESD Constructions of Ship Collision Scenario

In this section, the ship collision accident is modeled using the HCL methodology. The initiating event occurs when the closest point of approach (CPA) is less than a predefined minimum safe distance and time (i.e., CPA alarm). The accident case focuses on the initiating event ‘CPA alarm,’ which is a start state for the ship collision risk [38].
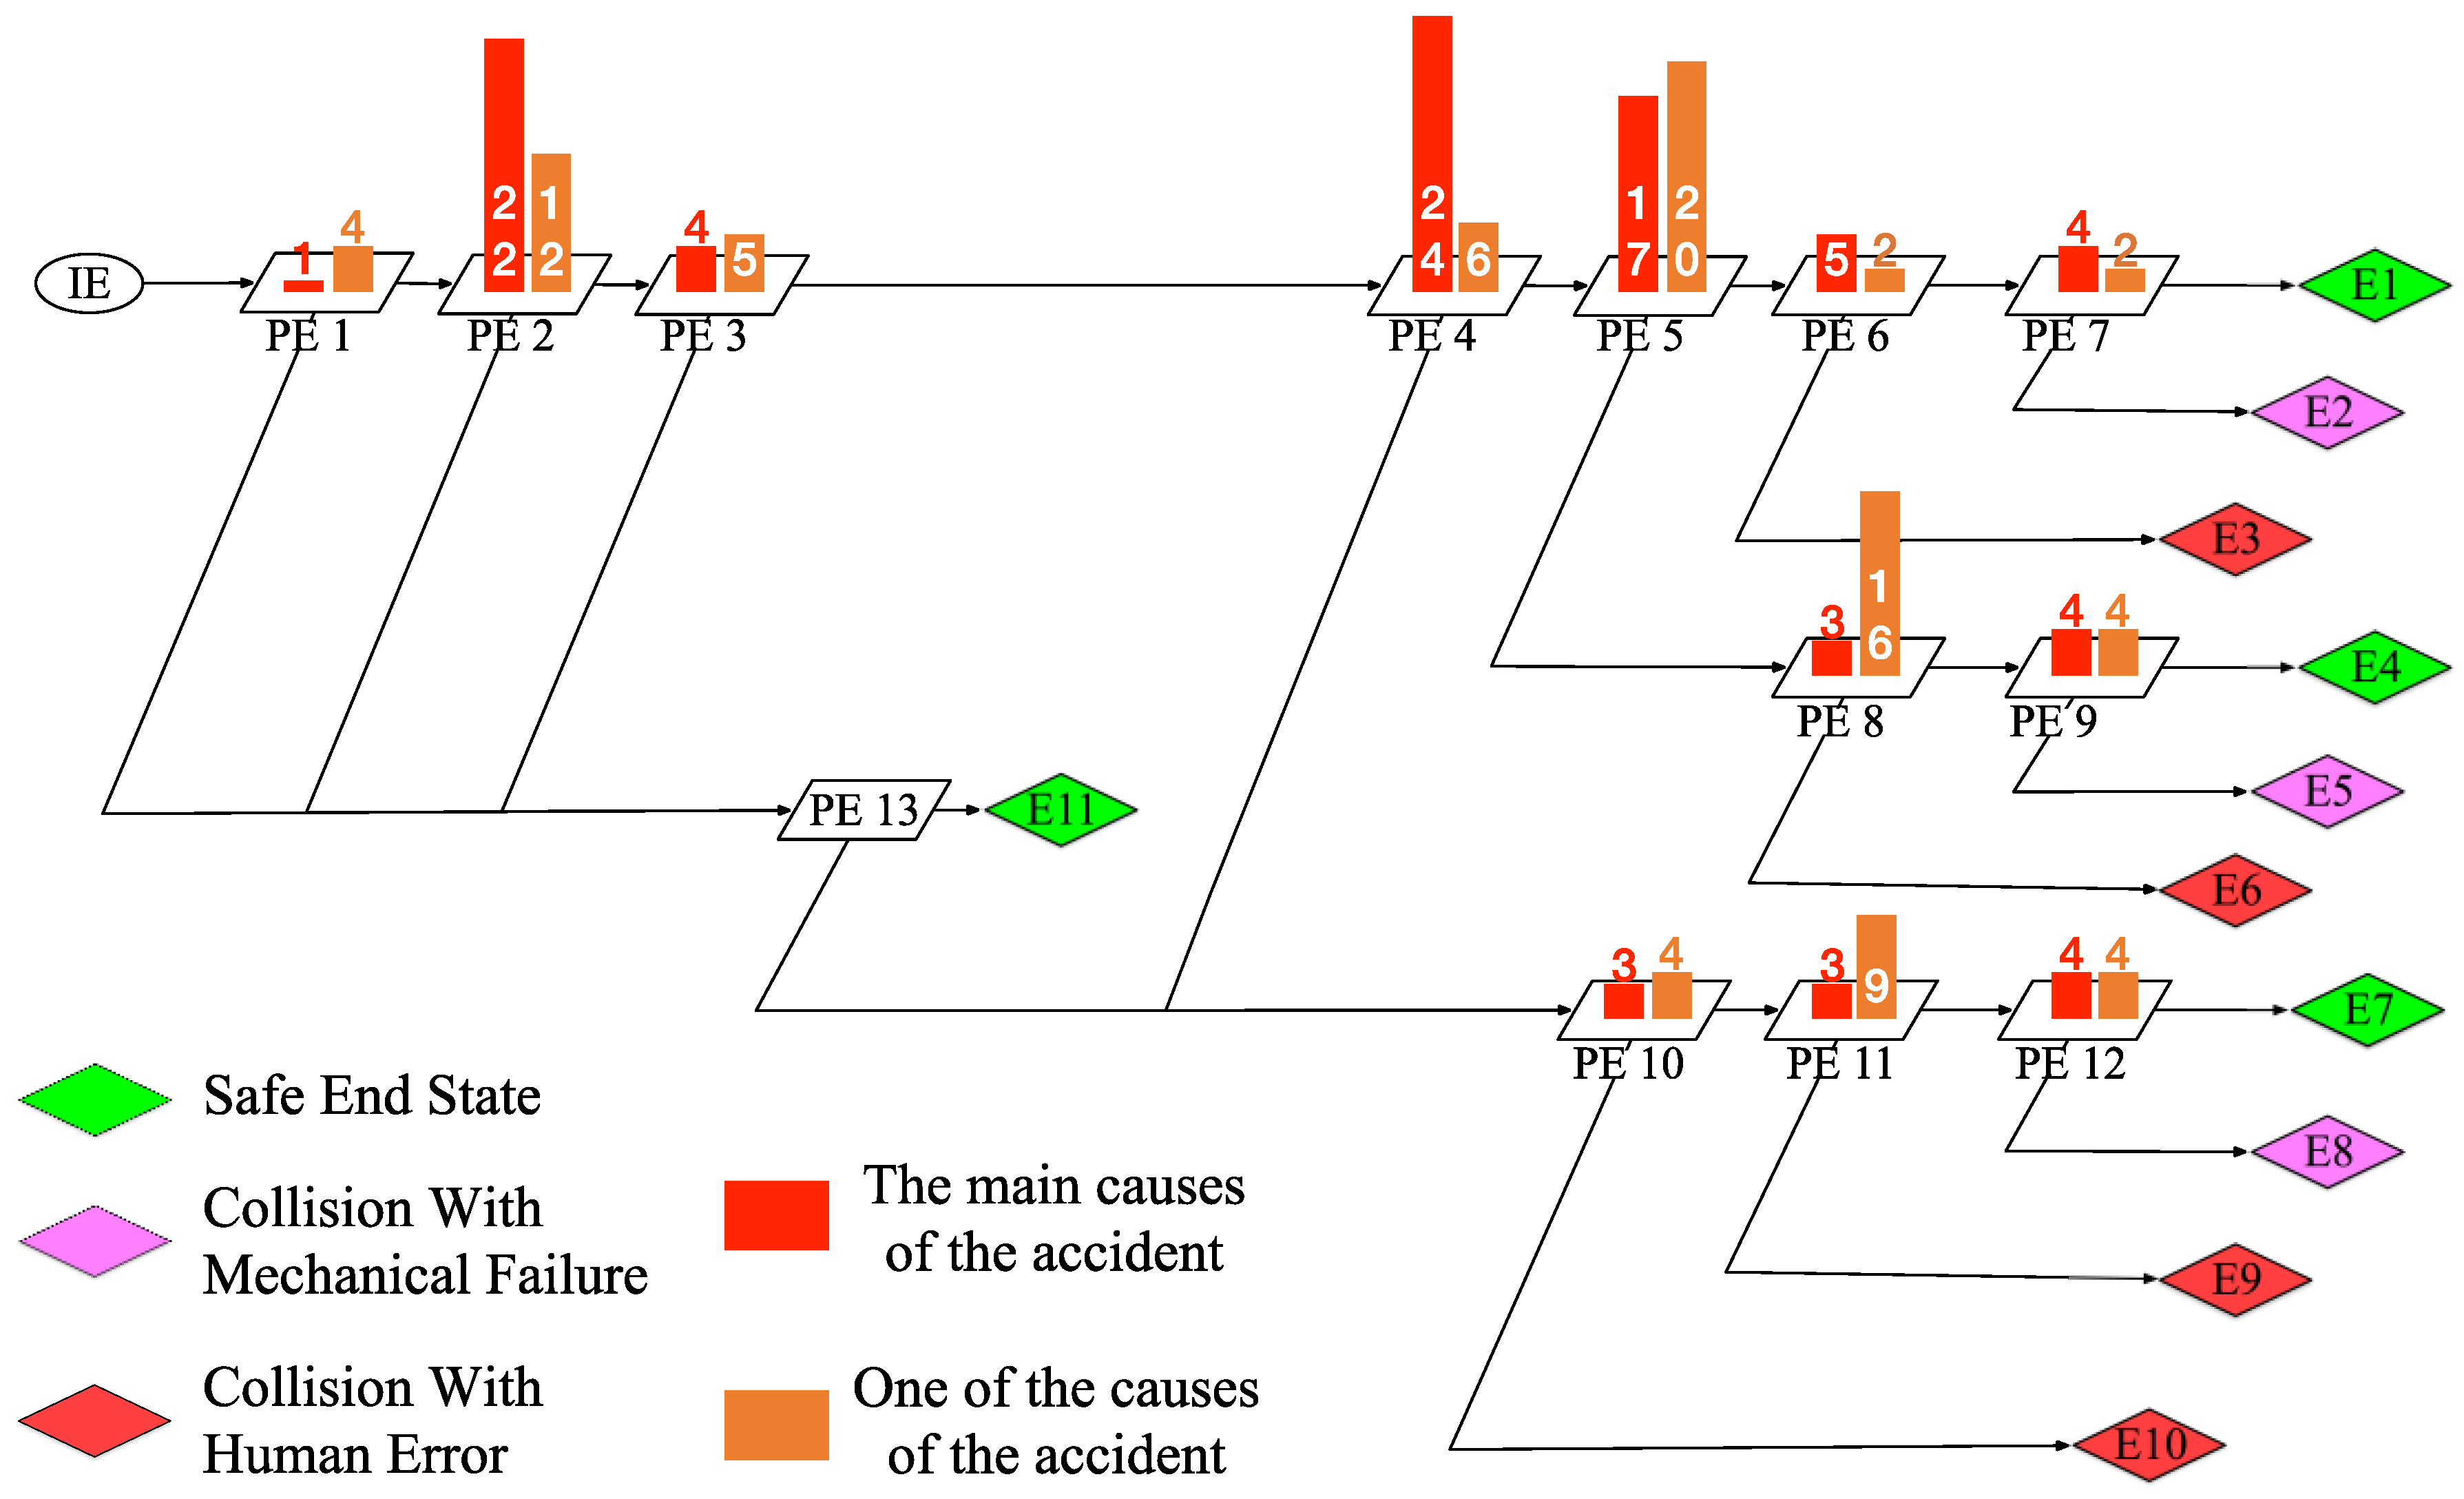
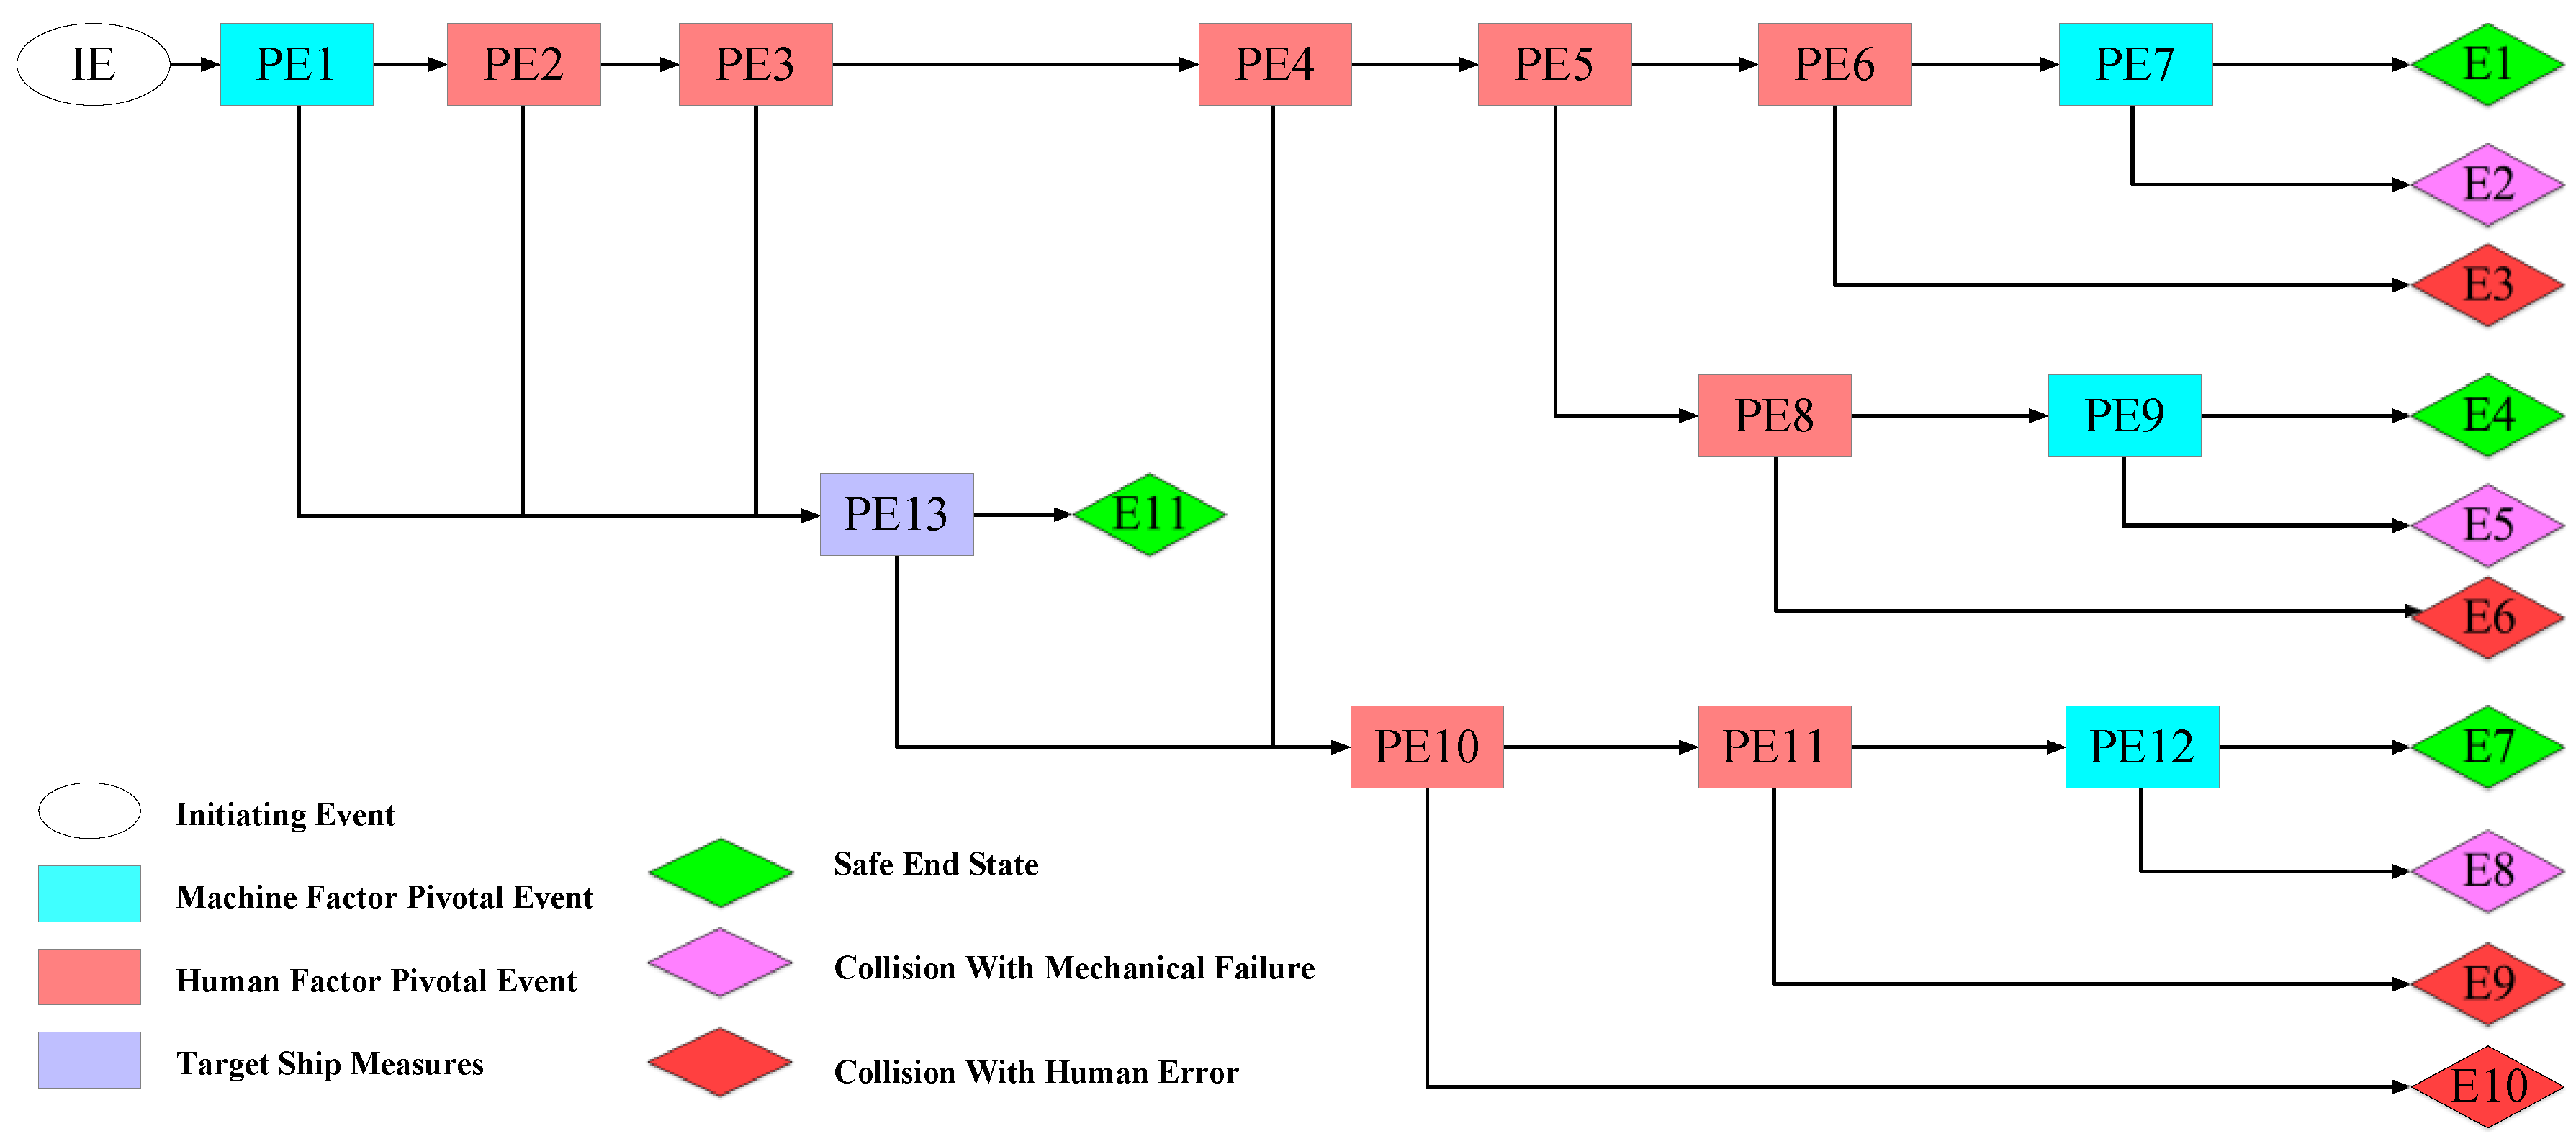
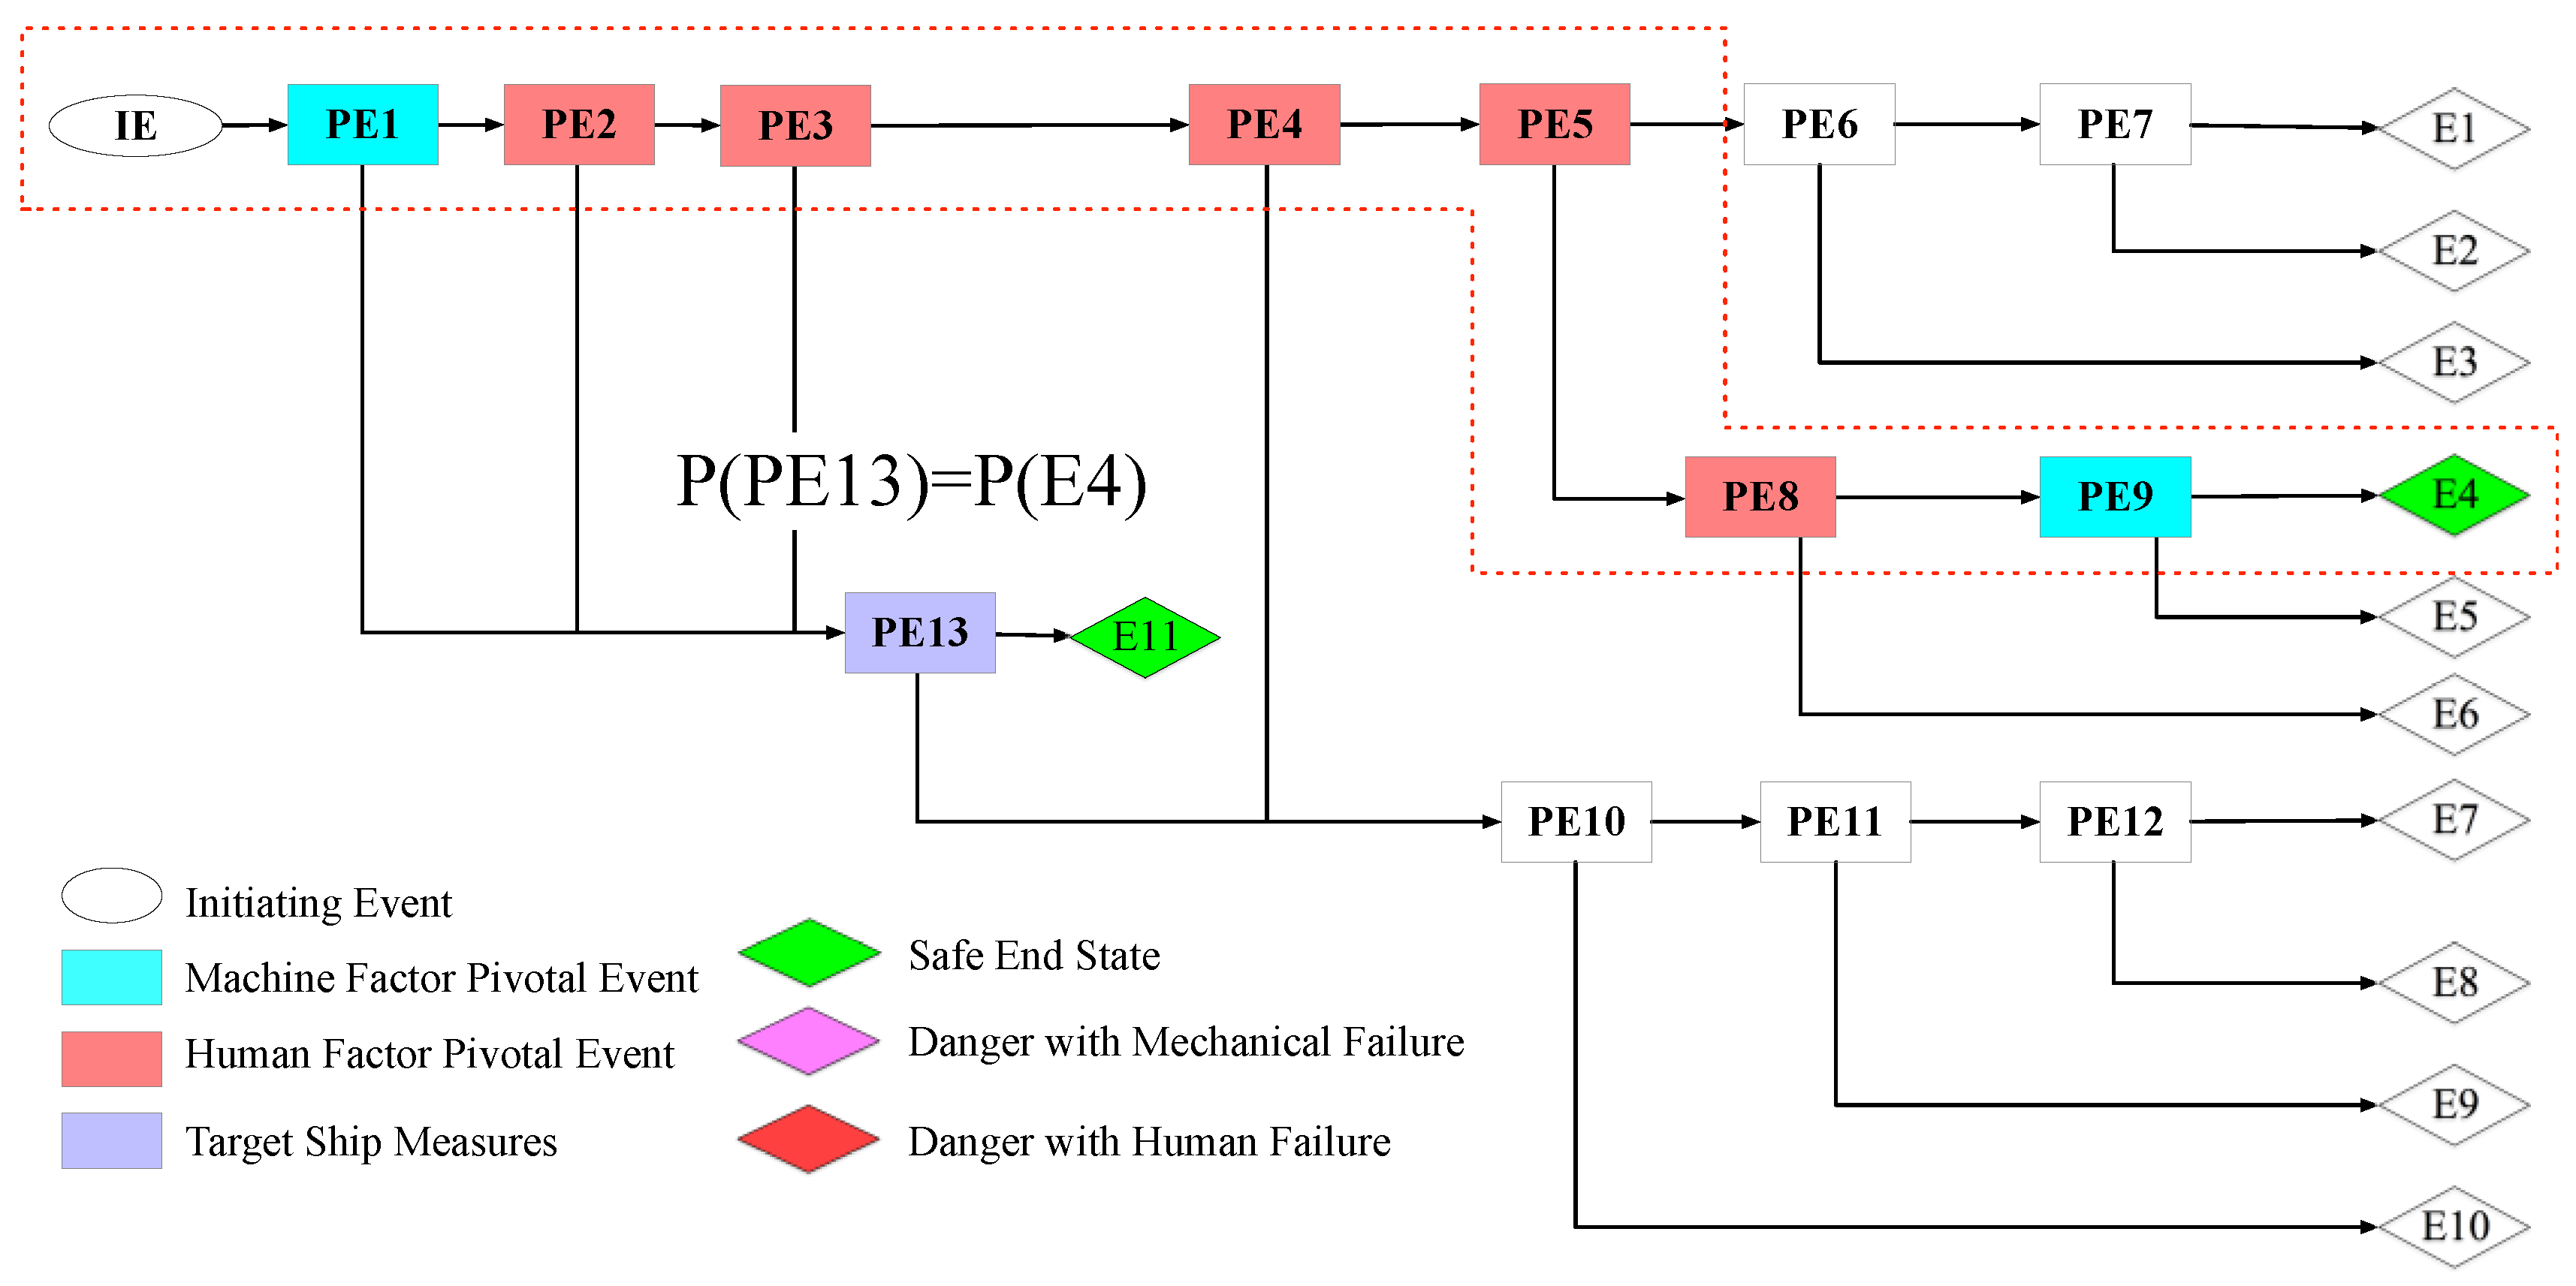
After a detailed analysis of the accidents in Section 3.1, the general logical events sequence of ship collision accidents can be concluded in Figure 4, where the red squares indicate that the events are the main causes of the accidents, and the orange squares indicate that the events are one of the causes of the accidents. The ESD in Figure 5 illustrates the following event sequences caused by the initiating event, which is a graphical representation for all the possible accident scenarios.
The events and related details are listed in Table 1. The whole ESD can be divided into three main parts: the collision risk identification and confirmation, OS’s decision-making and communication with the TS, and OS’s response action under different conditions. There are eleven end states following the various response actions and systems performance. The next few paragraphs present and discuss how to make an HCL model step by step, following the five steps given in Section 2.3.
In the first step the ESD is constructed by defining the RIFs and causal relationships. There are three main logic paths in the ESD after the collision risk identification (PE 1\2\3):
(1)
The scenarios with successful communication with TS: This will lead to a collaborative effort between both sides for avoiding a collision (PE 4\5\6\7, End 1\2\3);
(2)
The scenarios with failed communication with TS: This will lead to a unilateral effort of collision avoidance (PE 4\8\9, End 4\5\6);
(3)
The scenarios under emergency conditions: Since it is under emergency conditions, both ships do not have time to communicate with each other and only take recovery measures based on their assessment alone (PE 10\11\12, End 7\8\9\10).
The PE 13 is more different than the other events. As discussed in Section 3.2, a single point of view modeling approach is adopted in this paper and the PE 13 is the embodiment of this idea. During the process of identifying and reacting to a collision course, all crews of both involved ships tend to rely on their own perceived context to make decisions. Only when they do not recognize the risk can they rely on TS’s correct perception and decision-making. In this case, the two ships can be regarded as trying to avoid a collision independently, just like the scenarios with failed communication with TS (PE 4\8\9, End 4). For this reason, the probability of PE 13 is set to be equal to the probability of End State 4, as is depicted in Figure 6.

4.2. FTs Modeling of the Conventional Scenario

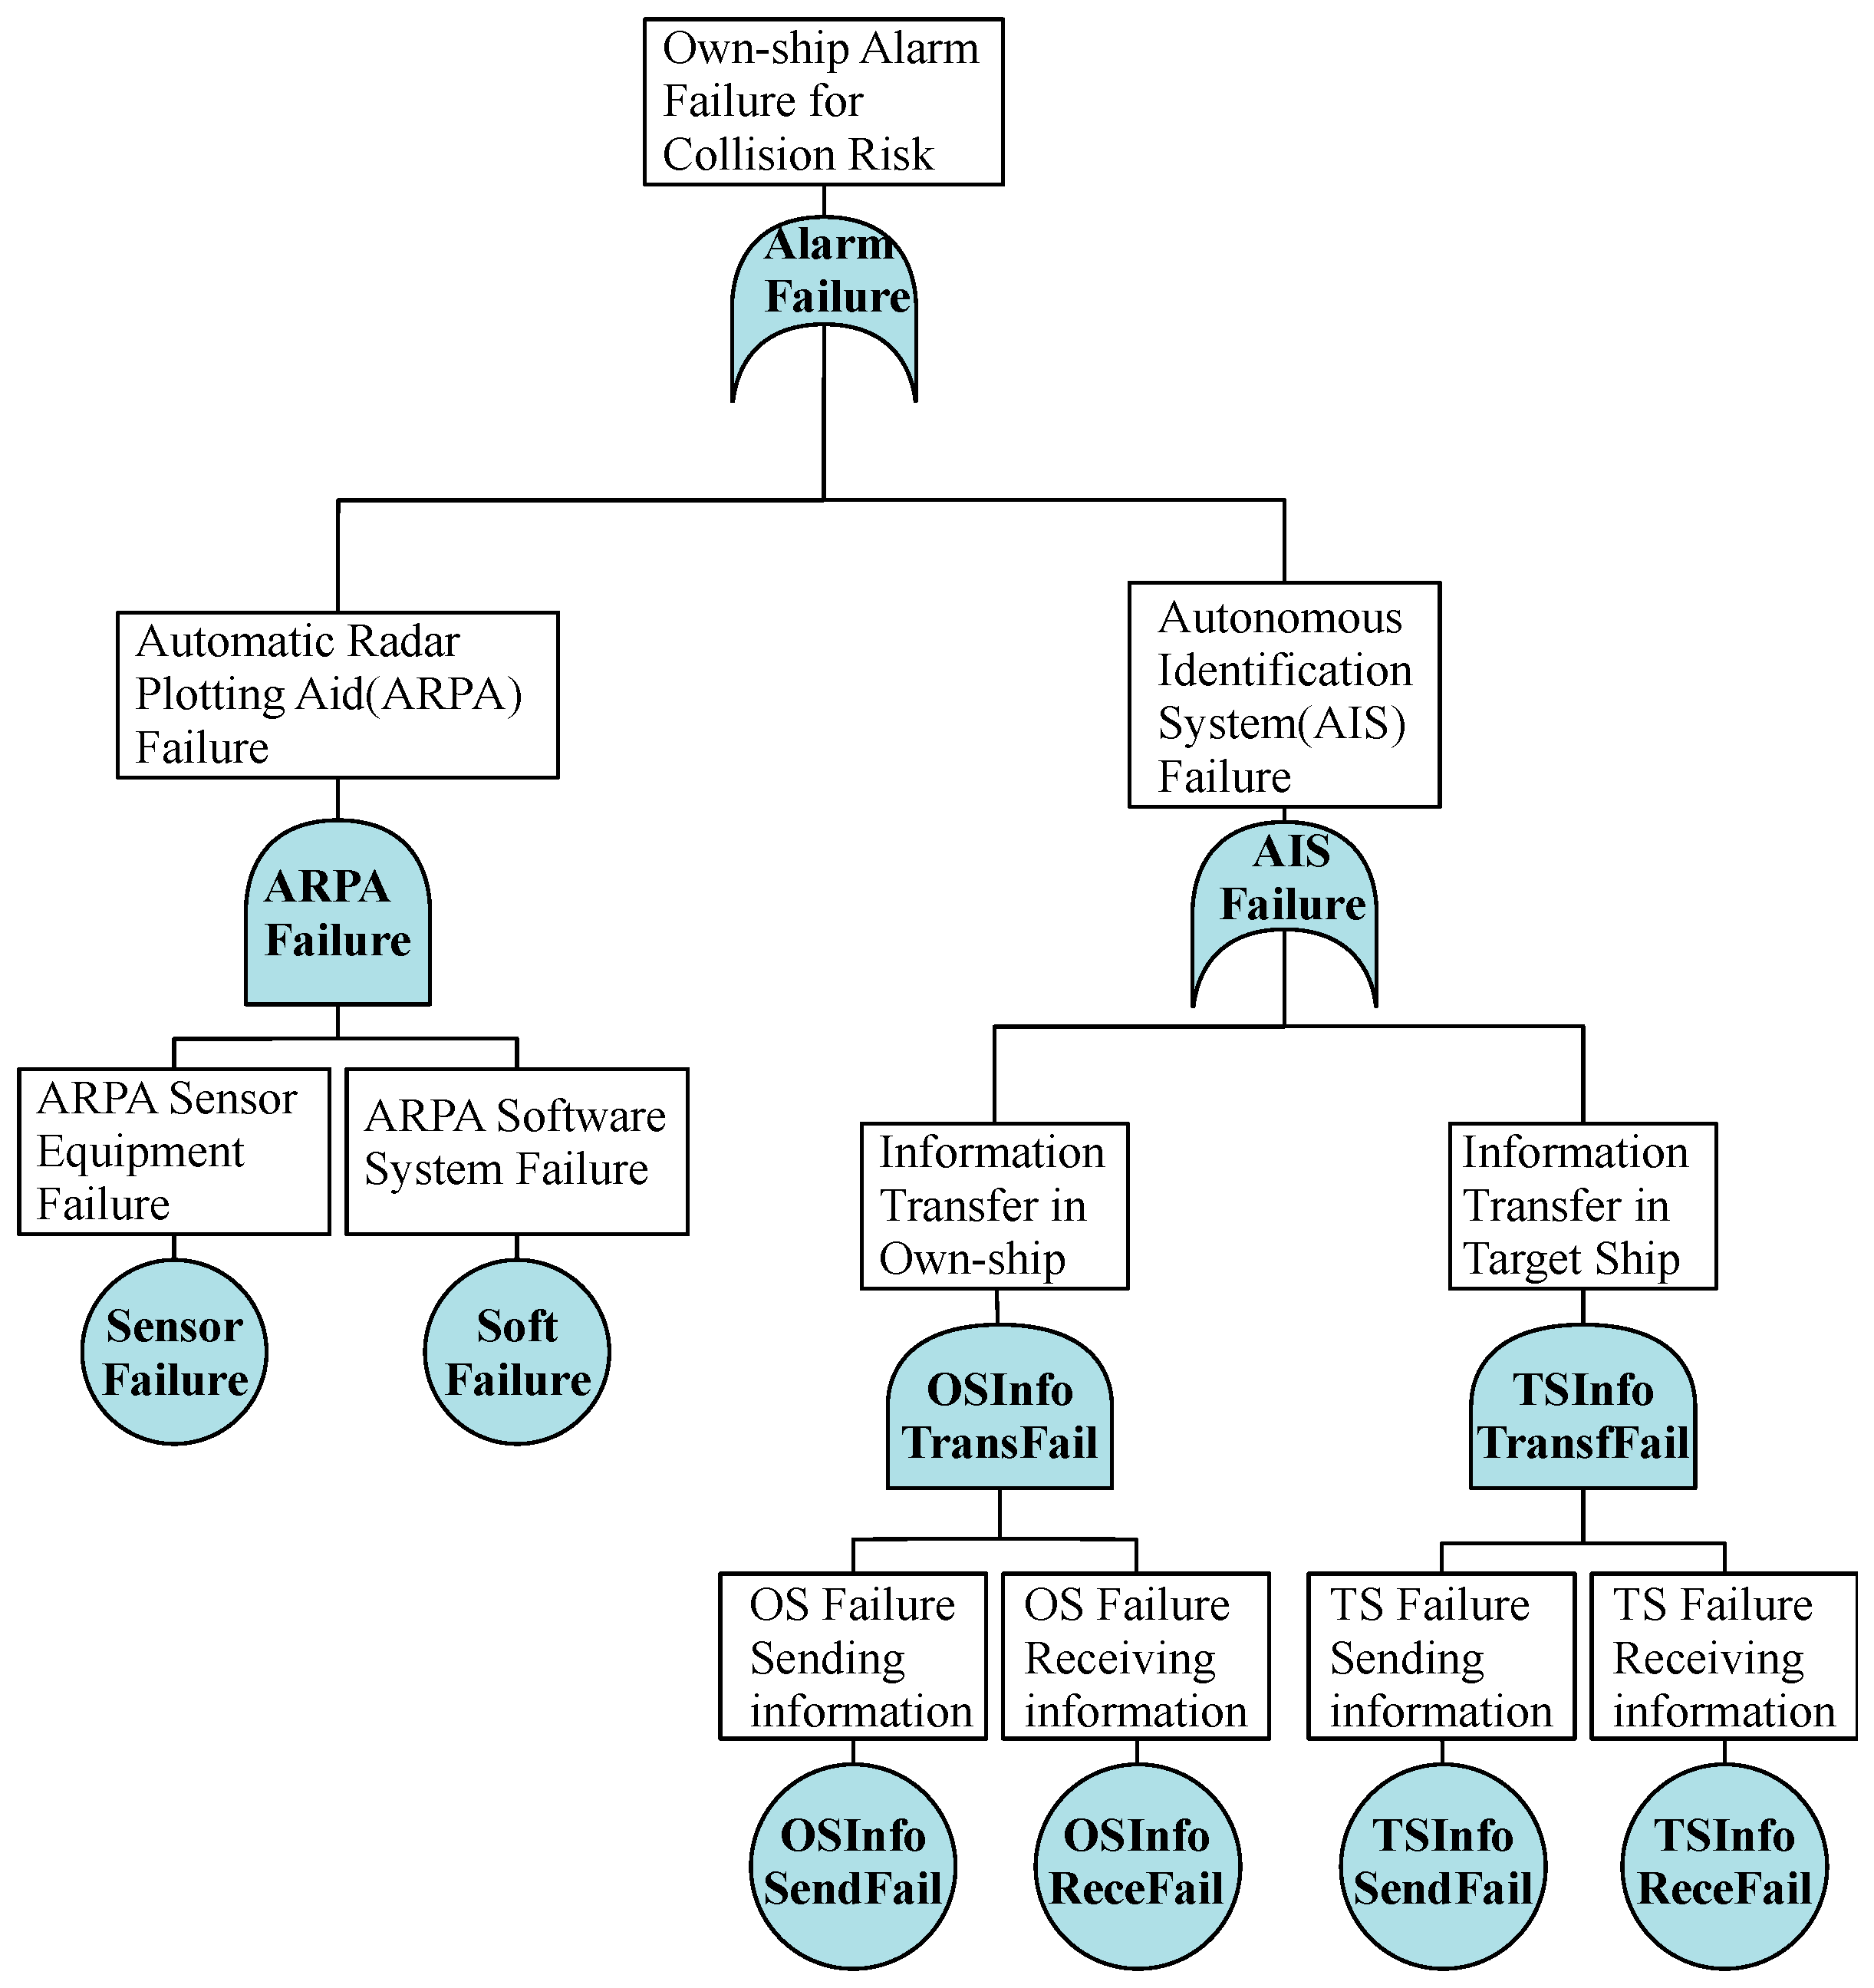
In the second step, the hardware related PEs (PE 1\7\9\12) of the ESD are further modeled by performing a functional decomposition and, subsequently, constructing FTs. These events are OS collision alarm (PE 1), OS propulsion and steering (PE 7), OS propulsion and steering with failed TS communication (PE 9), and OS propulsion and steering for emergency (PE 12). As the conventional ship navigation system is mainly constructed by Automatic Radar Plotting Aid (ARPA) and Automatic Identification System (AIS), the PE1 (OS Collision Alarm) is further modeled by the FT of alarm failure, which is shown in Figure 7.
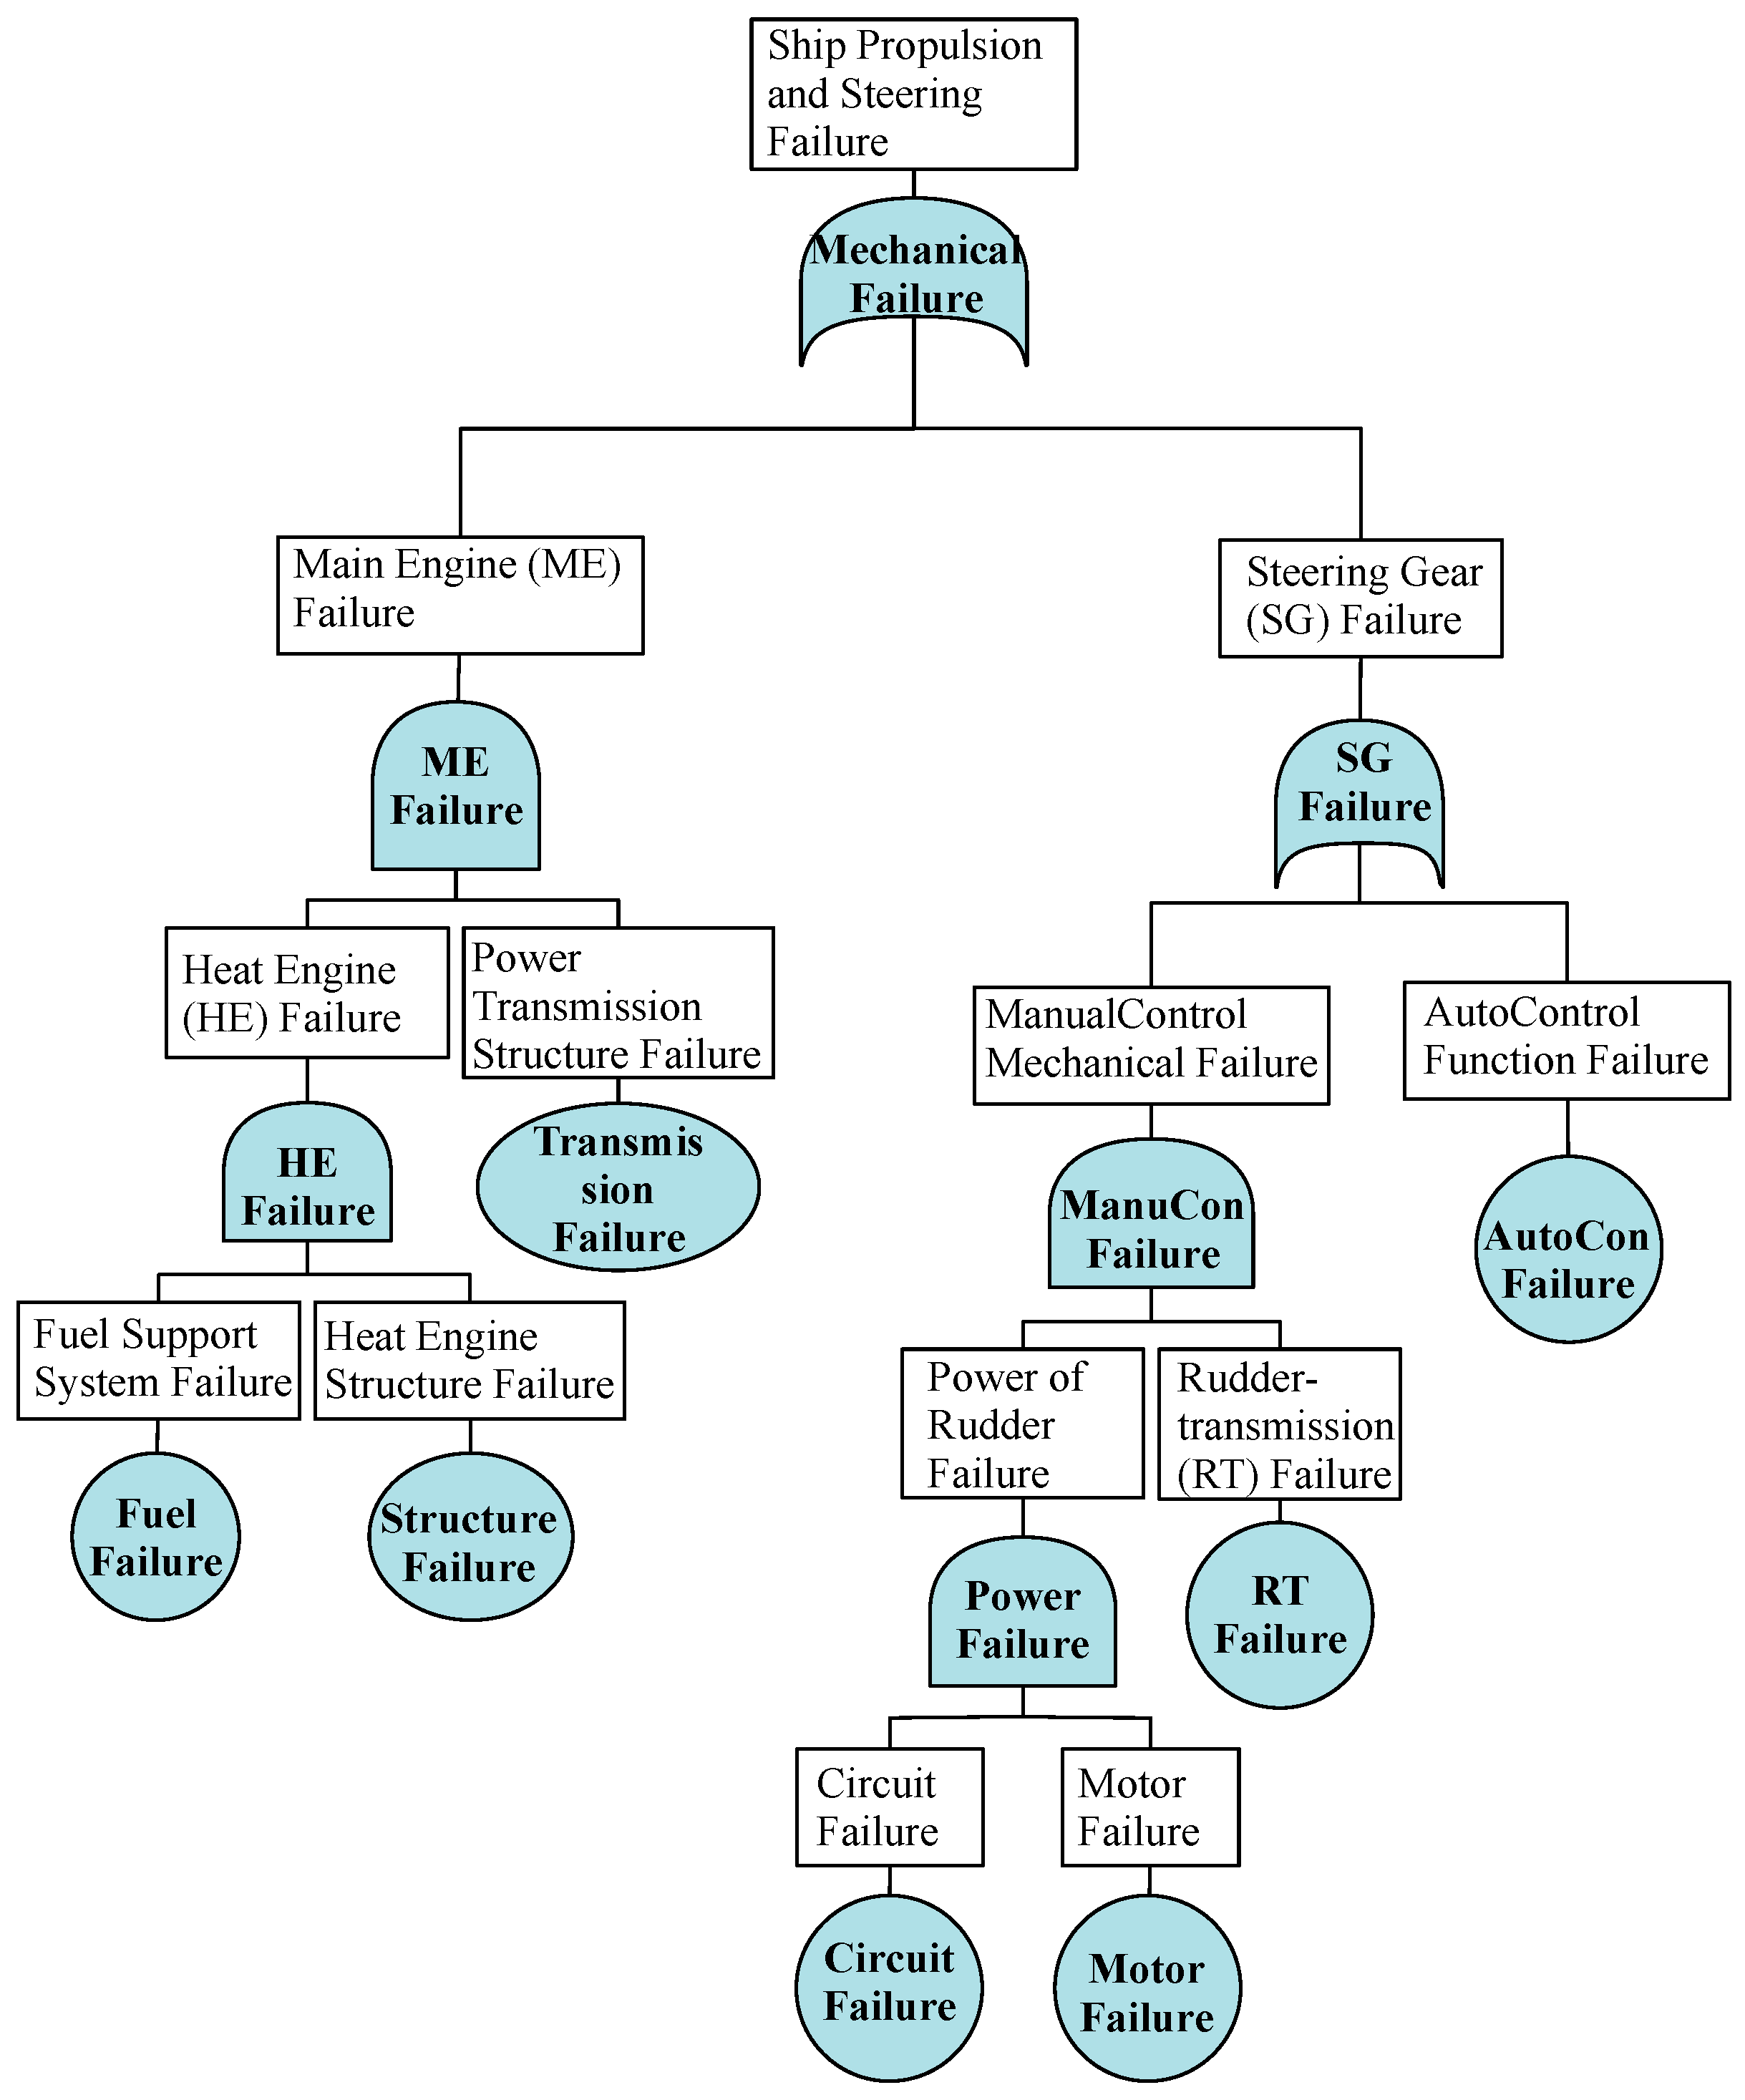
PE 7, PE 9, and PE 12 of the ESD model are linked with the FT model of mechanical failure, which describes the mechanical failure of ship’s high-level manoeuvre performance of conventional ships. According to the accident reports reviewed, the PE of OS propulsion and steering is mainly determined by the main engine and steering gear performance as shown in Figure 8. The FT model of mechanical failure will be used in all three scenarios of with successful communication with TS, with failed communication with TS and under emergency conditions. However, due to the different handling preferences of ships under different conditions, the mechanical reliability also show different states. For example, the state of the ship in the condition of emergency collision avoidance is very different from that in daily collision avoidance operation. In an emergency, the operating range is significantly larger, and the requirements for the mechanical reliability of the ship are also higher. The FTs linked with PE 7, PE 9, and PE 12 share the same FT model structure, but the probability values of basic events are different.

4.3. BNs Modeling of the Conventional Scenario

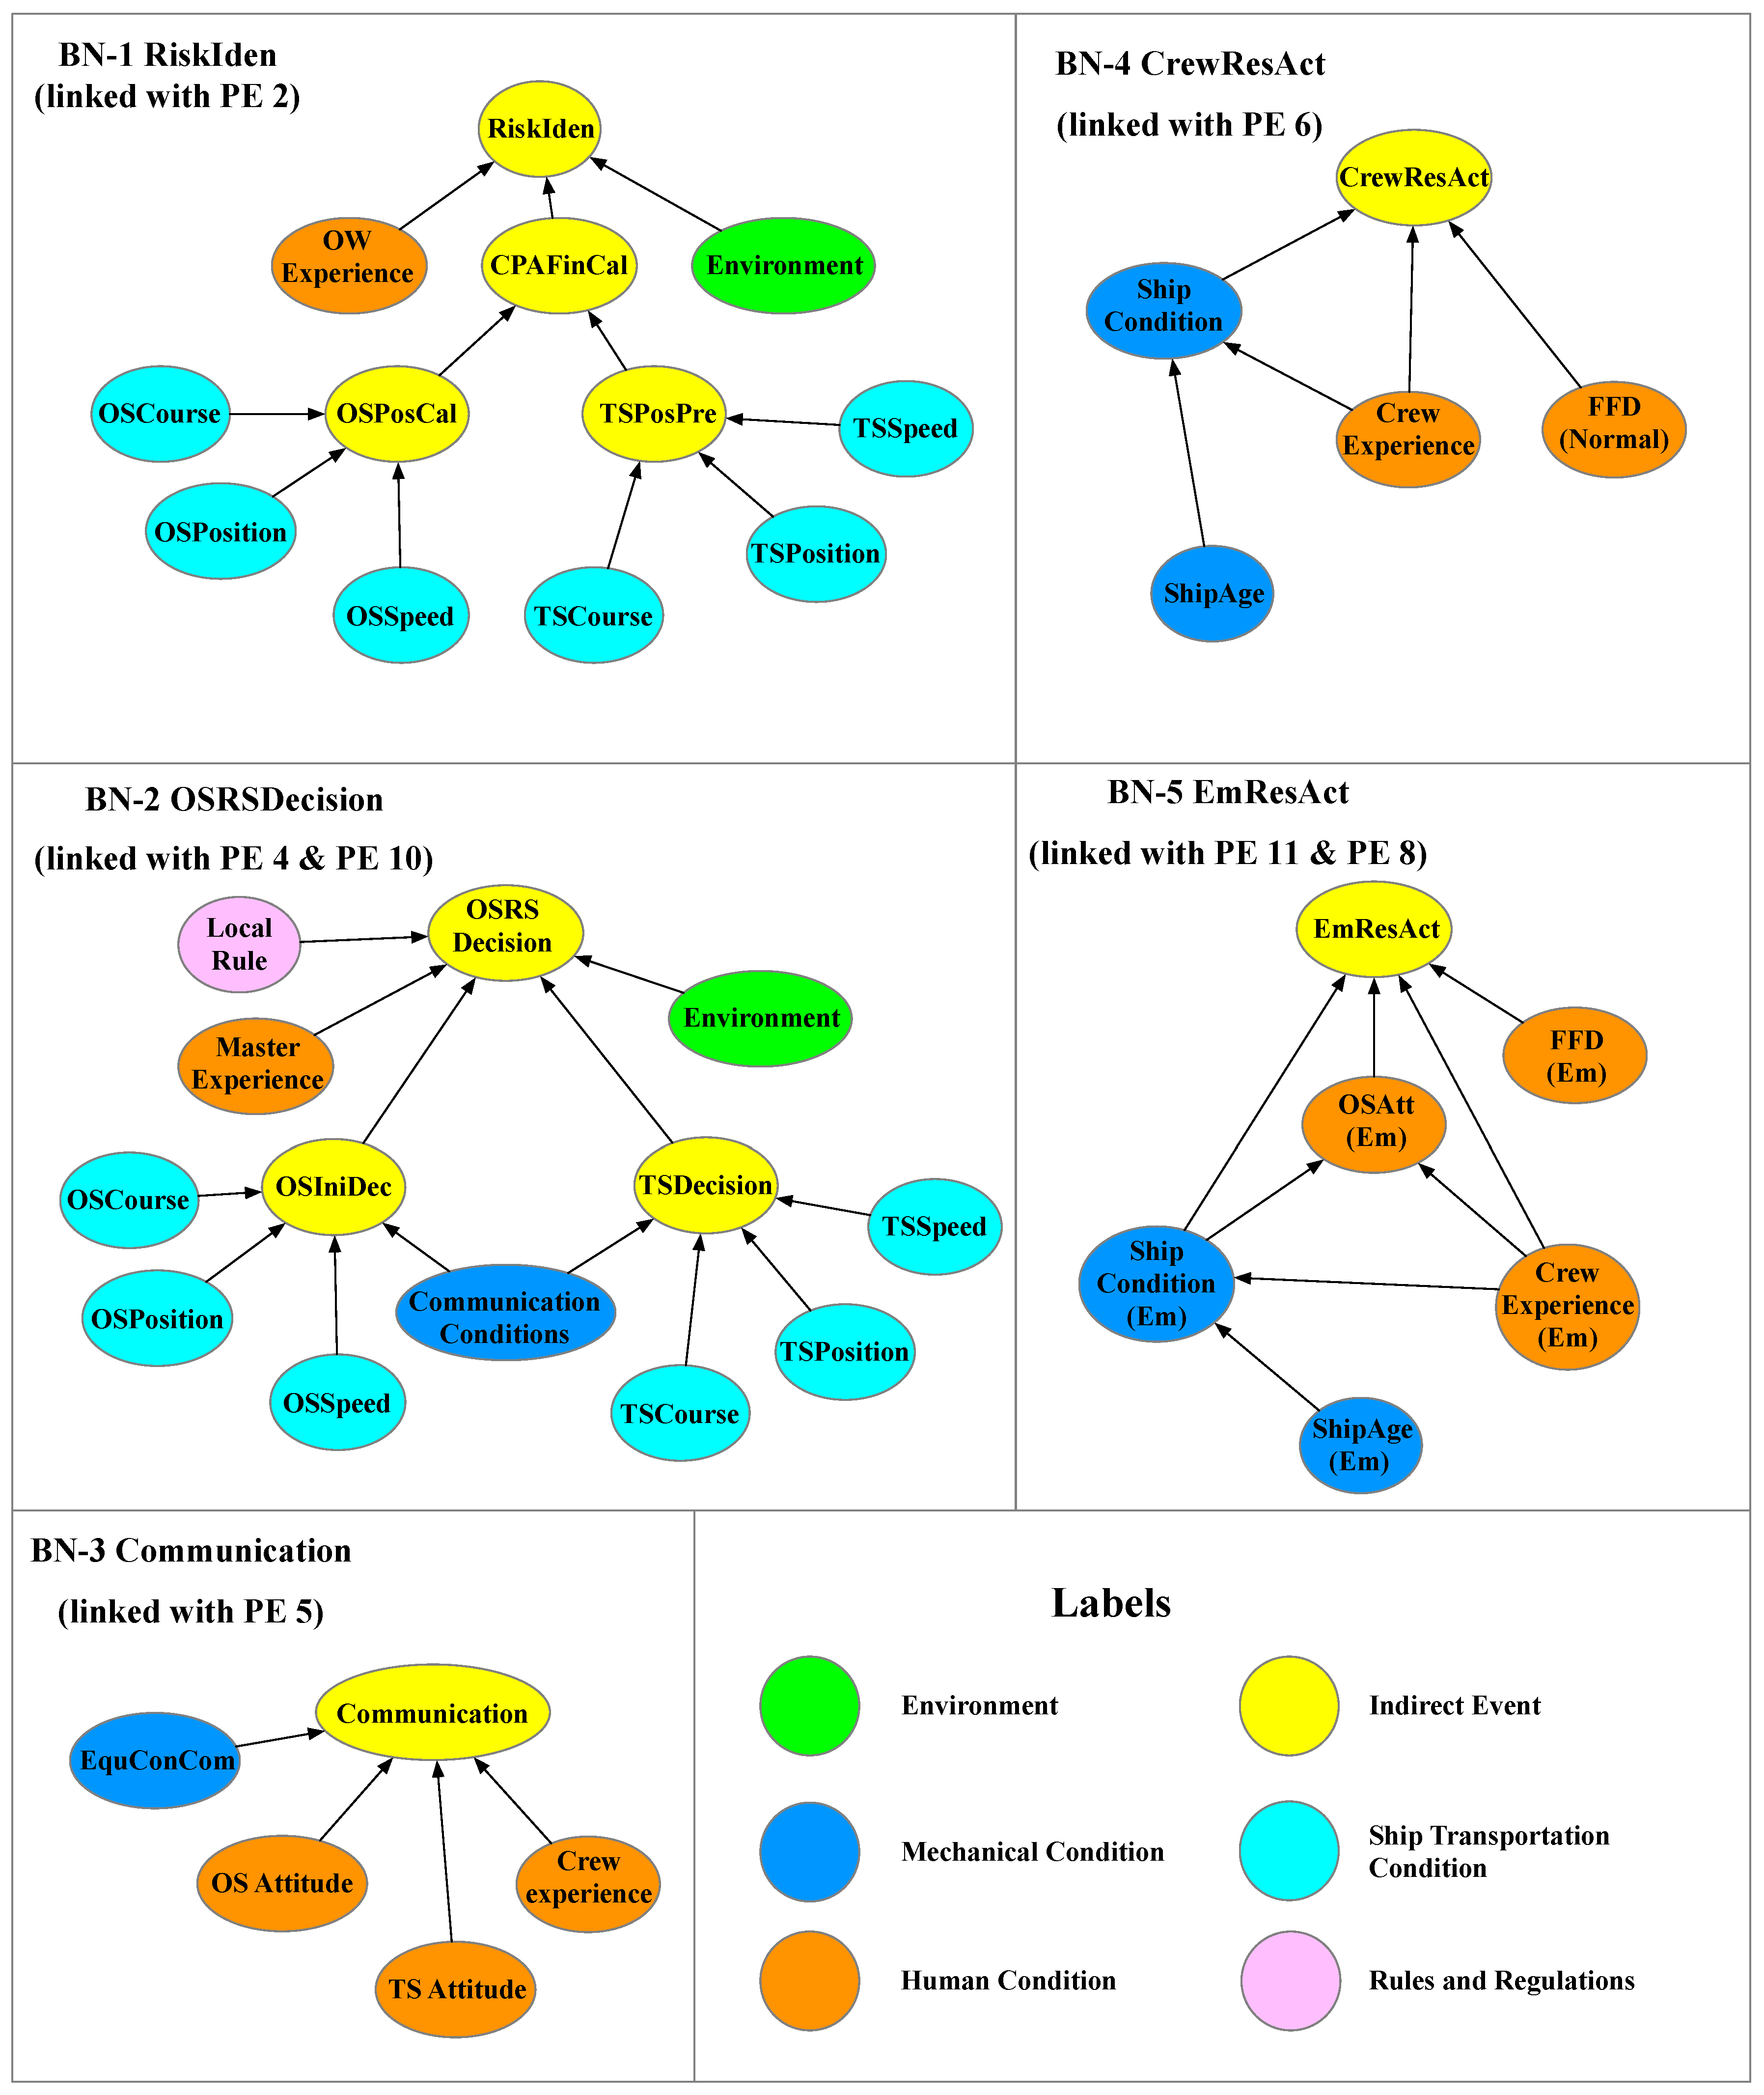
In the third step, all the human factor related events, including risk identification, communication, decision, and response action in ESD (PE 2\4\5\6\8\10\11) are further modeled using BNs. The BN method is applied to quantitatively analyze the influencing factors of human-related PEs. In this paper, for each PE that requires BN modeling analysis, the established BN model consists of one PE node and several influencing factor nodes. The PE node is the analysis object, and the result of BN analysis is directly transmitted to ESD for calculating the probability of end state. The influencing factor nodes are the factors that affect the analysis object in the performance of ship collision avoidance, including environmental factors, operator state factors, safety culture factors, and so on. The interaction between these factors and PE is very complex and involves much uncertainty. It is not possible and appropriative to use FT to model and analyze, while BN modeling is suitable in this situation. For example, human error events, such as fitness for duty (FFD) of office on watch (OOW) and the experience of OOW, are among the most important contributors to a collision accident.
Figure 9 illustrates all the BN structures, which are linked with PEs of the ESD model. Only factors that affect the PE node are analysis in this BN, and the standard of the level setting of each node is based on the degrees of impact, which are listed in Table 2. For instance, the environmental factors (blue nodes) can include wind, wave, current, weather, and sunshine conditions at the site, but these factors can be unified into the impact on PE node, which is advantage or disadvantage to the identification of risks. Therefore, when building the BN, the environment is taken as a separate node, and the level is set to be advantage and disadvantage. Besides the environment, the current states of both encountered ships also have a similar way of the influence on the risk identification, so the level settings of these nodes (cyanic nodes) are also advantageous and disadvantageous. In ship collision avoidance practice, CPA is the main method to identify the collision risk. Accurate estimation of CPA is necessary to successful risk identification, and the estimation of CPA is contributed by the estimation of states of both ships. All the estimations are based on the state of officers on duty include pressure, mental condition, and fatigue. The level setting of all these kinds of nodes is effective and noneffective.
It should be noted that PE 4 and PE 10 model the decision-making process of collision avoidance under different conditions (daily condition and emergency condition), so they share the same BN structure and CPT level settings. However, due to the different conditions, the specific values of the probability distribution of the CPTs are different. The BN-5 linked with PE 11 and PE 8 is built in the same way.

4.4. Model Assignment of the HCL Model

The fourth step is to assign the event probabilities in the ESD and FTs, and the CPTs of BNs. All the values of these ESD pivotal events, FT basic events, or RIFs were defined based on historical data, associated literature, and expert judgement. The data came from the handbook of offshore reliability industry [39,40], as well as the international collision accident reports. Completing the CPTs of BNs is much more challenging than the probability of ESD and FTs. Uncertainties, assumptions, qualitative, and quantitative analysis methods are usually employed to model these RIFs reasonably well [18]. In this paper, 50 ship collision accidents are chosen from more than 100 ship collision accident investigation reports. The CPTs are developed using the historical data by using the collected statistical data and expert judgment by IF-THEN rules [38]. Some similar PEs are modeled with the same FT or BN structure, but the setting of probability value varies according to different situations.
As this is the first application of the HCL methodology to ship collision accidents, the details of the model are expected to be improved in a further study that will include the full range of uncertainties as well.

5. Results of Risk Analysis of Ship Collision Accident Scenarios

The three main end state types of ship collision avoidance scenario have been quantified using Trilith. The probability values and percentage of all the end state events are listed in Table 3, and the fractions of the three-different end state types (i.e., safe, collision, collision due to mechanical failure, and collision due to human error) to the sum of all ends states are listed at the end of Table 3.
The several conclusions can be drawn from Table 3:
(1)
All the results are based on the probability of Initial Event (IE). The value is preset as Pr(IE) = 1 in Table 3 to show the probability of safe and collision in an easier way. This result shows that, given the probability of a dangerous encounter situation, the probability of safety is 0.3926 and the probability of a collision accident is 0.6073. Among it, the probability of accidents due to human error accounts for 94.27% of the total accident probability, and the probability of accidents due to mechanical failure is 5.73%.
(2)
The value of Pr(IE) comes from experts’ opinion, which means that in daily navigation, about Pr(IE) of the conflicts may lead to more urgent situations. In academically accepted data [41,42,43], the causation probability of different types of collision accidents is different, for instance, the causation probability of overtaking and head-on are 4.90 × 10⁻⁵, while the probability of crossing is 1.30 × 10⁻⁴.
(3)
The collision accidents due to human factors are accounted for 94.27% of the total in the ship collision scenario. Considering that the industry consensus is that 75–96% of marine accidents are human factor related [44,45], this result is reasonable. Compared with other situations, mechanical failure is more unlikely. Therefore, the improvement of ship collision safety by enhancing human reliability will be more effective than the improvement of mechanical system reliability.
In order to further verify the accuracy of the analysis results, the historical data of the Singapore Strait from 1997 to 2002 is selected to estimate the collision frequency in this region. The results of the analysis are shown in Table 4. In Table 4, the causation probabilities, which refer to the probability that collision avoidance measures need to be taken in the conflict scenario, are obtained from existing studies ([32,33,34]). The number of conflicts is the frequency count of two ships forming a specific encounter situation. The monthly conflict scenario frequency comes from statistical data [46], and the annual conflict scenario is calculated from monthly data. The causation probability and the frequency of annual conflicts constitute the value of initial events of the proposed HCL model. Then, the frequency of the accident is obtained by multiplying the probability of collision in Table 3 by the frequency of the initial event.
According to Table 4, during the year 1997 to 2002, the average number of conflicts of different types of collision accidents is assessed. The estimated collision frequency is 1.11 per year, while the frequency based on historical data is 1.80 per year. In a targeted study [46], this estimated data is more accurate than the method proposed in this article. However, the method proposed in [46] is based on a detailed historical data study of the area in the Singapore Strait with different encounter types. Considering that the HCL model proposed in this paper does not make further adjustments for different ship encounter situations, this result is acceptable.
In previous studies, the frequency estimation of maritime accidents is generally made based on based on historical data [47] or other quantitative risk assessment methods [48] for a certain region. These methods can estimate the data accurately, but they cannot be used to mine the logic and deep mechanism of accident development. In addition, Bayesian method is widely used in qualitative and quantitative analysis of uncertain factors [18] and has achieved good results. However, the BN method can only statically analyze the influence of a certain factor on the accident result from the system state level. It is impossible to analyze the basic events and related factors in the development process from the perspective of accident evolution. It is also impossible to distinguish the modeling of mechanical reliability failure events from the analysis of uncertain factors.
The HCL method focuses on the evolutionary order of events and lists various scenarios that may occur. Based on the modeling of event sequence, analysts can easily use the risk analysis model to further analyze the event. This kind of analysis is vertical in the sense that it can directly study the influence of the reliability change of a node in BN or FT on the whole event.

6. Conclusions

This article is an attempt to remove some of the limitations of current approaches and address some of the deficiencies of risk assessment to current ship collision risk assessment by using HCL method. The qualitative and quantitative analysis is presented based on 50 ship collision accident investigation reports. The unique three-layer framework of the hybrid causal logic (HCL) methodology allows different modeling technologies to take advantage of their respective strengths to analyze different aspects of the system. A complete set of hybrid structures goes beyond the typical PRA approach and allows the inclusion of uncertainties introduced by the human and organizational aspects of the system. The HCL method effectively enhances the ability of risk analysts to establish non-deterministic relationships between uncertain elements (e.g., human or organization) into the PRA. For hardware elements (e.g., machine reliability), the ESD and FT models are retained for modeling system-level and event-level elements separately. By taking advantage of the multi-level modeling capabilities of the HCL methodology, the modeling of ship collision scenarios can be carried out at a deep logical level. At the same time, it is possible to combine the detailed analysis of various primary events with a comprehensive analysis at the system level. This enables the comparative study of different ship collision scenarios. Because no matter what type of ship is assessed, a similar high-level logical sequence can be constructed for collision avoidance scenarios, while the system characteristics are captured in the low-level layers. Besides the convenience of modeling, the HCL method provides a series of qualitative and quantitative calculation and analysis methods, which also enabled this research.
The successful application of the HCL method requires the analyst to have a good understanding of the sequence of the events, during the course of a potential collision situation and the contributing courses, including equipment failure and human error. Since this is the first attempt to apply the HCL methodology to maritime safety, the quantitative results obtained are only best estimate. In future work, the various sources of uncertainty will be identified, and the models will be assessed to obtain numerical results that include the uncertainties.

Author Contributions

Conceptualization, A.M. and X.Y.; methodology, T.W. and M.A.D.; validation, Q.W. and A.M.; writing—original draft preparation, T.W. and M.A.D.; writing—review and editing, A.M., X.Y., and Q.W.; supervision, A.M. and Q.W.; project administration, X.Y.; funding acquisition, X.Y. All authors have read and agreed to the published version of the manuscript.

Funding

This work presented in this paper is cosponsored by Funds for International Cooperation and Exchange of the National Natural Science Foundation of China (Grant No. 51920105014), China National Key Research and Development Plan (Project/Task No. 2018YFC0810400/05). The first author of this paper is supported by the China Scholarship Council (CSC) and the Fundamental Research Funds for the Central Universities (Grant No. WHUT2017-YB-035). The financial support is acknowledged. The opinions expressed are those of the authors and should not be construed to represent the views of the project consortia.

Acknowledgments

The presented Hybrid Causal Logic (HCL) model has been developed using the Trilith modeling platform maintained at the B. John Garrick Institute for the Risk Sciences, University of California, Los Angeles.

Conflicts of Interest

The authors declare no conflict of interest.

Appendix A. List of Accidents Analyzed (in Chronological Order)

Case No.Ship1, Type (Main Responsible)Ship2, TypeLocationDateInjuriesProperty Damage (US $)Source of Data
Longitude and Latitude DataDetail
1.FU SHAN HAI, Bulk carrierGDYNIA, Container55°21.0′ N
014°44.6′ E
North of Bornholm in the Baltic Sea2003/5/31, 12:18NoneFU SHAN HAI sankDanish Division for Investigation of Maritime Accidents
2.BERGITTA, TankerMSC EYRA, Tanker55°11.55′ N
011°05.00′ E
Southwest of Agersoe Flak2004/24/10, 22:18None2,000,000The Danish Maritime Accident Investigation Board
3.ATLANTIC, bulk carrier ARNGAST, general cargo vessel54°43.2′ N
010°46.9′ E
DW route east of Langeland, Denmark2005/8/4None Danish Division for Investigation of Maritime Accidents
4.BLUE BIRD, General cargoHAGLAND BONA, General cargo56°30′28 N
10°13′77 E.
Randers Fjord, Denmark2008/12/1None Danish Division for Investigation of Maritime Accidents
5.GOTLAND CAROLINA, Products TankerCONTI HARMONY, Container Vessel 25°25.3′ N
057°21.7′ E
Gulf of Oman2008/19/04, 09:26None2,000,000The Danish Maritime Accident Investigation Board
6.Eagle Otome, oil tankshipDixie Vengeance, towboat 29°51.6′ N
93°56.4′ W
Sabine-Neches Canal, Port of Port Arthur, Texas2010/1/23, 09:35None1,926,000National Transportation Safety Board (USA)
7.NINANITU, Fishing vesselAFRICAN ZEBRA, Bulk carrier56°26.33′ N
11°32.5′ E
Kattegat, Route T2010/6/7, 18:41One fisherman injured2,000,000The Danish Maritime Accident Investigation Board
8.FRANK W, cargoLILLY, trawler 57 43′6 N
010 51′9 E
2011/06/26, 07:38NoneLilly total lossDanish Division for Investigation of Maritime Accidents
9.Elka Apollon, Chemical tankshipMSC Nederland, Containership29°36′44.0″ N
94°57′ 02.7″ W
near the intersection of the Houston and Bayport Ship Channels and Five Mile Cut2011/10/29, 09:05None2,800,000National Transportation Safety Board (USA)
10.ACX Hibiscus, Container shipHyundai Discovery, Container ship01°30.855 N
104°33.475 E
8nm ENE of the start of the Eastern Singapore Strait Traf c Separation Scheme2011/11/12, 07:56None2,000,000Marine Accident Investigation Branch, United Kingdom
11.Alexander Tvardovskiy, Multi-purpose dry cargoUKD Bluefin, Trailing suction hopper dredger and Wilson Hawk, General cargo53°37′55.1″ N
0°11′06.7″ W
Immingham2012/01/08, 13:37None2,000,000Marine Accident Investigation Branch, United Kingdom
12.TIAN FU (TIANJIN), Container ship SENTAIMARU, Chemical tanker34°27′09″ N
133°45′23″ E
In Mizushima Port, Kurashiki City, Okayama Prefecture2012/03/07, 07:15None2,000,000Japan Transport Safety Board
13.MV SPRING BOK, cargo vesselMV GAS ARCTIC, liquid petroleum gas (LPG) tanker50°49.1′ N
00°58.8′ E
6nm south of Dungeness, UK2012/03/24, 10:14None2,000,000 (12,500 L of diesel oil leakage, 5500 L of lubricating oil leakage)Marine Accident Investigation Branch, United Kingdom
14.SPRING GLORY, Bulk carrierJOSEPHINE MÆRSK, Container ship1°25.3′ N
104°29.01′ E
Strait of Singapore, eastern approaches, about 7 nm NE of Horsburgh Lighthouse2012/05/06, 22:34None2,000,000The Danish Maritime Accident Investigation Board
15.FR8 Pride, oil tanker Rowan EXL I, mobile offshore drilling unit (MODU) 27°49.1′ N
097°00.5′ W
Aransas Pass - Port Aransas/Corpus Christi, Texas2012/05/02, 07:18None17,000,000National Transportation Safety Board (USA)
16.KOTA DUTA, Container shipTANYA KARPINSKAYA, Cargo ship 37°58.5′ N
139°13.9′ E
Vicinity of 180° true, 4900 m from Port of Niigata Higashi Ku2012/07/02, 16:22NoneTANYA KARPINSKAYA founderedJapan Transport Safety Board
17.Stena Feronia, RoPax Union Moon, General cargo vessel54°55′ N
5°54′ W
Belfast Lough2012/07/03, 18:58None2,000,000Marine Accident Investigation Branch, United Kingdom
18.Seagate, Geared bulk carrierTimor Stream, Refrigerated-cargo ship with containers on deck20°18.4 N
071°38.9 W
24 nautical miles north of the Dominican Republic2012/10/03, 05:40None2,000,000Marine Accident Investigation Branch, United Kingdom
19.CMA CGM Florida, Container vesselChou Shan, Bulk carrier30°14′23.0″ N
125°50′07.4″ E
140 miles east of Shanghai, East China Sea2013/03/19, 00:33None2,000,000Marine Accident Investigation Branch, United Kingdom
20.TYUMEN-2, Cargo shipOOCL FINLAND, Container ship 54°8.5′ N
009°20.65′ E
Kiel Canal (NOK), km 32.22013/04/14, 07:002 people killed and 3 injured Marine Accident Investigation Branch, United Kingdom
21.American Dynasty, US fishing vessel Winnipeg, Canadian Navy frigate 48°25.9′ N
123°25.8′ W
Esquimalt, British Columbia, Canada2013/4/23, 08176 (minor injuries)500,000National Transportation Safety Board (USA)
22.Cosco Hong Kong, Container ShipZhe Ling Yu Yun 135, Fish Transportation28°10′7 N
122°14′5 E
126° Xia Yu Light 22 nm2013/06/03, 02:1811 deadFish Vessel lostMarine Accident Investigation Branch, United Kingdom
23.JIA HUI, Cargo shipEIFUKU MARU No.18, Cargo ship34°47.46′ N
139°15.53′ E
Approximately 265° true and 5.6 nautical miles from Izu Oshima Lighthouse off the west of Izu Oshima Island, Oshima-machi, Tokyo2013/09/27, 01:22EIFUKU MARU No.18 capsized and all 6 crew members were killed dead, and JIA HUI had damage on the bow but no one was injured or killed dead.Japan Transport Safety Board
24.PUTERI NILAM SATU, LNG tankerSAKURA HARMONY, LPG tanker35°26.0′ N
139°46.2′ E
Off the East of Yokohama District of Keihin Port2013/10/01, 12:19None2,000,000Japan Transport Safety Board
25.Ever Smart, container ship Alexandra 1, oil tanker 25°03′02.4″ N
55°01′32.5″ E
Jebel Ali, United Arab Emirates2013/11/02, 19:42None2,000,000Marine Accident Investigation Branch, United Kingdom
26.Paula C, General cargoDarya Gayatri, Bulk carrier51°22.8586 N
1°18′42.2″ E
south-west lane of the Dover Strait Traffic Separation2013/11/12, 00:27None2,000,000Marine Accident Investigation Branch, United Kingdom
27.Mesabi Miner, a self-unloading bulk carrier Hollyhock, US Coast Guard cutter45°51′ N
085°15′ W
Straits of Mackinac, Michigan2014/01/05None494,145National Transportation Safety Board (USA)
28.Summer Wind, bulk carrier Miss Susan tow 29°21′18.3″ N
94°47′58.1″ W
Houston Ship Channel, Lower Galveston Bay, Texas.2014/03/22, 12:35None1,378,000National Transportation Safety Board (USA)
29.BEAGLE III, Cargo shipPEGASUS PRIME, Container ship 35°05.7′ N
139°43.2′ E
South-east offshore Tsurugizaki, Miura City, Kanagawa Prefecture, Around 143° true, 3.5M from Tsurugisaki Lighthouse2014/08/03, 03:10Seven crews of BEAGLE III died, two are missing, and the ship sank due to a damage hole in side shell plating of the central port-side. A crew of PEGASUS PRIME was injured and the ship bow buckled.Japan Transport Safety Board
30.RIG, General cargoINGE MARIE, Fishing vessel–stern trawler57°26.81′ N
011°27.17′ E
Kattegat, Sweden2014/10/07, 06:071 death (crew on INGER MARIE)2,000,000The Danish Maritime Accident Investigation Board
31.KRASLAVA, Chemical/products tankerATLANTIC LADY, Refrigerated cargo ship 55°32.0′ N
12 °42.5′ E
The Sound, southern part, Denmark2014/11/1, 13:19None The Danish Maritime Accident Investigation Board
32.Star Kvarven, Mixed cargo/bulk/containerLulanyu 61809, Stern trawler34°34.7′ N
122° 04.3′ E
The Yellow Sea2014/11/27, 22:20Lulanyu 61809, fishing vessel sank and entire crew of 8 diedAccident Investigation Board Norway (AIBN)
33.NECKAR HIGHWAY, Vehicle carrierORION, AS 28, Fishing vessel, gillnetter 57°36.804′ N
009°50.871′ E
North Sea, 4 nm northwest of Hirtshals2015/01/07, 23:27NoneORION total lossThe Danish Maritime Accident Investigation Board
34.Chembulk Houston, tanker Monte Alegre, container ship 29°26.2′ N
94°50.2′ W
Houston Ship Channel, Galveston Bay, Houston, Texas.USA2015/3/5None1,727,300National Transportation Safety Board (USA)
35.Conti Peridot, Bulk carrierCarla Maersk, Chemical tanker29°40′38.5″ N
94°58′44.9″ W
Houston Ship Channel near Morgan’s Point, Texas. USA2015/03/09, 12:30None8,200,000National Transportation Safety Board (USA)
36.Tongala, Vehicle carrierBo Spring, General cargo 19° 51.20′ N
119° 56.5′ E
off the coast of the Philippines2015/05/07, 15:35None2,000,000Marine Safety Investigation Unit, Malta
37.SULPHUR GARLAND, Chemical TankerWAKOMARU NO. 2, Oil Tanker 33°58.9′ N
130°52.9′ E
East off Mutureshima Island, Shimonoseki City, Yamaguchi Prefecture2015/07/10, 03:26None2,000,000Japan Transport Safety Board
38.Daroja, general cargo shipErin Wood, oil bunker barge 57°32′34.1″ N
1°36′01.2″ W
4 nautical miles south-east of Peterhead, Scotland2015/08/29, 16:58None Marine Accident Investigation Branch, United Kingdom
39.Dewey R tow, Towing vesselP. B. Shah tow, Towing vessel36°46′05.2″ N
89°06′59.5″ W
Lower Mississippi River, near Columbus, Kentucky. USA2015/09/02, 19:59None1,100,000National Transportation Safety Board (USA)
40.Clipper Quito, VLGC LPG/EthyleneLurongyu 71108, Blue fishing vessel–Stern trawler36° 17.6′ N
122° 53.7′ E
The Yellow Sea2015/10/21, 20:00Lurongyu 71108, fishing vessel sank and 1 crew diedAccident Investigation Board Norway (AIBN)
41.City of Rotterdam, pure car carrierPrimula Seaways, the ro-ro freight ferry 53°35.1 N
000°02.6 E
River Humber, UK2015/12/03, 20:40 None Marine Accident Investigation Branch, United Kingdom
42.William E Strait, Towing vesselMargaret Ann tow, Towing vessel35°07′17.8″ N
90°09′50.1″ W
Lower Mississippi River (LMR), mile marker 727.42015/12/14, 11:22None2,000,000National Transportation Safety Board (USA)
43.Petunia Seaways Peggotty 53°37′45.8″ N
0°08′24.0″ W
River Humber, out Immingham2016/05/19, 04:50NonePeggotty total lossMarine Accident Investigation Branch, United Kingdom
44.Container Ship ESTELLE MAERSK Container Ship JJ SKY 34°38.7′ N
135°16.0′ E
Kobe Chuo Passage, Kobe Section, Hanshin Port2016/07/06, 07:08None2,000,000Japan Transport Safety Board
45.EASTERN PHOENIX, Chemical TankerKEIHIN MARU No. 8, Oil Tanker 35°28.2′ N
139°47.3′ E
Off to the Southeast of Higashi-Ogishima Island, Kawasaki City, Kanagawa Prefecture;2016/07/08, 09:27None2,000,000Japan Transport Safety Board
46.Saga Sky, General cargoStema Barge II, Barge51°05′51.1″ N
1°18′42.2″ E
English Channel, off the Kent Coast2016/11/20, 08:50None Marine Accident Investigation Branch, United Kingdom
47.Sider Capri, General Cargo Grande Anversa, Vehicle Carrier40°01.45′ N
026°11.37′ E
Çanakkale Strait’s Traffic Separation Scheme2016/11/27, 19:06None2,000,000Marine Safety Investigation Unit, Malta
48.Gortynia, Bulk carrierDZ Qingdao, Bulk carrier 1°11.67′ N
103°51.64′ E
Singapore Strait2017/05/17, 00:30None2,000,000Marine Safety Investigation Unit, Malta
49.Vertrouwen, Commercial Fshing vesselJames 2, recreational motor cruiser50°49.33′ N
000°12.56′ W
Near Shoreham2017/06/08, 00:263 deathJames 2 total lossMarine Accident Investigation Branch, United Kingdom
50.ASIAN BEAUTY, Cargo shipZEUS, Liquefied gas bulk carrier34°15.3′ N
133°38.3′ E
Around 328o true bearing and 1.4 nautical miles from the Takuma port Sudaichimonji breakwater east lighthouse2017/07/08, 06:08None2,000,000Japan Transport Safety Board

References

  1. Inoue, K.; Kawase, M. Innovative probabilistic prediction of accident occurrence. TransNav Int. J. Mar. Navig. Saf. Sea Transp. 2007, 1, 19–22. [Google Scholar]
  2. Montewka, J.; Goerlandt, F.; Kujala, P. On a systematic perspective on risk for formal safety assessment (FSA). Reliab. Eng. Syst. Saf. 2014, 127, 77–85. [Google Scholar] [CrossRef]
  3. Yang, W.; Shanshan, F.; Bing, W.; Jinhui, H.; Xiaoyang, W. Towards optimal recovery scheduling for dynamic resilience of networked infrastructure. J. Syst. Eng. Electron. 2018, 29, 995–1008. [Google Scholar] [CrossRef] [Green Version]
  4. Wu, B.; Yip, T.L.; Yan, X.; Guedes Soares, C. Fuzzy logic based approach for ship-bridge collision alert system. Ocean Eng. 2019, 187, 106152. [Google Scholar] [CrossRef]
  5. Zhang, M.; Zhang, D.; Yao, H.; Zhang, K. A probabilistic model of human error assessment for autonomous cargo ships focusing on human–autonomy collaboration. Saf. Sci. 2020, 130, 104838. [Google Scholar] [CrossRef]
  6. Zhang, W.; Floris, G.; Jakub, M.; Pentti, K. A method for detecting possible near miss ship collisions from AIS data. Ocean Eng. 2015, 107, 60–69. [Google Scholar] [CrossRef]
  7. Wu, B.; Cheng, T.; Yip, T.L.; Wang, Y. Fuzzy logic based dynamic decision-making system for intelligent navigation strategy within inland traffic separation schemes. Ocean Eng. 2020, 197, 106909. [Google Scholar] [CrossRef]
  8. Zhang, J.; Zhang, D.; Yan, X.; Haugen, S.; Soares, C.G.; Guedes Soares, C. A distributed anti-collision decision support formulation in multi-ship encounter situations under COLREGs. Ocean Eng. 2015, 105, 336–348. [Google Scholar] [CrossRef]
  9. Perera, L.P.; Carvalho, J.P.; Guedes Soares, C. Fuzzy logic based decision making system for collision avoidance of ocean navigation under critical collision conditions. J. Mar. Sci. Technol. 2011, 16, 84–99. [Google Scholar] [CrossRef]
  10. Perera, L.P.; Carvalho, J.P.; Guedes Soares, C.; Fang, Z.; Yu, H.; Ke, R.; Shaw, S.; Peng, G.; Chen, L.; Huang, Y.; et al. Intelligent ocean navigation and fuzzy-Bayesian decision/action formulation. IEEE J. Ocean. Eng. 2012, 37, 204–219. [Google Scholar] [CrossRef]
  11. Goerlandt, F.; Ståhlberg, K.; Kujala, P. Influence of impact scenario models on collision risk analysis. Ocean Eng. 2012, 47, 74–87. [Google Scholar] [CrossRef]
  12. Du, L.; Goerlandt, F.; Valdez Banda, O.A.; Huang, Y.; Wen, Y.; Kujala, P. Improving stand-on ship’s situational awareness by estimating the intention of the give-way ship. Ocean Eng. 2020, 201, 107110. [Google Scholar] [CrossRef]
  13. Wang, T.; Wu, Q.; Zhang, J.; Wu, B.; Wang, Y. Autonomous decision-making scheme for multi-ship collision avoidance with iterative observation and inference. Ocean Eng. 2020, 197, 106873. [Google Scholar] [CrossRef]
  14. Bakdi, A.; Glad, I.K.; Vanem, E.; Engelhardtsen, Ø. AIS-based multiple vessel collision and grounding risk identification based on adaptive safety domain. J. Mar. Sci. Eng. 2020, 8, 5. [Google Scholar] [CrossRef] [Green Version]
  15. Wang, T.; Yan, X.P.; Wang, Y.; Wu, Q. Ship Domain Model for Multi-ship Collision Avoidance Decision-making with COLREGs Based on Artificial Potential Field. TransNav Int. J. Mar. Navig. Saf. Sea Transp. 2017, 11, 85–92. [Google Scholar] [CrossRef] [Green Version]
  16. Zhang, L.; Meng, Q. Probabilistic ship domain with applications to ship collision risk assessment. Ocean Eng. 2019, 186, 106130. [Google Scholar] [CrossRef]
  17. Huang, Y.; Chen, L.; van Gelder, P.H.A.J.M. Generalized velocity obstacle algorithm for preventing ship collisions at sea. Ocean Eng. 2019, 173, 142–156. [Google Scholar] [CrossRef]
  18. Goerlandt, F.; Montewka, J. A framework for risk analysis of maritime transportation systems: A case study for oil spill from tankers in a ship-ship collision. Saf. Sci. 2015, 76, 42–66. [Google Scholar] [CrossRef]
  19. Fan, S.; BlancoDavis, E.; Yang, Z.; Zhang, J.; Yan, X. Incorporation of human factors into maritime accident analysis using a data-driven Bayesian network. Reliab. Eng. Syst. Saf. 2020, 203, 107070. [Google Scholar] [CrossRef]
  20. Wang, C. Hybrid Causal Logic Methodology for Risk Assessment. Ph.D. Thesis, University of Maryland, College Park, MD, USA, 2007. [Google Scholar]
  21. Groen, F.J.; Mosleh, A. An algorithm for the quantification of hybrid causal logic models. In Proceedings of the 8th International Conference on Probabilistic Safety Assessment and Management, PSAM 2006, New Orleans, LA, USA, 14–18 May 2006; pp. 924–930. [Google Scholar]
  22. Ren, D.; Zheng, W.; Wu, D. Hybrid causal methodology in quantitative risk assessment for the on-board ATP of high speed railway. In Proceedings of the 2014 17th IEEE International Conference on Intelligent Transportation Systems, ITSC 2014, Qingdao, China, 8–11 October 2014; pp. 1577–1582. [Google Scholar]
  23. Røed, W.; Mosleh, A.; Vinnem, J.E.; Aven, T. On the use of the hybrid causal logic method in offshore risk analysis. Reliab. Eng. Syst. Saf. 2009, 94, 445–455. [Google Scholar] [CrossRef]
  24. Wang, Y.F.; Xie, M.; Habibullah, M.S.; Ng, K.M. Quantitative risk assessment through hybrid causal logic approach. Proc. Inst. Mech. Eng. Part O J. Risk Reliab. 2011, 225, 323–332. [Google Scholar] [CrossRef]
  25. Diaconeasa, M.A. Integration of Qualitative and Quantitative Hybrid Causal Logic into a Simulation-Based Platform for Probabilistic Risk Assessment of Nuclear Power Plants. Ph.D. Thesis, University of California, Los Angeles, CA, USA, 2017. [Google Scholar]
  26. Quantitative risk assessment system (QRAS). Reliab. Eng. Syst. Saf. 2006, 91, 292–304. [CrossRef]
  27. Mosleh, A.; Dias, A.; Eghbali, G.; Fazen, K. An Integrated Framework for Identification, Classification, and Assessment of Aviation Systems Hazards. In Probabilistic Safety Assessment and Management; Springer: London, UK, 2004; pp. 2384–2390. [Google Scholar]
  28. Cheok, M.C.; Parry, G.W.; Sherry, R.R. Use of importance measures in risk-informed regulatory applications. Reliab. Eng. Syst. Saf. 1998, 60, 213–226. [Google Scholar] [CrossRef]
  29. Meng, F.C. Relationships of Fussell-Vesely and Birnbaum Importance to Structural Importance in Coherent Systems. Reliab. Eng. Syst. Saf. 2000, 67, 55–60. [Google Scholar] [CrossRef]
  30. Board, S. Marine Accident. Available online: https://www.ntsb.gov/investigations/AccidentReports/Pages/marine.aspx (accessed on 29 July 2019).
  31. Mærsk, S. The Danish Maritime Accident Investigation Board. Available online: www.dmaib.com (accessed on 11 February 2019).
  32. MAIB Marine Accident Investigation Branch—About Us. Available online: http://www.maib.gov.uk/about_us/index.cfm (accessed on 11 February 2019).
  33. Marine Accident and Incident Reports (Japan). Available online: http://www.mlit.go.jp/jtsb/marrep.html (accessed on 11 February 2019).
  34. Marine Published Reports (Norway). Available online: https://www.aibn.no/Sjofart/Published-reports (accessed on 11 February 2019).
  35. Marine Safety Investigations(Malta). Available online: https://mtip.gov.mt/en/msiu/Pages/2017.aspx (accessed on 11 February 2019).
  36. Groth, K.; Wang, C.; Mosleh, A. Hybrid causal methodology and software platform for probabilistic risk assessment and safety monitoring of socio-technical systems. Reliab. Eng. Syst. Saf. 2010, 95, 1276–1285. [Google Scholar] [CrossRef]
  37. Goerlandt, F.; Montewka, J.; Kuzmin, V.; Kujala, P. A risk-informed ship collision alert system: Framework and application. Saf. Sci. 2015, 77, 182–204. [Google Scholar] [CrossRef] [Green Version]
  38. Hänninen, M.; Kujala, P. Influences of variables on ship collision probability in a Bayesian belief network model. Reliab. Eng. Syst. Saf. 2012, 102, 27–40. [Google Scholar] [CrossRef]
  39. Dhanak, M.R.; Xiros, N.I. Springer Handbook of Ocean Engineering; Springer: Berlin/Heidelberg, Germany, 2016; ISBN 9783319166490. [Google Scholar]
  40. Brocken, E.M. Improving the Reliability of Ship Machinery: A Step towards Unmanned Shipping. Master’s Thesis, Delft University of Technology, Delft, The Netherlands, 2016. [Google Scholar]
  41. Otto, S.; Pedersen, P.T.; Samuelides, M.; Sames, P.C. Elements of risk analysis for collision and grounding of a RoRo passenger ferry. Mar. Struct. 2002, 15, 461–474. [Google Scholar] [CrossRef]
  42. Pedersen, P.T. Collision risk for fixed offshore structures close to high-density shipping lanes. Proc. Inst. Mech. Eng. Part M J. Eng. Marit. Environ. 2002, 216, 29–44. [Google Scholar] [CrossRef]
  43. Kujala, P.; Hänninen, M.; Arola, T.; Ylitalo, J. Analysis of the marine traffic safety in the Gulf of Finland. Reliab. Eng. Syst. Saf. 2009, 94, 1349–1357. [Google Scholar] [CrossRef]
  44. Zhang, D.; Yan, X.P.; Yang, Z.L.; Wall, A.; Wang, J. Incorporation of formal safety assessment and Bayesian network in navigational risk estimation of the Yangtze River. Reliab. Eng. Syst. Saf. 2013, 118, 93–105. [Google Scholar] [CrossRef]
  45. Zhang, J.; Yan, X.P.; Zhang, D.; Haugen, S. Ship Trajectory Control Optimization in Anti-collision Maneuvering. TransNav, Int. J. Mar. Navig. Saf. Sea Transp. 2013, 7, 89–93. [Google Scholar] [CrossRef]
  46. Weng, J.; Meng, Q.; Qu, X. Vessel Collision Frequency Estimation in the Singapore Strait. J. Navig. 2012, 65, 207–221. [Google Scholar] [CrossRef] [Green Version]
  47. Zhang, L.; Meng, Q.; Fang Fwa, T. Big AIS data based spatial-temporal analyses of ship traffic in Singapore port waters. Transp. Res. Part E Logist. Transp. Rev. 2019, 129, 287–304. [Google Scholar] [CrossRef]
  48. Montewka, J.; Goerlandt, F.; Kujala, P. Determination of collision criteria and causation factors appropriate to a model for estimating the probability of maritime accidents. Ocean Eng. 2012, 40, 50–61. [Google Scholar] [CrossRef]
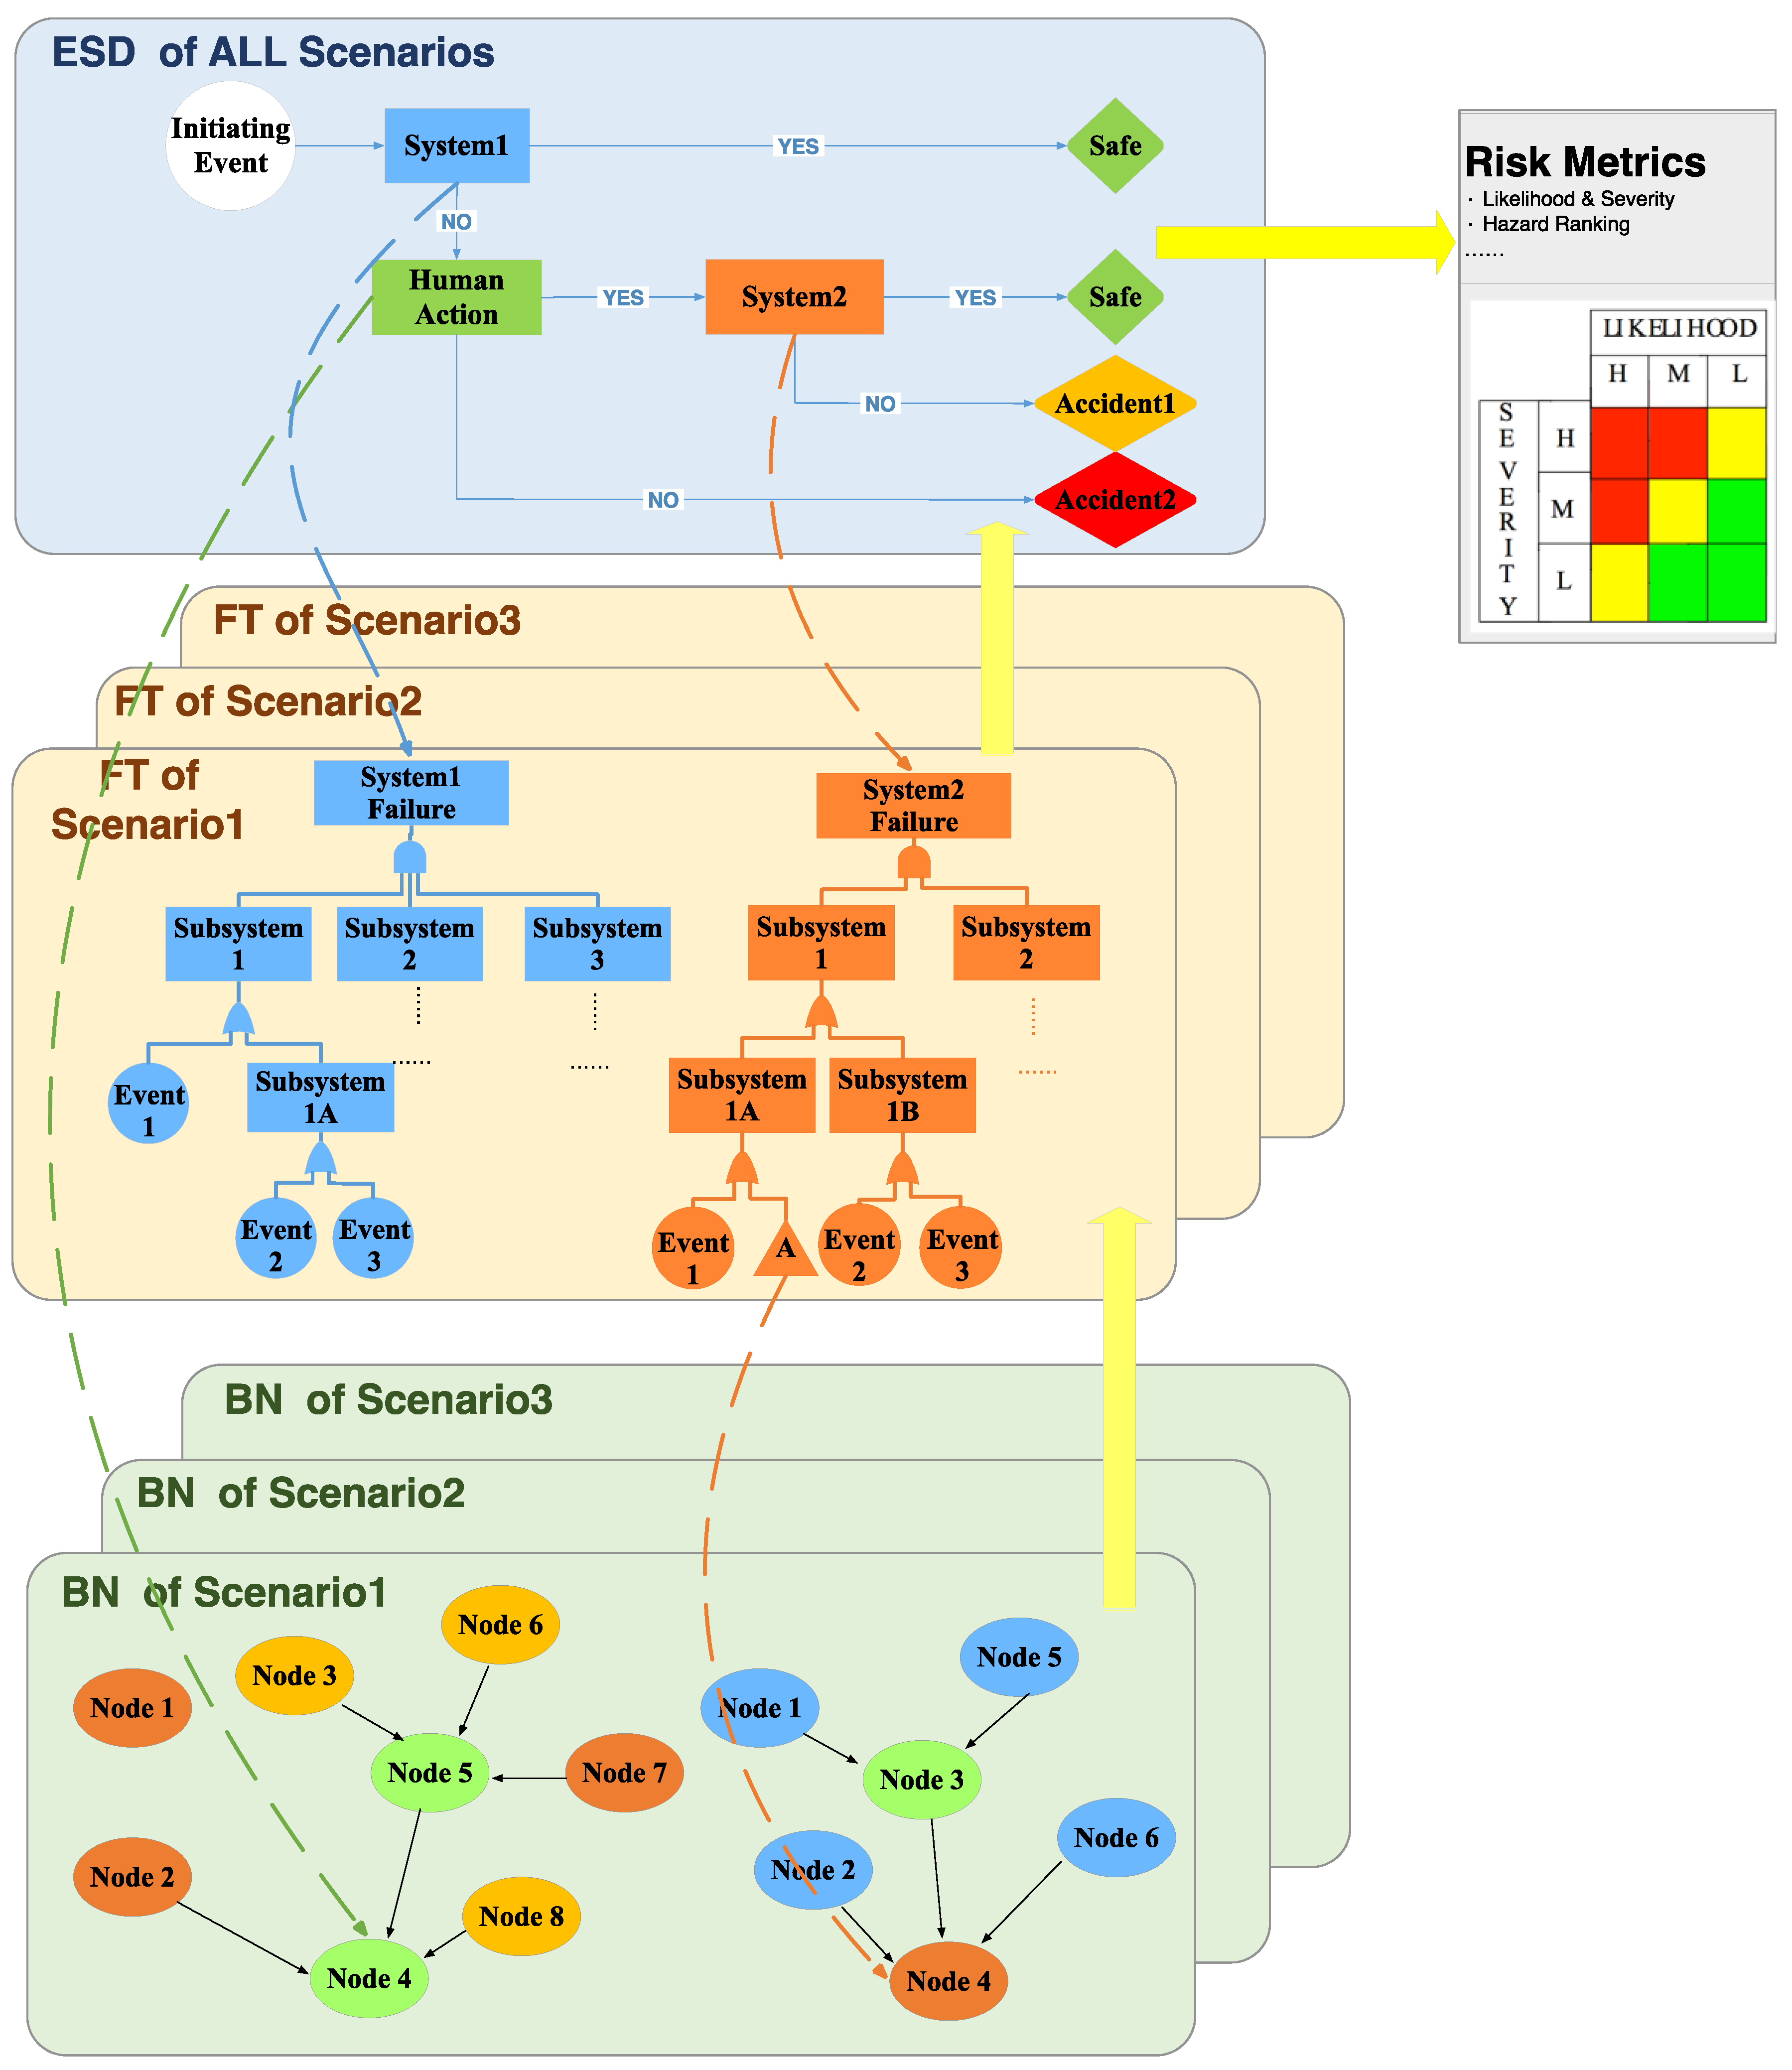
Figure 1. The Structure of the HCL model.
Jmse 08 00485 g001
Figure 2. Regions of accidents considered in analysis.
Jmse 08 00485 g002
Figure 3. Multi-subject modeling and single-subject modeling of Ship collision accident.
Jmse 08 00485 g003
Figure 4. Statistics of accidents based on accident event sequence logical.
Jmse 08 00485 g004
Figure 5. ESD of M-M ship collision scenario.
Jmse 08 00485 g005
Figure 6. Method of determining the TS Measures (PE 13).
Jmse 08 00485 g006
Figure 7. The FT model of OS Alarm Failure for Collision Risk (linked with PE 1 OS Collision Alarm).
Jmse 08 00485 g007
Figure 8. the FT model of Ship Propulsion and Steering Failure (linked with PE 7/9/12).
Jmse 08 00485 g008
Figure 9. The BN models of the proposed HCL model.
Jmse 08 00485 g009
Table 1. Events’ information in ESD of Figure 5.
Node NO.Node NameDescription
Initial Event (IE)Initiating Event: CPA alarmClosest point of approach less than minimum safe distance (e.g., 100 m)
Pivotal Event 1 (PE1)OS Collision AlarmOwn-Ship Alarm Signal for Possible Collision
PE2Officer on Watch (OW) Identifies CollisionOfficer on Watch Identifies Possible Collision
PE3OS Crew ConfirmationOS Crew Confirm Possible Collision
PE4OS Response Strategy DecisionCrew decides response strategy
PE5OS Effective Communication with TSOS Effective Communication with TS
PE6OS Crew Response Action with Successful TS CommunicationOS Crew Response Action with Successful TS Communication
PE7OS Propulsion and Steering
PE8OS Crew Response Action with Failed TS CommunicationOS Crew Response Action with Failed TS Communication
PE9OS Propulsion and Steering with Failed TS CommunicationOS Propulsion and Steering with Failed TS Communication
PE10OS Response Strategy Decision for EmergencyCrew decides response strategy for Emergency
PE11OS Crew Response Action for EmergencyOS Crew Response Action for Emergency
PE12OS Propulsion and Steering for EmergencyOS Propulsion and Steering for Emergency
PE13TS MeasuresTarget Ship Measures
End 1 (E1)End State 1Successful Avoidance
E2End State 2Ship Mechanical Failure
E3End State 3Crew Response Action Failure
E4End State 4Successful Avoidance with Failure TS Communication
E5End State 5Ship Mechanical Failure with Failed TS Communication
E6End State 6Crew Response Action Failure with Failed TS Communication
E7End State 7Successful Avoidance for Emergency
E8End State 8Crew Response Action Failure for Emergency
E9End State 9Crew Response Action Failure for Emergency
E10End State 10Crew Response Decision Failure
E11End State 11OS and TS all failure for collision
Table 2. Descriptions and Level labels of the BN-model.
Node NameDescriptionLevel Name
BN-1 RiskIden was linked with PE 2 (OW Identifies Collision)
RiskIdenOW Indentifies Possible CollisionNot Sure\Sure
OW Experience Intership\1~5 year\>5 year
Environment Advantage\Disadvantage
CPAFinCalCPA Final CalculationEffective\NonEffect
OSPosCalOwn-ship Position CalculationEffective\NonEffect
TSPosPreTarget Ship Position PredictionEffective\NonEffect
OSCourseOS current course angleAdvantage\Disadvantage
OSPosition Advantage\Disadvantage
OSSpeed Advantage\Disadvantage
TSCourseTS current course angleAdvantage\Disadvantage
TSPosition Advantage\Disadvantage
TSSpeed Advantage\Disadvantage
BN-2 OSRSDecision was linked with PE 4 (OS Response Strategy Decision), share BN structure with PE 10 (OS Response Strategy Decision for Emergency)
OSIniDecOSInitialDecisionEffective\NonEffect
OSRSDecisionOS Response Strategy DecisionEffective\NonEffect
TSDecision Effective\NonEffect
environment Advantage\Disadvantage
experience Intership\1~5 year\>5 year
local rule Obey\Not obey
OS courseOS current course angleAdvantage\Disadvantage
OS position Advantage\Disadvantage
OS speed Advantage\Disadvantage
TS courseTS current course angleAdvantage\Disadvantage
TS position Advantage\Disadvantage
TS speed Advantage\Disadvantage
CommunicateInformation CommunicationEffective\NonEffect
BN-3 Communication was linked with PE 5 (OS Effective Communication with TS)
CommunicationEffective Communication between two shipsEffective\Failure
Crew experienceCrew experience for both shipIntership\1~5 year\>5 year
EquConComEquipment Condition for communicationWork\Fail
OS AttitudeAttitude of OS crewsPositive\Negative
TS AttitudeAttitude of TS crewsPositive\Negative
BN-4 CrewResAct was linked with PE 6 (OS Crew Response Action)
CrewResActCrew Response ActionEffective\NonEffect
FFD(Normal)Fitness for Duty (FFD), Level 0 means don’t fit current operationLevel 0\Level 1\Level 2
Ship Condition Bad\Good
Crew Experience Intership\1~5 year\>5 year
ShipAge 0~3 year\3~10 year\>10 year
BN-5 EmResAct was linked with PE 11 (OS Crew Response Action for Emergency), share BN structure with PE 8 (OS Crew Response Action with Failed TS Communication).
EmResActOS Crew Response Action for emergencyEffective\NonEffect
FFD(Em)Fitness for Duty in emergency, Level 0 means don’t fit current operationLevel 0\Level 1\Level 2
OSAtt(Em)OS Attitude for EmergencyPositive\Negative
ShipCon(Em)Ship Condition in EmergencyBad\Good
EmExperenceCrew Experience for EmergencyIntership\1~5 year\>5 year
ShipAge(Em)Ship Age0~3 year\3~10 year\>10 year
Table 3. Probability Values of All End State Events.
End StateEnd State TypeProbability
E1Safe0.1236
E2Collision due to Mechanical Failure0.0051
E3Collision due to Human Error0.0700
E4Safe0.0713
E5Collision due to Mechanical Failure0.0066
E6Collision due to Human Error0.0305
E7Safe0.1611
E8Collision due to Mechanical Failure0.0230
E9Collision due to Human Error0.1277
E10Collision due to Human Error0.3444
E11Safe0.0366
TotalSafe0.3926
Collision0.6073
(1) Collision due to Mechanical Failure0.0348
(5.73% of Collision)
(2) Collision due to Human Error0.5725
(94.27% of Collision)
Table 4. Ship collision accident estimation in the Singapore Strait.
Collision TypeCausation Probability 1Number of Conflicts (1/Month)Number of Conflicts (1/Year = 12 × 1/Month)Estimated Collision Frequency (1/Year) 2
Overtaking4.90 × 10−5101412,1680.36
Head-on4.90 × 10−544152920.16
Crossing1.30 × 10−462074400.59
Total 207524,9001.11
1 Commonly accepted by the existing studies ([41,42,43,46]); 2 Collision frequency = Causation probability × Number of conflicts × Probability of collision in Table 3.