1. Introduction
The demand for land is addressed efficiently through the reclamation of foreshores, which include vast lands for industrial use, dwellings, airports, and harbors. Superior soil, suitable for making grounds through the reclamation of the foreshore, has been depleted due to resource exhaustion and environmental preservation, and marine soft soil is used to substitute soil to be reclaimed from nearby sites. Each year, over 30 million m3 of dredged soil is used for the environmental reformation of offshores and estuaries, harbor construction, and maintenance of waterways. Recently, dredged soil has been reclaimed to dumping areas only because the 1996 Protocol to the London Convention has not permitted ocean dumping from January 2009. The dredged marine soft soil is reclaimed to dump areas due to demands for new ground and the treatment of a huge amount of dredged soil.
In Korea, most of the dredged marine soft soil is reclaimed due to its high water content; however, the difference between construction methods as well as the very weak strength and large settlement of the soft soil is a problem. Settlement is the main geotechnical issue related to the stability and estimation of the amount of dredged soil.
The difference between actual settlement and Terzaghi’s one-dimensional consolidation theory is well explained by Gibson et al. [
1] and Cargill [
2]. Finite strain consolidation theory induces a large strain consolidation phenomenon without numerical inconsistency and, specifically, it applies nonlinear compressibility and permeability. Numerical analysis conducted using the equation that is governed by the finite strain consolidation theory is known to estimate a large consolidation settlement [
3,
4,
5,
6,
7]. Finite strain consolidation theory is not commonly applied to the design and construction in Korea. The general reasons are the lack of understanding of the theory, and difficulty in estimating input data and analyzing the numerical input or result.
The studies on void ratio-effective stress and void ratio-permeability have mainly focused on the exponential or power equation. Somogyi [
8,
9] proposed a constitution equation as a power law. Carrier et al. [
10] proposed a constitution equation of modified power laws by analyzing the relationship between physical character (Atterberg limits and Activity) and the coefficient of the constitution equation. Gibson et al. [
11] proposed an exponential constitution equation to simplify the consolidation governing equation.
Non-linear relationships between void ratio and effective stress, and void ratio and permeability, which directly affect settlement behavior, are observed in the high water content range of dredged soil. The non-linear constitution equation in a high water content range is difficult to estimate by conducting direct experiments. To overcome this problem, consolidation tests and settlement tests are carried out, and the results of these tests are back-analyzed through numerical analysis based on the finite strain consolidation theory. Therefore, in this study, representative relationship equations of void ratio-effective stress and void ratio-permeability of marine soft soil in Korea are proposed using finite strain consolidation theory.
2. Characteristics of Dredged and Reclaimed Soil
2.1. Methods of Analysis
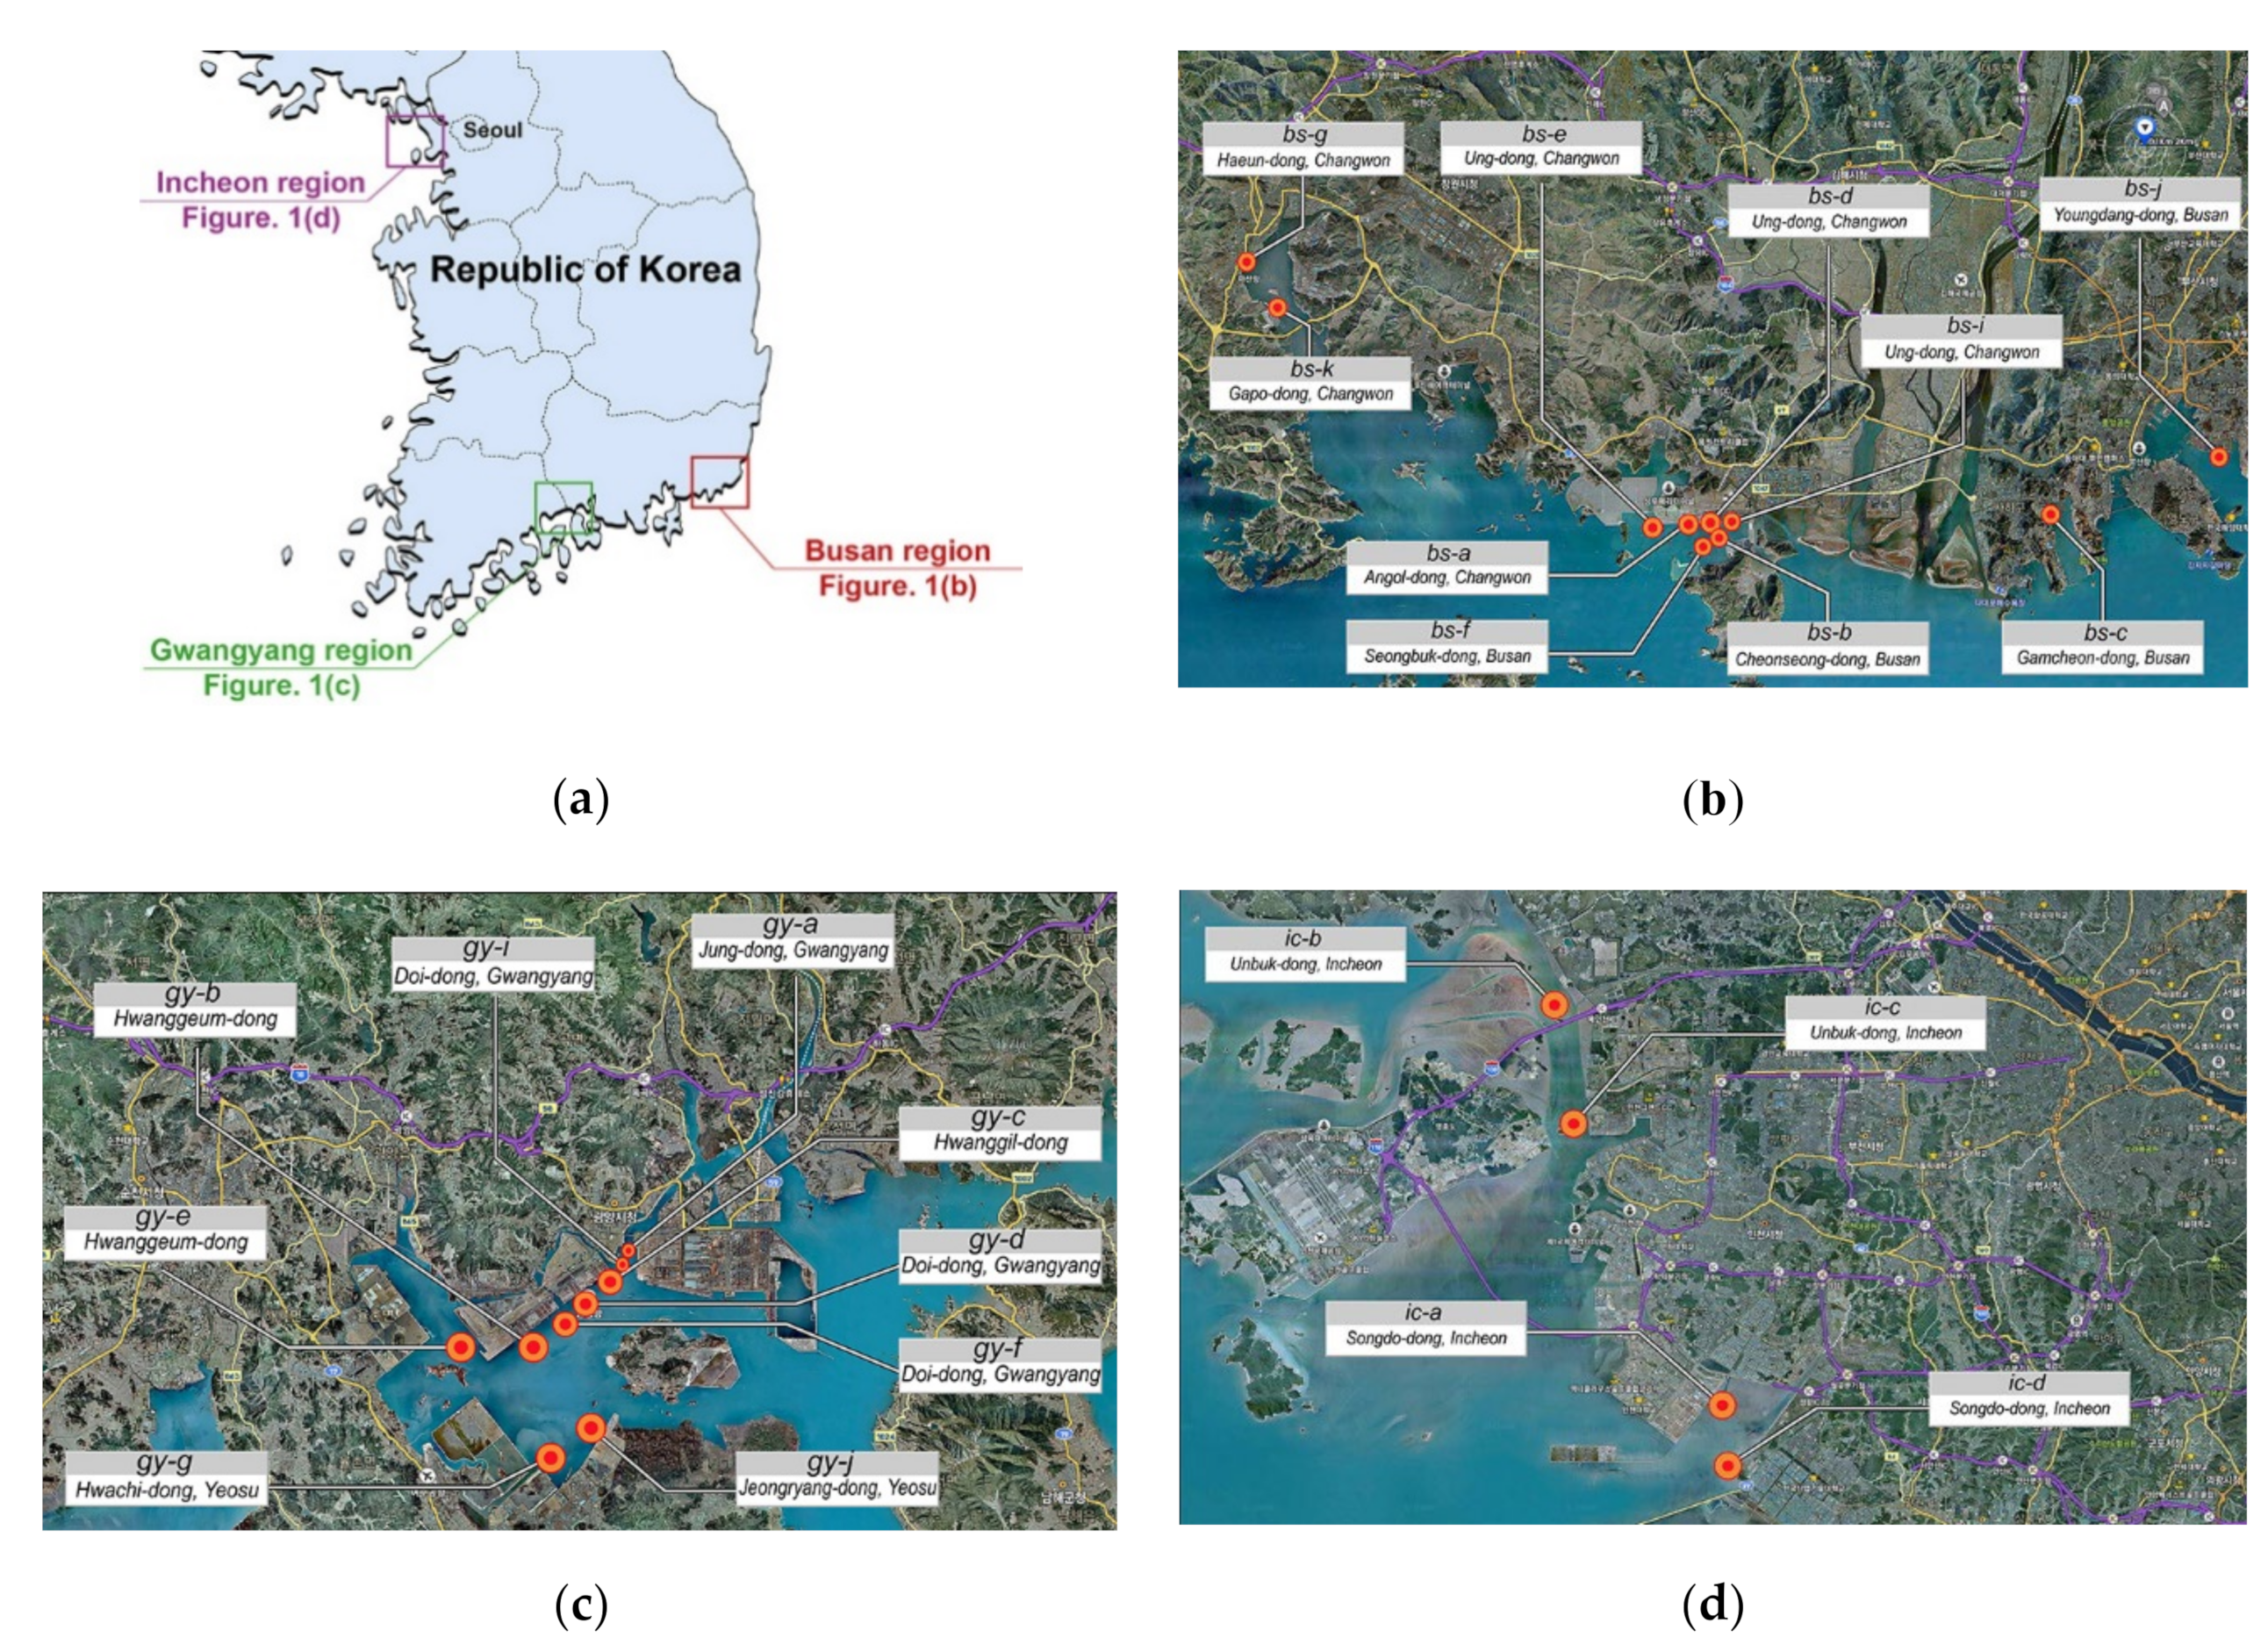
A huge amount of dredged soil has been reclaimed in disposal areas that are mostly developed at new ports. There are three main disposal areas of dredged soil at Busan New Port, five at Incheon port, and three at Pyeongtaek-Dangjin Port, in addition to several others in various locations. The demand for the disposal area is continuously increasing around the areas developed at new ports, and the expansion of the existing disposal area is covered due to the expropriation of dredged soil. In this study, dredged soil was sampled at 23 dredged-reclaimed construction sites and laboratory tests were carried out using 23 samples. The sampling locations and construction sites are shown in
Table 1 and
Figure 1. The samples were separated into three regions: the Busan, Gwangyang, and Incheon regions.
Dredged soil is disposed of under disturbed conditions using different dredging methods. In particular, the pump-dredged method mostly used in Korea moves dredged soil with water into the disposal area after being totally disturbed. Therefore, in this study, experiments on engineering properties and centrifugal tests used disturbed samples. The sieve analysis, particle size analysis, soil classification system, and Atterberg limit test for 23 samples were performed by ASTM C136, ASTM D422, ASTM D2487, and ASTM D4318, respectively. The oedometer one-dimensional consolidation test and the constant rate of the strain (CRS) consolidation test followed ASTM D2435-11 and ASTM D4186-06. The CRS test is performed as strain rates of 0.04–0.001% per minute depending on the liquid limit of the soil, and the result is analyzed using the consolidation solution provided by Wissa et al. [
12].
2.2. Characteristics of Dredged Soil
2.2.1. Busan Region
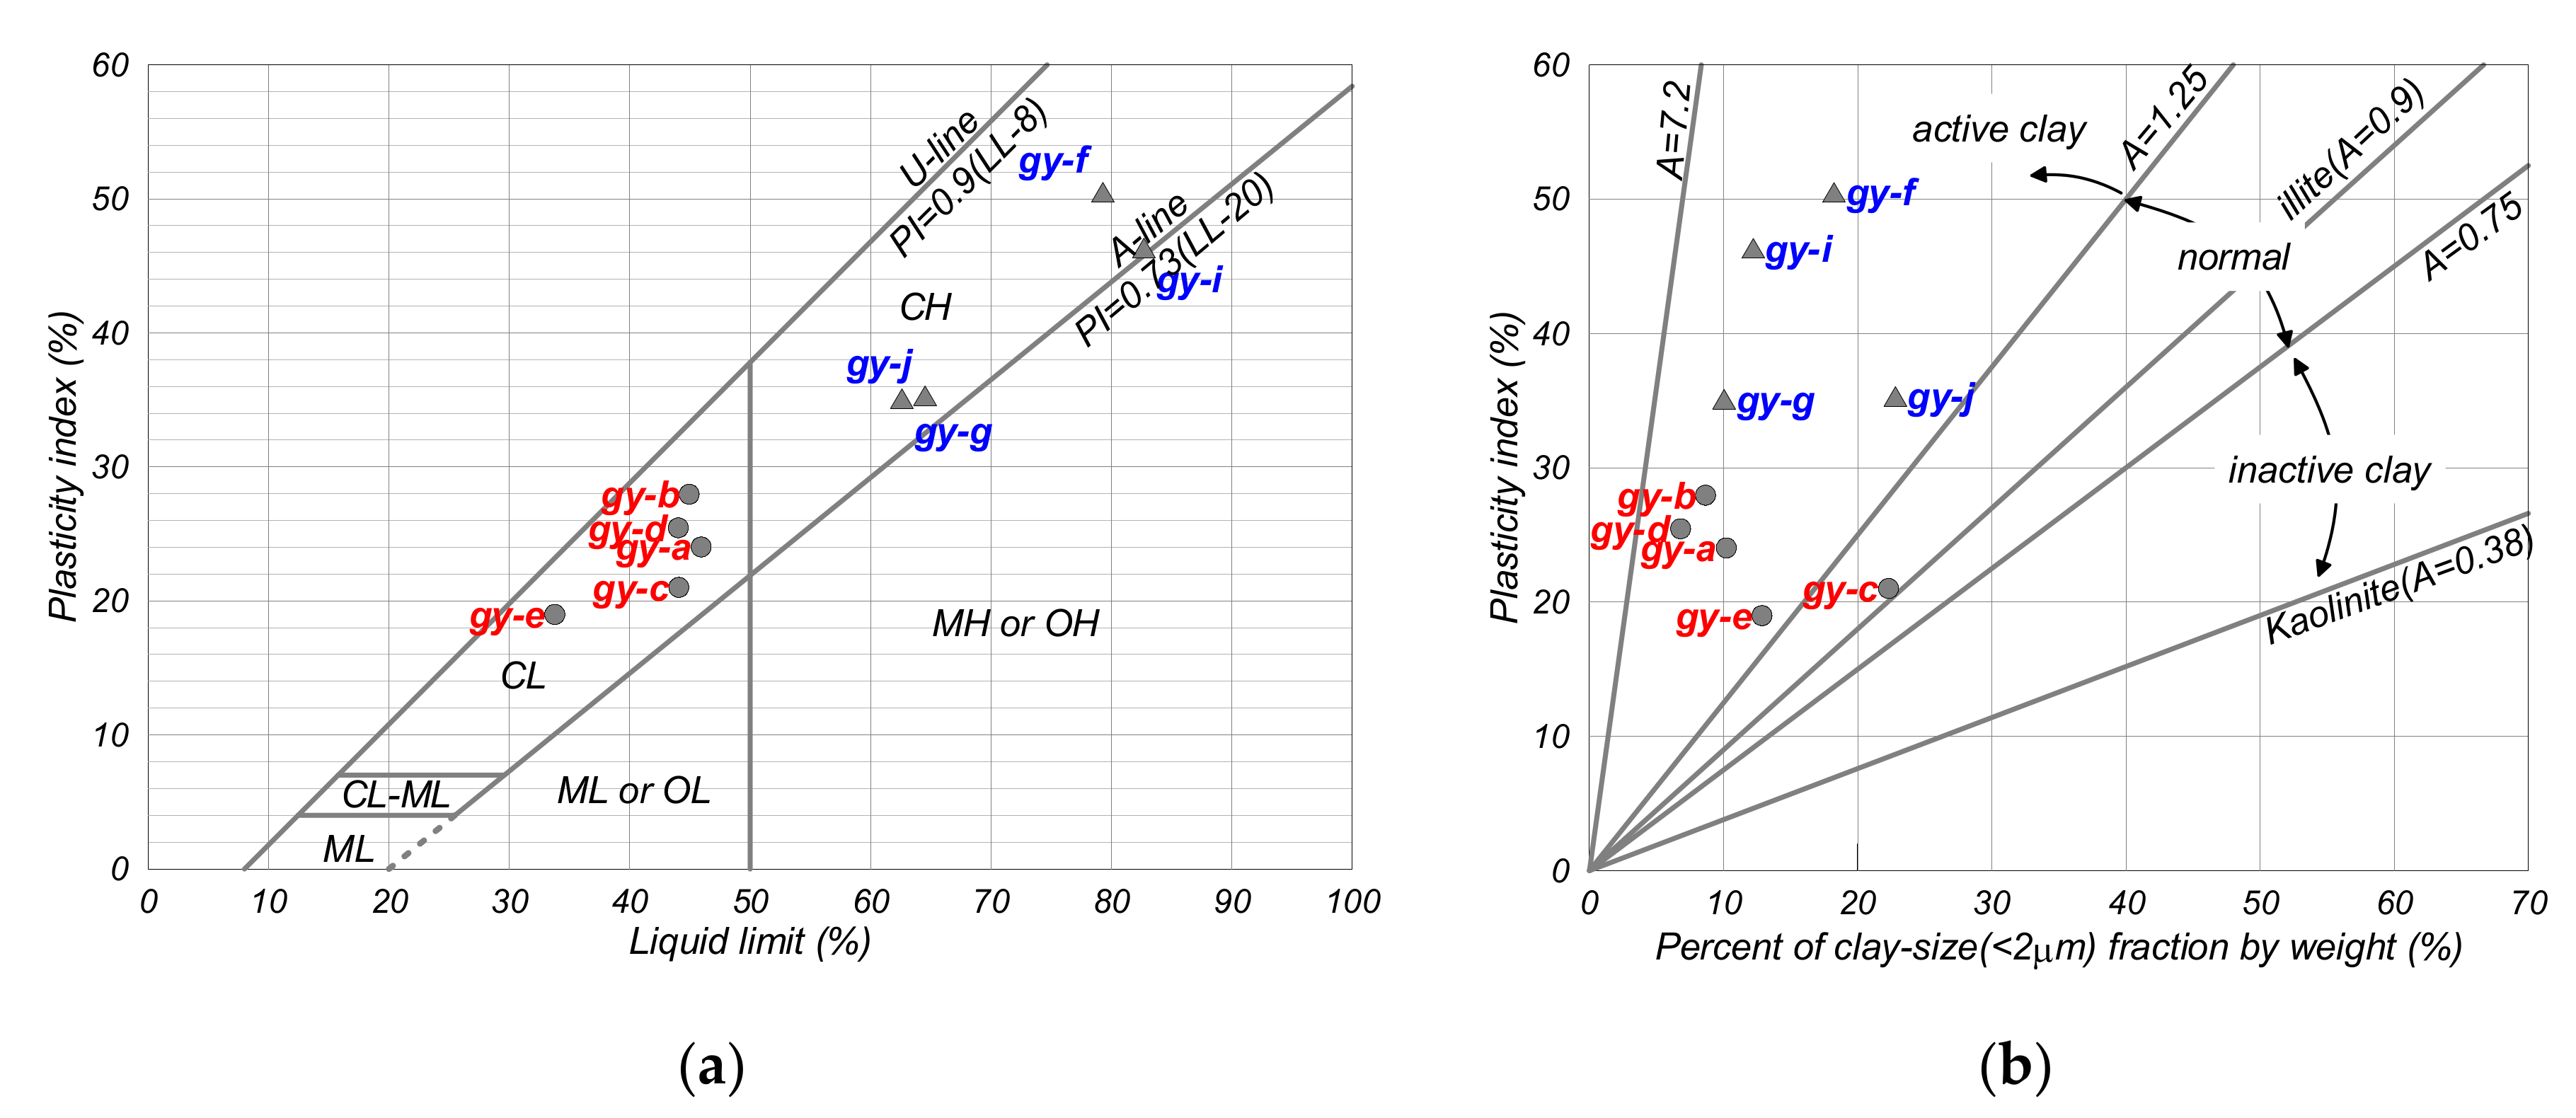
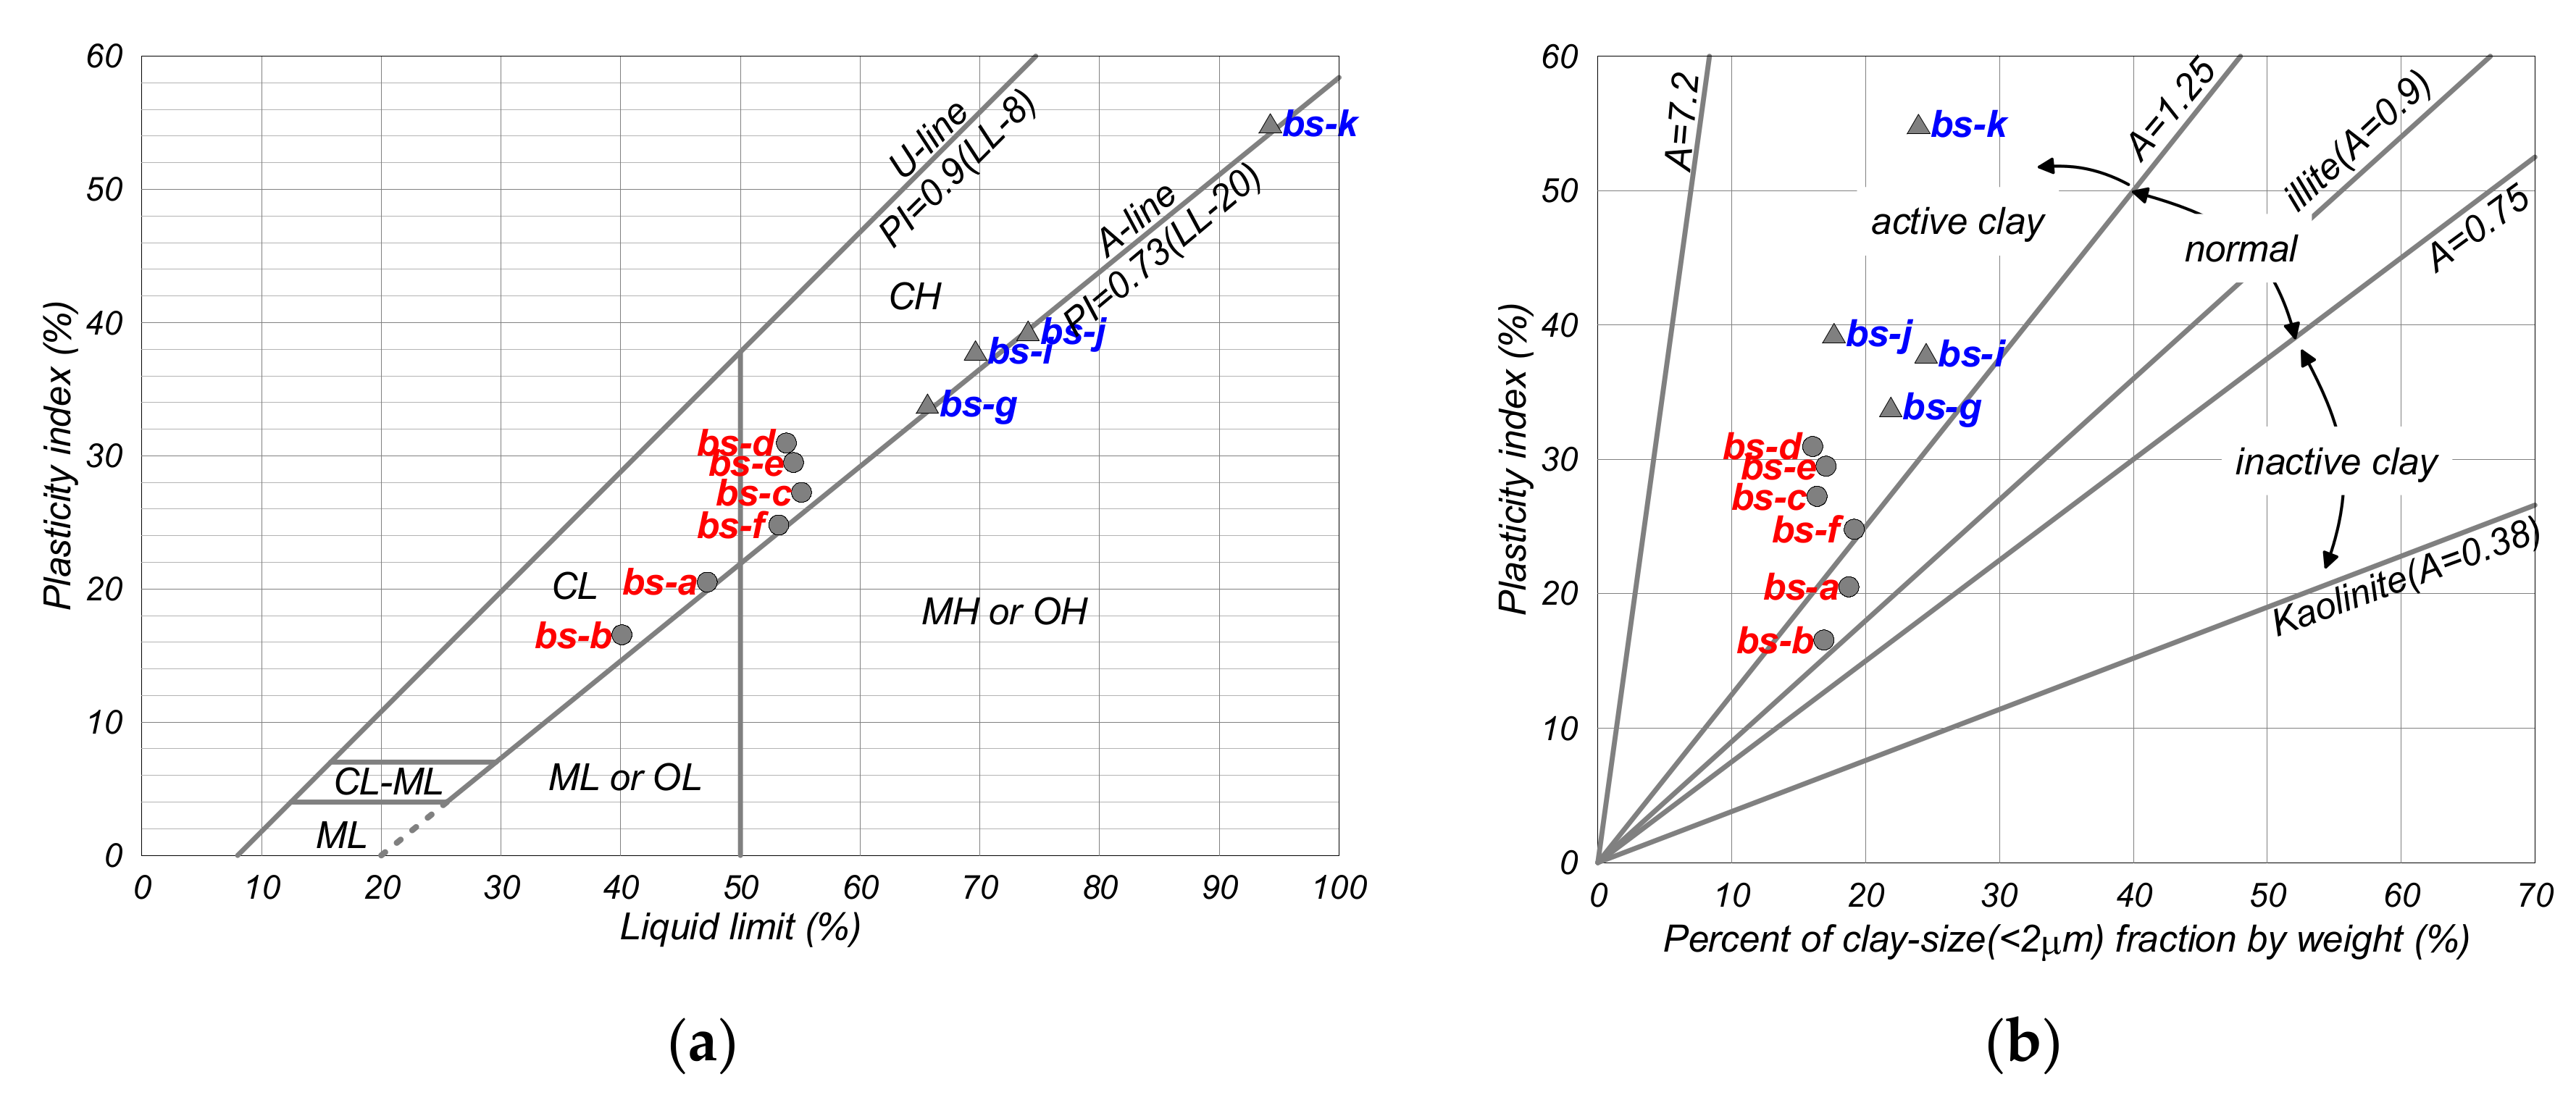
The characteristics of dredged soil in the Busan region were analyzed using 10 samples, and are shown as plasticity and activity charts in
Figure 2a,b, respectively. The specific gravity, plastic limit, liquid limit, plastic index, and activity of the samples were 2.706–2.731 (average 2.718), 20.88–39.31 (avg. 28.97%), 40.10–94.26% (avg. 60.74%), 15.56–54.96% (avg. 31.77%), and 0.8–2.29 (avg. 1.63), respectively. The specimens bs-g, bs-i, bs-j, and bs-k followed the A-line on the plasticity chart, and other specimens showed liquid limits (LL) in the range of 40–55% (LL < 60%). The specimens in the Busan region can be separated into bs-a to bs-f (LL < 60%) and bs-g to bs-k (LL ≥ 60%), according to the liquid limit. It can be observed from
Figure 2b that specimens with LL less than 60% represent a contented clay mineral with a PI (plasticity index) range of 10–20%, and the specimens with LL greater than 60% represent activated clay with a PI range of 33–55%. According to the sieve and particle size analysis tests, the sand particle content (less than the No. 200 sieve, 0.074 mm), silt particle content, and clay particle content were 0.62–5.07%, 72.90–82.93%, and 16.05–24.53%.
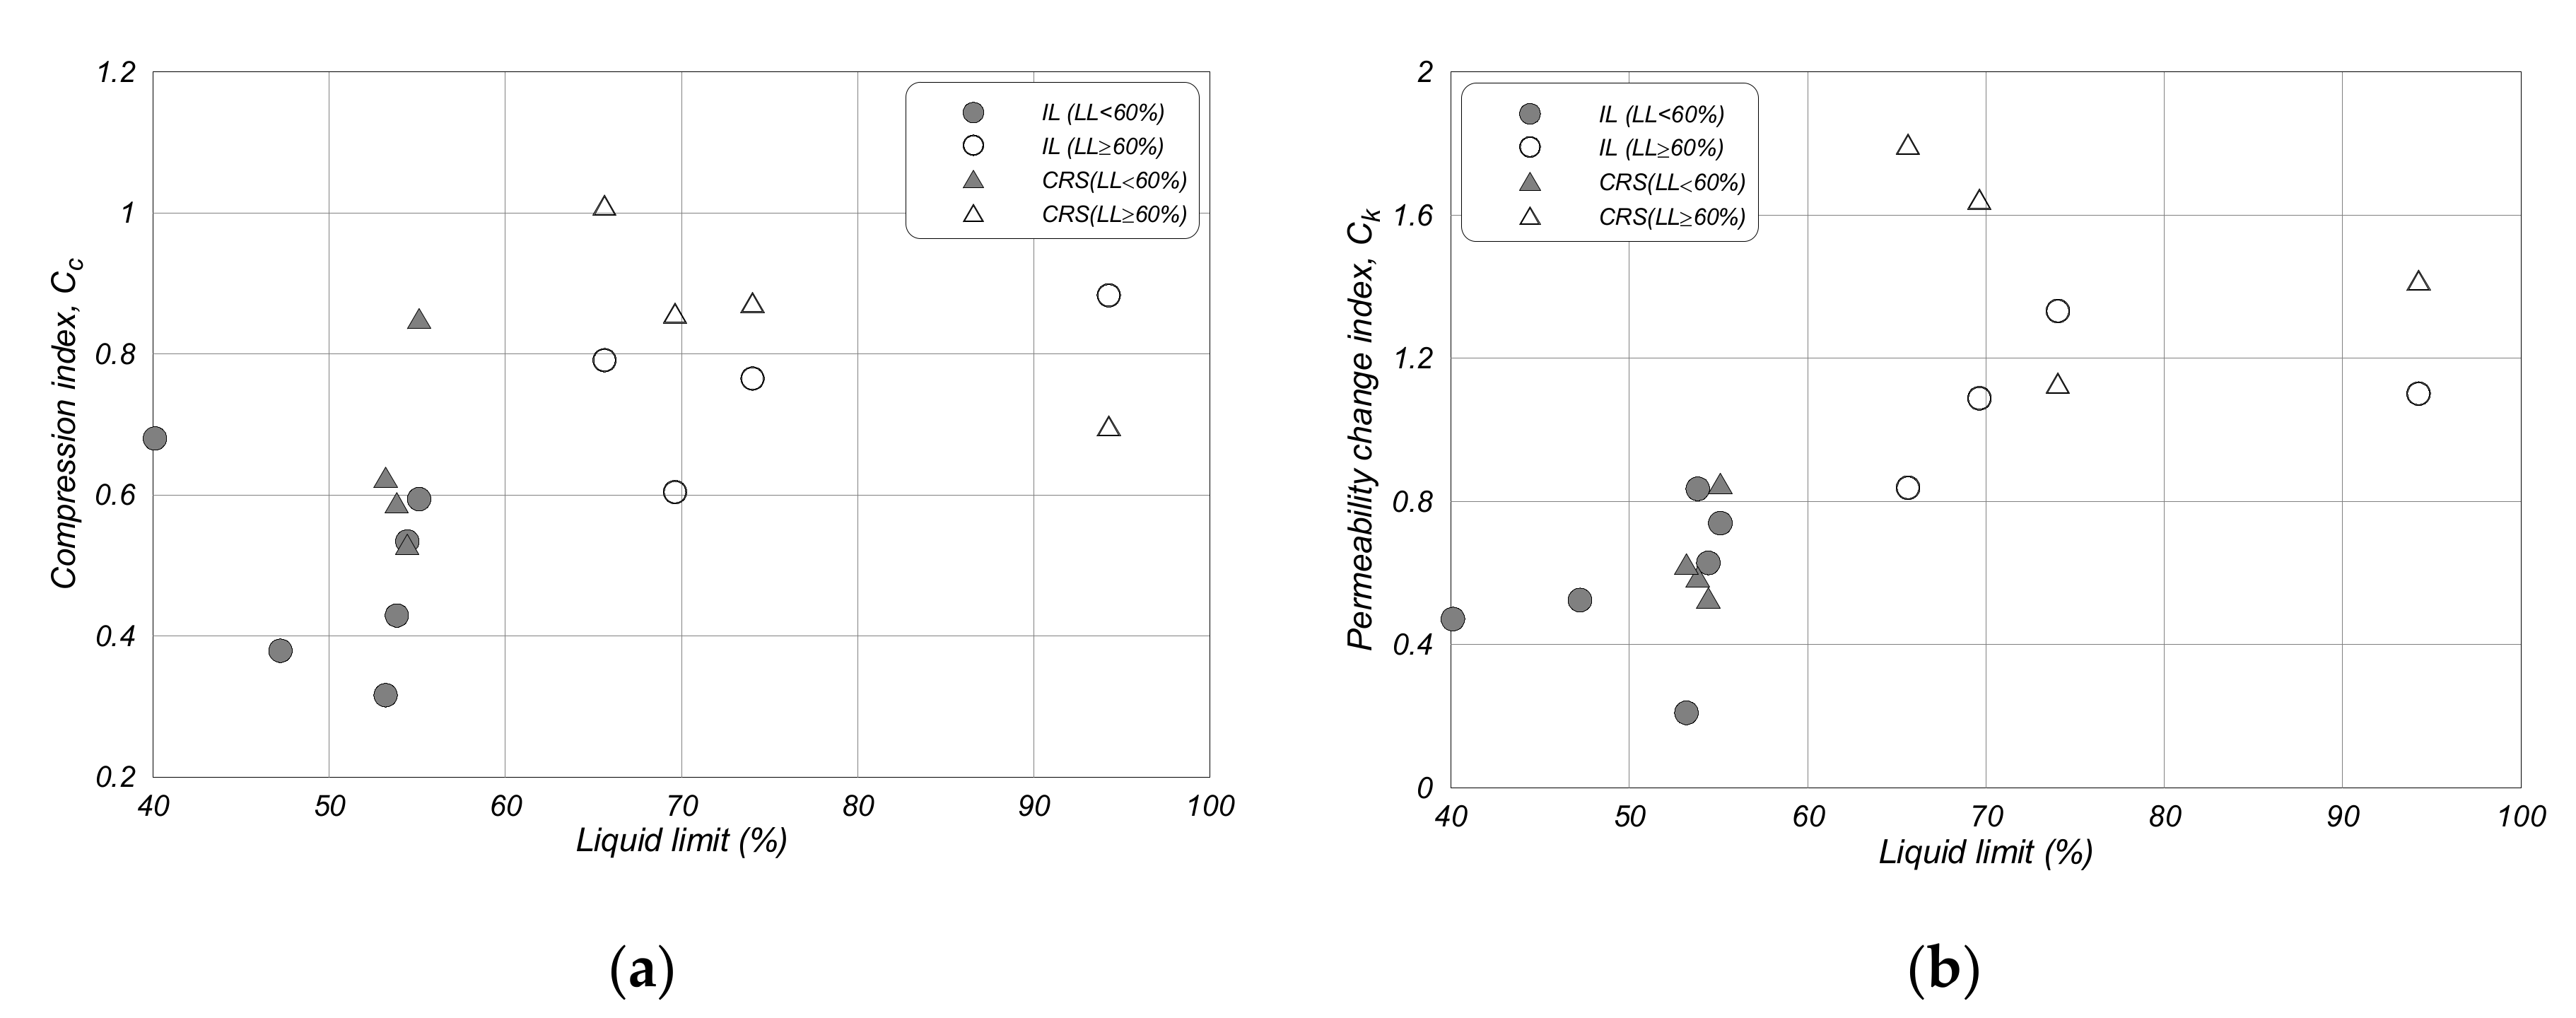
The specimens showed the compression index (C
c) of 0.316–0.883 and permeability change index (C
k) of 0.209–1.328 during the oedometer [incremental loading (IL)] test, and C
c of 0.530–1.011 and C
k of 0.731–1.799 during the CRS consolidation test where the compression index (C
c) and the permeability change index are defined as
and
. The consolidation properties of the Busan region soils as per the liquid limit are shown in
Figure 3. Specimens (bs-a, b, d) with LL < 60% showed small compression and high permeability than the specimens with LL ≥ 60%. Therefore, the separation of the Busan region soil using the criteria of liquid limit (LL = 60%) can be considered reasonable because the physical and consolidation properties are different. The clay with LL < 60% was named the Busan-L marine clay and the clay with LL ≥ 60% was named the Busan-H marine clay.
2.2.2. Gwangyang Region
The soil in the Gwangyang region, which was analyzed using nine samples, had the specific gravity, plastic limit, liquid limit, and plastic index of 2.702–2.745 (average 2.718), 14.78–36.37% (avg. 24.13%), 33.77–82.71% (avg. 55.77%), and 18.99–50.50% (avg. 31.63%), respectively, as shown in
Figure 4. It had an activity of 0.94–3.79 (avg. 2.60) and was classified into CL and CH as per the unified soil classification system (USCS). The plastic and liquid limits of the Gwangyang region soil were slightly less than those of the Busan region soil. According to the sieve and particle size analysis tests, the sand particle content, silt particle content, and clay particle content were 0.47–10.30%, 67.41–87.14%, and 6.9–22.81%, respectively. The Busan region soil contained slightly finer particles than the Gwangyang region soil as per the result of the plasticity, sieve, and particle size analysis tests. However, clay minerals might be different due to the higher activity of the Gwangyang region soil than the Busan region soil.
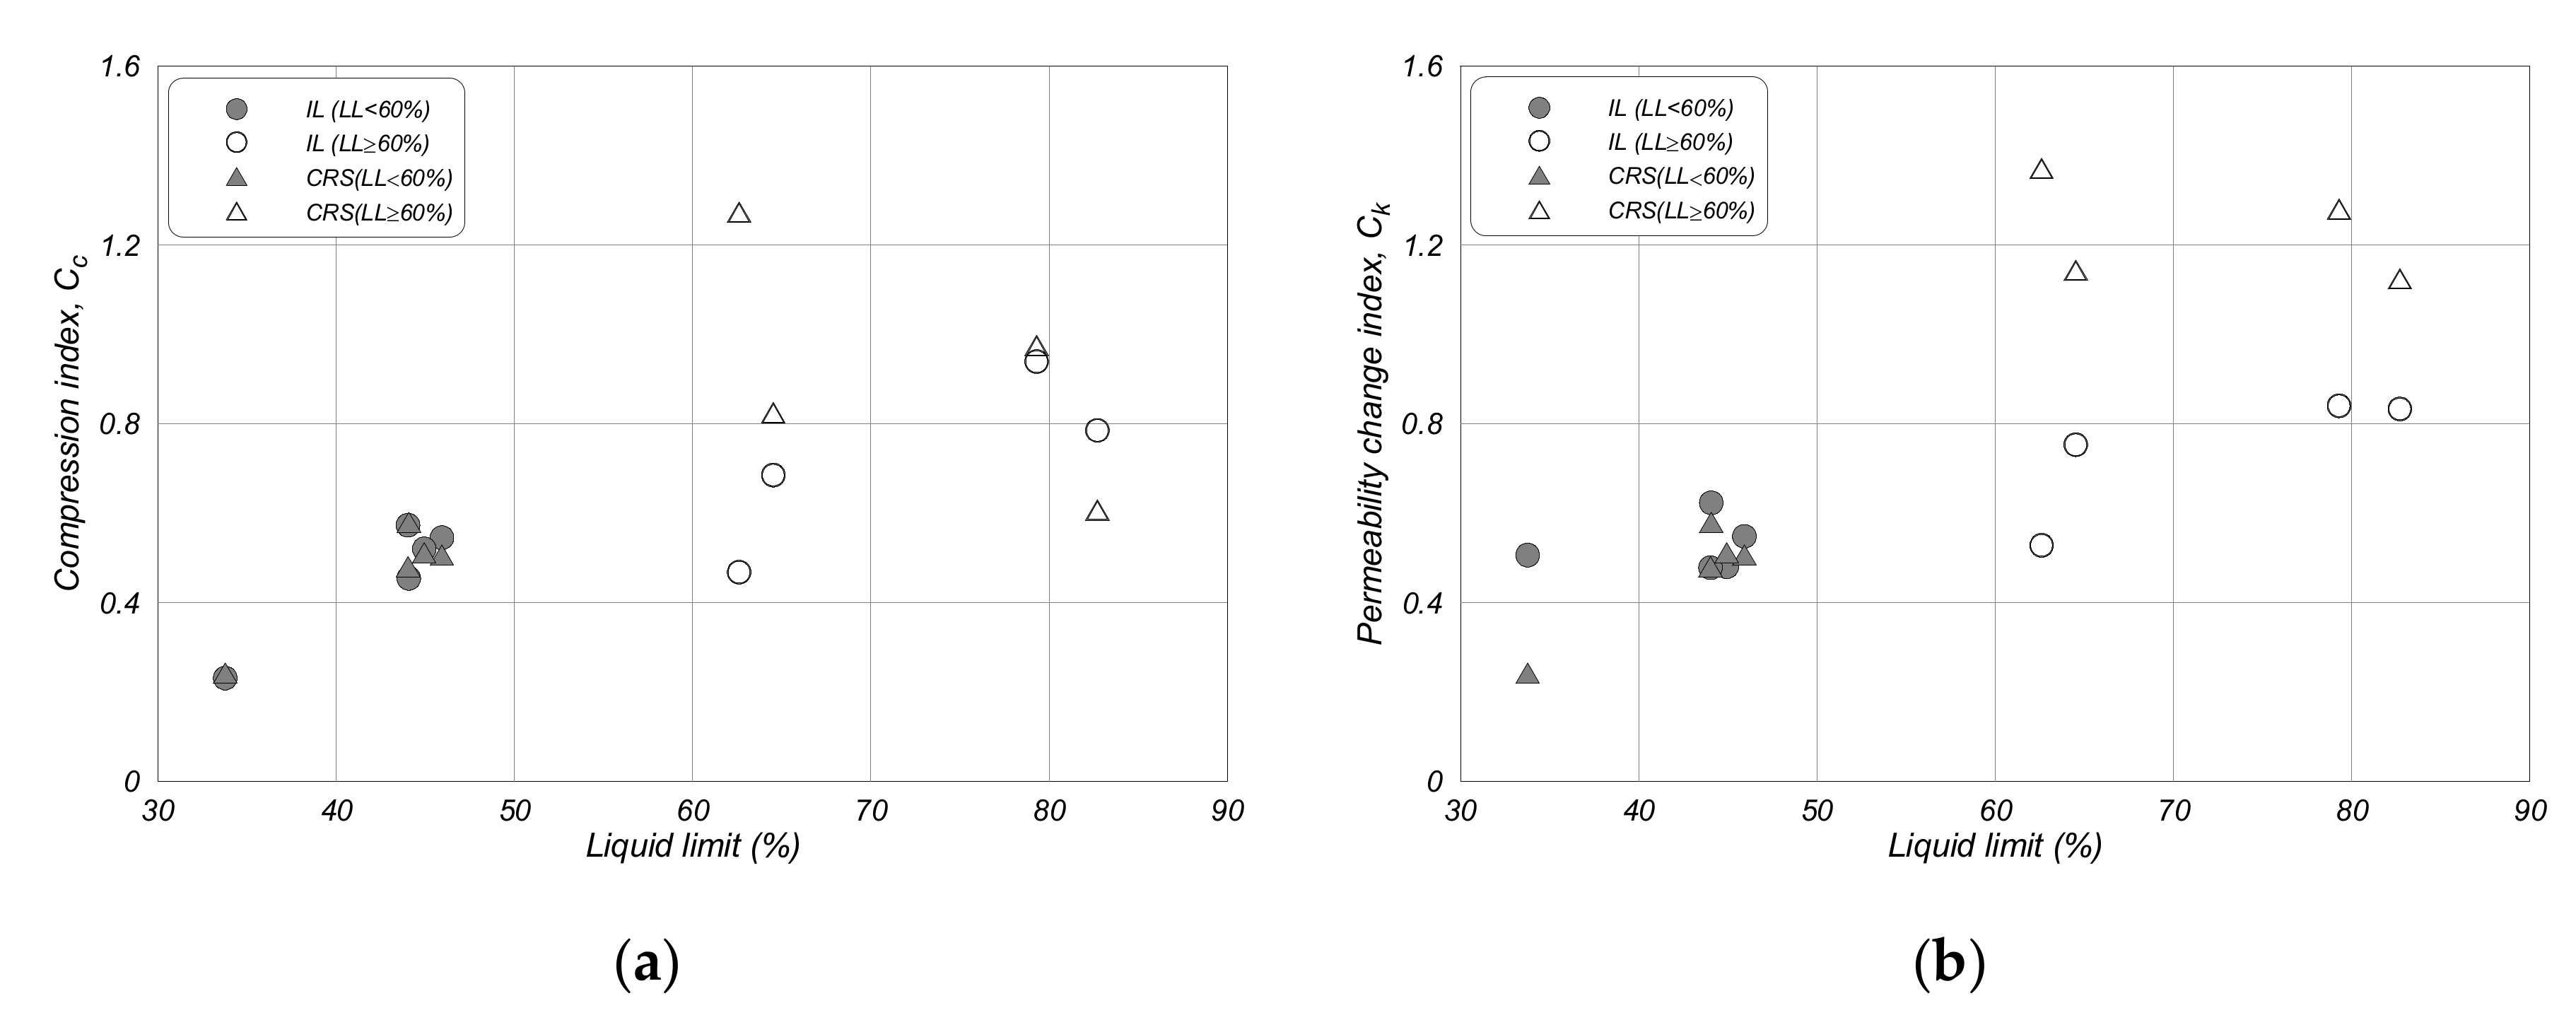
The clay showed a C
c of 0.231–0.939 and C
k of 0.478–0.840 during the IL test, and C
c of 0.242–1.273 and C
k of 0.518–1.371 during the CRS test, as shwon in
Figure 5. Hence, the Gwangyang region soil showed small ranges of C
c and C
k. This might be the reason why the Busan clay included more fine clay than the Gwangyang clay.
In the Gwangyang region soil, specimens such as gy-a to gy-e with LL > 60% showed high clay particle content, high plastic index, high compression, and low permeability than the specimens with LL < 60%. Therefore, the Gwangyang region dredged soil can be separated reasonably using the criteria of liquid limit (LL = 60%) in the same way as the Busan region dredged soil. The clay with LL < 60% was named the Gwangyang-L marine clay and the clay with LL ≥ 60% was named the Gwangyang-H marine clay.
2.2.3. Incheon Region
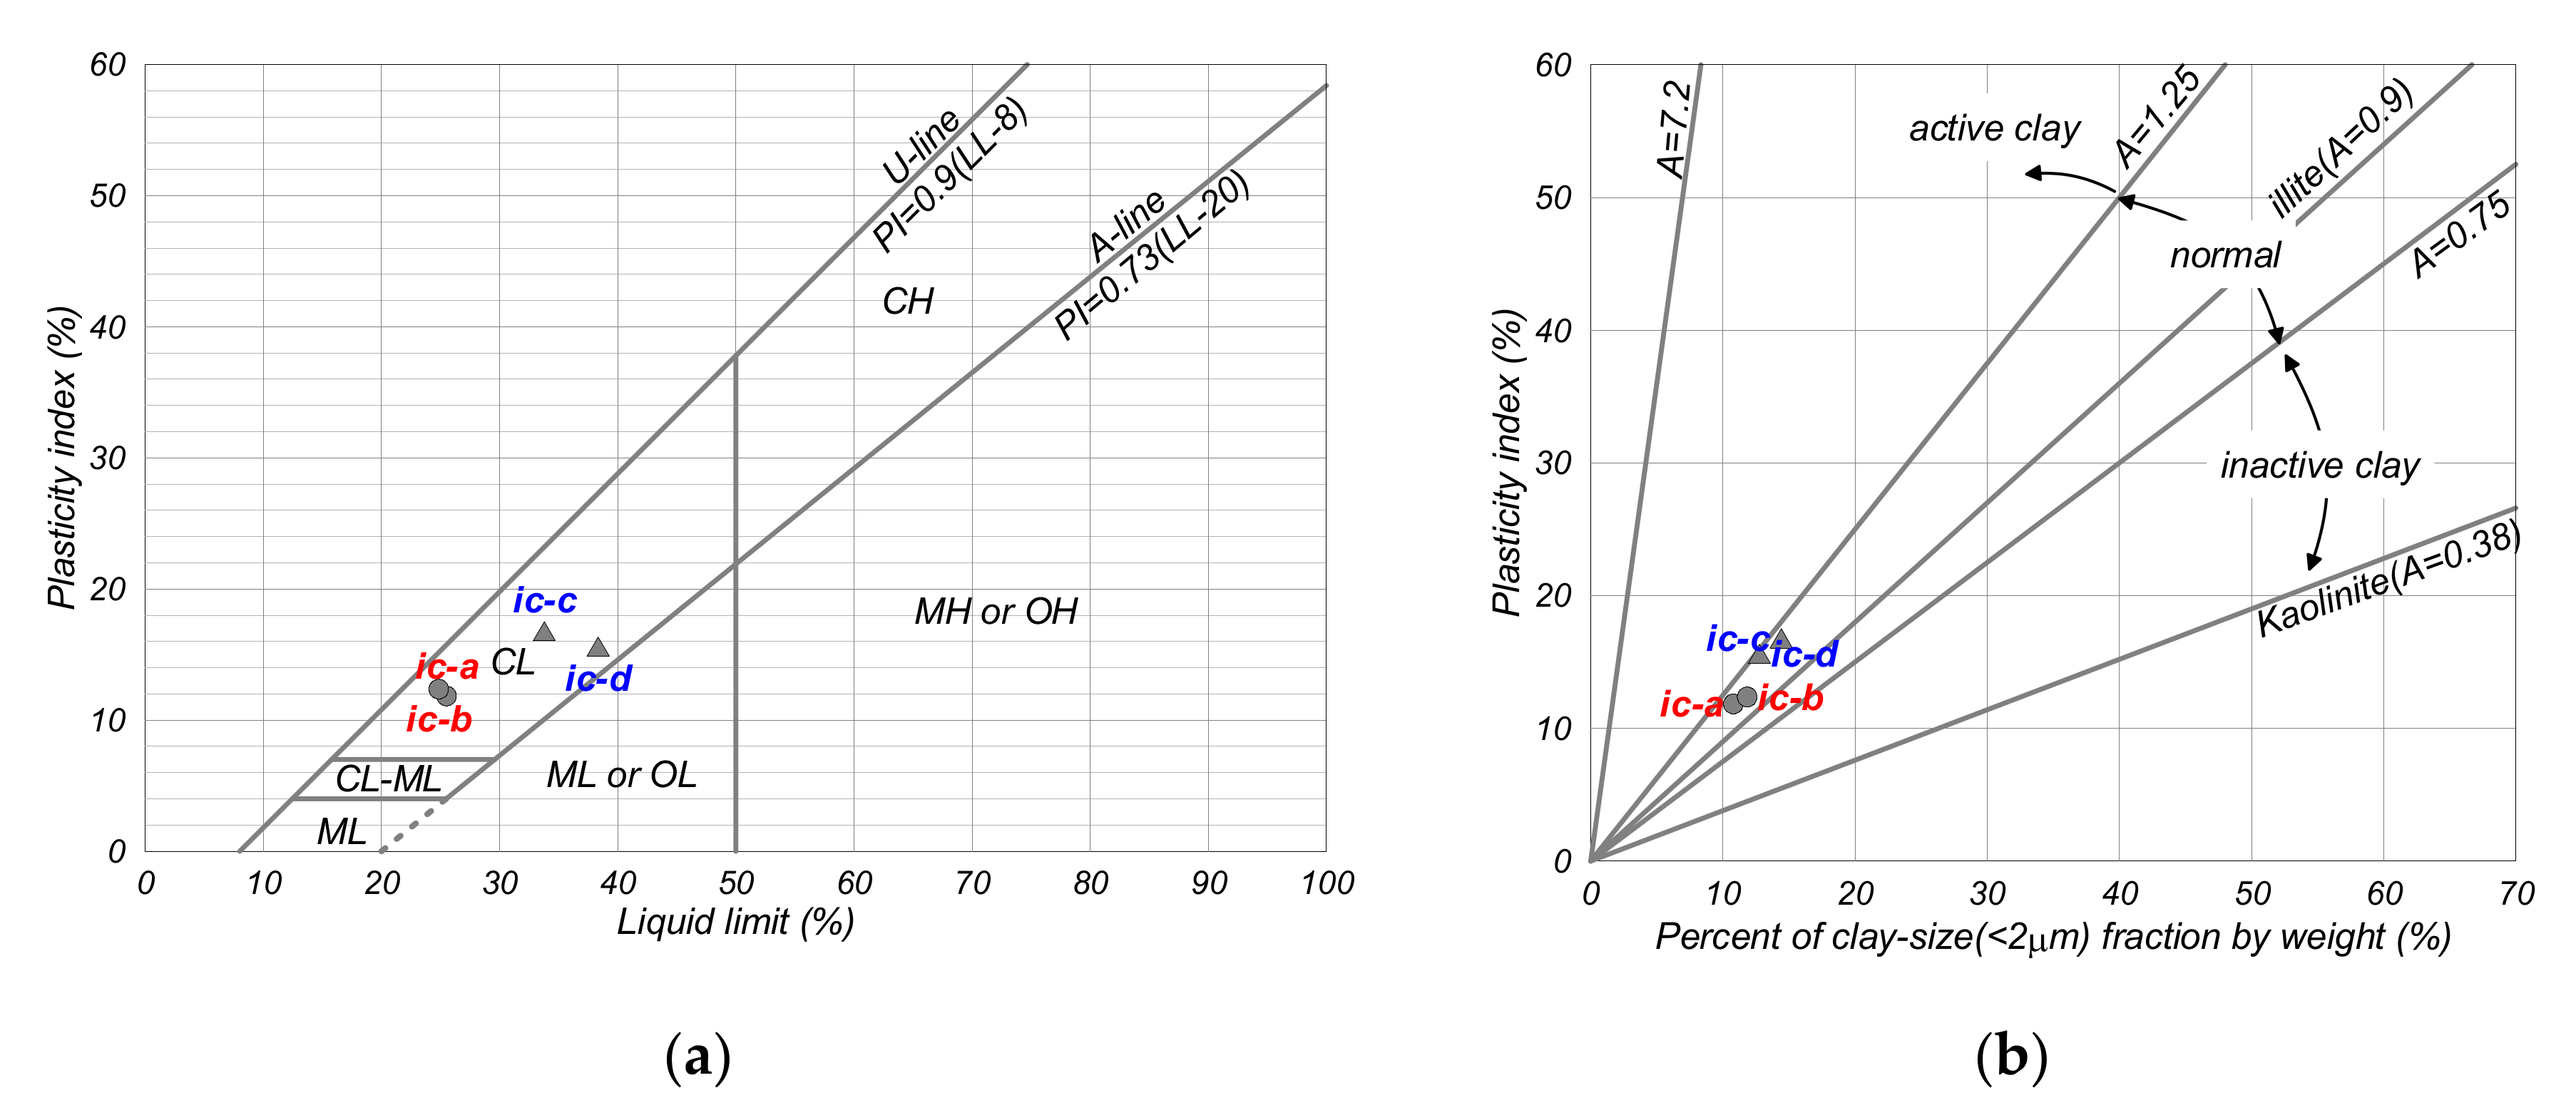
The Incheon region soil analyzed from four sites shown in
Table 1 had the specific gravity, plastic limit, liquid limit, and plastic index of 2.693–2.713 (avg. 2.703), 12.48–22.74% (avg. 16.48%), 24.86–38.34% (avg. 30.62%), and 11.84–16.78% (avg. 14.15%), respectively. The sand particle content, silt particle content, and clay particle content for the Incheon region soil were 4.59–8.78%, 79.38–84.41%, and 10.79–14.42%. The activity with a range of 1.04–1.22 and average of 1.13 lies in the normal area, as shown in
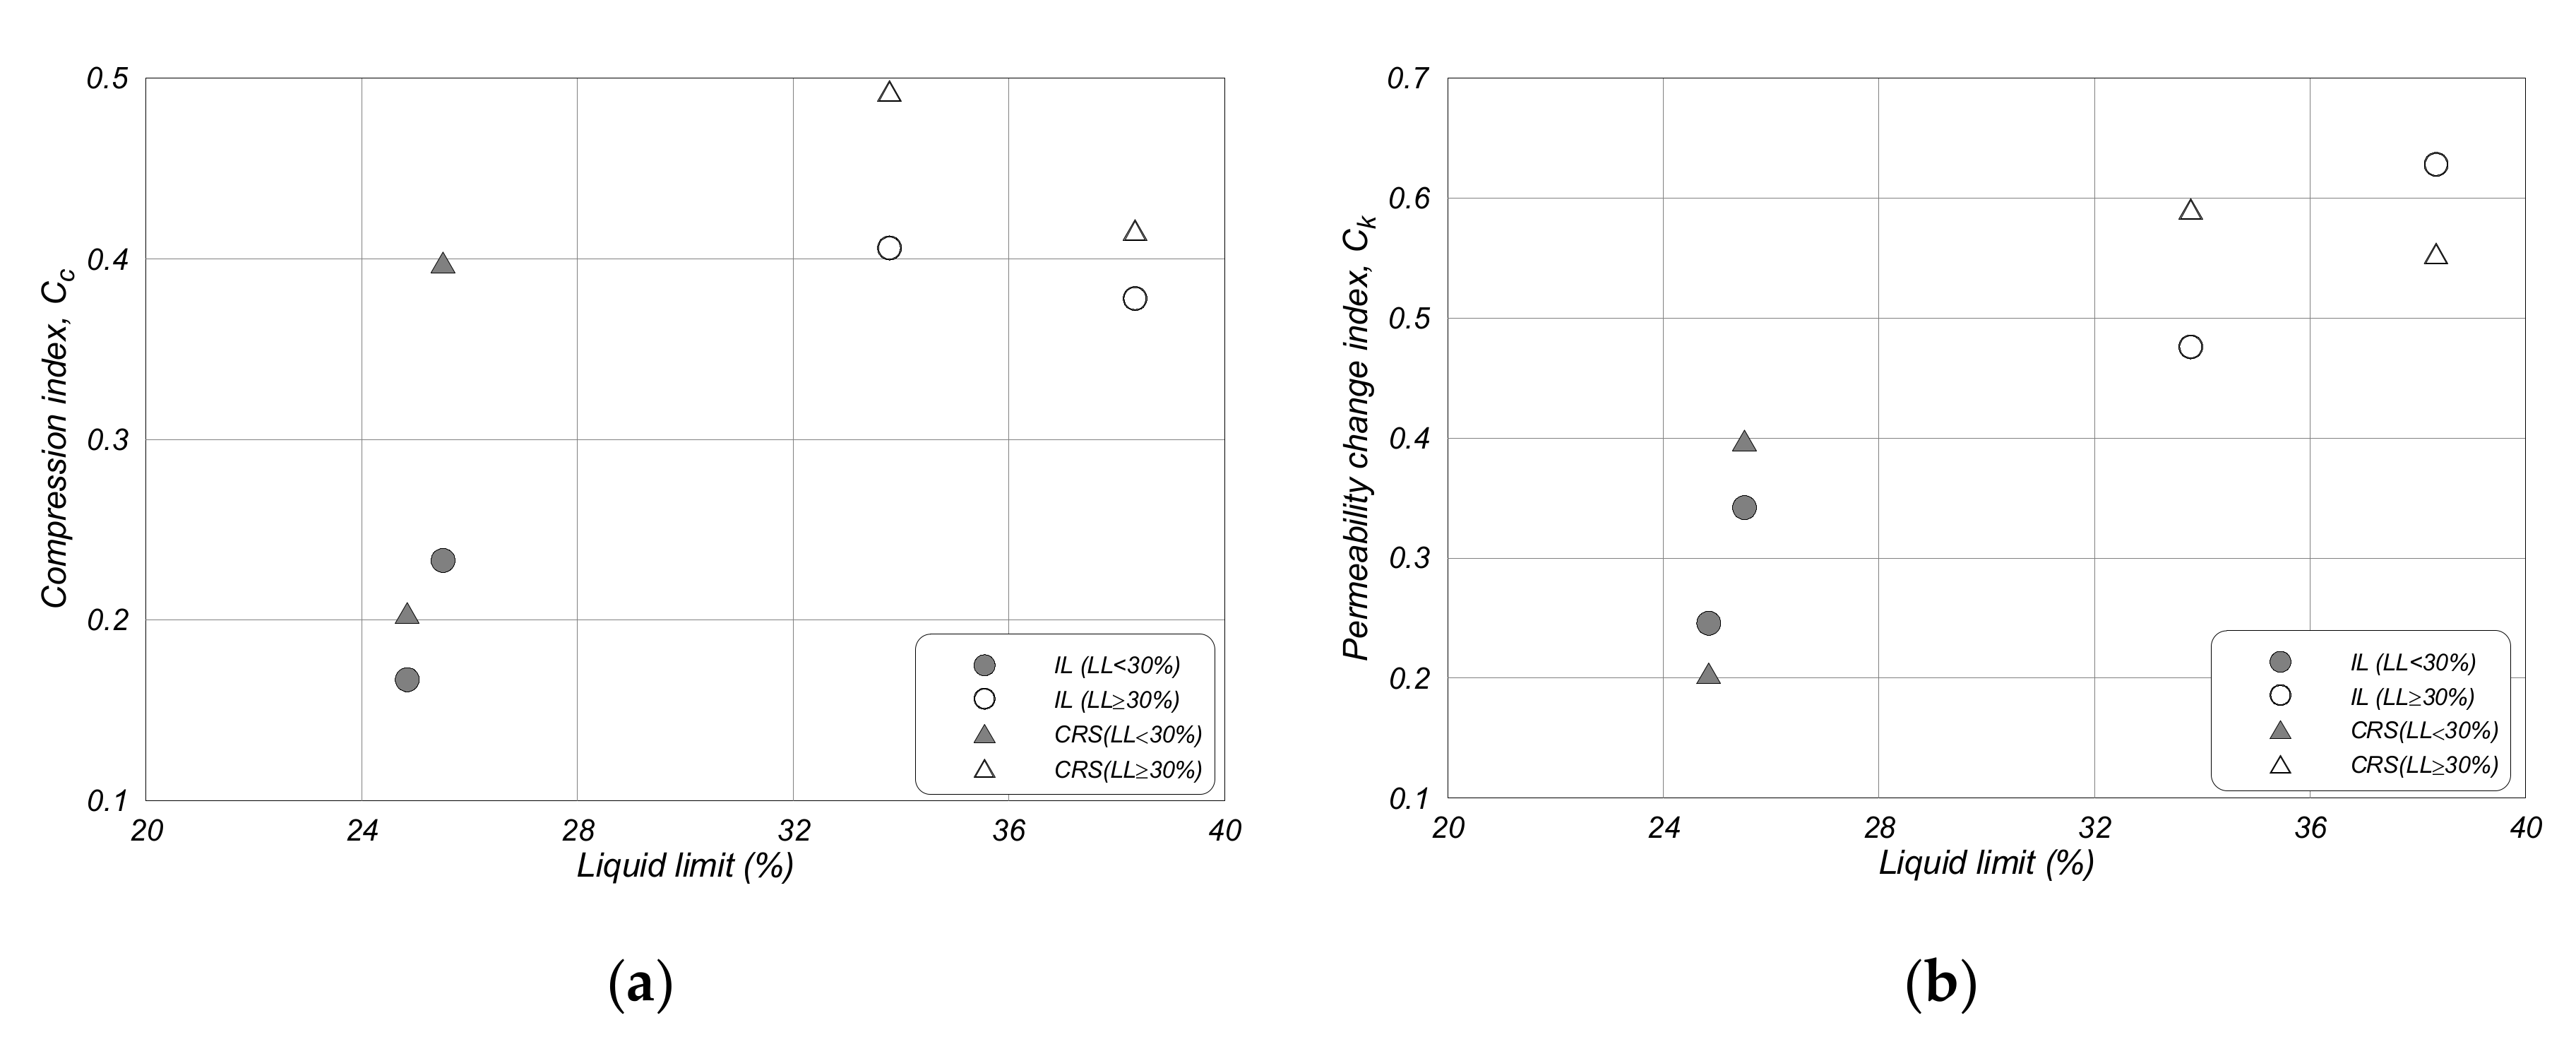
Figure 6. The consolidation properties were analyzed with C
c = 0.167–0.406 and C
k = 0.246–0.628 during the oedometer test, and C
c = 0.204–0.493 and C
k = 0.380–0.791 during the CRS test, as shown in
Figure 7.
The Incheon region soil had lower liquid and plastic limits than the Busan and Gwangyang region soils. The liquid limit was 30.12% less than that of Busan clay and 25.15% less than that of the Gwangyang clay. The plastic index was less than 17.5 compared to the Busan and Gwangyang clays. The results of the oedometer test show that Incheon clay exhibited a Cc = 0.31 and Ck = 0.246–0.628, which were less than those of the Busan and Gwangyang clays. That is, the Incheon region soil clearly showed low plasticity, small compressibility, and large permeability than the Busan and Gwangyang clays.
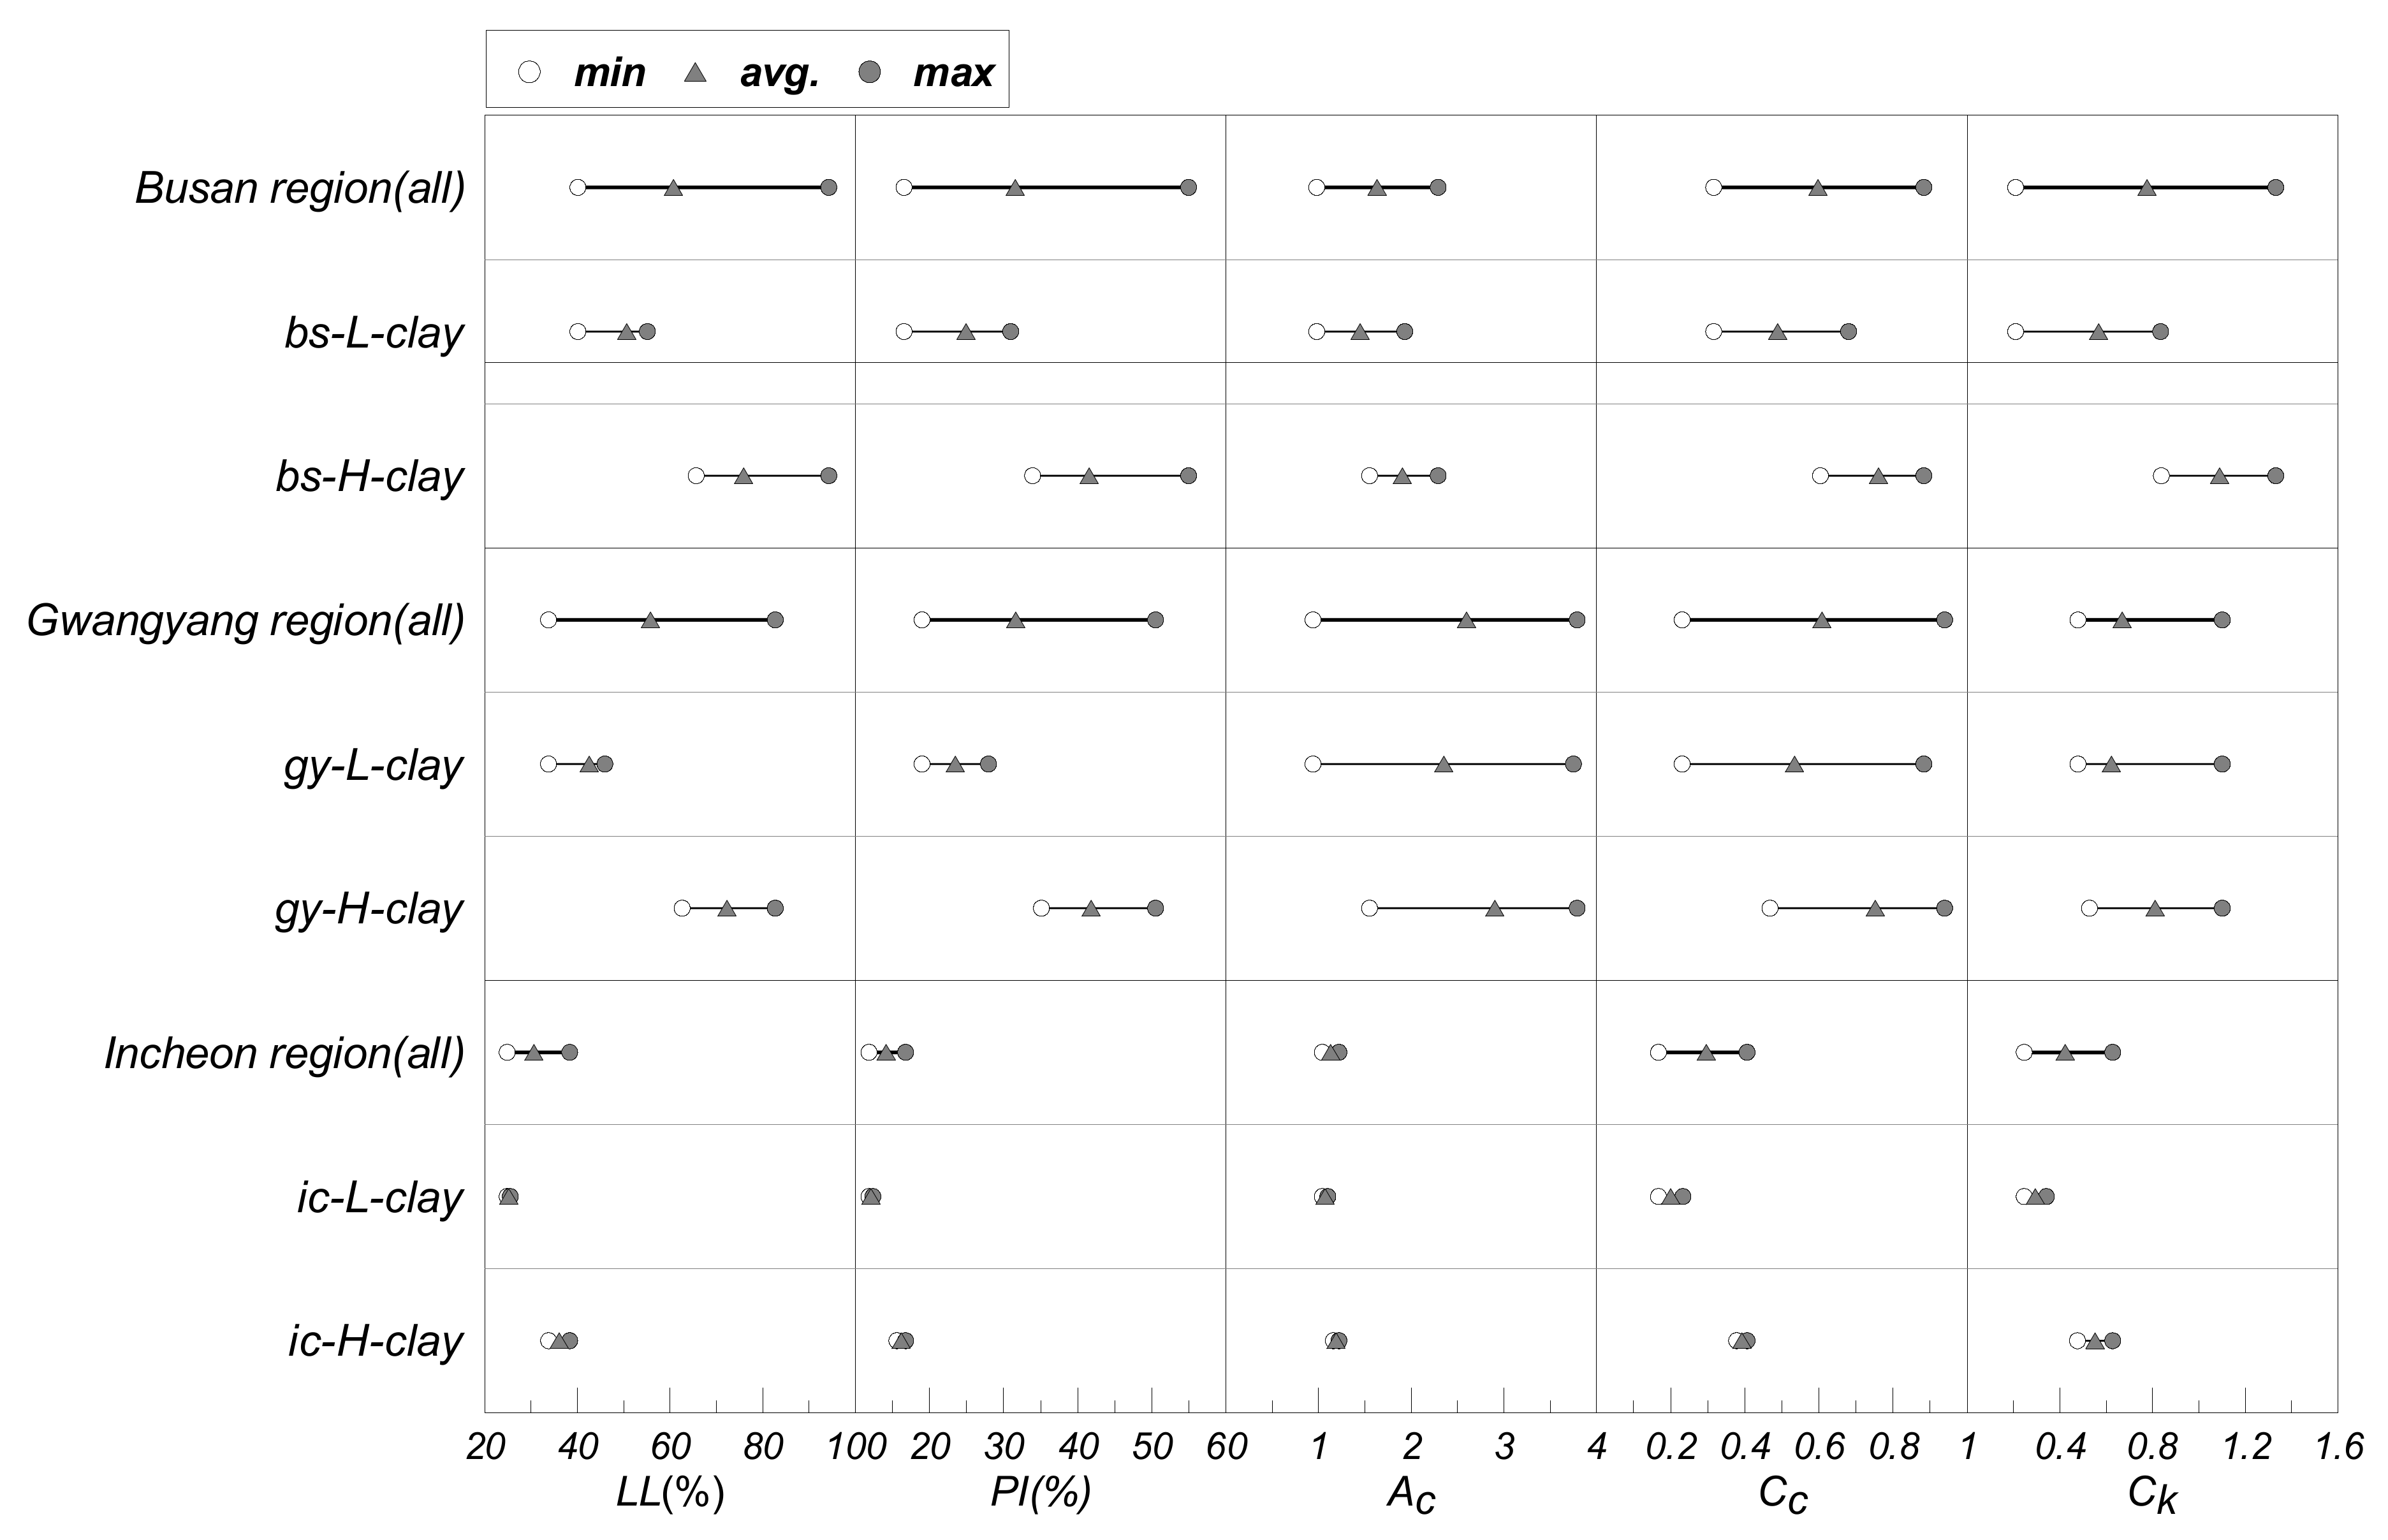
Furthermore, the Incheon region soil had different physical and compressive properties that were separated by the criteria of LL = 30% compared to the Busan and Gwangyang clays (LL = 60%). The ic-c and ic-d specimens with LL ≥ 30% had large fine particles, large compressibility, and small permeability compared to the ic-a and ic-b specimens with LL < 30%. Therefore, the Incheon region dredged soil can be separated reasonably using the criteria of liquid limit (LL = 30%). The clay with LL < 30% was named the Incheon-L marine clay and the clay with LL ≥ 30% was named the Incheon-H marine clay. Engineering properties of the marine soft soil were classified by liquid limits and are summarized in
Figure 8.
3. Relationships between Void Ratio–Effective Stress and Permeability
3.1. Estimation of Non-Linear Constitution Equation
The dredged-reclaimed clay with a high void ratio should be estimated using finite strain consolidation theory due to huge deformations. The finite strain consolidation is suitable to analyze large deformations, considering the variation in the compressibility and permeability of clay as per effective stress. The variation in compressibility and permeability depend on the relationship void ratio (e)–effective stress (σ’)–permeability coefficient (k) during analysis, and this relationship is called the constitutive relationship of finite strain consolidation theory [
13,
14]. The constitutive relationship between void ratio–effective stress and void ratio–permeability is examined in this section to choose a suitable constitutive relationship equation in Korea.
The constitutive relation equations were mostly the proposed exponential function and power function. Somogyi [
8,
9] proposed Equations (1) and (2) of the power function using the empirical data of void ratio–effective stress and void ratio–permeability:
where A, B, C, and D are the decided coefficients including the material properties observed during the test or empirical study. These equations were used in this study due to the following three considerations. First, there should be an equation that was proposed from research on Korean clay. Second, there should be an equation that represents a reasonable relationship between the void ratio–effective stress and void ratio–permeability coefficient in the high void ratio range. Finally, there should be a simple equation to propose a design chart.
3.2. Back Analysis of Constitutive Relationship Equation through Centrifugal Experiment
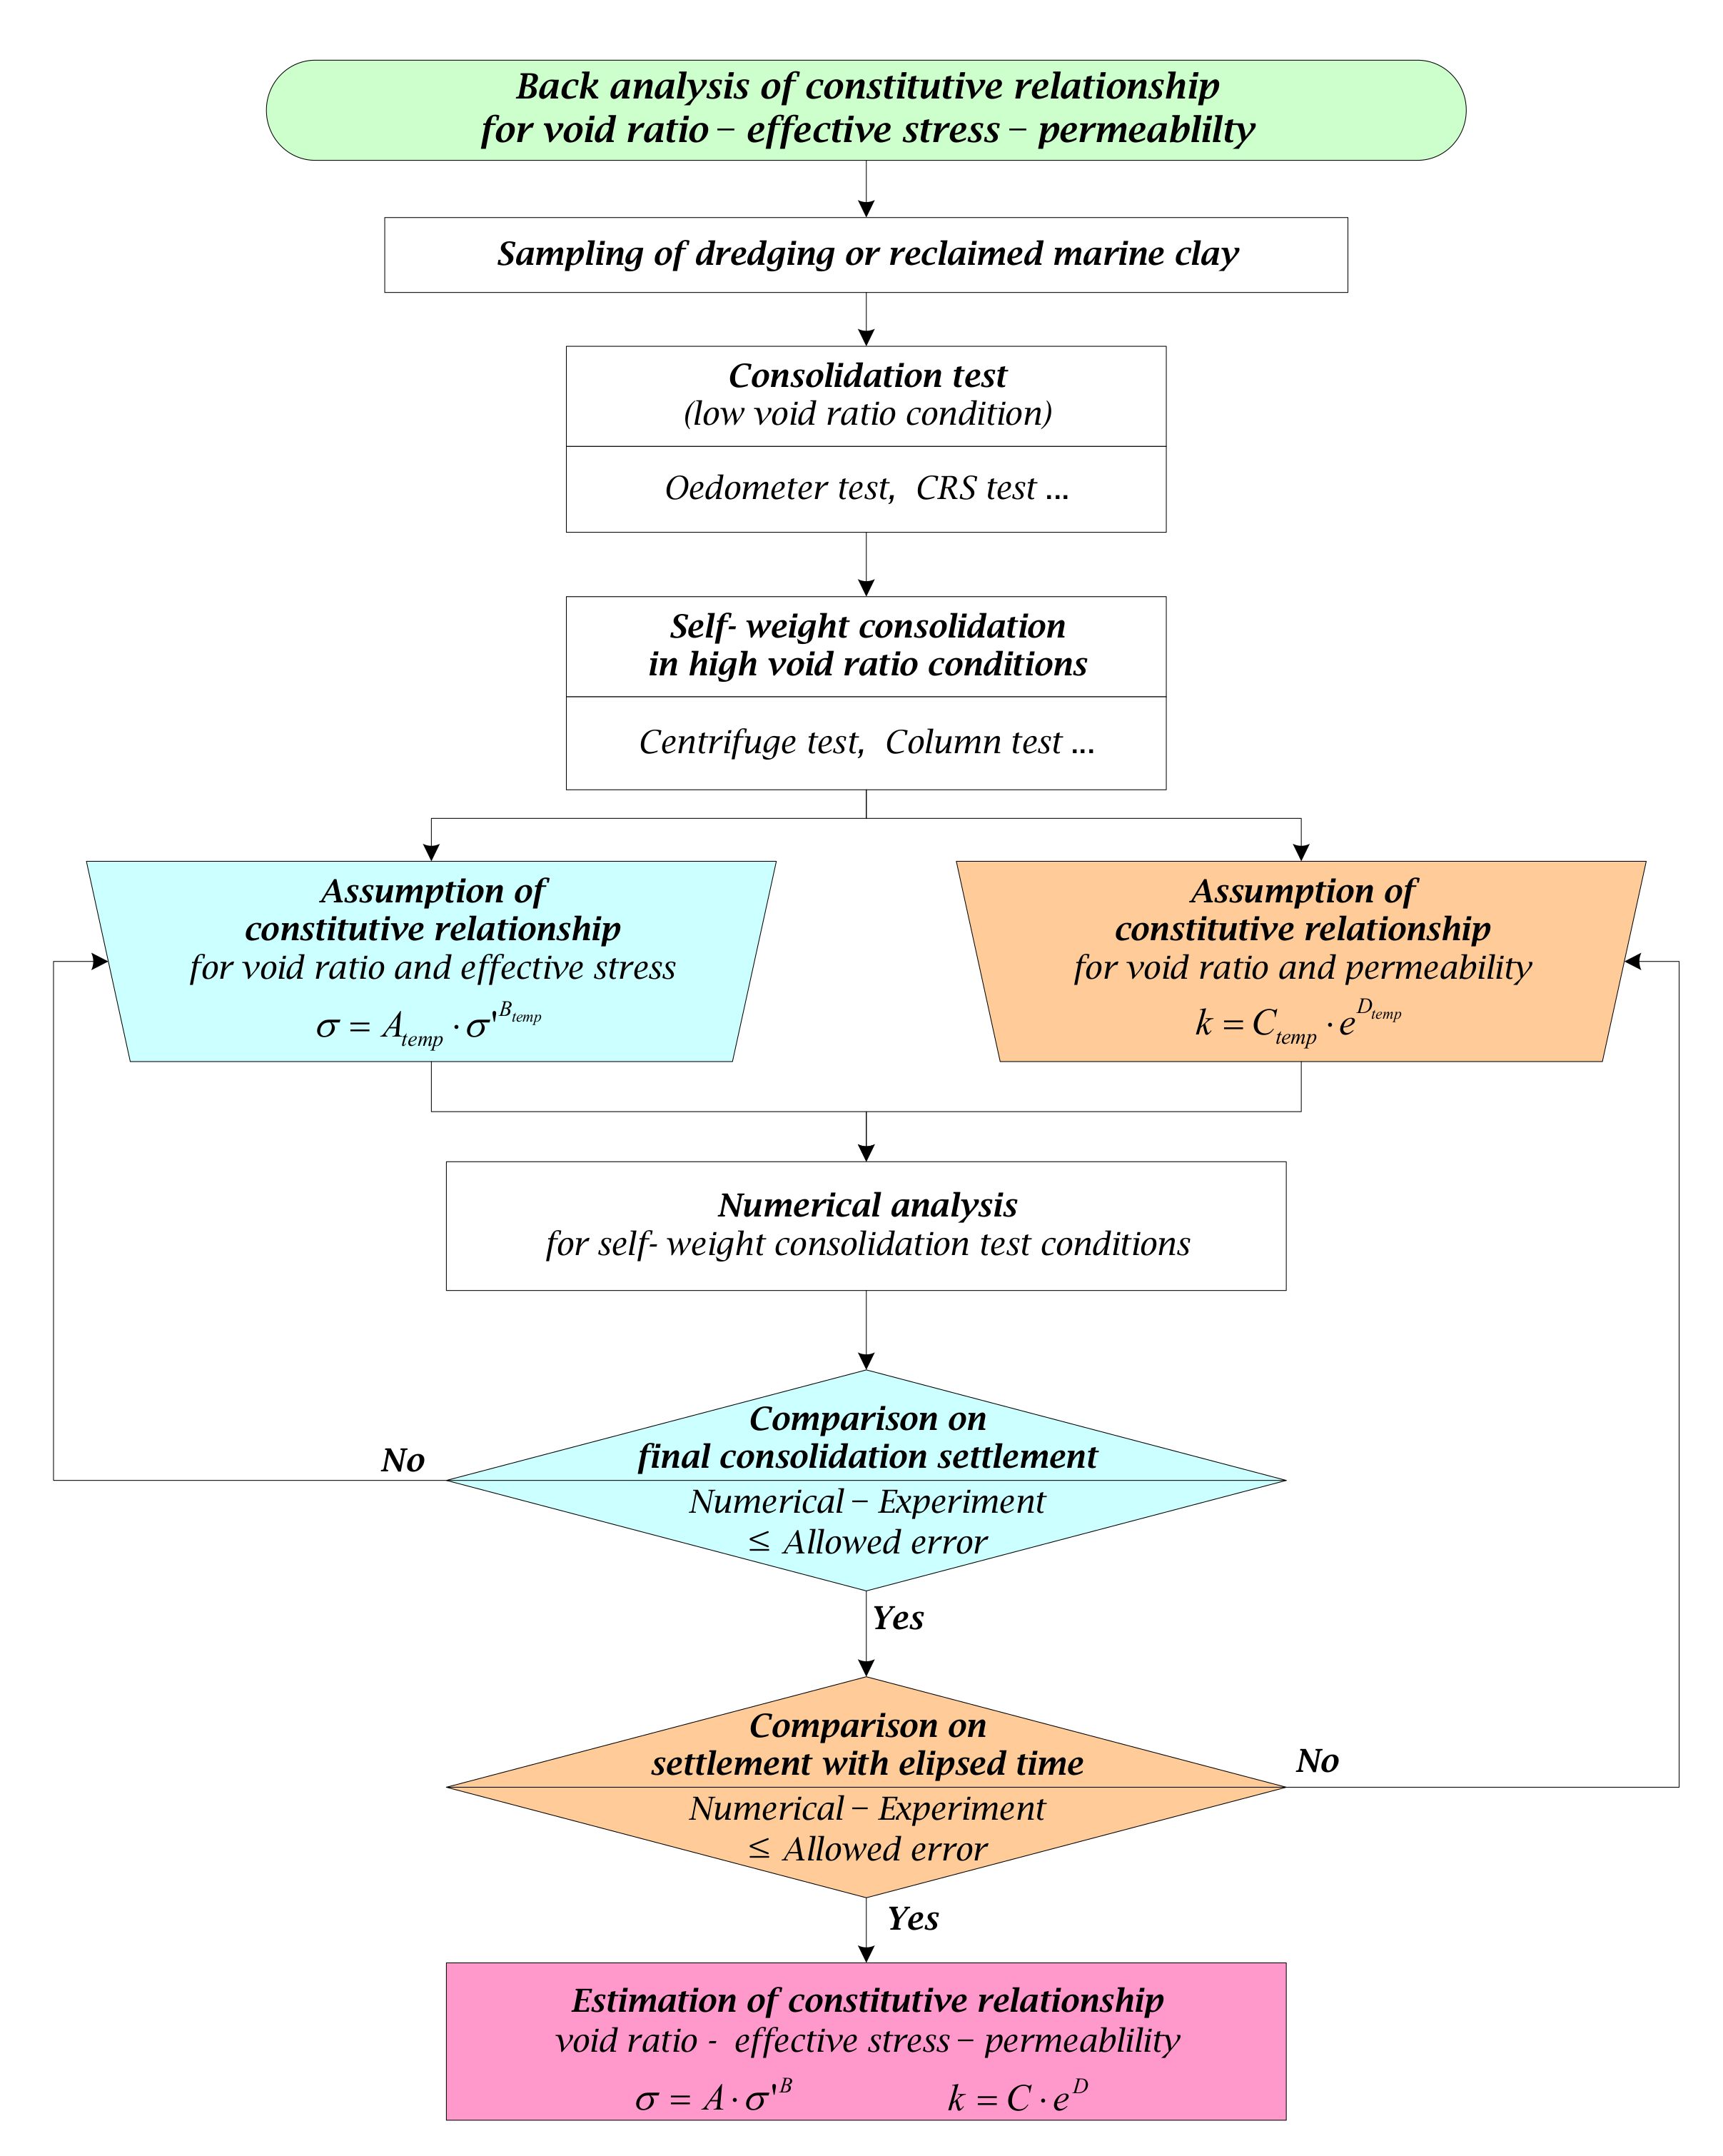
The centrifugal test is applied to carry out a one day long self-weight consolidation of dredged/reclaimed clay in foreign and domestic scenarios because it can surmount the limitations of consolidation time and initial height through a back-analysis study using the time-settlement results of the test. The back analysis using the centrifugal experiment is explained as a flowchart in
Figure 9. The equipment used for the centrifuge test in this study was from the Kangwon National University in Korea. The centrifugal experiment was carried out 2–4 times under different initial void ratio and height conditions for each specimen, and then a constitutive relationship equation was estimated through the back analysis from the experimental results. The experimental conditions such as test number, gravity acceleration, initial void ratio, and constitutive relationship equations analyzed by the back analysis for each region specimen are shown in
Table 2. Numerical analysis for the self-weight consolidation test in the flowchart was performed by the microcomputer program ‘Primary Consolidation, Secondary Compression, and Desiccation of Dredged Fill’ (PSDDF) by Stark et al. [
3,
4].
4. Proposed Constitutive Relationship Equation for Each Region
4.1. Representative Constitutive Relationship Equation for Each Region
The constitutive relationship equations for a total of 23 dredged clay specimens from three regions and six groups were obtained through back analysis and the results of the centrifugal experiments. The equation of the power function is shown on a log–log scale and is the deduced representative equation for each of the six groups. The units of the constitutive equation are kPa of effective stress and m/day of permeability coefficient.
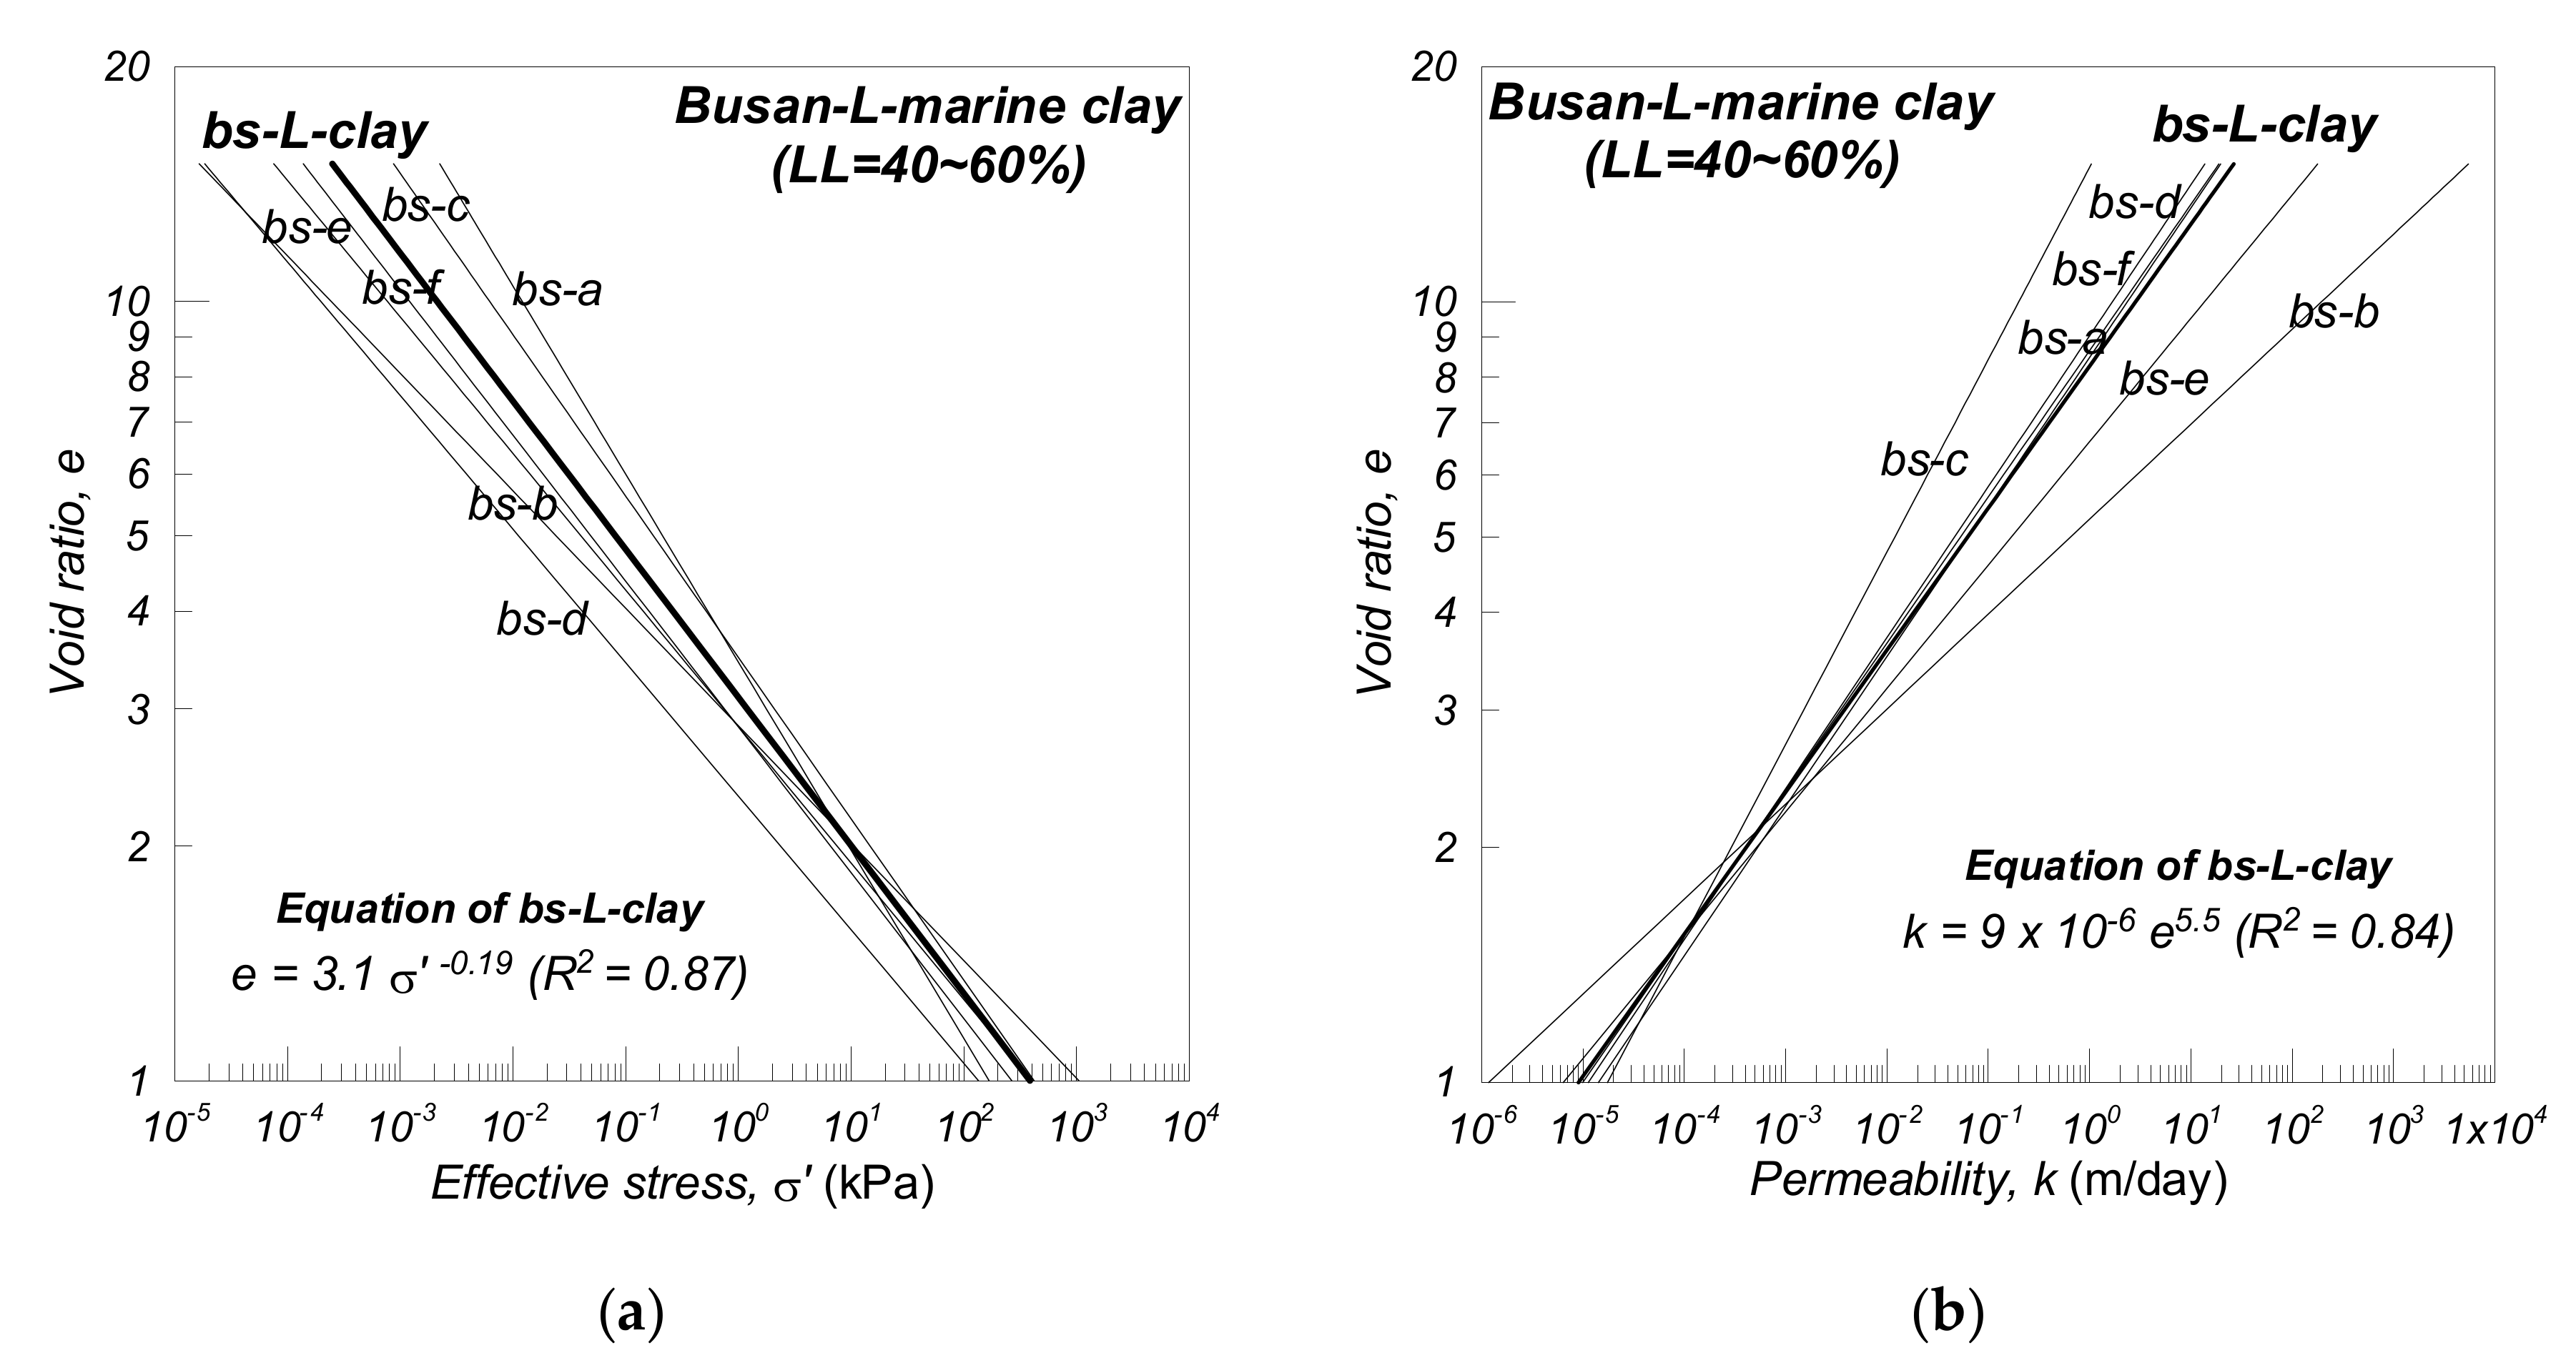
The Busan-L marine clay (Busan marine clays with low liquid limit) with a liquid limit in the 40–60% range in the Busan region dredged clay was analyzed using six specimens (bs-a, b, c, d, e, f). A constitutive relationship equation for the six specimens is shown in
Figure 10 of the log–log scale. The representative constitutive relationship equation (bs-L-clay) of Busan-L marine clay can be expressed as
and
(A = 3.1, B = −0.19, C = 9 × 10
−6, D = 5.5) using the arithmetic mean on the log–log plot, as shown in
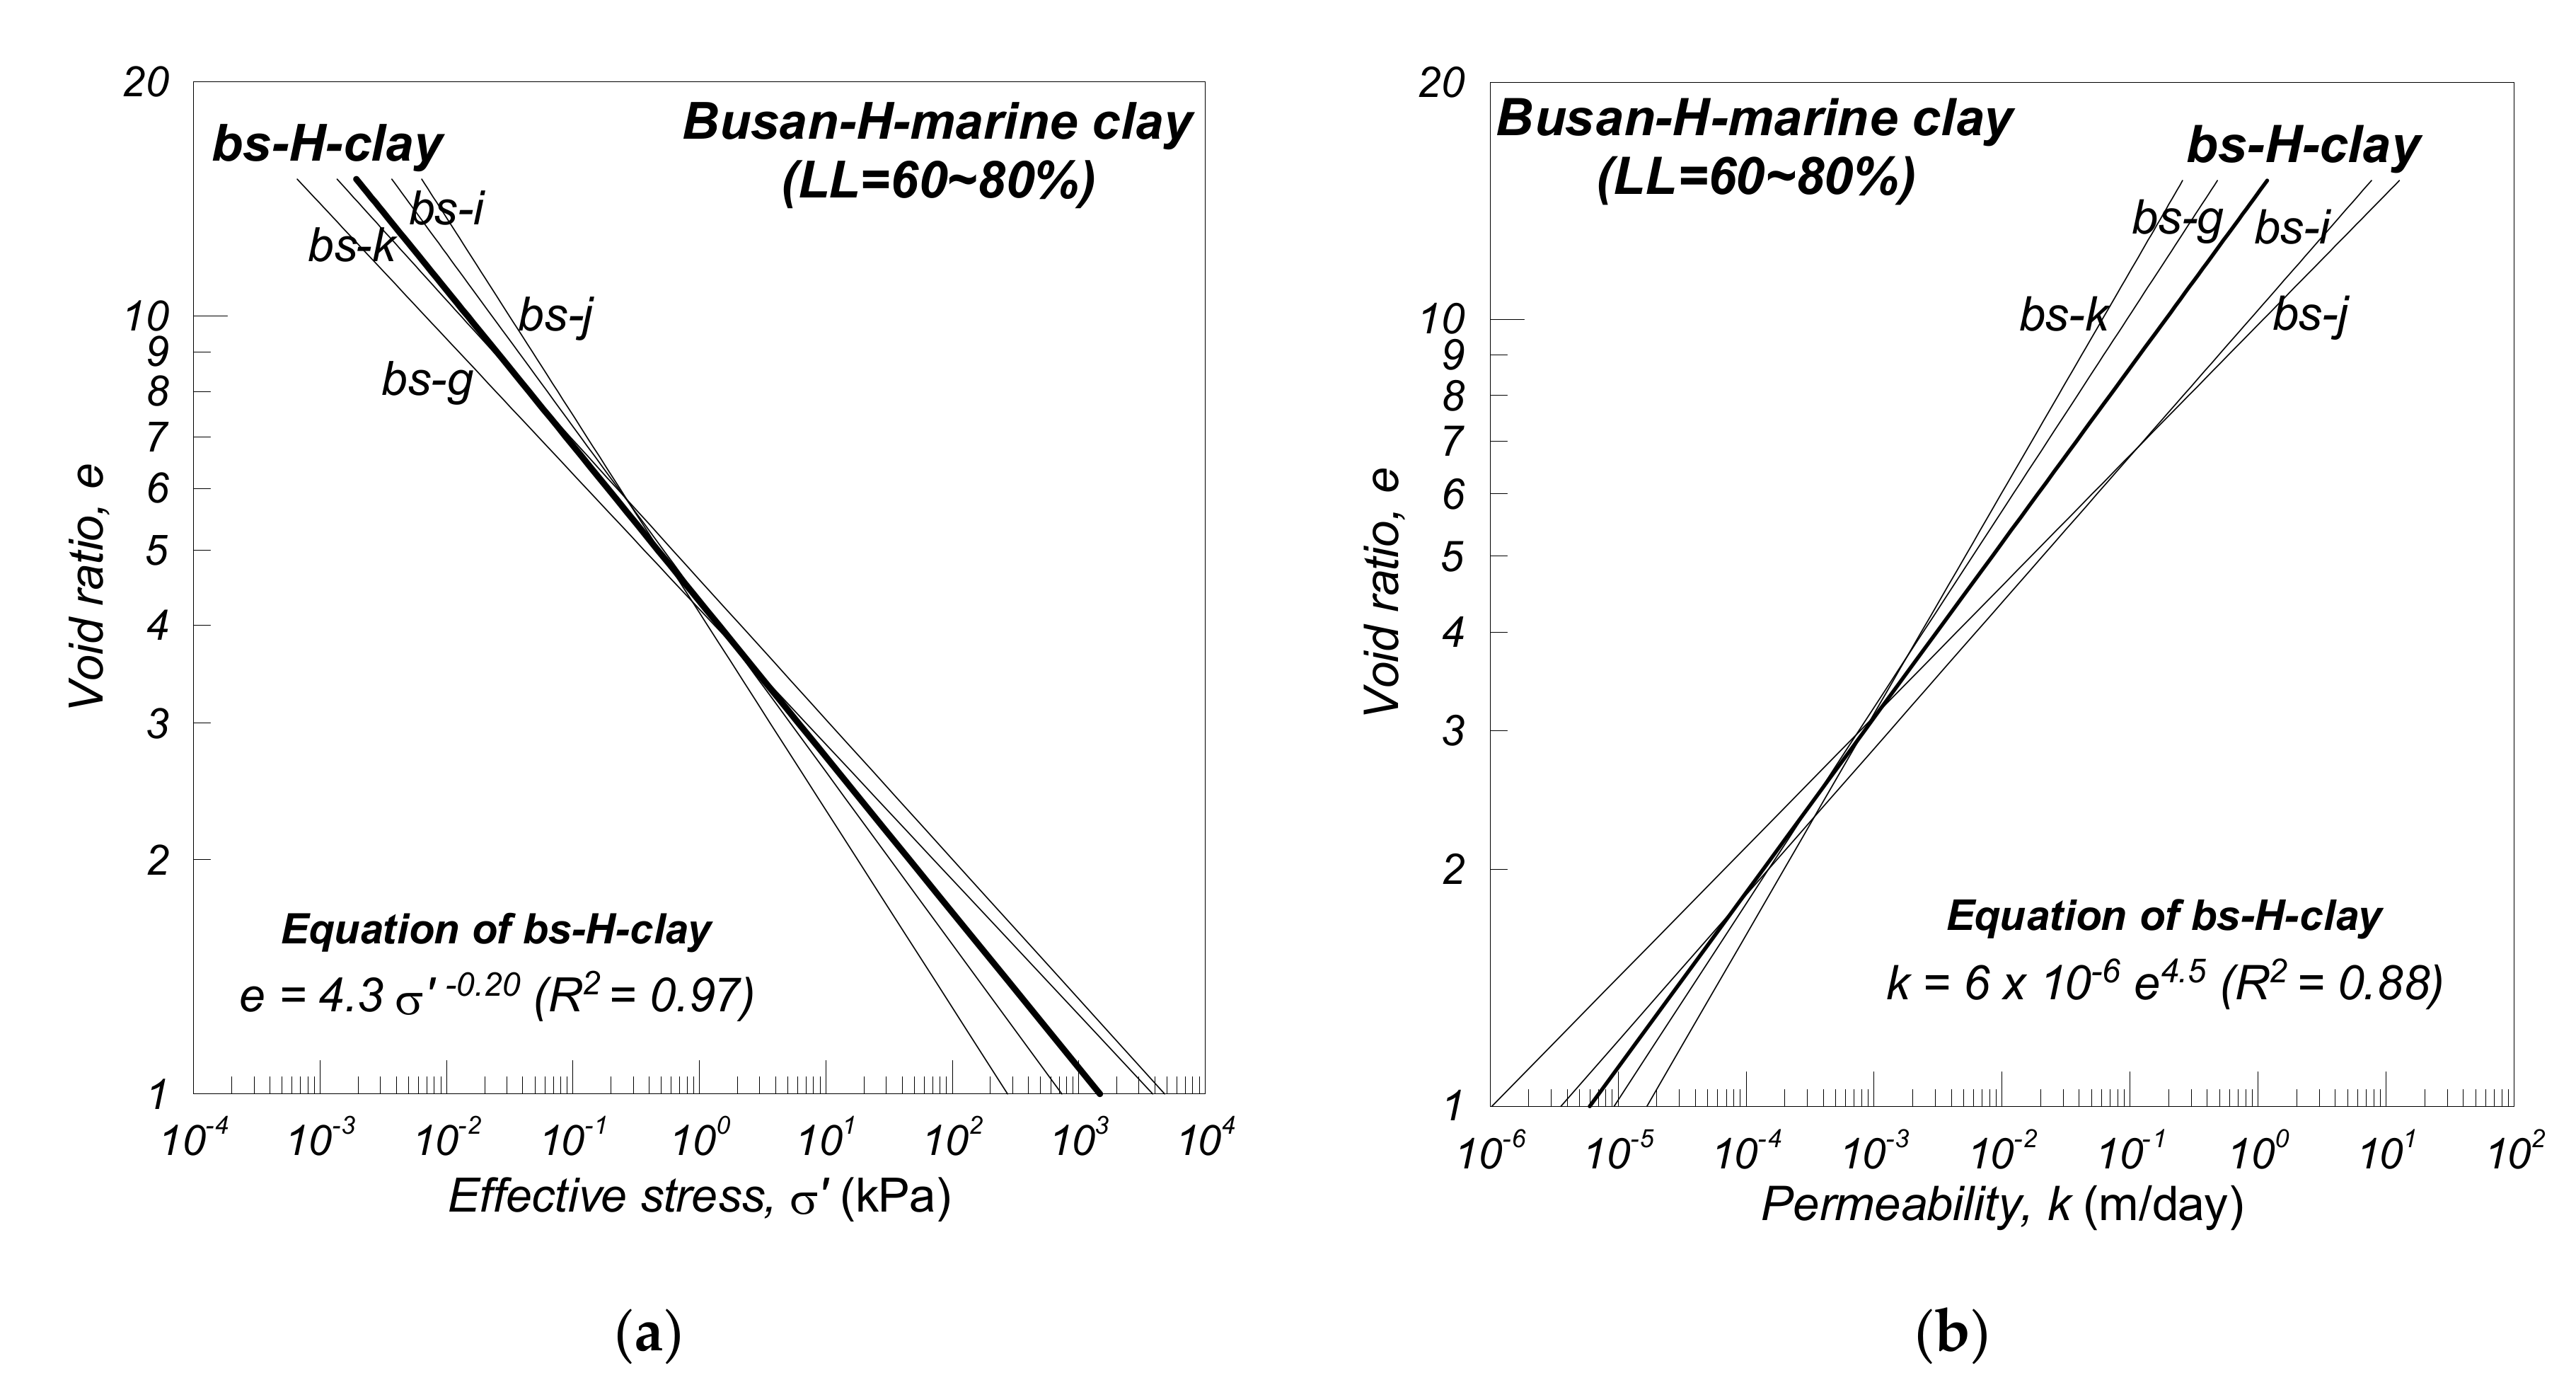
Figure 10. The representative constitutive relationship equations of Busan-L marine clay had the coefficient of determination of 0.87 on void ratio–effective stress and 0.84 on void ratio–permeability. The Busan-H marine clay had a high liquid limit (LL = 60–80%) and was analyzed using four specimens (bs-g~k), as shown in
Figure 11. The representative constitutive relationship equations of Busan-H clay (bs-H-clay) can be expressed as
and
, and had the coefficient of determination of 0.97 on void ratio–effective stress and 0.88 on void ratio–permeability.
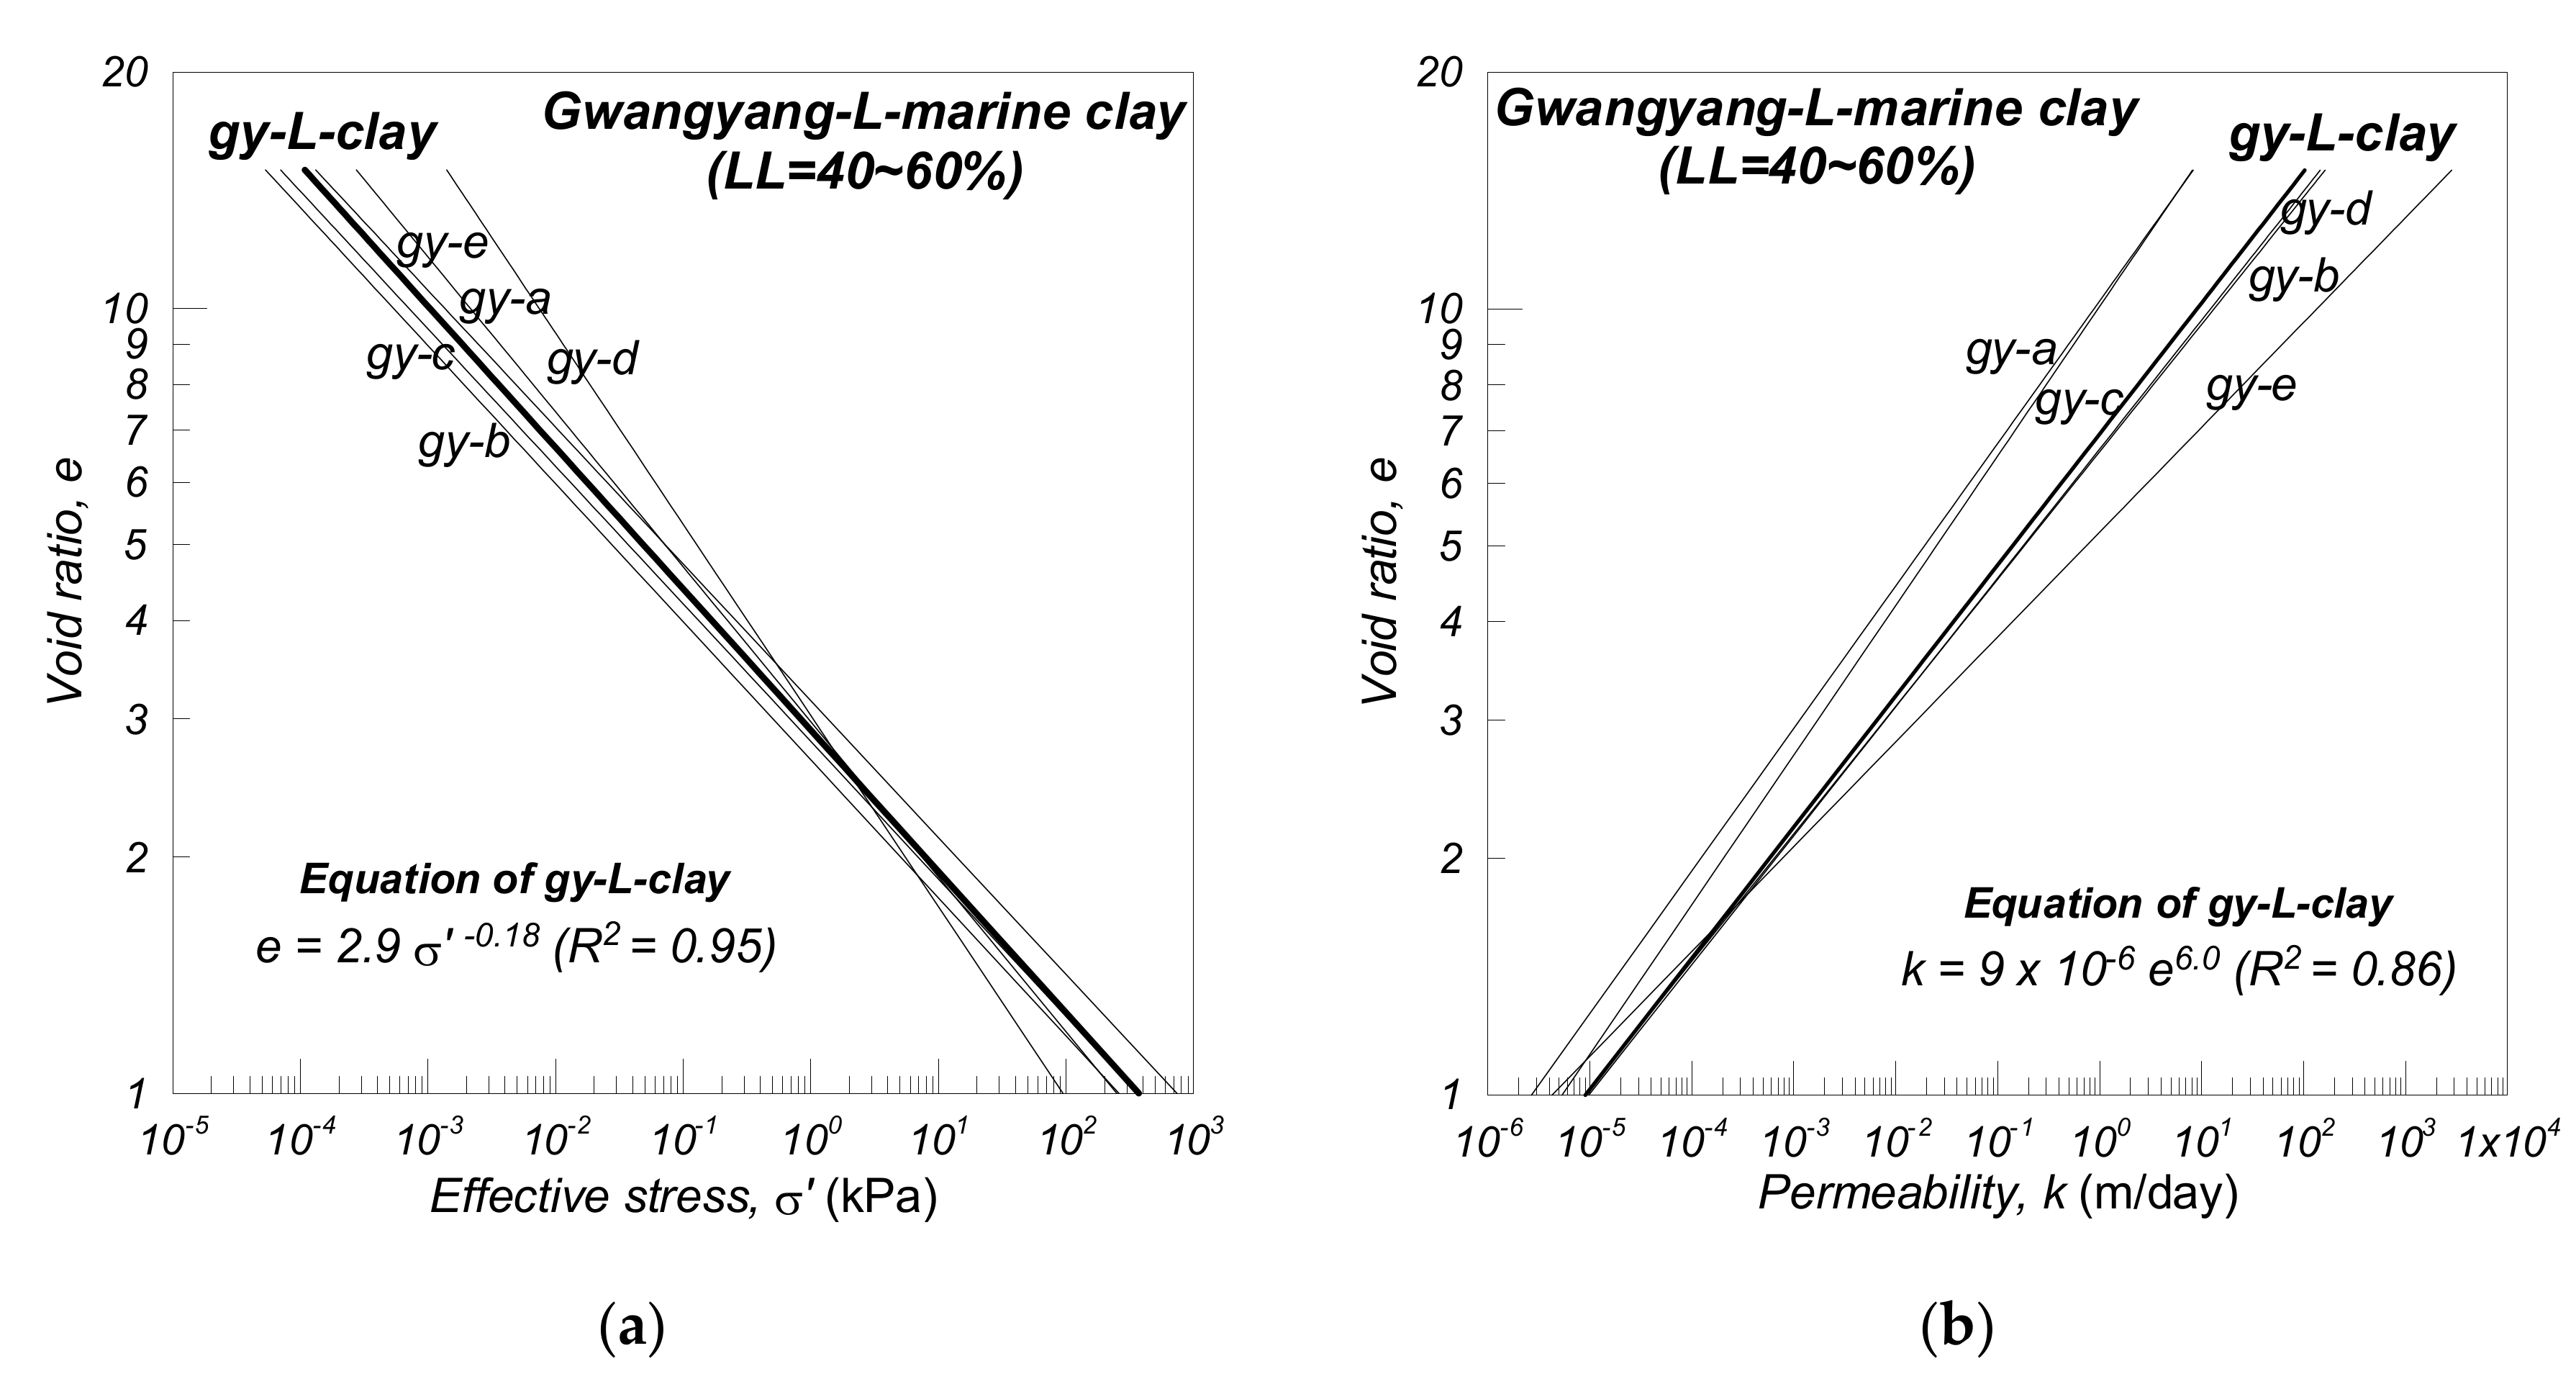
The Gwangyang-L marine clay with LL = 40–60% and the representative constitutive equation (gy-L-clay) of
and
was analyzed using five specimens (gy-a~e), as shown in
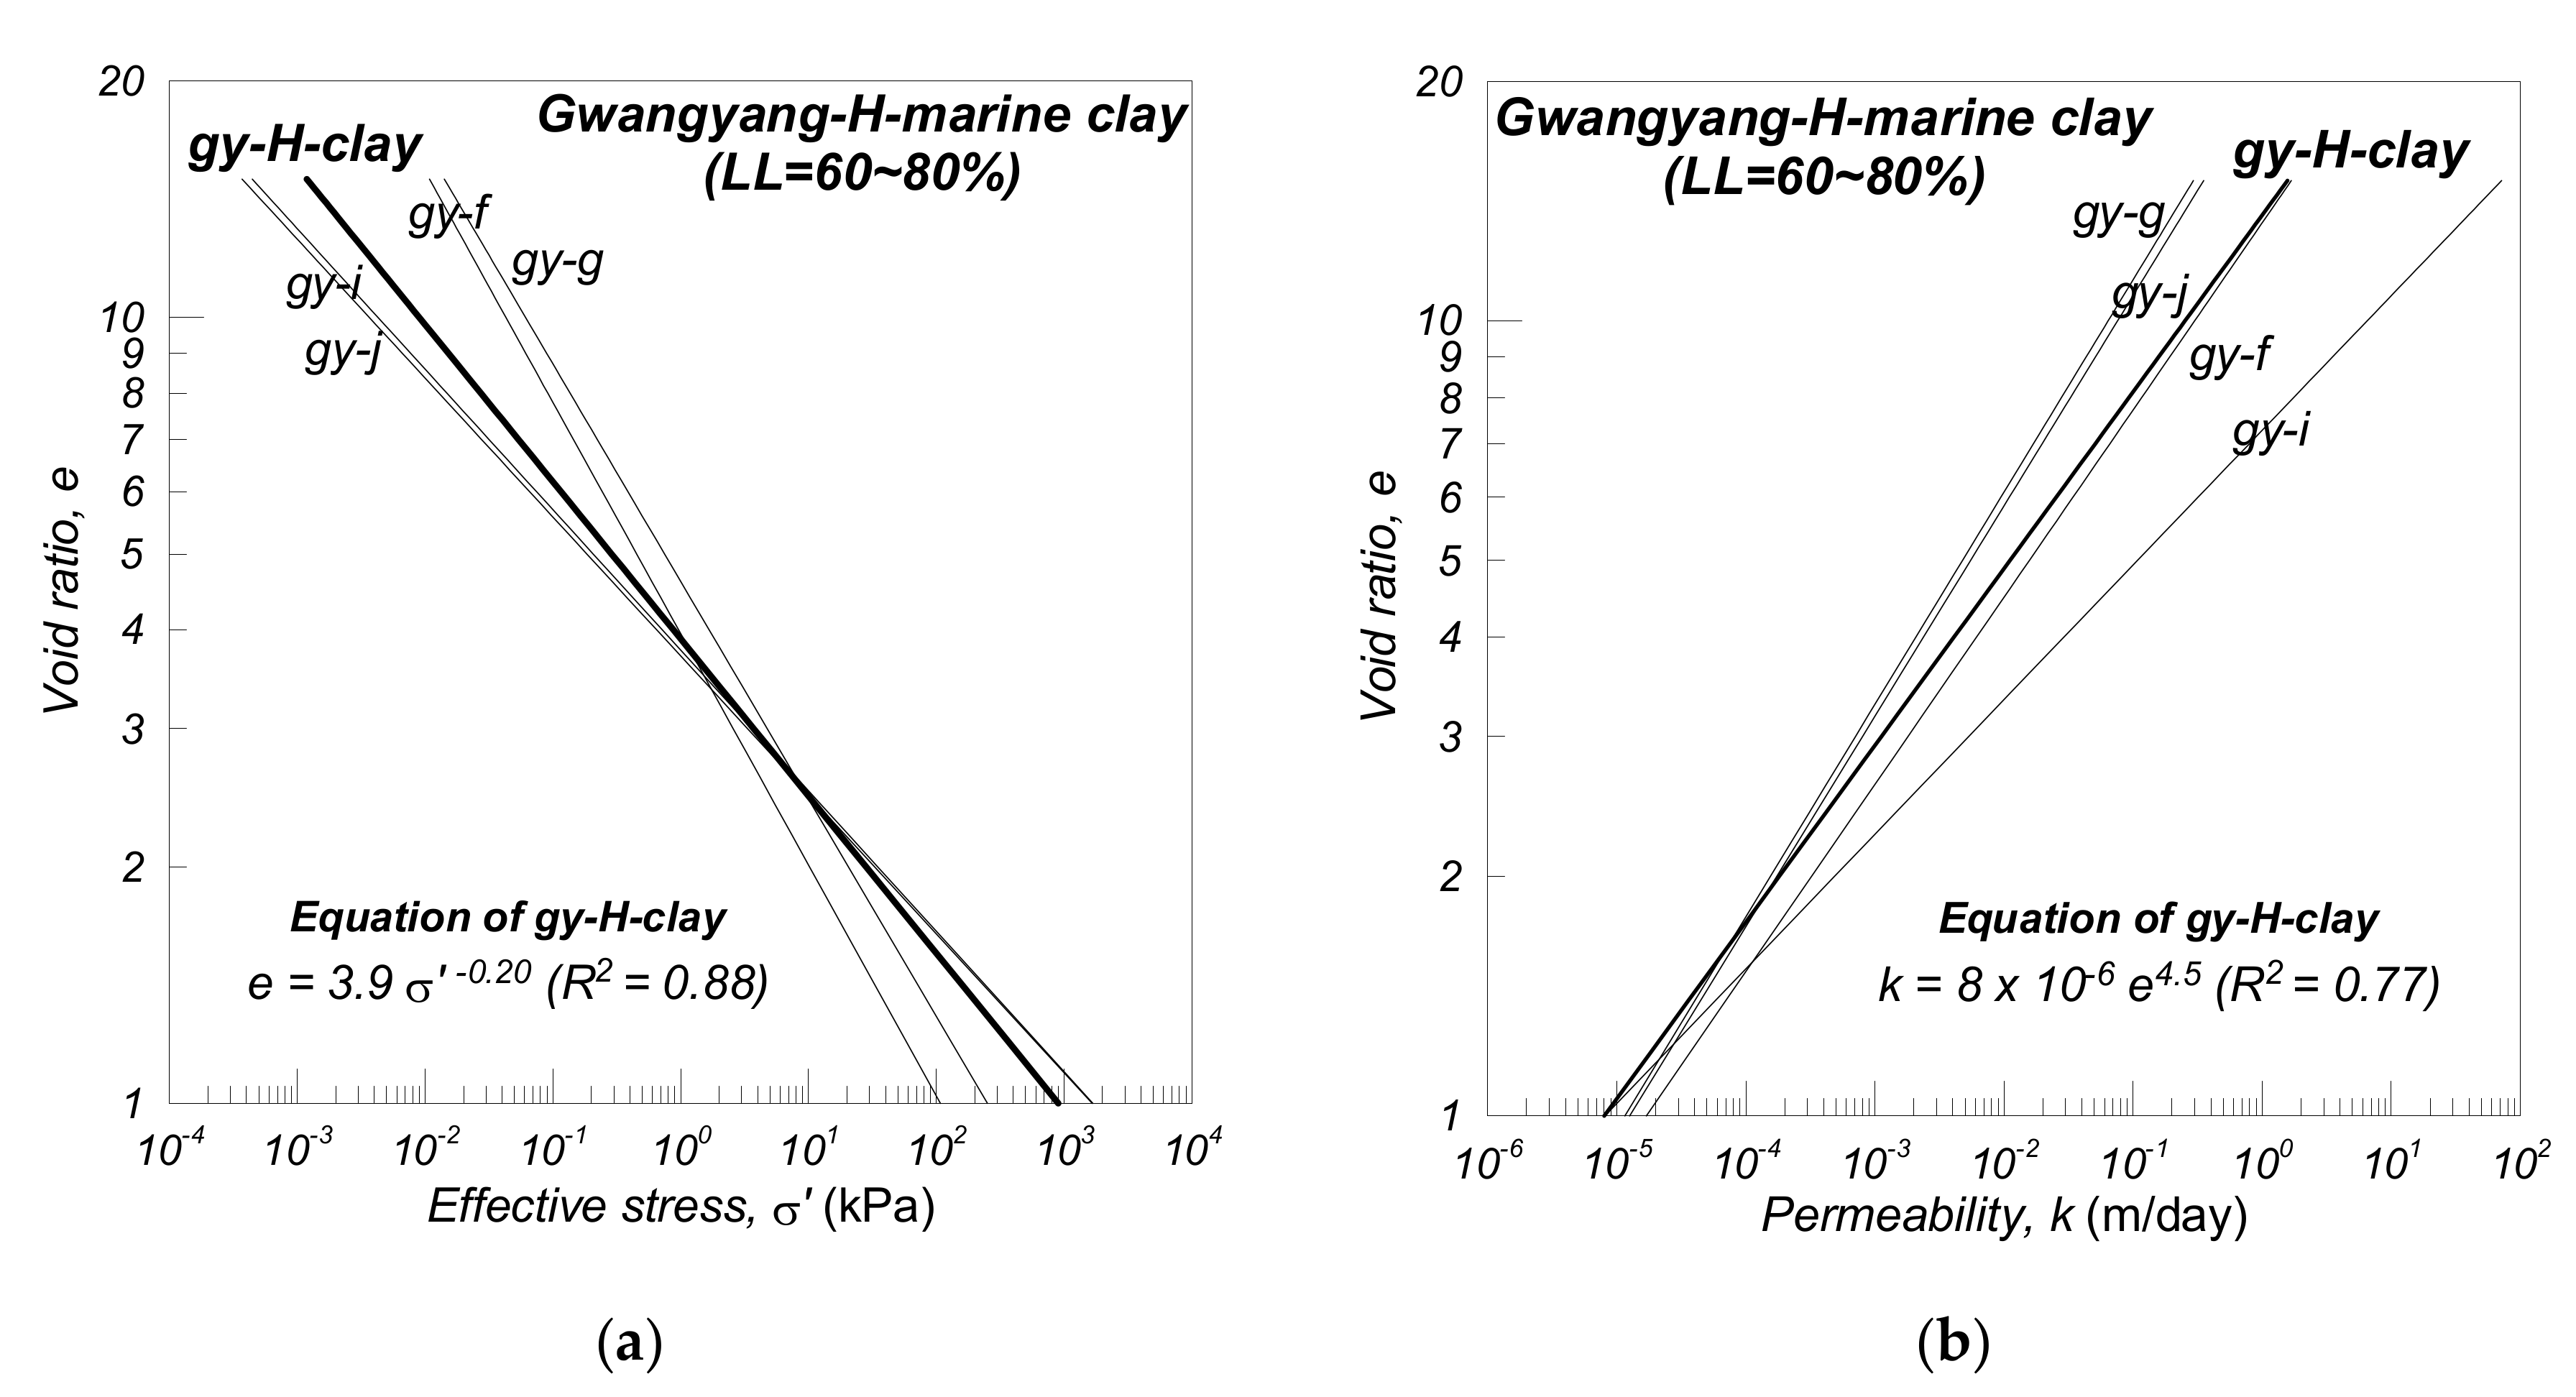
Figure 12. The equations of gy-L-clay had the coefficient of determination of 0.95 on void ratio–effective stress and 0.86 on void ratio–permeability. The Gwangyang-H marine clay with a high liquid limit of 60–80% and the representative constitutive equation (gy-H-clay) of
and
was analyzed using four specimens (gy-f~j), as shown in
Figure 13. The equations of gy-H-clay had the coefficient of determination of 0.88 on the e-
relationship and 0.77 on the e-k relationship.
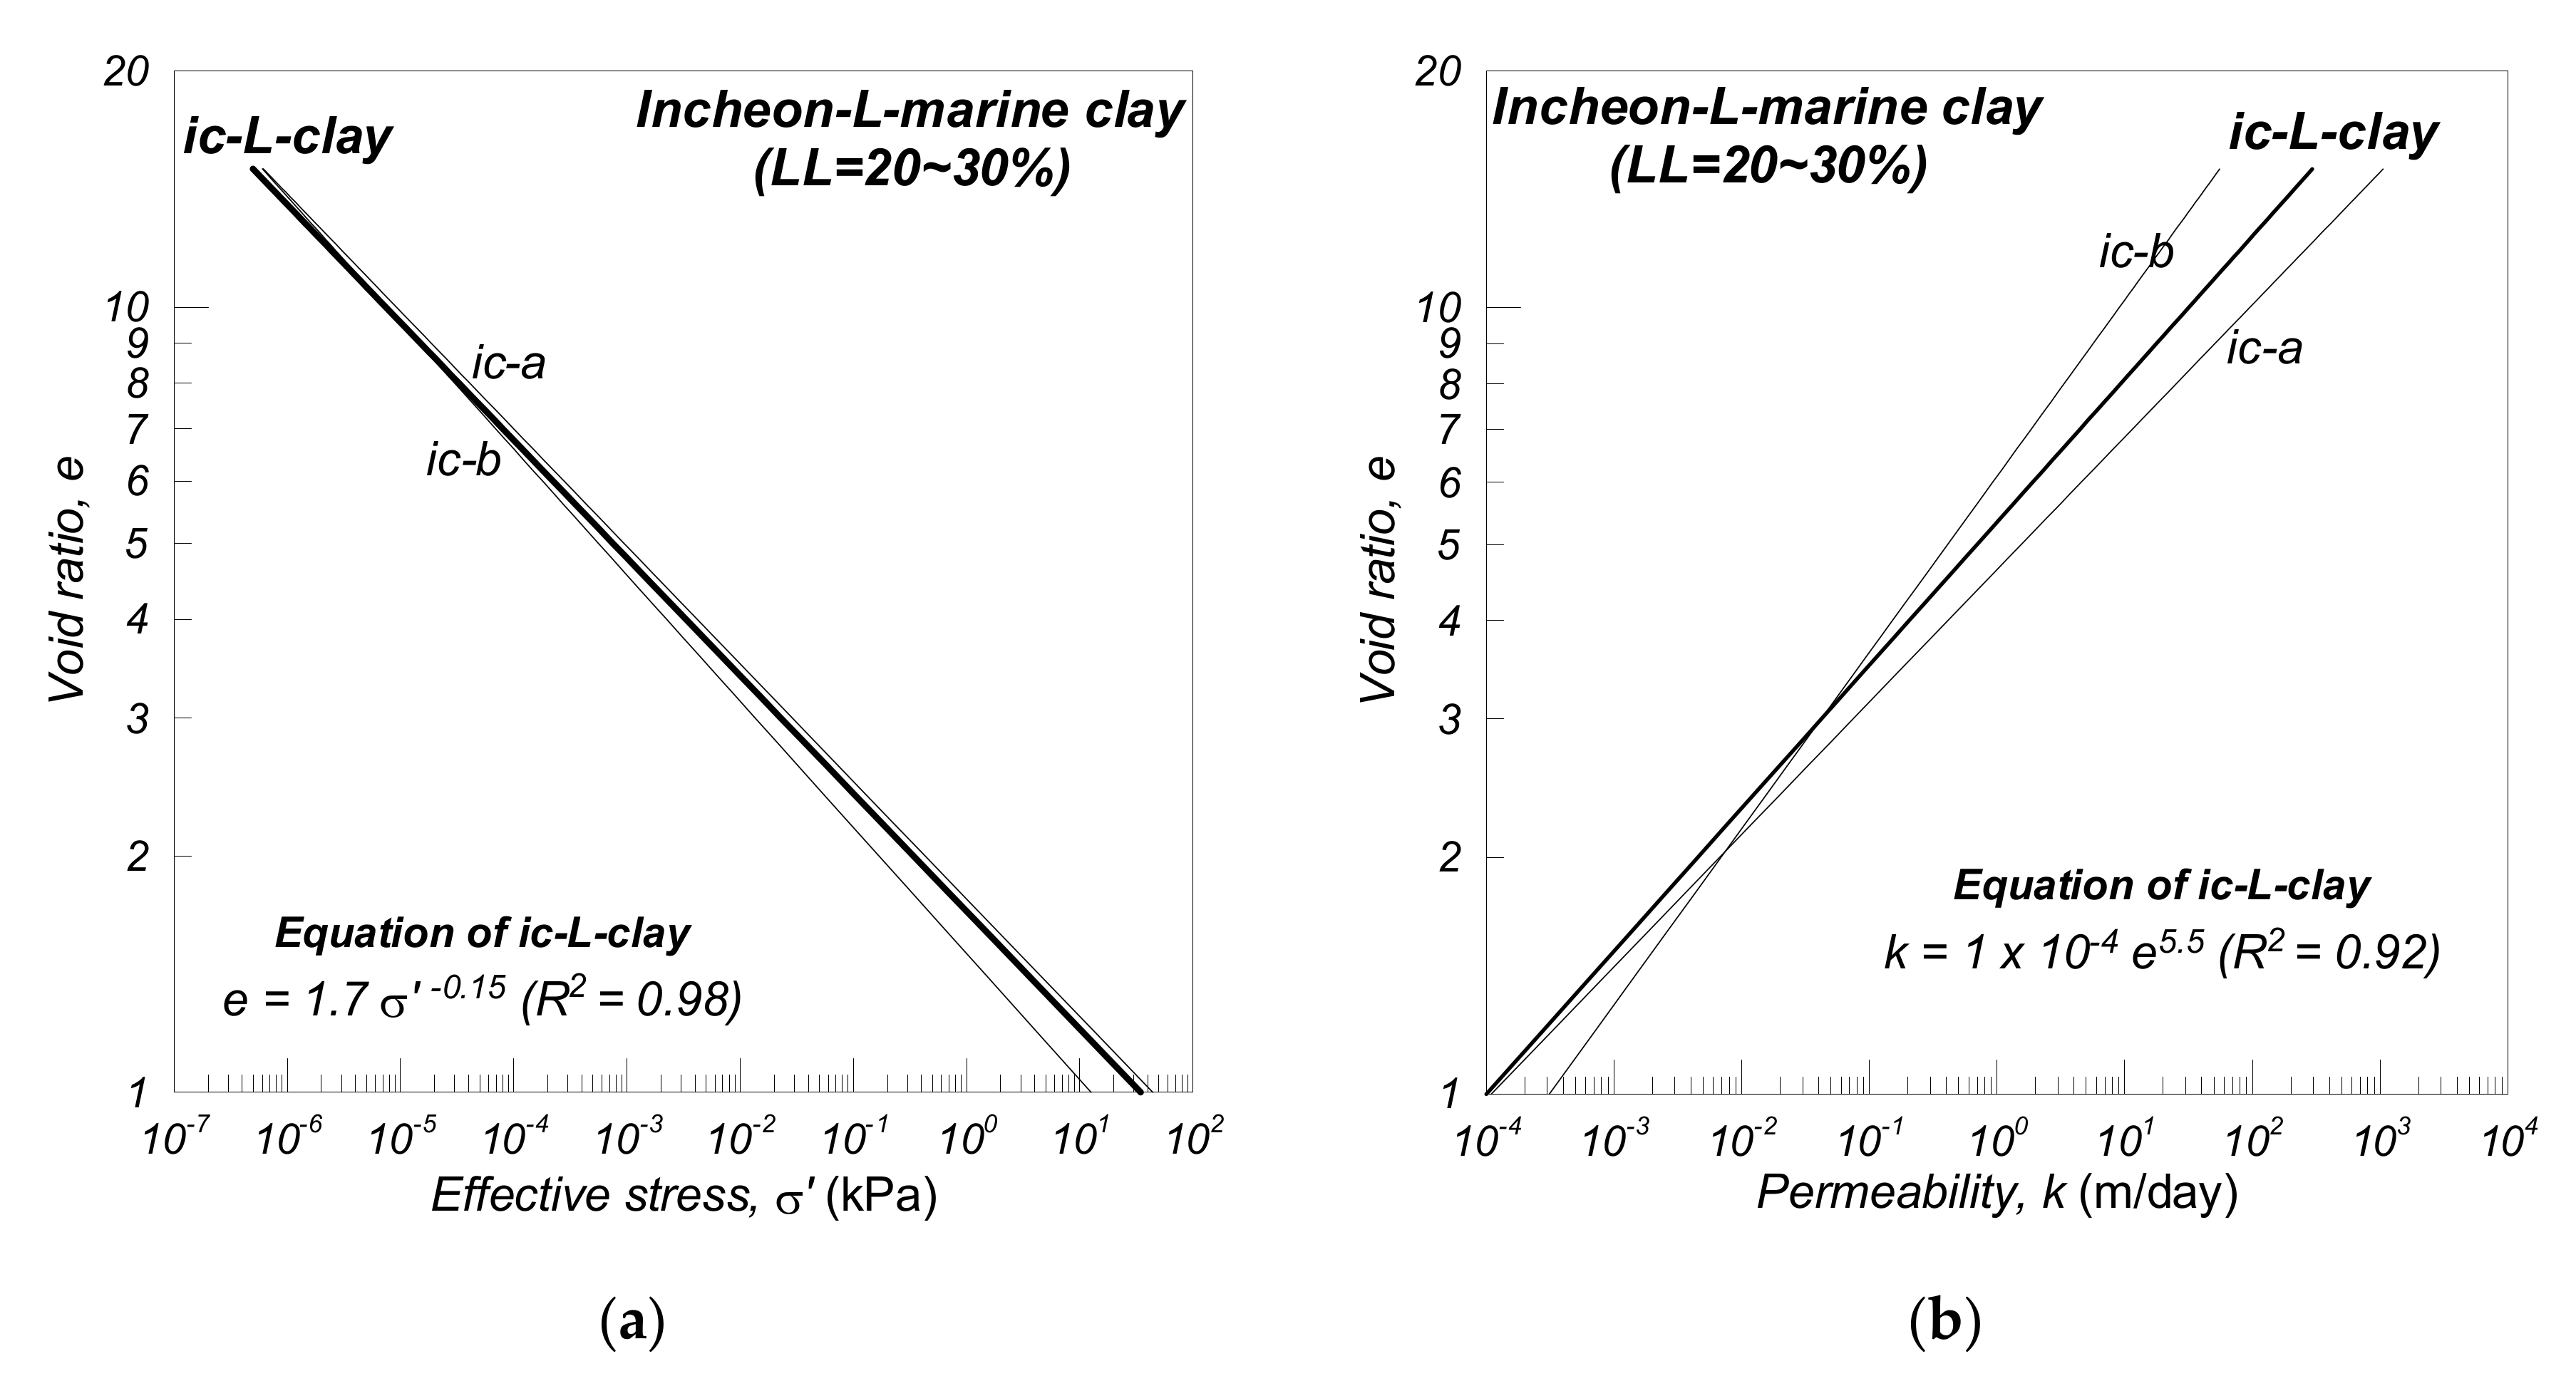
The Incheon-L marine clay with LL = 20–30% and the representative constitutive equation (ic-L-clay) of
and
was analyzed using ic-b and ic-c specimens, as shown in
Figure 14. The equations of ic-L-clay had the coefficient of determination of 0.98 on the e-
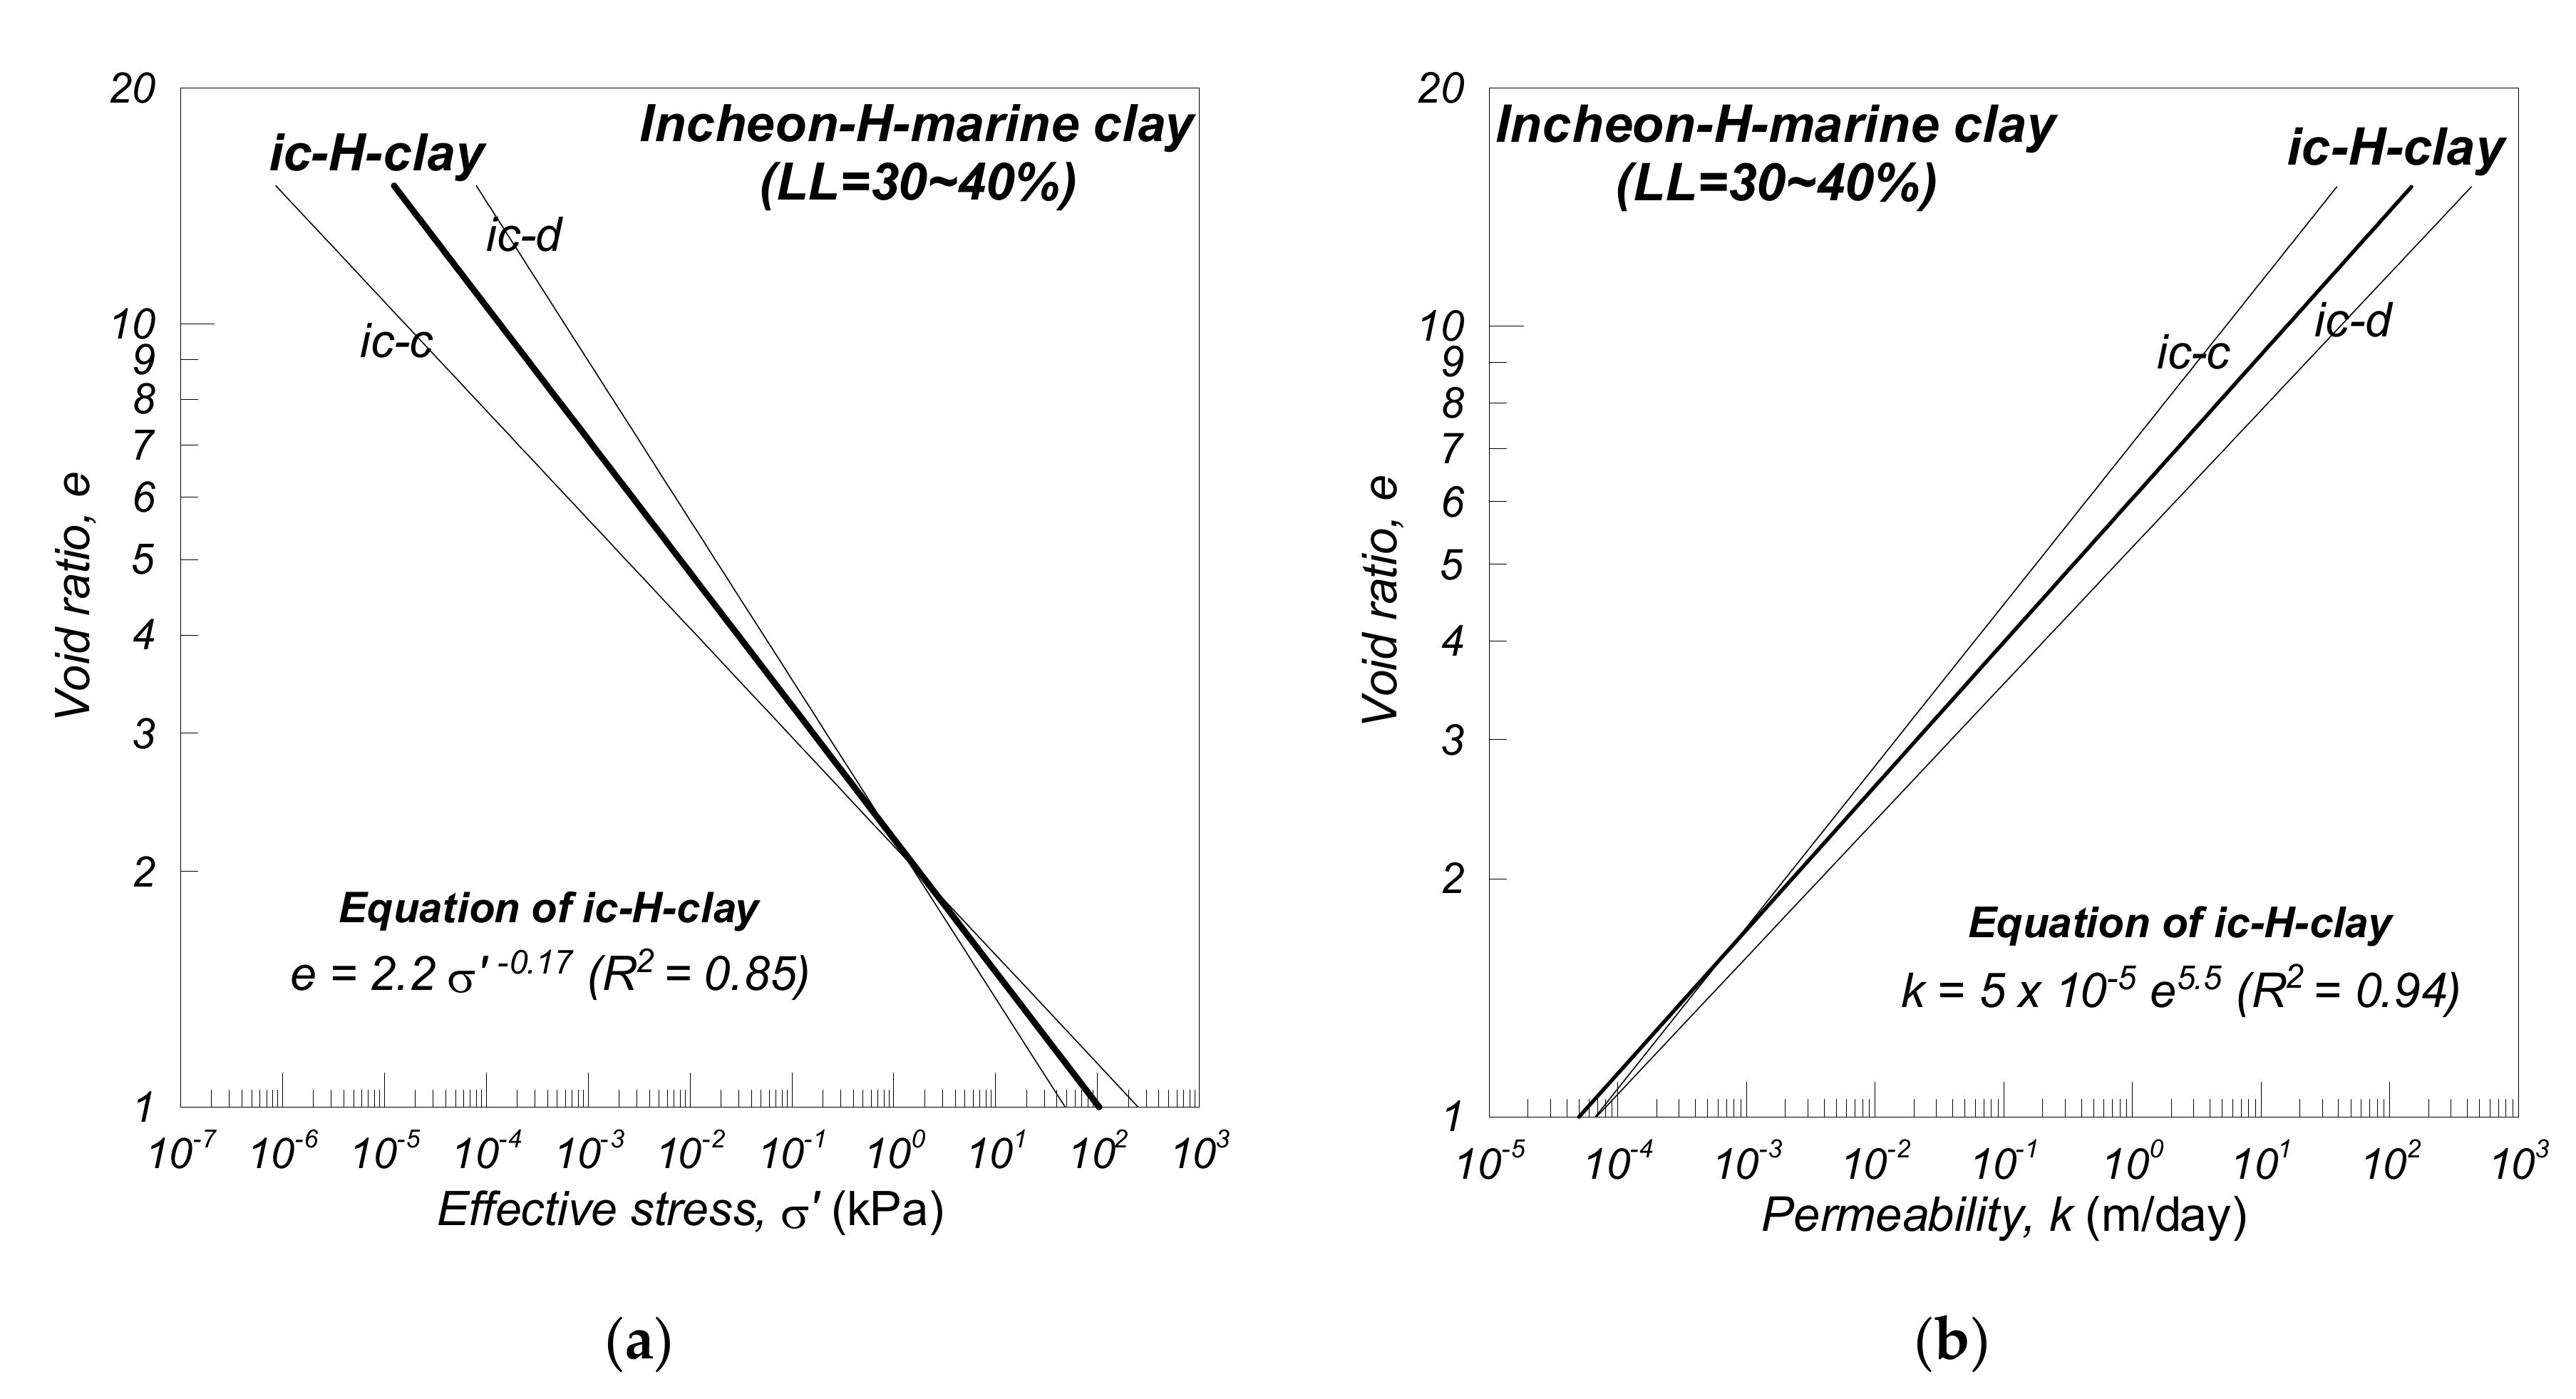
relationship and 0.92 on the e-k relationship. The representative constitutive equation (ic-H-clay) of the Incheon-H marine clay was
and
, which was deduced from the ic-c and ic-d specimens, as shown in
Figure 15. The equations of ic-H-clay had the coefficient of determination of 0.85 on the e-
relationship and 0.94 on the e-k relationship.
The representative constitutive relationship equations for each region are summarized in
Table 3.
4.2. Comparison with Precedent Studies
The representative constitutive relationship equations were compared to previous studies that had similar basic physical properties such as a classification of soil and Atterberg limits. The constitutive equations proposed in this paper and those presented by Carrier et al. [
10] were plotted, as shown in
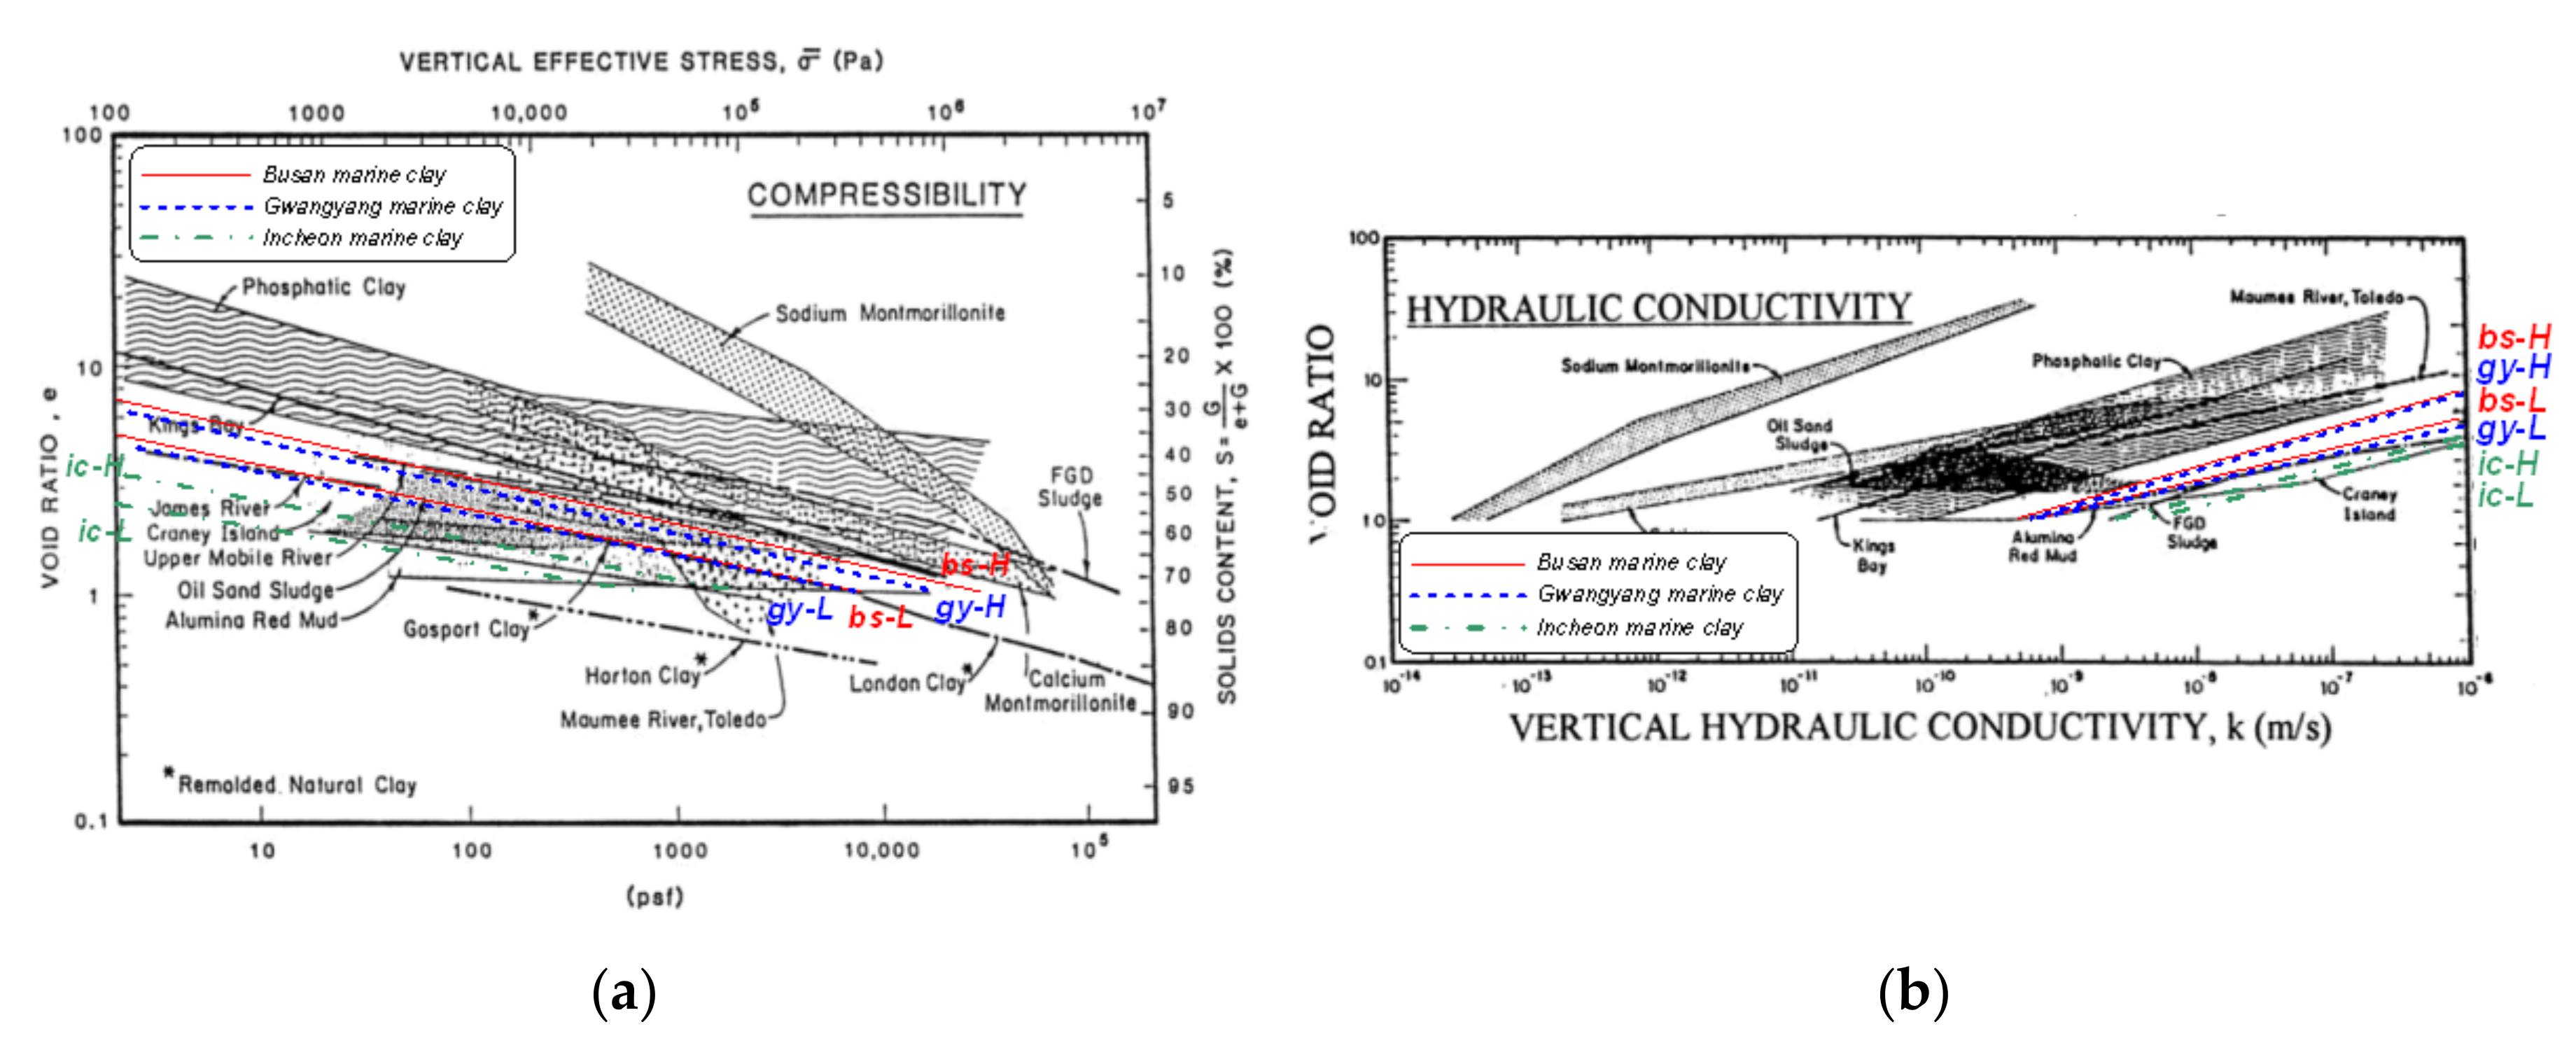
Figure 16. The relationships of void ratio–effective stress were plotted in the low effective stress range at the same void ratio. The equations were similar to Horton, Naumee River, Todedo and Craney Island clays, which had similar physical properties. The permeability of Korean clay had a comparatively high range at the same void ratio. The constitutive relationship equations were similarly analyzed for aluminum red mud (LL = 41–46%, PI = 7–9), FGD (Flue-Gas Desulfurization) sludge (LL = 65%, PI = 17), and Craney Island clay.
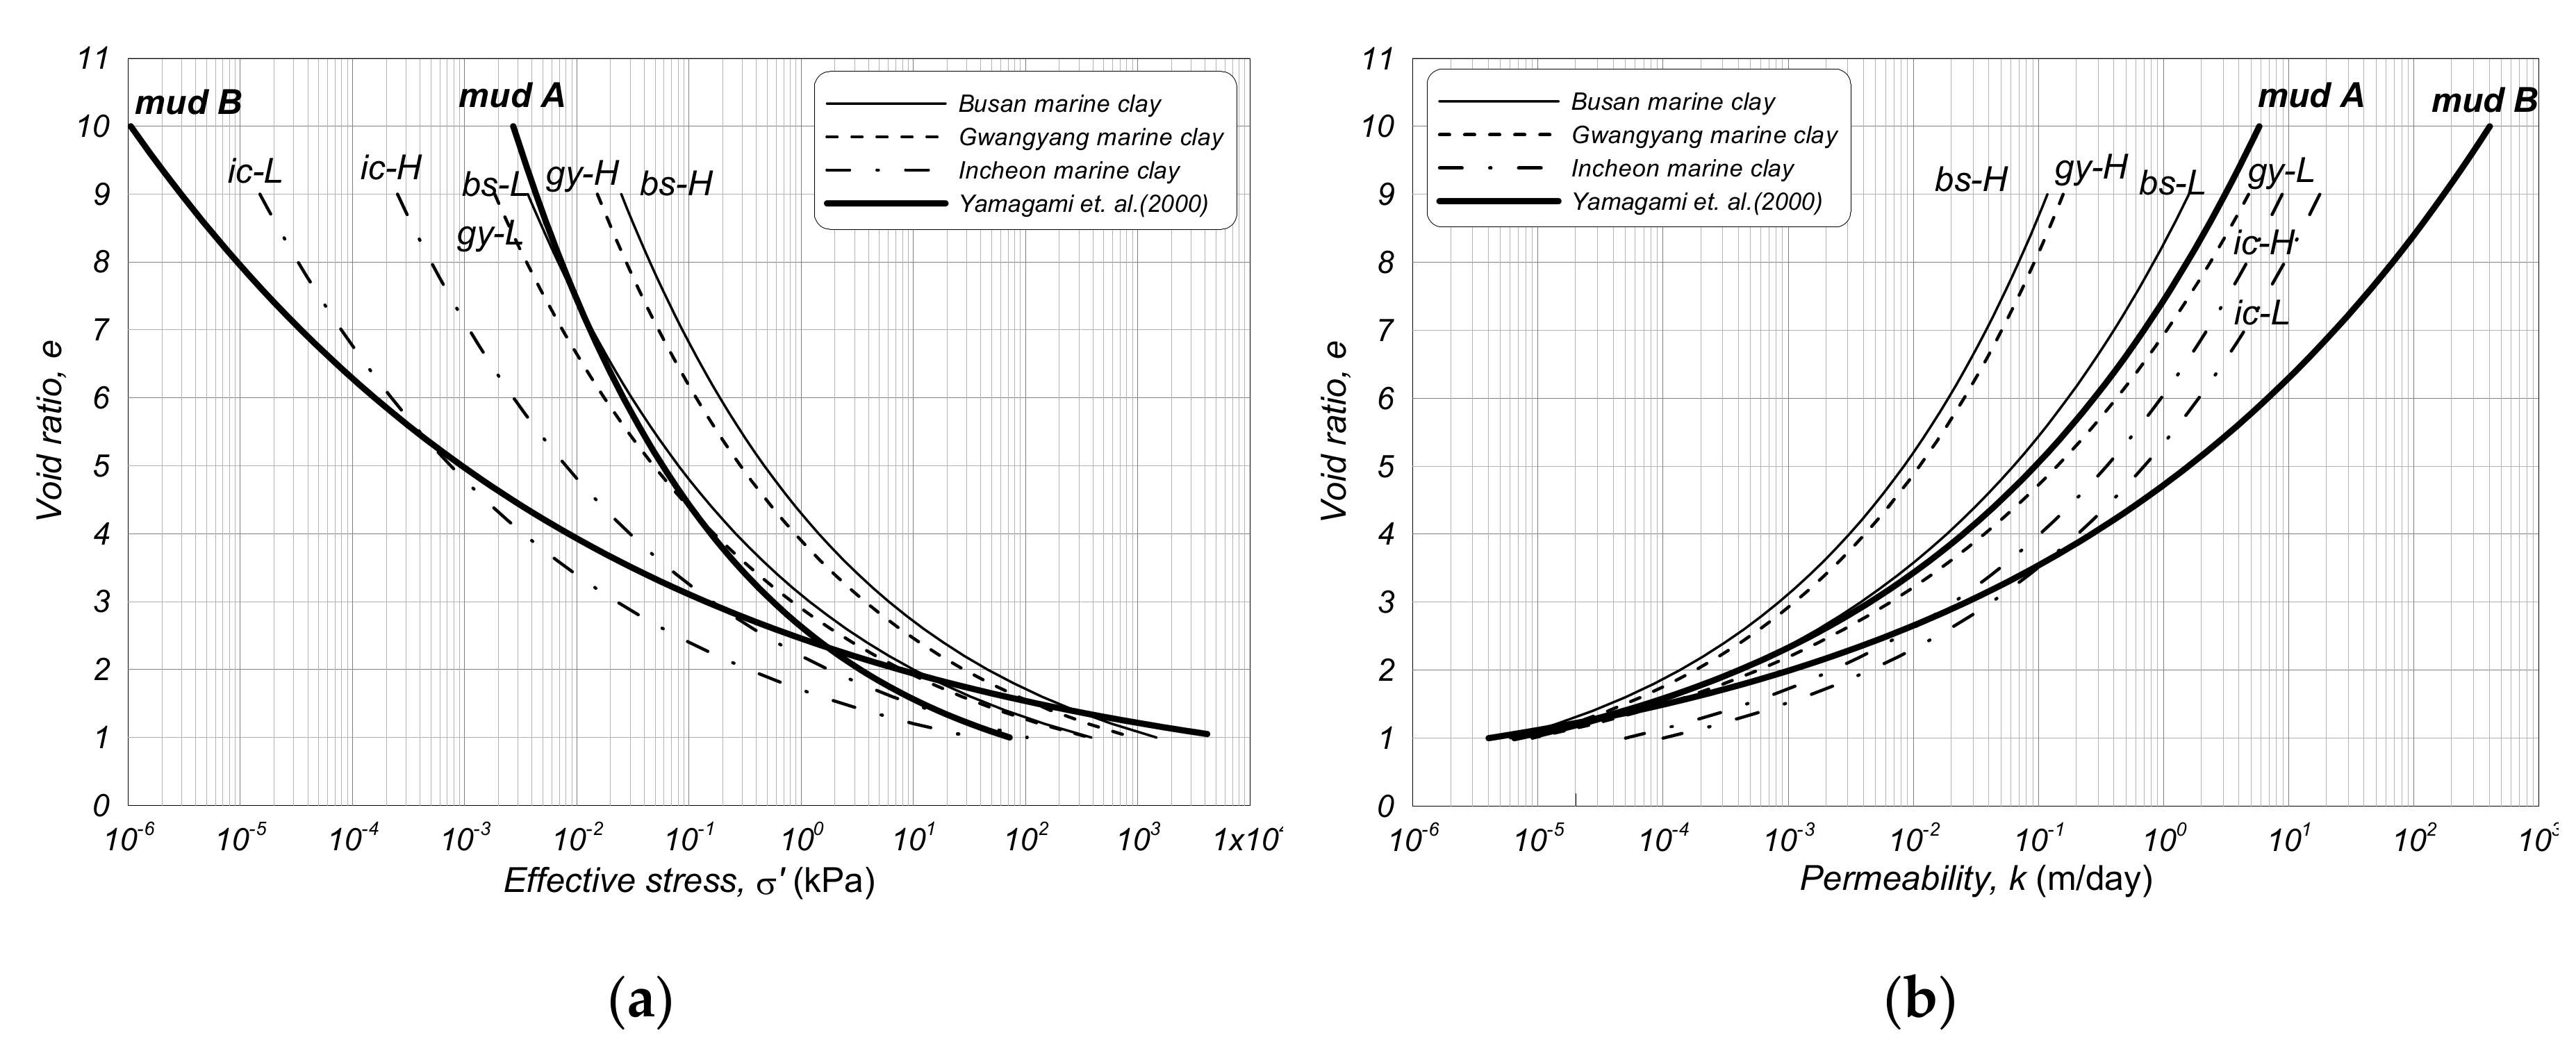
Yamagami et al. [
15] proposed the power function relationship equations of void ratio–effective stress and void ratio–permeability coefficient for each stage of settling and consolidation during the estimation of settling and consolidation characteristics from back analysis. The equations proposed here were plotted and compared with the constitutive equations for mud A (PI = 40.1) and mud B (PI = 22.5) presented by Yamagami et al., as shown in
Figure 17. The equation for mud A was similar to that of the e-σ’-k of bs-L-clay and gy-L-clay; mud B showed low compressibility and high permeability at high void ratio ranges. The representative constitutive equations in this study were compared to the existing research data that had similar physical properties as a Korean marine soft soil, and the results showed a similar range.
5. Conclusions
In this study, the marine soft soil that was sampled at dredging and reclamation sites in Korea was analyzed, and the representative constitutive relationship equations were proposed as follows:
The consolidation property was classified according to LL = 60% for Busan and Gwangyang marine clay and according to LL = 30% for Incheon marine clay by conducting basic physical property tests and consolidation tests for 23 marine soft soils in the Busan, Gwangyang, and Incheon regions. Busan clay showed a slightly higher consolidation settlement property than Gwangyang clay. Incheon clay showed the lowest consolidation settlement property among the three regions. The void ratio–effective stress and void ratio–permeability coefficient were estimated using the back analysis and centrifugal experiment with high void ratios, and the constitutive relationships were shown to be similar in terms of region and properties. This is a reasonable analysis procedure to carry out the consolidation experimental high void ratios using the centrifugal experiment, and then to estimate the constitutive relationship equation by back analysis from the result of the centrifugal experiment. Furthermore, the constitutive relationship equation for Korean clay was analyzed to be a reasonable power function equation. The representative constitutive relationship equations of each region were analyzed by estimating each constitutive equation for each specimen using the back analysis and centrifugal experiment, and then the specimens were classified on the basis of LL criteria, reflecting the engineering properties. For future study, a design chart for estimating the consolidation phenomenon of marine soft soil will be proposed using the constitutive relationship equations.
Author Contributions
Conceptualization, S.H.J. and H.J.K.; Methodology, S.H.J.; Investigation, S.H.J.; Writing—original draft preparation, S.H.J.; Writing—review and editing, H.J.K. All authors have read and agreed to the published version of the manuscript.
Funding
This research received no external funding.
Conflicts of Interest
The authors declare no conflicts of interest.
References
- Gibson, R.E.; England, G.L.; Hussey, M.J.L. The Theory of One-dimensional Consolidation of Saturated Clays, I. Finite Non-linear Consolidation of Thin Homogeneous Layers. Geotechnique 1967, 17, 261–273. [Google Scholar] [CrossRef]
- Cargill, K.W. Consolidation of Soft Layers by Finite Strain Analysis; U.S. Army Engineer Waterways Experimentation Station: Vicksburg, MS, USA, 1982. [Google Scholar]
- Stark, T.D.; Choi, H.; Schroeder, P.R. Settlement of Dredged and Contaminated Material Placement Areas. I: Theory and Use of Primary Consolidation, Secondary Compression, and Desiccation of Dredged Fill. J. Waterw. Port Coast. Ocean Eng. 2005, 131, 43–51. [Google Scholar] [CrossRef]
- Stark, T.D.; Choi, H.; Schroeder, P.R. Settlement of Dredged and Contaminated Material Placement Areas. II: Primary Consolidation, Secondary Compression, and Desiccation of Dredged Fill Input Parameters. J. Waterw. Port Coast. Ocean Eng. 2005, 131, 52–61. [Google Scholar] [CrossRef]
- Liu, J.C.; Griffiths, D.V. A general solution for 1D consolidation induced by depth-and time-dependent changes in stress. Geotechnique 2015, 65, 66–72. [Google Scholar] [CrossRef]
- Hu, A.F.; Xia, C.Q.; Cui, J.; LI, C.X.; Xie, K.H. Nonlinear consolidation analysis of natural structured clays under time-dependent loading. Int. J. Geomech. 2018, 18, 04017140. [Google Scholar] [CrossRef]
- Liu, W.; Shi, Z.; Zhang, J.; Zhang, D. One-dimensional nonlinear consolidation behavior of structured soft clay under time-dependent loading. Geomech. Eng. 2019, 18, 299–313. [Google Scholar]
- Somogyi, F. Analysis and Prediction of Phosphatic Clay Consolidation: Implementation Package; Bromwell & Carrier Engineering Inc.: Lakeland, FL, USA, 1979. [Google Scholar]
- Somogyi, F. Large Strain Consolidation of Fine Grained Slurries. In Proceedings of the Canadian Society for Civil Engineering, Winnipeg, Manitoba, 29–30 May 1980. [Google Scholar]
- Carrier, W.D., III; Bromwell, L.G.; Somogyi, F. Design Capacity of Slurried Mineral Waste Ponds. J. Geotech. Eng. 1983, 109, 699–716. [Google Scholar] [CrossRef]
- Gibson, R.E.; Schiffman, R.L.; Cargill, K.W. The Theory of One-dimensional Consolidation of Saturated Clay II: Finite Non-linear Consolidation of Thick Homogeneous Layers. Can. Geotech. J. 1981, 18, 280–293. [Google Scholar] [CrossRef]
- Wissa, A.E.Z.; Christian, J.T.; Davis, E.H.; Heiberg, S. Consolidation at Constant Rate of Strain. J. Soil Mech. Found. Div. 1971, 97, 1393–1413. [Google Scholar]
- Schiffman, R.L.; Pane, V.; Gibson, R.E. The Theory of One-dimensional Consolidation of Saturated Clays IV: An Overview of Nonlinear Finite Strain Sedimentation and Consolidation. In Proceedings of the A Symposium on Sedimentation/Consolidation Models: Predictions and Validation; Townsend: San Francisco, CA, USA, 1984; pp. 1–29. [Google Scholar]
- Morris, P.H. Analytical Solutions of Linear Finite-Strain One-dimensional Consolidation. J. Geotech. Geoenvironmental Eng. 2002, 128, 319–326. [Google Scholar] [CrossRef]
- Yamagami, T.; Jiang, J.C.; Ueno, K. Back Analysis for Determination of Sedimentation and Consolidation Properties. In Proceedings of the International Symposium on Coastal Geotechnical Engineering in Practice, Yokohama, Japan, 20–22 September 2000; pp. 217–222. [Google Scholar]
Figure 1.
Sampling locations: (a) the regions in Korea; (b) the Busan region; (c) the Gwangyang region; (d) the Incheon region.
Figure 1.
Sampling locations: (a) the regions in Korea; (b) the Busan region; (c) the Gwangyang region; (d) the Incheon region.
Figure 2.
Physical properties of Busan region soil: (a) Plasticity chart; (b) Activity chart.
Figure 2.
Physical properties of Busan region soil: (a) Plasticity chart; (b) Activity chart.
Figure 3.
Consolidation properties of Busan region soil: (a) liquid limit (LL)-compression index (Cc); (b) liquid limit (LL)-permeability change index (Ck).
Figure 3.
Consolidation properties of Busan region soil: (a) liquid limit (LL)-compression index (Cc); (b) liquid limit (LL)-permeability change index (Ck).
Figure 4.
Physical properties of Gwangyang region soil: (a) Plasticity chart; (b) Activity chart.
Figure 4.
Physical properties of Gwangyang region soil: (a) Plasticity chart; (b) Activity chart.
Figure 5.
Consolidation properties of Gwangyang region soil: (a) liquid limit (LL)-compression index (Cc); (b) liquid limit (LL)-permeability change index (Ck).
Figure 5.
Consolidation properties of Gwangyang region soil: (a) liquid limit (LL)-compression index (Cc); (b) liquid limit (LL)-permeability change index (Ck).
Figure 6.
Physical properties of the Incheon region soil: (a) Plasticity chart; (b) Activity chart.
Figure 6.
Physical properties of the Incheon region soil: (a) Plasticity chart; (b) Activity chart.
Figure 7.
Consolidation properties of Incheon region soil: (a) liquid limit (LL)-compression index (Cc); (b) liquid limit (LL)-permeability change index (Ck).
Figure 7.
Consolidation properties of Incheon region soil: (a) liquid limit (LL)-compression index (Cc); (b) liquid limit (LL)-permeability change index (Ck).
Figure 8.
Engineering properties for the classified marine soft soil by liquid limits.
Figure 8.
Engineering properties for the classified marine soft soil by liquid limits.
Figure 9.
Flowchart of back analysis of constitutive relationship using the centrifugal experiment.
Figure 9.
Flowchart of back analysis of constitutive relationship using the centrifugal experiment.
Figure 10.
Constitutive relationship of Busan L marine clay (bs-L-clay): (a) void ratio vs. effective stress; (b) void ratio vs. permeability.
Figure 10.
Constitutive relationship of Busan L marine clay (bs-L-clay): (a) void ratio vs. effective stress; (b) void ratio vs. permeability.
Figure 11.
Constitutive relationship of Busan H marine clay (bs-H-clay): (a) void ratio vs. effective stress; (b) void ratio vs. permeability.
Figure 11.
Constitutive relationship of Busan H marine clay (bs-H-clay): (a) void ratio vs. effective stress; (b) void ratio vs. permeability.
Figure 12.
Constitutive relationship of Gwangyang L marine clay (gy-L-clay): (a) void ratio vs. effective stress; (b) void ratio vs. permeability.
Figure 12.
Constitutive relationship of Gwangyang L marine clay (gy-L-clay): (a) void ratio vs. effective stress; (b) void ratio vs. permeability.
Figure 13.
Constitutive relationship of Gwangyang H marine clay (gy-H-clay): (a) void ratio vs. effective stress; (b) void ratio vs. permeability.
Figure 13.
Constitutive relationship of Gwangyang H marine clay (gy-H-clay): (a) void ratio vs. effective stress; (b) void ratio vs. permeability.
Figure 14.
Constitutive relationship of Incheon L marine clay (ic-L-clay): (a) void ratio vs. effective stress; (b) void ratio vs. permeability.
Figure 14.
Constitutive relationship of Incheon L marine clay (ic-L-clay): (a) void ratio vs. effective stress; (b) void ratio vs. permeability.
Figure 15.
Constitutive relationship of Incheon H marine clay (ic-H-clay): (a) void ratio vs. effective stress; (b) void ratio vs. permeability.
Figure 15.
Constitutive relationship of Incheon H marine clay (ic-H-clay): (a) void ratio vs. effective stress; (b) void ratio vs. permeability.
Figure 16.
Comparison of our study and the study by Carrier et al. [
10]: (
a) void ratio vs. effective stress; (
b) void ratio vs. permeability.
Figure 16.
Comparison of our study and the study by Carrier et al. [
10]: (
a) void ratio vs. effective stress; (
b) void ratio vs. permeability.
Figure 17.
Comparison of our study and the study by Yamagami et al. [
15]: (
a) void ratio vs. effective stress; (
b) void ratio vs. permeability.
Figure 17.
Comparison of our study and the study by Yamagami et al. [
15]: (
a) void ratio vs. effective stress; (
b) void ratio vs. permeability.
Table 1.
Sampling locations.
Table 1.
Sampling locations.
| Region | Mark | Locations in Korea | Region | Mark | Locations in Korea |
|---|
Busan
(10 sites) | bs-a | Angol-dong, Changwon | Gwang
-yang
(9 sites) | gy-c | Hwanggil-dong, Gwangyang |
| bs-b | Cheonseong-dong, Busan | gy-d | Doi-dong, Gwangyang |
| bs-c | Gamcheon-dong, Busan | gy-e | Hwanggeum-dong |
| bs-d | Ung-dong, Changwon | gy-f | Doi-dong, Gwangyang |
| bs-e | Ung-dong, Changwon | gy-g | Hwachi-dong, Yeosu |
| bs-f | Seongbuk-dong, Busan | gy-i | Doi-dong, Gwangyang |
| bs-g | Haeun-dong, Changwon | gy-j | Jeongryang-dong, Yeosu |
| bs-i | Ung-dong, Changwon | Incheon
(4 sites) | ic-a | Songdo-dong, Incheon |
| bs-j | Youngdang-dong, Busan | ic-b | Oryu-dong, Incheon |
| bs-k | Gapo-dong, Changwon | ic-c | Unbuk-dong, Incheon |
Gwang-
yang | gy-a | Jung-dong, Gwangyang | ic-d | Songdo-dong, Incheon |
| gy-b | Hwanggeum-dong | Total | 23 dredged-reclaimed sites |
Table 2.
Centrifugal experimental conditions and results.
Table 2.
Centrifugal experimental conditions and results.
| Symbol | Mark | Accel. of Gravity,
n (g) | Initial Void Ratio
e0 | Initial Height of Column
H0 (mm) | Atterberg Limits | Constitutive Relationship |
|---|
| LL (%) | PI | | e-k (m/day) |
|---|
Busan
-L-clay
(bs-L-clay) | bs-a | 20~30 | 4.08~6.80 | 75~200 | 47.2 | 20.5 | | |
| bs-b | 30 | 4.07~6.78 | 100~200 | 40.1 | 16.6 | | |
| bs-c | 40 | 5.42~6.78 | 100 | 55.1 | 27.3 | | |
| bs-d | 50~60 | 4.07~5.43 | 100~150 | 53.8 | 31.0 | | |
| bs-e | 50~60 | 4.34~5.42 | 150~200 | 54.4 | 29.5 | | |
| bs-f | 30~40 | 4.06~5.41 | 100 | 53.2 | 24.8 | | |
Busan
-H-clay
(bs-H-clay) | bs-g | 30~40 | 5.42~6.78 | 100 | 65.6 | 33.9 | | |
| bs-i | 50~60 | 4.08~5.44 | 120~220 | 69.6 | 37.9 | | |
| bs-j | 30~40 | 4.10~5.46 | 100~200 | 74.0 | 39.4 | | |
| bs-k | 30~50 | 5.44~10.88 | 100~200 | 94.3 | 55.0 | | |
Gwangyang
-L-clay
(gy-L-clay) | gy-a | 30~40 | 4.08~5.43 | 100 | 45.9 | 24.0 | | |
| gy-b | 30~40 | 4.12~5.49 | 100 | 44.9 | 28.0 | | |
| gy-c | 30~40 | 4.07~5.42 | 100 | 44.1 | 21.0 | | |
| gy-d | 30~40 | 4.11~5.48 | 100 | 44.0 | 25.5 | | |
| gy-e | 40~50 | 4.05~8.11 | 180~225 | 33.8 | 19.0 | | |
Gwangyang
-H-clay
(gy-H-clay) | gy-f | 30~50 | 4.08~6.80 | 100~200 | 79.3 | 50.5 | | |
| gy-g | 30~40 | 4.17~6.95 | 100~200 | 62.6 | 35.1 | | |
| gy-i | 30~40 | 4.07~5.42 | 100~200 | 82.7 | 46.3 | | |
| gy-j | 40 | 3.32~5.45 | 100~125 | 64.5 | 35.3 | | |
Incheon
-L-clay
(ic-L-clay) | ic-a | 60 | 2.71~4.06 | 200 | 25.5 | 11.8 | | |
| ic-b | 50 | 2.69~4.04 | 100~200 | 24.8 | 12.4 | | |
Incheon
-H-clay
(ic-H-clay) | ic-c | 30~40 | 2.71~4.34 | 100~200 | 33.8 | 16.8 | | |
| ic-d | 30~40 | 4.05~5.40 | 100 | 38.3 | 15.6 | | |
Table 3.
Representative constitutive relationship equation.
Table 3.
Representative constitutive relationship equation.
| Region | Symbol | Representative Constitutive Relationship | Applicable Range of Liquid Limits |
|---|
Void Ratio-
Effective Stress (kPa) | Void Ratio-Permeability (m/day) |
|---|
| Busan | bs-L-clay | | | 40~60% |
| bs-H-clay | | | 60~80% |
| Gwangyang | gy-L-clay | | | 40~60% |
| gy-H-clay | | | 60~80% |
| Incheon | ic-L-clay | | | 20~30% |
| ic-H-clay | | | 30~40% |
© 2020 by the authors. Licensee MDPI, Basel, Switzerland. This article is an open access article distributed under the terms and conditions of the Creative Commons Attribution (CC BY) license (http://creativecommons.org/licenses/by/4.0/).


