1. Introduction
Breakwaters are coastal protection structures generally built out into the sea to protect the emerged beach, cliffs, dunes or harbours from the action of waves. In recent decades, semicircular breakwaters have aroused interest in the scientific community, based on their advantages compared to conventional breakwaters.
As reported by [
1] and [
2], the semicircular breakwater was developed in the early 90s of the last century in Japan, and a 36 m prototype of this type of breakwater was built at the port of Mayazaki between 1992 and 1993. As a rule, they are pre-fabricated reinforced concrete structures, with semicircular hollow perforations on the exposed face, and are installed over a rubble mound foundation. They are more economical, stable and efficient than conventional breakwaters, being suitable for installation over coastal stretches of low resistant capacity [
3].
Previous studies of this type of coastal structures have concentrated essentially on the evaluation of hydrodynamic parameters, such as pressure, reflection coefficients, runup, rundown and aspects related to the dissipation of energy by the breakwater. Different semi-empirical design formulations were proposed by [
4]. Sasajima et al. [
5] calculated pressures and loads on the semicircular breakwater and concluded that the peak pressure towards the beach follows a Rayleigh distribution. The authors in [
6] and [
7] developed methods to calculate the wave loads that act on the semicircular breakwater. The authors in [
8] and [
9] performed an experimental verification of the pressure exerted on semicircular breakwaters, comparing the results with those obtained through numerical models. Zhang et al., in [
10], evaluated the loads acting on semicircular breakwaters, resulting from oblique waves. The authors in [
11,
12,
13] and [
14] presented results of the hydrodynamic performance characteristics of the breakwater, analyzing the influence of water depth, holes and the height of the rubble mound foundation base. They concluded that a semicircular breakwater perforated in half a section dissipates more energy, reflects less energy and is subject to lower dynamic pressures. Moreover, [
13] also showed that reflection coefficients decrease with the increase of porosity of the front wall (analyzing 0%, 7% and 11% percentages of perforated front walls). Porosity of breakwaters has an important effect on wave dynamics (eg., [
15,
16]).
Nishnath [
17] carried out studies on perforated and non-perforated emerged breakwater models and showed that the reflection coefficient increases with an increase in the inclination and height of the incident waves. Ganesh [
18] studied semi-circular breakwater models perforated on the surface exposed to waves, and perforated on both sides, by considering different wave heights and periods, as well as different depths. The results obtained showed that as the percentage of perforations increases or the relationship between spacing and diameter of perforation decreases, the value of the reflection coefficient, the runup and rundown decrease, but the transmission coefficient increases. These conclusions were also obtained by [
19] for perforated models with different holes spacing/diameter ratios. Zanuttigh et al. [
20] studied the reflection coefficient and showed that this is an important aspect in the assessment of the breakwater stability. Hodaei et al. [
21] found that perforations in semicircular breakwaters absorb wave energy better compared to vertical breakwaters and inclined barriers, with a reduction in the reflection coefficient. More recently, [
22] studied the variations in the critical weight necessary for sliding stability, taking into account different parameters of depth and wave characteristics, using a physical model of a semicircular breakwater emerged and perforated in the face exposed to waves, for a relationship between spacing and hole diameter of 8. They concluded that the stability parameter decreases as the slope of incident waves increases, for all ranges of depth parameters. It was found that the stability increases with the increase in the depth parameter for the adopted inclination of incident waves, that is, as the depth parameter increases, the critical weight necessary for sliding stability also increases.
Almost all the previous works mentioned are based on physical models. However, this methodology is subject to high costs and prolonged procedures. The CFD modelling tools, associated with the increase in computational capacity, have been making it possible to analyse this type of structure, based on numerical models. They allow numerical simulations of the interaction between fluids and structures to be undertaken, allowing the estimation of wave loads on complex geometry structures. The FLOW-3D® software [
23] has a high capability to simulate fluid dynamics problems, including the possibility to simulate different types of waves in complex geometry domains, which include three-dimensional solid objects. It solves the Reynolds’ averaged Navier-Stokes equations (RANS) with an efficient numerical method, considering different alternatives for turbulence closure models.
FLOW-3D® is being used in different studies of coastal structures. Najafi-Jilani et al. [
24] applied the software to analyze the performance of different breakwater armour arrangements, based on antifer armour units, and concluded that the numerical method, based on VOF (Volume of Fluids) algorithm outperforms other numerical codes. Nourani and Askar [
25] applied Flow-3D® to study the performance of different shapes of concrete armoured blocks to be used in a breakwater. Chen et al. [
26] studied a floating breakwater using a physical model and FLOW-3D® and evidenced the software’s good ability to capture the hydrodynamic interaction effect with the analyzed structure.
This work presents results of the application of FLOW-3D® for the study of the sliding stability of a perforated semicircular breakwater, based on a rubble mound foundation. Experimental results of the critical weight necessary to resist sliding were used to validate the model, taking into account the effects of water depth and different characteristics of the waves. Moreover, a comparison is made between the perforated and the non-perforated solution, in terms of the breakwater’s performance to dissipate wave energy. Interior conditions of the breakwater are evaluated in detail in order to assess the potential of this structure as a biological refuge for marine species.
2. Methods
2.1. Flow Model
The numerical simulations are performed based on Reynolds’ averaged Navier-Stokes equations (RANS), used to describe the wave-induced fluid movement, assuming an incompressible fluid; the model equations are,
where
,
is the velocity,
t is time,
is the fluid density,
is pressure,
g is the gravitational force and τ is viscous stress tensor.
Fluid configurations are defined in terms of a VOF function F (x, y, z, t) [
27], which represents the fluid volume that occupies a portion of the unitary volume space. F satisfies the following transport equation:
For a single incompressible fluid with a free surface, there is fluid where F = 1, while places where F = 0 correspond to empty regions, in which a uniform pressure is applied. In the case of two incompressible fluids without a free surface, F represents the volumetric fraction of fluid no. 1, while the complementary region with volumetric fraction 1 - F represents the second fluid.
In addition to gravity, two additional physical processes were considered in this work: (a) a turbulence model based on the well-known two-equation model k-ε and (b) a generalized moving object (GMO) model. This allows quantifying the resulting forces and torques exerted by the fluid on the breakwater that is assumed to be a GMO. In this way, it allows obtaining the weights necessary to guaranty sliding stability of the structure. It was assumed a friction coefficient,
, between the breakwater base (concrete) and the foundation base. The critical weights (
W) associated with the maximum horizontal force (
), are obtained by:
According to [
28], the friction coefficient between the concrete and the rubble mound foundation is normally considered equal to 0.6. This value was adopted in this study.
Turbulence was modelled using two transport equations for the turbulent kinetic energy
k and its dissipation ε (the standard k-ε model). This model has been shown to provide reasonable approximations to many types of flows [
29]. At all boundaries, except for rigid no-slip boundaries, the two-equation turbulence model is used to compute the energy and dissipation functions. A non-slip or partial-slip condition was adopted for wall boundary conditions. At these boundaries, the FLOW-3D® adopts a simplified turbulence model, based on the assumption of the Prandtl mixing length model, which assumes that turbulence production and dissipation are in balance everywhere in the flow. This is because the numerical resolution is usually too coarse to resolve details of a laminar boundary layer region. For wave generation, FLOW-3D® has the ability to simulate surface waves of regular linear and non-linear propagation, as well as irregular waves. Although linear wave theory [
30] has been used in many applications, non-linear wave theories generally offer a significant improvement in accuracy over linear wave theory for greater wave amplitudes [
31]. In FLOW-3D®, three theories of non-linear waves are used to generate non-linear waves: (a) Stokes 5th order wave theory [
32], (b) Fourier series method for Stokes and cnoidal waves [
33] and (c) McCowan’s theory for solitary waves [
34]. For each of the simulated scenarios, wave generation was defined according to its specific validity characteristics and the water depth.
2.2. Breakwater Geometry
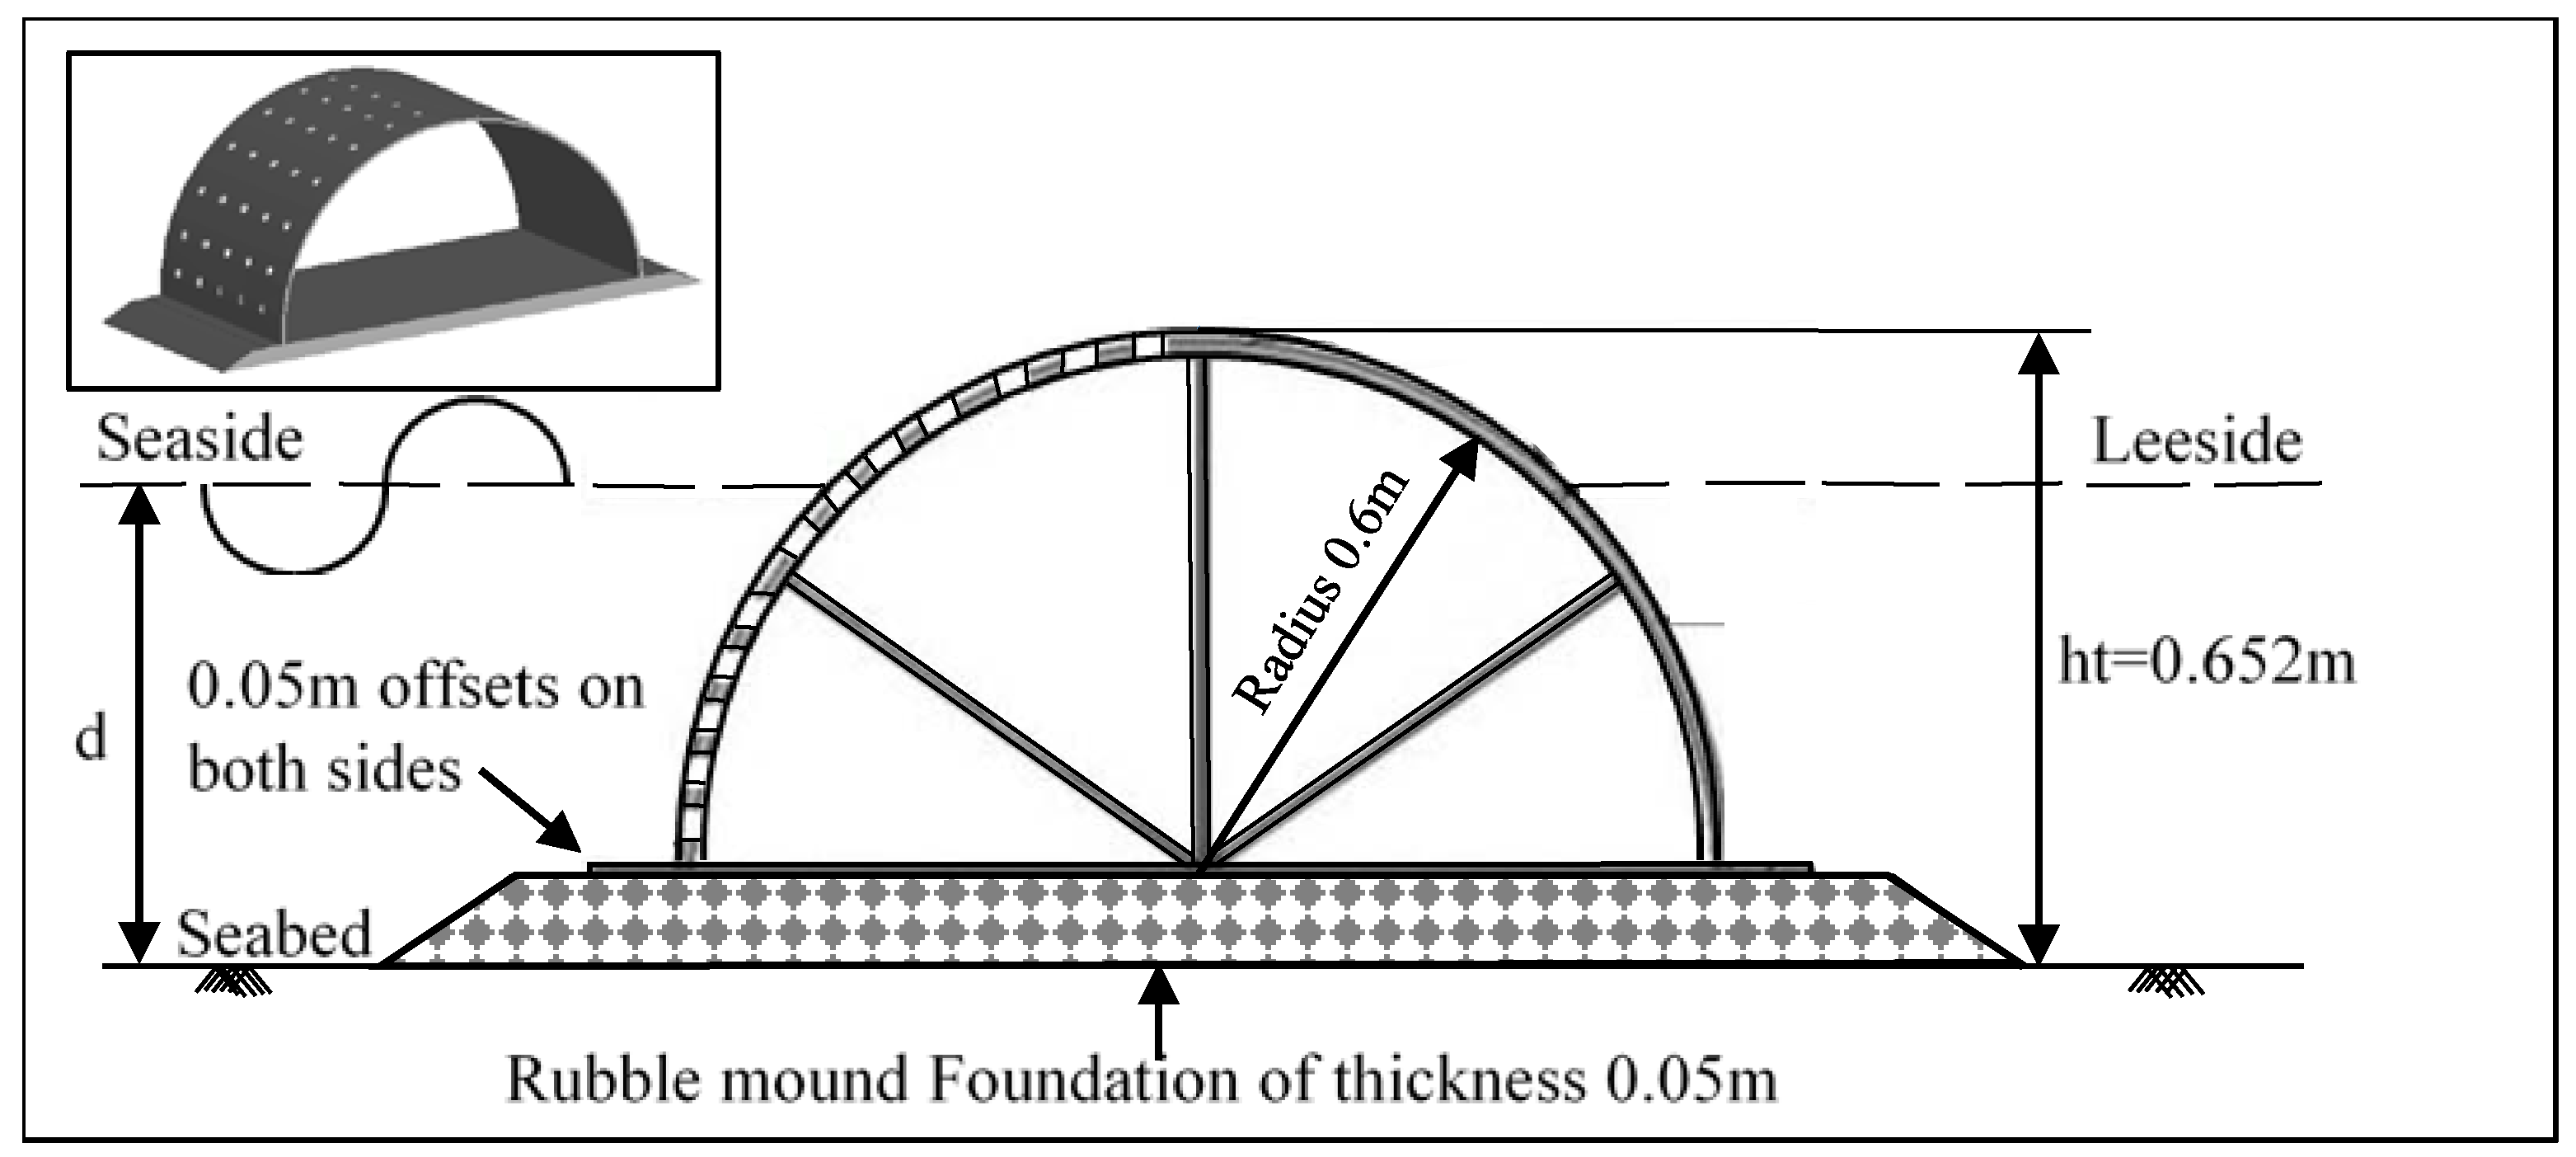
Hegde et al. [
22] built a physical model to assess the stability of a perforated semicircular breakwater with the dimensions shown in
Figure 1. A set of experiments were carried out in that work in order to estimate the critical weight of the breakwater needed to resist sliding, taking into account the effects of water depth, wave height and period. The laboratory channel was equipped with a wave-maker and pressure probes. The physical model consisted of a semicircular caisson with a 0.6 m radius fixed to a base, both made of galvanized iron plate with dimensions of 1.3 m × 0.73 m × 0.002 m (Length × Width × Thickness), weighing 372.78 N and covered with a thin layer of cement mortar to simulate the concrete surface of a real model. The semicircular breakwater was positioned on a rubble mound foundation base, with a thickness of 0.05 m. The holes spacing (S)/diameter (D) ratio was equal to 8, with the hole diameter equal to 0.016 m.
In the experimental work, for the different wave parameters, weights were added to the model so that it was possible to find the critical weight necessary to resist sliding.
In order to optimize the computation time of the FLOW-3D® model, it was necessary to scale the dimensions of the physical model. The numerical model of the corresponding perforated semicircular breakwater was five times larger than that used in the experimental work. However, all simulation parameters involved were defined with respect to the range of dimensionless parameters obtained in the experimental work of [
22].
2.3. Numerical Model
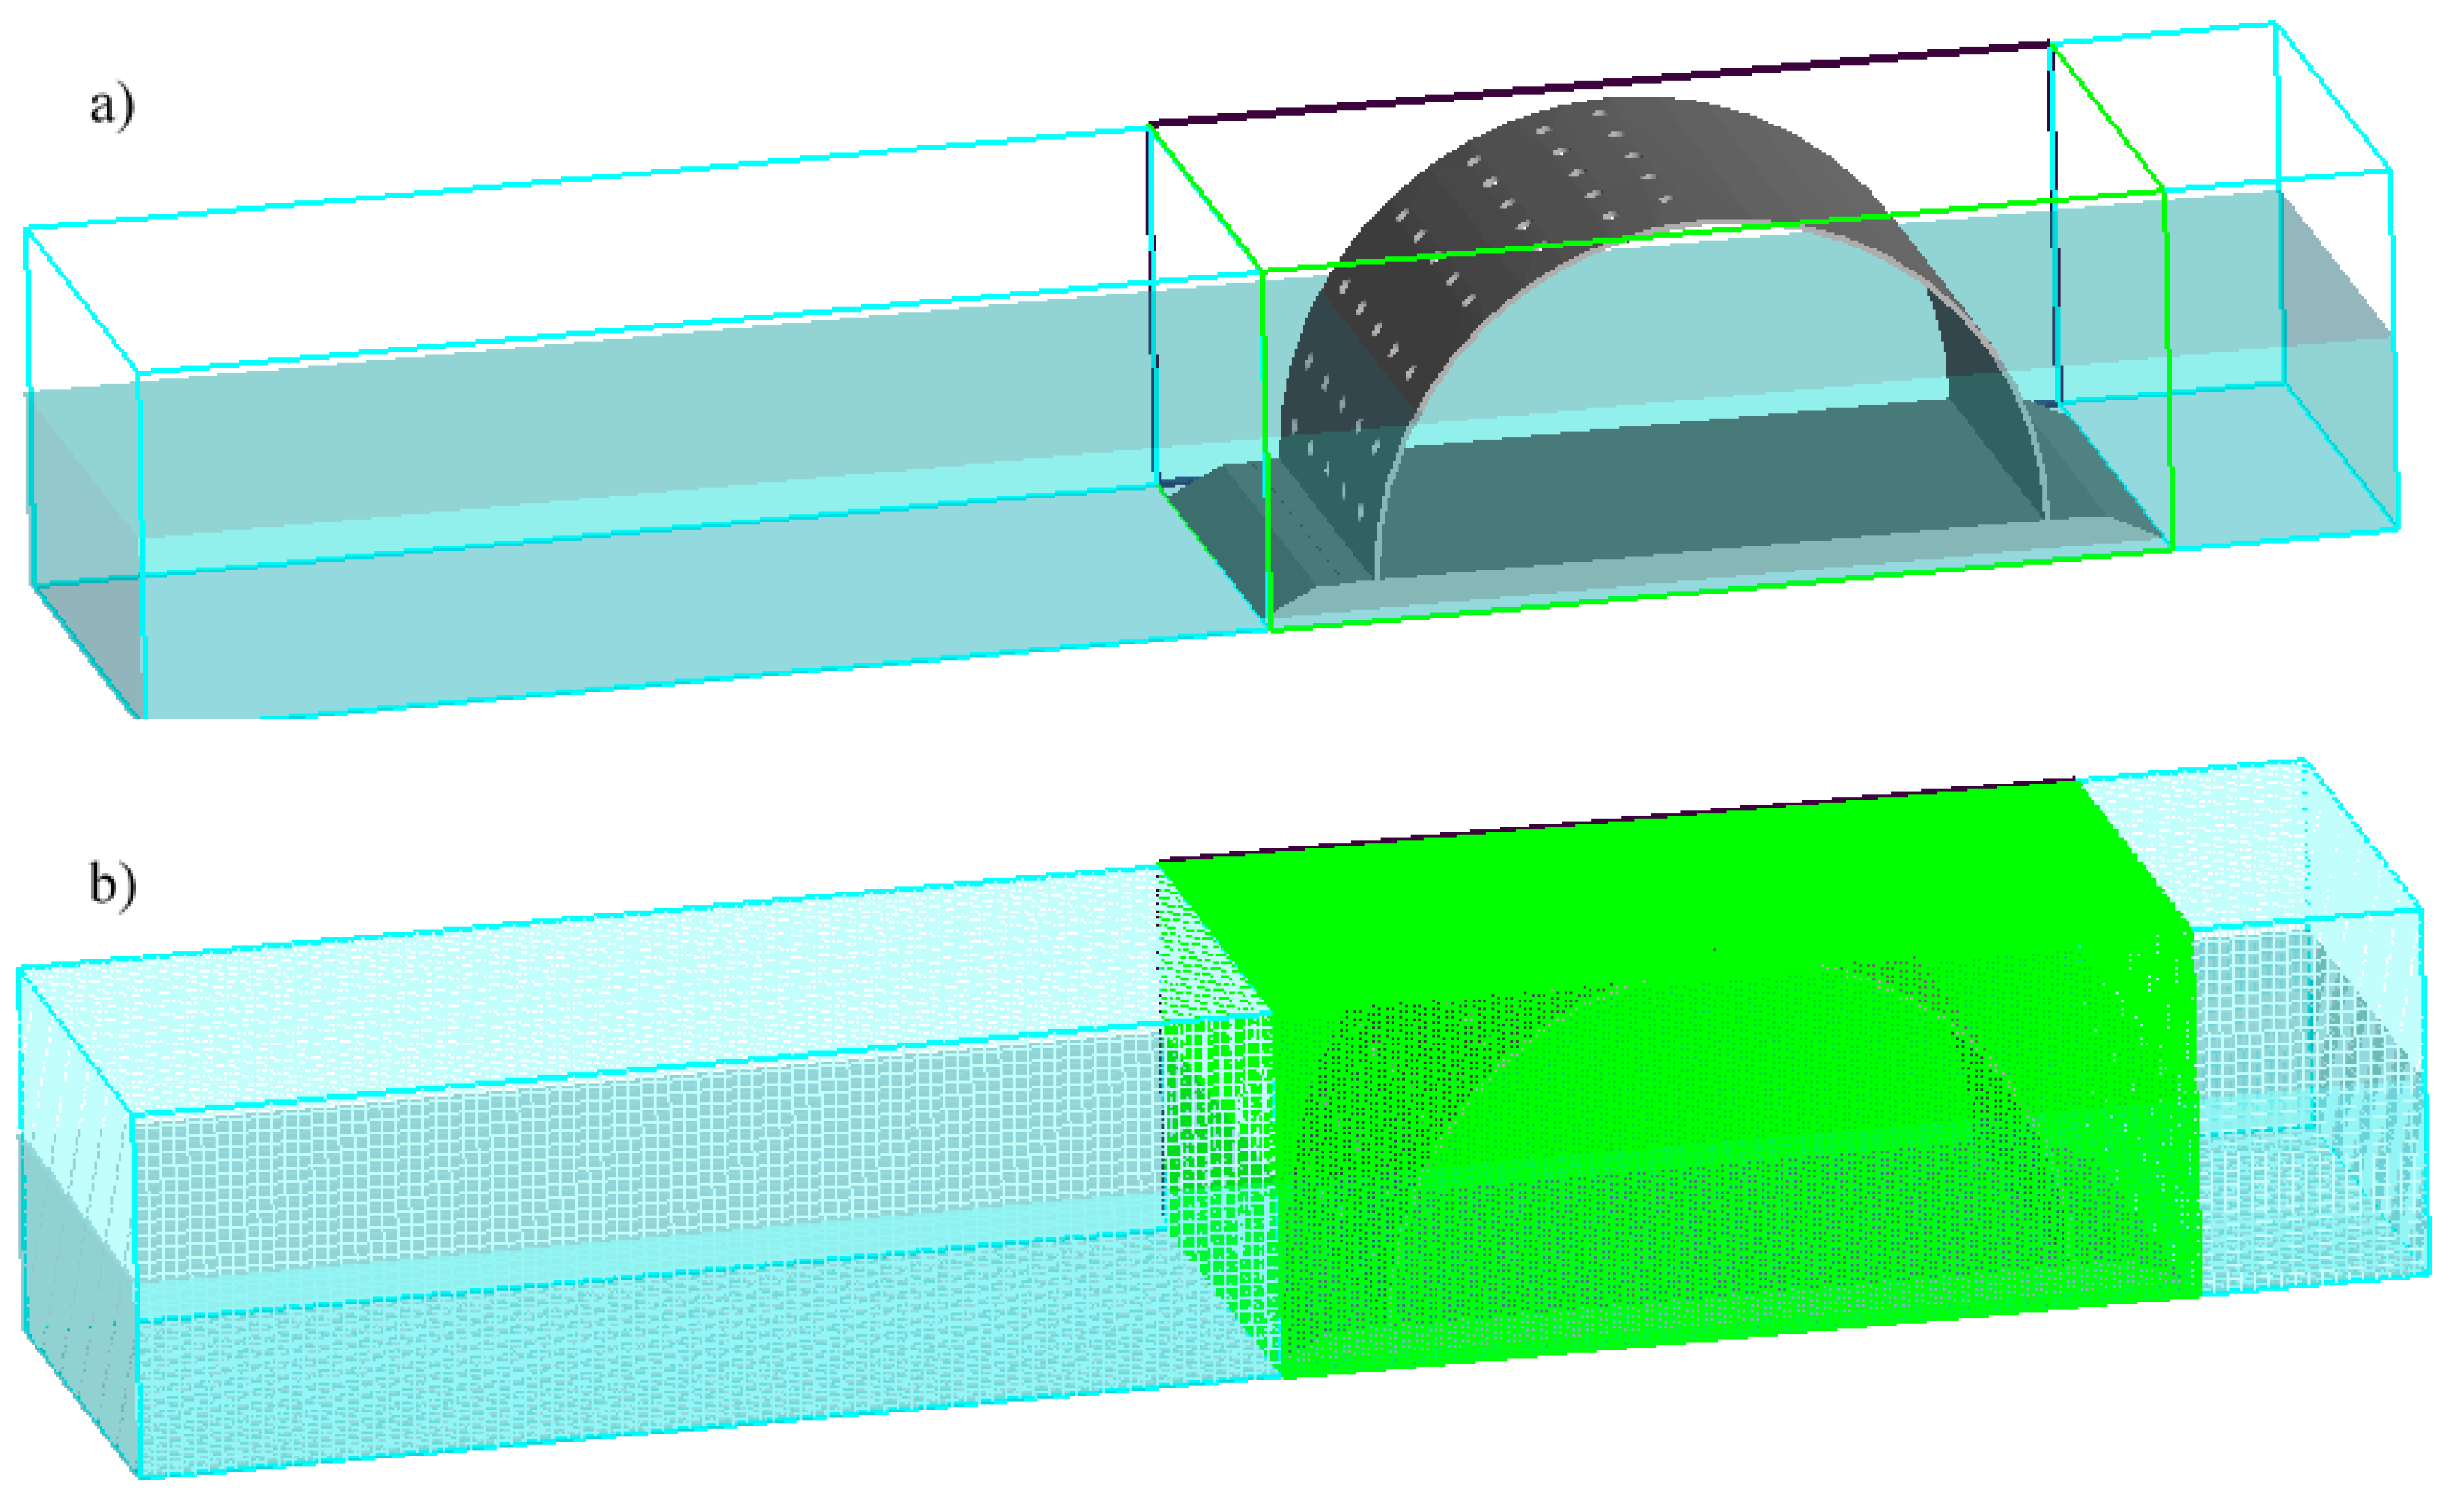
The three-dimensional geometry of the breakwater model was defined in a CAD tool and exported into a stereo lithographic format (STL) to be used in FLOW-3D®. The dimension of the breakwater holes conditioned the minimum cell size of the 3D grid. The accuracy of the results and the simulation time depend on the size and number of the cubic cells. It is important to minimize the total number of cells, but at the same time it is necessary to consider a sufficiently high spatial resolution to be able to simulate all the relevant flow patterns and all the details of the geometry. Thus, three blocks with different cell sizes were adopted throughout the domain (
Figure 2).
The total number of cells used to discretize the domain was 1901659. The first block presented 80676 cells of 0.12 m in size, the second block, which comprises the breakwater, presented 1804000 cells of 0.04 m in size and the third block presented 16983 cells of 0.12 m in size. Several initial simulations were defined using different grid resolutions in order to achieve an adequate solution in terms of capturing the relevant flow details with acceptable computational CPU (central process unit) times. On average, each simulation lasted 12 hours (CPU—4 Intel Core™ i7-6700k @ 4.0 GHz) to simulate 20 seconds of wave hydrodynamics.
At the left open boundary, the incident wave conditions were imposed. At the right boundary an absorption boundary was adopted to avoid or mitigate the effects of wave reflection. In all other open boundaries, symmetry conditions were defined. The type of incident wave was defined according to the wave height (Hi), period (T), water depth (d) and wavelength (L) for the case of cnoidal waves. As initial conditions, a fluid region was considered along the simulated channel. The fluid used in the simulations was water at 20° with null salinity.
2.4. Simulated Scenarios
Simulated scenarios considered several water depths and different characteristics of the incident waves. For each scenario, the adopted wave characteristics are shown in
Table 1, namely the wavelength, significant wave height, wave period and average water depth; the adopted wave type at the boundary was defined according to [
35]. For model validation, five simulations were performed (scenarios 1, 2, 3, 4 and 5), considering a dimensionless depth range between 0.005 to 0.0216, for posterior comparison with the experimental results. For assessment of the hydrodynamic conditions in the semicircular perforated breakwater, scenarios 2 and 5 were taken in intermediate water conditions (0.05 < d/L < 0.50) and scenarios 6 and 7 were added as representative of shallow water conditions (d/L < 0.05). For comparison with a non-perforated semicircular breakwater, scenarios 8 to 11 were set up.
3. Results
Three-dimensional (3D) results for free surface elevation and pressure are presented for relevant scenarios. Also, the results of the horizontal pressure forces are shown for the five scenarios used to validate the model (scenario 1, 2, 3, 4 and 5). Finally, the turbulent kinetic energy, together with the respective dissipation rate, are compared for both simulated breakwater types.
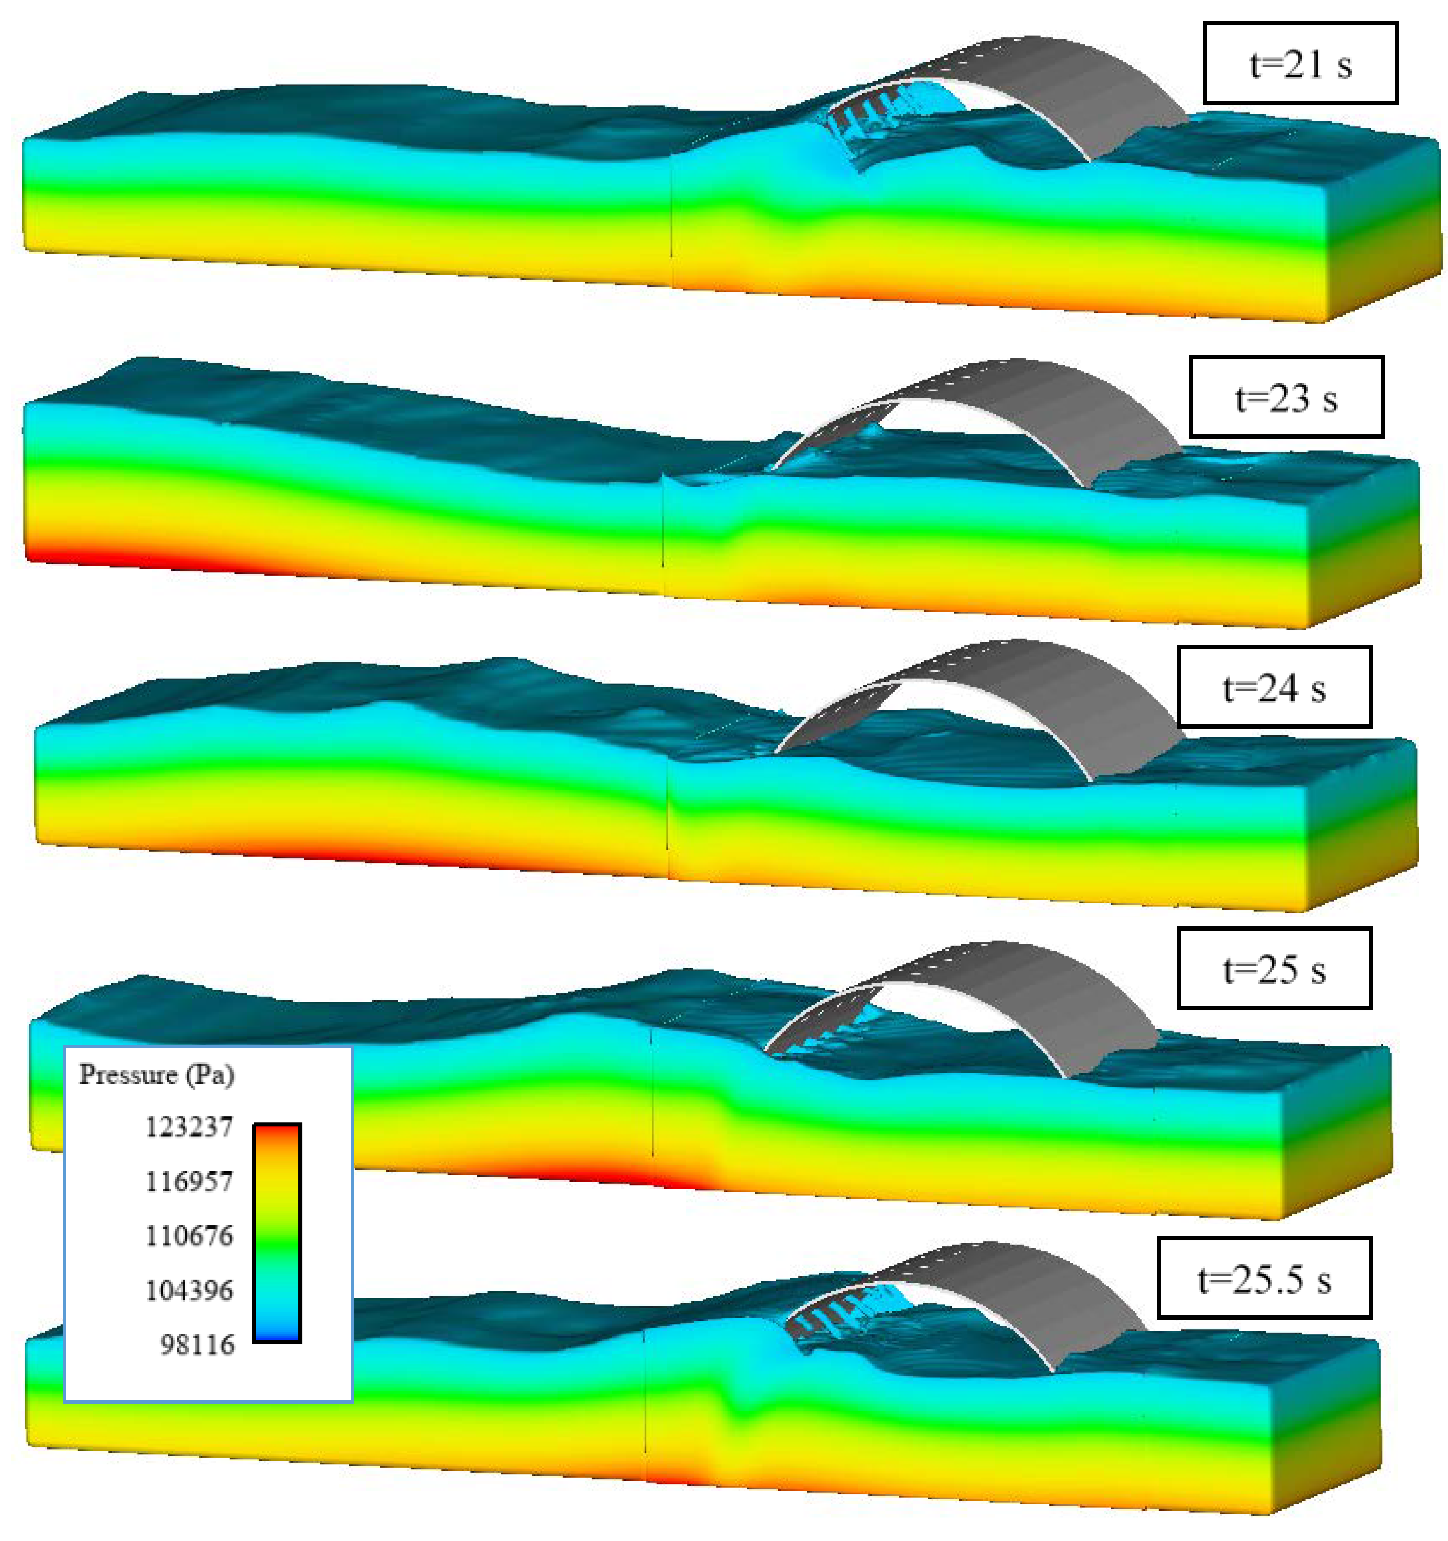
The three-dimensional wave dynamics for scenario 2 is presented in
Figure 3. Surface elevation and pressure are shown at five different instants along one wave period (4.52 s). The fluid-structure interaction is simulated with sufficient detail as demonstrated by the water flowing throughout the breakwater holes.
It is also possible to observe the evolution of the wave as it travels until reaching the perforated face of the semicircular breakwater. The waves that reach the semicircular breakwater are partially reflected, with simultaneous water entering the breakwater through the perforations, dissipating energy, and thus, reducing wave reflections.
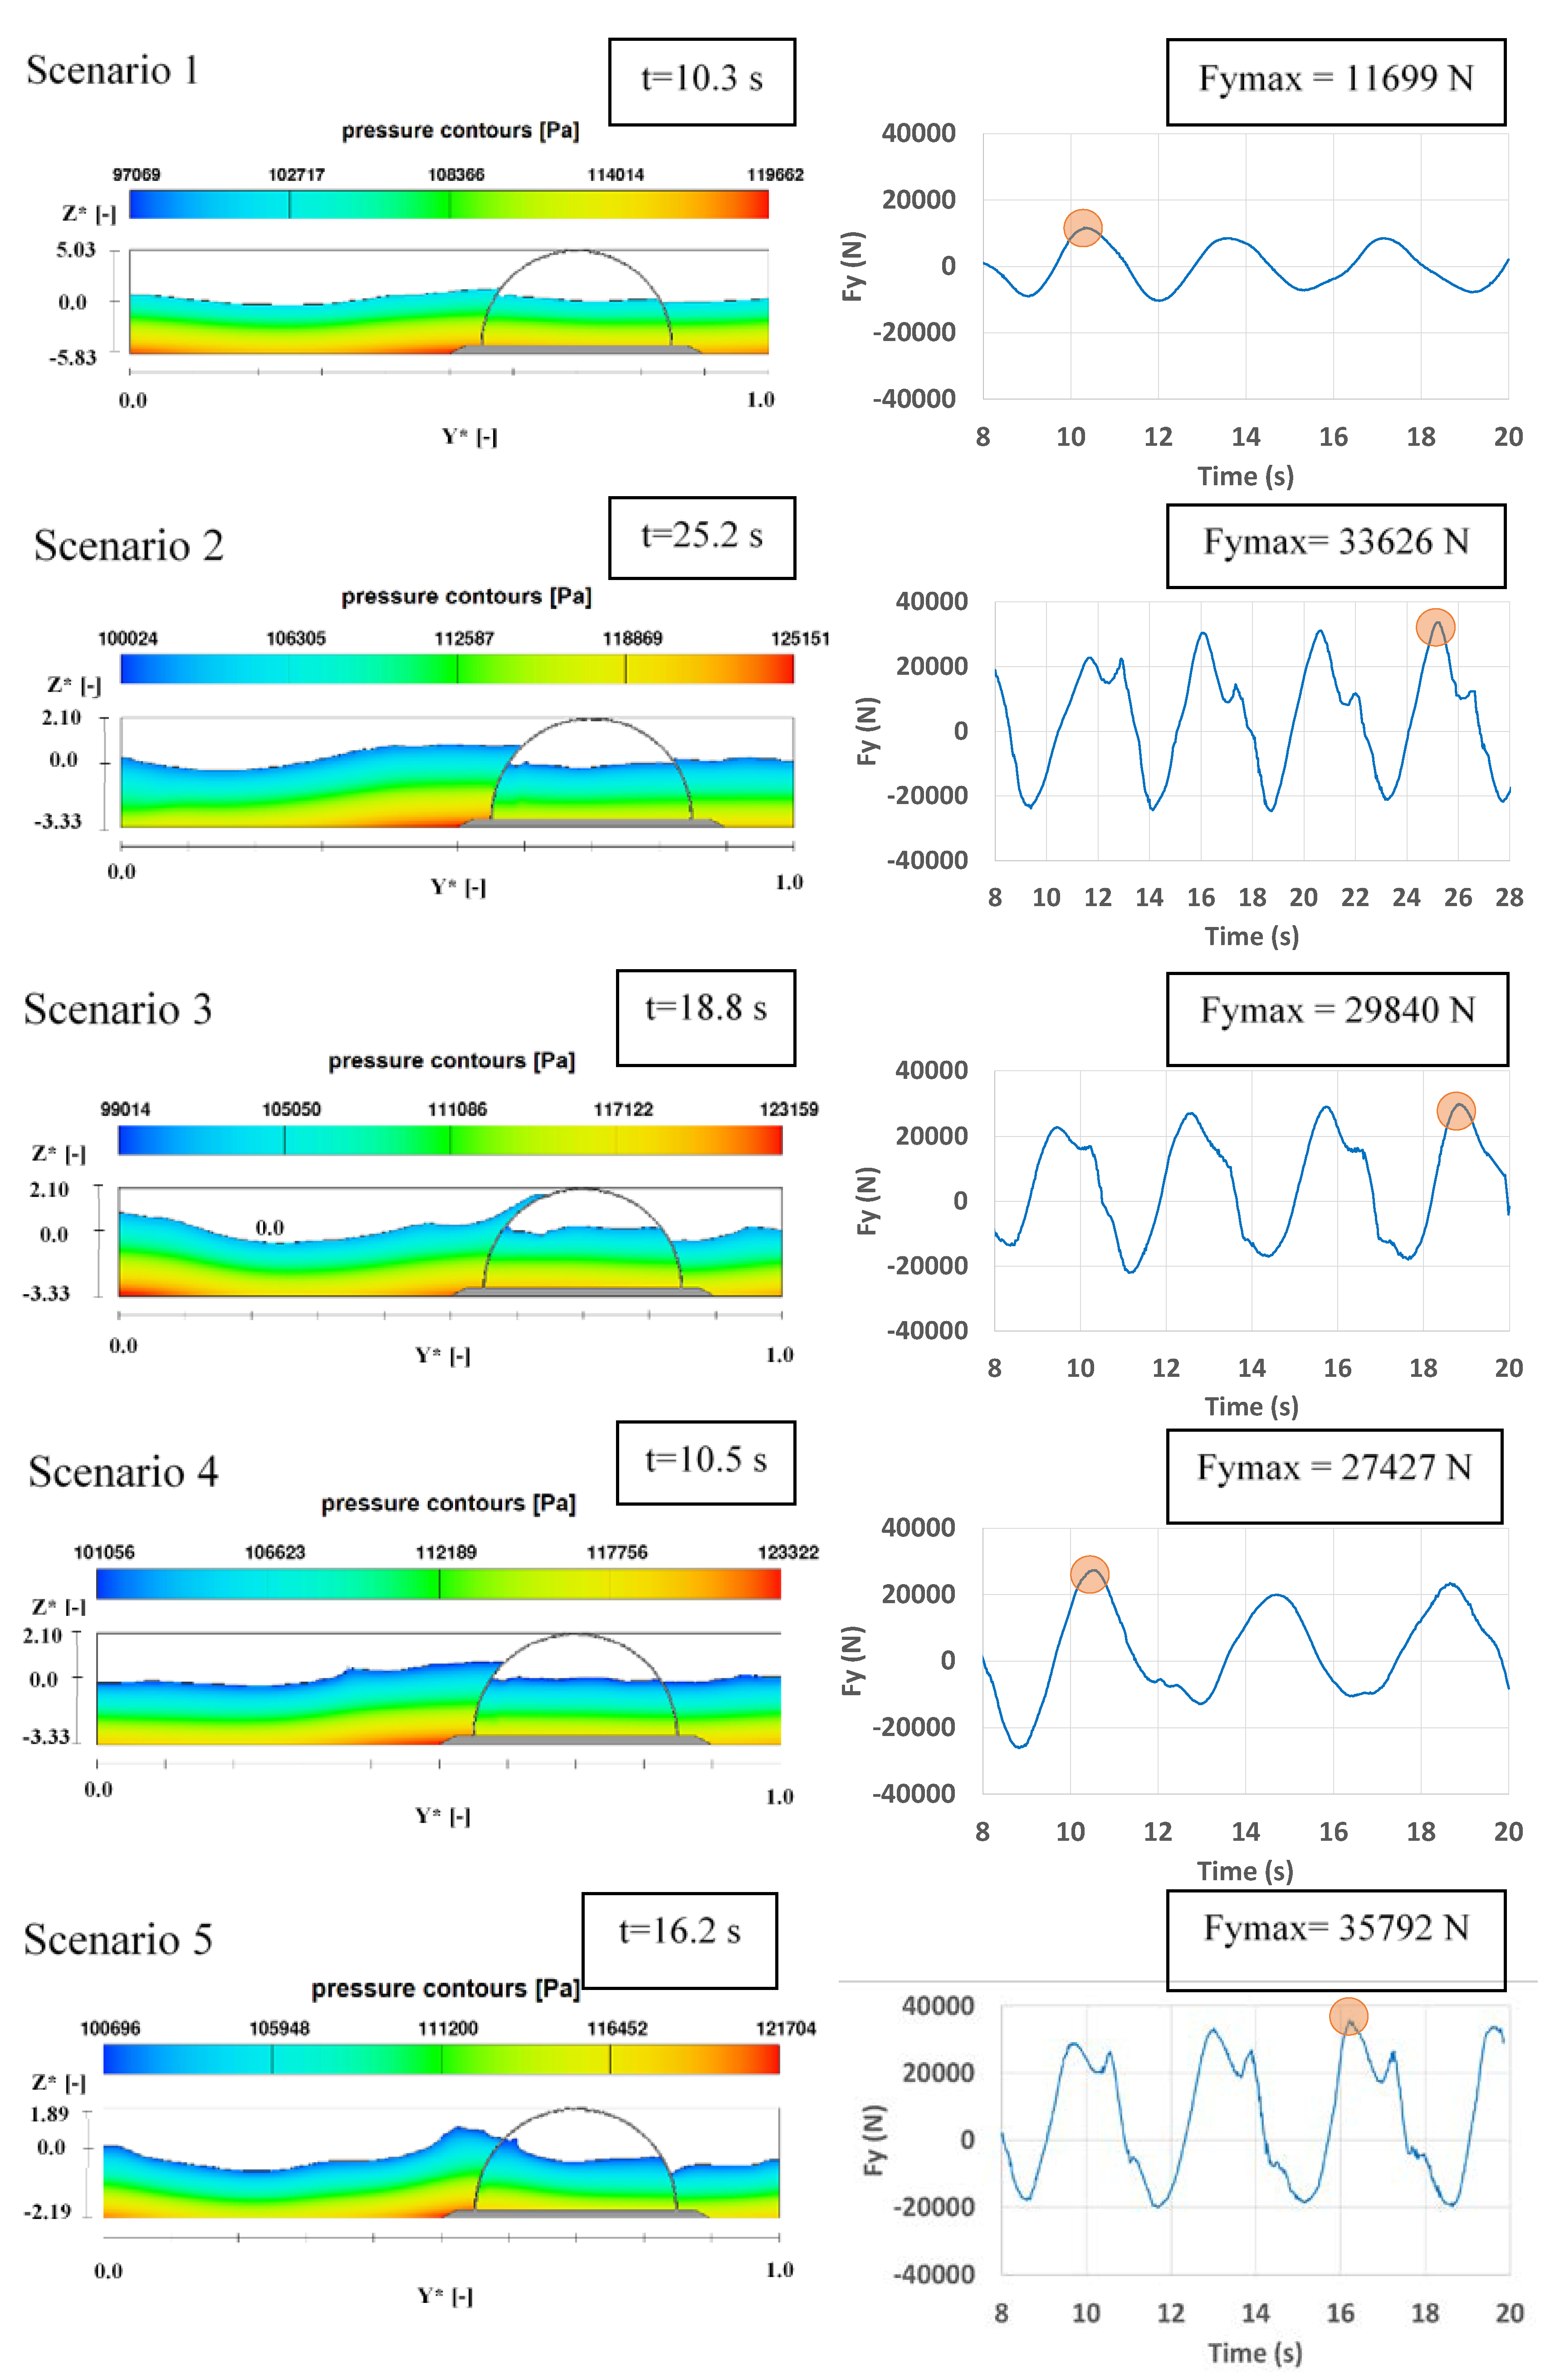
Wave loads, acting on the breakwater, vary depending on the water depth and the wave parameters, such as the significant wave height and the wave period. With model implementation of the breakwater as GMO on the foundation base, it was possible to obtain the resultant of the pressure forces along the x, y and z directions.
Figure 4 presents the maximum horizontal component of the pressure force (Fymax) for five modelled scenarios (1 to 5,
Table 1). The images on the left side show the pressure as well as the free surface in a two-dimensional (2D) view (y-z) at the instant when the force is maximum. The graphs on right show variations of the forces over the simulation time.
It is noted that the horizontal pressure force increases with wave height, as expected, since the associated wave periods have similar values (ranging from 3.19 s to 4.52 s), and the maximum force acts in the direction of wave propagation in all simulations. However, pressure forces of almost equal magnitudes act in the opposite direction. These results will be used to estimate the required breakwater weight and compare them with experimental results, in order to validate the model later in the discussion section.
For scenarios 8 and 9 with waves and water depths identical to those assumed in scenarios 2 and 5 and considering a non-perforated breakwater, the maximum horizontal pressure forces were 38904 N, and 38423 N, respectively. This corresponds to an increase of 14% (scenario 8) and 7% (scenario 9) in the maximum pressure forces for the scenarios involving a non-perforated breakwater.
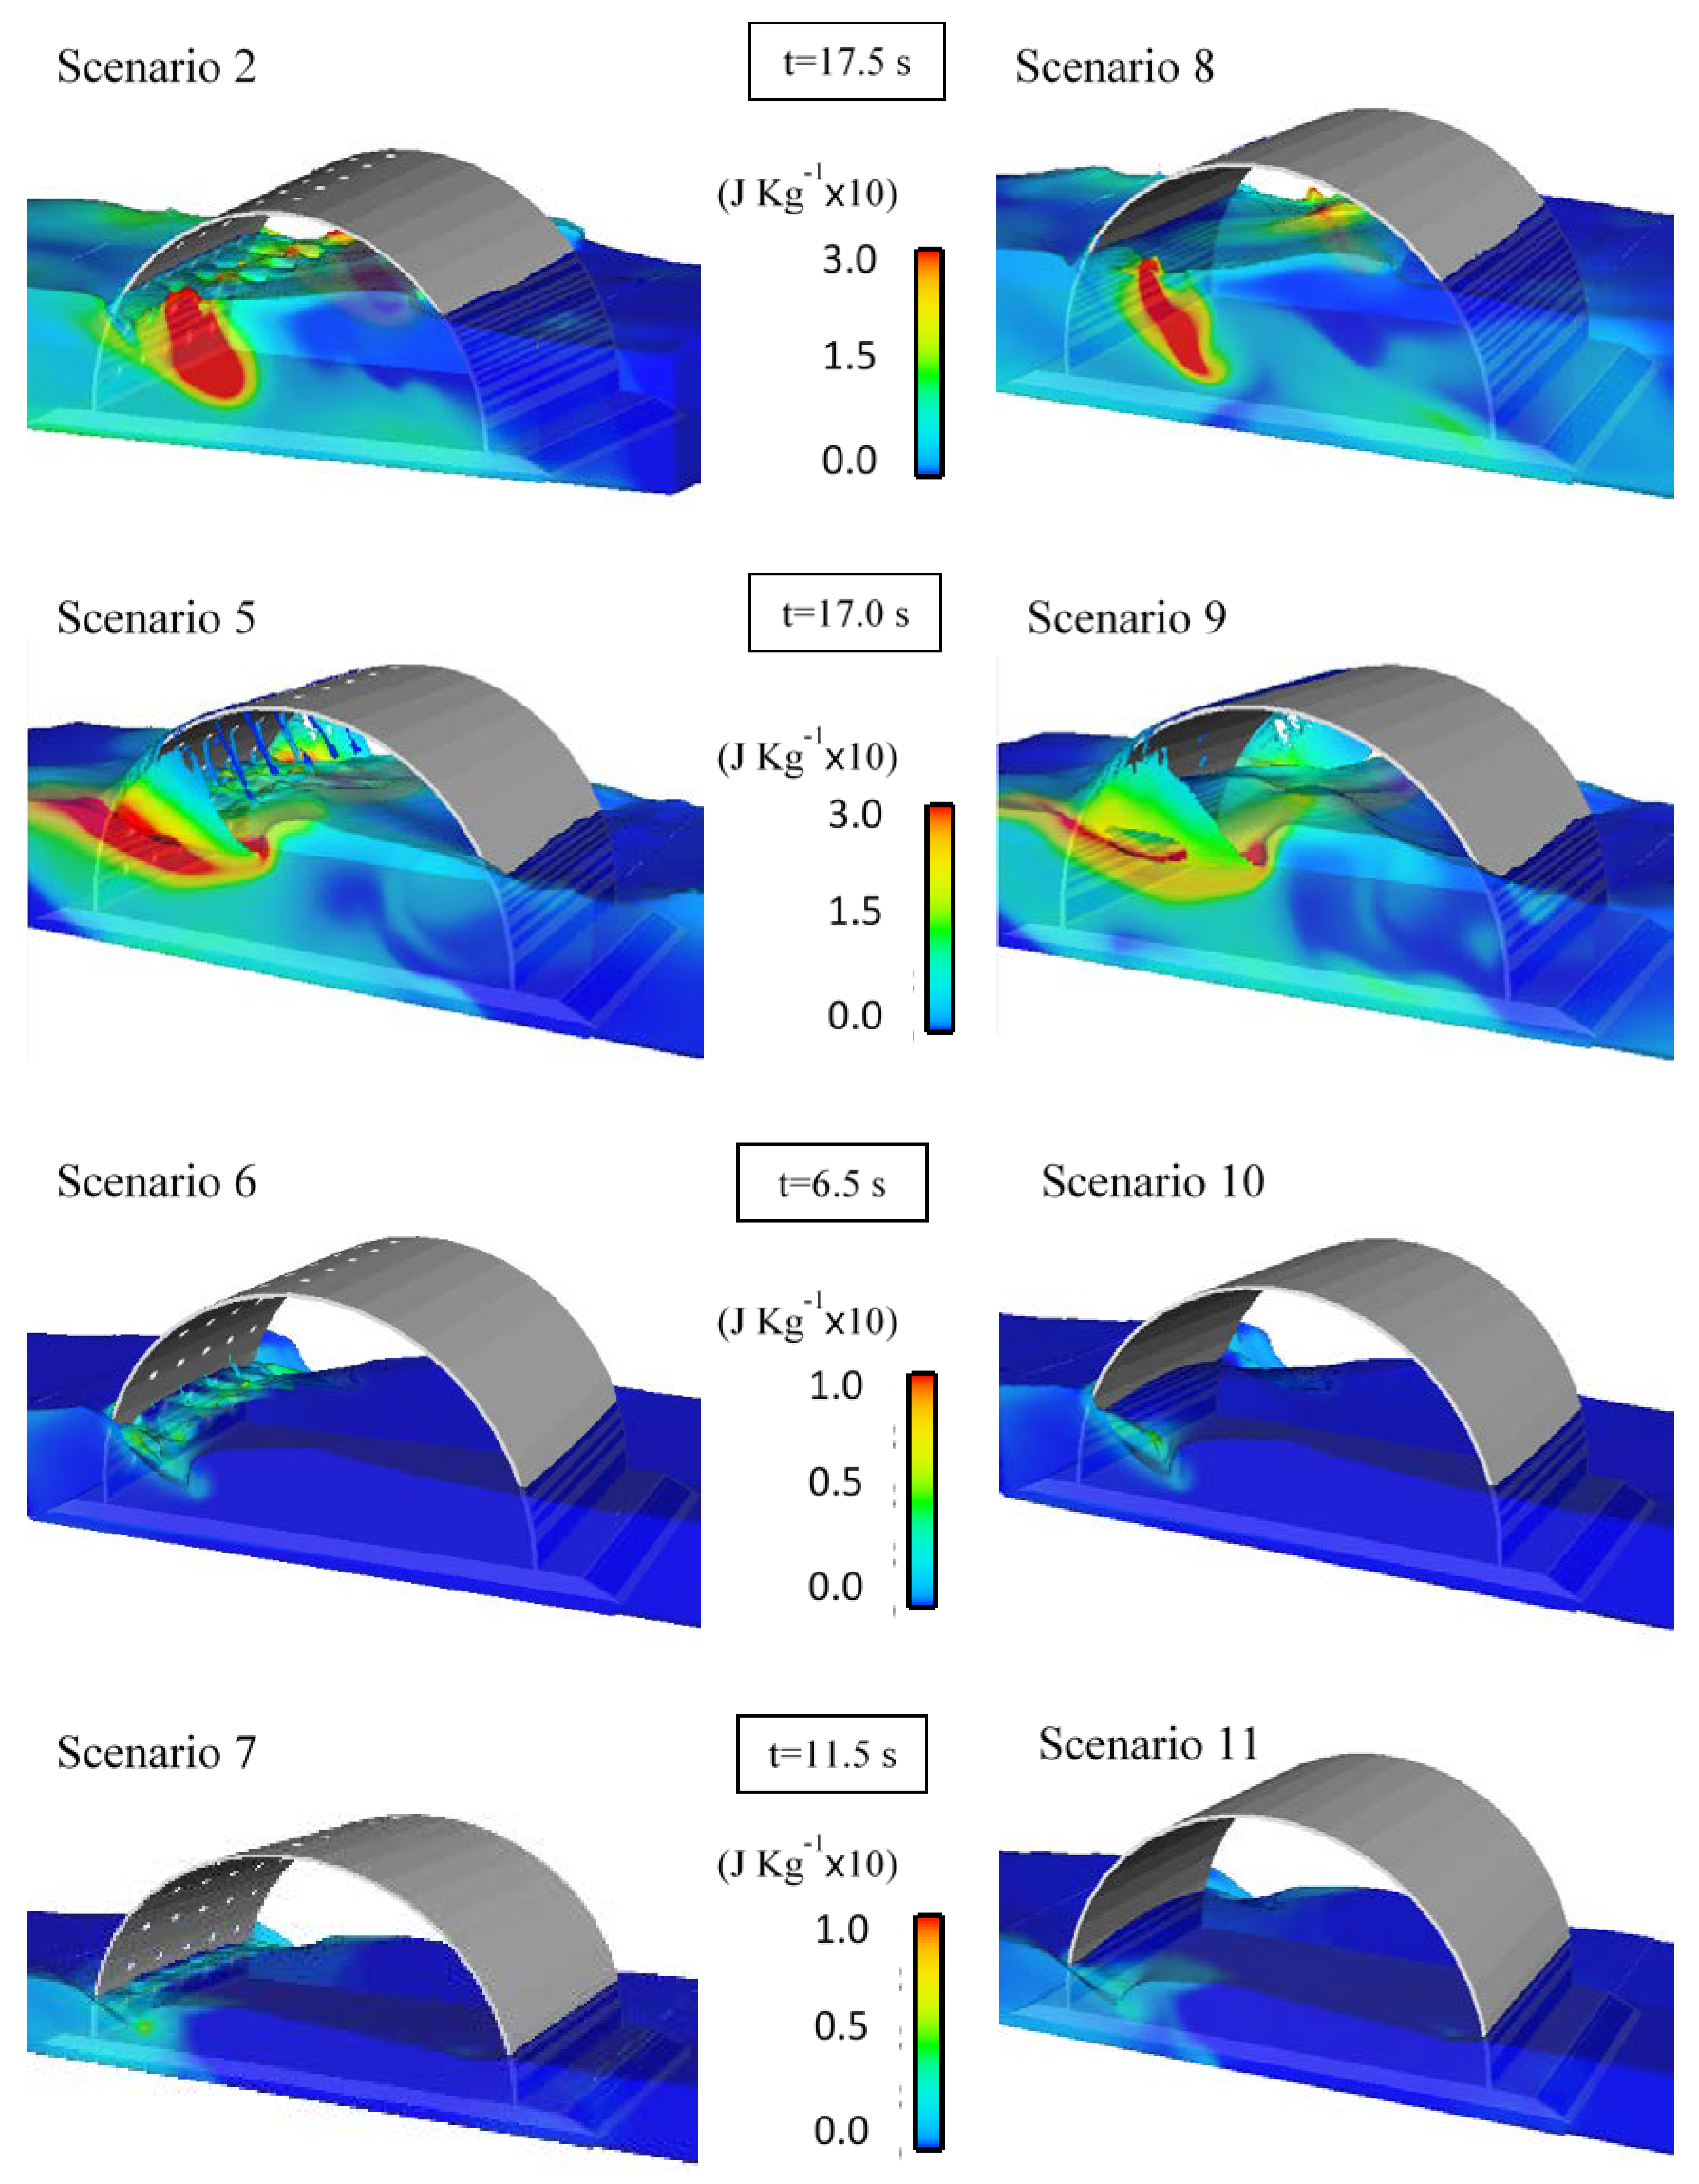
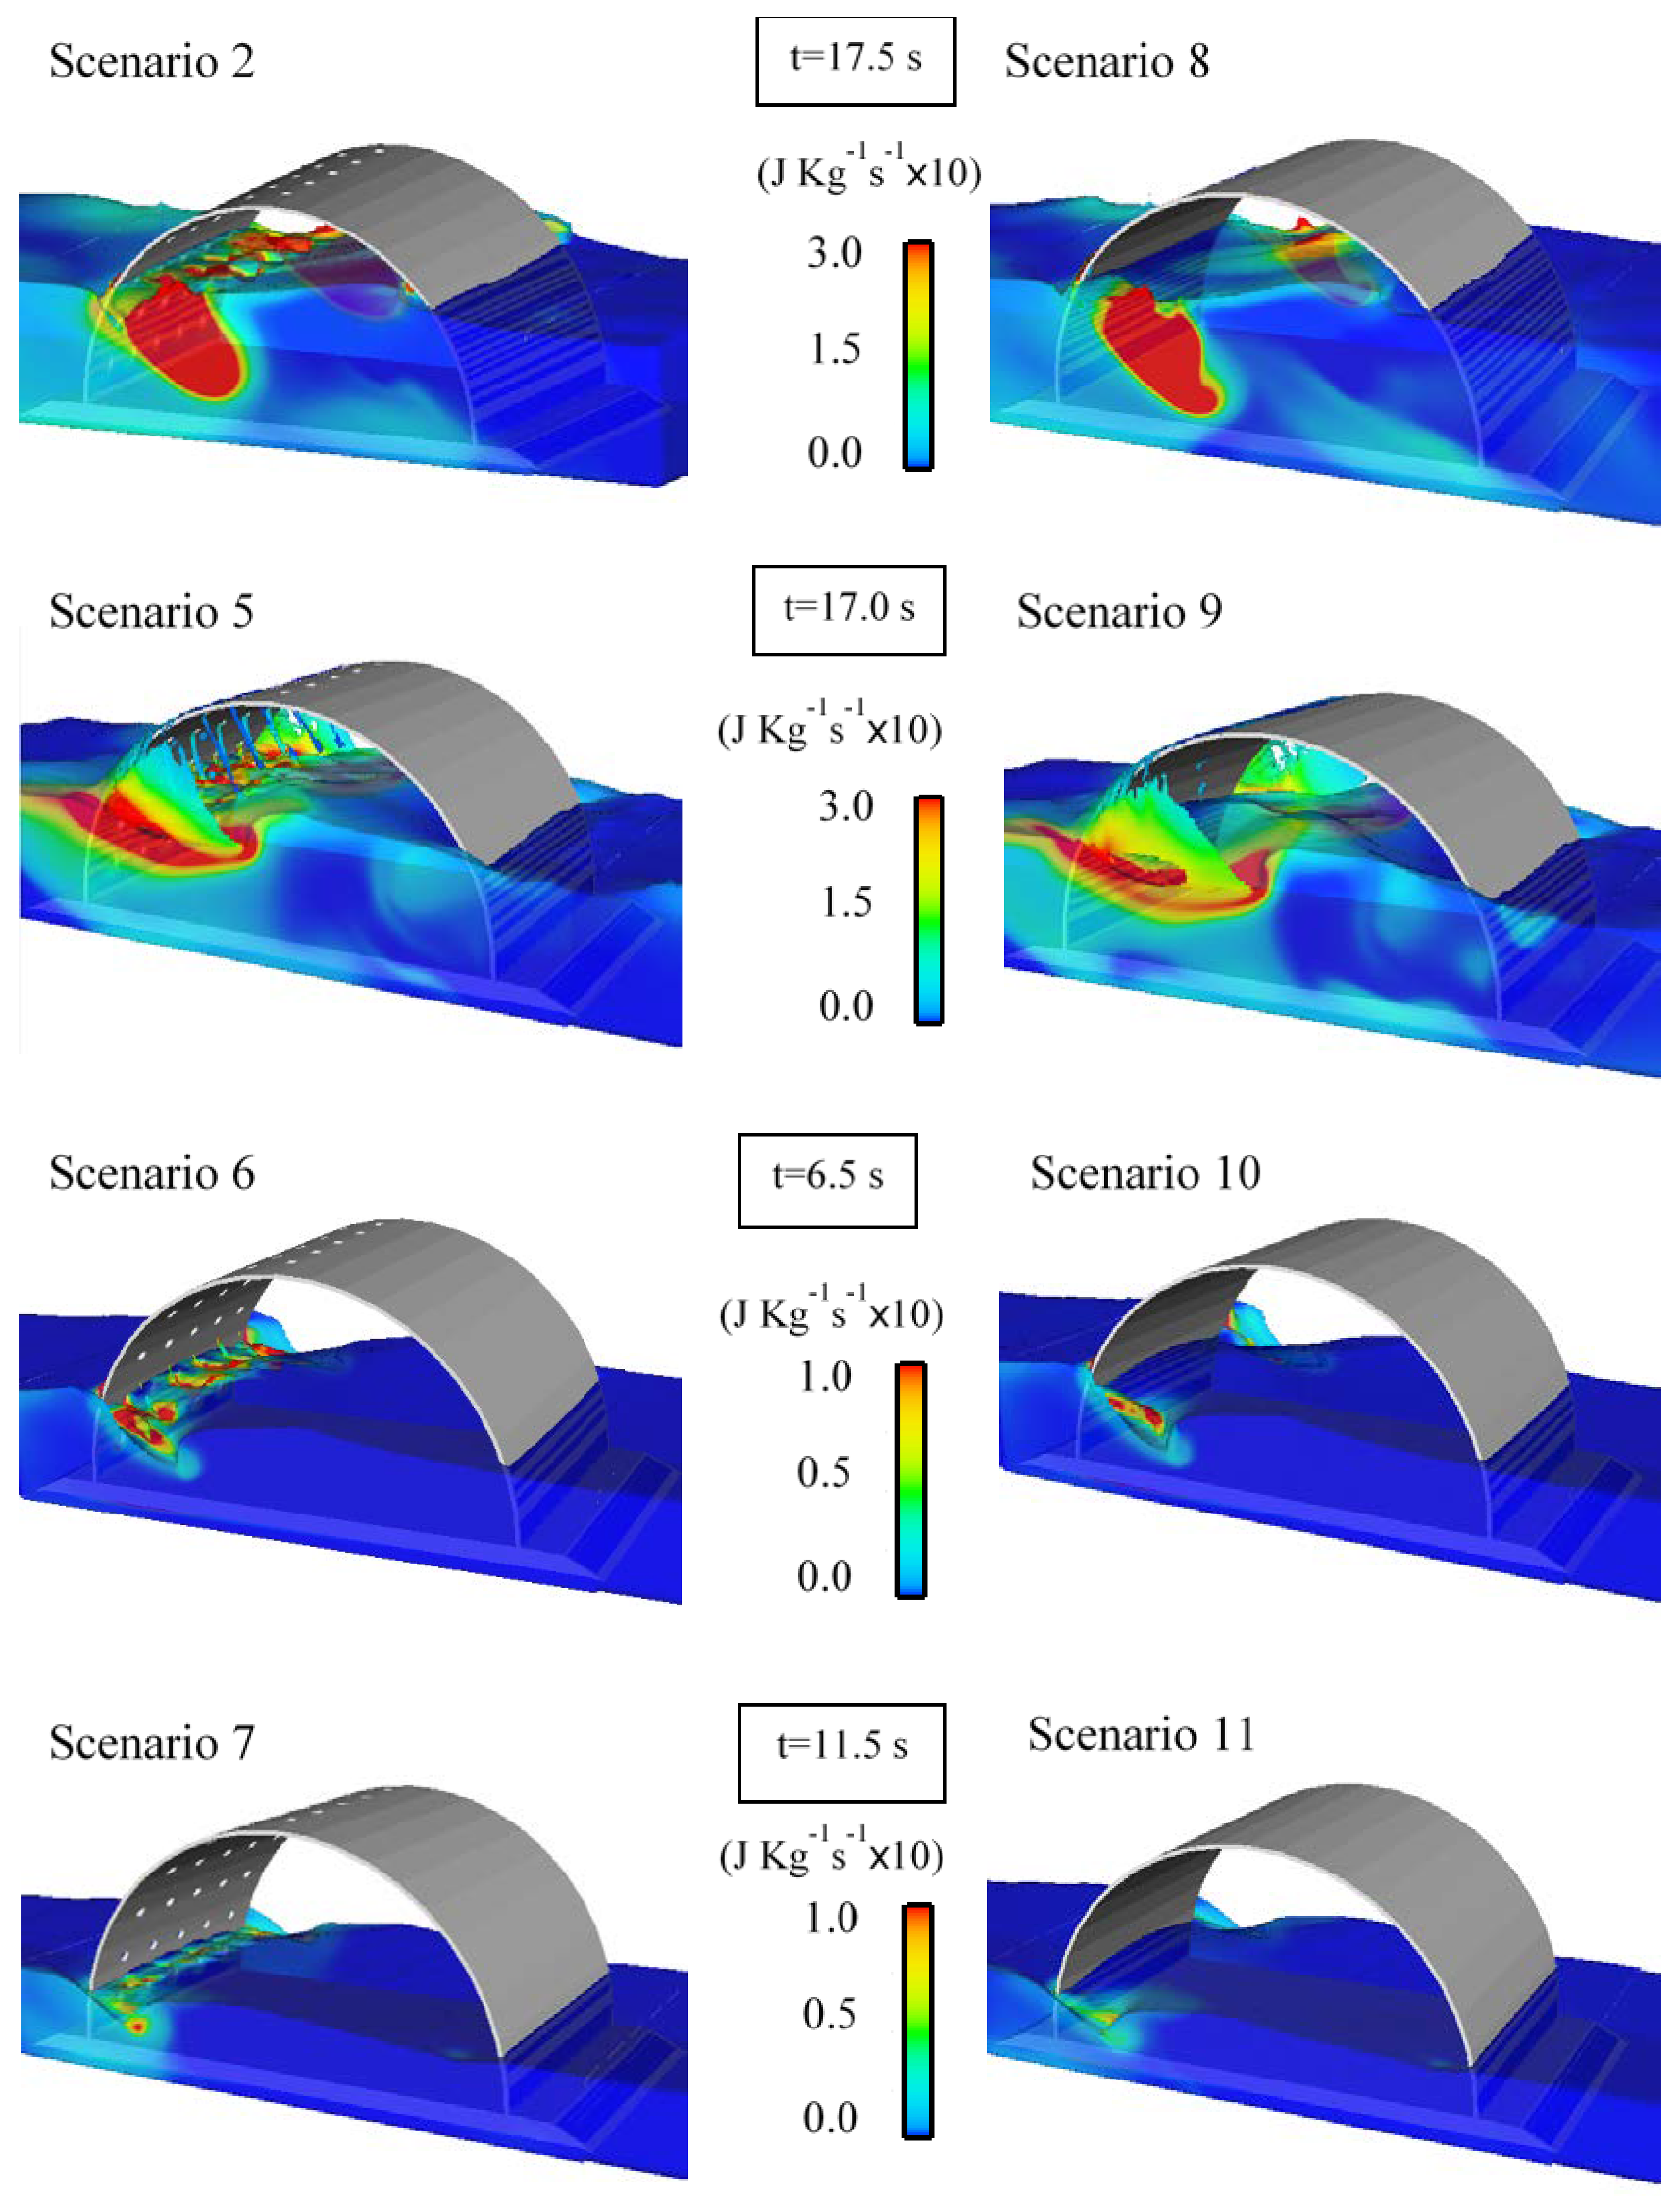
Figure 5 and
Figure 6 present the generated turbulent kinetic energy (TKE), and its dissipation (DTKE), around the breakwater module, respectively. The results shown correspond to the maximum TKE and DTKE instants in the perforated breakwater scenarios. TKE is distributed along the surface holes and at the breakwater extremities for the case of the perforated breakwater. In the non-perforated case, the TKE is concentrated at the breakwater extremities for all scenarios.
4. Discussion
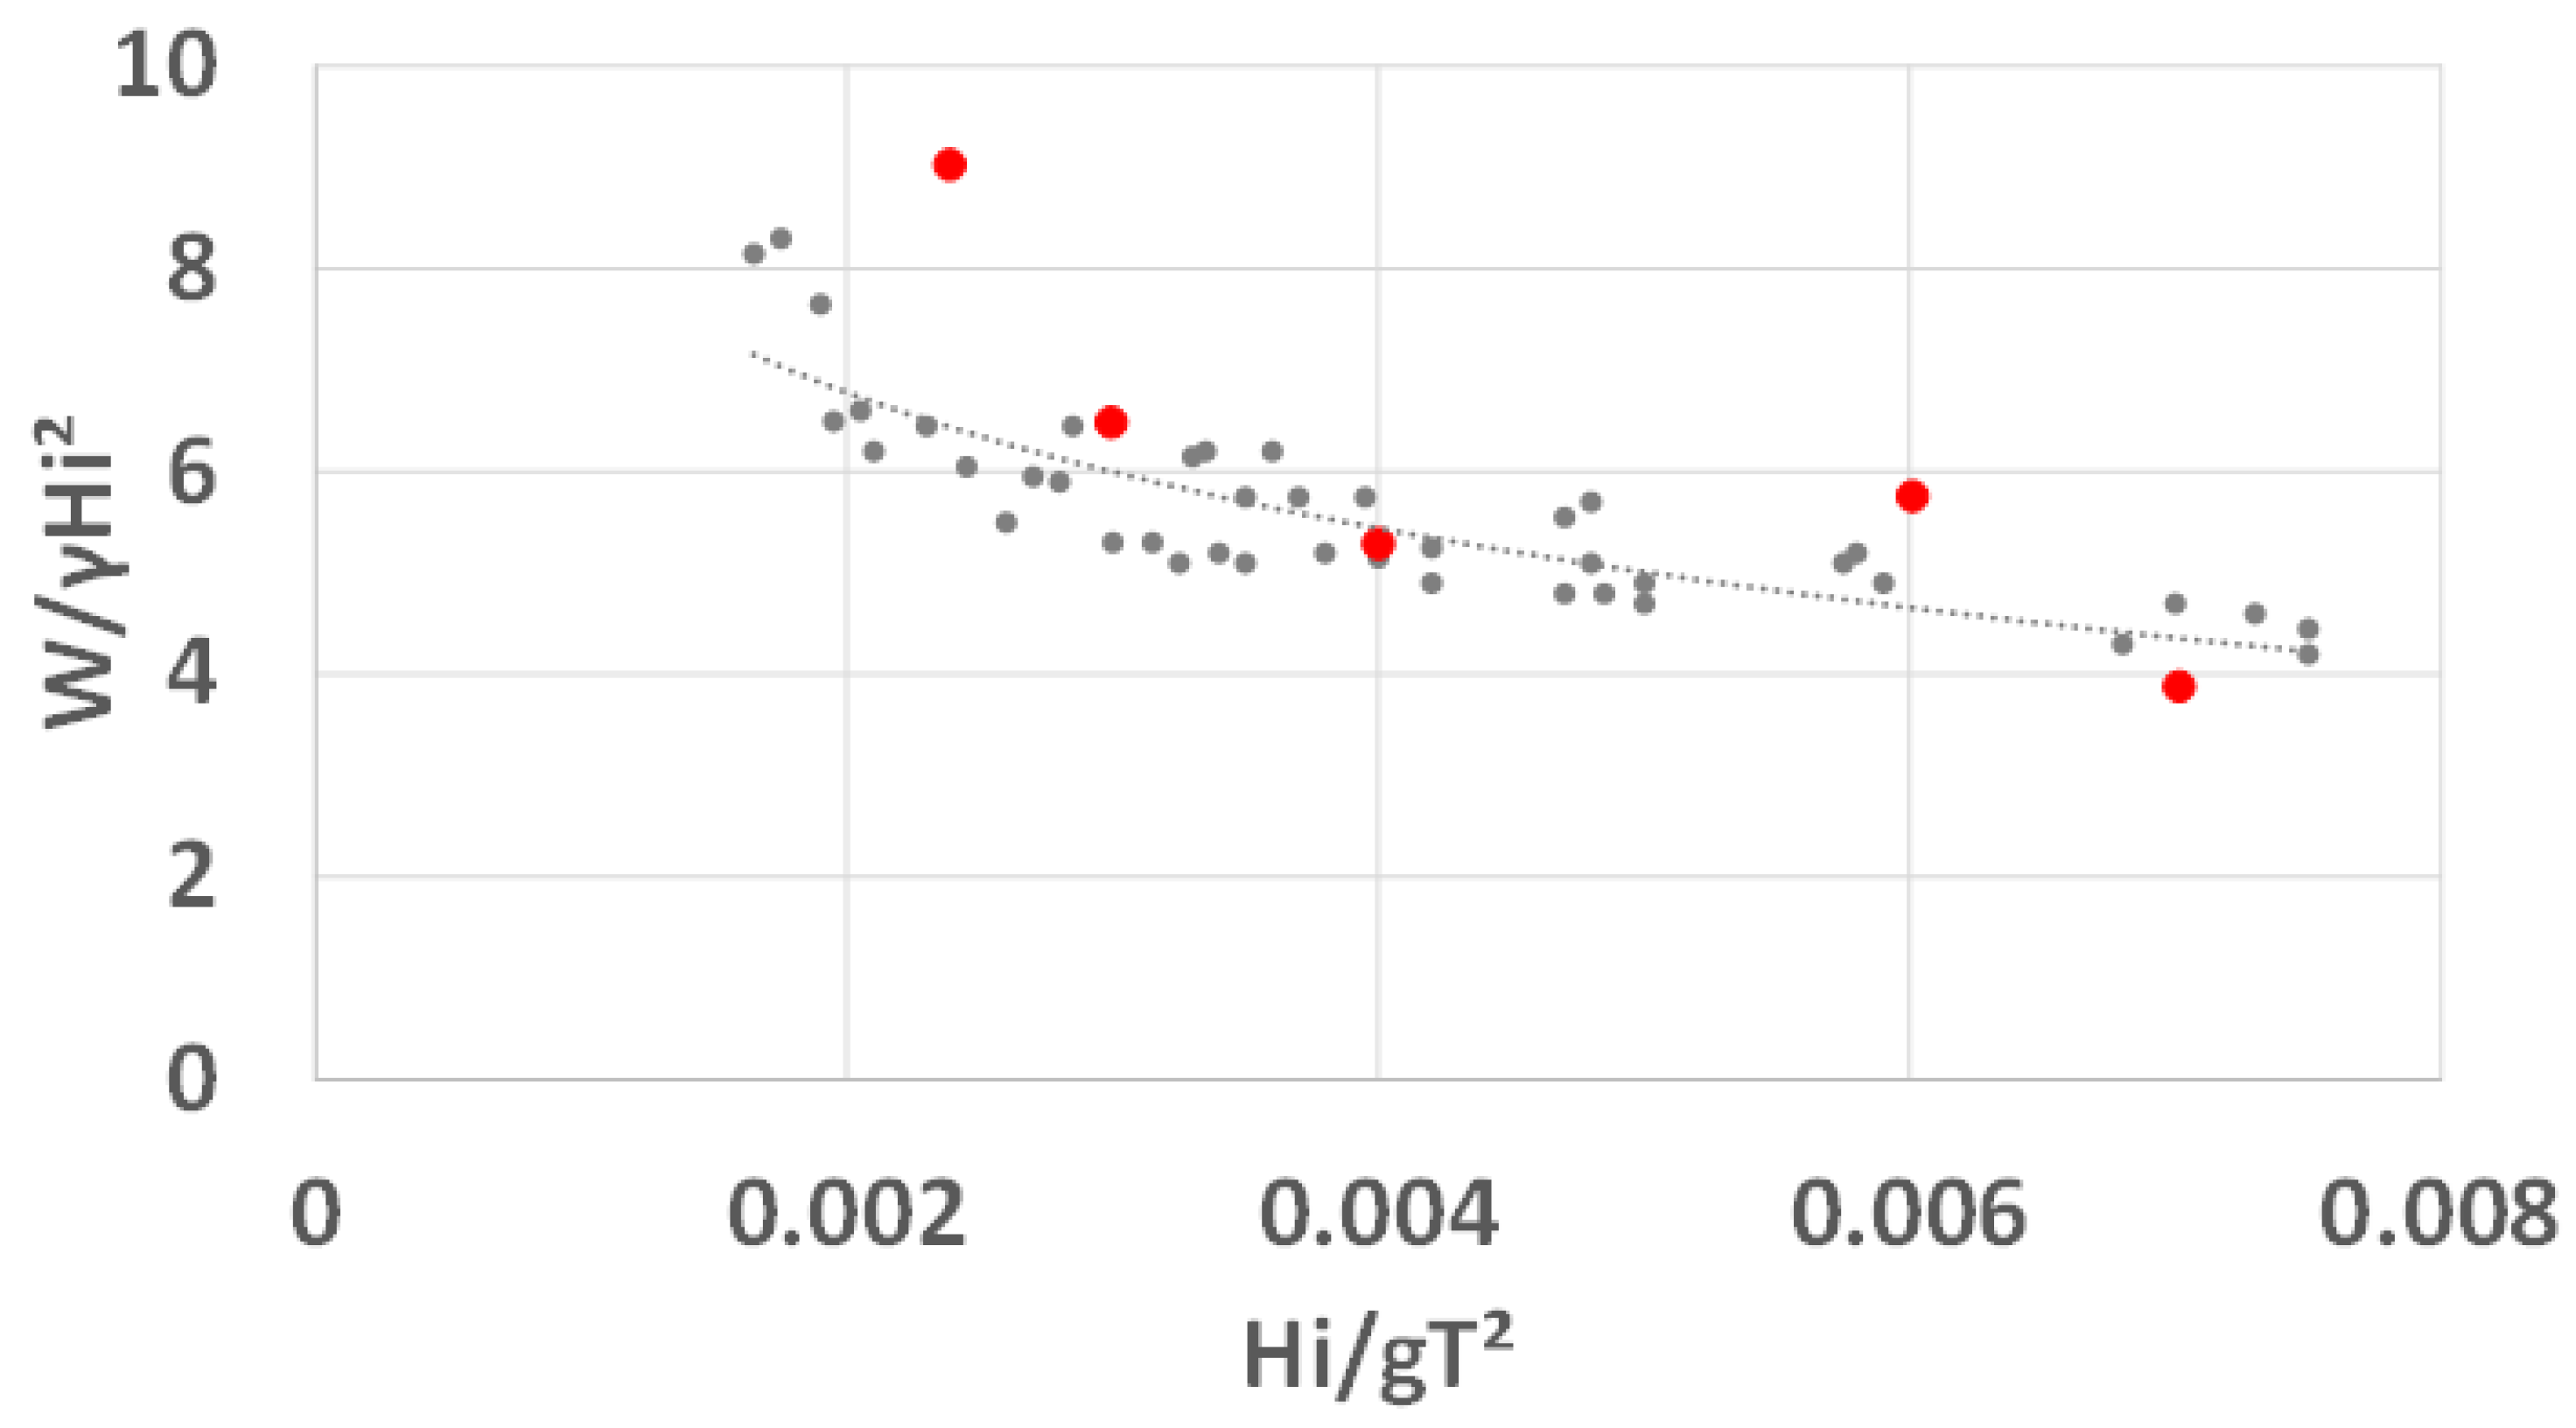
The monogram presented by [
22], provides the critical weight (W) necessary to assure the sliding stability for the emerged perforated breakwater obtained from experimental results. The simulated numerical scenarios 1 to 5 are in the range of these experimental results. The corresponding stability parameters (W/γH
i2, where γ is the fluid specific weight), and the dimensionless incident wave parameter (H
i/gT
2) were inserted (red dots) in the monogram (
Figure 7).
As can be observed, numerical results have a rather good approximation, compared to the experimental results, which prove the excellent performance of the computational model in the simulation of this complex fluid-structure interaction problem. It should be noted that as the dimensionless incident wave parameter (H
i/gT
2) increases, the stability parameter (W/γH
i2) decreases. This behaviour can be explained by the fact that the longer period waves exert greater forces on the structure, when compared to short waves period. This was already concluded by [
22].
The hydrodynamic performance of breakwaters is usually assessed by different coefficients. One of those coefficients is the reflection coefficient, which is the ratio between the heights of the incident and the reflected waves. Several methods for computation of this coefficient are proposed in the literature (eg., [
36]). More recently [
37] proposed a method to quantify this coefficient using the measurement of the velocity at a single point. Based on this method, we estimate for scenario 2 a value of 0.65 and for scenario 8 a value of 0.67. This means that both solutions of the breakwater present the same wave reflection behaviour, despite the existence or not of the adopted perforations.
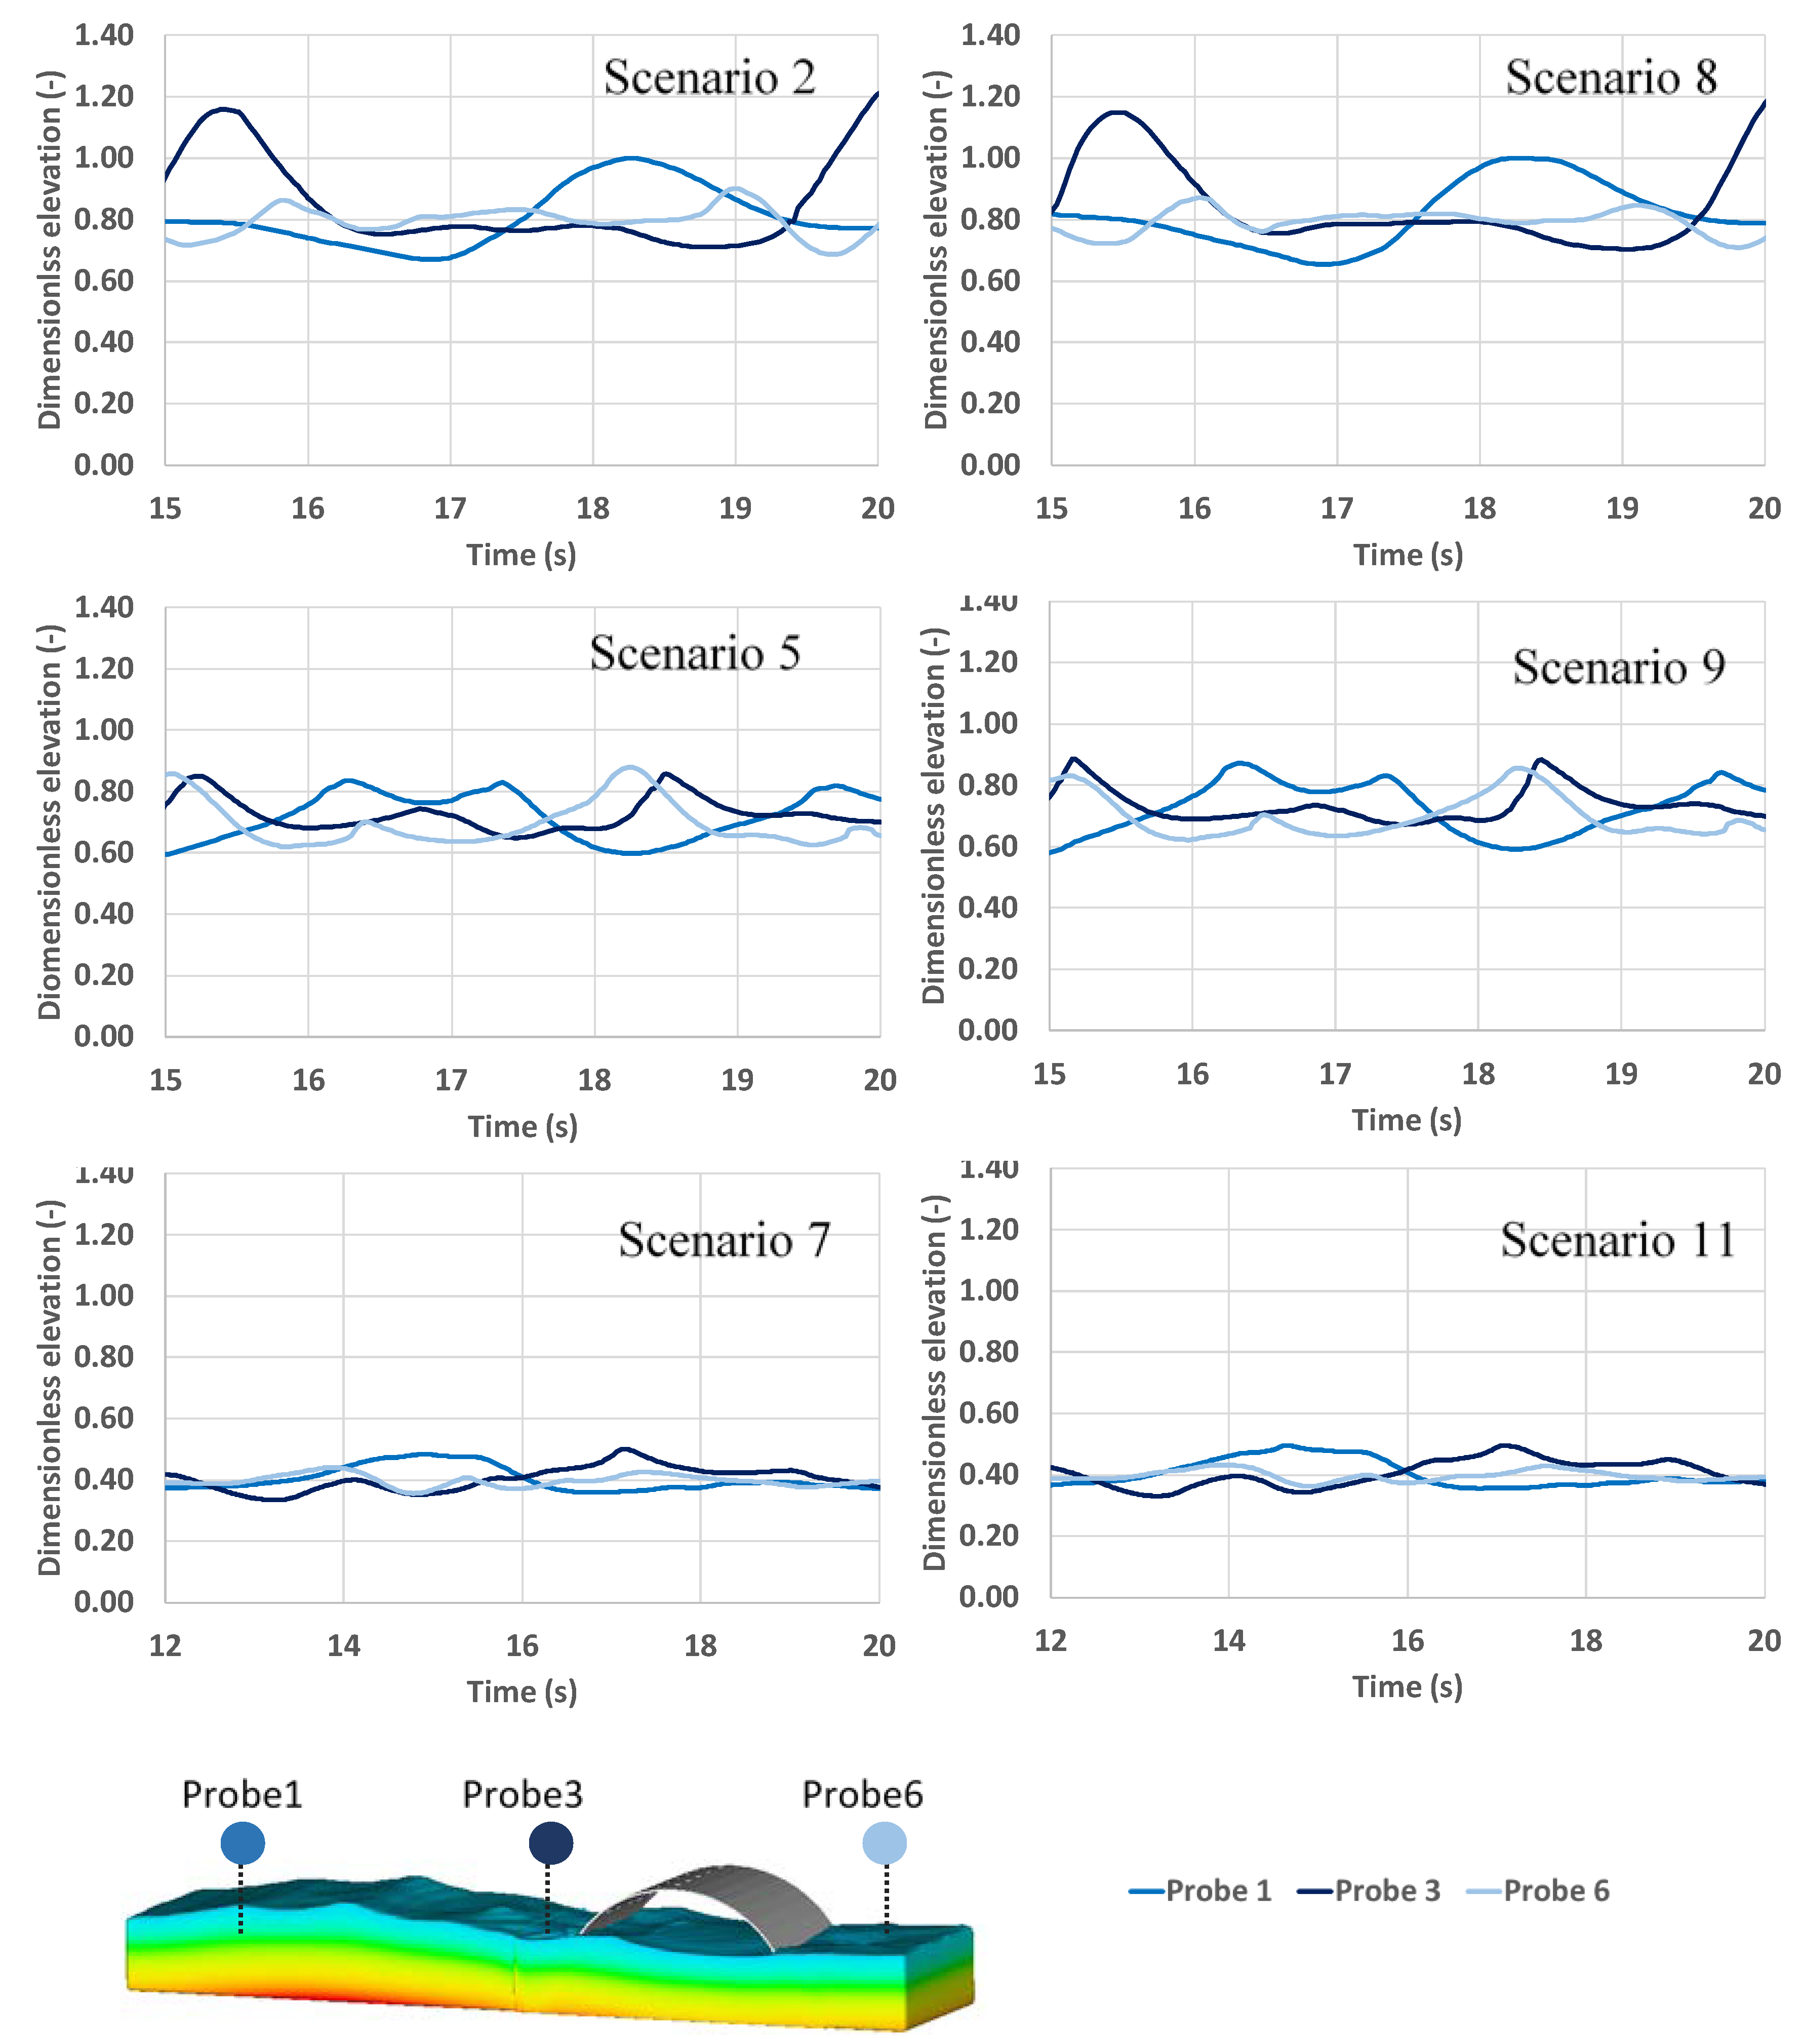
Wave energy transmission conditions are showed by water surface elevation results presented in
Figure 8. Both perforated (2, 5 and 7) and non-perforated (8, 9 and 11) breakwater scenarios have similar wave transmission conditions, since the surface elevation at probe 6 (lee side of the breakwater) is identical. However, the transmitted wave energy differs according to the incident wave characteristics. Indeed, for intermediate water and for scenarios 5 and 9 (short wave period and very high H/d ratio -H/d = 0.46 - which means greater importance of the non-linear effects) the maximum wave heights in the protected region (probe 6) are of an identical magnitude to those of the incident waves. This reveals a limited protection for these conditions at the lee side of the breakwater. For shallow water scenarios 7 and 11, the wave heights at probe 6 are significantly lower than the wave heights at the exposed breakwater face.
Behind the coastal protection that can justify the installation of a semicircular breakwater, other potential benefits should be taken into account. The interior environment of a perforated semicircular breakwater presents a considerable volume with relatively calm hydrodynamic conditions (
Figure 5 and
Figure 6) and considerable surfaces for biological species fixation [
38]. Light availability limitations, imposed by a continuous structure, could be diminished if new modular arrangements for the installation of the breakwater are considered. These arrangements could also benefit from the considerable energy dissipation that takes place at the breakwater extremities, as noted before.
Acting as physical barriers in coastal areas, this type of structure (artificial reef) can also induce changes in the intensity and direction of the bottom current, water flow and turbulence patterns, contributing to the nutrients enrichment of the water column and thus attracting biological species ([
39,
40,
41]). In fact, turbulence promotes oxygenation of water to plants and animals that flourish and live or are attracted to inside, and to the area located at the leeward of the breakwater. In addition, those enhanced vertical induced currents, like in the case of the upwelling, brings benthic waters from a nutrient-rich bottom to the water column, thereby enhancing biological production ([
39]). This effect is clearly identified by the increases in the wave height in front of the breakwater. In such conditions, several fish species can benefit from the ecological functions provided by the presence of the reef, as spawning structures, feed, and possible mating areas. Such a structure can also provide shelter for some fish species and serve as a refuge against currents, waves, and predators ([
40,
41]).
In recent years several works were dedicated to the application of CFD to the study of different coastal structures (eg., [
42], [
24], [
25] and [
26]). This work presents one of the first applications of a three-dimensional CFD approach to simulate a semicircular breakwater, which is validated with experimental data. Simulated pressure forces were obtained considering the breakwater as a GMO. Energy dissipation reveals a three-dimensional nature of this fluid-structure interaction problem that requires further validation based on measurement data. Most of the available experimental results are related to traditional hydrodynamic performance coefficients of breakwaters like reflection, transmission, and energy dissipation. These are derived from point measurements and do not allow to characterize the three-dimensional features of the wave hydrodynamics. Thus, new experiments involving detailed measurements will be required to further validate three-dimensional models.
Numerical experiments are still vey computing demand, even when the model is scaled. Prototype simulation requires HPC facilities that are now available for FLOW-3D®.
5. Conclusions
Adopted methodology for the quantification of the pressure loads on an emerged semicircular breakwater, considering the breakwater as a GMO proved to be efficient, as evidenced by the obtained results when compared with experimental ones. It shows the effectiveness of the computational model in solving this complex fluid-structure interaction problem. A detailed characterization of the turbulent energy and the respective dissipation rate was presented, revealing a considerable dissipation at the breakwater extremities. This feature can be explored to propose new solutions, involving more complex arrangements of perforated breakwater module arrangements, instead of using a continuous solution.
Comparing the perforated and non-perforated solutions show similar hydrodynamic performance in terms of the wave reflectivity coefficient and transmission characteristics. This result is in line with the adopted permeability of the perforated breakwater.
The turbulence dissipation on the exposed face of the perforated breakwater occurs in a limited interior region, which is advantageous, since relatively calm conditions are felt inside the breakwater, creating an adequate environment for biological activity.
Future research should pay more attention to aspects related to the location of the structure (submerged and in transition waters), the interaction between structure and biology, and the possible upwelling generation, thus, contributing to improve biological production and attract fish species.

 ,
, 


