A Novel Framework of Real-Time Regional Collision Risk Prediction Based on the RNN Approach


Abstract
1. Introduction
2. The Prediction Framework and Regional Collision Risk Identification
2.1. Procedure of Regional Collision Risk Prediction
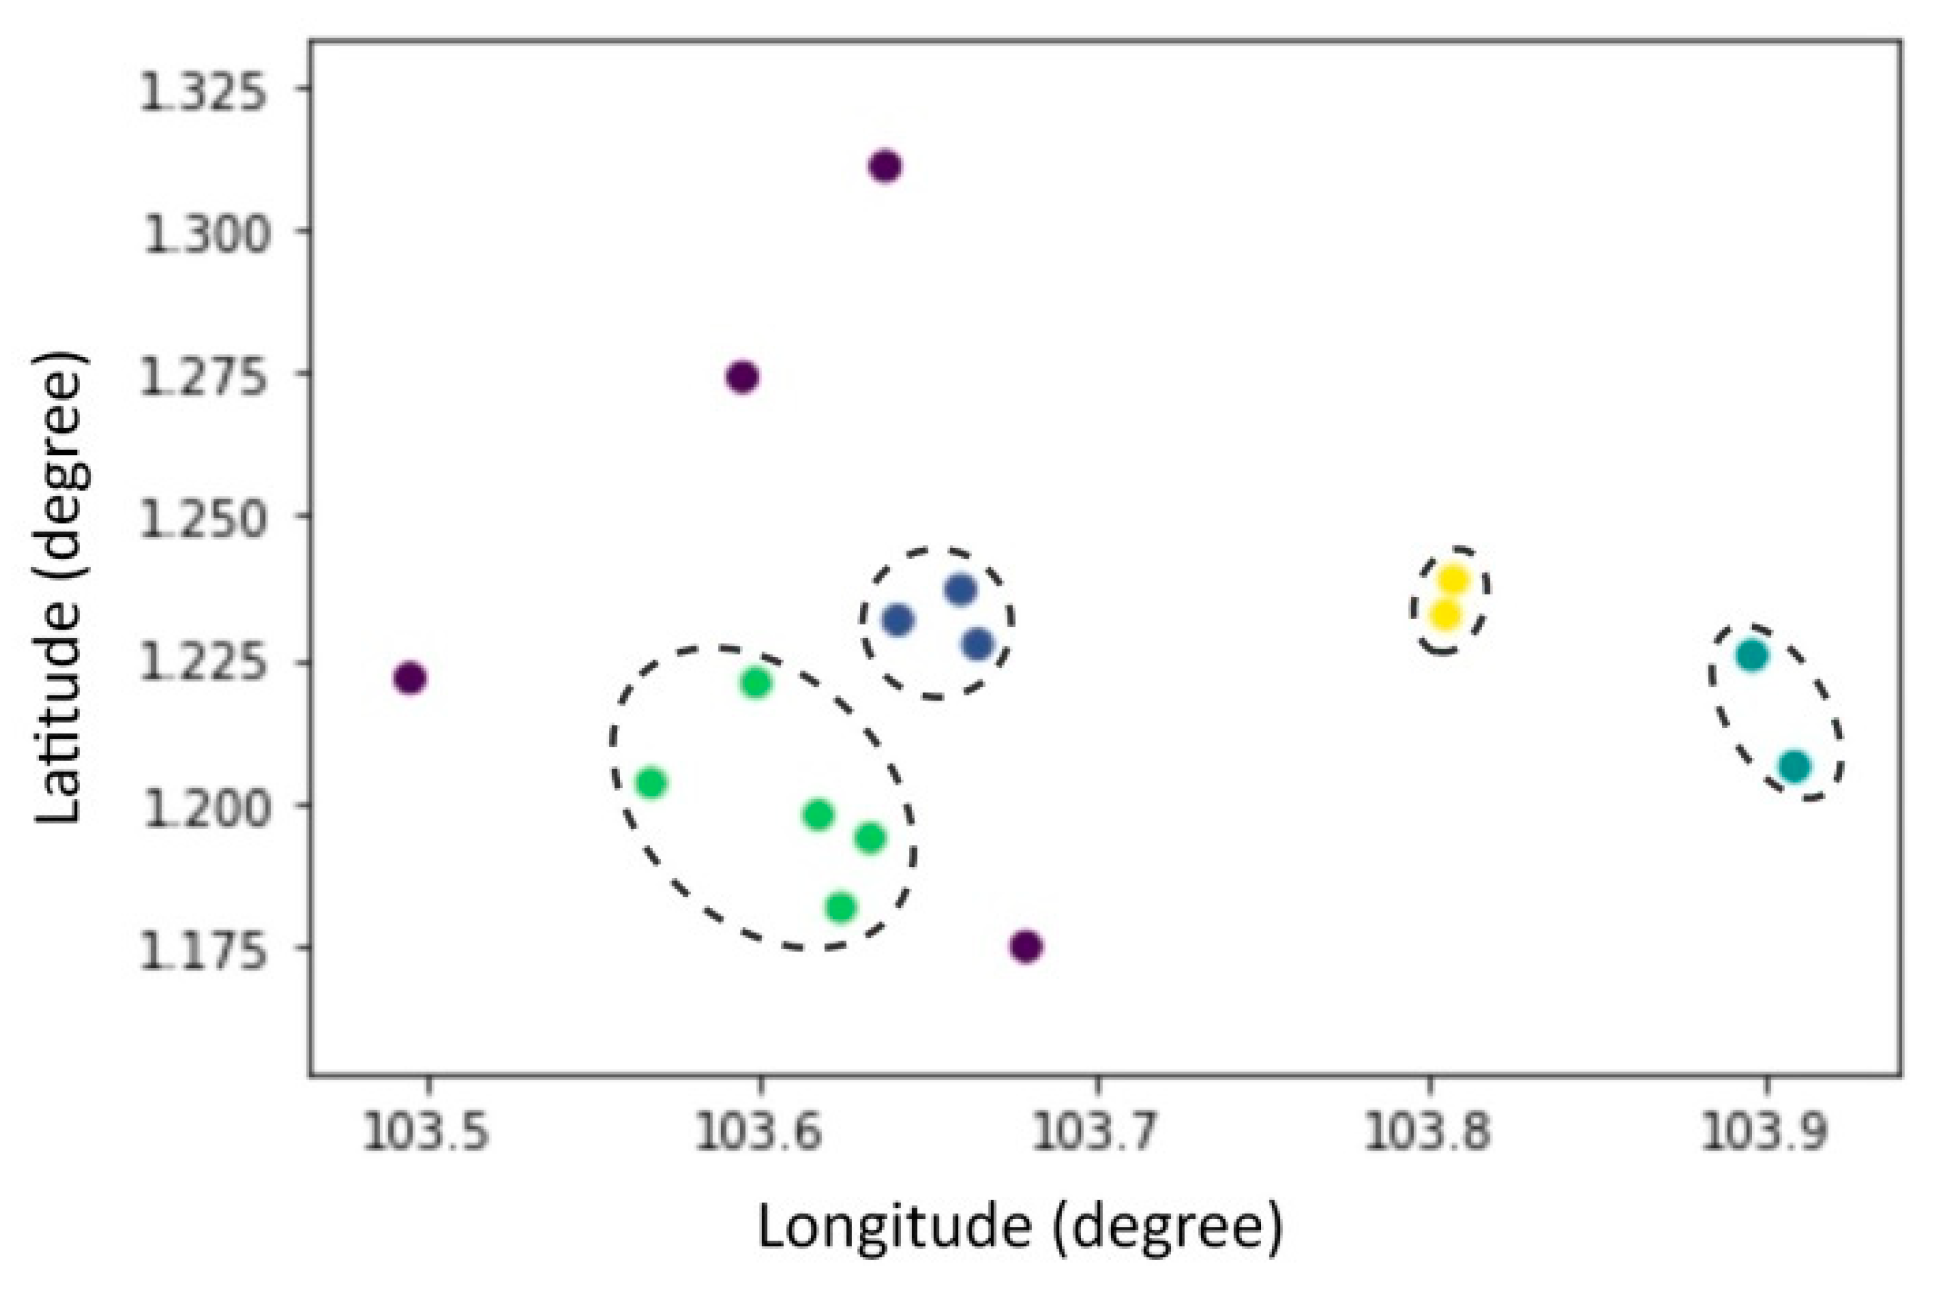
2.2. The Regional Collision Risk Identification
3. The RNN Based Prediction Framework
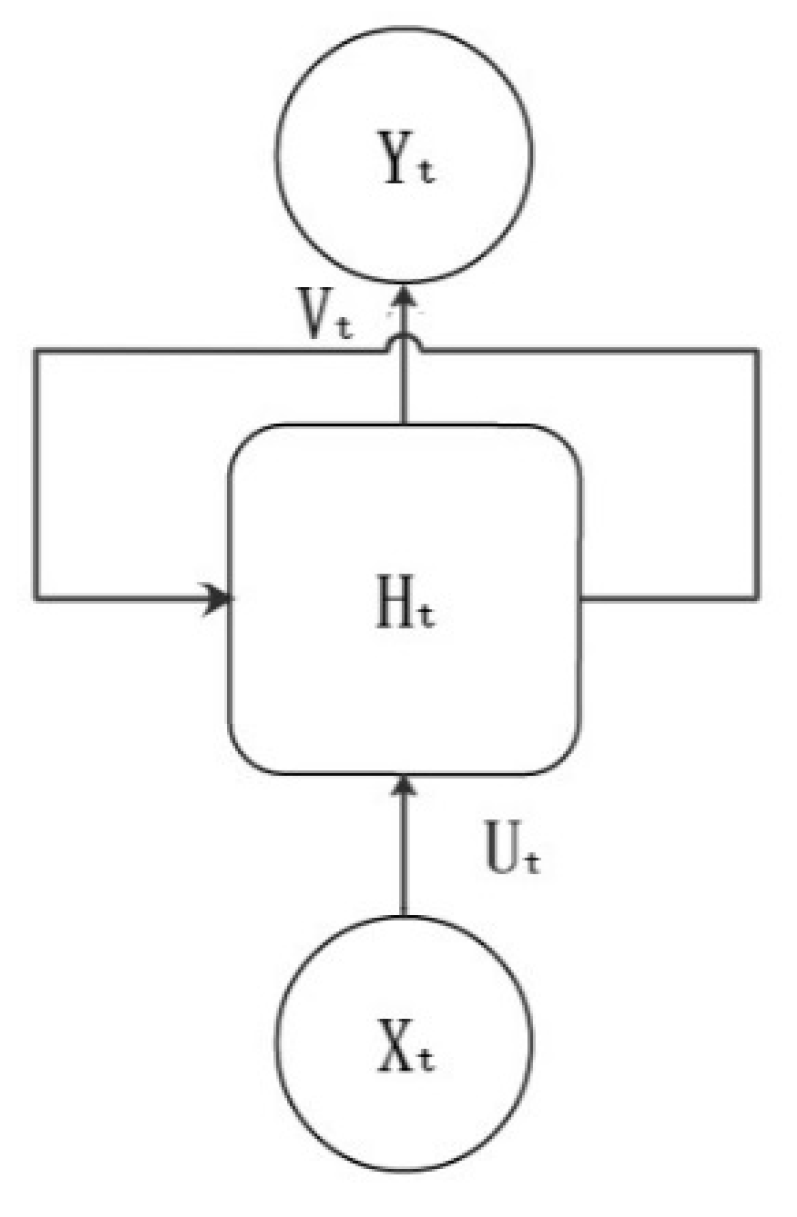
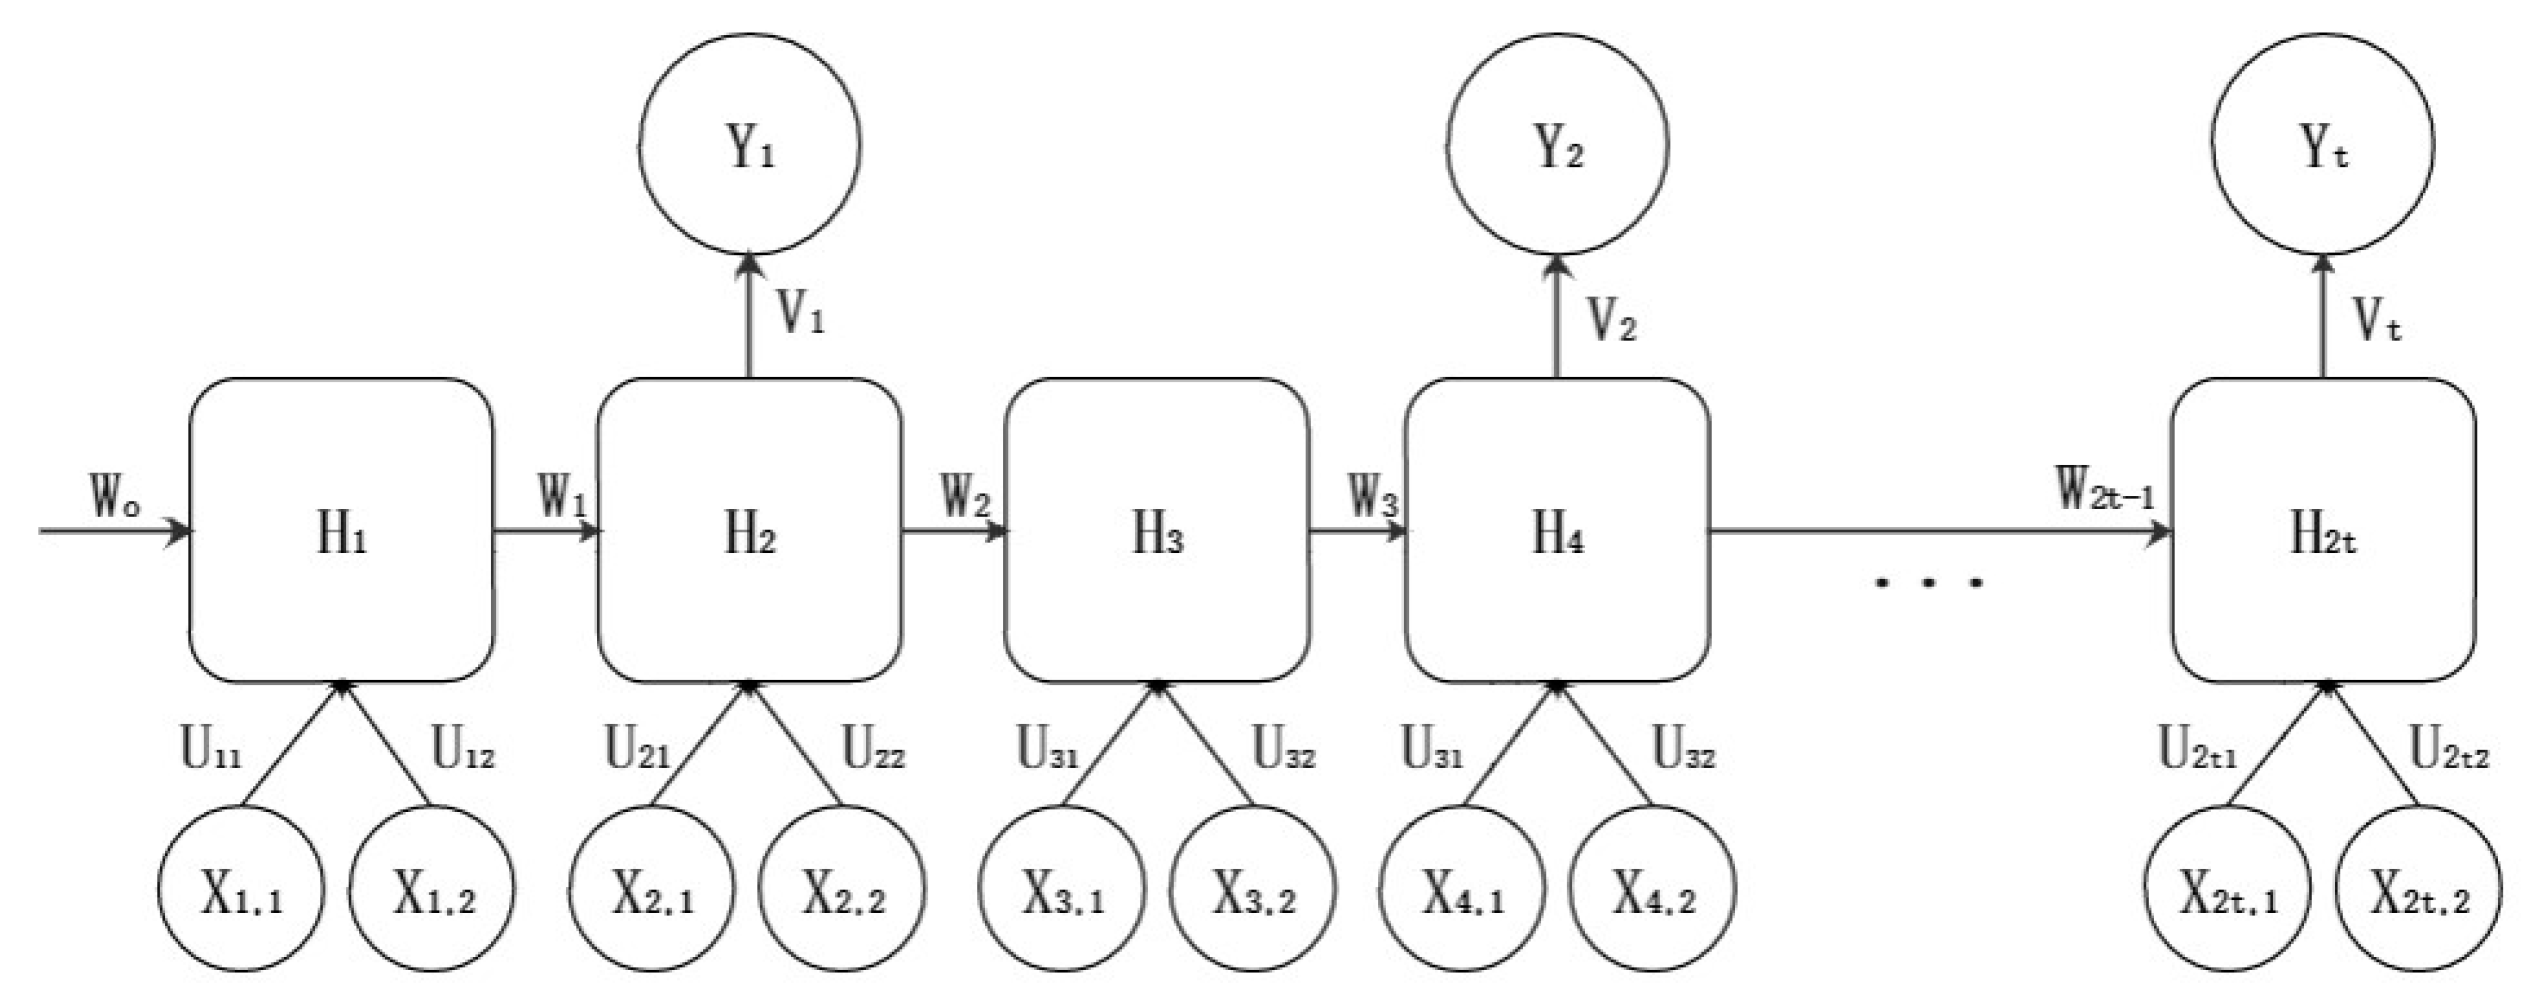
3.1. Recurrent Neural Network
3.2. RNN Model for Regional Collision Risk Prediction
4. Case Study
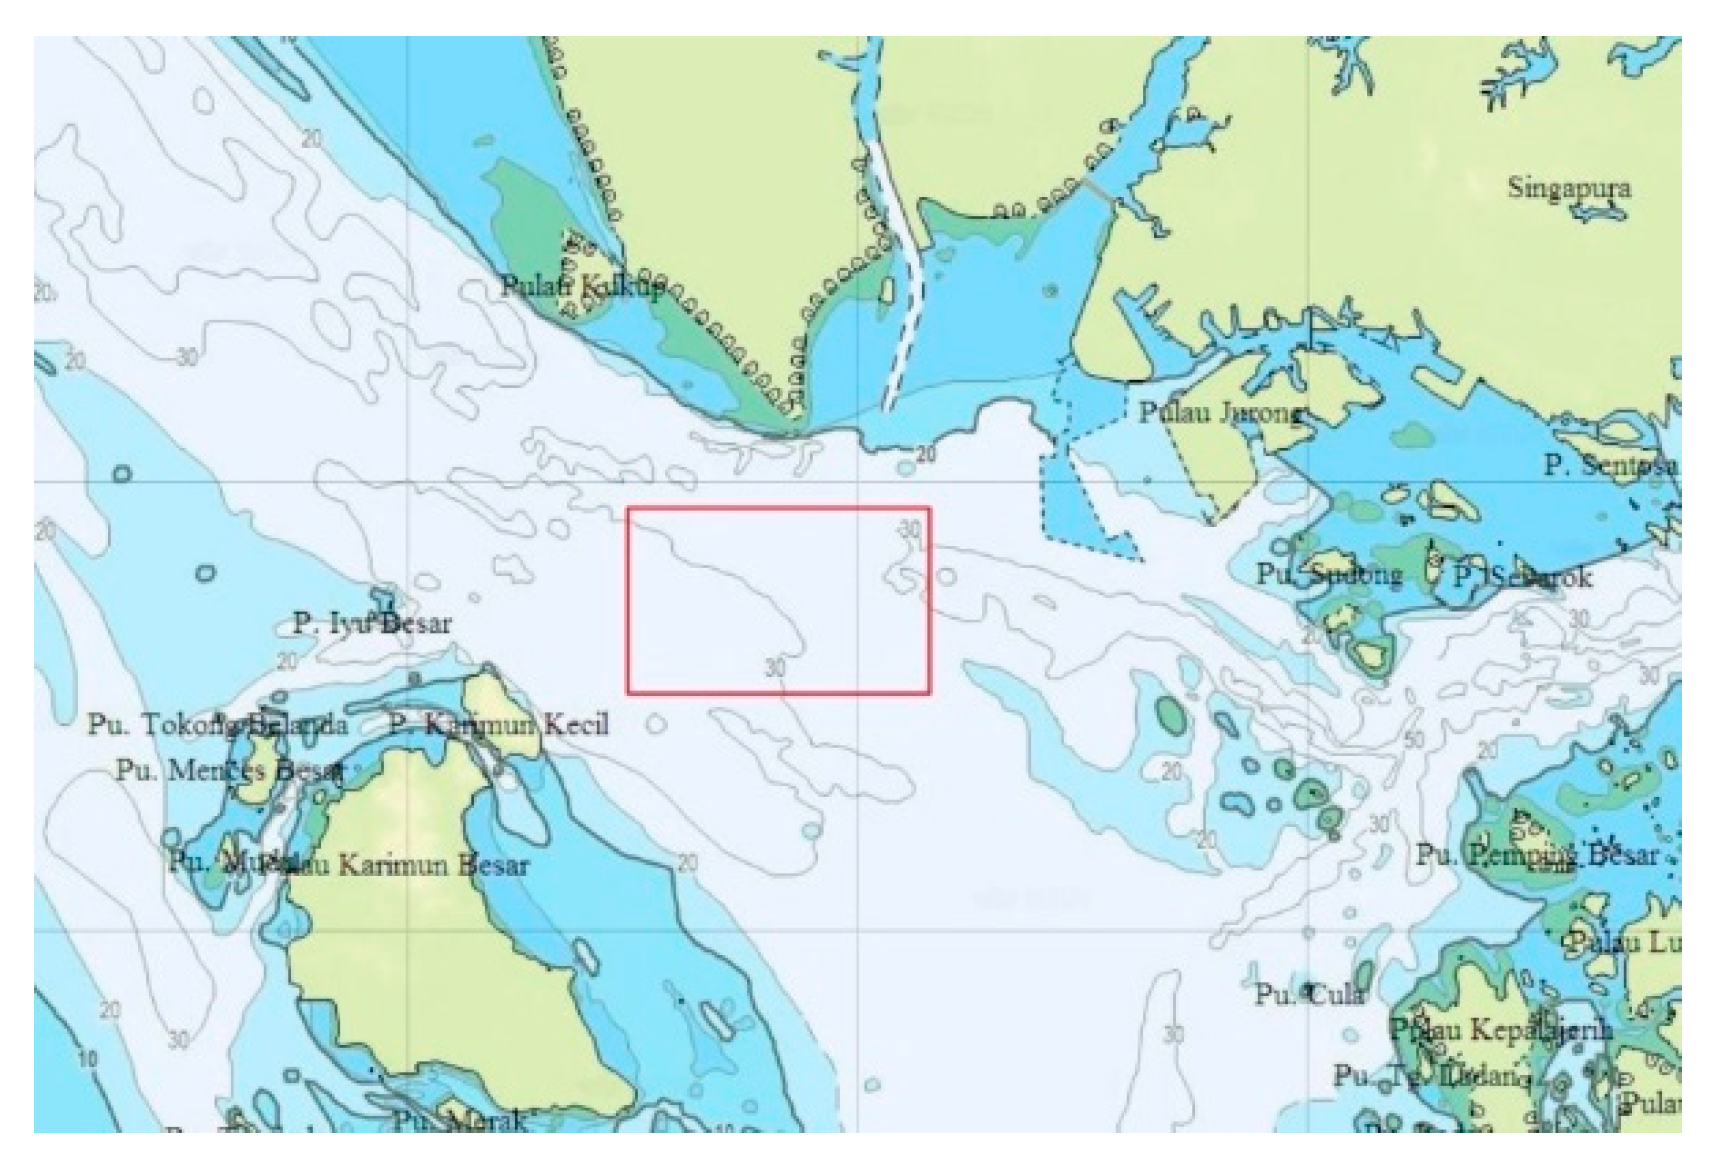
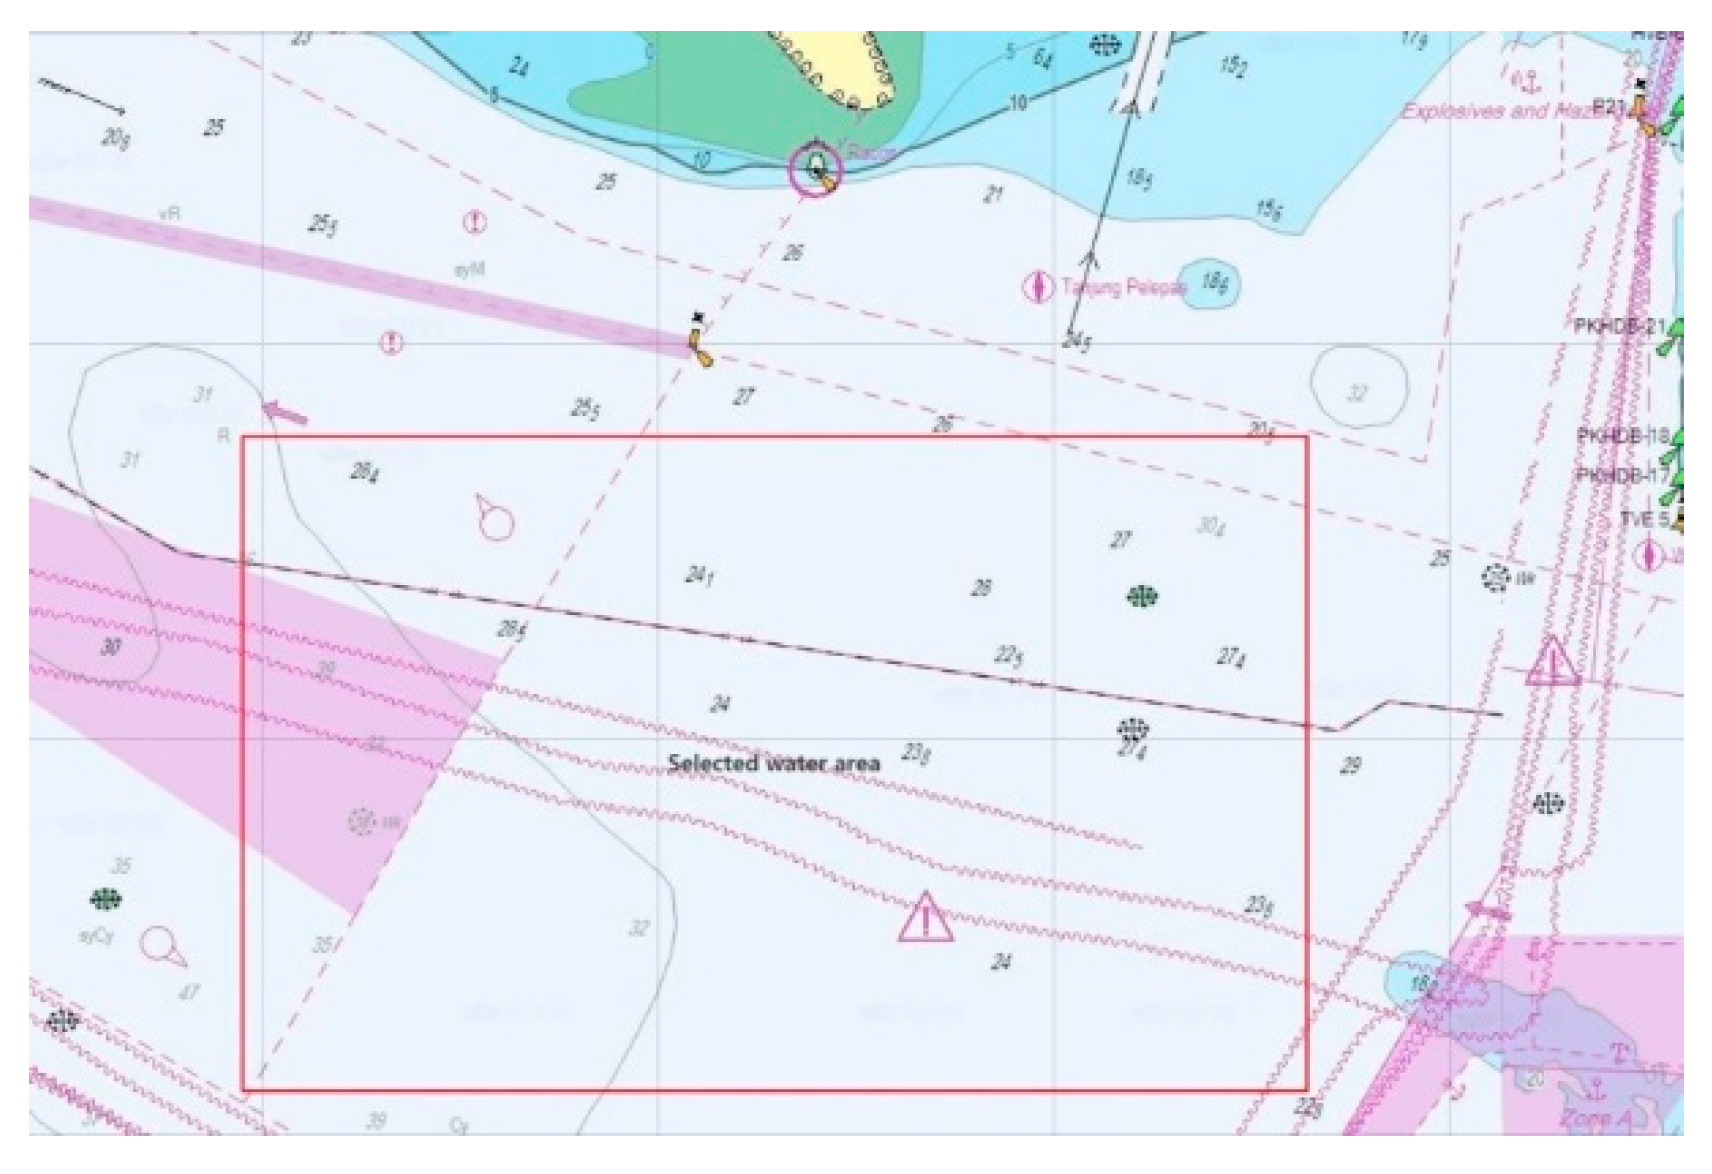
4.1. Data Selection
4.2. Data Optimizing
4.2.1. AIS Data Screening
4.2.2. AIS Data Processing
4.3. Prediction Model Application
5. Validation of Prediction Framework
6. Conclusions
Author Contributions
Funding
Conflicts of Interest
Abbreviations
| AIS | Automatic Identification System |
| ARPA | Automatic Radar Plotting Aids |
| DBSCAN | Density-Based Spatial Clustering of Applications with Noise |
| DCPA | Distance at Closet Point to Approach |
| ECDIS | Electronic Chart Display and Information System |
| FSA | Formal Safety Assessment |
| GPS | Global Satellite Positioning System |
| MMSI | Maritime Mobile Service Identify |
| OZT | Obstacle Zone by Target |
| RNN | Recurrent Neural Network |
| SDOI | Ship Domain Overlapping Index |
| SVM | Support Vector Machine |
| TCPA | Time to Closet Point of Approach |
| VCD | Vessel’s Compass Degree |
| VTS | Vessel Traffic Service |
References
- UNCTAD Review of Maritime Transport 2018. Available online: https://unctad.org/en/pages/PublicationWebflyer.aspx?publicationid=2245 (accessed on 27 November 2019).
- Zhang, S.; Villavicencioa, R.; Zhu, L.; Pedersen, P.T. Ship collision damage assessment and validation with experiments and numerical simulations. Mar. Struct. 2019, 63, 239–256. [Google Scholar] [CrossRef]
- Zhen, R.; Riveiro, M.; Jin, Y. A novel analytic framework of real-time multi-vessel collision risk assessment for maritime traffic surveillance. Ocean Eng. 2017, 145, 492–501. [Google Scholar] [CrossRef]
- Liu, Z.H.; Wu, Z.L.; Zheng, Z.Y. A cooperative game approach for assessing the collision risk in multi-vessel encountering. Ocean Eng. 2019, 187, 106–175. [Google Scholar] [CrossRef]
- Bukhari, A.C.; Tusseyeva, I.; Kim, Y.G. An intelligent real-time multi-vessel collision risk assessment system from VTS view point based on fuzzy inference system. Expert Syst. Appl. 2013, 40, 1220–1230. [Google Scholar] [CrossRef]
- Zhang, D.; Yan, X.P.; Yang, Z.L.; Wall, A.; Wang, J. Incorporation of formal safety assessment and bayesian network in navigational risk estimation of the Yangtze river. Reliability. Eng. Syst. Saf. 2017, 118, 93–105. [Google Scholar] [CrossRef]
- Mou, J.; Chen, P.; He, Y.; Yip, T.L.; Li, W.; Tang, J.; Zhang, H. Vessel traffic safety in busy waterways: A case study of accidents in western shenzhen port. Accid. Anal. Prev. 2016, 123, 461–468. [Google Scholar] [CrossRef]
- Hu, S.; Fang, Q.; Xia, H.; Xi, Y. Formalsafety assessment based on relative risks model in ship navigation. Reliab. Eng. Syst. Saf. 2007, 92, 369–377. [Google Scholar] [CrossRef]
- Debnath, A.K.; Chin, H.C. Navigational traffic conflict technique: A proactive approach to quantitative measurement of collision risks in port waters. J. Navig. 2010, 63, 137–152. [Google Scholar] [CrossRef]
- Montewka, J.; Hinz, T.; Kujala, P.; Matusiak, J. Probability modelling of vessel collisions. Reliab. Eng. Syst. Saf. 2010, 95, 573–589. [Google Scholar] [CrossRef]
- Le, C.H.; Ding, H.Y.; Dong, G.H.; Zhang, P.Y. Risk Assessment of Offshore Platform due to Ship Collision. In Proceedings of the International Conference on Electric Technology and Civil Engineering, Lushan, China, 22–24 April 2011. [Google Scholar]
- Qu, X.; Meng, Q.; Li, S.Y. Ship collision risk assessment for the Singapore strait. Accid. Anal. Prev. 2011, 43, 2030–2036. [Google Scholar] [CrossRef]
- Liu, Z.H.; Wu, Z.L.; Zheng, Z.Y. A novel framework for regional collision risk identification based on AIS data. Appl. Ocean Res. 2019, 89, 261–272. [Google Scholar] [CrossRef]
- Nivoliantou, Z.S.; Koromila, I.A.; Giannakopoulos, T. Bayesian Network to Predict Environmental Risk of a Possible Ship Accident. Int. J. Risk Assess. Manag. 2016, 19, 1–5. [Google Scholar] [CrossRef]
- Fan, S.; Sang, L.; Mao, Z. The prediction of the collision incident level in the lower reaches of the Yangtze River based on the mutual information. In Proceedings of the 2017 4th International Conference on Transportation Information and Safety (ICTIS), Banff, AB, Canada, 8–10 Auguest 2017. [Google Scholar]
- Kim, K.; Lee, K.M. Deep Learning-Based Caution Area Traffic Prediction with Automatic Identification System Sensor Data. Sensors 2018, 18, 3172. [Google Scholar] [CrossRef] [PubMed]
- Okazaki, T.; Terayama, M.; Nishizaki, C. Feasibility Study for Predicting Collision Possibility Sea Area for Each Ship by Using Support Vector Machine. In Proceedings of the 2018 IEEE International Conference on Systems, Man, and Cybernetics, Miyazaki, Japan, 17 January 2019. [Google Scholar]
- Fukuto, J.; Imazu, H. Application of “Obstacle Zone by Target (OZT)” Algorithm for Collision Alarm. J. Jpn. Inst. Navig. 2013, 128, 49–54. [Google Scholar] [CrossRef][Green Version]
- Costa, M.; Pasero, E.; Piglione, F.; Radasanu, D. Short term load forecasting using a synchronously operated recurrent neural network. In Proceedings of the International Joint Conference on Neural Networks, Washington, DC, USA, 10–16 July 1999. [Google Scholar]
- Coulibaly, P.; Anctil, F. Real-time short-term water inflows forecasting using recurrent neural networks. In Proceedings of the International Joint Conference on Neural Networks, Washington, DC, USA, 10–16 July 1999. [Google Scholar]
- Li, S.; Wunsch, D.C.; O’Hair, E.; Giesselmann, M.G. Wind turbine power estimation by neural networks with Kalman filter training on a SIMD parallel machine. In Proceedings of the International Joint Conference on Neural Networks, Washington, DC, USA, 10–16 July 1999. [Google Scholar]
- Liang, S.F.; Su, A.W.Y.; Lin, C.T. A new recurrent-network-based music synthesis method for Chinese plucked-string instruments-pipa and qin. In Proceedings of the International Joint Conference on Neural Networks, Washington, DC, USA, 10–16 July 1999. [Google Scholar]
- Giles, C.L.; Lawrence, S.; Tsoi, A.C. Rule inference for financial prediction using recurrent neural networks. In Proceedings of the IEEE Conference on Computational Intelligence for Financial Engineering, New York City, NY, USA, 24–25 March 1997. [Google Scholar]
- Karpathy, A.; Fei-Fei, L. Deep Visual-Semantic Alignments for Generating Image Descriptions. IEEE Trans. Pattern Anal. Mach. Intell. 2017, 39, 3128–3137. [Google Scholar] [CrossRef] [PubMed]
- Mou, L.; Ghamisi, P.Z. Deep Recurrent Neural Networks for Hyperspectral Image Classification. IEEE Trans. Geosci. Remote Sens. 2017, 55, 3639–3655. [Google Scholar] [CrossRef]
- Kolbæk, M.; Yu, D.; Tan, Z.H.; Jensen, J. Multitalker Speech Separation with Utterance-Level Permutation Invariant Training of Deep Recurrent Neural Networks. IEEE/ACM Trans. Audio Speech Lang. Process. 2017, 25, 1901–1913. [Google Scholar] [CrossRef]
- Ma, X.; Dai, Z.; He, Z.; Ma, J.; Wang, Y. Learning Traffic as Images: A Deep Convolutional Neural Network for Large-Scale Transportation Network Speed Prediction. Sensors 2017, 17, 818. [Google Scholar] [CrossRef]
- Guo, L.; Li, N.; Jia, F.; Lei, Y.; Lin, J. A recurrent neural network based health indicator for remaining useful life prediction of bearings. Neurocomputing 2017, 240, 98–109. [Google Scholar] [CrossRef]
- Shi, Z.; Xu, M.; Pan, Q.; Yan, B.; Zhang, H. LSTM-based Flight Trajectory Prediction. In Proceedings of the 2018 International Joint Conference on Neural Networks, Rio de Janeiro, Brazil, 8–13 July 2018. [Google Scholar]
- Gao, M.; Shi, G.; Li, S. Online Prediction of Ship Behavior with Automatic Identification System Sensor Data Using Bidirectional Long Short-Term Memory Recurrent Neural Network. Sensors 2018, 18, 4211. [Google Scholar] [CrossRef]
- Kong, W.; Dong, Z.Y.; Jia, Y.; Hill, D.J.; Xu, Y.; Zhang, Y. Short-Term Residential Load Forecasting Based on LSTM Recurrent Neural Network. IEEE Trans. Smart Grid 2019, 10, 841–851. [Google Scholar] [CrossRef]
- Kaufman, L.; Rousseeuw, P.J. Finding Groups in Data: An Introduction to Cluster Analysis; John Wiley & Sons: Hoboken, NJ, USA, 1990. [Google Scholar]
- Ester, M.; Kriegel, H.P.; Xu, X. Knowledge discovery in large SPATIAL database: Focusing techniques for efficient class identification. In International Symposium on Spatial Databases; Springer: Berlin/Heidelberg, Germany, 1995; pp. 67–82. [Google Scholar]
- Ester, M.; Kriegel, H.; Sander, J.; Xu, X. A density-based algorithm for discovering clusters in large spatial databases with noise. In Proceedings of the 2nd International Conference on Knowledge Discovery and Data Mining (KDD’96), Portland, OR, USA, 2–4 August 1996; 1996; pp. 226–231. [Google Scholar]
- Guha, S.; Rastogi, R.; Shim, K. CURE: An efficient clustering algorithm for large databases. Inf. Syst. 2001, 26, 35–38. [Google Scholar] [CrossRef]
- Agrawal, R.; Gehrke, J.; Gunopolos, D.; Raghavan, P. Automatic subspace clustering of high dimensional data for data mining application. In Proceedings of the 1998 ACM SIGMOD International Conference on Management of Data, Seattle, WA, USA, 1–4 June 1998; pp. 94–105. [Google Scholar]
- Nanopoulos, A.; Theodoridis, Y.; Manolopoulos, Y. C2P: Clustering based on closest pairs. In Proceedings of the 27th International Conference on Very Large Databases, Roma, Italy, 11–14 September 2001; pp. 331–340. [Google Scholar]
- Filipovych, R.; Resnick, S.M.; Davatzikos, C. Semi-supervised cluster analysis of imaging data. NeuroImage 2011, 54, 2185–2197. [Google Scholar] [CrossRef] [PubMed]
- Huth, R.; Beck, C.; Philipp, A.; Demuzere, M.; Ustrnul, Z.; Cahynová, M.; Kyselý, J.; Tveito, O.E. Classifications of atmospheric circulation patterns. Ann. N. Y. Acad. Sci. 2008, 1146, 105–152. [Google Scholar] [CrossRef]
- Emad, W.S.; Danil, V.; Donald, C. Comparative study of stock trend prediction using time delay, recurrent and probabilistic neural networks. IEEE Trans. Neural Netw. 1998, 9, 1456–1470. [Google Scholar]
- Tian, Y.; Pan, L. Predicting Short-Term Traffic Flow by Long Short-Term Memory Recurrent Neural Network. In Proceedings of the 2015 IEEE International Conference on Smart City, Chengdu, China, 19–21 December 2015. [Google Scholar]
- Maher, I.S.; Biswajeet, P. Severity Prediction of Traffic Accidents with Recurrent Neural Networks. Appl. Sci. 2017, 7, 476. [Google Scholar]
- Xu, E.; Zhao, S.; Mei, J.; Xia, E.; Yu, Y.; Huang, S.F. Multiple MACE Risk Prediction using Multi-Task Recurrent Neural Network with Attention. In Proceedings of the 2019 IEEE International Conference on Healthcare Informatics, Xi’an, China, 10–13 June 2019. [Google Scholar]
- Zaman, M.B.; Kobayashi, E.; Wakabayashi, N.; Khanfir, S.; Pitana, T.; Maimun, A. Fuzzy FMEA model for risk evaluation of ship collisions in the Malacca Strait: Based on AIS data. J. Simul. 2014, 8, 91–104. [Google Scholar] [CrossRef]
- Zaman, M.B.; Santoso, A. Formal Safety Assessment (FSA) for Analysis of Ship Collision Using AIS Data. Int. J. Mar. Navig. Saf. Sea Transp. 2015, 9, 67–72. [Google Scholar] [CrossRef]


| Moment | 1800 | 1810 | 1820 | 1830 |
| Regional Collision Risk | 0 | 0.93935 | 0.61104 | 0.49891 |
| Moment | 1840 | 1850 | 1900 | - |
| Regional Collision Risk | 0 | 0.83017 | 0 | - |
| Period | 1800–1810 | 1810–1820 | 1820–1830 |
| Entered Vessel Number | 4 | 2 | 1 |
| Period | 1830–1840 | 1840–1850 | 1850–1900 |
| Entered Vessel Number | 0 | 3 | 0 |
| Input Set | Set 1.1 | Set 1.2 | Set 2.1 | Set 2.2 | Set 3.1 | Set 3.2 | Set 4.1 | Set 4.2 | ||||||||
| 0 | 0.939 | 4 | 2 | 0.939 | 0.611 | 2 | 1 | 0.611 | 0.499 | 1 | 0 | 0.499 | 0 | 0 | 3 | |
| Output Set | Set 1 | Set 2 | Set 3 | Set 4 |
| 0.611 | 0.49891 | 0 | 0.83017 |
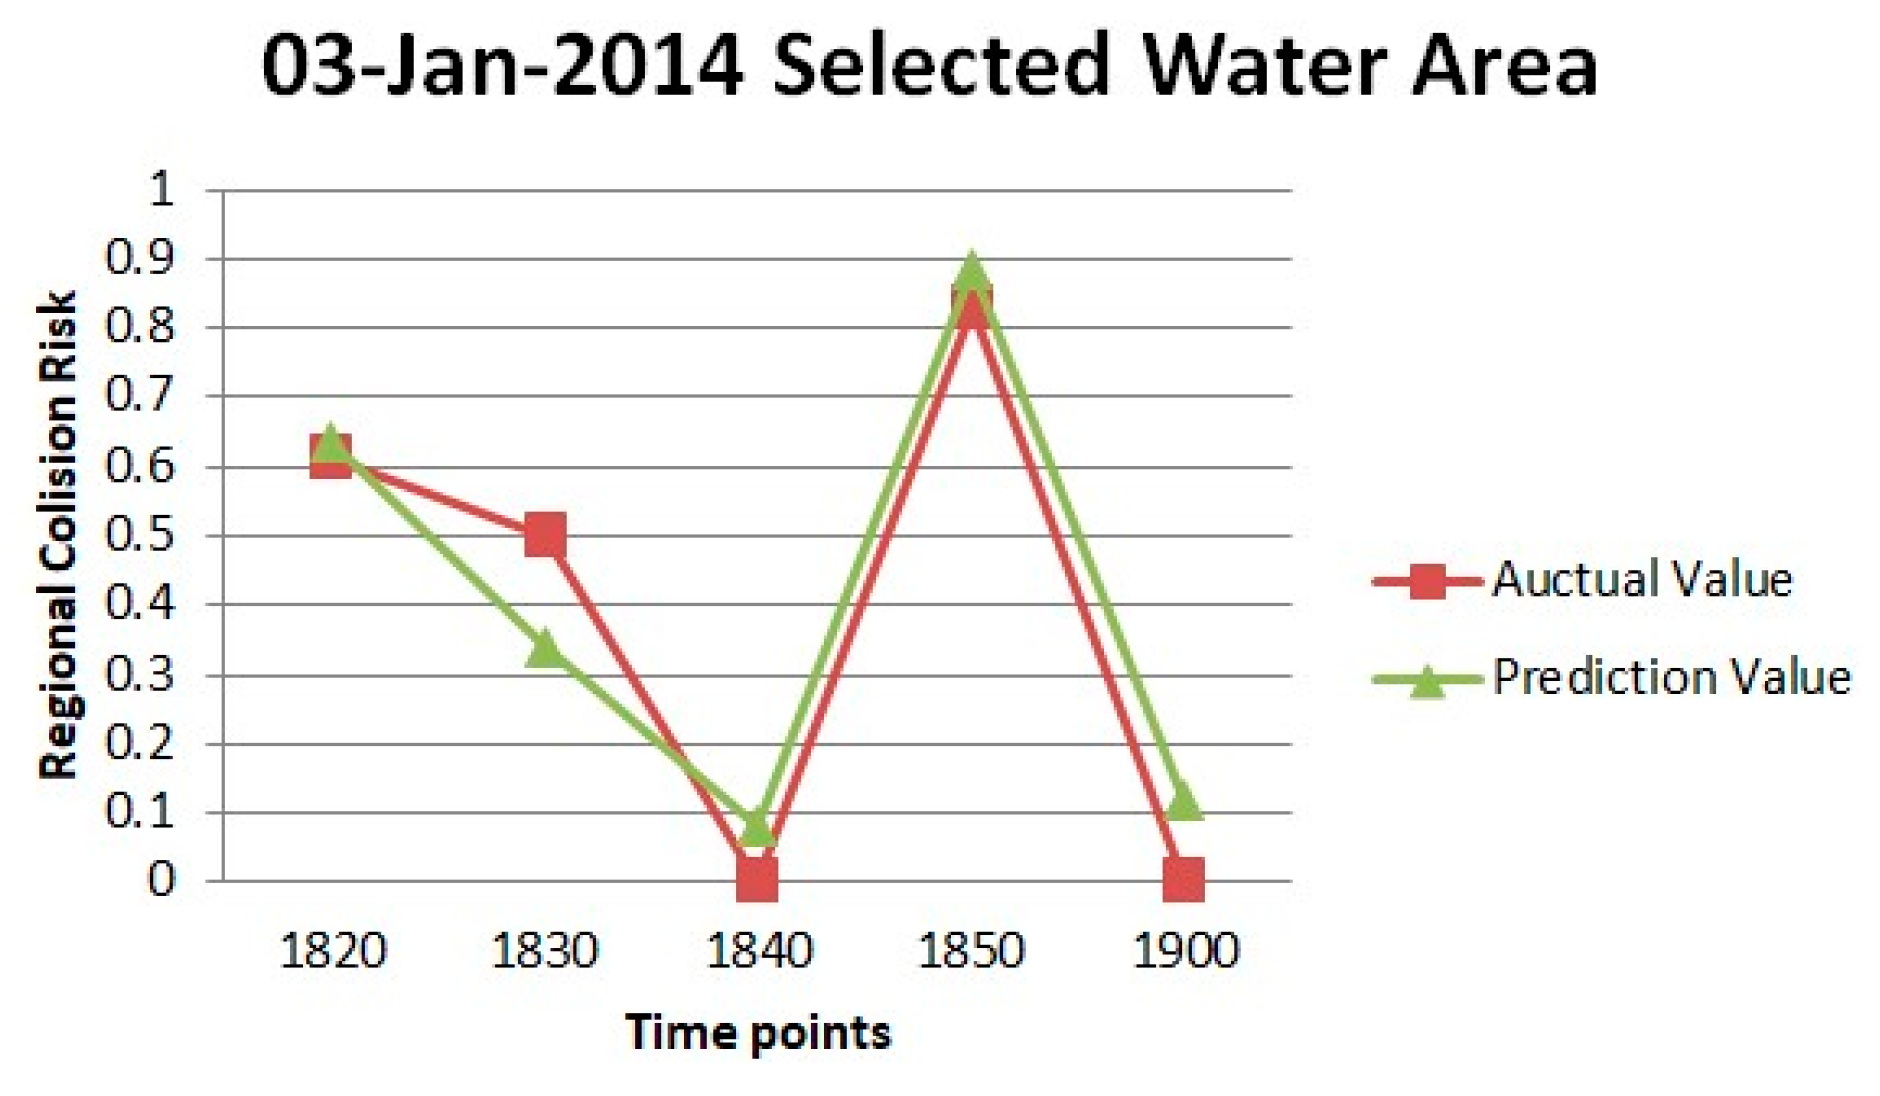
| 03-Jan-14 | |||||
| Regional Collision Risk | 1820 | 1830 | 1840 | 1850 | 1900 |
| Actual Value | 0.611 | 0.498 | 0 | 0.830 | 0 |
| Prediction Value | 0.634 | 0.339 | 0.081 | 0.886 | 0.117 |
| Input Set | Date | Set 1.1 | Set1.2 | Set 2.1 | Set 2.2 | Set 3.1 | Set 3.2 | Set 4.1 | Set 4.2 | ||||||||
| 04-Jan-14 | 0 | 0.135 | 2 | 1 | 0.135 | 0 | 1 | 3 | 0 | 0 | 3 | 0 | 0 | 0.544 | 0 | 3 | |
| 05-Jan-14 | 0 | 0.614 | 1 | 1 | 0.614 | 0 | 1 | 2 | 0 | 1 | 2 | 0 | 1 | 0 | 0 | 1 | |
| Output Set | Date | Set1 | Set2 | Set3 | Set4 |
| 04-Jan-14 | 0 | 0 | 0.54425 | 0 | |
| 05-Jan-14 | 0 | 1 | 0 | 0 |
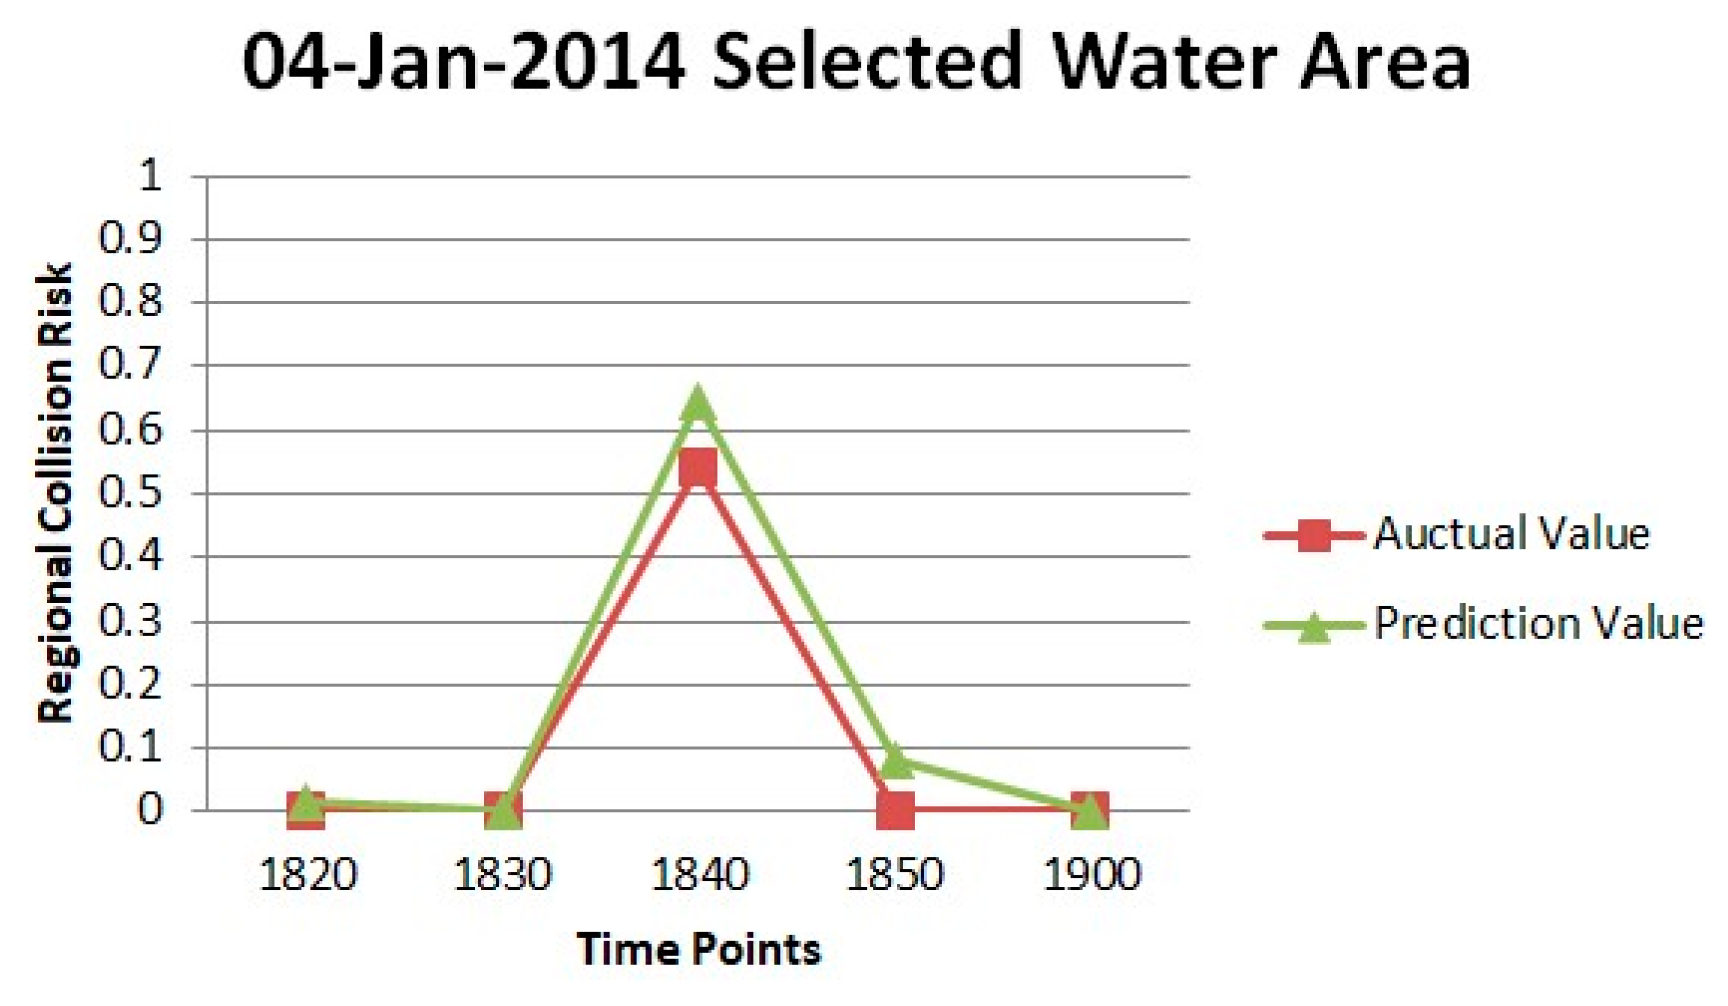
| Regional Collision Risk | 1820 | 1830 | 1840 | 1850 | 1900 |
| Actual Value | 0 | 0 | 0.544 | 0 | 0 |
| Prediction Value | 0.014 | 0 | 0.648 | 0.079 | 0 |
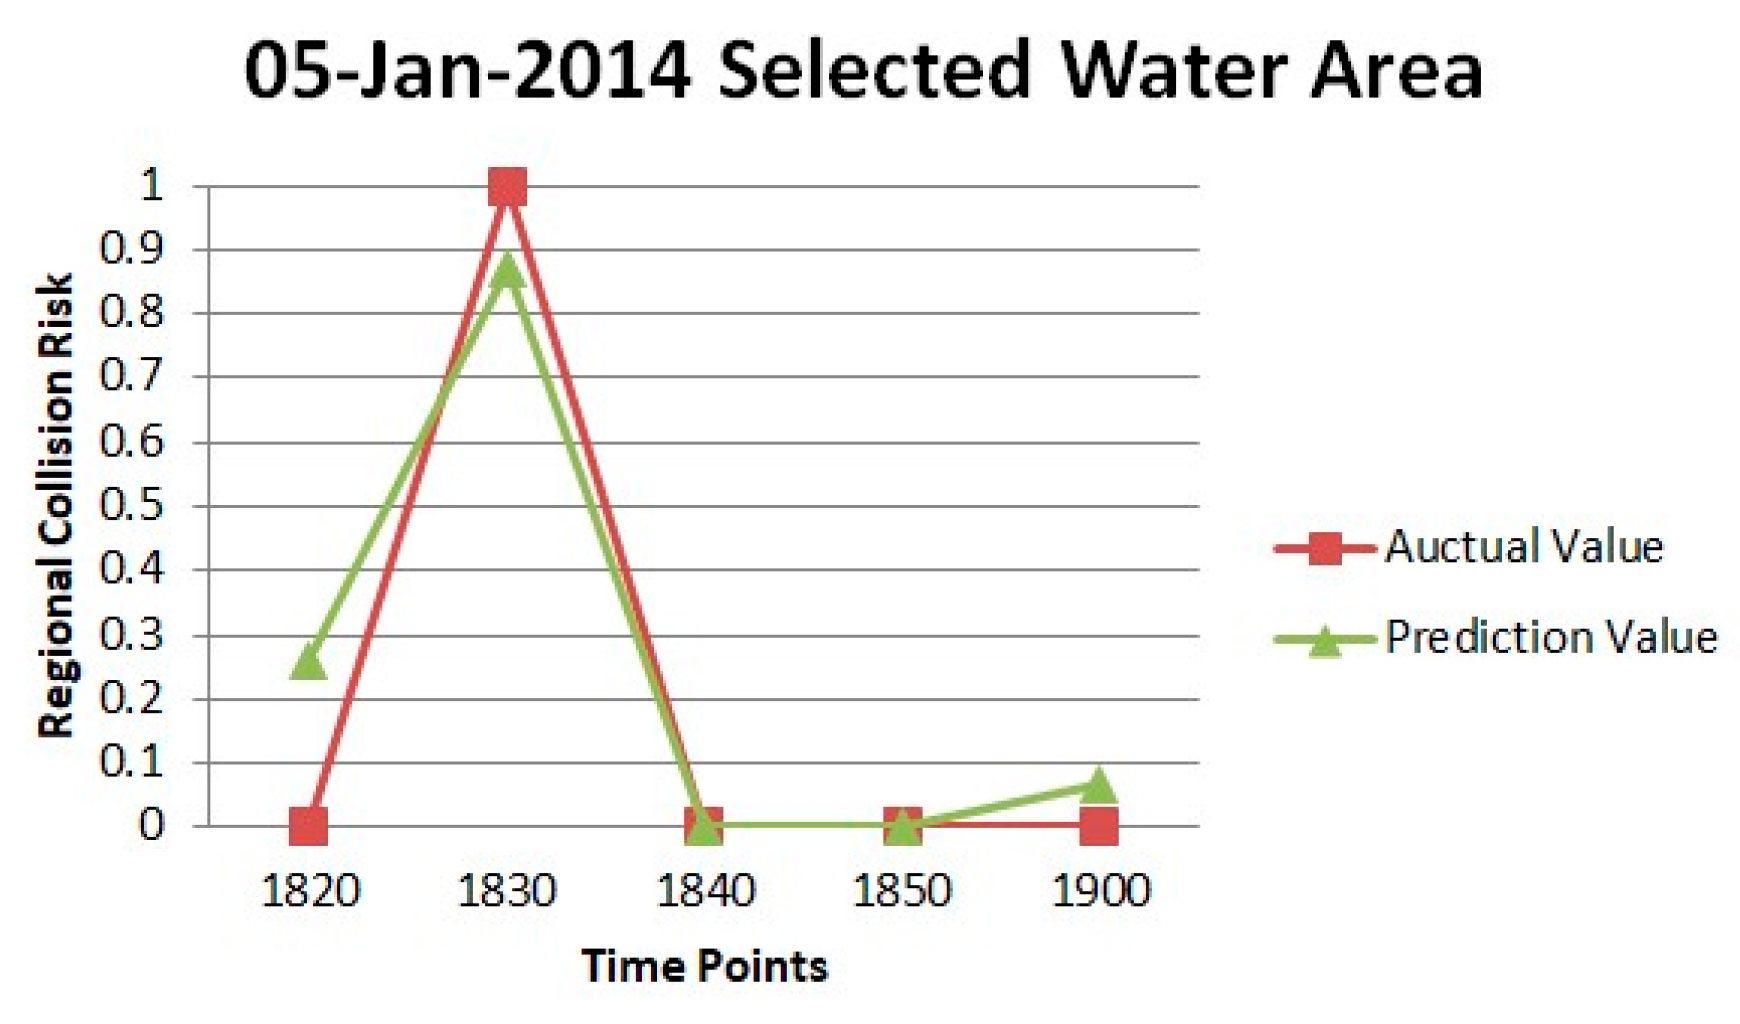
| Regional Collision Risk | 1820 | 1830 | 1840 | 1850 | 1900 |
| Actual Value | 0 | 1 | 0 | 0 | 0 |
| Prediction Value | 0.262 | 0.872 | 0 | 0 | 0.069 |
© 2020 by the authors. Licensee MDPI, Basel, Switzerland. This article is an open access article distributed under the terms and conditions of the Creative Commons Attribution (CC BY) license (http://creativecommons.org/licenses/by/4.0/).
Share and Cite
Liu, D.; Wang, X.; Cai, Y.; Liu, Z.; Liu, Z.-J. A Novel Framework of Real-Time Regional Collision Risk Prediction Based on the RNN Approach. J. Mar. Sci. Eng. 2020, 8, 224. https://doi.org/10.3390/jmse8030224
Liu D, Wang X, Cai Y, Liu Z, Liu Z-J. A Novel Framework of Real-Time Regional Collision Risk Prediction Based on the RNN Approach. Journal of Marine Science and Engineering. 2020; 8(3):224. https://doi.org/10.3390/jmse8030224
Chicago/Turabian StyleLiu, Dapei, Xin Wang, Yao Cai, Zihao Liu, and Zheng-Jiang Liu. 2020. "A Novel Framework of Real-Time Regional Collision Risk Prediction Based on the RNN Approach" Journal of Marine Science and Engineering 8, no. 3: 224. https://doi.org/10.3390/jmse8030224
APA StyleLiu, D., Wang, X., Cai, Y., Liu, Z., & Liu, Z.-J. (2020). A Novel Framework of Real-Time Regional Collision Risk Prediction Based on the RNN Approach. Journal of Marine Science and Engineering, 8(3), 224. https://doi.org/10.3390/jmse8030224