Article

A Preliminary Study on an Alternative Ship Propulsion System Fueled by Ammonia: Environmental and Economic Assessments

1
Future Technology Research Team, Korean Register (KR), Busan 46762, Korea
2
Department of Electrical Engineering, Pusan National University (PNU), Busan 46241, Korea
*
Authors to whom correspondence should be addressed.
J. Mar. Sci. Eng. 2020, 8(3), 183; https://doi.org/10.3390/jmse8030183
Submission received: 4 February 2020 / Revised: 19 February 2020 / Accepted: 3 March 2020 / Published: 7 March 2020
(This article belongs to the Special Issue Green Shipping)

Abstract

:
The shipping industry is becoming increasingly aware of its environmental responsibilities in the long-term. In 2018, the International Maritime Organization (IMO) pledged to reduce greenhouse gas (GHG) emissions by at least 50% by the year 2050 as compared with a baseline value from 2008. Ammonia has been regarded as one of the potential carbon-free fuels for ships based on these environmental issues. In this paper, we propose four propulsion systems for a 2500 Twenty-foot Equivalent Unit (TEU) container feeder ship. All of the proposed systems are fueled by ammonia; however, different power systems are used: main engine, generators, polymer electrolyte membrane fuel cell (PEMFC), and solid oxide fuel cell (SOFC). Further, these systems are compared to the conventional main engine propulsion system that is fueled by heavy fuel oil, with a focus on the economic and environmental perspectives. By comparing the conventional and proposed systems, it is shown that ammonia can be a carbon-free fuel for ships. Moreover, among the proposed systems, the SOFC power system is the most eco-friendly alternative (up to 92.1%), even though it requires a high lifecycle cost than the others. Although this study has some limitations and assumptions, the results indicate a meaningful approach toward solving GHG problems in the maritime industry.

1. Introduction

Beginning in 2020, all ships have to meet sulfur regulation for the limit of 0.5% m/m (mass by mass) in the fuel oil used onboard ships. Therefore, it is required to either use fuels with a maximum sulfur content of 0.5% (0.5%S) or use cheaper and conventional heavy fuel oil (HFO) with an exhaust gas cleaning system, called a scrubber. Moreover, the International Maritime Organization (IMO) agreed to an initial greenhouse gas (GHG) strategy that aimed to cut the total carbon dioxide (CO2) emissions from ships by at least 50% from the levels in 2008 by 2050 and to phase out GHG emissions from international shipping as soon as possible in this century [1].
Therefore, carbon-free fuels (especially, hydrogen (H2) and ammonia (NH3)) appear to be the most promising solutions for the IMO’s GHG reduction target by 2050. The International Transport Forum (ITF) [2] assumes that, in the case of 80% carbon factor reduction, hydrogen and ammonia will account for around 70% of the fuel market. A study by Nick Ash [3] concluded that green ammonia, which is produced while using renewable electricity not emitting greenhouse gases at any point in its product lifecycle, is a technically feasible solution for decarbonizing international shipping. Moreover, the results from Lewis, J. [4] suggest that H2 and NH3 are the most promising zero-carbon fuel options for decarbonizing in the transportation sector. In addition, a report by the International Energy Agency (IEA) [5] estimates that H2 and NH3 have the potential to meet the environmental target in shipping, but their cost of production is high relative to oil-based fuels.
Table 1 shows the characteristics of hydrogen and ammonia as fuels when compared with HFO. Hydrogen is the most abundant element in the universe, but it is rarely found in its pure form. Although hydrogen can be obtained from various sources, such as biomass or electrolysis, it is currently mostly produced from natural gas [6]. Therefore, its key barriers are the high fuel price and limited availability for maritime operations. In addition, Table 1 shows that the liquefaction of hydrogen requires a very low temperature of −253 °C, which brings the high cost of liquefying and storage system onboard. In this regard, NH3 is being discussed as an alternative fuel due to its higher volumetric energy density and ease of handling.
The volumetric energy density of liquid ammonia is higher than that of liquid hydrogen, which is one of the attractions for fuel storage onboard, as shown in Table 1. Moreover, the storage requirements of ammonia are similar to those of propane, with ammonia in liquid form at room temperature (25 °C) when pressurized to 9.9 atm or temperature of −33.4 °C at atmospheric pressure [8]. The main benefits of using NH3 as fuel when compared to H2 are as follows.
  • NH3 is a cost-efficient alternative in terms of fuel price, and it has already existing infrastructure (approximately 10.6–30.2 times cheaper than H2) [9].
  • NH3′s volumetric hydrogen content is significantly greater than that of H2 (about 1.7 times more than liquid-H2).
  • Transportation and storage technologies for NH3 already exist and they are available today (annually, more than 18 M t of NH3 is traded internationally) [13].
  • NH3 has acute toxicity with strong smell and is easy to detect, and the safety measures are commonly practiced.
  • A carbon capture system (CCS) from an NH3 production plant is a feasible option [5].
In the marine industry, many studies have been performed on using ammonia as a fuel for zero-emission ships. Under some assumptions, ammonia is estimated to be more cost-effective than other alternative fuels. Ammonia is more economically beneficial than methanol or hydrogen, as explained by the Crown [14]. Furthermore, Lloyd’s Register (LR) and University Maritime Advisory Services (UMAS) [15] suggest that ammonia is more competitive than hydrogen because of the lower costs that are associated with onboard storage. Nick Ash [3] and Niels de Vries [16] highlight that the ammonia-fueled engine is the most likely initial entry point for ammonia as a marine fuel and it will need to begin during the 2020s to follow the de-carbonization timetable.
Moreover, as part of the de-carbonizing technology, several R&D projects or consortiums have undertaken the use of ammonia as a marine fuel: ‘The Green Ammonia Consortium’ in Japan since 2017 [17], and ‘ZEEDS (Zero Emission Energy Distribution at Sea)’ project in Northern Europe since 2019 [18]. There is also a joint effort between a maritime company (MAN Energy Solutions) and a wind turbine manufacturer (Siemens Gamesa Renewable Energy) to supply clean ammonia as fuel for marine purposes [19].
Mostly, this ammonia can be used as fuel in an engine or fuel cell. Firstly, the ammonia can be used as engine fuel. In the case of the automotive industry, there are many demonstrations of ammonia-fueled engine as a range extender of the lithium batteries pack. Especially, the NH3-fueled truck was developed in the USA. In 2007 [20], an automobile (AmVeh) was developed in South Korea in 2013 [21], and Toyota showcased the first ammonia fueled sports car in 2013 [22].
Additionally, in the marine industry, the main engine (M/E) or genset (generator engine combined with alternator) manufacturers have already started developing a new type of engine (or genset) while using ammonia fuel. In 2008, Caterpillar filed a patent (US Patent US20100019506A1) for an ammonia-fueled engine and ancillary systems [23]. Additionally, in 2018, Wärtsilä signed a memorandum of understanding with Finland’s Lappeenranta University of Technology (LUT) and the Nebraska Public Power District (NPPD) for the study of the development of gensets based on ammonia fuel.
Further, in 2018, MAN announced that the first ammonia unit could be in operation in a short time based on their liquid propane gas (LPG) engine. MAN also planned to undertake a risk assessment on the use of ammonia as a gaseous fuel for propulsion [24]. Recently, Alfa Laval, which is one of the marine fuel system developers, announced that it is exploring the next generation of fuel gas supply systems to accommodate LPG and eventually ammonia for engines [25]. In 2019, the Japan Engine Corporation (J-ENG) announced the launch of a new R&D program in collaboration with the National Maritime Research Institute, focusing on engine development for the combustion of carbon-free fuels (e.g., hydrogen and ammonia) [26].
Secondly, ammonia can be used as fuel in a fuel cell system. Until now, most fuel cell-powered ships directly use hydrogen as the main fuel instead of ammonia. However, In January 2020, a new project (ShipFC) was launched to install the world’s first ammonia-fueled fuel cell on an offshore vessel (Viking Energy) funding from the European Union (EU) [27]. On the other hand, for other industries, ammonia has been adopted as the main fuel for the fuel cell. For example, the ammonia-fed solid-oxide fuel cell (SOFC) is approaching commercial status, with major developments underway by IHI Corporation in Japan [28]. Project Alkammonia concluded its work on cracked-ammonia-fed alkaline fuel cells (AFC) in the EU. In addition, some research works [14,29] mentioned ammonia to be the main fuel for polymer electrolyte membrane fuel cells (PEMFCs) as a low-cost approach.
Moreover, one of the companies in Denmark (RenCat) is commercializing technology to generate low-cost, high-purity hydrogen from ammonia, for use in fuel cells by replacing the traditional ruthenium-based catalyst with an iron-nickel alloy [30]. One research center in Australia, the Commonwealth Scientific and Industrial Research Organization (CSIRO), has also developed a metal membrane for extracting pure hydrogen from ammonia [31].
Therefore, the ammonia-fueled power systems are expected to be more promising based on rapidly developed technologies. In this regard, this paper proposes possible power systems while using ammonia as fuel based on a target ship. The rest of this paper is structured, as follows: in Section 2, detailed explanations of a target ship and assumptions made in this study are presented. In Section 3, four proposed systems are described and fuel consumptions are calculated and compared with the conventional system for each method. In Section 4, the amount of GHG emissions for each case are compared. Additionally, Section 5 provides an economic study that is based on the lifetime of a ship. Lastly, the results are reviewed and conclusions are presented. The novelty of this paper is that a new preliminary study on ammonia-fueled propulsion systems, which are promising de-carbonization solutions in the marine industry, are investigated from the long-term perspective.

2. Target Ship

Within the global fleet, container ships accounted for the largest share (23%) of carbon dioxide (CO2) emissions [32], and the small container feeder ship has the highest emission control area (ECA) share (65.1%) than other container ship sizes [33]. Therefore, the target ship is selected as the container feeder ship of length 195 m and capacity of 2500 Twenty-foot Equivalent Unit (TEU) (Figure 1); it operates short-distance voyages (usually 3–6 days/voyage). The ship is equipped with one main engine with a power output of 13,500 kW, and three gensets with power outputs of 1500 kW, each according to several references [34,35,36]. This conventional ship is equipped with a scrubber and a selective catalytic reduction (SCR) to meet the sulfur oxides (SOX) and NOX regulation (Tier 3). Table 2 provides the detailed specifications of the target ship.
Furthermore, for the target ship, the electric power demand is highly dependent on the reefer containers. In this study, it is assumed that the ship has 50% reefer containers (3.5 kW/reefer) onboard.
For a container feeder ship of this size, Table 3 illustrates a typical main engine load profile. In the Table, the time that is spent per year is based on reference [34], and the maneuvering time is given at the propulsion load of 5%. When maneuvering (or port in/out), the ship service load increased from 780 kW to 1800 kW, and it takes approximately 30 min. for each such operation. For this profile, the ship is at sea nearly 77% of the year (280 days) and in harbor operation for the remaining 23% (85 days).

3. Proposed Systems

3.1. Description of Proposed Systems

In this study, the conventional power system using HFO fuel is referred to as Case 1, and four new propulsion systems (Cases 2–5) are suggested while using NH3 fuel, as given below.
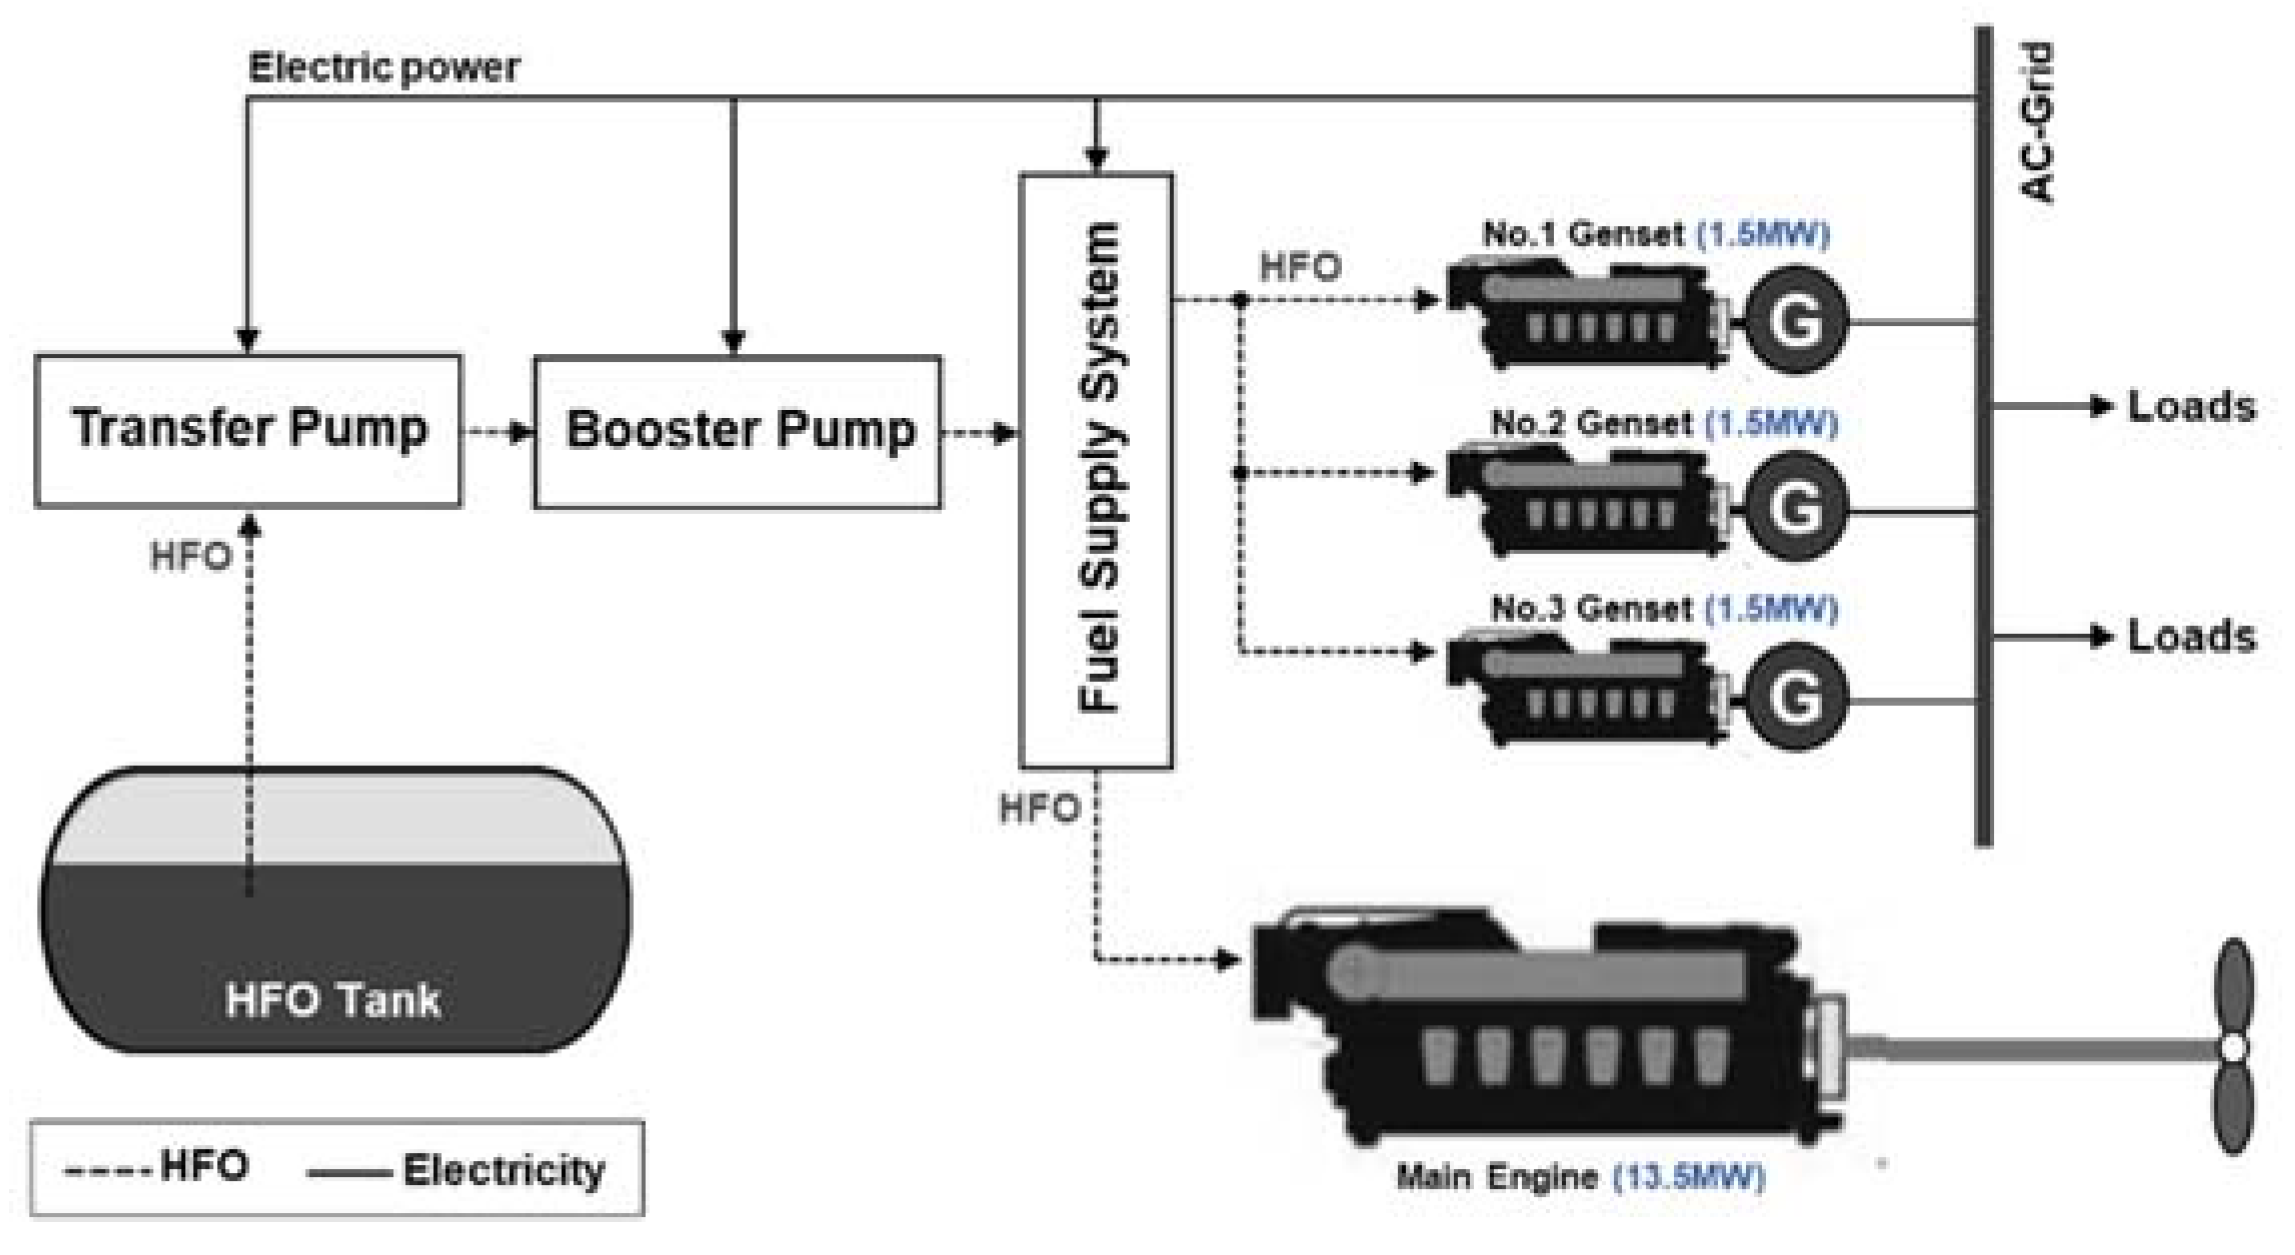
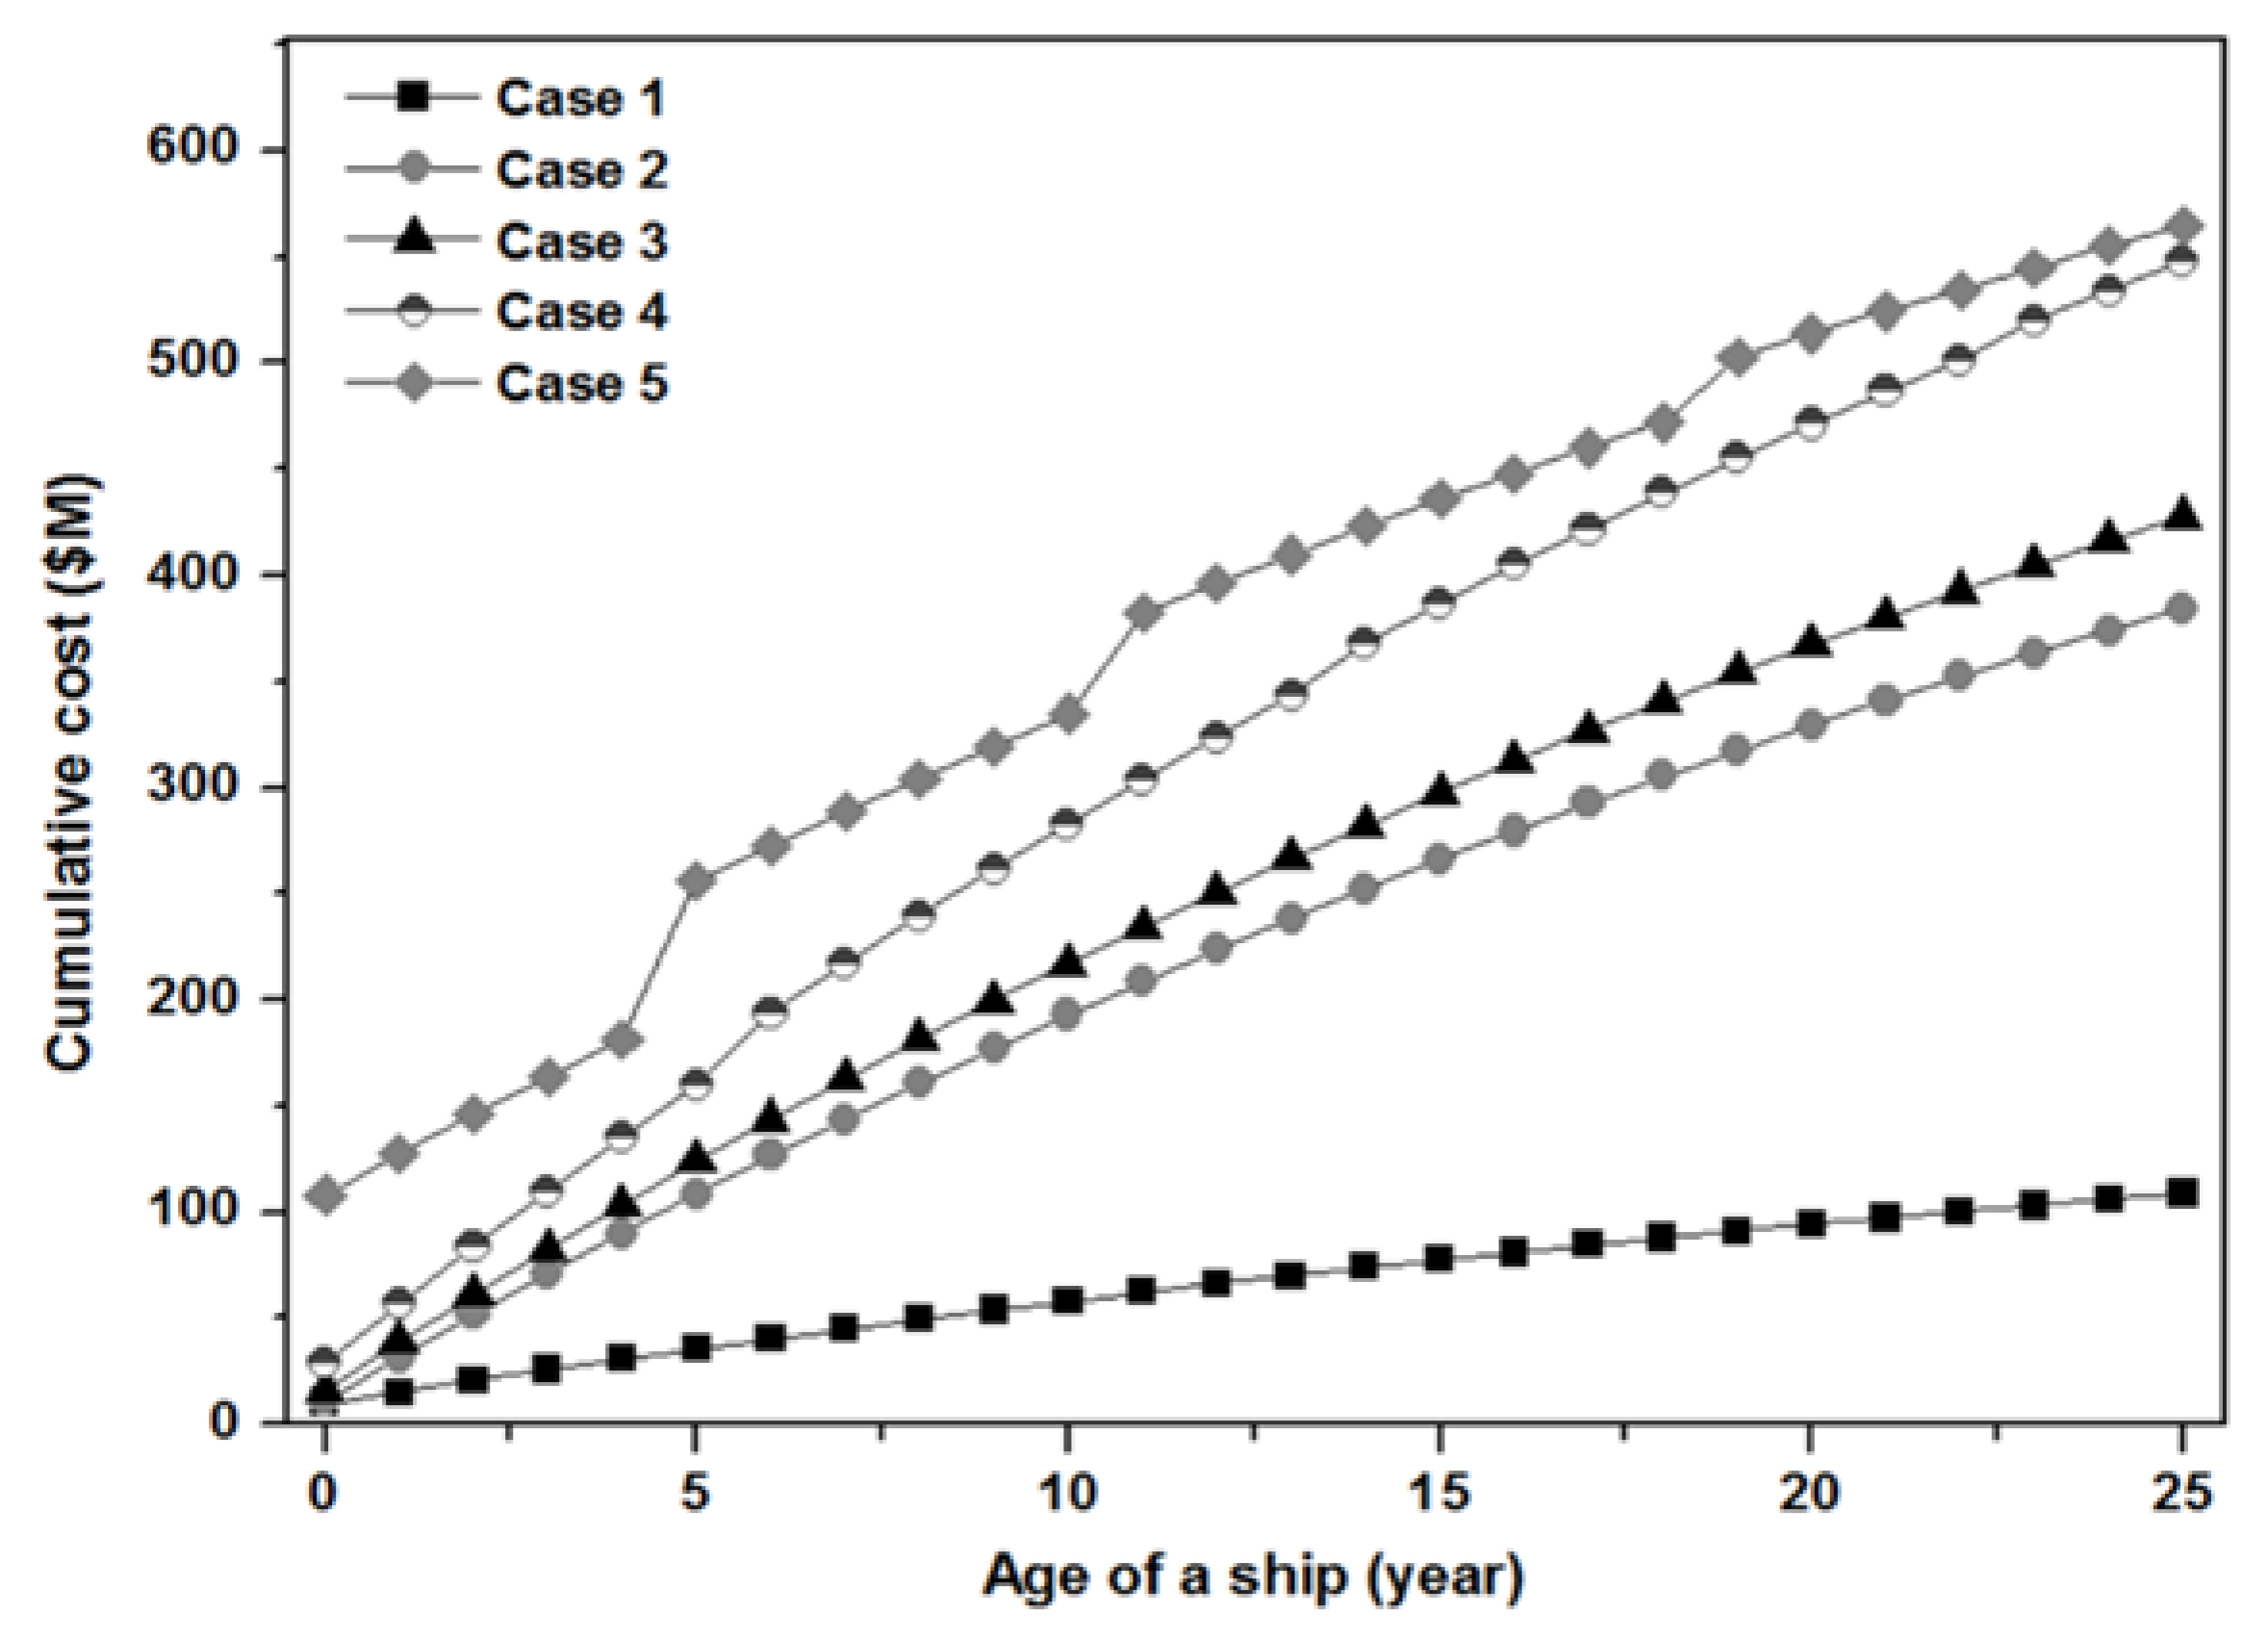
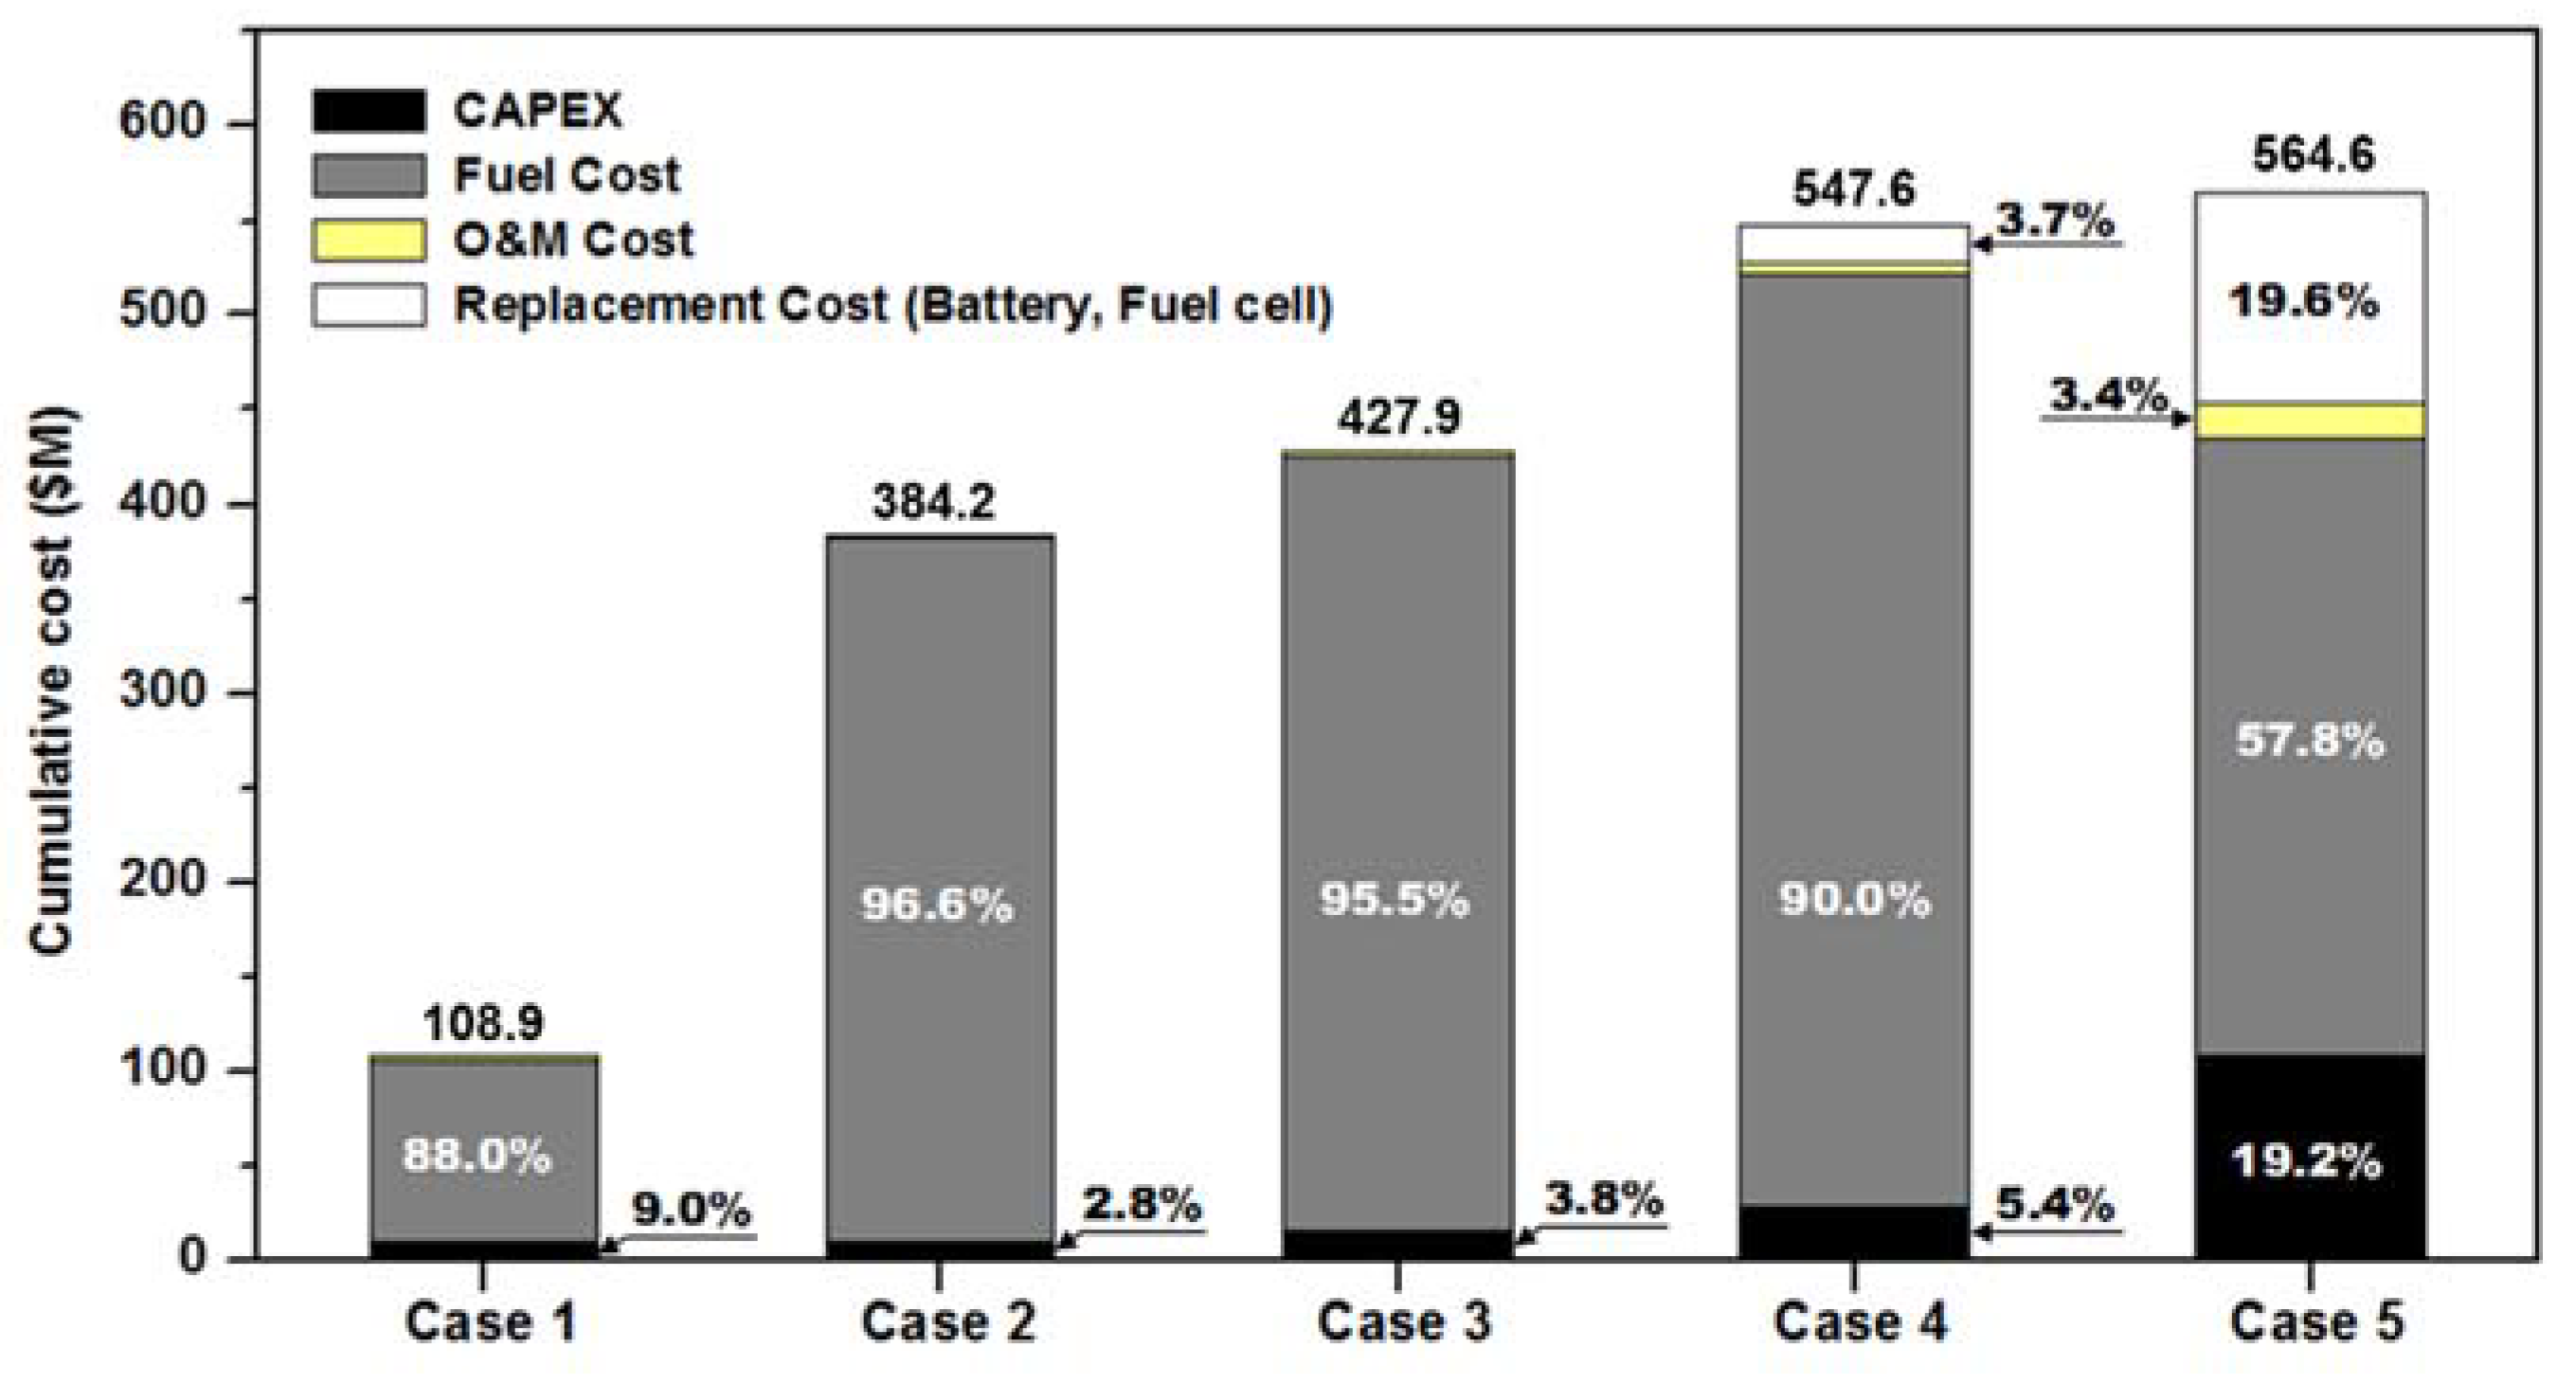
  • Case 1. The conventional HFO-based M/E propulsion system.
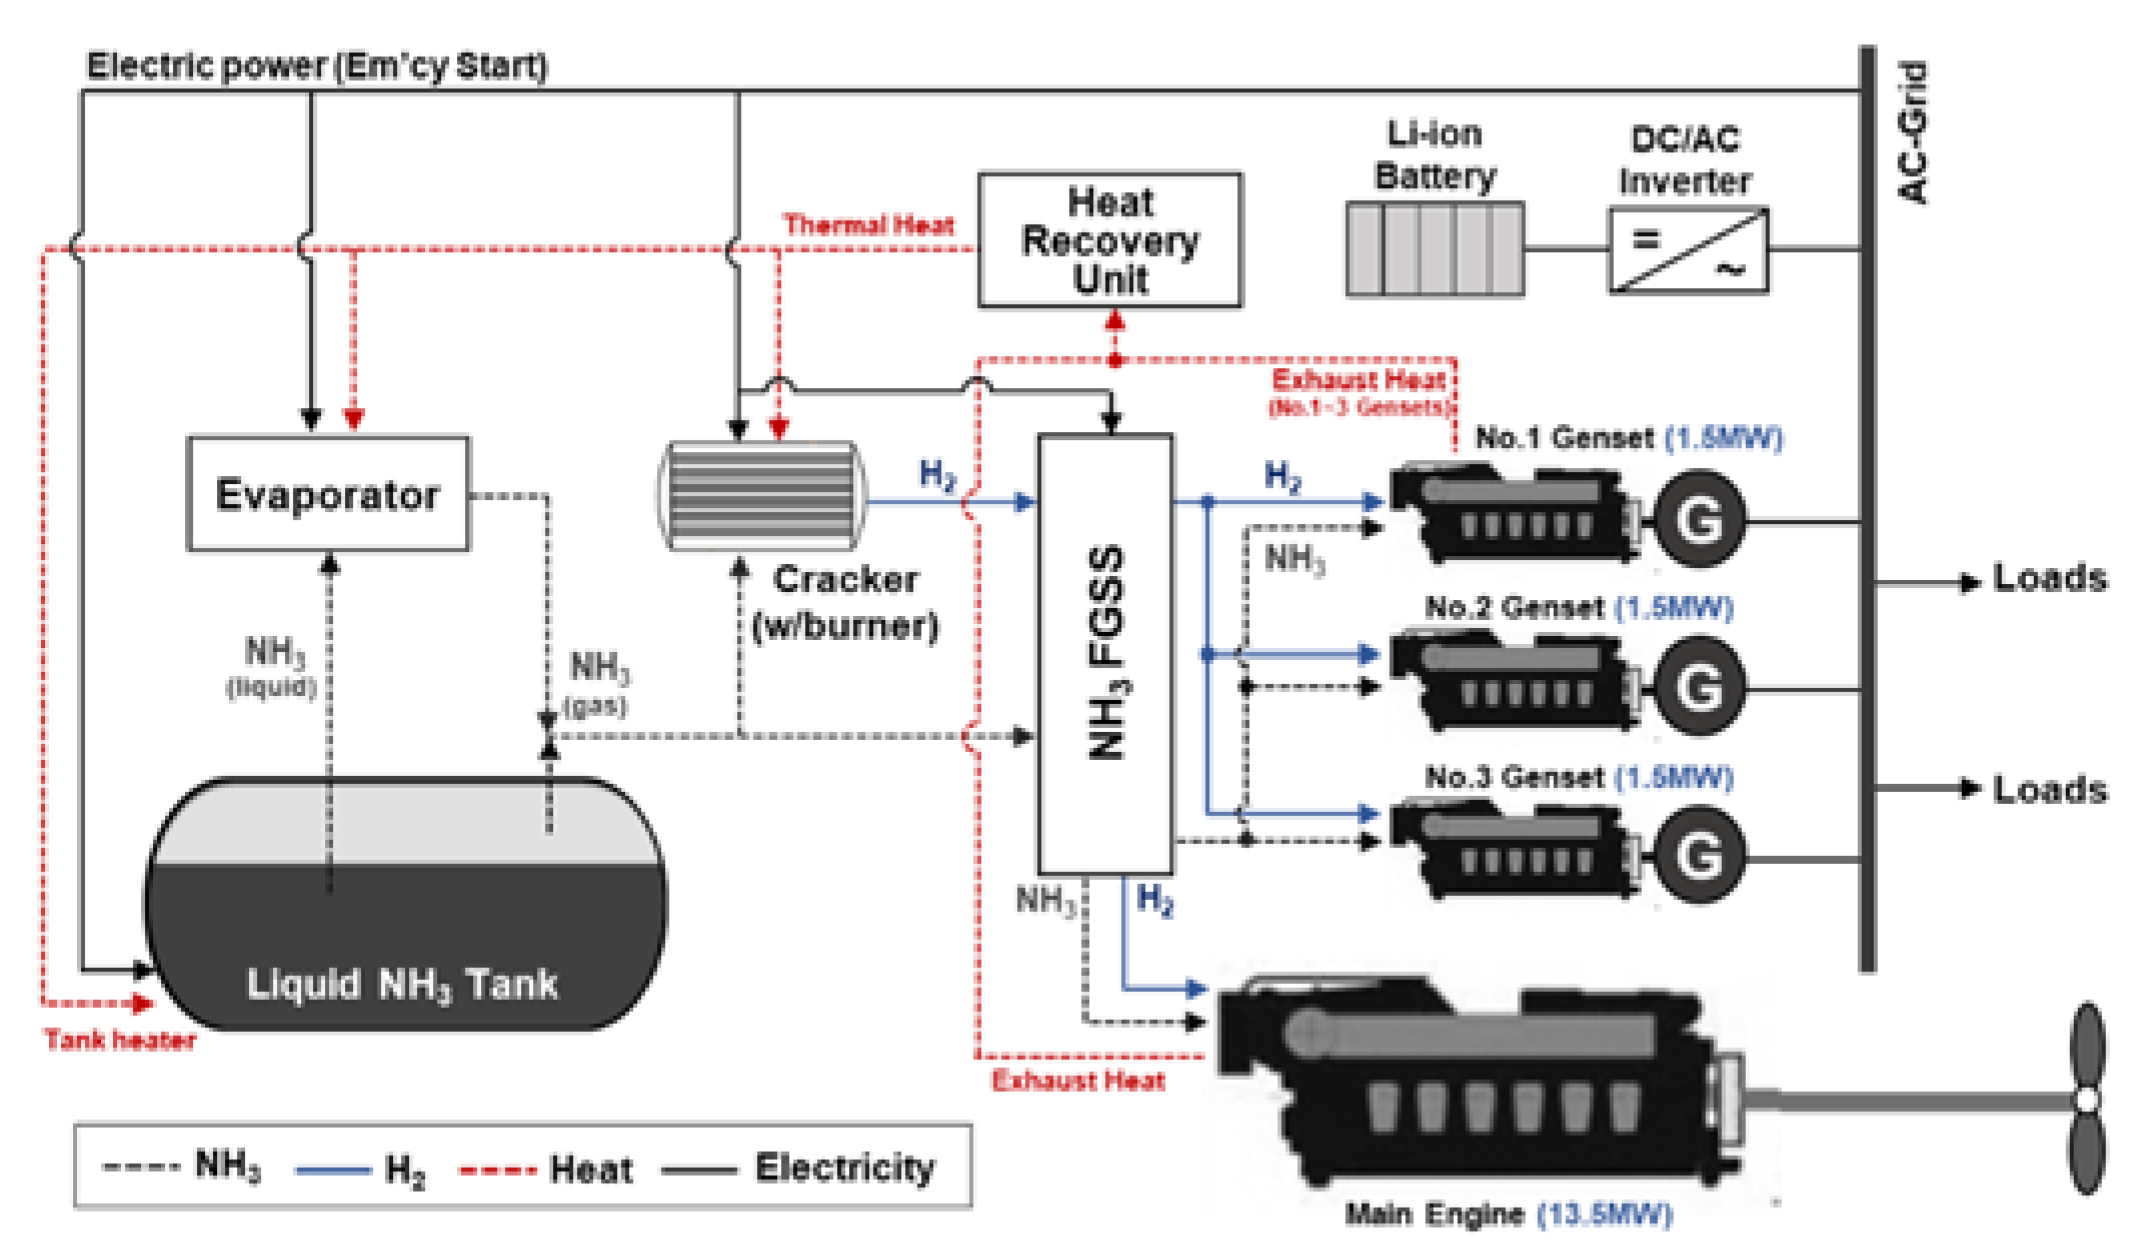
  • Case 2. The proposed NH3-based M/E propulsion system.
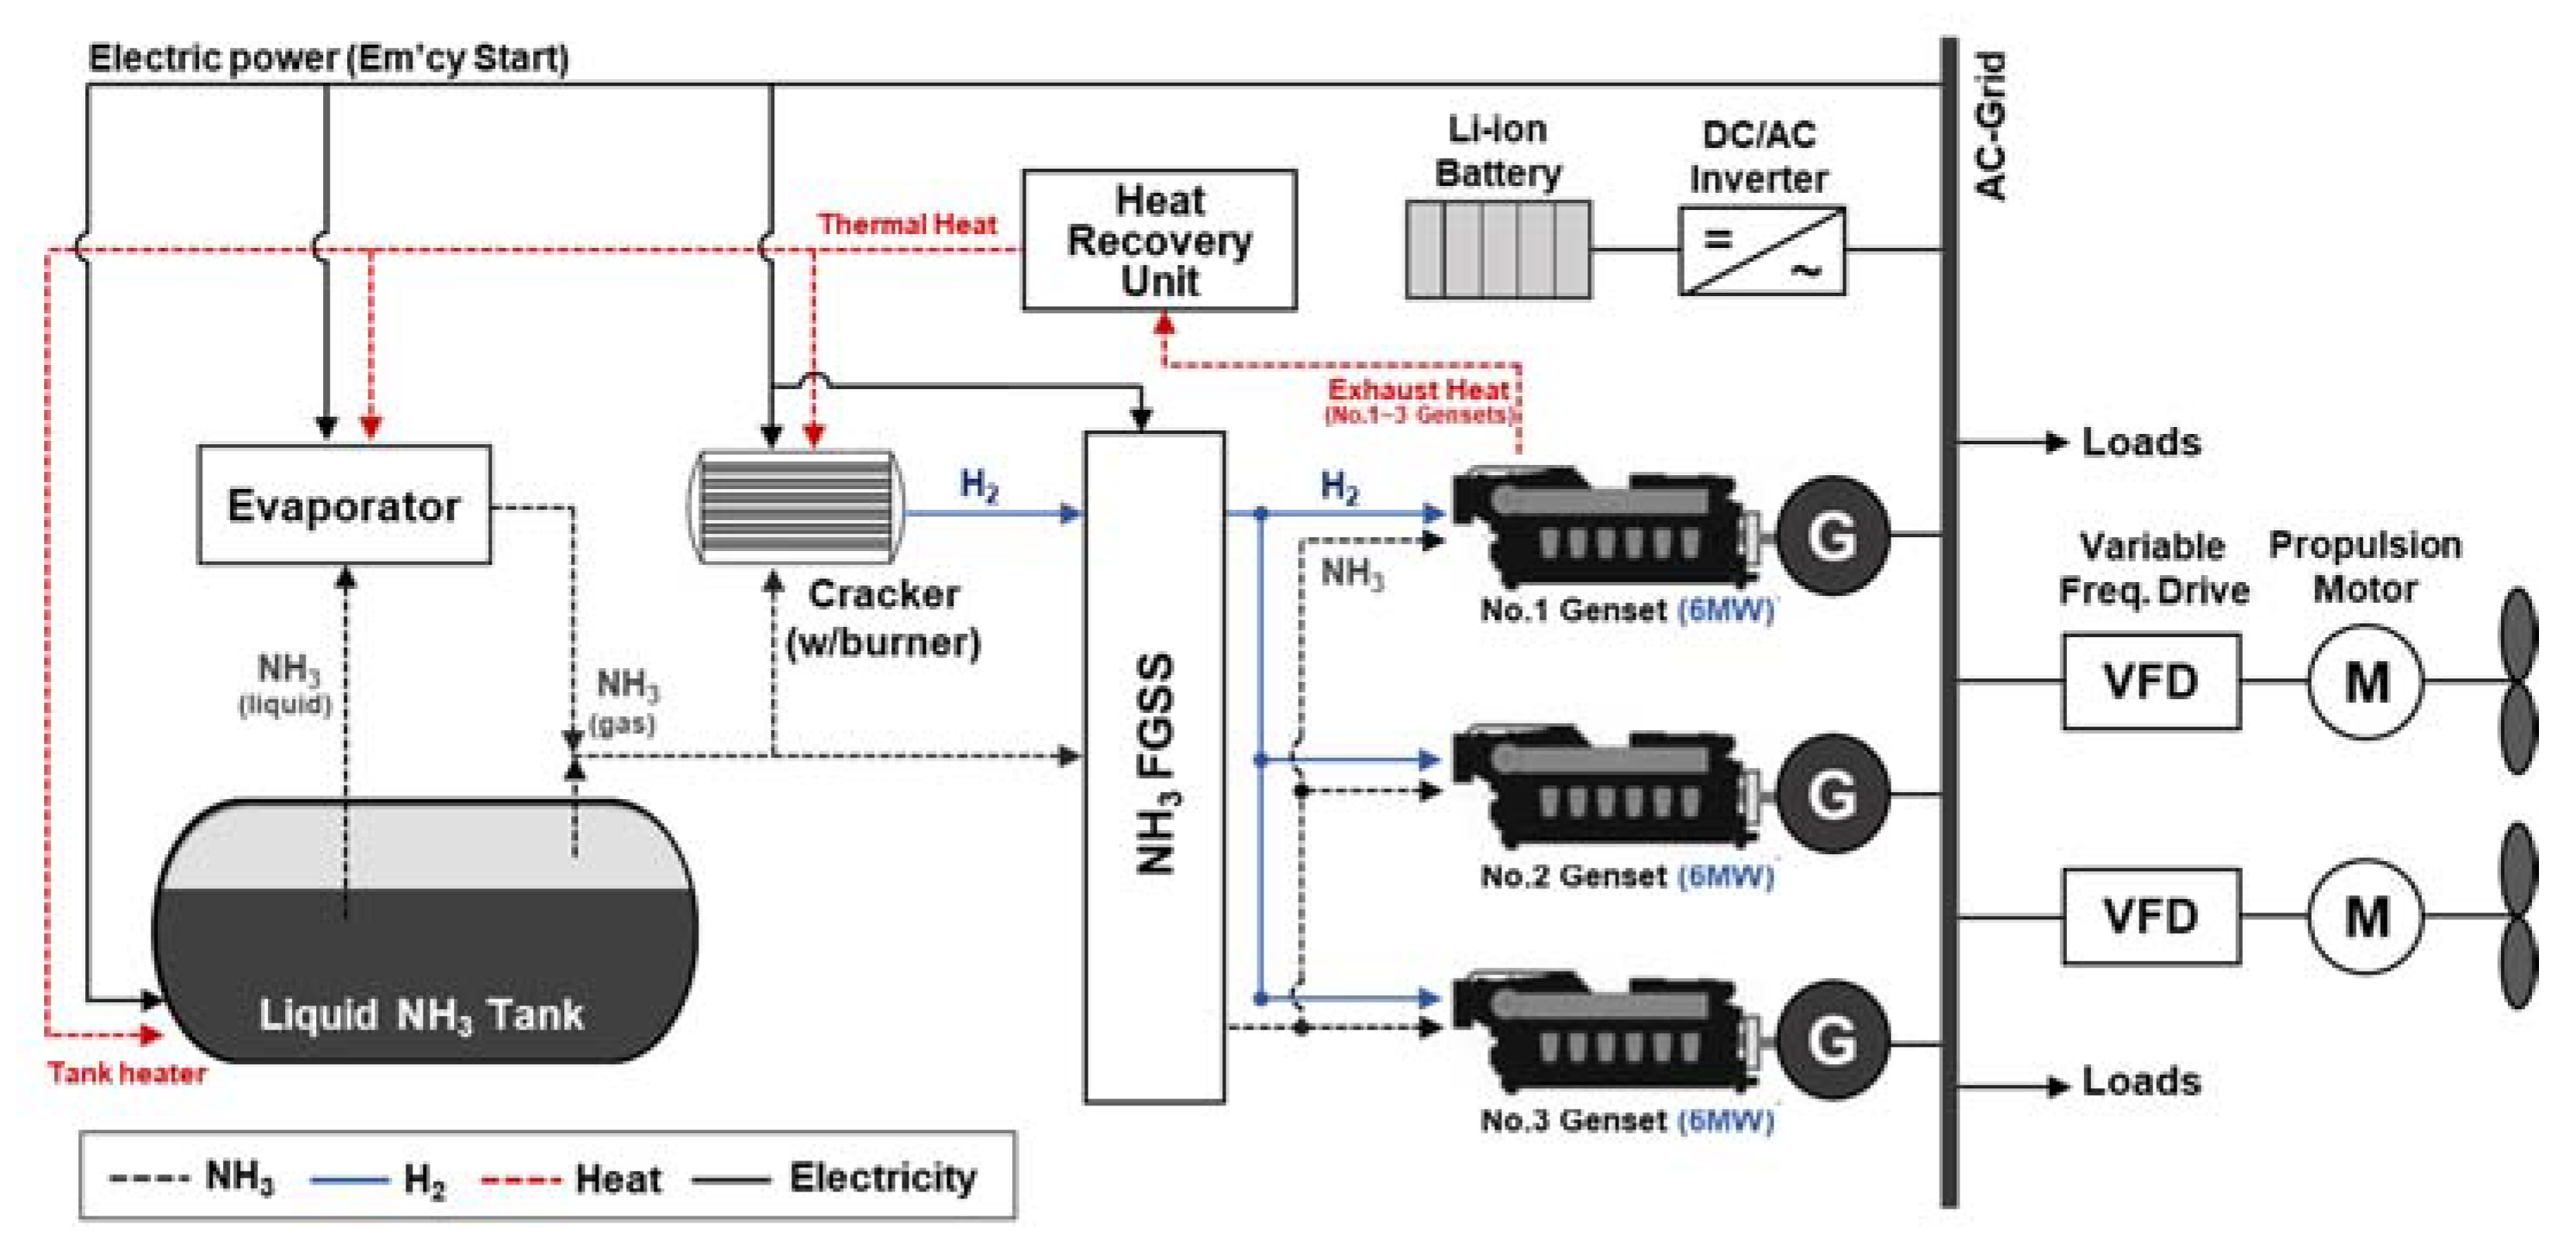
  • Case 3. The proposed NH3-based electric propulsion system powered by generators.
  • Case 4. The proposed NH3-based electric propulsion system powered by PEMFC.
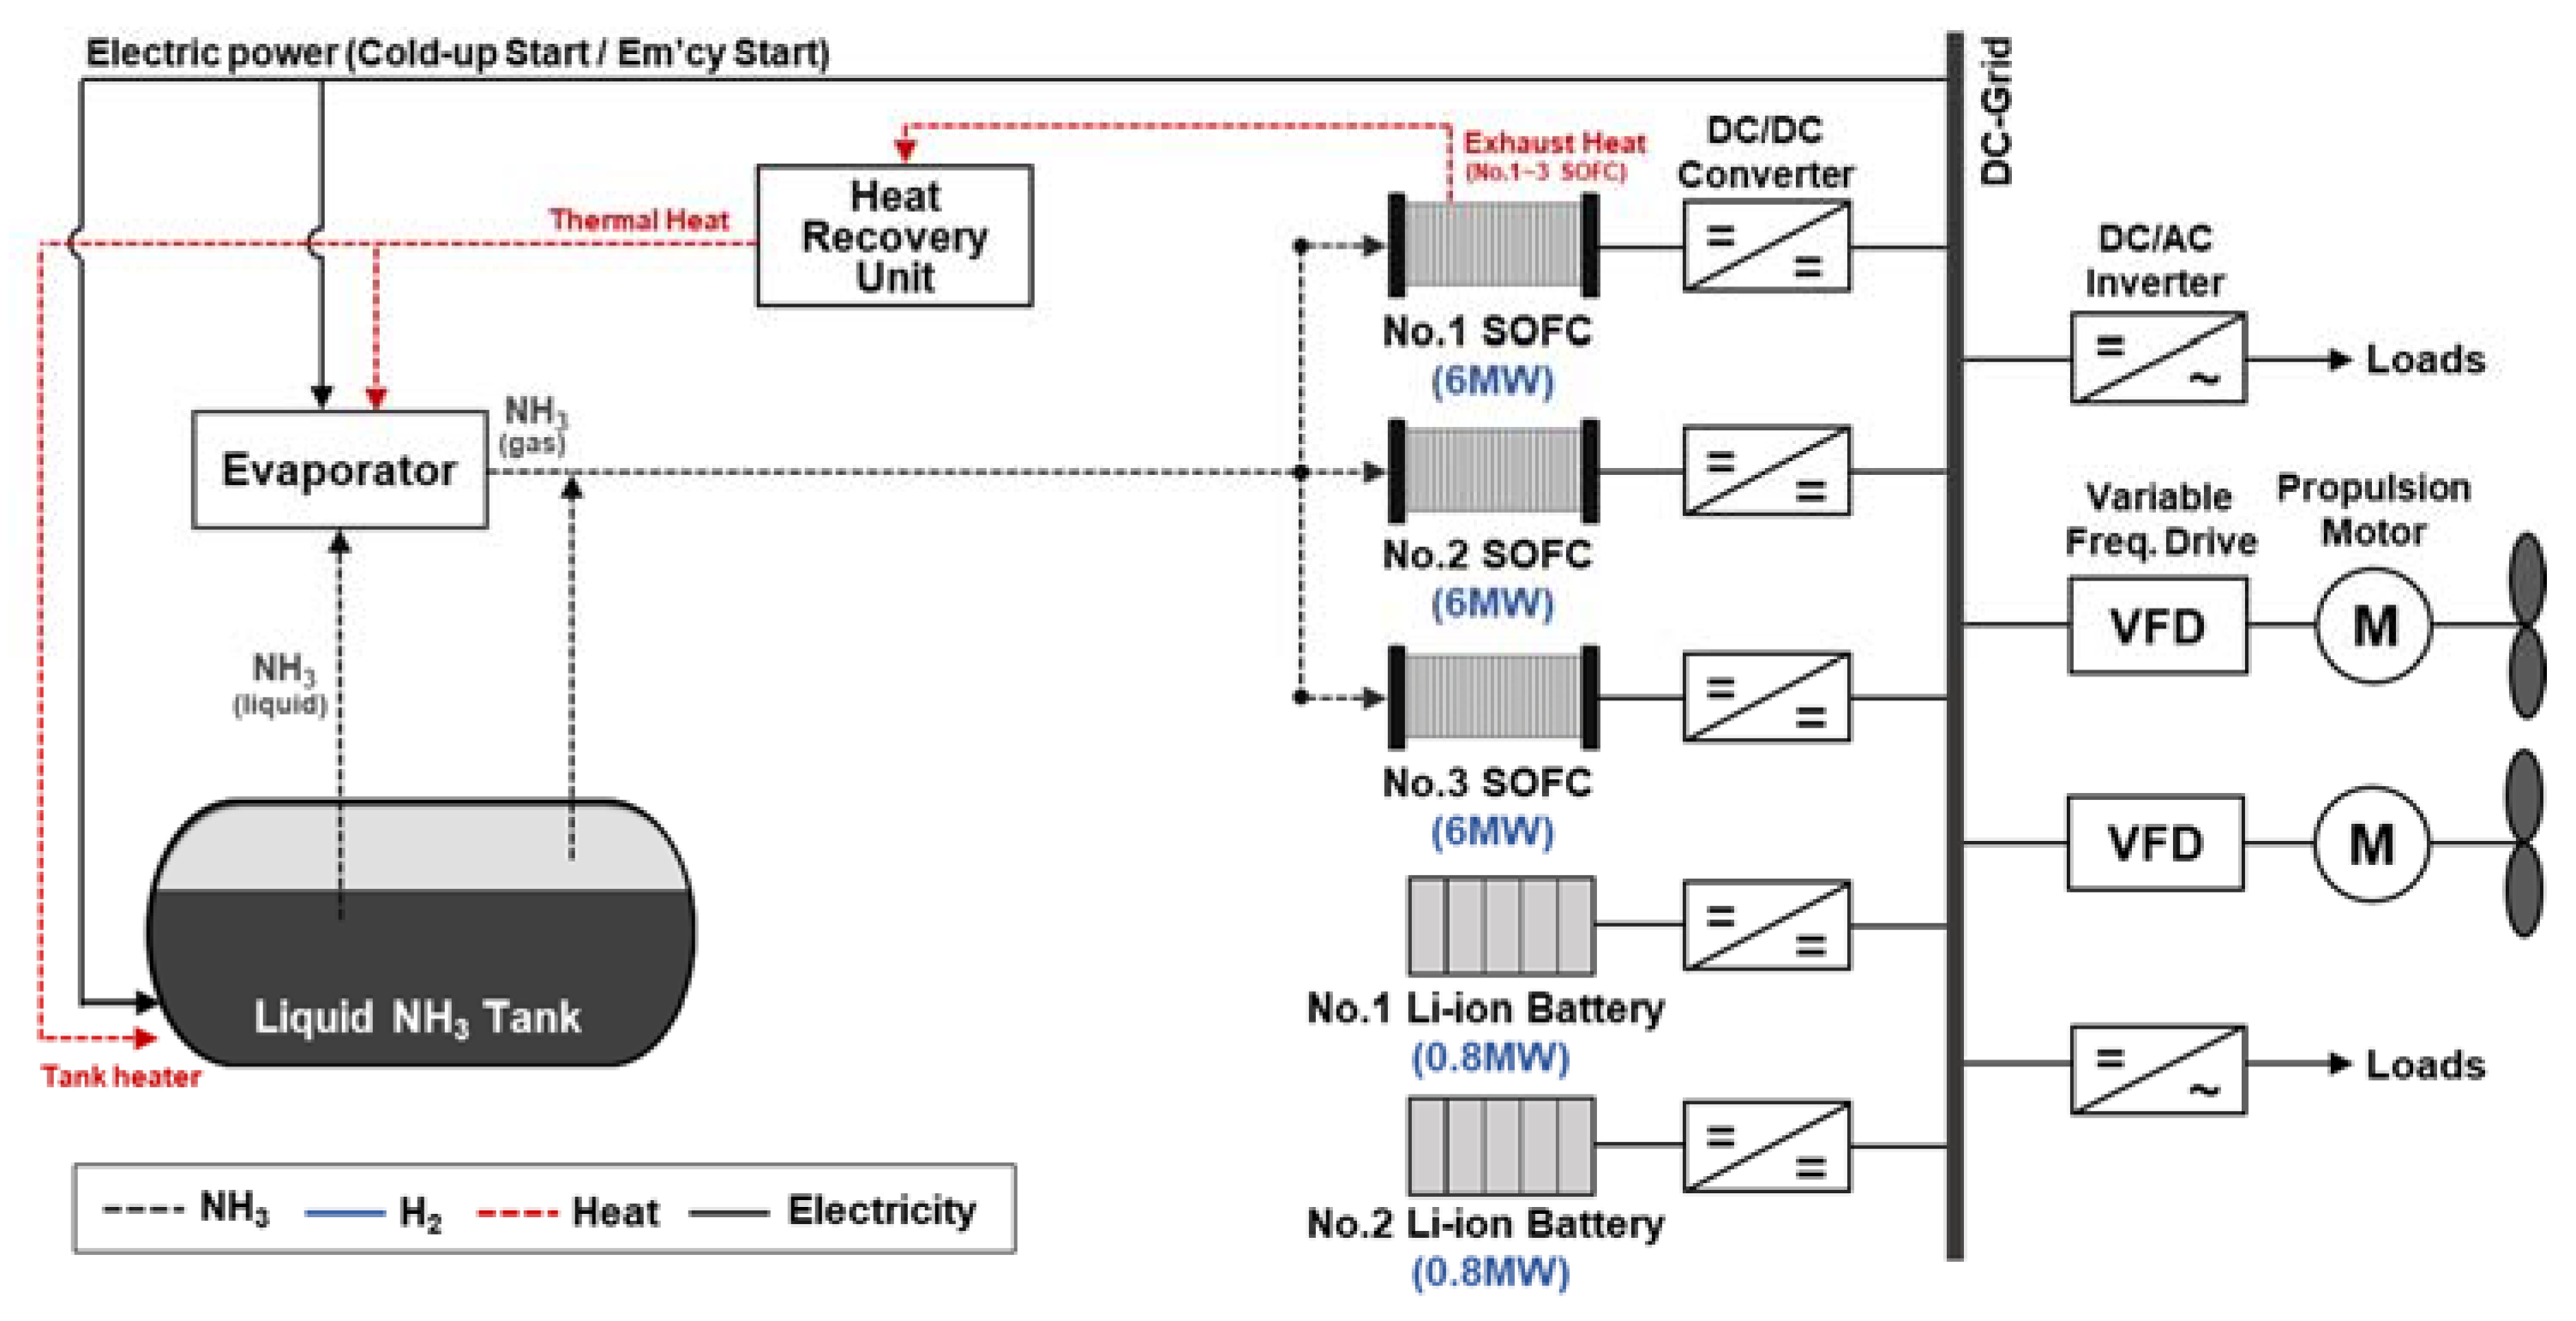
  • Case 5. The proposed NH3-based electric propulsion system powered by SOFC.
For Case 2, the propulsion configuration is the same as Case 1, except for the fuel type. For Case 3, the generators supply electric power to both the ship service load and propulsion load. For Cases 4 and 5, the generators are replaced with PEMFC and SOFC, respectively. Figure 2, Figure 3, Figure 4, Figure 5 and Figure 6 show the concept system for each case.

3.2. Main Equipment & System

3.2.1. Ammonia Engine

It is clear that pure ammonia shows low specific energy, high auto-ignition temperature, and it has narrow flammability limits (15–28% by volume in air), as shown in Table 1. This means that the combustion conditions are unstable at very low and very high engine speeds [3,7]. Consequently, hydrogen has been applied as a promoter for ammonia engines in many studies. M. Comotti et al. [37] successfully developed a cracking reactor housing for hydrogen generation and coupled it to an internal combustion engine that was fueled with ammonia. Frigo S. et al. [38] selected hydrogen as an engine combustion promoter and obtained it by reforming ammonia. In a study by C. S. Mørch et al. [39], the use of ammonia/hydrogen mixtures as an engine fuel was investigated in a series of experiments.
Hydrogen displays the lowest ignition energy, highest combustion velocity, and widest flammability range that allows for the engine to operate with very high air–fuel ratios. Therefore, a small amount of it, added to the air–ammonia mixture, is effective in speeding up combustion [40]. Of course, there are NH3-fed engines that applied gasoline fuel as a support fuel. However, the best and carbon-free promoter is regarded as hydrogen.
Ammonia–hydrogen mixtures can be used in a compression ignition (CI) or a spark ignition (SI) internal combustion engine. The CI is bound to certain mixtures and their corresponding timings based on the principle of design. Furthermore, to use both fuels efficiently, the CI has a trade-off between high compression ratio to promote ammonia combustion and limited compression ratio to prevent hydrogen from ringing [41].
In this regard, some research works that were undertaken on the use of ammonia have been on spark ignition engines Niels de Vries [14] mentioned that using an SI engine instead of a CI engine results in a further reduction in harmful emissions. In addition, C. S. Mørch investigated the use of ammonia/hydrogen mixtures as an SI-engine fuel [39], by varying the excess air ratio and the ammonia to hydrogen ratio. Moreover, the study by Frigo S. et al. [42] aimed at determining the proper air-ammonia-hydrogen mixture composition for the actual operating conditions of a twin-cylinder 505 cm3 SI engine. Besides, C. Duynslaegher [43] examined the combustion characteristics of premixed ammonia-air mixtures under the elevated pressure and temperature conditions that were encountered in SI engine operations.
In another study, Valera-Medina [7] reviewed an SI engine that was fueled by ammonia and mentioned that ammonia is required to be vaporized with at least 4–5% (by weight) hydrogen for good performance. In other words, mixtures of approximately 30% hydrogen and 70% ammonia (by volume) have been reported. In this study, the mixture ratio between NH3 and H2 for spark ignition is assumed based on references [3,14] and is given in Table 4. However, a separate fuel tank for hydrogen might not be a necessity because an onboard reformer could be used to crack a proportion of the ammonia into hydrogen (and nitrogen) to support combustion [3]. The cracking process itself is relatively simple, but further research is required to calibrate the rate of hydrogen cracking to support stable combustion conditions at variable engine loads and speeds.

3.2.2. PEMFC

The PEMFC is the most commercialized fuel cell type, and many fuel-cell-driven ships have already applied this type. The PEMFC is required to supply high purity hydrogen while using a purifier, which consumes approximately 2% [14] of the PEMFC’s capacity to maintain proper flow and pressure. The other auxiliary equipment for operating the PEMFC systems (cracker, cooling, air supply fan, fuel supply pump, etc.) is assumed to be similar to the amount of auxiliary equipment load that is required for the conventional engine.

3.2.3. SOFC

The SOFC has a huge advantage, in that it can directly use NH3 as fuel; however, the SOFC is limited in how rapidly it can increase fuel delivery rate according to power demand [44]. Therefore, the energy storage system (ESS) is utilized as a complement (back-up) power to compensate for the slow dynamics of the SOFC during transient operations, and it can also be used as a cold-start energy source. In other words, the ESS is charged through the remaining power at an instantaneous load reduction and it discharges at an instantaneous load increase. The ESS can cope with the extra load fluctuations, especially for high load conditions (ex. heavy weather, etc.).

3.2.4. ESS

For Cases 2, 3, and 4, at the cold start-up condition, the ammonia engine or fuel cell requires energy for ammonia cracking as well as vaporizing, and this could be supplied as electrical energy. In other words, during cold start-up, the cracker, evaporizer, and tank heater are electrically heated [42], and the amount of energy is assumed to be approximately 10 Wh (per kW of engine capacity) [37]. On the other hand, in the case of the PEMFC, it is assumed to be about 19 Wh (per kW of PEMFC capacity) based on a reference [45].
For Case 5, which directly uses ammonia, the ESS could be used for maneuvering power at port-in/out due to the slow dynamics of the SOFC. The additional increased load for the port-in/out is 1020 kWh; therefore, the ESS capacity that is demanded (Edemand) for Case 5 is at least over 1020 kWh. Based on the Edemand, the installed ESS capacity (Einstalled) is calculated, as below (Equation (1)), which is modified to a simple expression based on a reference [46]. In this study, it is assumed that DoD (kdod) is 80%, total system efficiency (ke) is 96%, and safety margin (ka) is 20% while considering battery aging (degradation) during its lifetime.
E i n s t a l l e d E d e m a n d k d o d × k e × ( 1 + k a )   [ kWh ]
Therefore, the Einstalled are selected as 300 kWh for Cases 2 and 3550 kWh for Case 4, and ESS of 1600 kWh for Case 5.

3.2.5. Cracking

Ammonia can be dissociated (or cracked) into nitrogen and hydrogen via the reaction [47]:
2 N H 3 N 2 + 3 H 2
Ammonia cracking is an endothermic reaction that requires a heat source (46.22 kJ/mol) [48] that is capable of maintaining the catalyst at the proper cracking temperature and, thus, delivering the required reaction enthalpy. Further, the dissociation rate depends on the temperature, pressure, and catalyst type [37]. The theoretical adiabatic efficiency for the thermocatalytic reaction is approximately 85% relative to the energy of the released hydrogen. Additionally, additional energy would be required to overcome thermal losses in the cracking process [48]. In this study, it is assumed that the cracker efficiency is about 80% based on several references [49,50].
In addition, for Cases 2 and 3, as per references [14,48], the exhaust gases and the cooling system from the engine can be utilized to supply heat to the cracker, evaporator, and the tank heater [14]. In other words, this recycled heat would be sufficient, because it only required a small percentage of H2 as a pilot fuel. For Case 4, the PEMFC operates with high-temperature conditions, and the heat could be utilized to supply heat to both the evaporator and the tank heater [14].

3.2.6. BOG and Vaporizing

Today, the Haber–Bosch process produces most ammonia on a large scale by and the generated liquid ammonia from the process is stored in tanks. A portion of the ammonia continuously evaporates, creating a gas called boil-off gas (BOG), due to heat entering the tanks during storage. The BOG leads to an increase in the pressure in tanks and loss of ammonia through the safety (or blow-off) valve, which could cause economic and safety problems. Therefore, similar to LNG carriers, this BOG could be reused as power sources.
Equation (3) could be applied to determine the BOG of the liquid ammonia inside a tank [51].
BOG = N H 3 E v a p N H 3 S t o r a g e × 100 % = U × A × Δ T N H 3 S t o r a g e × Δ H V a p × 100 %
where NH3,Evap is the mass of evaporated ammonia produced in a single day and NH3,Storage is the amount of available storage. ΔHVap [kJ/kg] is the heat of vaporization for liquid ammonia at −33 °C and U [W/(m2·K)] is the overall heat transfer coefficient for the tank, and ΔT is the temperature difference between the tank and outside air. A [m2] is the surface area of a tank. Typically, the boil-off rate of ammonia fuel is around 0.04%/d or lower [51], which is a significantly lower value than LNG fuel due to the small temperature difference (ΔT).

3.3. Fuel Consumption

In general, the specific fuel consumption (SFC) is calculated, as below, based on the energy density of the fuel and the total system efficiency [52].
S F C k ( i ) = 1 δ ( k ) × η   [ g / kWh ]
where i = the load factor of the M/E, genset or fuel cell. δ = the energy density of the fuel used [kWh/g] (Table 1). k = the fuel type (HFO, NH3, H2). η = the total system efficiency (Table 5).
However, the optimal load range of an engine lies between 70–85% [53]. Especially, in light load conditions, the engine runs less efficiently, and this phenomenon leads to a relative fuel increase when compared to the optimal operating conditions. In other words, the SFC of the fuel is different, depending on the load factor, and the modified SFC (SFC’) is calculated, as below (Equation (5)). In this study, the correction factors (Lf) according to different load factors are assumed in Table 6 based on references [54,55,56,57], and these may differ by manufacturers’ specifications.
S F C k ( i ) = 1 δ ( k ) × η × L f ( i )   [ g / kWh ]
Table 5 shows the system efficiency for each case based on references. For all cases, the total fuel consumption is the sum of the fuel demand for propulsion load (Pp) and ship service load (Ps), as below (Equation (6)). While using the SFC′, the total fuel consumption for one year (Ftotal) is calculated by adding the fuel used at each operating load time.
F t o t a l = i { P p ( i ) × T ( i ) × S F C k ( i ) ) } + i { P s ( i ) × T ( i ) × S F C k ( i ) }   [ g ]
where i = the load factor of the M/E, genset or fuel cell. k = the fuel type (HFO, NH3, H2). P(i) = the power demand for the load factor (i) [kW]. T(i) = the time spent for the load factor (i) [hours].
For Cases 1 and 5, which are fueled by HFO and NH3, respectively, the fuel consumption is just calculated while using Equation (6). However, for Cases 2 and 3, the total fuel consumption is calculated by summing the amount of NH3 for direct use and the amount of NH3 for cracking by using Table 4. Additionally, the hydrogen content of ammonia is 17.8%/mass (Table 1), which means that the NH3 for cracking is required about 6.18 times (including 10% loss) more than direct use to produce hydrogen. Furthermore, for Case 4, the fuel consumption is dependent on the PEMFC, which is only fueled by hydrogen from the NH3 cracking process.
Additionally, in Case 1, it is assumed that the scrubber requires 20 kW additional power per MW engine output [67] and, in Case 5, the additional power is required at harbor mode (i = 0%) for ESS charging. For Cases 1, 2, and 3, which have installed SCR, it is assumed that additional fuel (8%) is required for operating the SCR at the port in/out and at harbor [68].
Moreover, for Cases 2 to 5, while considering the naturally generated BOG in the storage tank (FBOG), the fuel demand for one year (Fdemand) is calculated, as below. In Equation (7), the boil-off rate (r) is assumed as 0.04% [51], and the efficiency of the BOG return system (ηB) is assumed as 80%.
F d e m a n d = F t o t a l F B O G = ( 1 r × 365 100 × η B ) × F t o t a l   [ g ]
Table 7 shows the results of the total fuel consumption for each case. Case 4, which is powered by hydrogen-based PEMFC, has the highest fuel consumption, despite the hydrogen’s high energy density, which is generated from ammonia cracking. Case 5, which is powered by ammonia-based SOFC, has the lowest fuel consumption, due to its high energy efficiency and its non-cracking system.

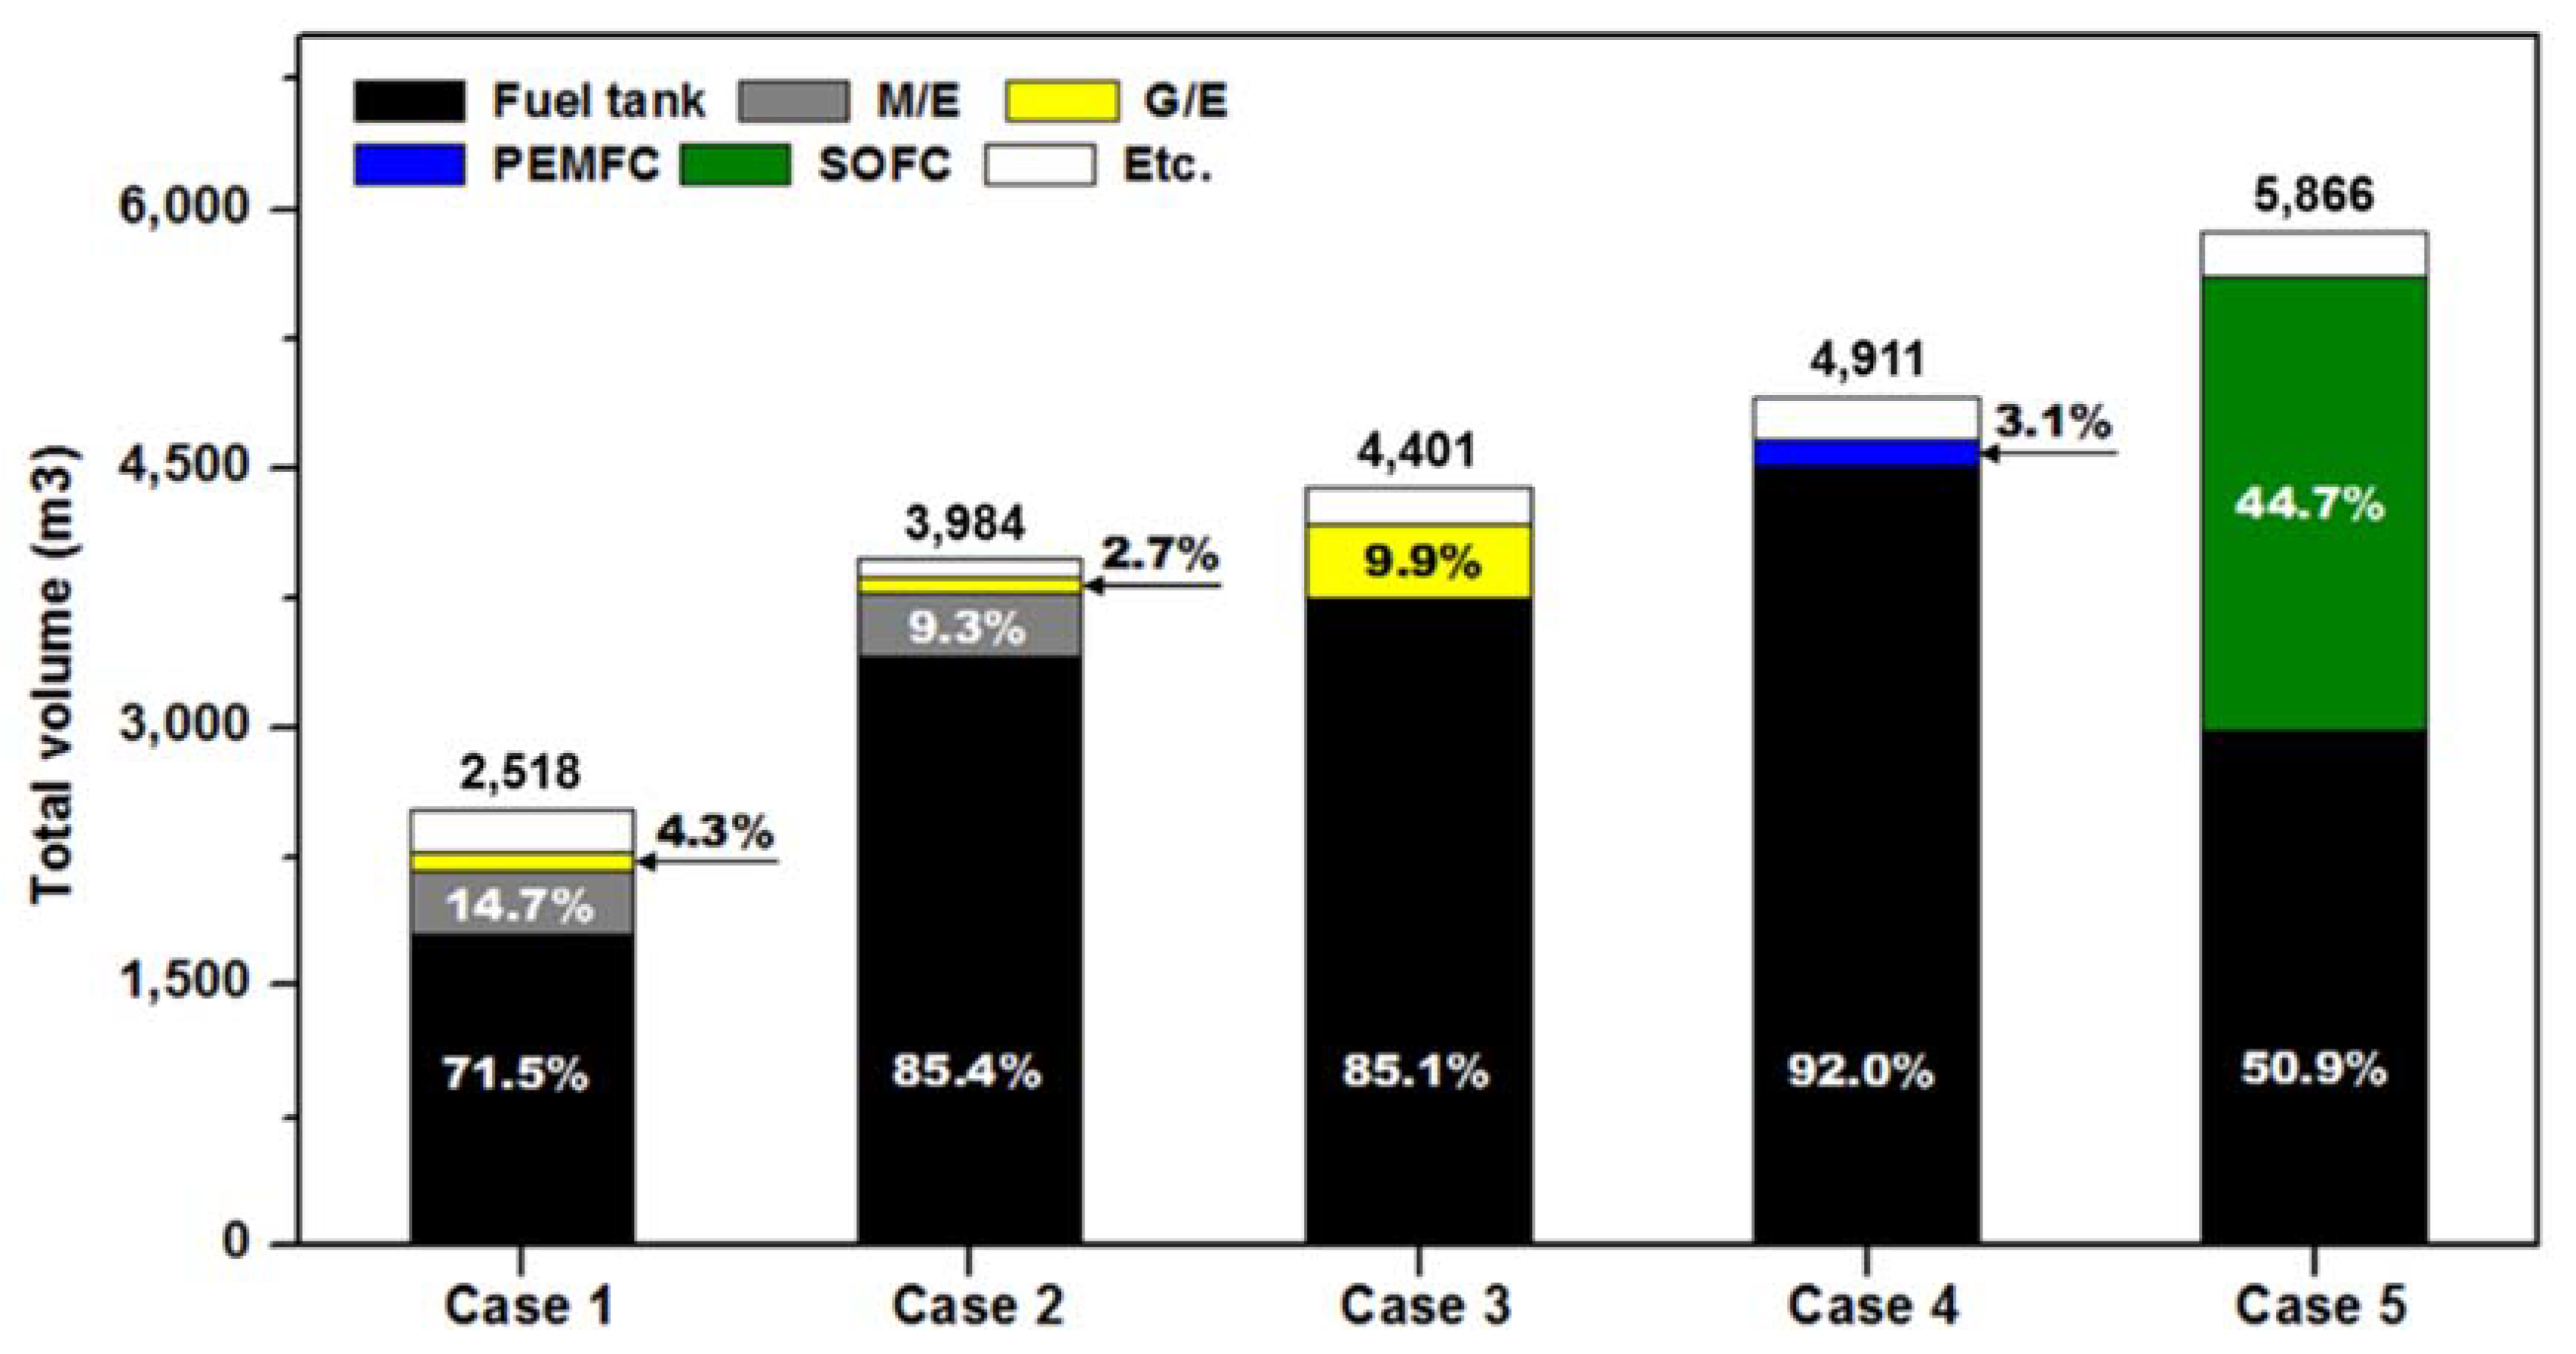
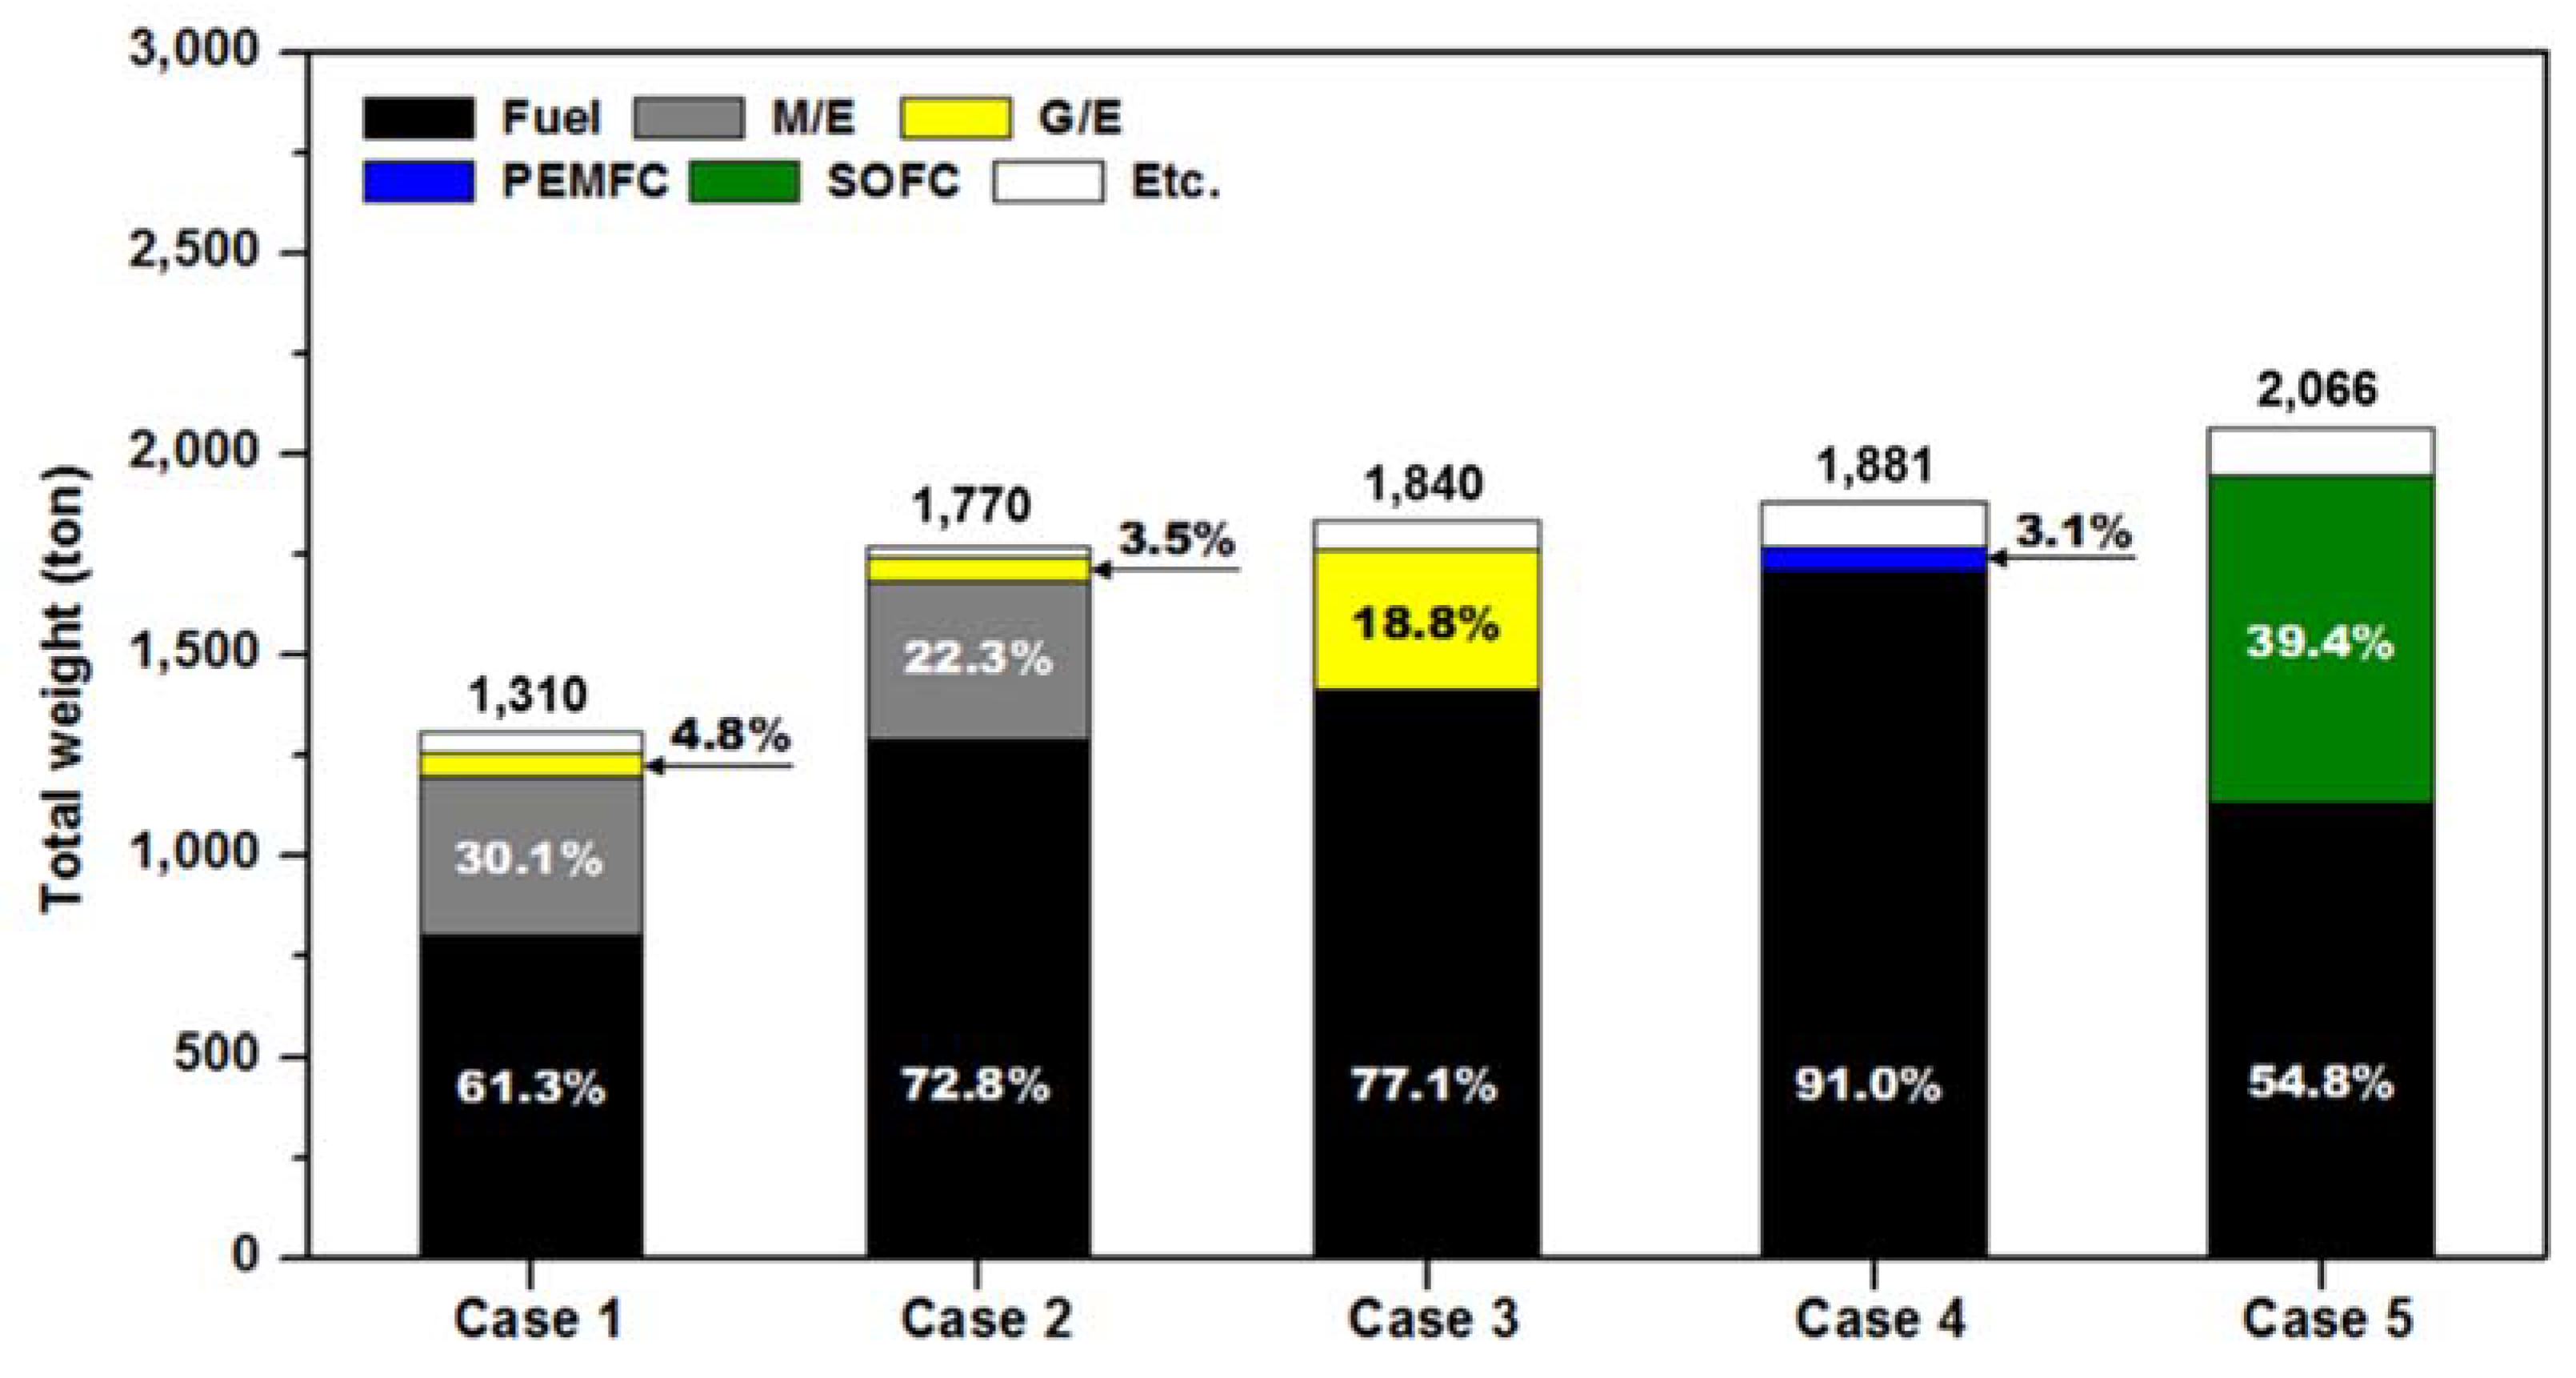
3.4. Volume and Weight

Ammonia has lower volumetric energy density and low heating value (LHV) than the conventional HFO fuel. Therefore, if a ship applied the proposed systems, it takes cargo loss inevitably, due to the decreasing space and dead weight tonnage (DWT) due to the ammonia fuel storage. In this study, Table 8 shows the assumed volume and weight for each piece of equipment.
Figure 7; Figure 8, while using Table 7, compare the results of total volume and weight for each case. In case of the weight, it is assumed that there is only half the amount of fuel in a fuel tank. In each case, the ratio of the main equipment was different. Among the cases, Case 5 required the largest volume and weight, owing to the high percentage of SOFC. In particular, the effect of volume increase is greater than weight, which is equivalent to cargo losses of about 87 TEU 20ft containers [81,82] as compared to Case 1. Therefore, alternative technologies (lightweight hull materials, optimized space layout, etc.) need to be considered to compensate for this.

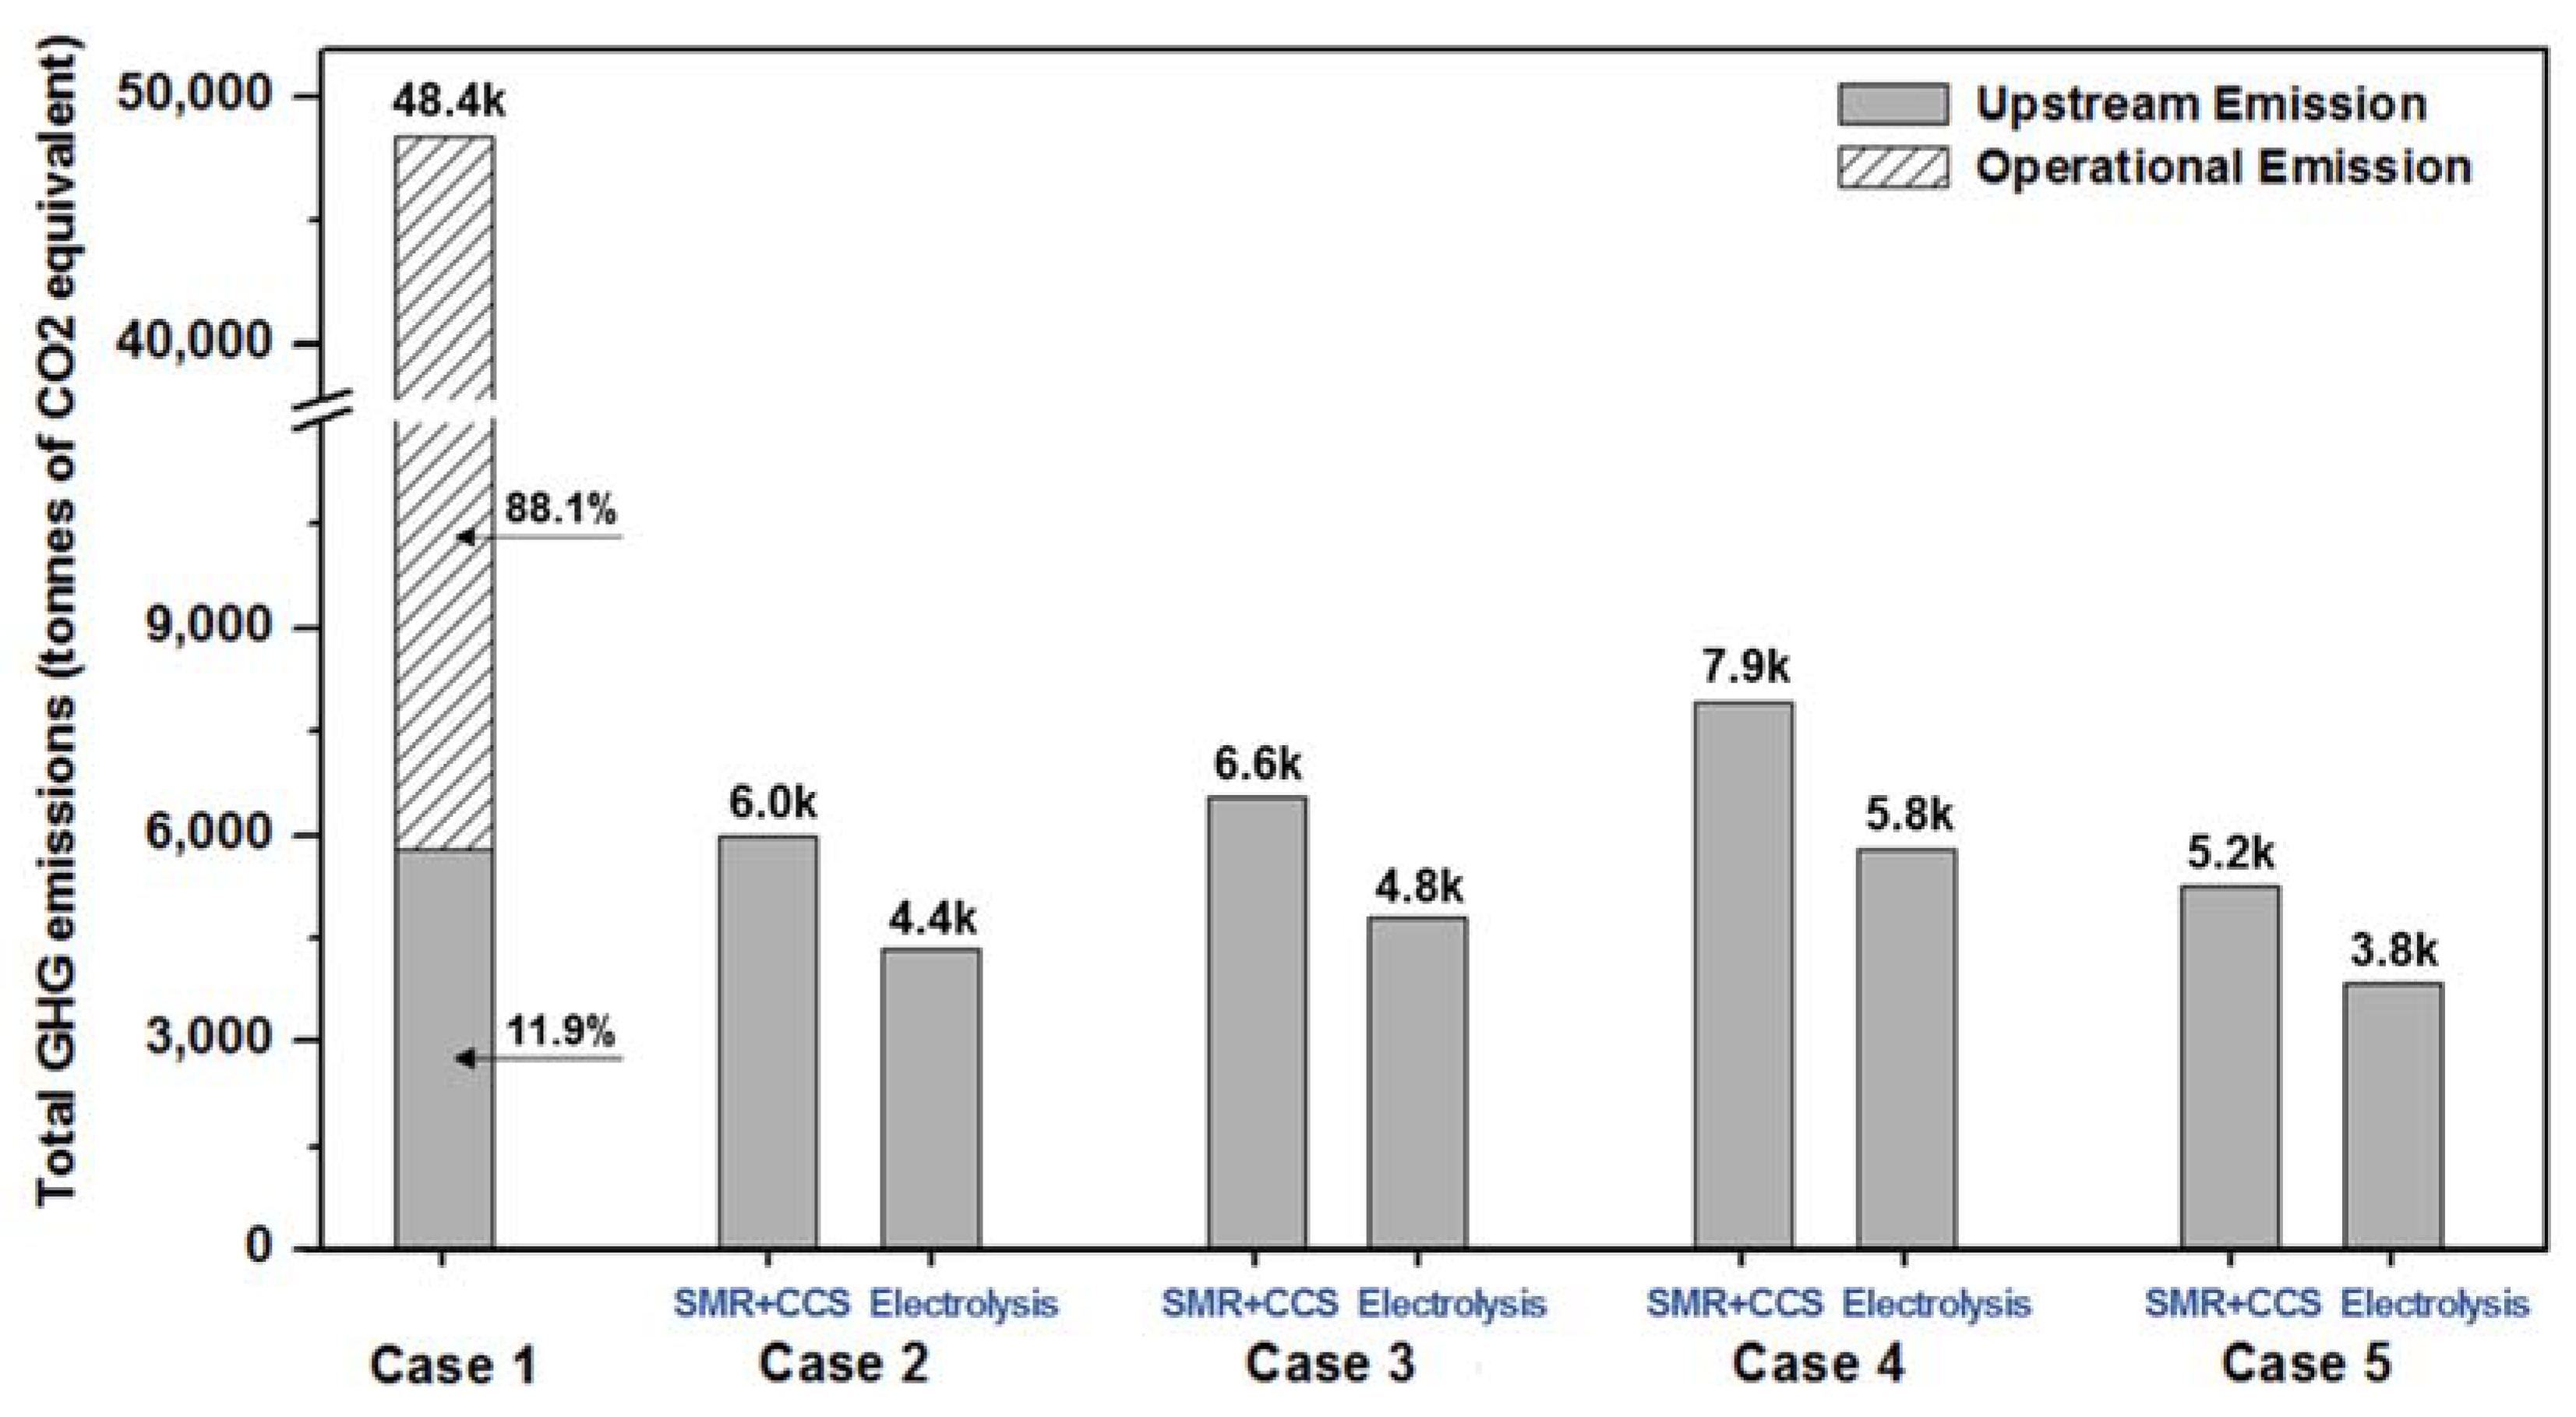
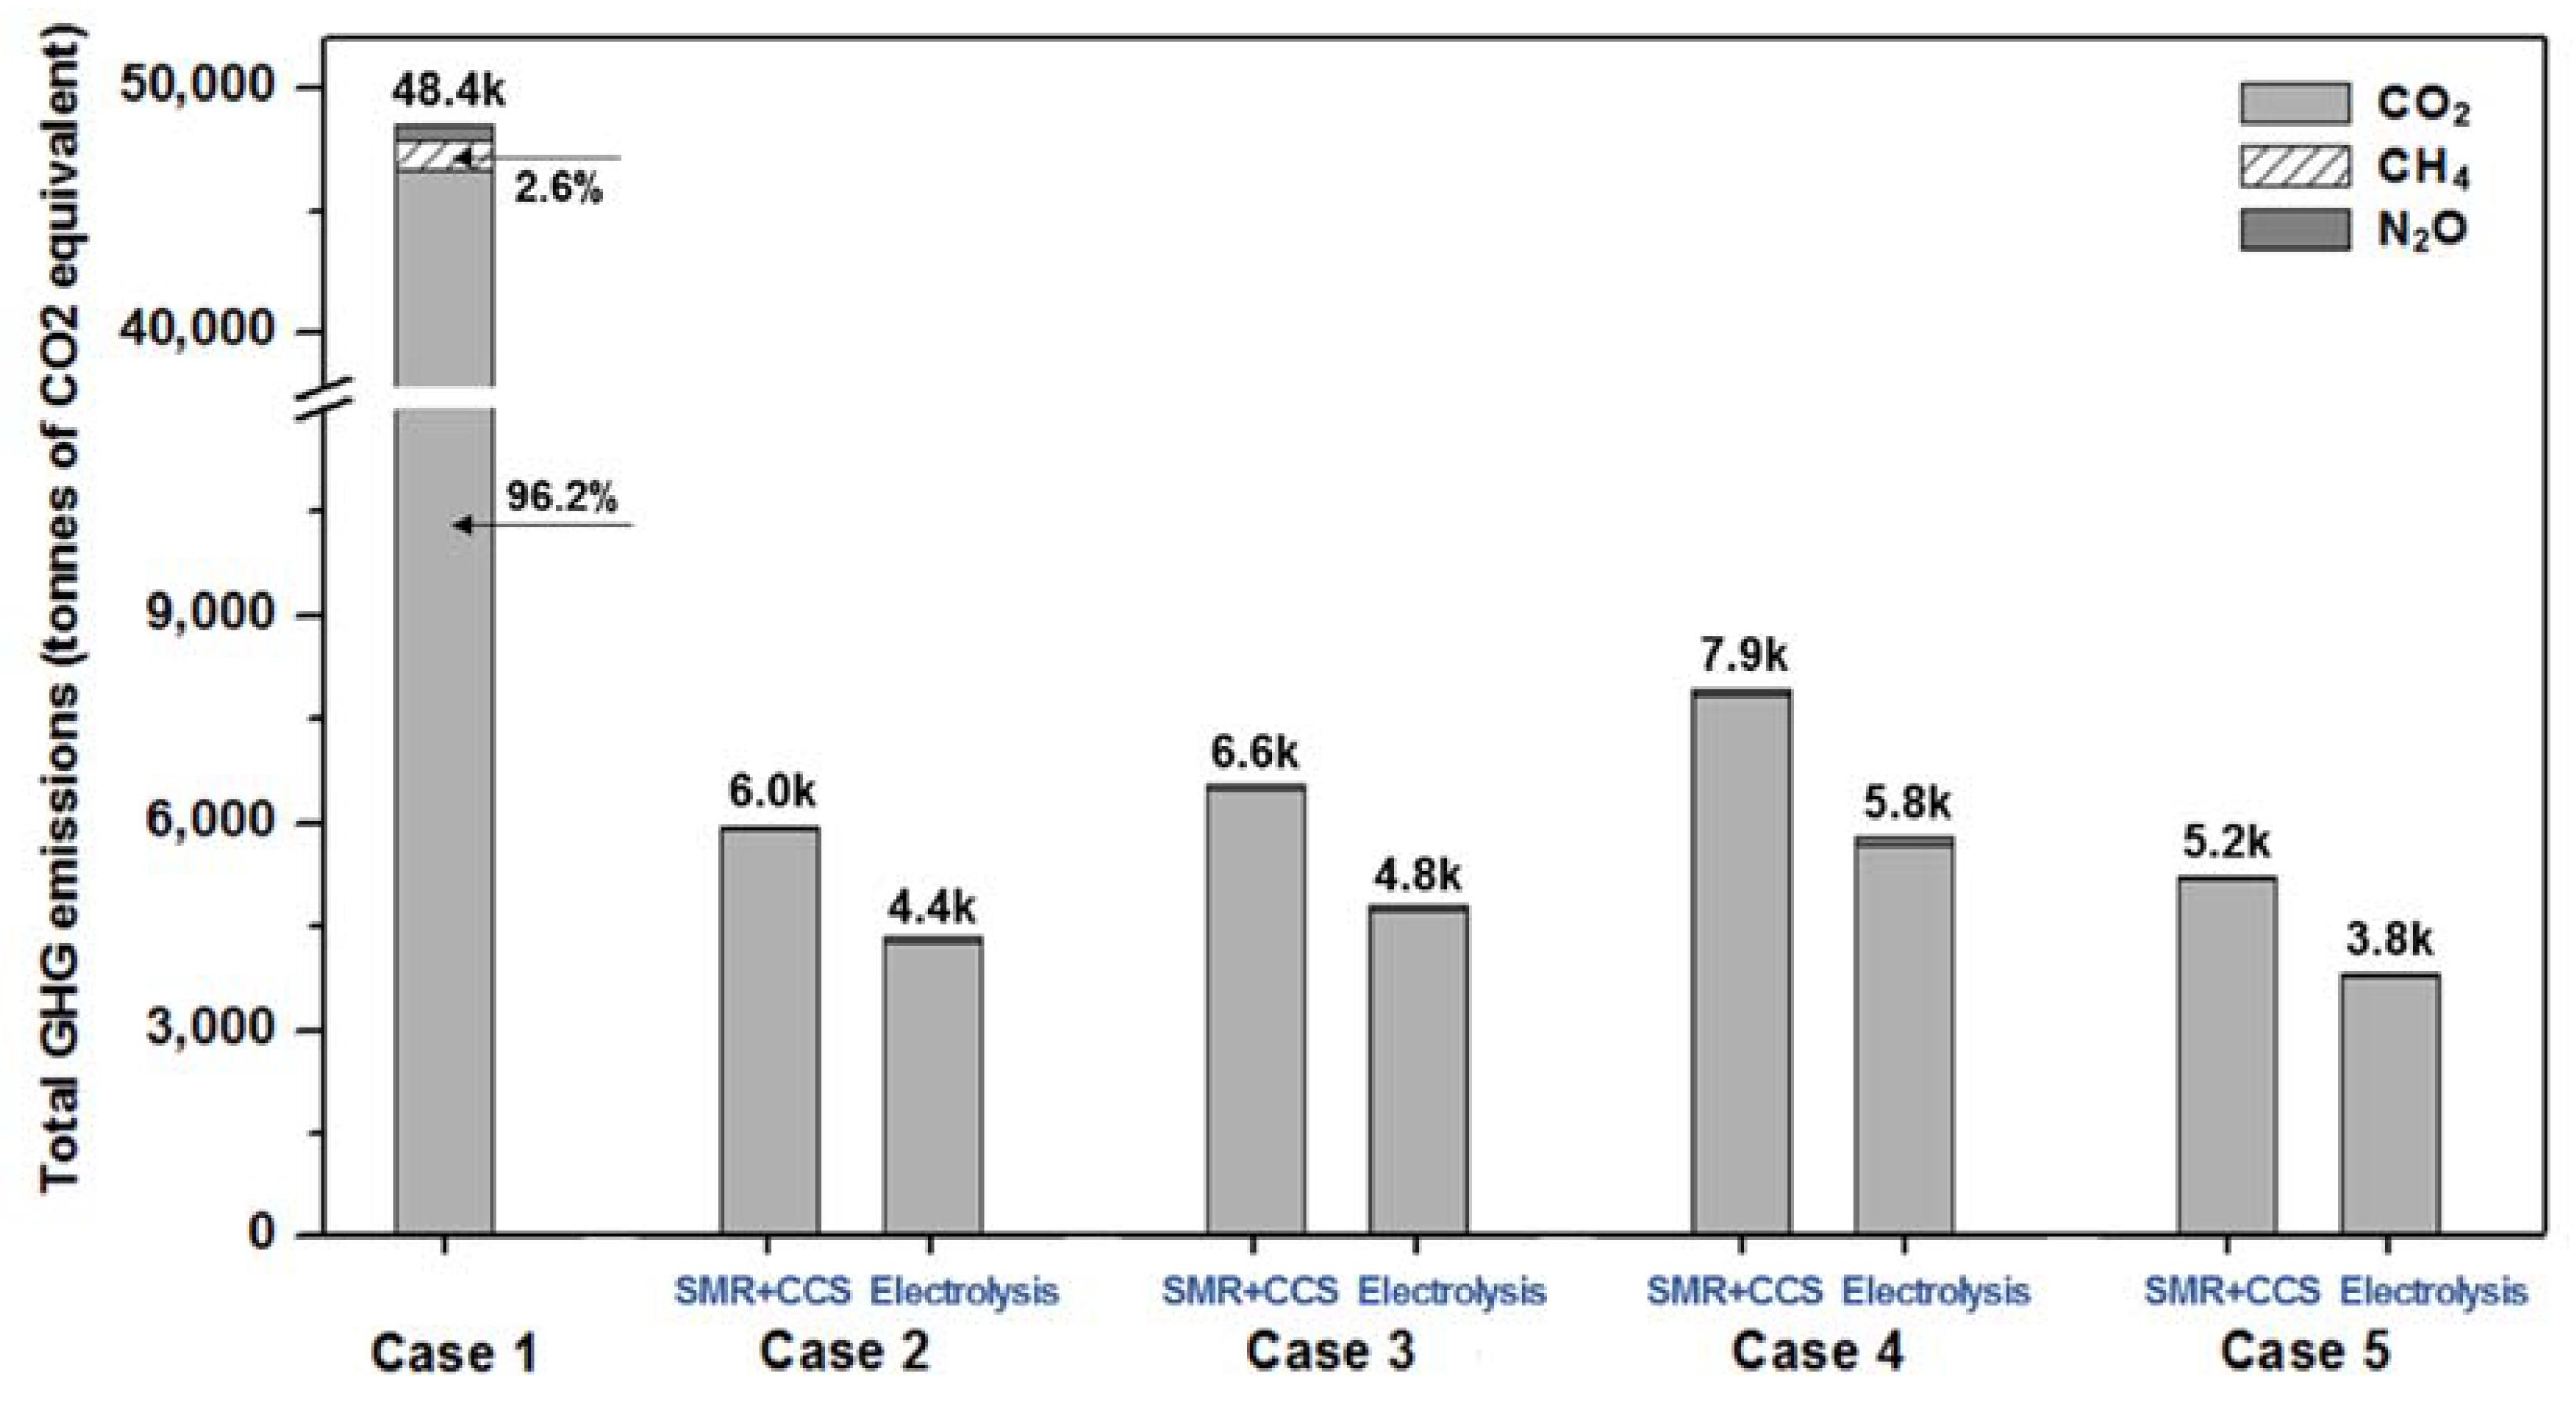
4. Environmental Analysis

The environmental impacts are compared for each case being focused on GHG emissions. The other types of emissions (SOX, NOX, and particulate matter (PM)) are not necessary for comparison due to the installation of SCR and scrubber for Case 1. In the case of ammonia fuel, the Haber–Bosch process can produce it in great quantities from natural gas, which is not an eco-friendly solution due to the steam methane reformation (SMR) emissions for hydrogen production. Therefore, the SMR is mostly integrated with carbon capture and storage (CCS). However, ammonia could also be produced by renewable or waste energy though the water electrolysis process. Therefore, the emission factor of NH3 is divided into two: the SMR with CCS method and the electrolysis method. Table 9 shows the emission factors for each fuel type [10,83].
Additionally, the total life cycle emissions are both upstream emissions and operational emissions. The upstream emissions are the emissions generated from the fuel production and transportation processes, whereas the operational emissions are the emissions that are generated from the ship’s operation.
GHG emissions are calculated while using the CO2-equivalent global warming potential by directly summing the 100-year conversion coefficients recommended by the 5th assessment report (AR5) of the Intergovernmental Panel for Climate Change (IPCC) for the three main GHG emission types (CO2, CH4, and N2O) [84]. Therefore, the GHG emission factors (Ef (GHG)) are calculated as:
E f ( G H G ) = E f ( C O 2 ) + 28 × E f ( C H 4 ) + 265 × E f ( N 2 O )   [ t · C O 2   _ e / t · f u e l ]
As shown in Figure 9; Figure 10, among all of the cases, Case 5 is the most eco-friendly system that requires the lowest fuel consumption. When comparing with Case 1, Case 5 could reduce GHG emissions by approximately 89.2% (SMR with CCS) or 92.1% (electrolysis). For all cases, the ammonia fuel by electrolysis would be more environmentally beneficial than SMR with the CCS method. The upstream emissions are given a higher impact when it comes to the ammonia fuel; however, the operational emissions have a significant effect on the HFO. Therefore, it is noted that CO2-neutral shipping seems to be possible for ammonia-fueled ships.

5. Economic Analysis

The cumulative cost for the lifespan of a ship is calculated, as below, based on a reference [85] while using the capital expenditure (CAPEX) and the operating expense (OPEX).
C u m u l a t i v e   c o s t = C A P E X + n = 1 n = 25 O P E X × ( 1 + i ) n ( 1 + r ) n
where n is the age of ship from 1 to 25 years, r is the discount rate, and i is the annual inflation rate. For all cases, the only capital cost of main equipment is considered as CAPEX, and the replacement cost for fuel cells and lithium-ion batteries are included if applicable. In addition, the cost of fuel cells and lithium-ion batteries are predicted to decrease, while their lifetimes are expected to increase, as shown in Table 10.
The OPEX is the sum of operation and maintenance (O&M) costs for each equipment and the fuel cost during the total lifetime of a ship. For Case 1, HFO fuel price is assumed at approximately $ 405.0/t, which is the annual average value in 2019 for global 20 Ports [93]. In the other cases, the NH3 fuel price is assumed to be about $ 830/t [3], and the annual OPEX inflation rate and discount rate are assumed as 2% and 5%, respectively. The other auxiliary equipment installation cost and its O&M cost would be ignored based on the assumption that these costs are extremely small [86].
Additionally the cargo loss due to the increased volume of machinery for the proposed cases is not considered due to the difficulty of deciding the exact cargo cost. Table 11 shows the assumed equipment cost and O&M cost for the main equipment.
Figure 11 shows the results of the cumulative cost for a ship with a 25-year lifespan, and Figure 12 shows the division of CAPEX, fuel cost, O&M cost, and replacement cost (battery, fuel cell). Among the proposed systems, the most economic system is Case 2, which is the M/E propulsion that is fueled by NH3; however, its cumulative cost is about 3.5 times higher than Case 1. For Case 5, the CAPEX (19.2%) and the replacement cost (19.6%) have comparatively higher impacts, while the fuel cost (57.8%) is the lowest when compared to the others.
Even though the price of ammonia fuel is higher than that of conventional HFO, it is expected to decrease with stability because of improvements in the procurement of the ammonia supply chain. If the NH3 price is decreasing same as the HFO price at $ 405/t, the cumulative cost will be down 1.8 to 3.6 times than Case 1, depending on the system type, as shown in Table 12.

6. Conclusions

Ammonia is an intrinsically carbon-free fuel that produces zero CO2 emissions when renewably sourced, and it is a clean fuel solution for engines and fuel cells. In this study, four possible propulsion systems that are all fueled by ammonia are suggested and compared with a focus on fuel consumption, and economic and environmental aspects. The results show that the ammonia-based ship would require more volume (1.6–2.3 times) and weight (1.4–1.6 times) than the conventional HFO-based ship, and it costs 3.5–5.2 times from the total lifecycle perspective. However, the NH3-fueled ship could reduce GHG emissions by approximately 83.7–92.1%, which is dependent on the propulsion type and the fuel production method.
Among the proposed systems, Case 5, which is applied to the electric propulsion system powered by the SOFC and ESS, is the most eco-friendly system. However, it is the most expensive solution due to the high CAPEX than the others. Moreover, it requires more development in power density considering the high volume and weight. Alternatively, it is expected to compensate by integrating new technology, such as lightweight hull materials, the optimized space layout, etc. Furthermore, the cost-effectiveness is to be improved.
A number of additional challenges should also be solved to prove the feasibility of ammonia as a ship fuel. First of all, the main potential drawback is the safety issue (corrosion, toxicity, low flammability, etc.). However, ammonia has been handled as the liquefied gas cargo, a refrigerant, and an SCR reducing agent in ships, so the measures for these could enable the next step in enabling ammonia as a safe fuel.
On the regulatory side, some partial amendments to the section on the International Code of Safety for Ship Using Gases or Other Low-flashpoint Fuels (IGF Code) are required, and the International Gas Carrier Code (IGC Code) needs to allow for ammonia as a ship fuel. In addition, even though there are no classification rules for using ammonia as a fuel for ships, classification societies have already developed rules for ammonia carrier ships (ammonia tankers), refrigerated ships using ammonia, and thus these can be used as a basis for developing rules for ammonia as a fuel. In terms of the infrastructure, as ammonia has been already produced and transported in large quantities around the world, the industry’s existing infrastructure could be used to realize bunker locations for ammonia-fueled ships in the future [106].
The economical and eco-friendly ships are of utmost importance for future sustainable development. Therefore, this new approach could be helpful in realizing carbon-free ships in the long-term perspective.

Author Contributions

K.K. wrote the manuscript, conceptualized and analyzed; G.R. analyzed; W.K. reviewed and edited; and K.C. supervised. All authors have read and agreed to the published version of the manuscript.

Funding

This work was supported by the ‘RnD Platform Establishment of EcoFriendly Hydrogen Propulsion Ship’ (No. 20006636, ‘Development of test facility and method for MW class hydrogen FC ESS system of ship’) funded by the Ministry of Trade, Industry & Energy (MOTIE, Korea).

Conflicts of Interest

The authors declare no conflict of interest.

References

  1. International Maritime Organization (IMO). Greenhouse Gas Emissions. Available online: http://www.imo.org/en/OurWork/Environment/PollutionPrevention/AirPollution/Pages/GHG-Emissions.aspx (accessed on 30 November 2019).
  2. The International Transport Forum (ITF). Decarbonising Maritime Transport Pathways to Zero-Carbon Shipping by 2035; OECD: Paris, France, 2018. [Google Scholar]
  3. Ash, N.; Scarbrough, T. Sailing on Solar—Could Green Ammonia Decarbonise International Shipping; Environmental Defense Fund Europe (EDF Europe): London, UK, 2019. [Google Scholar]
  4. Lewis, J. Fuels Without Carbon - Prospects and the Pathway Forward for Zero-Carbon Hydrogen and Ammonia Fuels; Clean Air Task Force: Boston, MA, USA, 2018. [Google Scholar]
  5. International Energy Agency (IEA). The Future of Hydrogen—Seizing Today’s Opportunities; International Energy Agency (IEA): Paris, France, 2019. [Google Scholar]
  6. Van Biert, L.; Godjevac, M.; Visser, K.; Aravind, P.V. A Review of Fuel Cell Systems for Maritime Applications. J. Power Sources 2016, 327, 345–364. [Google Scholar] [CrossRef] [Green Version]
  7. Valera-Medina, A.; Xiao, H.; Owen-Jones, M.; David, W.I.F.; Bowen, P.J. Ammonia for Power. Prog. Energy Combust. Sci. 2018, 69, 63–102. [Google Scholar] [CrossRef]
  8. Kobayashi, H.; Hayakawa, A.; Somarathne, K.D.; Kunkuma, A.; Okafor, E.C. Science and Technology of Ammonia Combustion. Proc. Combust. Inst. 2019, 37, 109–133. [Google Scholar] [CrossRef]
  9. NCE Maritime CleanTech. Norwegian Future Value Chains for Liquid Hydrogen; NCE Maritime CleanTech: Stord, Norway, 2019. [Google Scholar]
  10. International Maritime Organization (IMO). 2014 Guidelines on the Method of the Attained Energy Efficiency Design Index (EEDI) for New Ships; as Amended (MEPC.1/Circ.866); IMO: London, UK, 2017. [Google Scholar]
  11. Misra, S.C. Design Principles of Ships and Marine Structures, 1st ed.; CRC Press: Boca Raton, FL, USA, 2015; ISBN 9781482254464. [Google Scholar]
  12. Wright, A.A.; Wilson, T.S. Flashpoint of Marine Distillate Oil Fuels; Lloyd’s Register: London, UK, 2012. [Google Scholar]
  13. Muraki, S. R&D on Hydrogen Energy Carriers toward Low Carbon Society; Cross-ministerial Strategic Innovation Promotion Program (SIP): Tokyo, Japan, 2018.
  14. The Crown (Department for Transport). Clean Maritime Plan; The Crown: London, UK, 2019. [Google Scholar]
  15. Lloyd’s Register (LR) & University Maritime Advisory Services (UMAS). Zero-Emission Vessels 2030—How Do We Get There; LR: London, UK; UMAS: London, UK, 2017. [Google Scholar]
  16. De Vries, N. Safe and Effective Application of Ammonia as a Marine Fuel. Master’s Thesis, Delft University of Technology (TU Delft), Delft, The Netherlands, 2019. [Google Scholar]
  17. Shiozawa, B. CO2 Free Ammonia as CO2 Free Fuel and Hydrogen Carrier—Achievements of SIP “Energy Carriers”; Cross-Ministerial Strategic Innovation Promotion Program (SIP): Tokyo, Japan, 2019.
  18. Hellenic Shipping News. Sowing ZEEDS (Zero Emission Energy Distribution at Sea) of a New Era. Available online: https://www.hellenicshippingnews.com/sowing-zeeds-zero-emissioni-energy-distribution-at-sea-of-a-new-era/ (accessed on 13 August 2019).
  19. Global Maritime Forum. How Renewables Can Solve Shipping’s Need for Climate Friendly Fuel. Available online: https://www.globalmaritimeforum.org/news/how-renewables-can-solve-shippings-need-for-climate-friendly-fuel/ (accessed on 13 October 2019).
  20. NH3 Fuel Association. Introduction to NH3 Fuel. Available online: https://nh3fuelassociation.org/introduction/ (accessed on 31 October 2019).
  21. NH3 Fuel Association. The AmVeh—An Ammonia Fueled Car from South Korea. Available online: https://nh3fuelassociation.org/2013/06/20/the-amveh-an-ammonia-fueled-car-from-south-korea/ (accessed on 3 October 2019).
  22. NH3 Fuel Association. Ammonia Fueled Sports Car: Marangoni Toyota GT86 Eco Explorer. Available online: https://nh3fuelassociation.org/2013/04/25/ammonia-fuel-marangoni-eco-explorer/ (accessed on 28 September 2019).
  23. Ship Insight. Ammonia—Another New Fuel for the Future? Available online: https://shipinsight.com/articles/ammonia-another-new-fuel-for-the-future/ (accessed on 14 February 2020).
  24. The MotorShip. MAN Energy Solutions to Undertake Ammonia Study. Available online: https://www.motorship.com/news101/alternative-fuels/man-energy-solutions-to-undertake-ammonia-study (accessed on 19 September 2019).
  25. Alfa Laval. Press release. The Alfa Laval FCM LPG Booster System Excels with the New LPG-Fuelled Engine from MAN Energy Solutions; Alfa Laval: Lund, Sweden, 2019. [Google Scholar]
  26. Ammonia Energy Association. Maritime Ammonia Engines in Japan; Ammonia Shipbuilding in South Korea. Available online: https://www.ammoniaenergy.org/articles/maritime-ammonia-engines-in-japan-ammonia-shipbuilding-in-south-korea/ (accessed on 10 August 2019).
  27. The Maritime Executive. Offshore Vessel to Run on Ammonia-Powered Fuel Cell. Available online: https://www.maritime-executive.com/article/offshore-vessel-to-run-on-ammonia-powered-fuel-cell (accessed on 29 January 2020).
  28. Suda, T.; Uchida, M.; Ito, T.; Matsuo, T.; Fujimori, T. Technologies to Use Carbon Free Ammonia in Power Plant (IHI Corporation). In Proceedings of the Presented at NH3 Energy Implementation Conference, Pittsburgh, PA, USA, 1 November 2018. [Google Scholar]
  29. Hunter, H.M.A.; Makepeace, J.W.; Wood, T.J.; Mylius, O.S.; Kibble, M.G.; Nutter, J.B.; Jones, M.O.; David, W.I.F. Demonstrating Hydrogen Production from Ammonia Using Lithium Imide—Powering a Small Proton Exchange Membrane Fuel Cell. J. Power Sources 2016, 329, 138–147. [Google Scholar] [CrossRef]
  30. RenCat. Clean Hydrogen on Demand. Available online: https://www.rencat.net/ (accessed on 26 August 2019).
  31. Dolan, M. Delivering Clean Hydrogen Fuel from Ammonia Using Metal Membranes; The Commonwealth Scientific and Industrial Research Organization (CSIRO): Canberra, Australia, 1 November 2017.
  32. Olmer, N.; Comer, B.; Roy, B.; Mao, X.; Rutherford, D. Greenhouse Gas Emissions from Global Shipping, 2013–2015; ICCT (The International Council on Clean Transportation): Washington, DC, USA, 2017. [Google Scholar]
  33. MAN Diesel & Turbo. Costs and Benefits of LNG as Ship Fuel for Container Vessels; MAN Diesel & Turbo: Augsburg, Germany, 2012. [Google Scholar]
  34. MAN Energy Solutions. Propulsion of 2,200–3,000 TEU Container Vessels; MAN Energy Solutions: Augsburg, Germany, 2019. [Google Scholar]
  35. Damen Shipyards Group. CONTAINER FEEDER 2500—STANDARD; Damen Shipyards Group: Gorinchem, The Netherlands, 2017. [Google Scholar]
  36. Wärtsilä. WSD80 2400–2400 Teu Container Feeder; Wärtsilä: Helsinki, Finland, 2015. [Google Scholar]
  37. Comotti, M.; Frigo, S. Hydrogen Generation System for Ammonia–Hydrogen Fuelled Internal Combustion Engines. Int. J. Hydrog. Energy 2015, 40, 10673–10686. [Google Scholar] [CrossRef]
  38. Frigo, S.; Gentili, R. Analysis of the Behavior of a 4-Stroke Si Engine Fueled with Ammonia and Hydrogen. Int. J. Hydrog. Energy 2013, 38, 1607–1615. [Google Scholar] [CrossRef]
  39. Mørch, C.S.; Bjerre, A.; Gøttrup, M.P.; Sorenson, S.C.; Schramm, J. Ammonia/Hydrogen Mixtures in an SI-Engine: Engine Performance and Analysis of a Proposed Fuel System. Fuel 2011, 90, 854–864. [Google Scholar] [CrossRef]
  40. Frigo, S.; Gentili, R. A Hybrid Vehicle Powered by Ammonia and Hydrogen. In Proceedings of the 10th NH3 Fuel Conference, Sacramento, CA, USA, 22–25 September 2013. [Google Scholar]
  41. Pochet, M.; Truedsson, I.; Foucher, F.; Jeanmart, H.; Contino, F. Ammonia-Hydrogen Blends in Homogeneous-Charge Compression-Ignition. In Proceedings of the 13th International Conference on Engines & Vehicles, Capri, Italy, 10–14 September 2017. [Google Scholar] [CrossRef]
  42. Frigo, S.; Gentili, R.; Ricci, G.; Pozzana, G.; Comotti, M. Experimental Results Using Ammonia Plus Hydrogen in a S.I. Engine. In FISITA 2012 World Automotive Congress; Future Automotive Powertrains (I); Springer: Berlin/Heidelberg, Germany, 2013; Volume 3, pp. 65–76. [Google Scholar]
  43. Duynslaegher, C.; Jeanmart, H.; Vandooren, J. Use of Ammonia as a Fuel for SI Engine. In Proceedings of the European Combustion Meeting, Vienna, Austria, 14–17 April 2009. [Google Scholar]
  44. Hassan, S.Z.; Li, H.; Kamal, T.; Mumtaz, S.; Khan, L. Fuel Cell/Electrolyzer/Ultra-Capacitor Hybrid Power System: Focus on Integration, Power Control and Grid Synchronization. In Proceedings of the 13th International Bhurban Conference on Applied Sciences and Technology (IBCAST), Islamabad, Pakistan, 12–16 January 2016. [Google Scholar]
  45. Hyundai. All-New Hyundai NEXO—Technical Specifications. Available online: https://hyundai.news/eu/press-kits/all-new-hyundai-nexo-technical-specifications/ (accessed on 1 September 2019).
  46. Open Electrical. Battery Sizing. Available online: https://wiki.openelectrical.org/index.php?title=Battery_Sizing (accessed on 11 November 2019).
  47. Ogden, J. Review of Small Stationary Reformers for Hydrogen Production; International Energy Agency (IEA): Paris, France, 2002. [Google Scholar]
  48. Thomas, G.; Parks, G. Potential Roles of Ammonia in a Hydrogen Economy—A Study of Issues Related to the Use Ammonia for On-Board Vehicular Hydrogen Storage; U.S. Department of Energy: SW Washington, DC, USA, 2006.
  49. Giddey, S. Ammonia as a Renewable Energy Transportation Media. ACS Sustain. Chem. Eng. 2017, 10231–10239. [Google Scholar] [CrossRef]
  50. Kojima, Y.; Adachi, T. Ammonia As a Hydrogen Carrier for PEM Fuel Cells. In Proceedings of the 2018 AIChE Annual Meeting, Pittsburgh, PA, USA, 28 October–2 November 2018. [Google Scholar]
  51. Morgan, E.R. Techno-Economic Feasibility Study of Ammonia Plants Powered by Offshore Wind. Ph.D. Thesis, University of Massachusetts Amherst, Amherst, MA, USA, 2013. [Google Scholar]
  52. Raucci, C. The Potential of Hydrogen to Fuel International Shipping. Ph.D. Thesis, University College London (UCL), London, UK, 2017. [Google Scholar]
  53. Wiesmann, A. Slow Steaming—A Viable Long-Term Option? Wärtsilä: Helsinki, Finland, 2010. [Google Scholar]
  54. Brake, M.C.T.; Kauffman, K.F.; Hulskotte, J. Sea Shipping Emissions 2017: Netherlands Continental Shelf, 12 Mile Zone and Port Areas; Maritime Research Institute Netherlands (MARIN): Wageningen, The Netherlands, 2019. [Google Scholar]
  55. PowerCell. Datasheet. PowerCell MS100 (50–100 kW PEM Fuel Cell System Prototype); PowerCell: Gothenburg, Sweden, 2018. [Google Scholar]
  56. Siemens. SINAVY PEM Fuel Cells––For Submarines (VRMS-B10018-00-7600); Siemens: Munich, Germany, 2016. [Google Scholar]
  57. Adam, A.; Fraga, E.S.; Brett, D.J.L. Options for Residential Building Services Design Using Fuel Cell Based Micro-CHP and the Potential for Heat Integration. Appl. Energy 2015, 138, 685–694. [Google Scholar] [CrossRef]
  58. Grzesiak, S. Alternative Propulsion Plants for Modern LNG Carriers. New Trends Prod. Eng. 2018, 1, 399–407. [Google Scholar] [CrossRef] [Green Version]
  59. Wärtsilä. Wärtsilä Generating Sets. Available online: https://www.wartsila.com/marine/build/engines-and-generating-sets/generating-sets/wartsila-gensets (accessed on 30 September 2019).
  60. Energy, B. Energy Server 5—Technical Highlights (ES5-YA8AAN); Bloom Energy: San Jose, CA, USA, 2019. [Google Scholar]
  61. Fraunhofer Institute. High Power SiC DC/DC Converters. Available online: https://www.iisb.fraunhofer.de/en/press_media/brochures_flyers.html (accessed on 11 October 2019).
  62. Dynapower. DPS-500—500 kW DC-to-DC Converter. Available online: https://www.dynapower.com/products/energy-storage-solutions/dc-coupled-utility-scale-solar-plus-storage/dps-500/ (accessed on 26 September 2019).
  63. MAN. Diesel-Electric Propulsion Plants—A Brief Guideline How to Engineer a Diesel-Electric Propulsion System; MAN: Munich, Germany, 2012. [Google Scholar]
  64. GE Power Conversion. MV6 Medium Voltage Drive—Leading next Generation Technology; GE Power Conversion: Paris, France, 2017. [Google Scholar]
  65. Yaskawa Electric Corp. YASKAWA Marine Drive System; Yaskawa Electric Corp.: Fukuoka, Japan, 2019. [Google Scholar]
  66. Solar Power World. What are the Most Important Features to Look for in a String Inverter? Available online: https://www.cconline.com/2019/08/most-important-features-of-string-inverters/ (accessed on 11 October 2019).
  67. Soares, C.G.; Santos, T.A. Proceedings of MARTECH 2014, 2nd International Conference on Maritime Technology and Engineering. In Maritime Technology and Engineering; CRC Press/Balkema: Leiden, The Netherlands, 2015. [Google Scholar]
  68. DNV GL. DNV GL Updates NOx Tier III Compliance Guide—Choices and Challenges for on-Time Compliance; DNV GL: Oslo, Norway, 2017. [Google Scholar]
  69. Man Energy Solutions. Marine Engine Programme, 2nd ed.; Man Energy Solutions: Augsburg, Germany, 2019. [Google Scholar]
  70. Hydrogenics. Specification Sheet. In Hypm-HD 180 Power Module; Hydrogenics: Ontario, ON, Canada, 2016. [Google Scholar]
  71. Ballard Power Systems. Technical Brochure. In FCvelocity HD; Ballard Power Systems: Burnaby, BC, Canada, 2016. [Google Scholar]
  72. Mitsubishi Heavy Industries, Ltd. Cogeneration. In Proceedings of the Singapore Energy Efficiency Symposium, Singapore, 15–16 October 2019. [Google Scholar]
  73. Kobayashi, Y.; Tomida, K.; Nishiura, M.; Hiwatashi, K.; Kishizawa, H.; Takenobu, K. Development of Next-Generation Large-Scale SOFC toward Realization of a Hydrogen Society. Mitsubishi Heavy Ind. Tech. Rev. 2015, 52, 111–116. [Google Scholar]
  74. Minnehan, J.J.; Pratt, J.W. Practical Application Limits of Fuel Cells and Batteries for Zero Emission Vessels; SAND-2017-12665; Sandia National Laboratories: Livermore, CA, USA, 2017.
  75. Koyo Thermo Systems Co., Ltd. Ammonia Cracker for the Generation of Forming Gas. Available online: https://www.crystec.com/kllhyame.htm (accessed on 6 October 2019).
  76. ABB. Product Brochure. ABB Central Inverters—PVS800, 100 to 1000 kW; ABB: Zurich, Switzerland, 2014. [Google Scholar]
  77. ABB. Product Brochure. Solar Inverters—ABB Medium Voltage Compact Skid (PVS-175-MVCS); ABB: Zurich, Switzerland, 2019. [Google Scholar]
  78. ABB. Product Brochure. Medium Voltage AC Drive ACS 5000, 1.5 MW–36 MW, 6.0–6.9 kV; ABB: Zurich, Switzerland, 2013. [Google Scholar]
  79. Brochure, H.E.T. Induction Motors Medium & High Voltage; Hyundai Electric: Seongnam-si, Korea, 2019. [Google Scholar]
  80. Shu, S. A Life Cycle Cost Analysis of Marine Scrubber Technologies. Master’s Thesis, University of Rostock, Rostock, Germany, 2013. [Google Scholar]
  81. Uniteam. Specification Sheet. In 20ft ISO Container Specification; Uniteam: Torslanda, Sweden, 2014. [Google Scholar]
  82. Box. Shipping Containers–20ft Storage Containers for Sale and Hire. Available online: https://www.mrbox.co.uk/shipping-containers/20ft-storage-containers-for-sale-and-hire/ (accessed on 1 October 2019).
  83. Frontier economics. Reducing the UK Maritime Sector’s Contribution to Climate Change and Air Pollution; Frontier Economics: London, UK, 2019. [Google Scholar]
  84. Myhre, G.; Shindell, D.; Bréon, F.-M.; Collins, W.; Fuglestvedt, J.; Huang, J.; Koch, D.; Lamarque, J.-F.; Lee, D.; Mendoza, B.; et al. Chapter 8–Anthropogenic and Natural Radiative Forcing. In 5th Assessment Report (AR5); Intergovernmental Panel for Climate Change (IPCC): Geneva, Switzerland, 2014. [Google Scholar]
  85. Judd, S. Watermaths: Process Fundamentals for the Design and Operation of Water and Wastewater Treatment Technologies; IWA Publishing: London, UK, 2019; p. 85. [Google Scholar]
  86. Saito, N. The Economic Analysis of Commercial Ships with Hydrogen Fuel Cell through Case Studies; World Maritime University: Malmȍ, Sweden, 2018. [Google Scholar]
  87. International Renewable Energy Agency (IRENA). Hydrogen from Renewable Power: Technology Outlook for the Energy Transition; IRENA: Abu Dhabi, UAE, 2018. [Google Scholar]
  88. Thomas, D. Cost Reduction Potential for Electrolyser Technology; Hydrogenics: Mississauga, ON, Canada, 2018. [Google Scholar]
  89. Can, S.S.; Difiglio, C.; Esmaeili, D.; Gülgün, M.A.; Öncel, Ç.; Yesilyurt, S. IICEC Energy and Climate Research Paper. In Using Natural Gas as an Environmentally Sustainable Power Source with Solid Oxide Fuel Cells; Sabanci University Istanbul International Center for Energy and Climate (IICEC): Istanbul, Turkey, 2018. [Google Scholar]
  90. DNV GL KEMA. Battery Energy Storage Study for the 2017 IRP (PacifiCorp); DNV GL KEMA: Arnhem, The Netherlands, 2016. [Google Scholar]
  91. Schroeder, R.; Francesco Gattiglio. E-Mobility Battery R&D Roadmap 2030—Battery Technology for Vehicle Applications; EUROBAT (Association of European Automotive and Industrial Battery Manufacturers): Brussels, Belgium, 2015. [Google Scholar]
  92. Energy Storage News. BloombergNEF: Bullish on Cost Reductions, in Line with Others on Global Battery Market Forecast. Available online: https://www.energy-storage.news/news/bloombergnef-bullish-on-cost-reductions-in-line-with-others-on-global-batte (accessed on 18 September 2019).
  93. Ship & Bunker. World Bunker Prices—Global 20 Ports Average. Available online: https://shipandbunker.com/prices/apac/sea/sg-sin-singapore (accessed on 20 December 2019).
  94. California Air Resources Board (CARB). Technology Assessment: Ocean-Going Vessels; CARB: Sacramento, CA, USA, 2018.
  95. TNO (Netherlands Organization for Applied Scientific Research). PROMINENT project. In D2.8/D2.9 Standardized Model and Cost/Benefit Assessment for Right-Size Engines and Hybrid Configurations; European Commission: Brussels, Belgium, 2018. [Google Scholar]
  96. Small Business Innovation Research (SBIR). 2kW Solid Oxide Fuel Cell (SOFC) Power System. Available online: https://www.sbir.gov/sbirsearch/detail/1605929 (accessed on 1 December 2019).
  97. Heinzmann, J. GE (General Electric) Energy Storage. In Proceedings of the Solar Power International, Las Vegas, NV, USA, 13–15 September 2016. [Google Scholar]
  98. Aquino, T.; Roling, M.; Baker, C.; Rowland, L. Battery Energy Storage Technology Assessment; Platte River Power Authority: Fort Collins, CO, USA, 2017. [Google Scholar]
  99. Viswanathan, V.; Kintner-Meyer, M.; Balducci, P.; Jin, C. National Assessment of Energy Storage for Grid Balancing and Arbitrage Phase II—Volume 2: Cost and Performance Characterization; Pacific Northwest National Laboratory (PNNL): Richland, WA, USA, 2013.
  100. Interreg Europe. Danube Transnational Program—Grendel. FACT SHEET N°2—Diesel-Electric Propulsion; Interreg Europe: Lille, France, 2019. [Google Scholar]
  101. CERAM & H+H Umwelt and Industrietechnik GmbH. SCR for Marine Applications; CERAM: Frauental, Austria; H+H Umwelt and Industrietechnik GmbH: Hargesheim, Germany, 2007. [Google Scholar]
  102. Vms. Ge Diesel Engines. Available online: https://vms.dk/products/ge-diesel-engines/ (accessed on 1 December 2019).
  103. MPC Container Ships. Scrubber Initiative and Waiver Request Investor Presentation; MPC Container Ships: Oslo, Norway, 2019. [Google Scholar]
  104. Den Boer, E.; Hoen, M. Scrubbers—An Economic and Ecological Assessment; CE Delft: Delft, The Netherlands, 2015. [Google Scholar]
  105. Karimpour, R. Scrubber; Is it the Option to Meet the Shipping Fuel Sulphur Cap on 2020? Available online: https://www.onthemosway.eu/18823-2/?cn-reloaded=1 (accessed on 19 November 2019).
  106. The Maritime Executive. With Ammonia, There’s No “Chicken or Egg” Dilemma. Available online: https://www.maritime-executive.com/article/with-ammonia-there-s-no-chicken-or-egg-dilemma (accessed on 15 February 2020).
Figure 1. Typical layout of a 2500 (Twenty-foot Equivalent Unit) TEU container feeder ship.
Jmse 08 00183 g001
Figure 2. The simplified concept system for Case 1.
Jmse 08 00183 g002
Figure 3. The simplified concept system for Case 2.
Jmse 08 00183 g003
Figure 4. The simplified concept system for Case 3.
Jmse 08 00183 g004
Figure 5. The simplified concept system for Case 4.
Jmse 08 00183 g005
Figure 6. The simplified concept system for Case 5.
Jmse 08 00183 g006
Figure 7. Total volume comparison of each case.
Jmse 08 00183 g007
Figure 8. Total weight comparison of each case.
Jmse 08 00183 g008
Figure 9. Total GHG emissions for each case focused on upstream and operational emissions.
Jmse 08 00183 g009
Figure 10. Total GHG emissions for each case focused on main emission types.
Jmse 08 00183 g010
Figure 11. Cumulative cost for Cases 1–5 (NH3 price = $ 830/t).
Jmse 08 00183 g011
Figure 12. Division of the cumulative cost for Cases 1–5 (NH3 price = $ 830/t).
Jmse 08 00183 g012
Table 1. Fuel properties of heavy fuel oil (HFO), hydrogen, and ammonia.
Fuel PropertyUnitHFOCompressed Hydrogen (350 bar)Liquid HydrogenLiquid AmmoniaReference
Low heating valueMJ/kg
(kWh/kg)
40.2
(11.17)
120.00
(33.33)
120.00
(33.33)
18.6
(5.17)
[7,8,9,10]
Volumetric energy densityMJ/m3
(kWh/m3)
39,564–42,036
(10,990–11,677)
5040
(1400)
8500
(2361)
14,100
(3917)
[5,9,11]
Min. auto-ignition temperature°C250500–577500–577650–657[7,8,12]
Boiling temperature at 1atm°CN/AN/A−253−33.4[8,9]
Condensation pressure at 25 °CatmN/AN/AN/A9.90[8]
Hydrogen content% by massN/A100.0100.017.8[7,8]
Table 2. General specifications of the target ship.
CategorySpecification
Length overall (LOA)195 m
Breadth32 m
Deadweight30,000 t
Container capacity2500 TEU (reefer: 500 TEU)
Ship speedMax. 19.0 knots
M/E power output (MCR)1 × 13,500 kW
Diesel gensets (MCR)3 × 1500 kW
FuelHFO
Tank capacity1800 m3
Main voltageAC 440V
Table 3. Assumed load profile and time spent in one year.
Propulsion Load Factor (%)Propulsion Power (kW)Electric Service Load (kW)Reefer Container Load (kW)Time Spent per Year (Hour)
10013,500780875336
8511,4757808752016
6587757808753024
506750780875336
354725780875336
253375780875336
101350780875236
56751800875100
0-5508752040
Table 4. Assumed ammonia–hydrogen mixture for spark ignition (SI) engine.
FuelEnergy DensityWeight RatioEnergy Ratio
NH318.6 MJ/kg (5.17 kWh/kg)95%74.7%
H2120.0 MJ/kg (33.33 kWh/kg)5%25.3%
Table 5. The system efficiency (η) according to each case.
Case 1 & 2Case 3Case 4Case 5
Equipmentη (%)Ref.Equipmentη (%)Ref.Equipmentη (%)Ref.Equipmentη (%)Ref.
M/E0.52[52,58]Genset0.50[59]Cracker0.80[49,50]SOFC0.65[60]
Shafting0.99[58]Alternator0.98[58]H2 purifier0.90[50]Converter0.98[61,62]
Genset0.50[59]Switchboard0.98[63]PEMFC 20.65[55,56]Switchboard0.98[63]
Alternator0.98[58]VFD 10.97[64,65]Converter0.98[61,62]Inverter0.98[66]
Switchboard0.98[63]Prop. motor0.98[58]Switchboard0.98[63]VFD 10.97[64,65]
------Inverter0.98[66]Prop. motor0.98[58]
------VFD 10.97[64,65]---
------Prop. motor0.98[58]---
ηprop30.51-ηprop30.46-ηprop30.43-ηprop30.59-
ηservice40.48-ηservice40.48-ηservice40.44-ηservice40.61-
1 VFD: Variable Frequency Drive (also known as motor drive). 2 The average value of the peak efficiency on the references. FCM 120 model is applied in the case of reference [56]. 3 The total efficiency of the propulsion system. 4 The total efficiency of the ship service power system.
Table 6. Assumed correction factors (Lf) according to different load factors.
Load Factor (i) (%)Main Engine/GensetPEMFCSOFC
85 < i ≤ 1001.021.251.14
65 < i ≤ 851.001.191.09
50 < i ≤ 651.011.121.06
35 < i ≤ 501.041.071.04
25 < i ≤ 351.091.031.00
10 < i ≤ 251.131.001.06
i ≤ 101.211.671.43
Table 7. Total weight and volume of fuel consumption for each case.
ItemCase 1 (HFO)Case 2 (NH3)Case 3 (NH3)Case 4 (NH3)Case 5 (NH3)
Total weight of fuel consumption (t/y)13,507.0
(1.00 base)
25,505.7
(1.89 times)
28,083.4
(2.08 times)
33,889.0
(2.51 times)
22,447.3
(1.66 times)
Total volume of fuel consumption (m3/y)14,289.0
(1.00 base)
33,645.8
(2.35 times)
37,046.1
(2.59 times)
44,704.6
(3.13 times)
29,611.4
(2.07 times)
Table 8. Assumed volume and weight for each equipment.
EquipmentCapacityVolume (m3)Weight (t)Reference
Main Engine13.5 MW370.7394.0[69]
Genset1.5 MW35.920.8[59]
6.0 MW145.3115.0[59]
PEMFC 16.0 MW50.9 219.5[70,71]
SOFC 16.0 MW874.9 2271.5[60,72,73]
ESS 3300 kWh4.24.0[74]
550 kWh7.77.4[74]
1600 kWh33.3 221.4[74]
Cracker 4 (Case 2,3)-6.33.0[75]
Cracker 4 (Case 4)-19.58.0[75]
DC/AC converter300 kW2.71.1[76]
DC/DC converter (ESS)600 kW4.01.8[76]
1600 kW10.74.8[62]
DC/DC converter (F/C)6.0 MW30.614.0[77]
VFD7.0 MW30.98.0[78]
Propulsion Motor6.7 MW28.017.8[79]
SCR 518 MW90.017.0[80]
Scrubber18 MW150.033.0[80]
1 Assumed value based on references. Excluding auxiliary equipment (balance of plant) from the package system. 2 Assumed value based on references. A space margin of 50% is included for the separation distance between each pack, in view of the possibilities of an optimal layout design for large scale applications. This can be changeable depending on the safety requirements and location environment. 3 Excluding the inverter/converter. 4 Assumed value based on reference due to the lack of suitable manufacturer’s data for the capacity. 5 Including reactor and catalyst.
Table 9. Greenhouse gas (GHG) emission factors for each fuel type.
Fuel CO2 t/t FuelCH4 t/t FuelN2O t/t Fuel
UpstreamOperationUpstreamOperationUpstreamOperation
HFO0.3383.1140.00320.0001-0.00016
NH3 (SMR+CCS)0.231---0.00001-
NH3 (electrolysis)0.168---0.00001-
Table 10. Lifetime and cost expectations for fuel cells and Li-ion batteries.
ItemExpected LifetimeIncreasing Rate of Lifetime for each ReplacementDecreasing Rate of Cost for each Replacement
PEMFC6 year [86]25% [87,88]42% [87,88]
SOFC5 year [89]25% [87,88]42% [87,88]
Li-ion battery10–12 year 1,2 [90]30% 2 [91]45% [92]
1 12 years for Cases 2–4 in which batteries are used for only cold start-ups, and 10 years for Case 5 in which batteries are used for dynamic load change. 2 Assumed value based on a reference.
Table 11. Assumed equipment cost and operation and maintenance (O&M) cost for main equipment.
EquipmentCAPEXOPEX
Equipment CostReferenceO&M CostReference
M/E (HFO)$ 300/kW[94]$ 5.2/kW/y[95]
Genset (HFO)$ 350/kW[95]$ 5.2//kW/y[95]
M/E (NH3)$ 500/kW 1-$ 5.2/kW/y 2-
Genset (NH3)$ 550/kW 1-$ 5.2/kW/y 2-
PEMFC$ 1000/kW[14]1% of CAPEX[88]
SOFC$ 5500/kW[96]1% of CAPEX 2-
Li-ion Battery$ 500/kW 2-$ 0.5/kW/y[97]
Cracker (Engine) 3$ 670,000[14]1% of CAPEX[14]
Cracker (PEMFC) 3$ 2,690,000[14]1% of CAPEX[14]
Converter$ 200/kW[98]$ 2/kW/y[99]
VFD$ 200/kW[98]$ 2/kW/y[99]
Propulsion Motor$ 135/kW[100]1% of CAPEX[14]
SCR$ 44/kW[14,101]3% of CAPEX[102]
Scrubber$ 3,400,000[103,104]2% of CAPEX[105]
1 Assumed value including the additional cost for the NH3 engine (non-corrosive material, special fuel system, etc.). 2 Assumed value based on manufacturers’ opinions. 3 Including burner and purifier.
Table 12. Different cumulative cost for Cases 1–5, depending on the NH3 price.
NH3 PriceCumulative Cost Comparison for Ship’s Life Time
Case 1
(Base)
Case 2
(Times)
Case 3
(Times)
Case 4
(Times)
Case 5
(Times)
$ 830/t1.03.53.95.05.2
$ 730/t1.03.13.54.54.8
$ 630/t1.02.73.03.94.5
$ 530/t1.02.32.63.44.1
$ 405/t1.01.82.02.73.6

