Abstract
As a key parameter, icebreaking capability is often used to judge whether a polar ship could navigate in level ice at a certain speed. This paper presents two methods to calculate icebreaking capability. The first one is a static method based on the estimation of ice resistance under different ice thicknesses and ship speeds. The second is a dynamic method that involves solving the equation of motion. A series of model tests with a double-acting icebreaking tanker were also carried out in the ice basin of the Krylov State Research Center to measure ice resistances. The simulated ice resistances were compared with model tests results for both ahead and astern running operations. The calculated icebreaking capability based on static and dynamic methods was validated with the model test result. A good agreement was achieved between measurement and simulation. The discrepancy between the model test result and the result simulated by the static or dynamic method was minor.
1. Introduction
For safe operation, ship performance in ice should be taken into account seriously. The ability of a polar ship to break ice is measured in uniform ice conditions by the speed that the ship can attain in ice of a certain thickness []. The speed that the ship can attain in ice is determined by the propeller thrust available to overcome the ice resistance. It is thus clear that the performance in ice is influenced by the resisting forces and the propulsive forces, which can be improved (resisting forces minimized and propulsive forces maximized) by the hull shape and propulsion design, respectively.
It is important to make a reasonable prediction of ice loads on a polar ship. Many researchers have calculated ice loads numerically with the ice resistance formula [,,] or numerical simulations [,,,,,,,]. However, the icebreaking capability for a polar ship has been seldom studied. Su [] used a circumferential crack method to calculate the icebreaking capability of icebreaker Tor Viking II and compared the simulated result with full-scale data.
Zhou et al. [] proposed a squared ice grid method to calculate dynamic ice forces. The ice grid could be taken as a simple static finite element. It would fail against the structure when a certain failure criterion was met. Similarly to the method developed by Su et al. [], it is difficult to choose the speed-dependent icebreaking length coefficient and the bending capacity coefficient, which should be taken from model tests or full-scale trials. In the present paper, we proposed a formula to calculate the two coefficients, which are functions of ice thickness and relative velocity of ice and structure, based on which the ice resistance is calculated. The simulated ice resistances were then compared with the model test data.
2. Mathematical Model
There are two methods which could be applied to estimate icebreaking capability for a polar ship. The first method, the static method, considers the static balance between the ice resistance and available thrust from prolusion system of the polar ship. The second method, the dynamic method, obtains the steady speed of the polar ship under the available thrust in level ice by solving the equation of motion. The principles of two methods are described in the following section.
2.1. Static Method
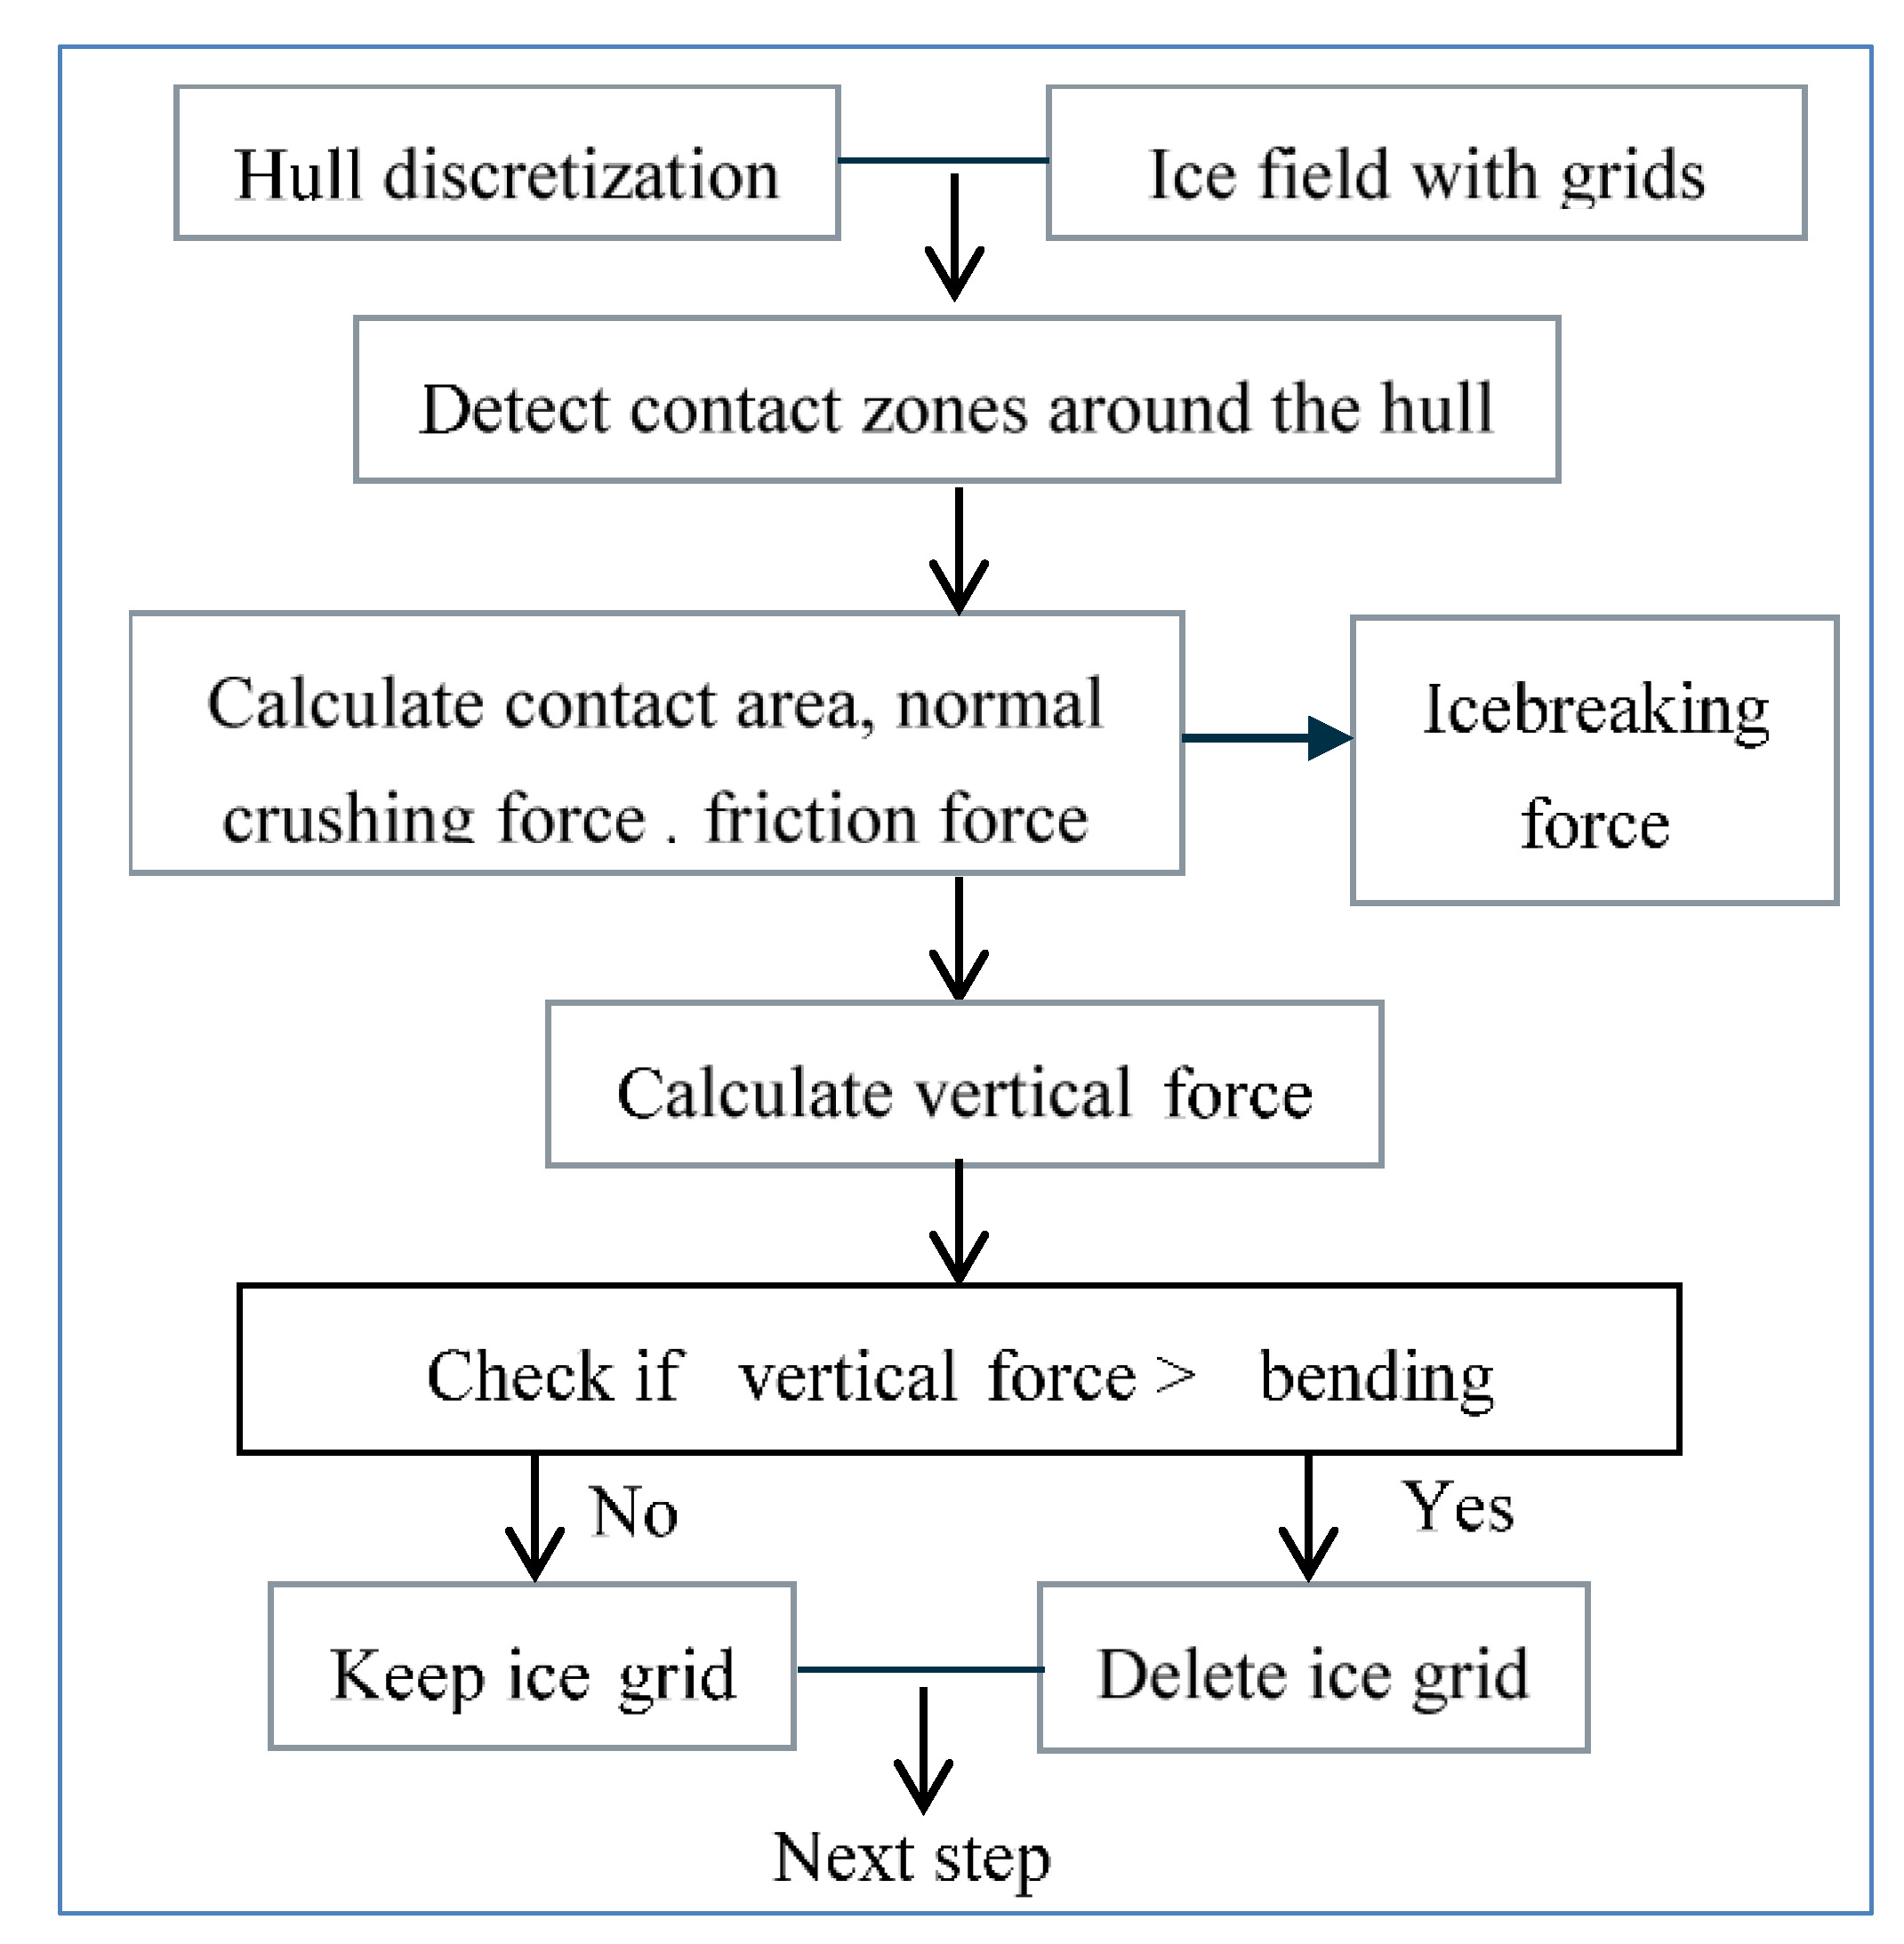
Using the static method, we need to evaluate the ice resistance of polar ship and available thrust under certain ice conditions. A method was developed to calculate ice resistance by Zhou et al. [], which was used in the present study. The ice force consists of the icebreaking force and the ice submersion force. The icebreaking is mainly due to the local ice crushing force during individual bending failure of an ice wedge. To calculate the icebreaking force, the hull was discretized into many nodes at the waterline (as shown in Figure 1).
Figure 1.
Discretization of the waterline.
The icebreaking force occurs when ice collides with the hull. The local icebreaking force on each hull node was estimated at each time step. The detailed information on the calculation of local ice force Fbi was previously described by Zhou et al. []. The total icebreaking force were calculated as the sum of all local forces Fbi on each panel or hull node on the waterline at a certain time instance:
The loop of calculating the icebreaking force in the time domain is presented in Figure 2. The ice submersion force occurs when the broken ice floe fragmented from intact ice pile around the hull underwater. When a ship moves forward against the ice, the ice breaks at the bow area and the broken ice floe becomes submerged and slides along the hull. There were almost no ice floes sliding at the bottom of the ship model, and most of the ice floes moved laterally beneath the bordering ice sheet at the low drift speed range []. Based on the ice resistance formula described by Lindqvist [], the speed dependence of ice submersion resistance due to the loss of potential energy of the submerged ice floes and friction between the hull and ice floes was written as
Figure 2.
Calculation loop of the icebreaking force.
In early design, the net thrust was estimated by Juva and Riska [] as the following ice rule:
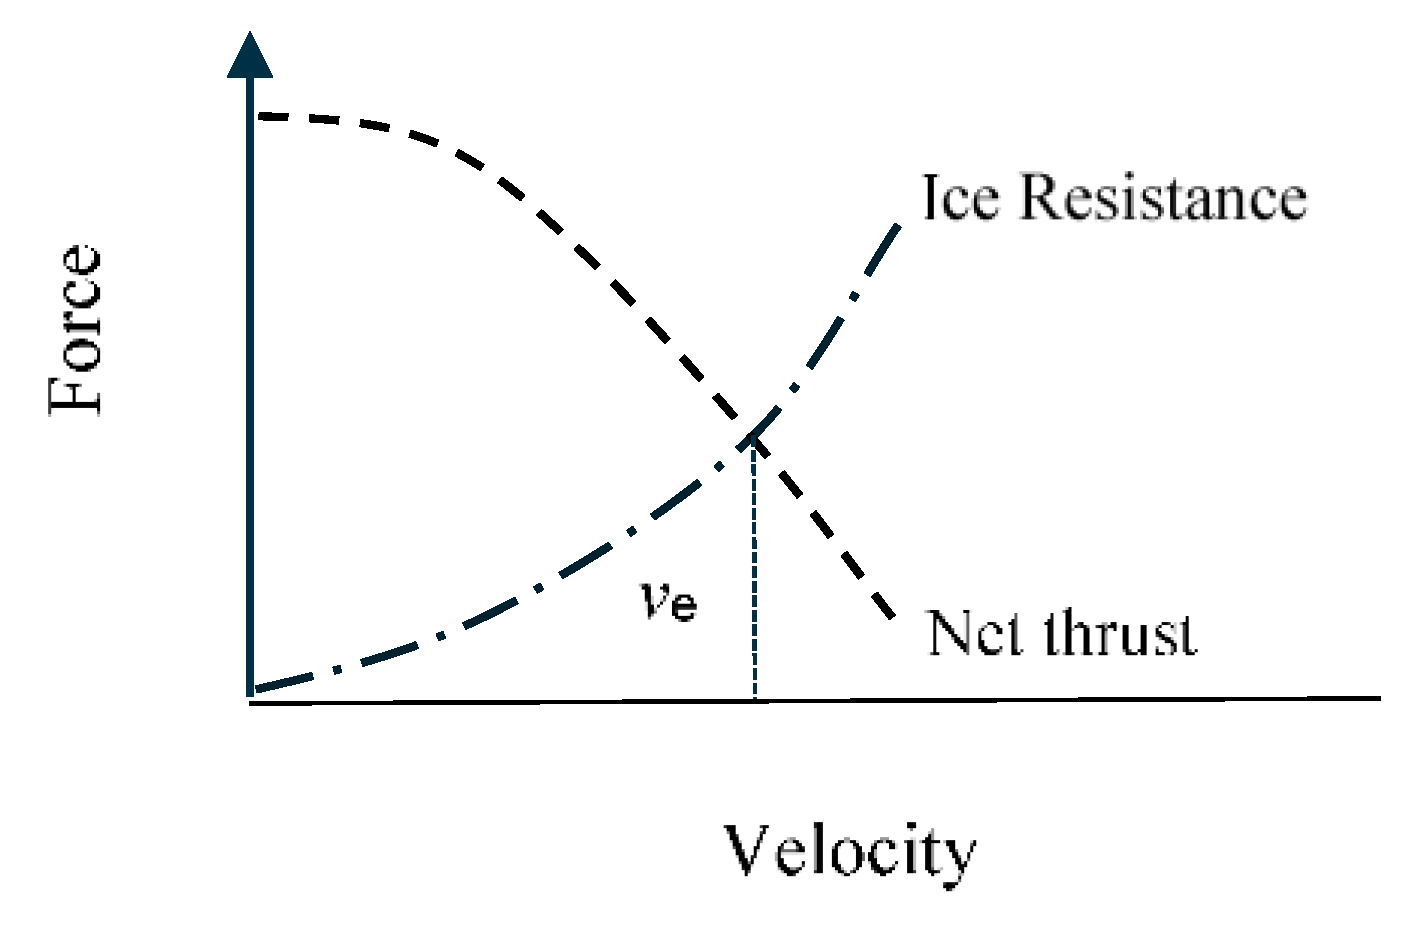
Figure 3 shows two typical curves of ice resistance and net thrust as a factor of ship speed with a certain ice thickness. The intersection of the two curves was taken as the expected steady speed ve of the ship. By changing the ice thickness, the h–v curve could be calculated.
Figure 3.
Illustration of the ice resistance and net thrust.
2.2. Dynamic Method
The dynamic method is based on solving the equation of motion including both the net thrust and ice resistance at each time step. The steady speed could be achieved when the net thrust and ice resistance came to a balance. According to Newton’s second law, the linear coupled differential equations of motion in the body-fixed coordinate could be written in the following form:
The Runge–Kutta method was used to solve the resulting equations of motion.
3. Model Tests in the Ice Basin
The model tests were carried out in the ice basin of the Krylov State Research Center (KSRC). The length of the tank is 45 m including the trimming area (as shown in Figure 4). The width and depth are 6 and 1.75 m respectively. The refrigeration system ensures uniform cooling of air over the tank down to −29 °C. The towing carriage could move by the rails running along both sides of the tank at a speed of 0.0005~1 m/s. This carriage possesses a number of openings serving to spray sea water uniformly over the test tank to generate the model ice. Usually, it takes two days to generate an ice sheet. The ice thickness ranges from 10 to 80 mm with an error less than ±1.5 mm. The bending strength of the model ice is 10~70 kPa with relative error of no more than ±20%.
Figure 4.
Ice tank of the Krylov State Research Center (KSRC).
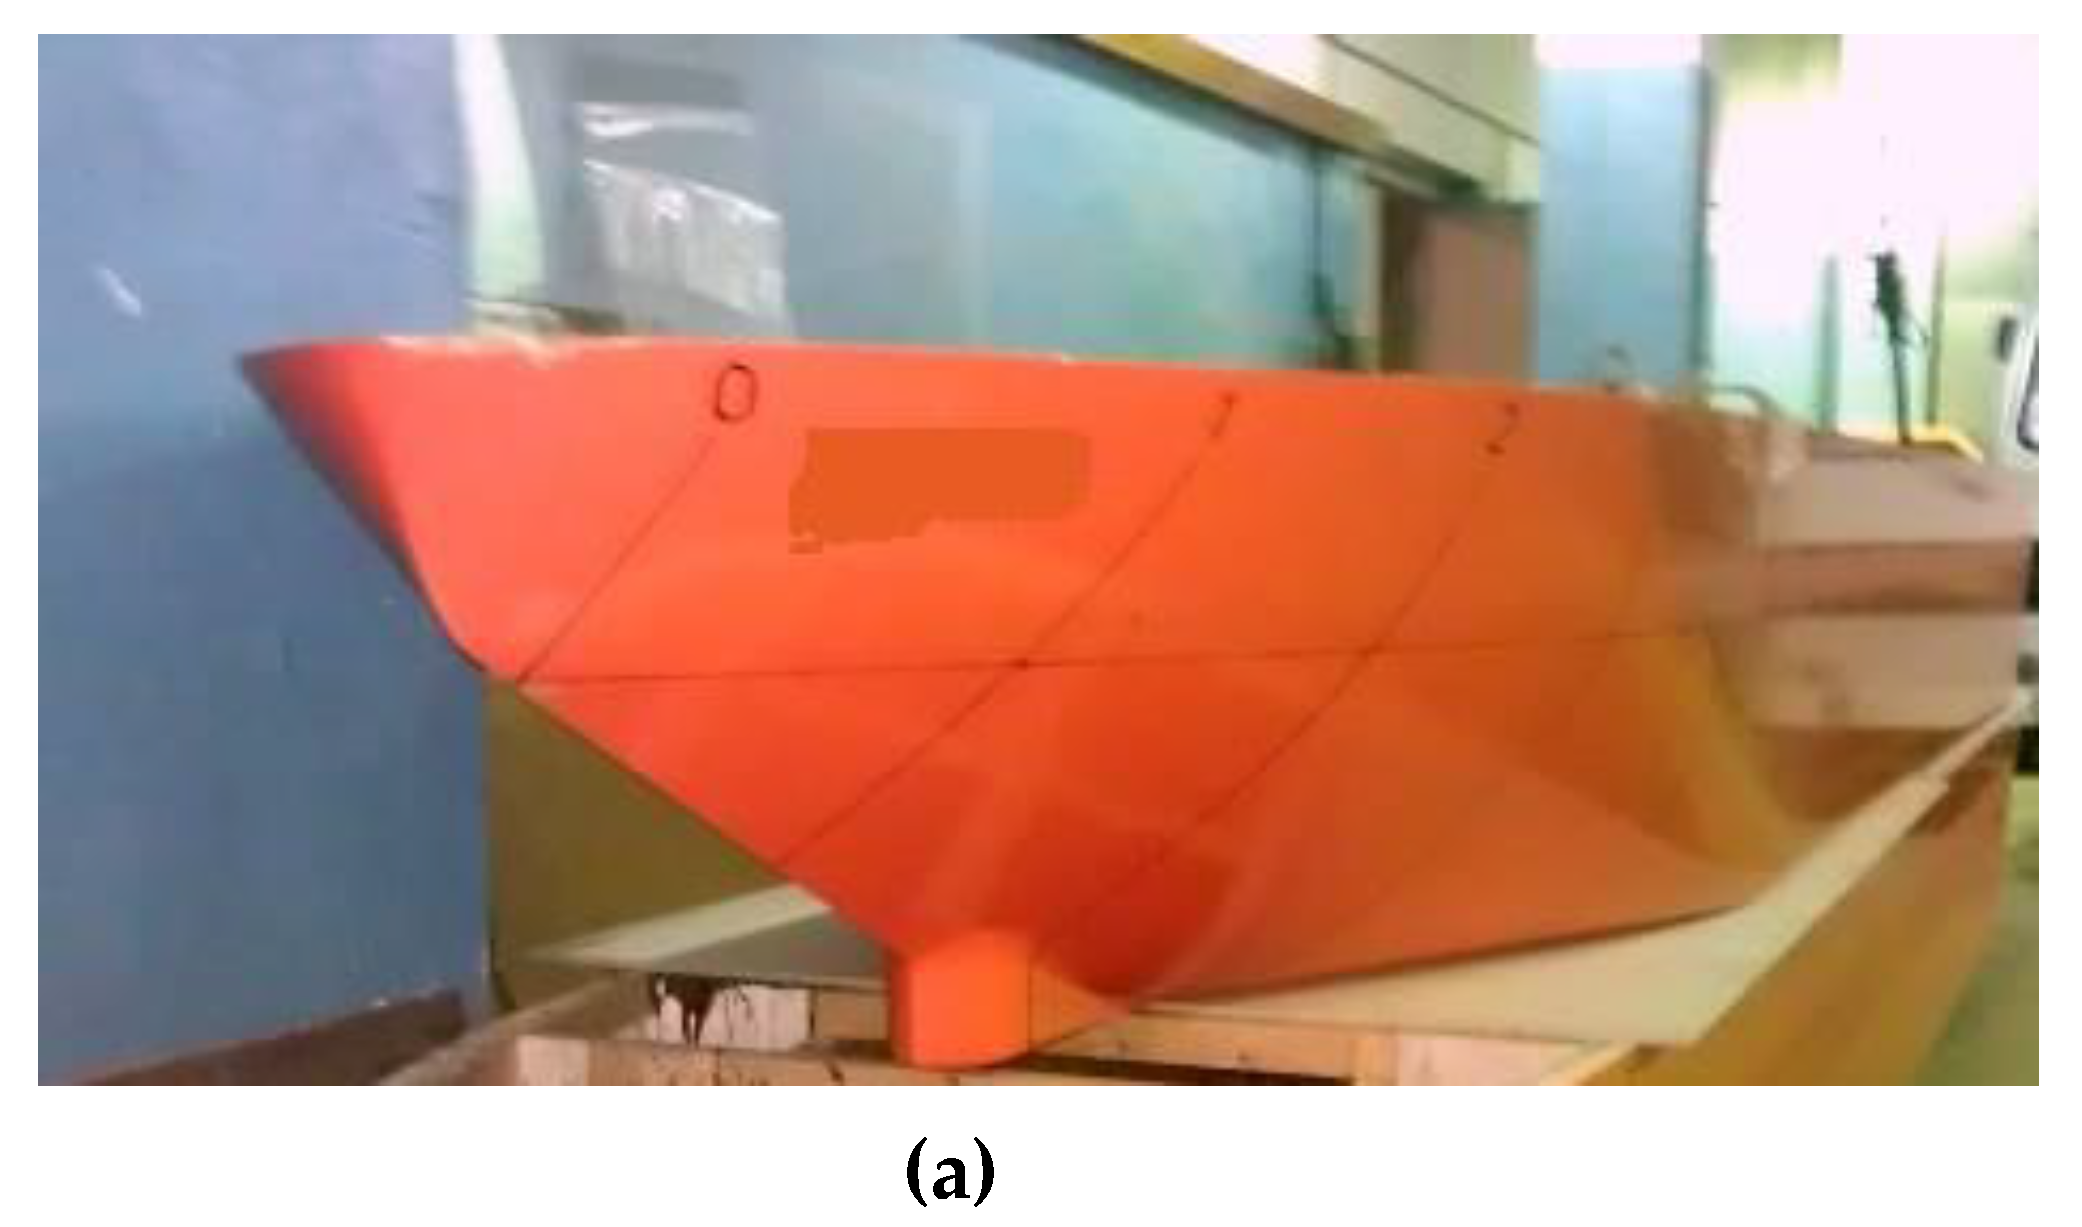
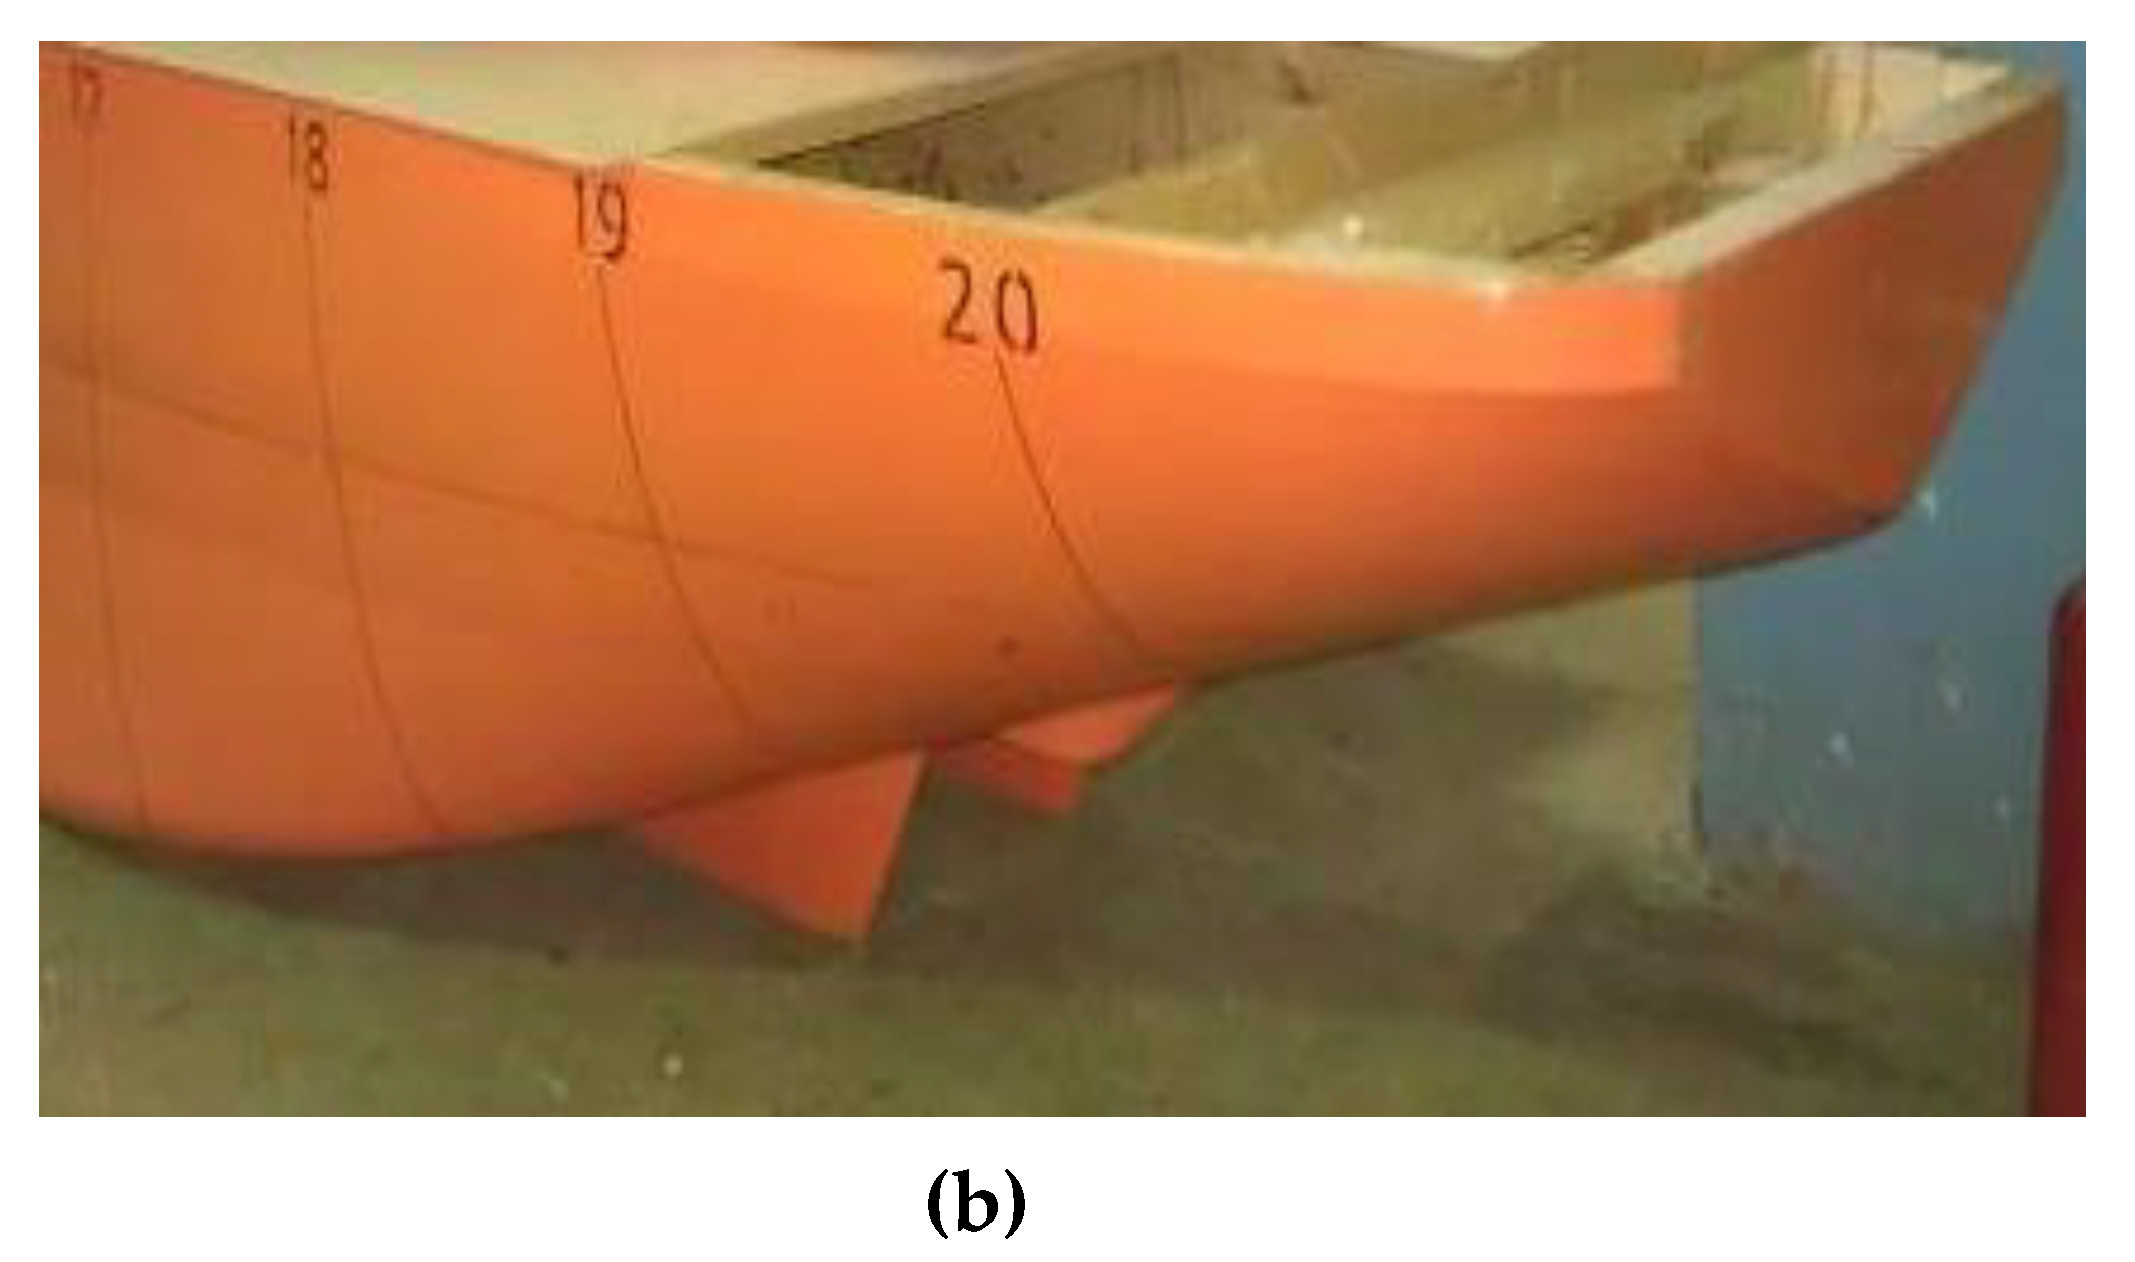
An artic tanker model with PC4 ice class was used in the model test. The dimensions of the tanker were reduced to the model scale with a geometric scale factor of λ = 42.5. The particulars of the full-scale vessel in the design draft are given in Table 1. Figure 5 presents the bow and stern of the ship model used for the tests.
Table 1.
Main parameters of the arctic tanker.

Figure 5.
Photographs of the ship model. (a) Bow view (b) Stern view.
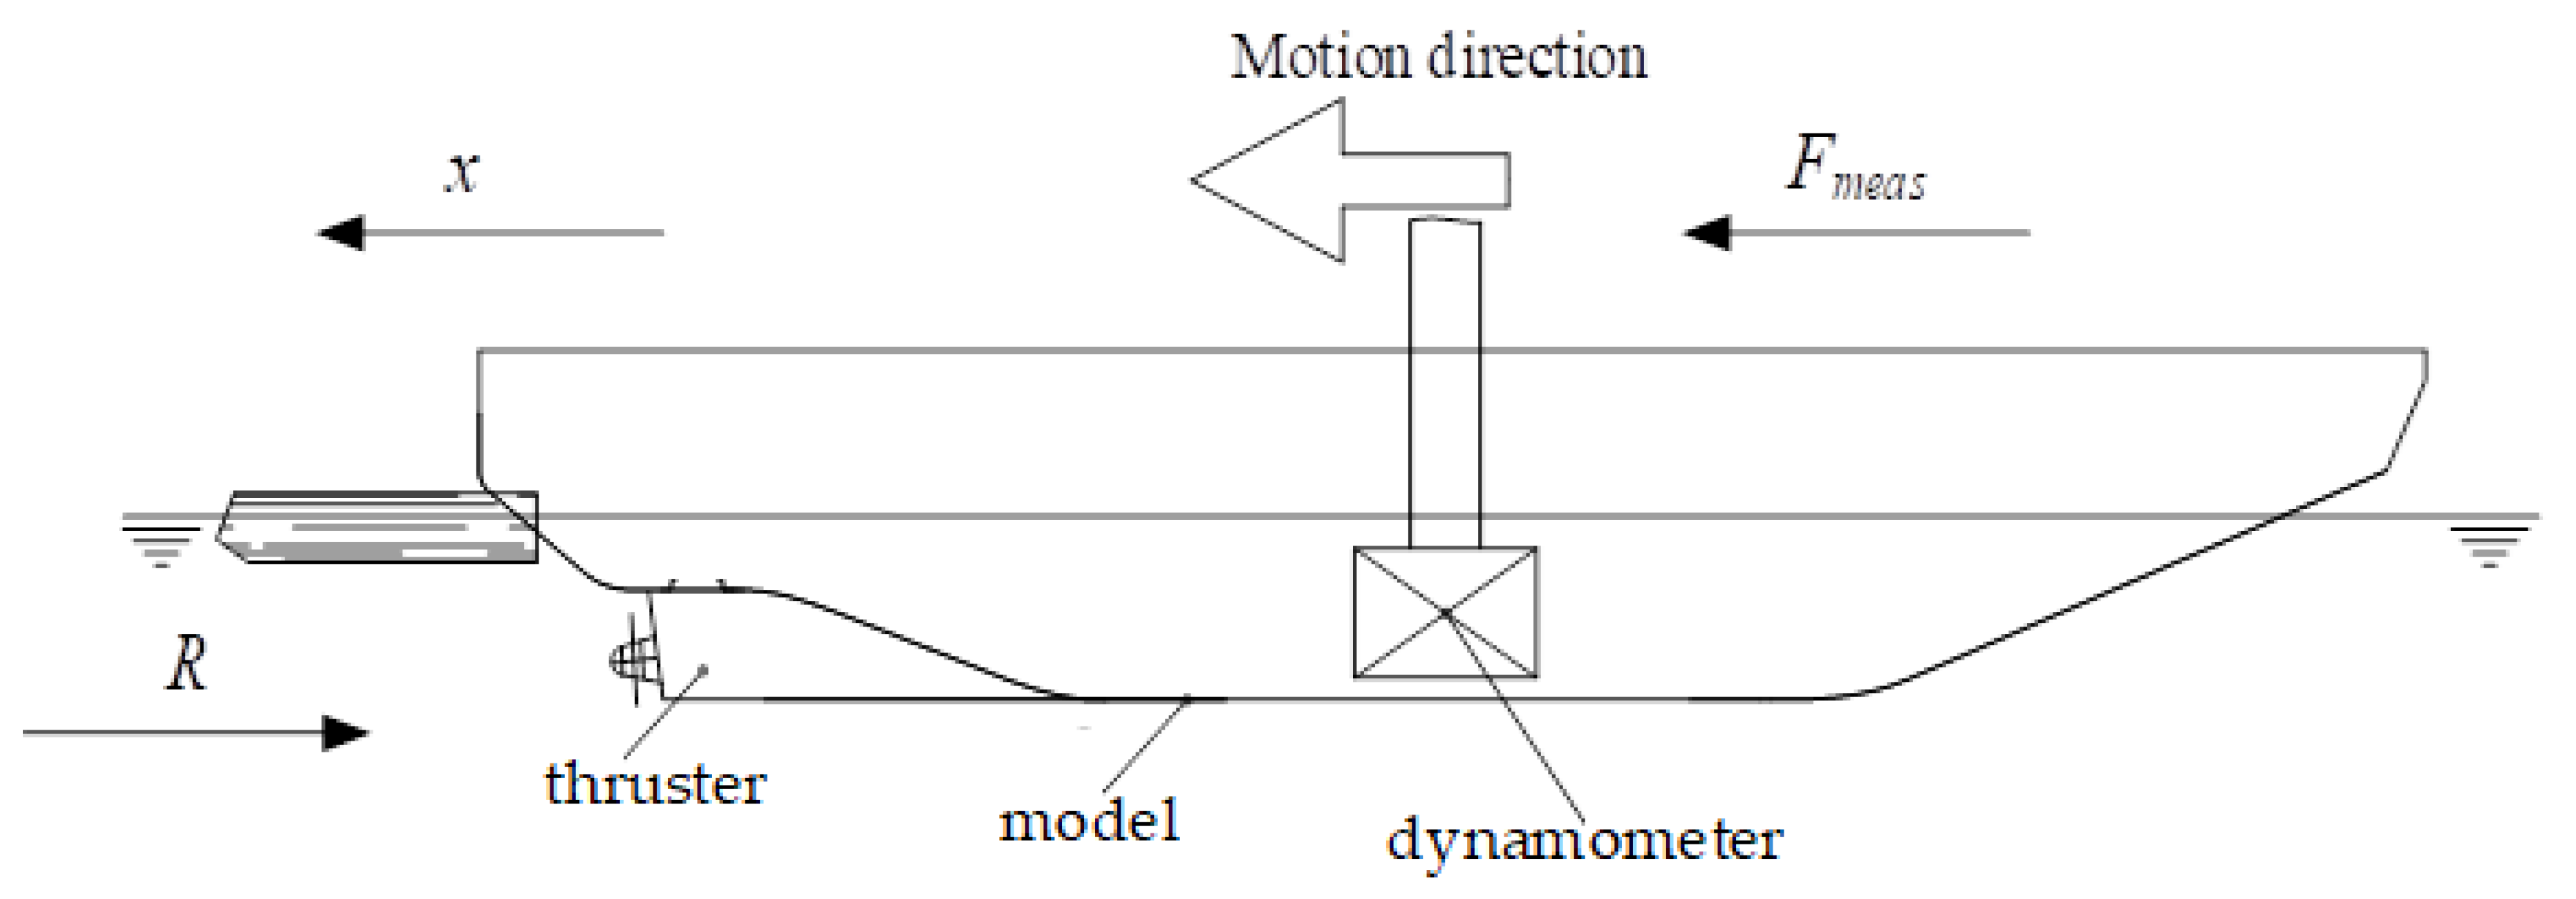
The ship model was constrained to the carriage, then the force could be measured. A dynamometer was installed and applied to measure the ice force acting on the model ship. The general setups of the model tests are shown in Figure 6.
Figure 6.
Side view illustration of the test system.
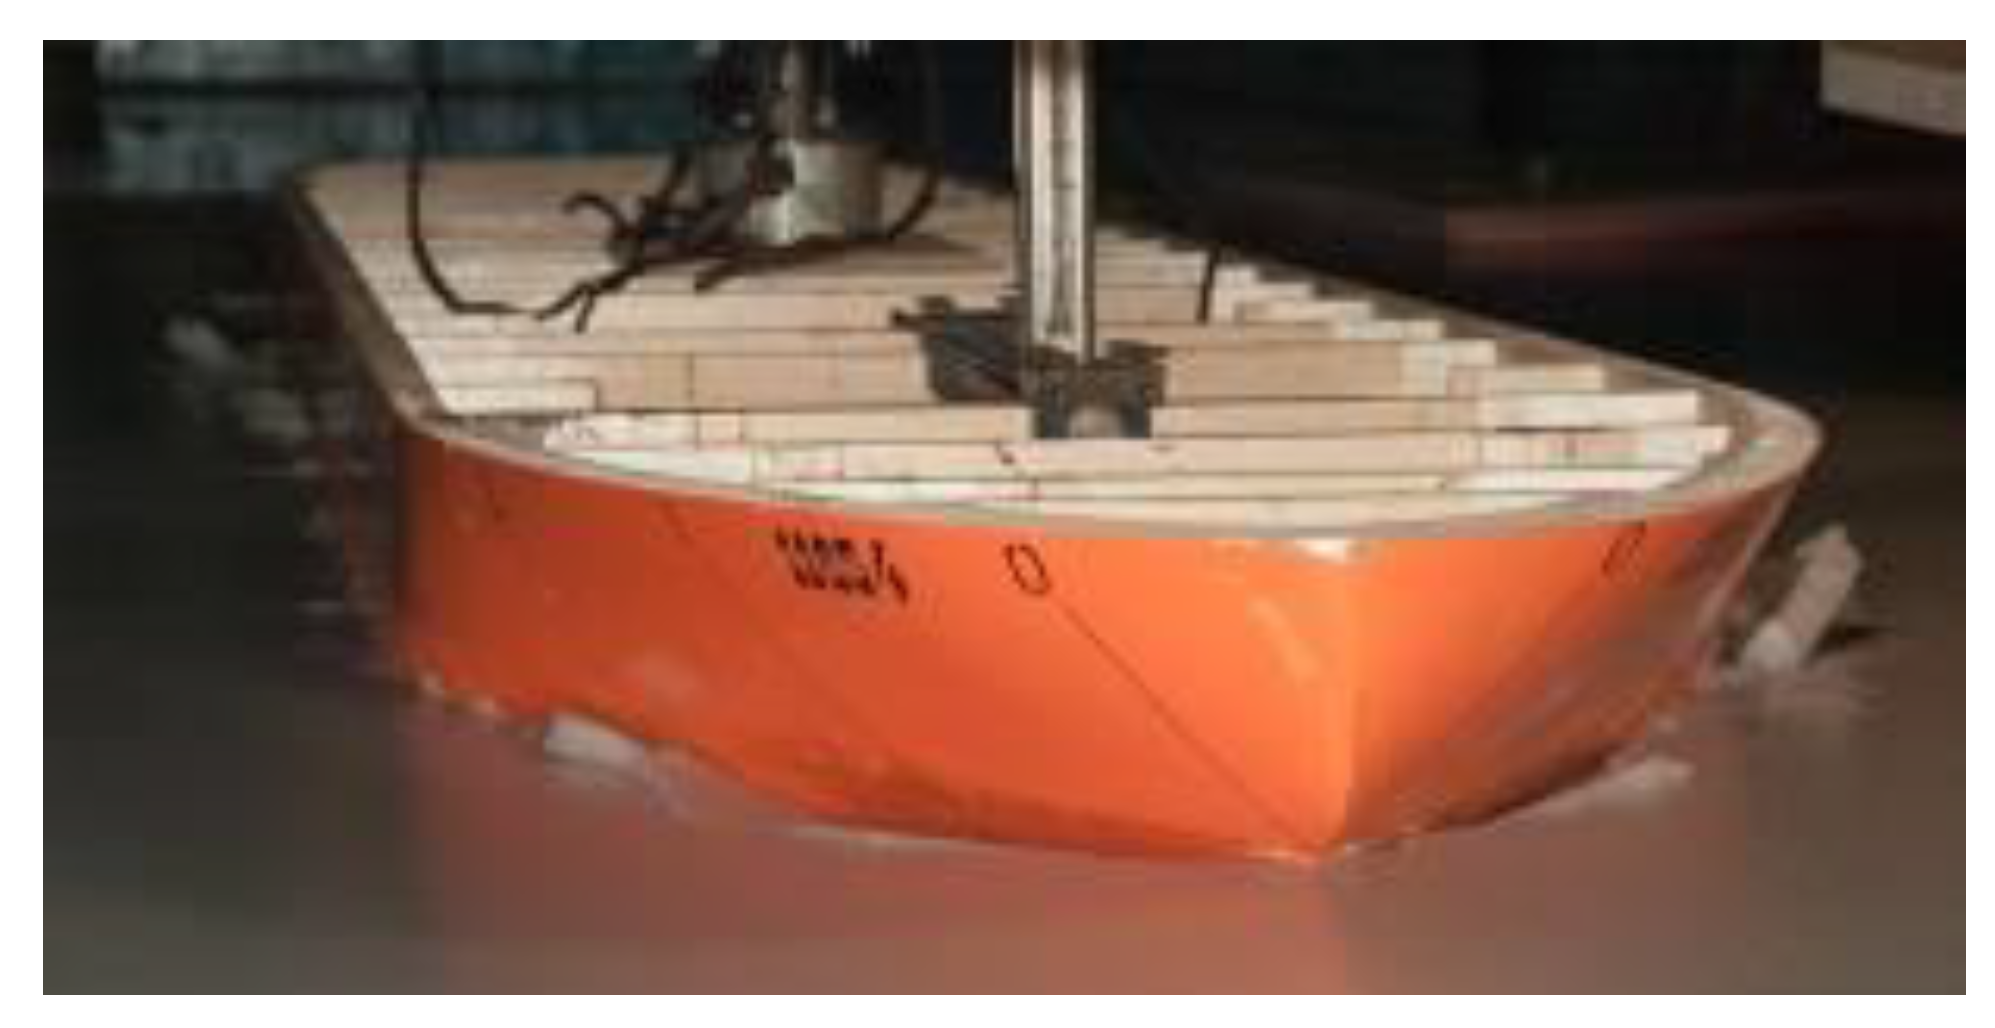
The ice sheet was made by cooling, spraying, freezing and tempering. Two ice sheets with thicknesses of 1.3 and 1.6 m in full scale were generated for these tests. Two operation modes were tried in the ice. The first mode was ahead running as normal. The other one was astern running with operating propellers. The constant speeds used to tow the ship model were 1.27, 1.90, 2.54 and 3.80 kn. In total, there were 16 tests performed with the specific information shown in Table 2. A picture of the model test is given in Figure 7.
Table 2.
Test matrix.
Figure 7.
Model test of ahead running.
4. Numerical Simulation and Comparison
4.1. Simulation Setup
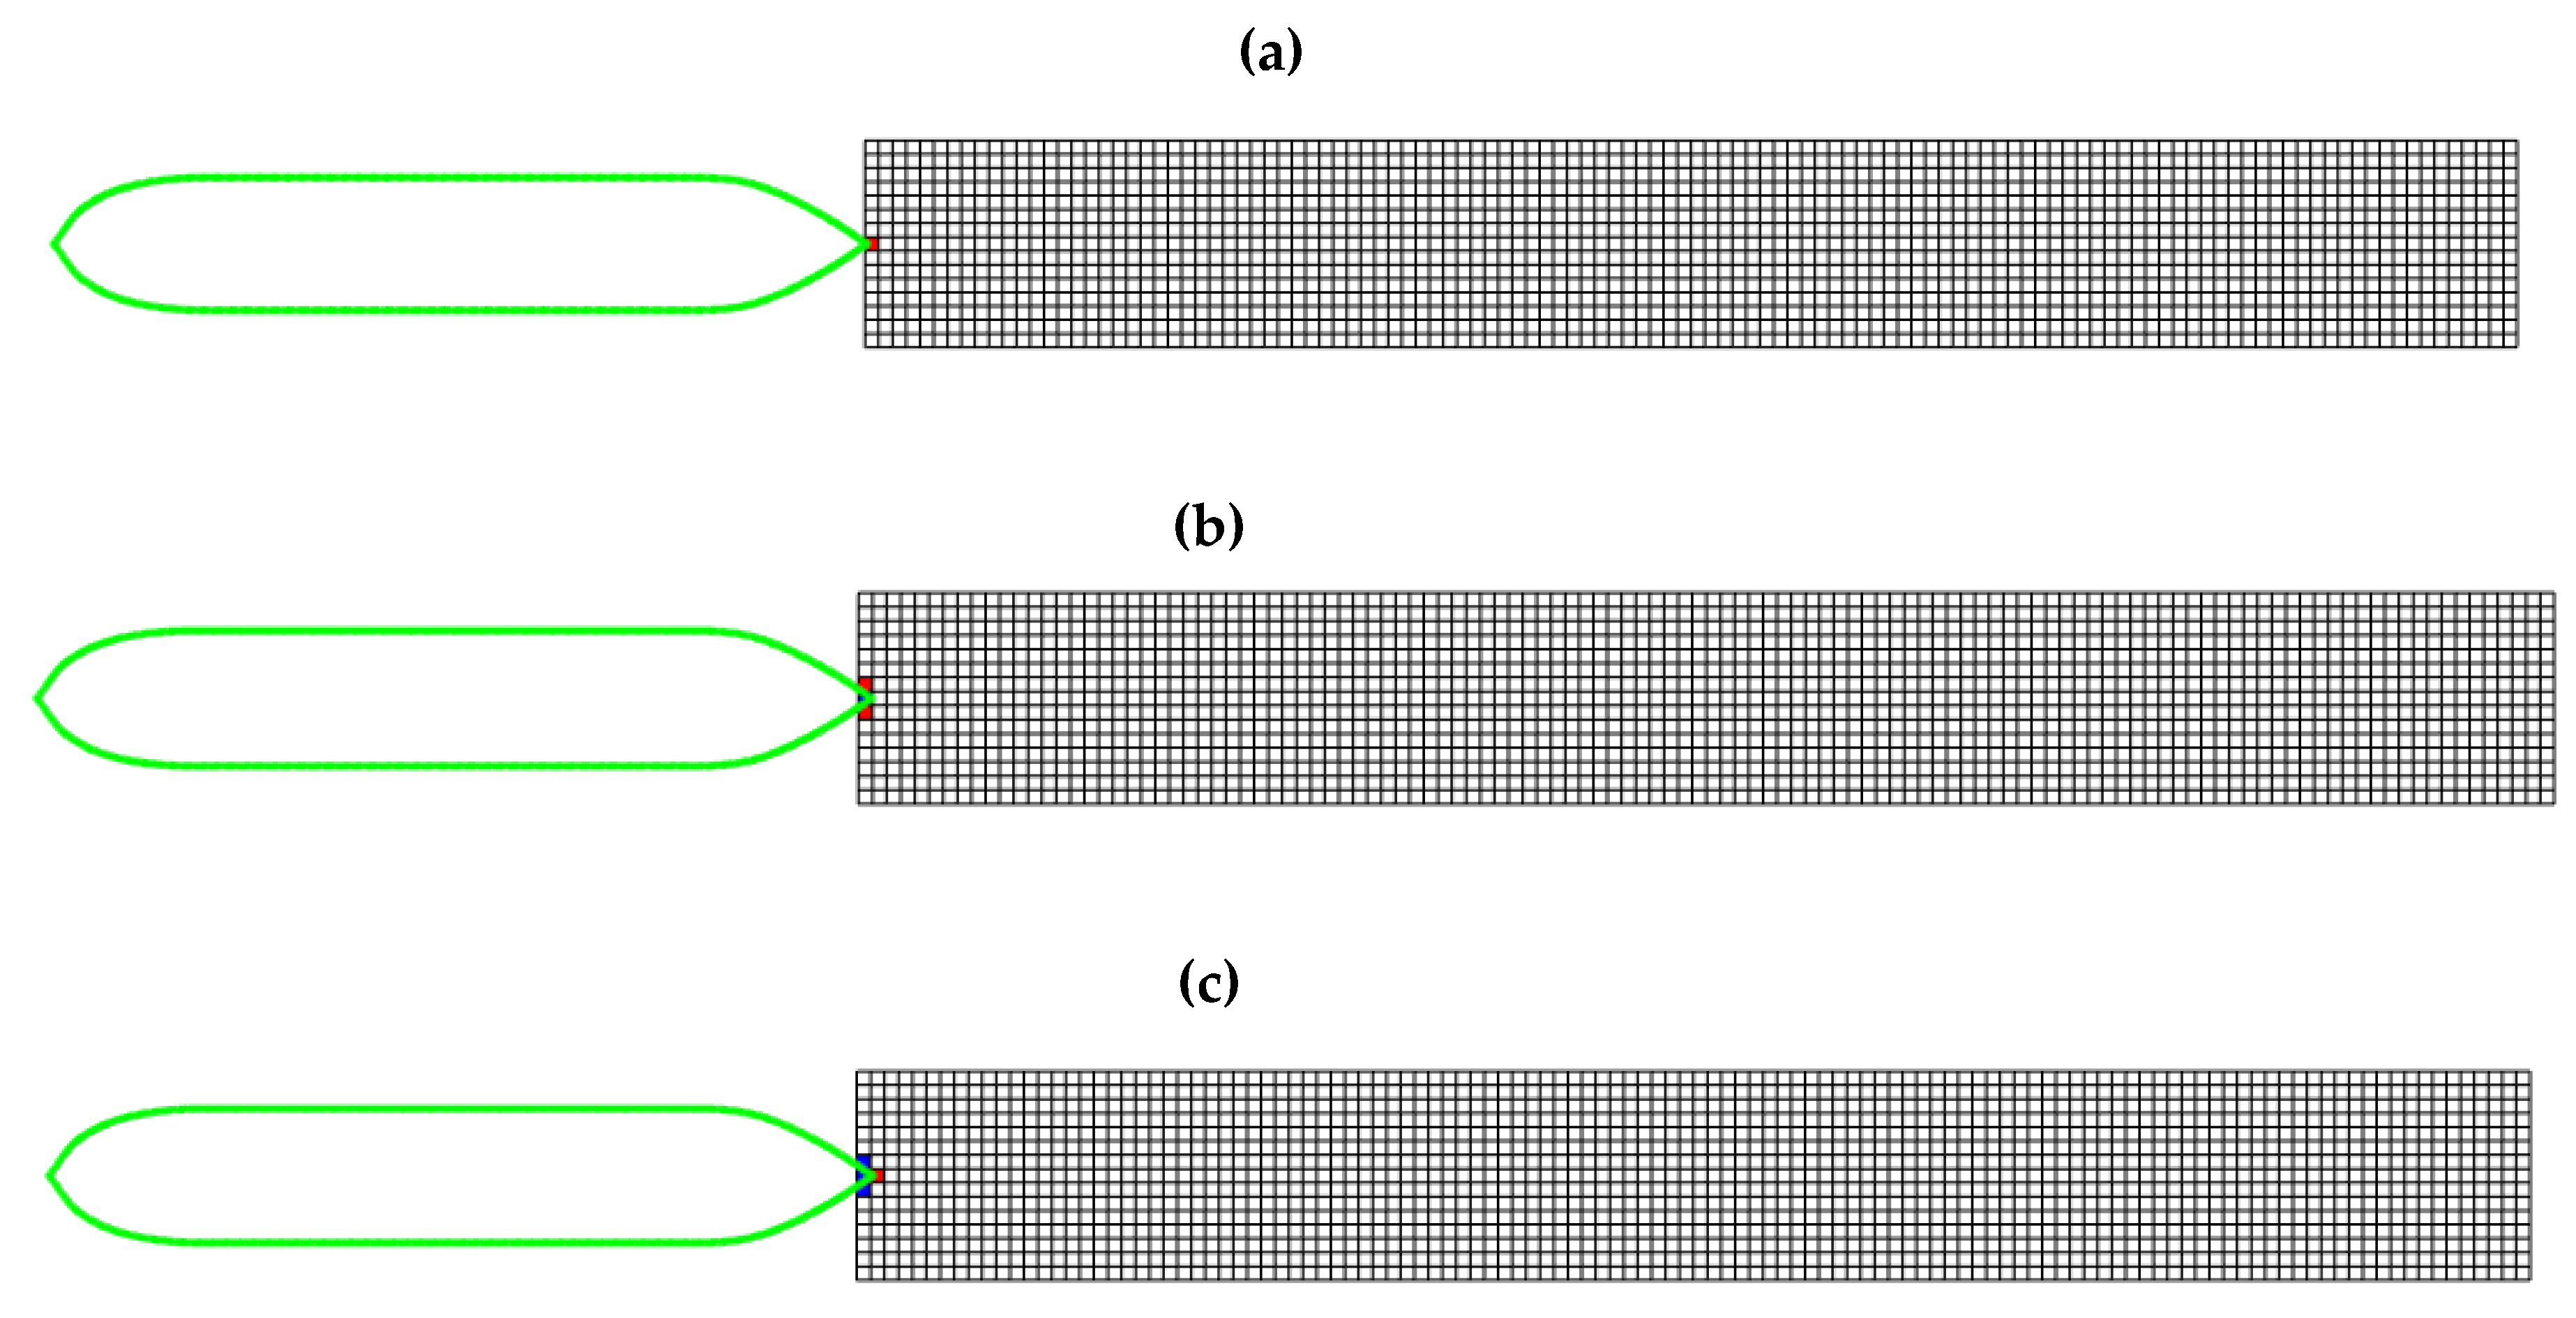
The ice field was composed of squared ice grids with the same size. The length of each ice grid was set to be the breaking length. The initial positions of the ship and ice field are shown in Figure 8.
Figure 8.
Initial positions of the ship and ice field.
The general ice data with respects to bending strength, crushing strength, elastic modulus, water and ice density, ice-hull friction coefficient, Poisson ratio and gravity acceleration are given in Table 3. The bending strength, crushing strength, elastic modulus and ice-hull friction coefficient were measured directly from the model test. The unknown parameters were Poisson ratio, and water and ice density. The Poisson ratio was selected based on previous study [,]. The water contains many chemical components including salts. Herein, the density was taken as sea water density with 1025 kg.m−3. The ice density varies from 720 to 940 kg.m−3 with an average of 910 kg.m−3 []. The ice density was taken as 900 kg.m−3 in the present study. All data shown in the present paper are in full scale if not specified otherwise.
Table 3.
Ice parameters used in the simulation.
4.2. Simulation Examples
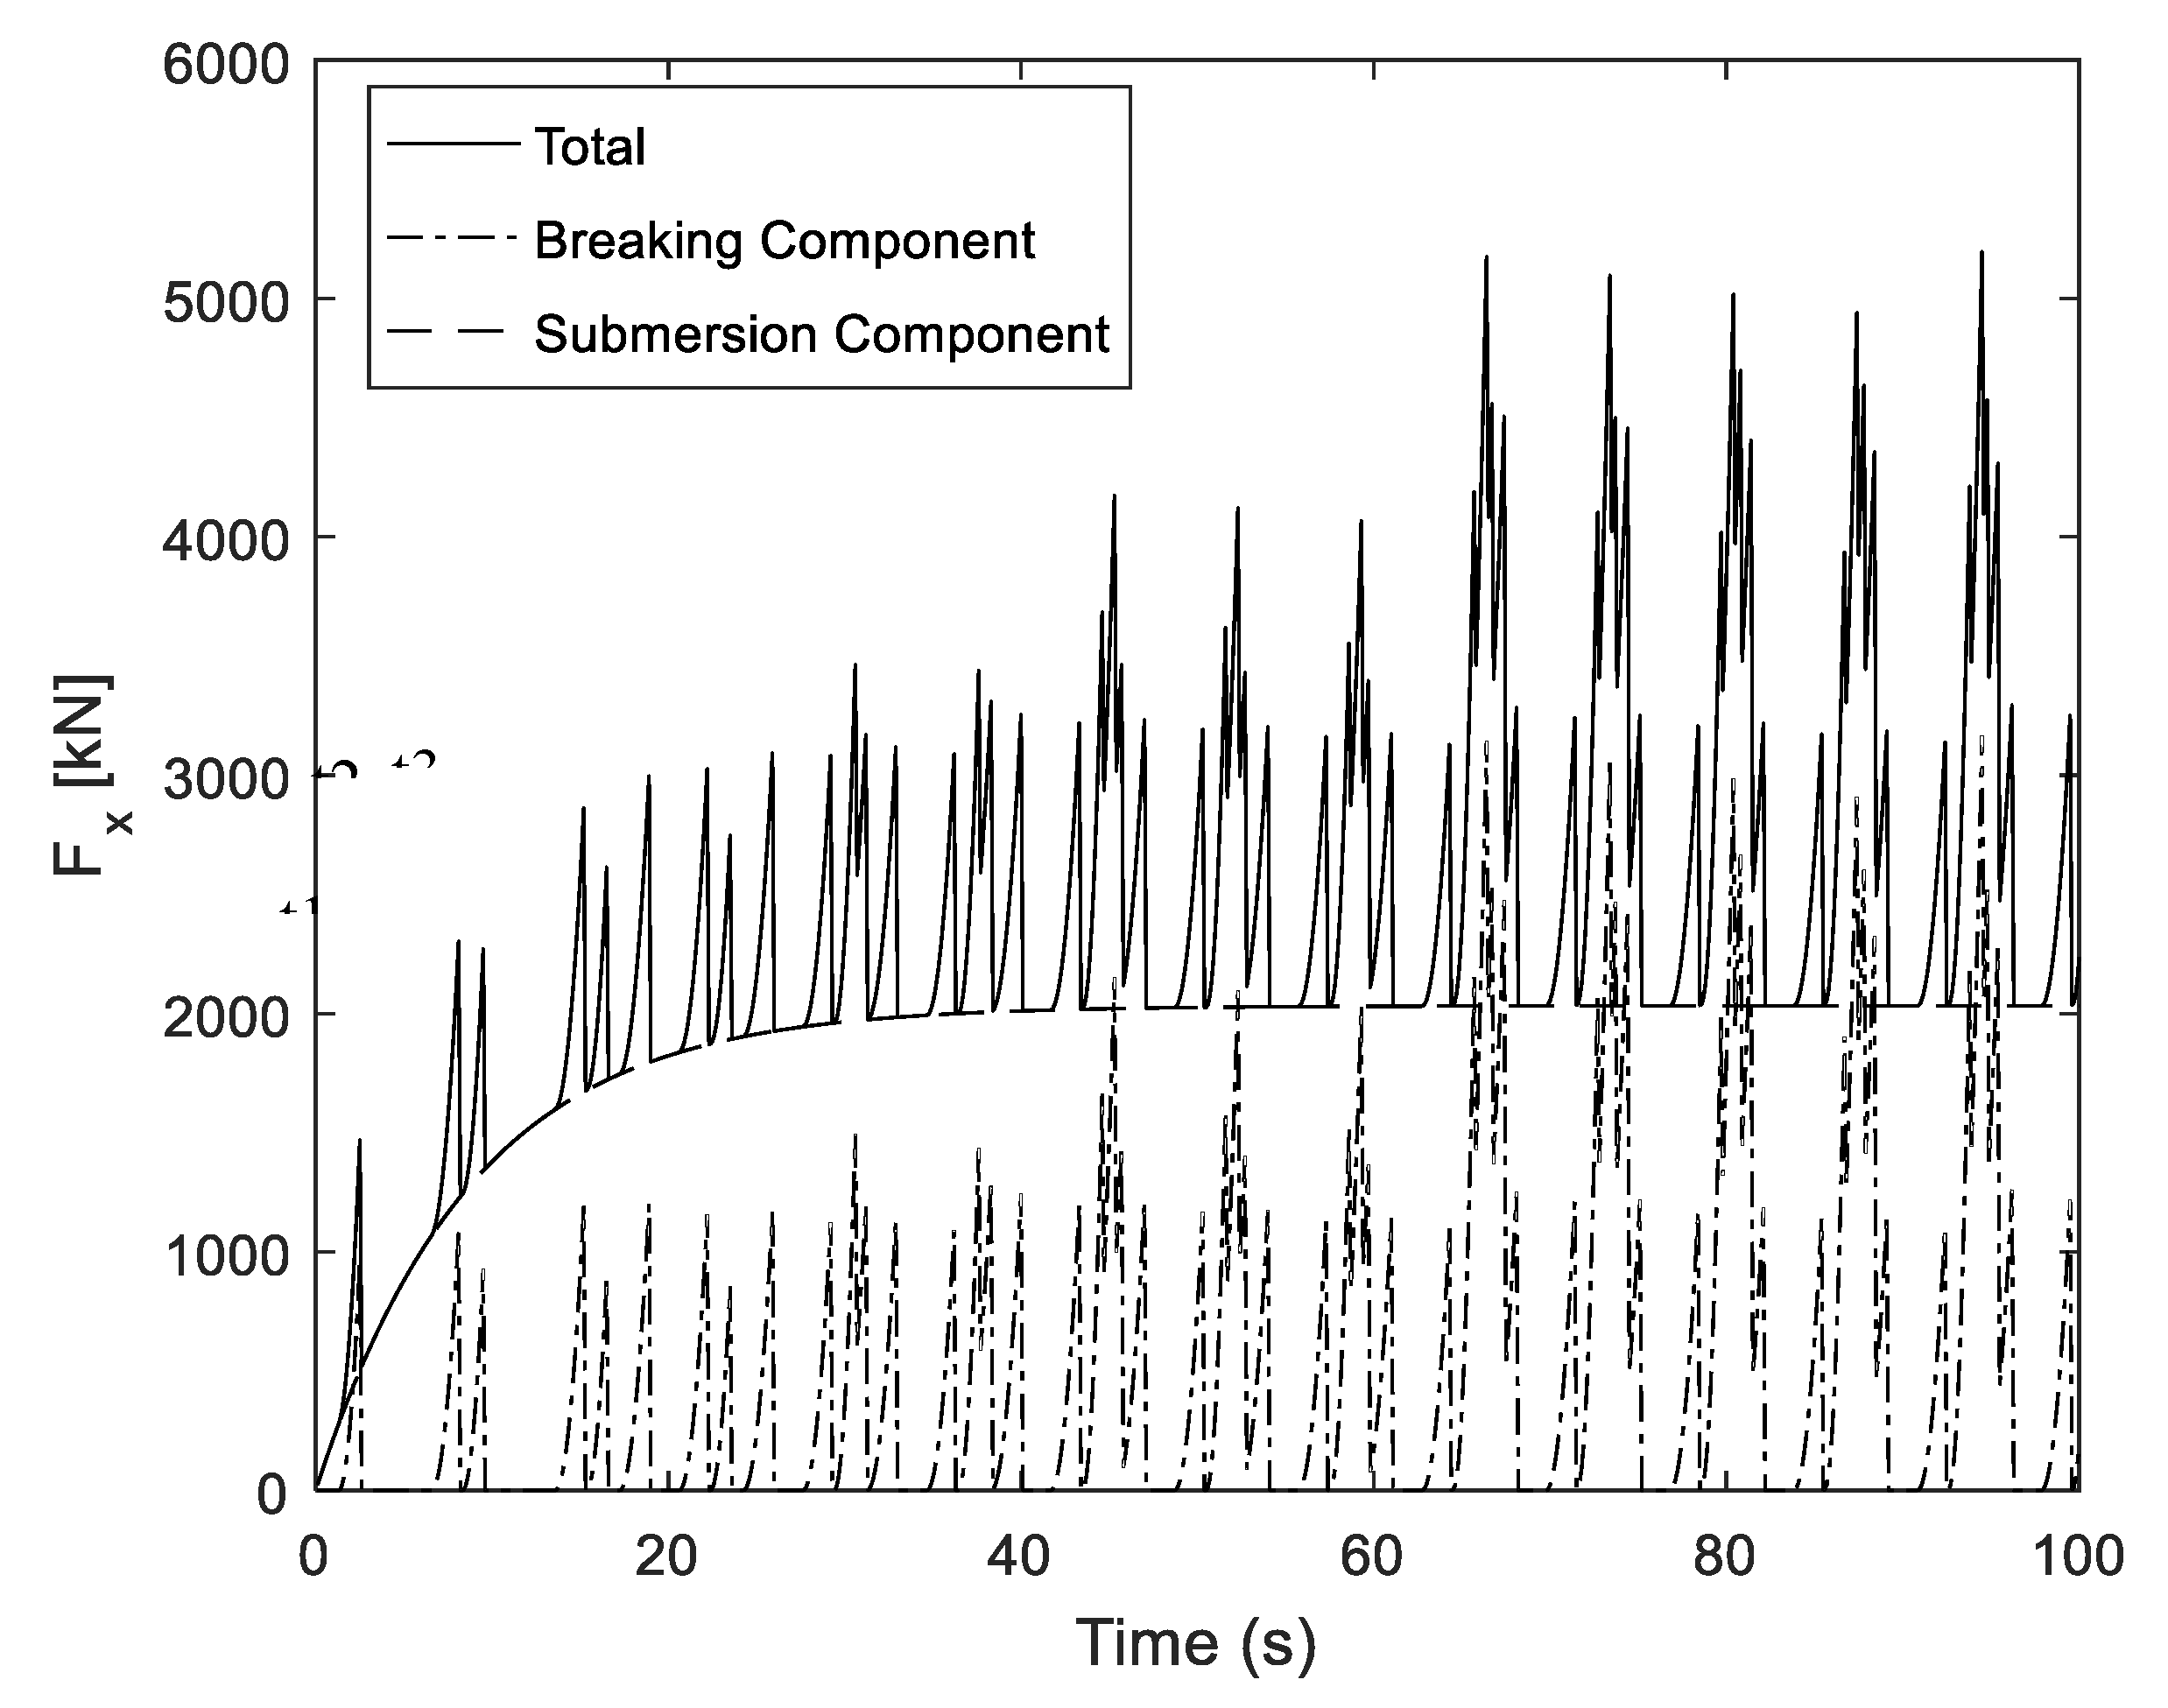
Test 11 was simulated using an ice drift velocity of 1.27 kn and ice thickness of 1.3 m. The speed-dependent icebreaking length coefficient Cl was selected to be 0.24 while the bending capacity coefficient Cf was set to be 2.5. The longitudinal ice force exposed to the ship was of interest for analysis of both operation modes herein. Therefore, only the longitudinal ice force was considered and taken as the ice force for short. The time series of the ice force components due to breaking and submersion are given in Figure 9. It can be seen that the ice submersion force increases steadily to a constant value. The breaking component is nonlinear and changing rapidly, significantly depending on the failure of the ice grid around the waterline of the hull.
Figure 9.
Time series of the total ice force and ice force components.
The process would be discussed briefly at several time intervals. The time intervals t1, t2 and t3 were selected for study, which corresponded to the first three peaks at the early stage of the ice-hull interaction. The time intervals are labelled in Figure 9. The icebreaking snapshots at each time instant are presented in Figure 10. At time t1, the central grid is breaking against the hull, then the ice grid fails in bending and the icebreaking force turns to zero. When it comes to time t2, two ice grids neighboring the failed ice grid at time instant t1, are colliding with the hull. Then the three ice grids failed after t2 and the fourth ice grid starts to intrude the hull and the three peak occurs at t3.
Figure 10.
The breaking process of the ice-hull interaction from 2.5~9.5 s (a) t1 = 2.5 s (b) t2 = 8.1 s (c) t3 = 9.5 s.
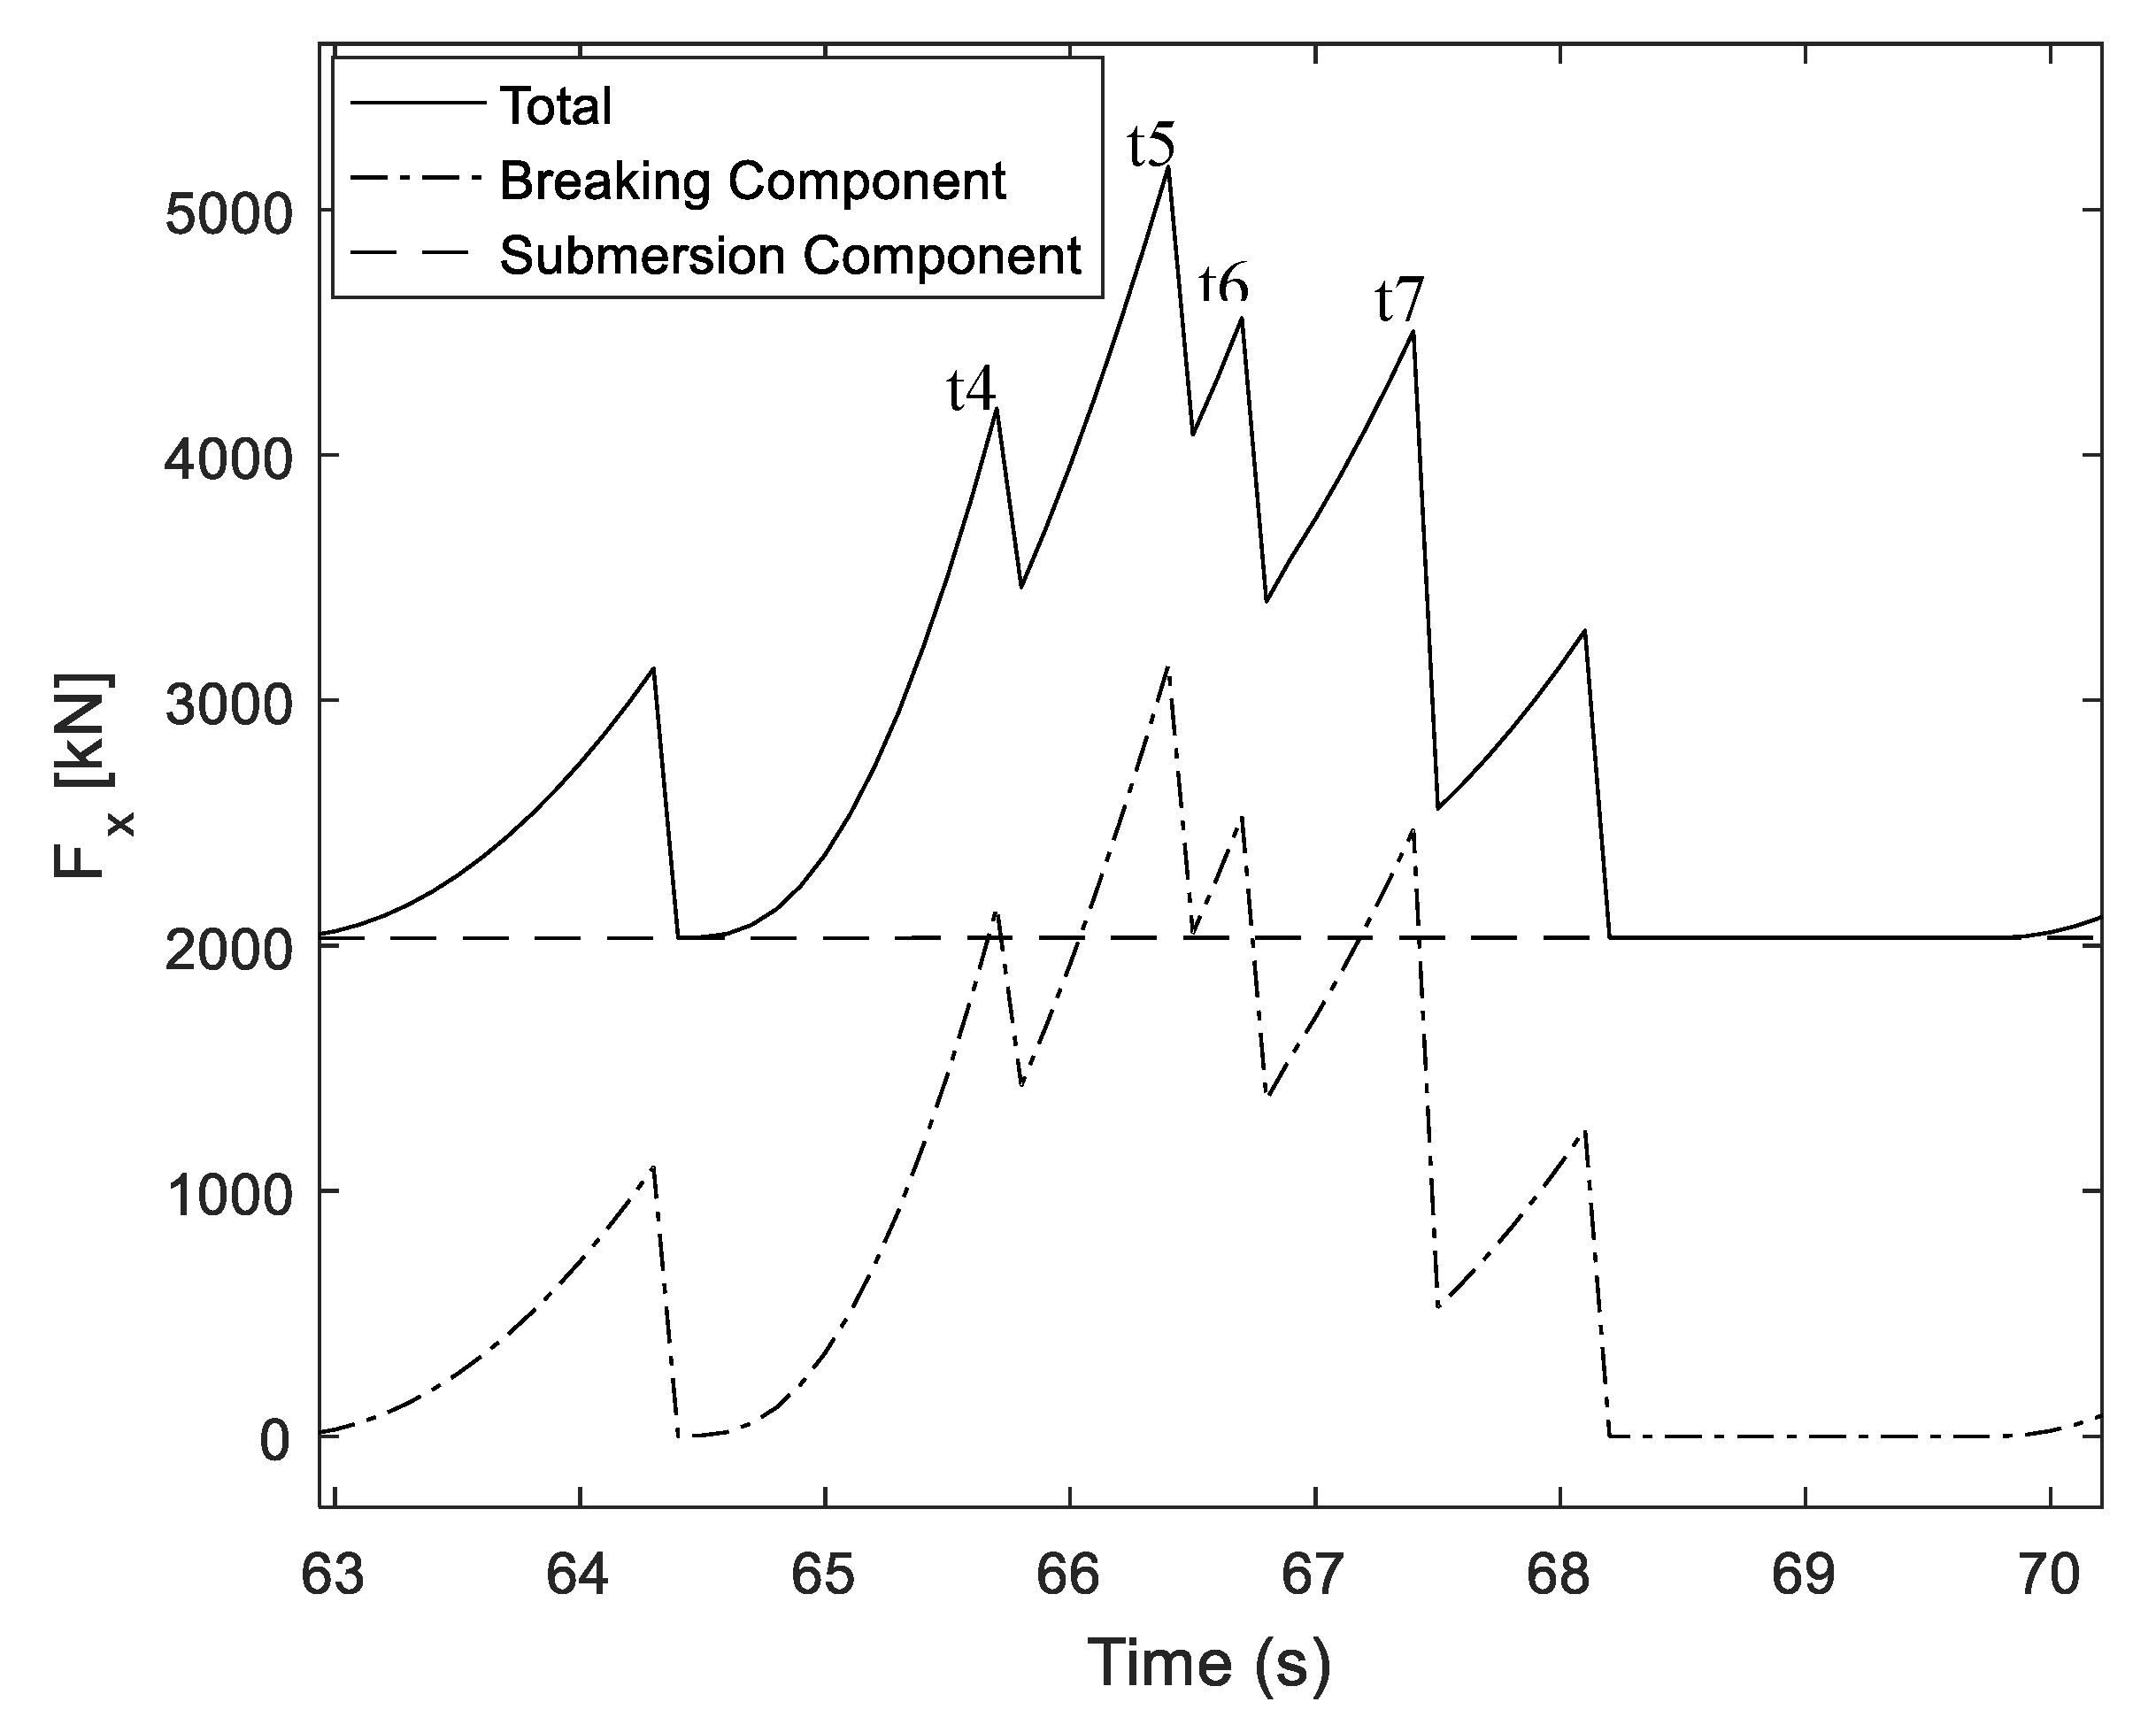
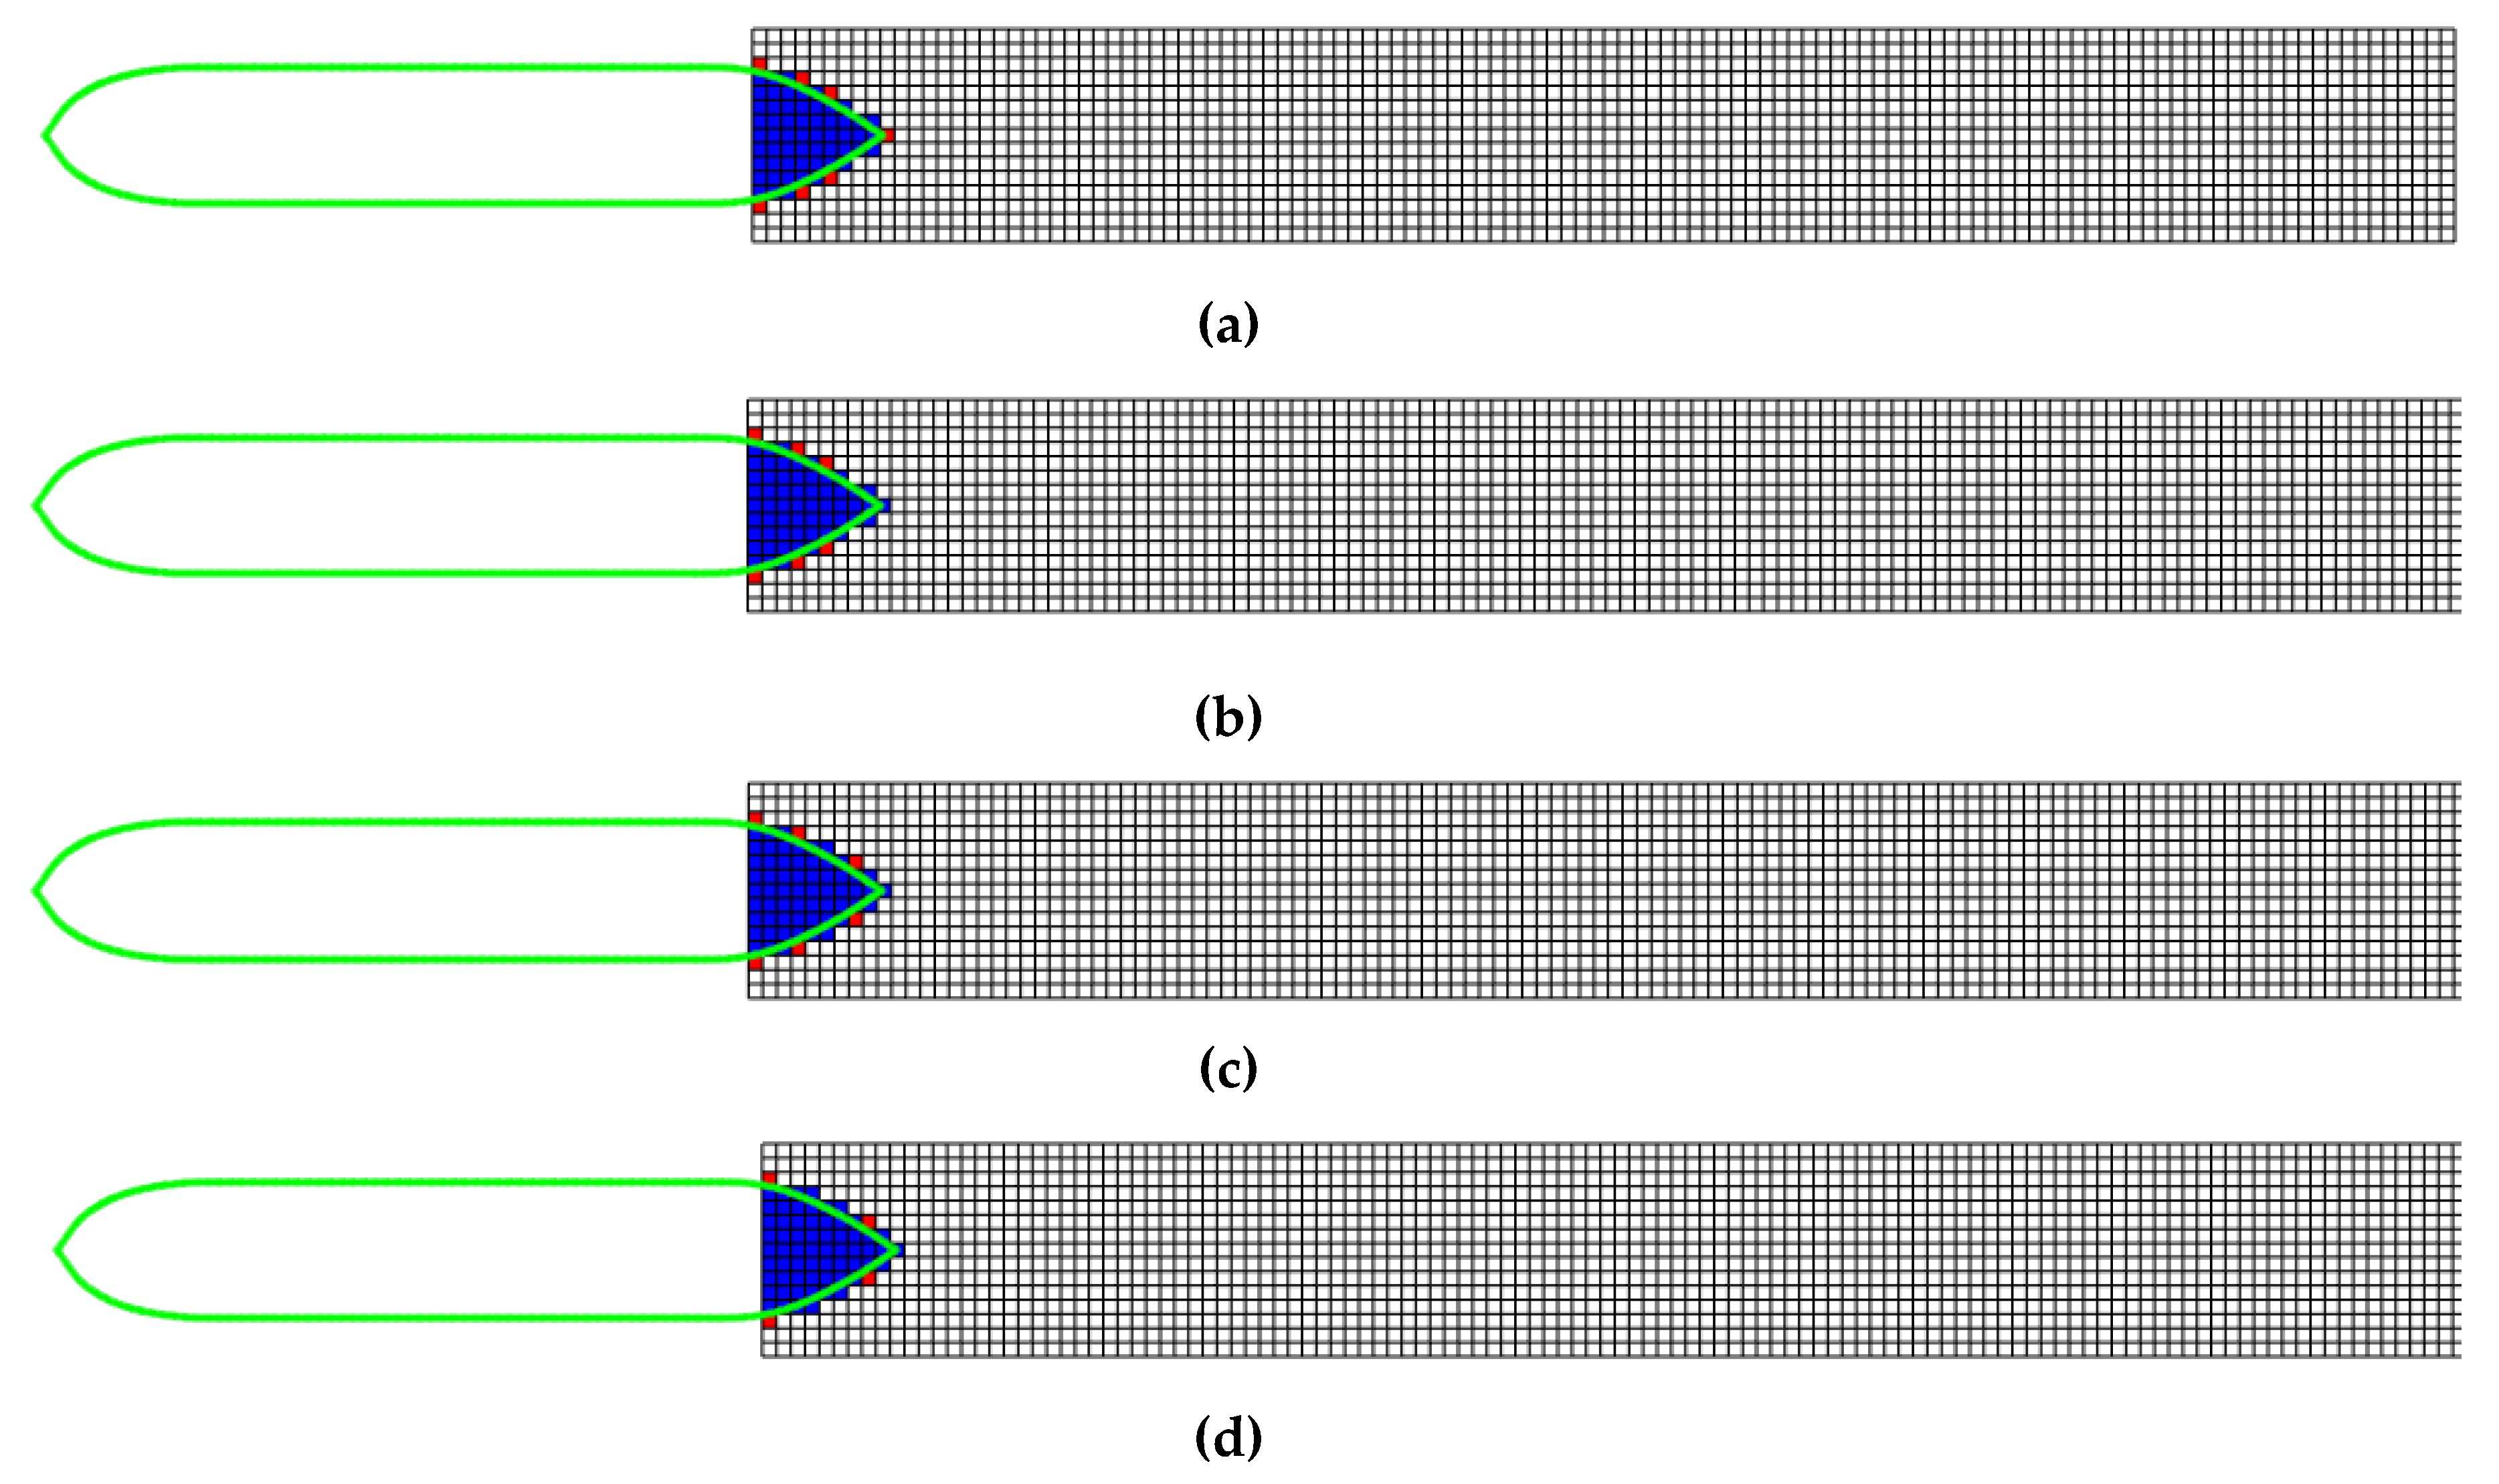
Figure 11 shows a part of the ice force based on Figure 9 at the steady state when the whole bow part is travelled into ice field. The time intervals t4~t7 where the peaks occur are included and the ice-ship interaction snapshots are shown in Figure 12. There are seven ice grids interacting with the hull at time instant t4. Then the foremost ice grid which are colliding with the ship fails, but the total ice force continues to augment as the overall interaction area increases at t5. When it evolves to t6, the peak decreases though the number of icebreaking grid is the same as that at t5. Only four ice grids are breaking against the hull as t7 and the force tends to decrease afterwards.
Figure 11.
Part of the total ice force and ice force components.
Figure 12.
The breaking process of the ice-hull interaction from 65.7~67.4 s (a) t4 = 65.7 s (b) t5 = 66.4 s (c) t6 = 66.7 s (d) t7 = 67.4 s.
4.3. Sensitivity Study
To give insight into the present method, sensitivity study has been performed with respect to influence of simulation time interval, speed-dependent icebreaking length coefficient Cl and bending capacity coefficient Cf on the ice loads.
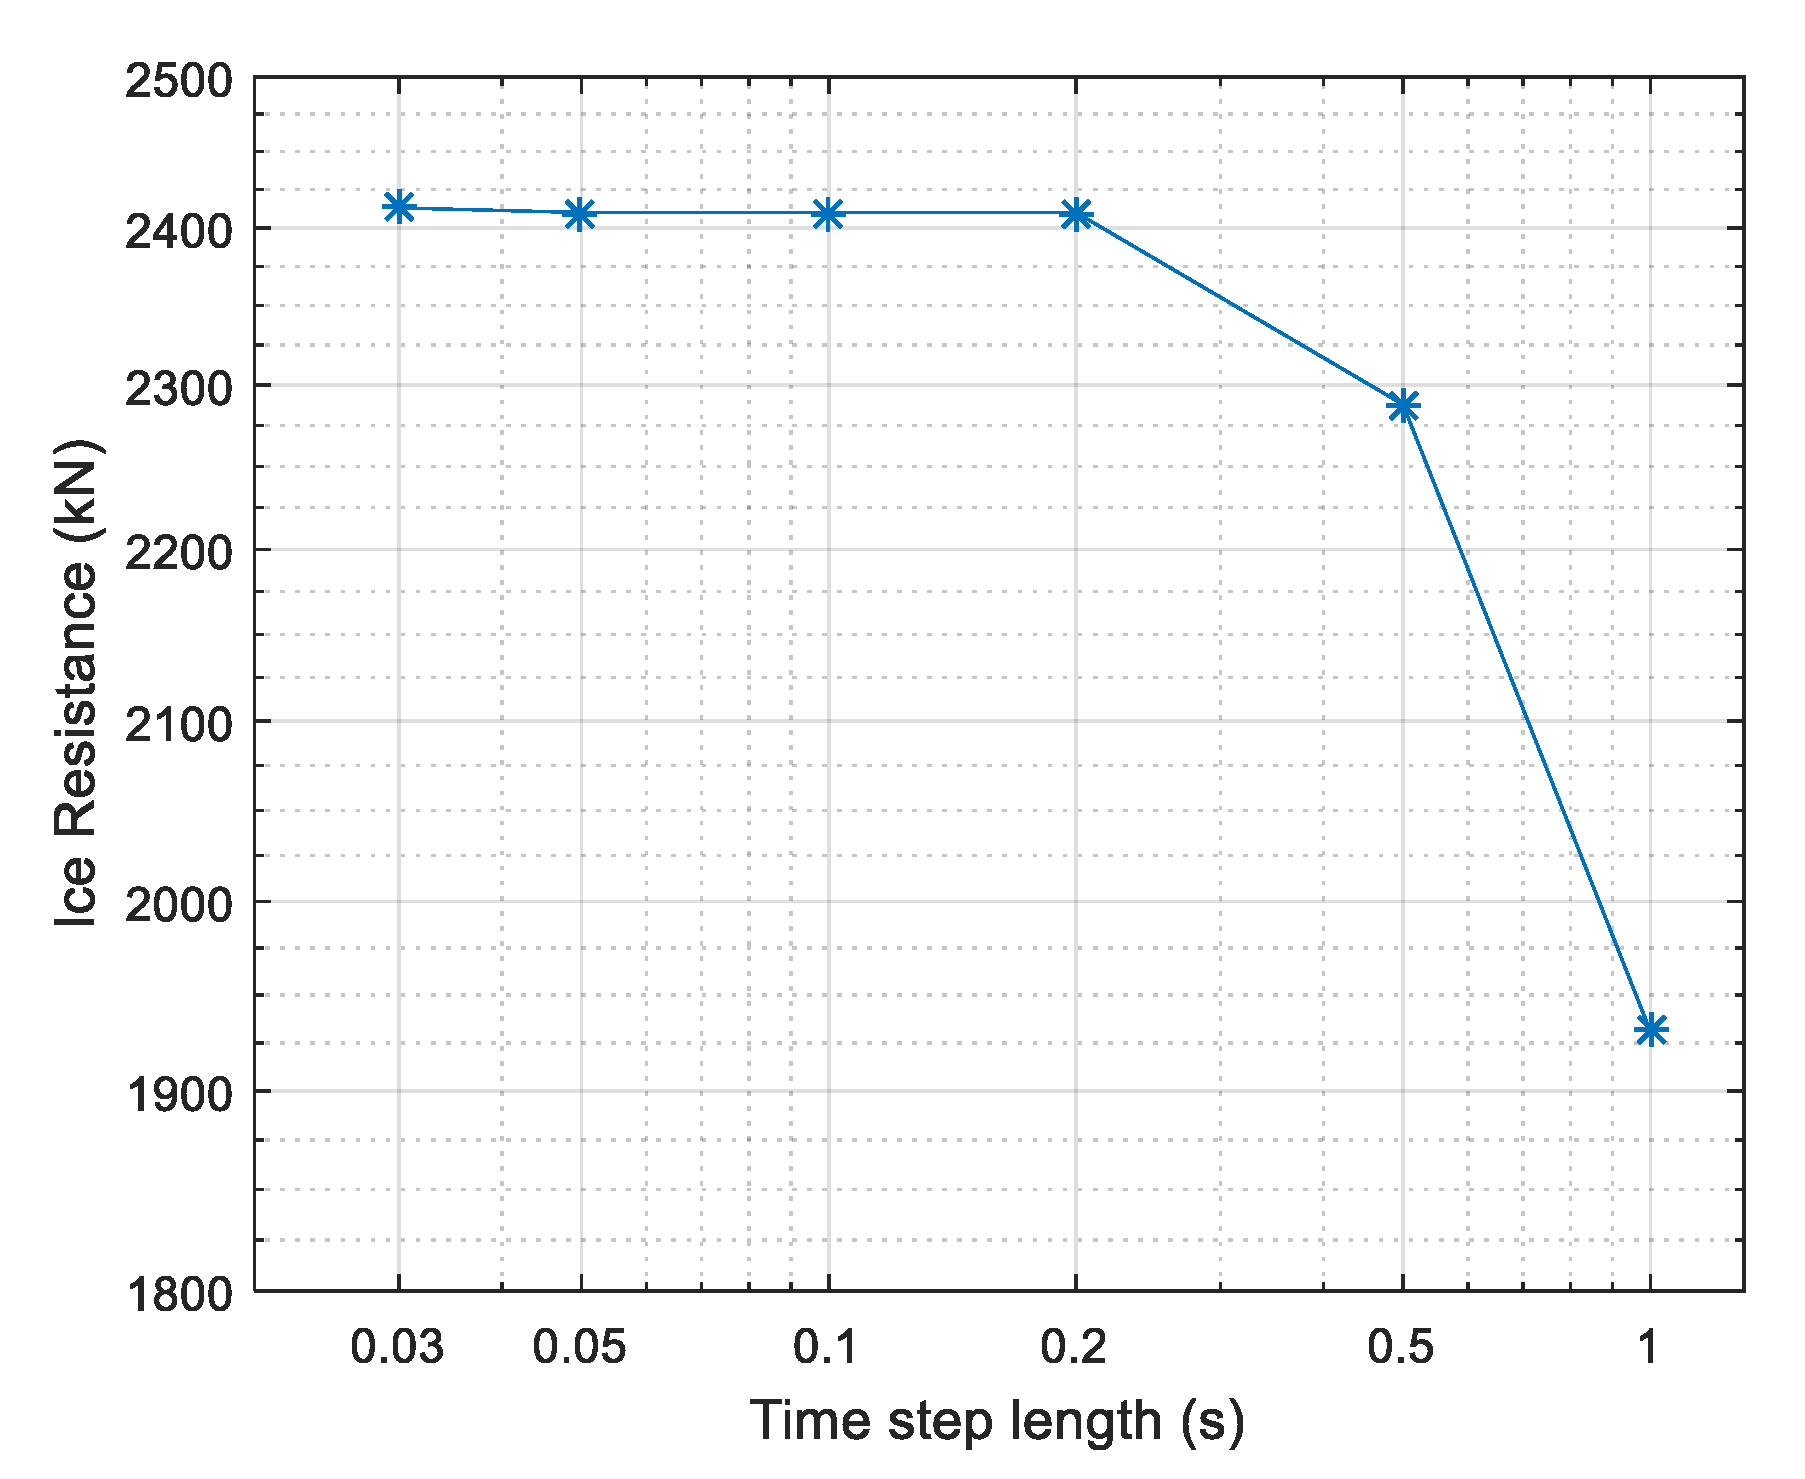
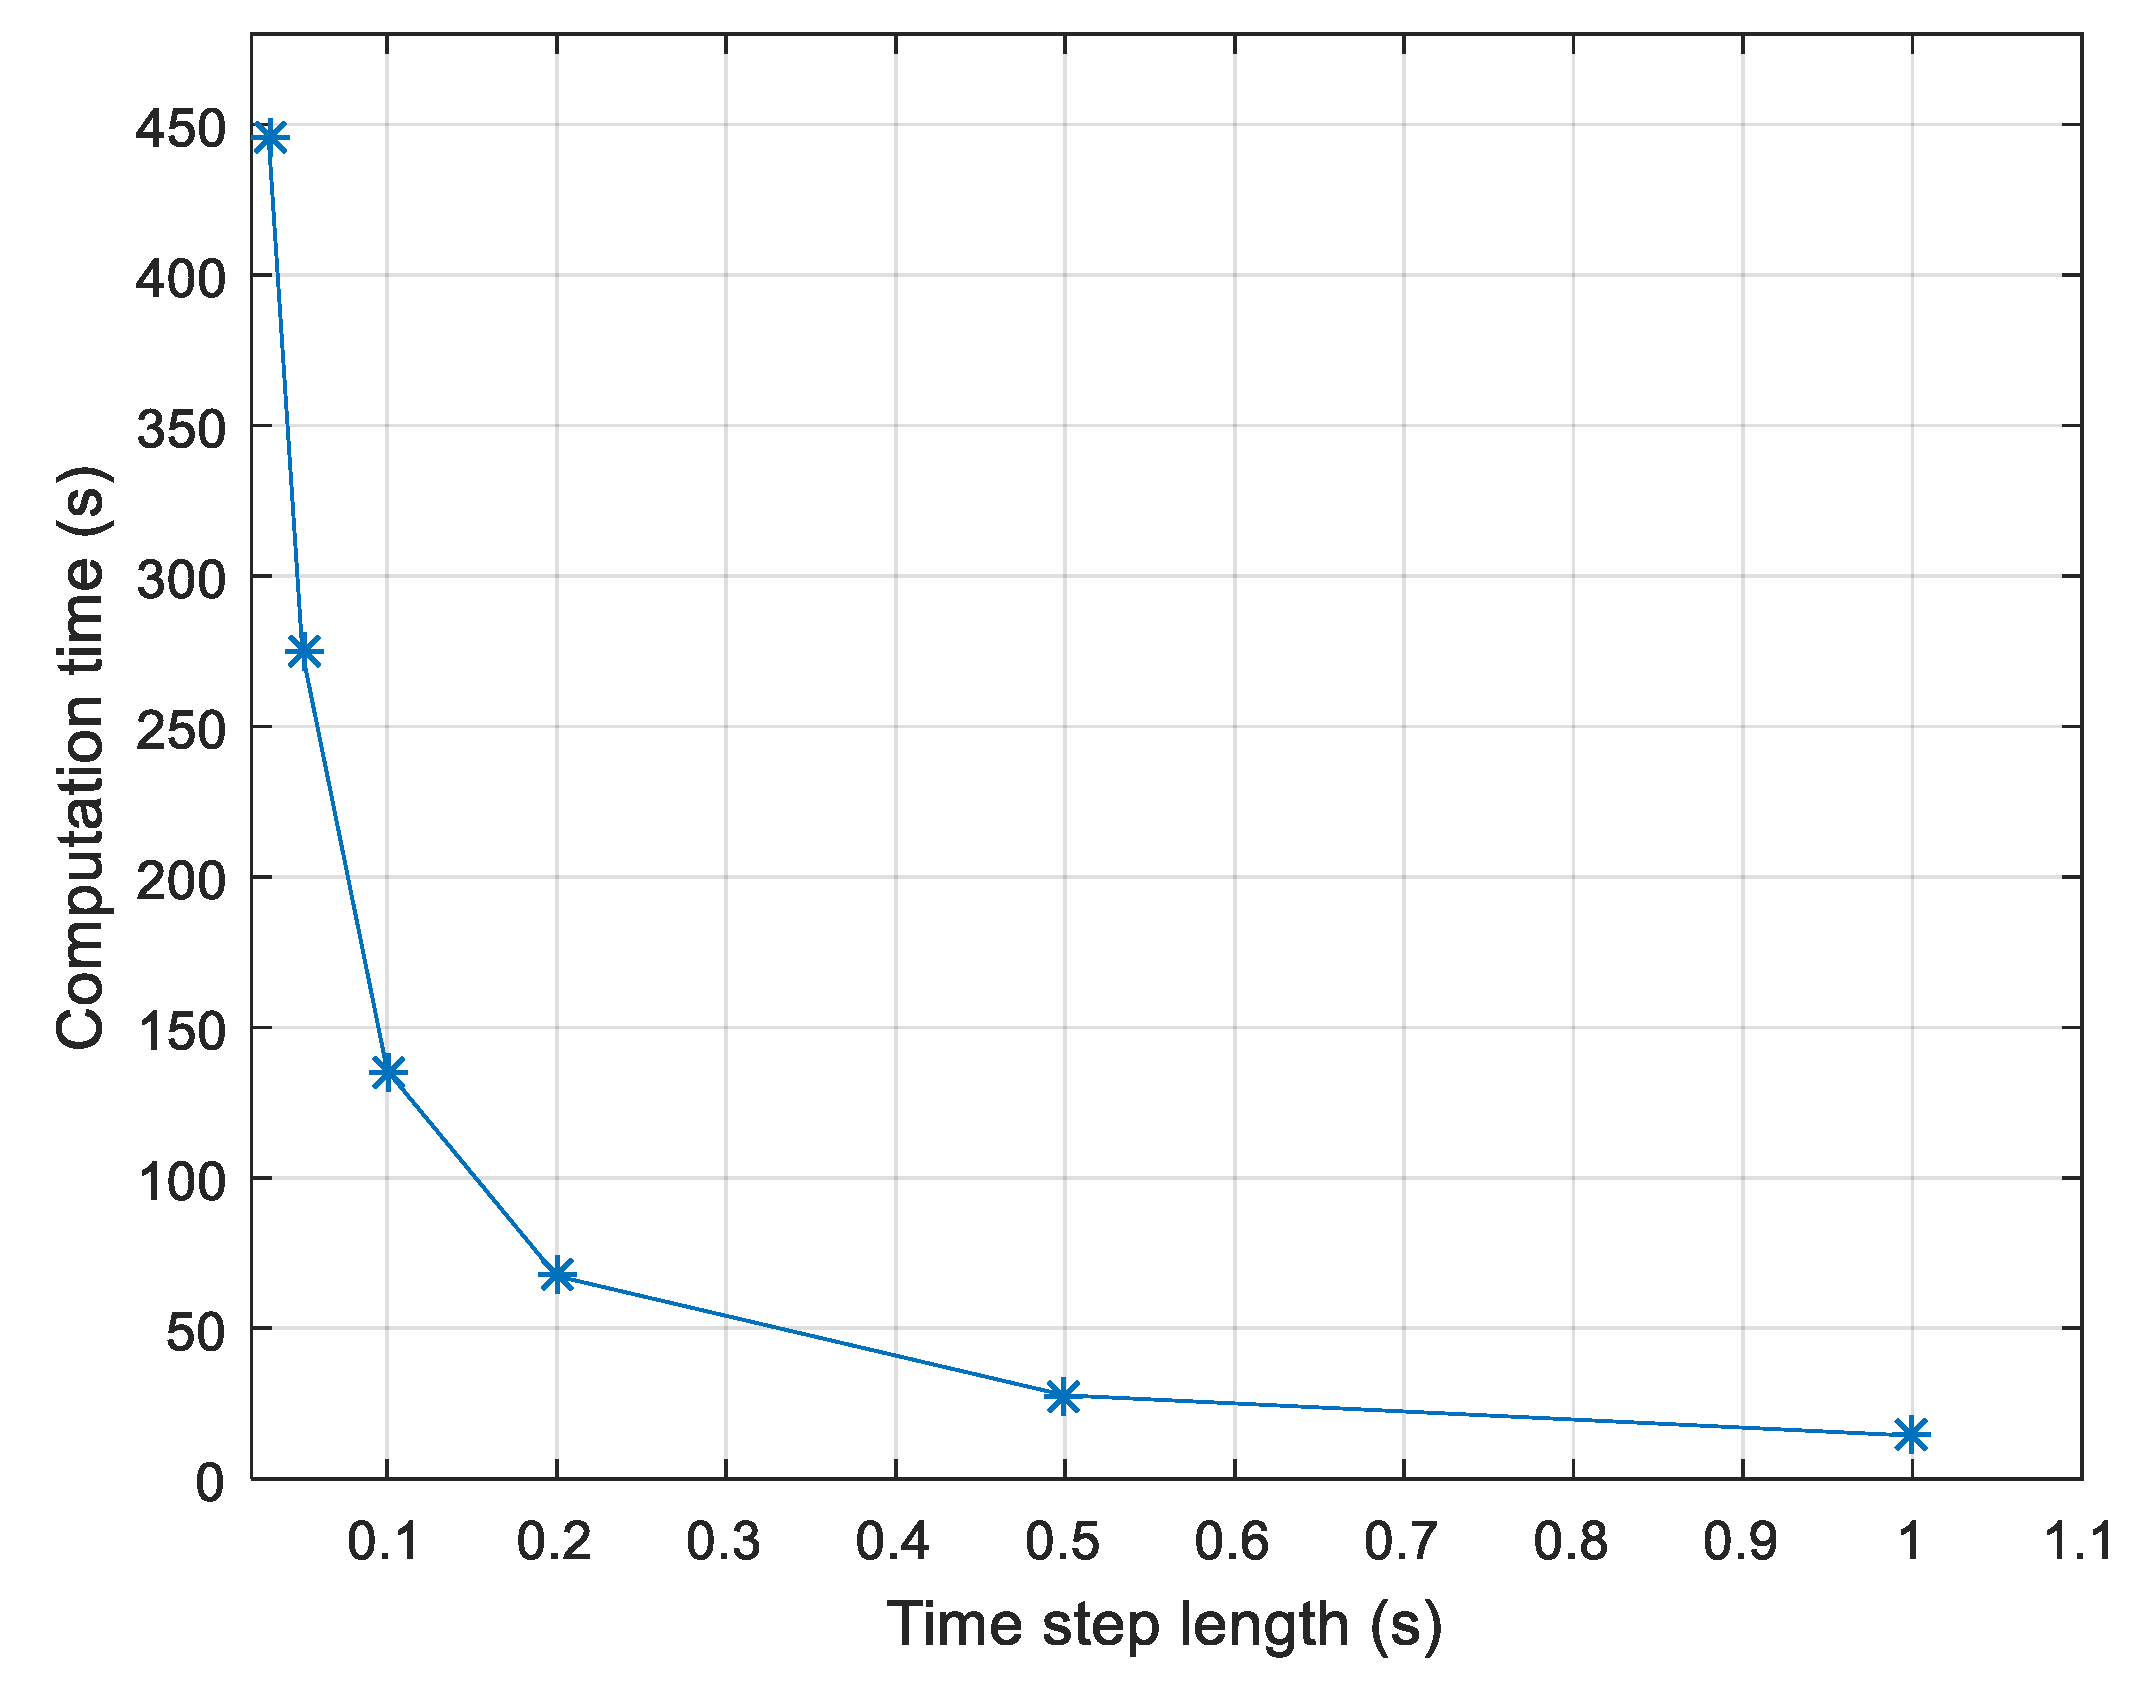
The specified ice thickness was 1.3 m and the speed was 1.27 kn (as same as that used in Test 11). Different values of time step lengths (0.03, 0.05, 0.1, 0.2, 0.5, 1 s) were applied. The ice resistance encountered by the ship as a function of time interval is plotted in Figure 13. As shown in Figure 13, the simulated ice load converges quite well when the time step length decreases. It comes to be steady at around 2400 kN when the time step drops to 0.2s. The computation time versus time step length is also given in Figure 14. From Figure 14, it is clear that the computation time increases exponentially with decreasing time interval. Considering the balance between computation time and the accuracy of the numerical simulation, the time step length of 0.1 s was appropriate and used in the following simulations.
Figure 13.
Simulated ice resistance as a function of the time step length.
Figure 14.
Computation time as a function of the time step length.
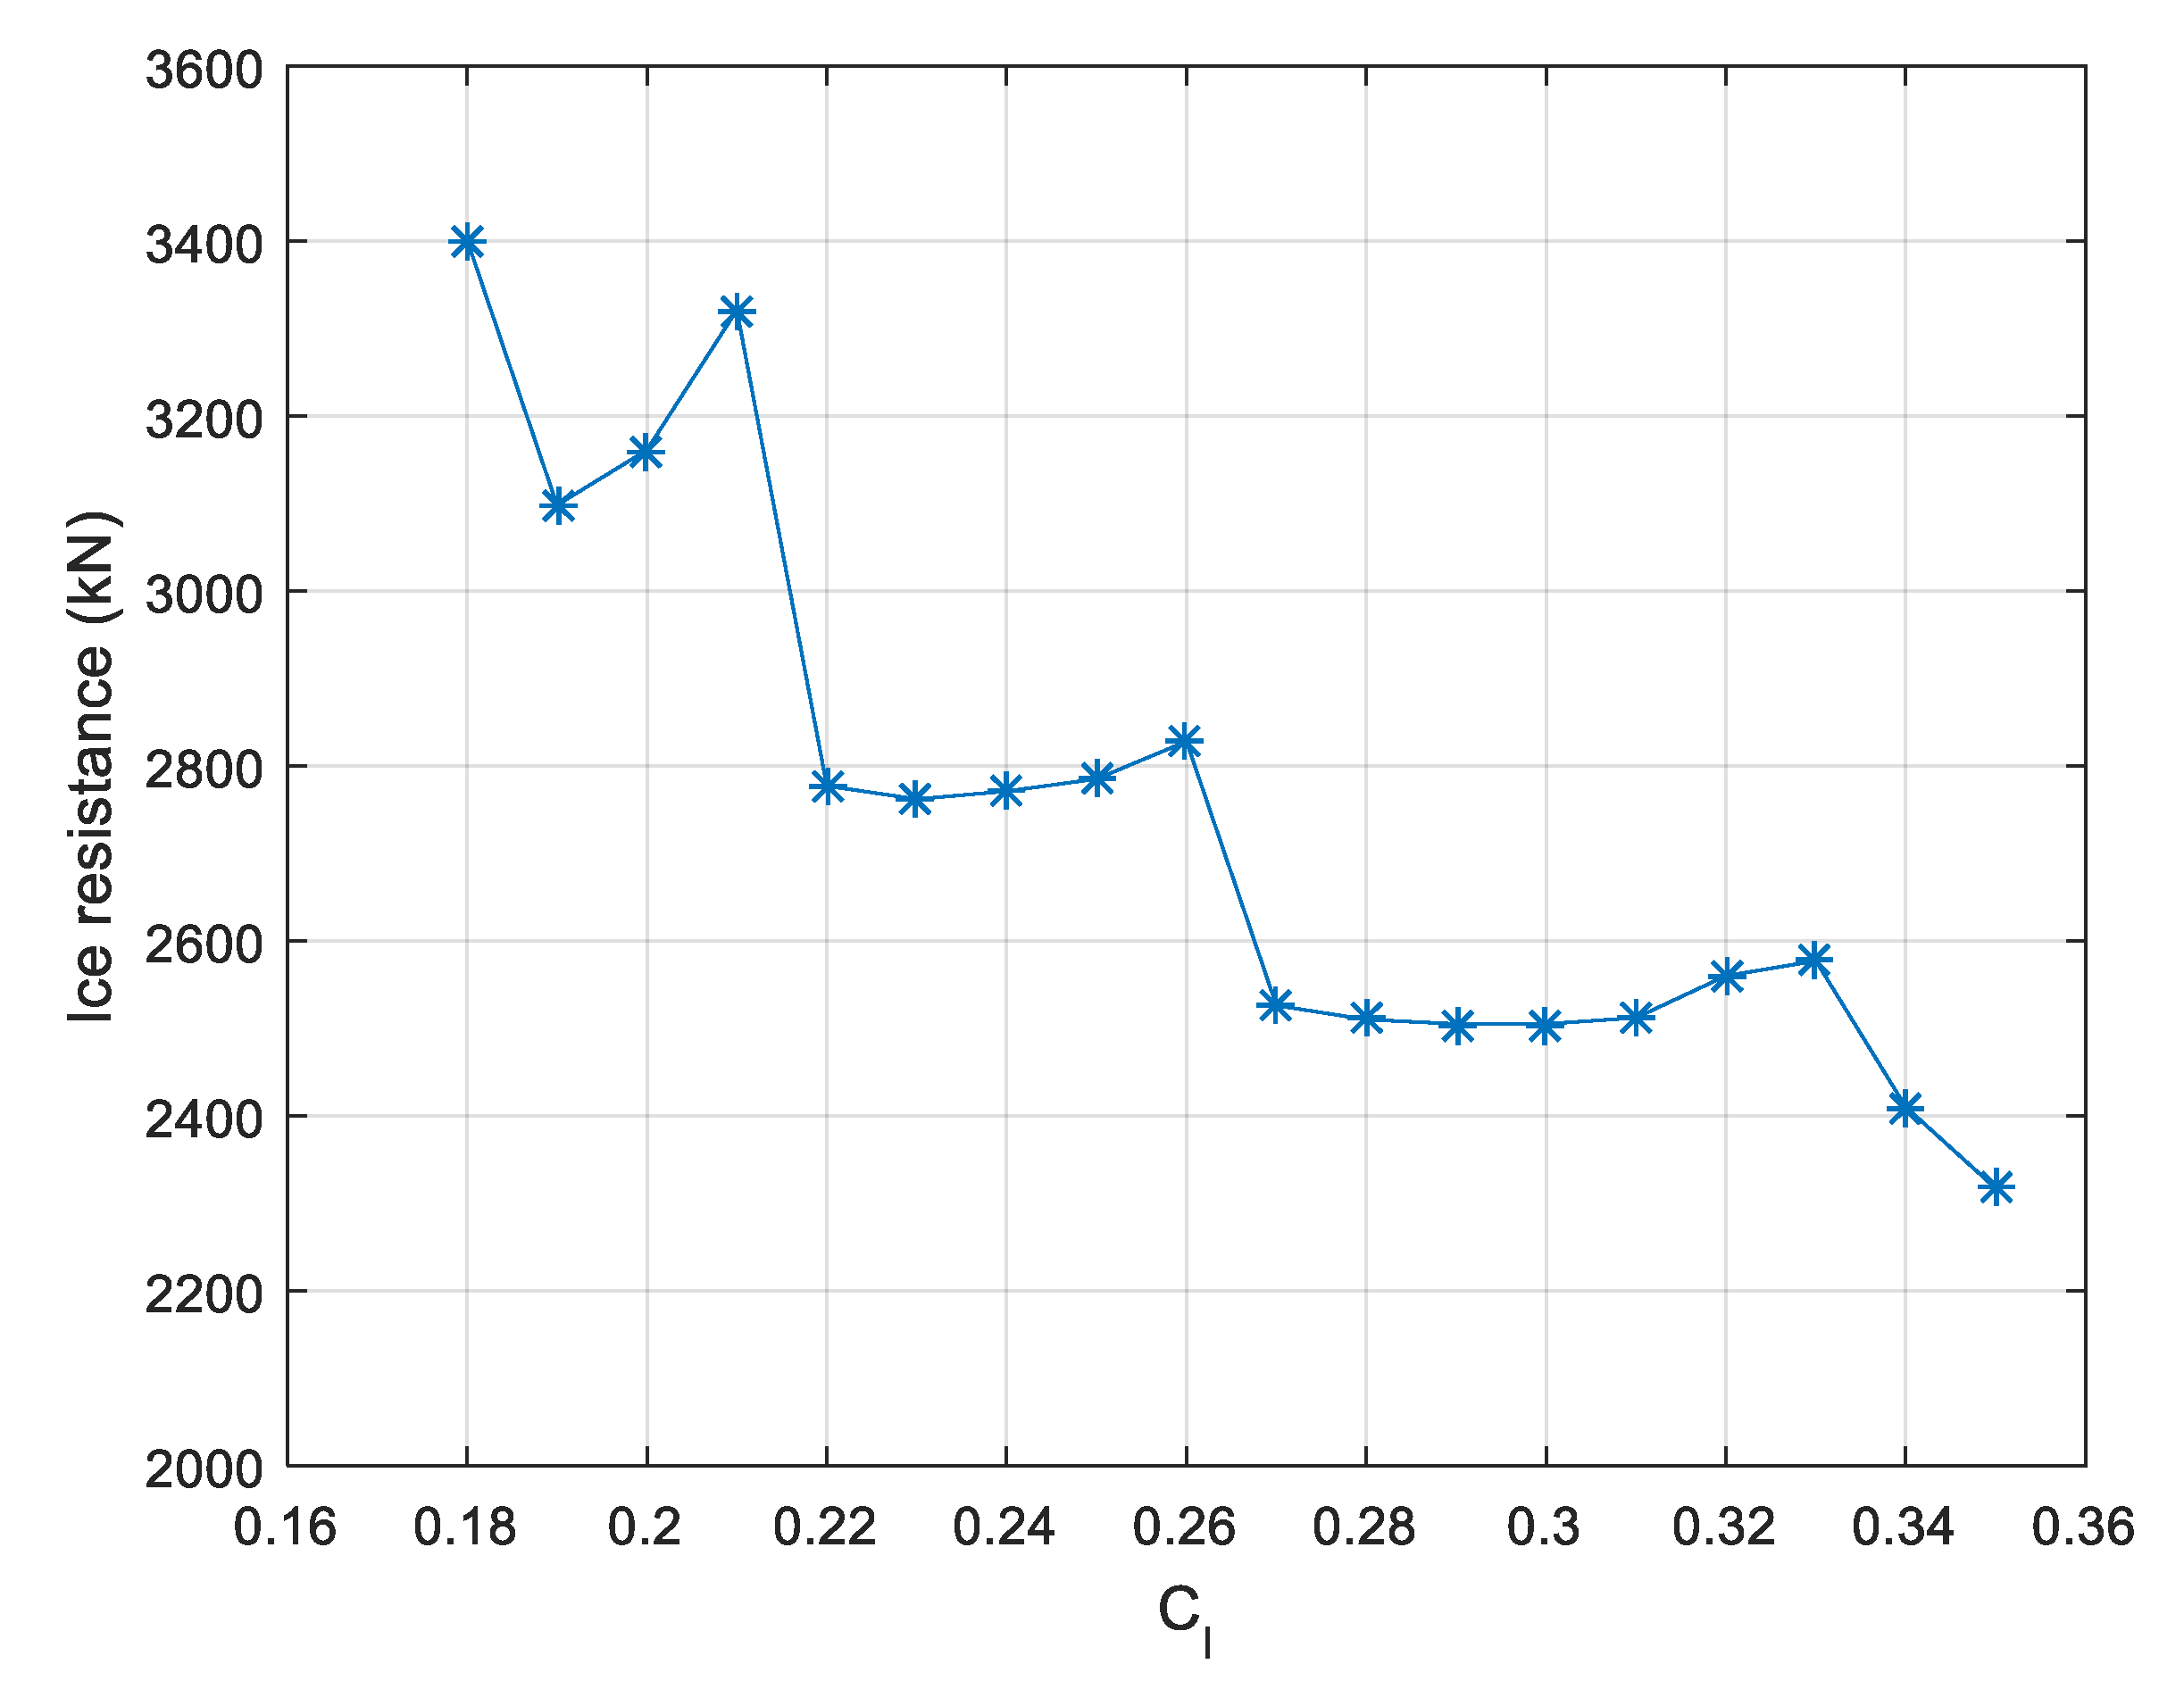
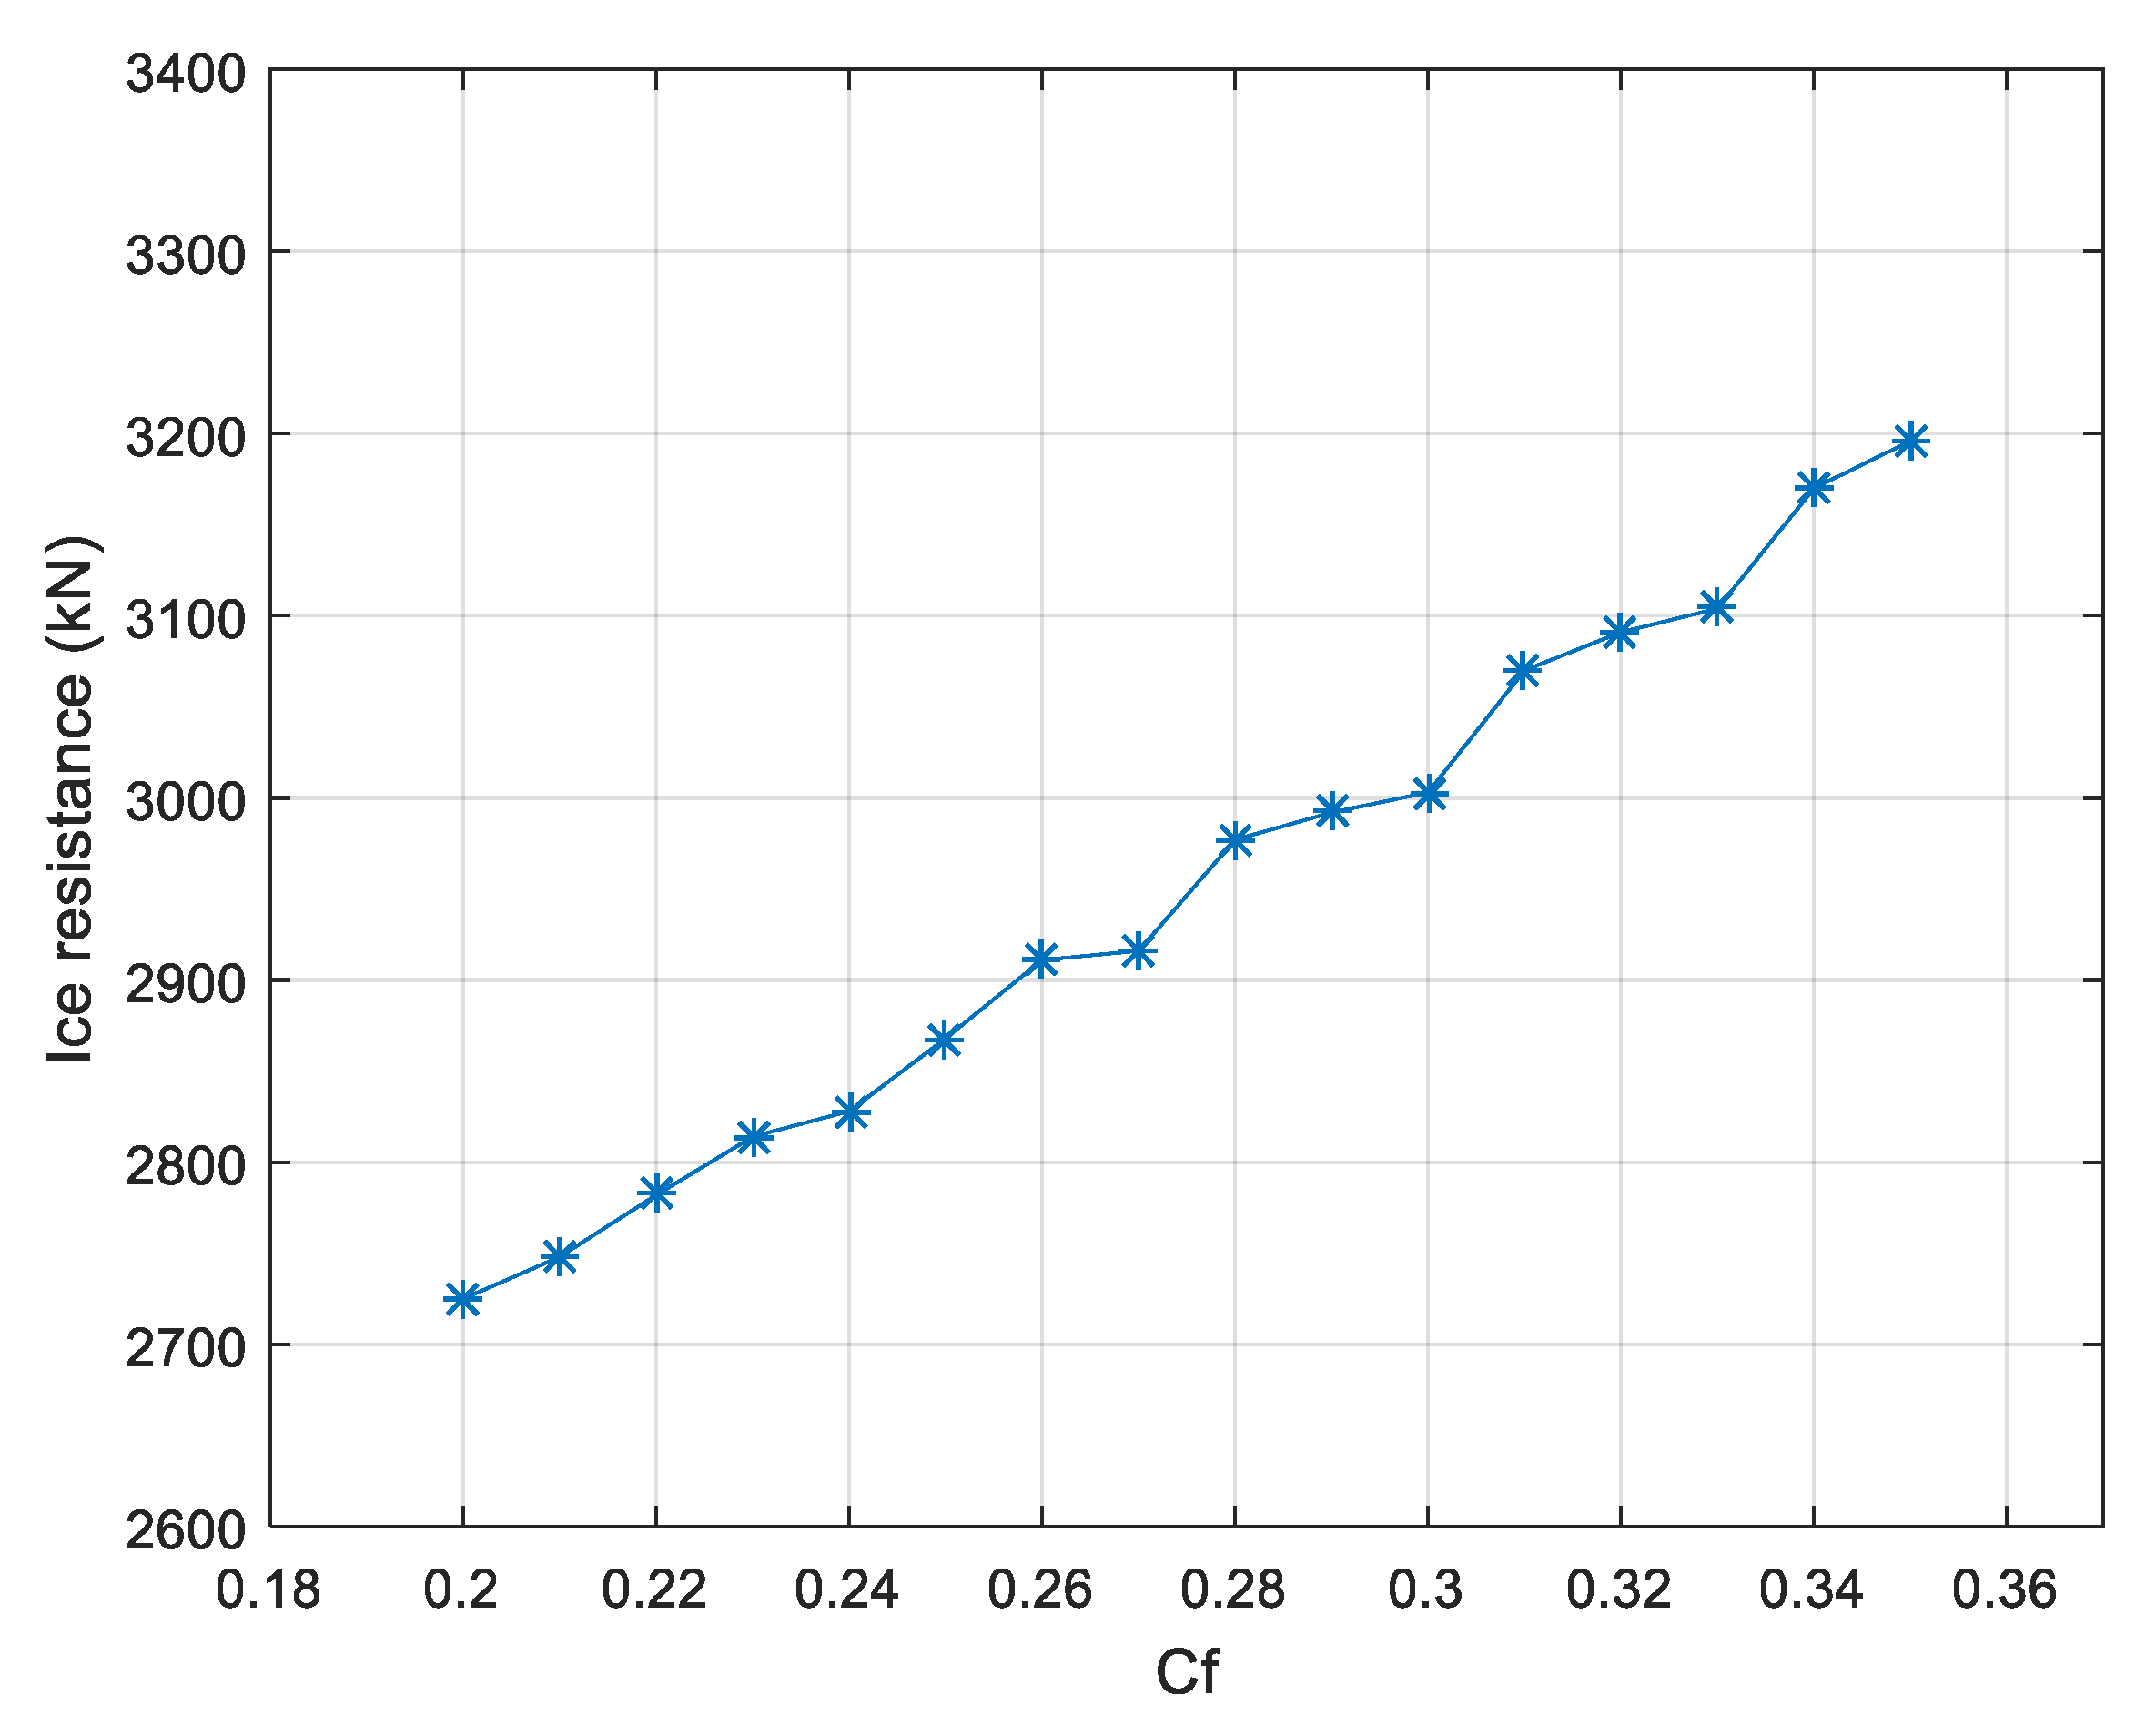
In addition, effects of speed-dependent icebreaking length coefficient Cl and bending capacity coefficient Cf were studied. In total, 18 icebreaking length coefficients ranging from 0.18 to 0.35 were considered in the simulation. The corresponding results are presented in Figure 15. It is shown in Figure 15 that as the icebreaking parameter Cl increases, the ice resistance decreases monotonously. Increasing Cl means large ice floe broken from intact ice sheet and long distance of travelling is needed before consequent collision. The impact of bending capacity coefficient Cf on ice resistance is given in Figure 16. It shows that the ice resistance increases as Cf increases in general. The relationship is almost linear. The ice resistance rises from 2730 kN to 3200 kN when the bending capacity coefficient increases from 0.20 to 0.35.
Figure 15.
Simulated global ice load as a function of Cl.
Figure 16.
Simulated global ice load as a function of Cf.
As shown in Figure 15 and Figure 16, ice resistance is very sensitive to the parameters Cf and Cl. This remains a question. In previous research, the parameters Cf and Cl were often selected based on measurements or ice resistance by some empirical formulas [,,,]. In fact, measurements are sometimes unavailable due to limited condition. Empirical formula brings different uncertainties. Therefore, we proposed a new formula which could be suitable for the simulation. The length of ice grid is equal to the icebreaking radius. By including two parameters Cvs and Cls, the icebreaking radius was expressed as
where
The ice bending capacity coefficient could be written as a function of relative velocity between ice and hull:
The following simulation was carried out based on the proposed method to determine the key factors Cf and Cl.
4.4. Ice Resistance Comparison
4.4.1. Icebreaking Ahead
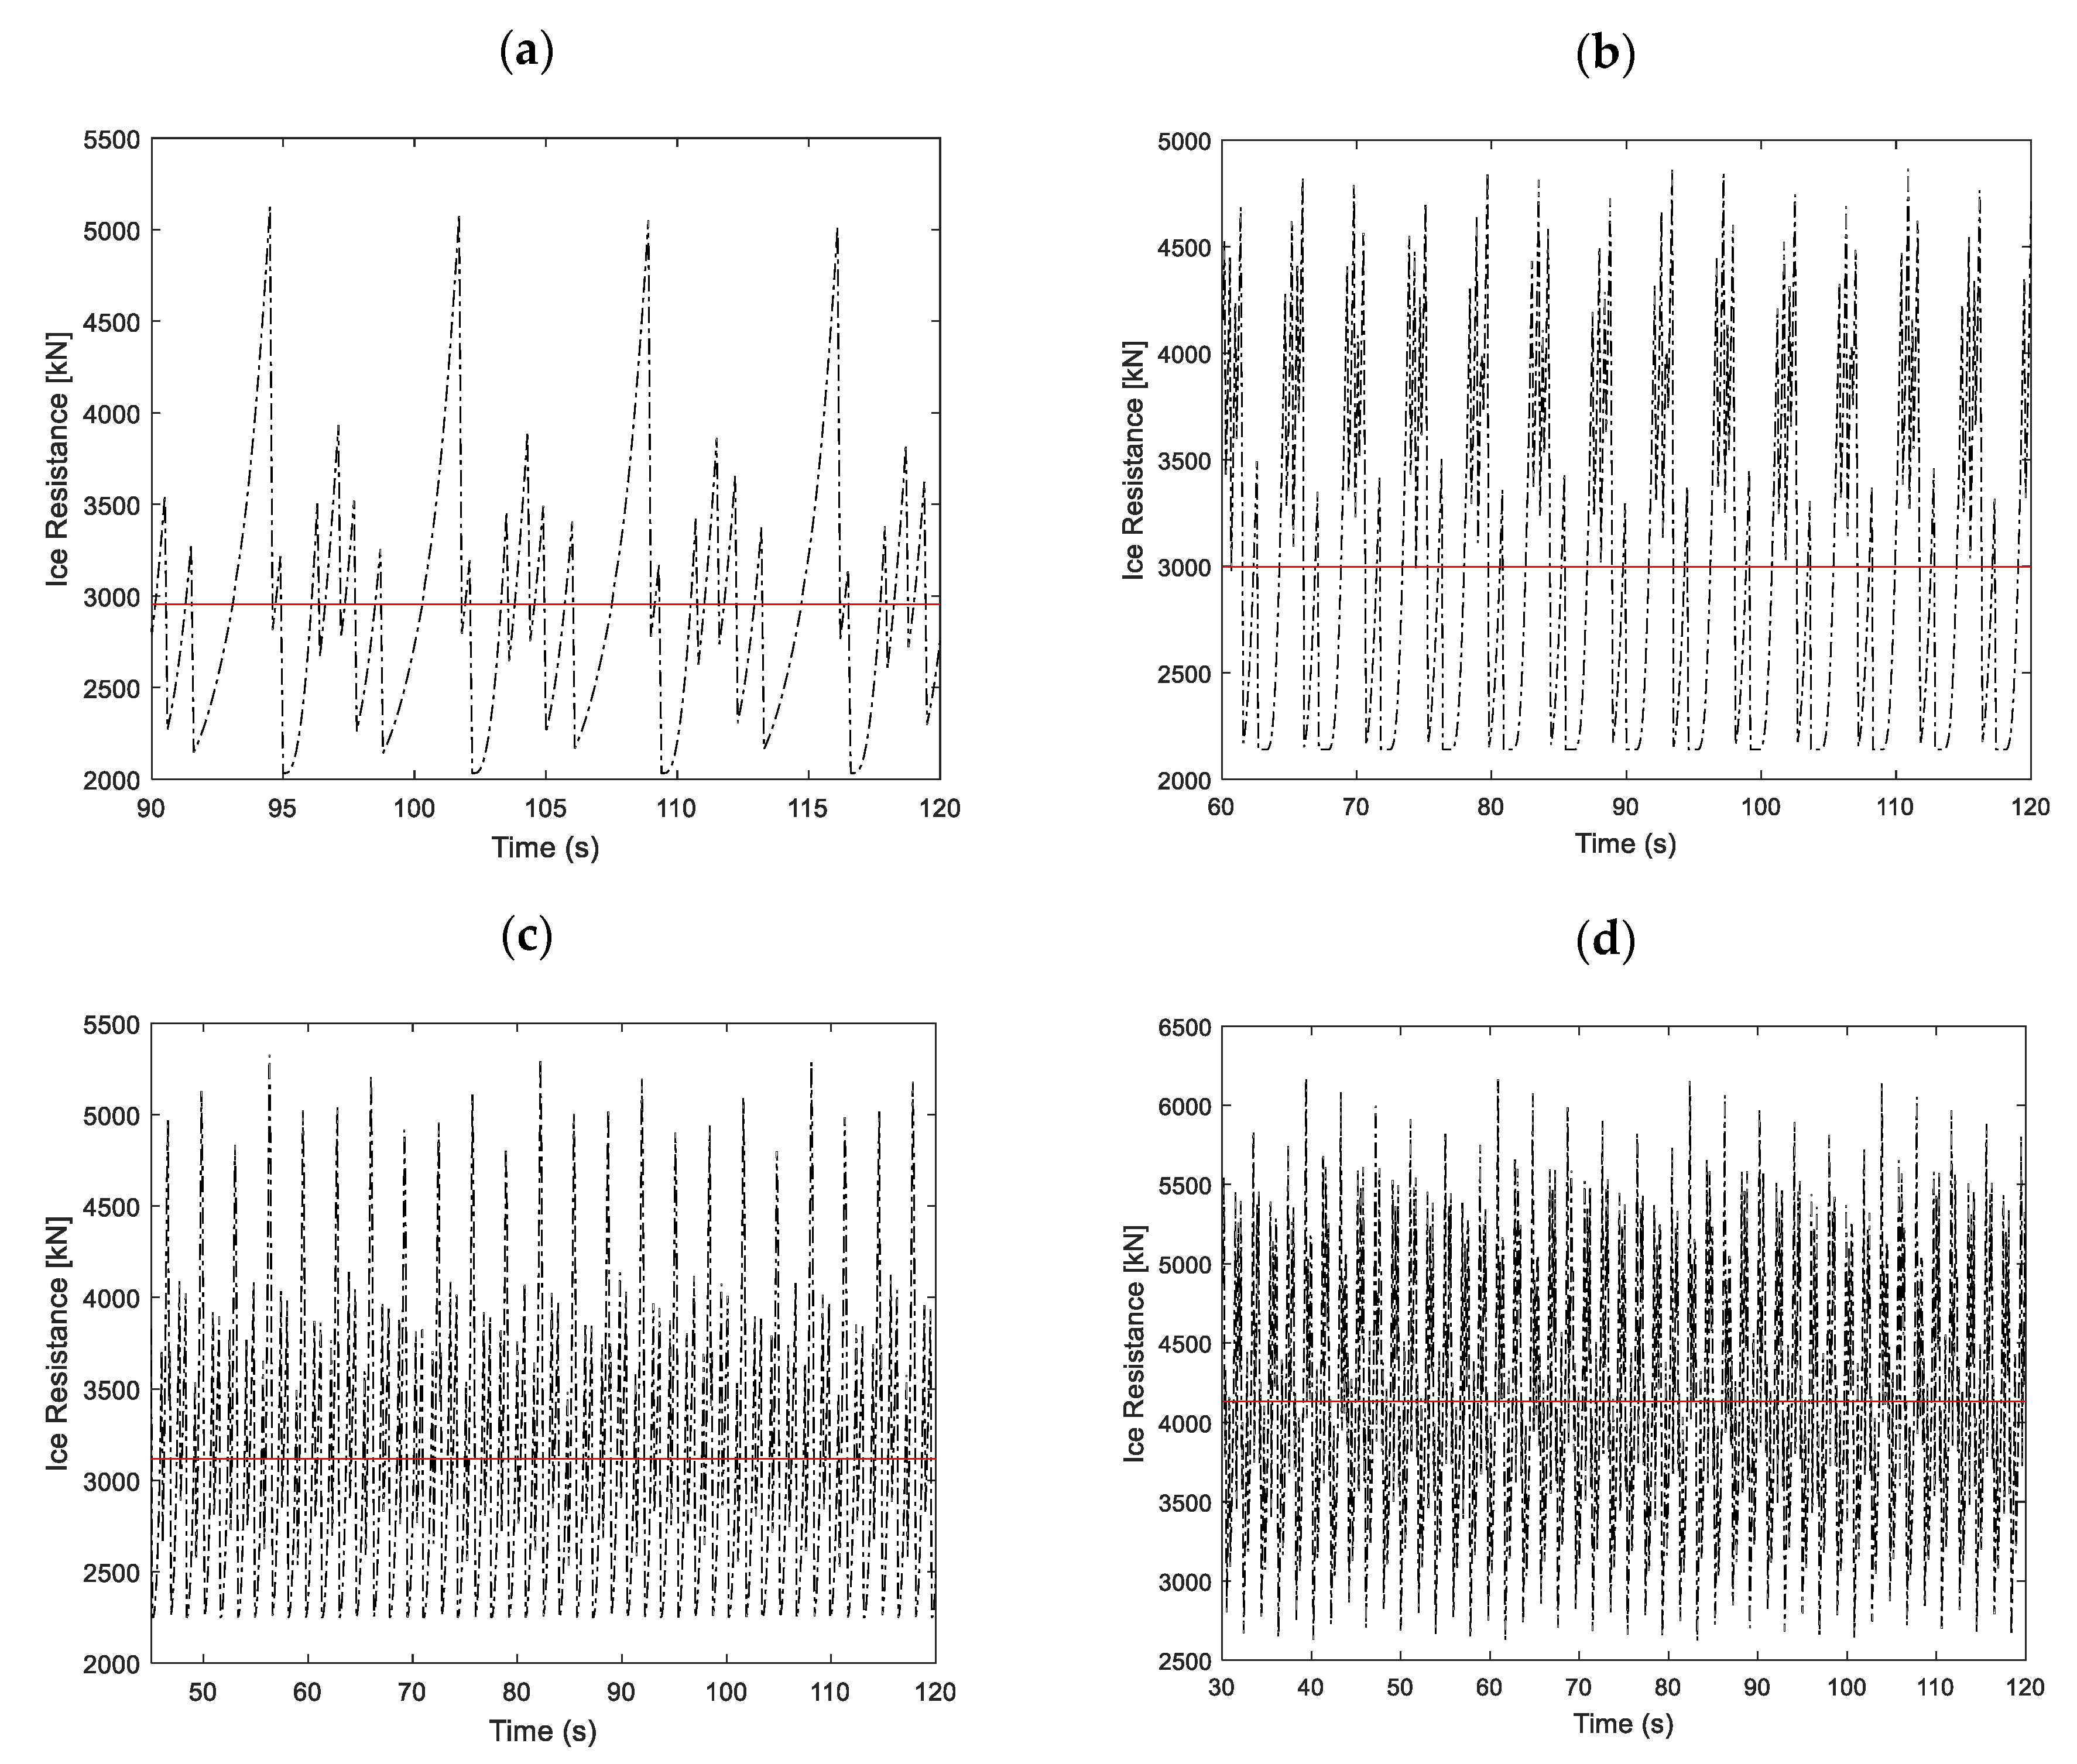
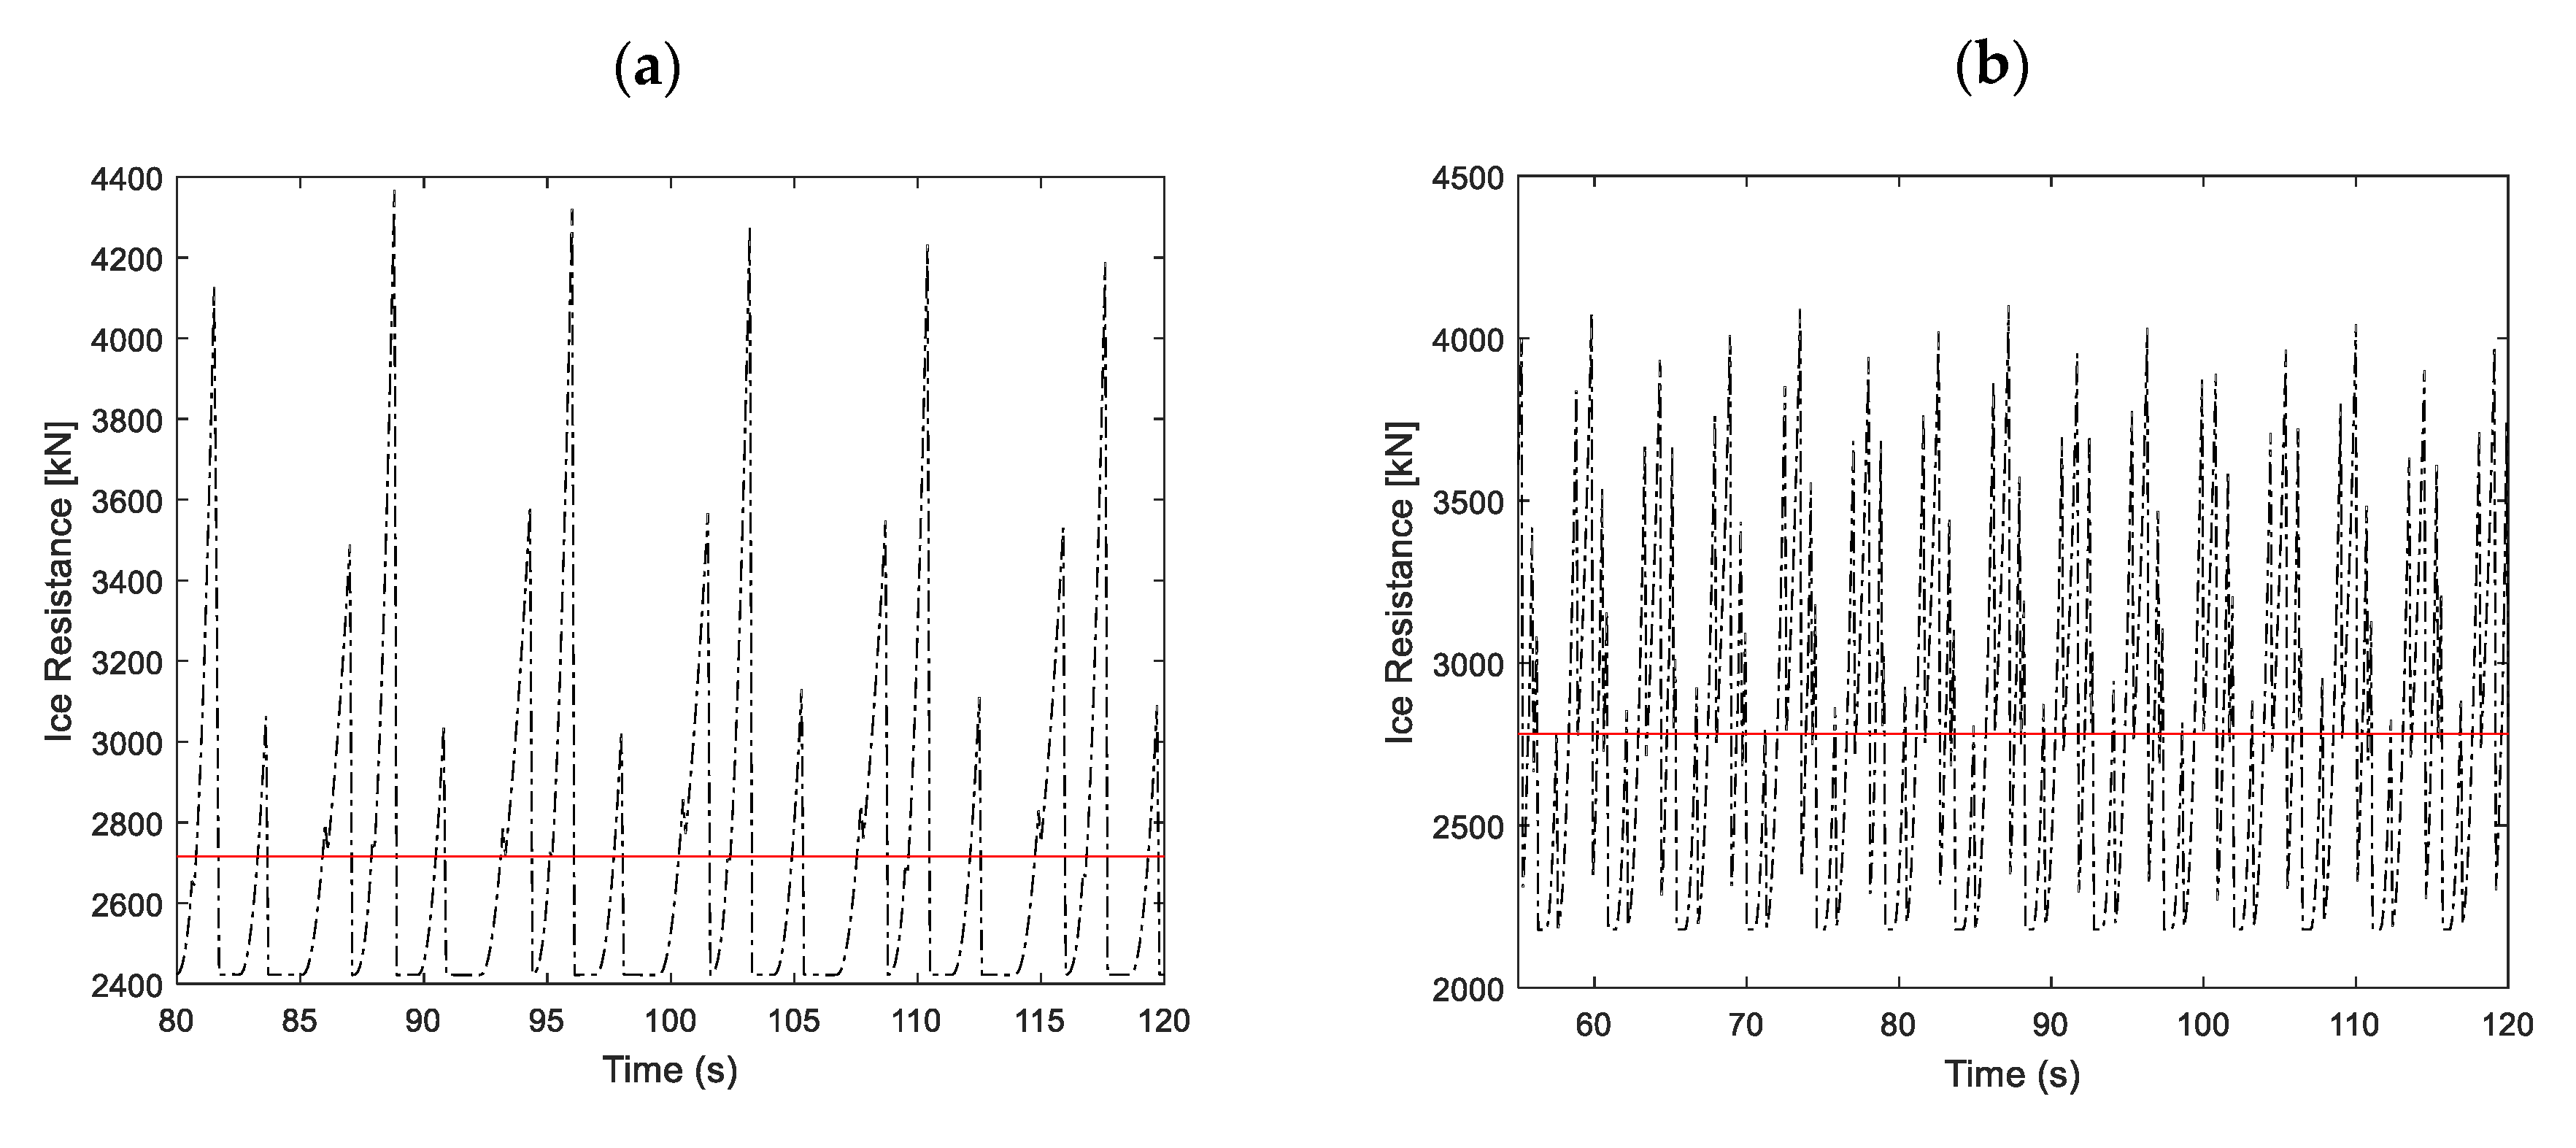
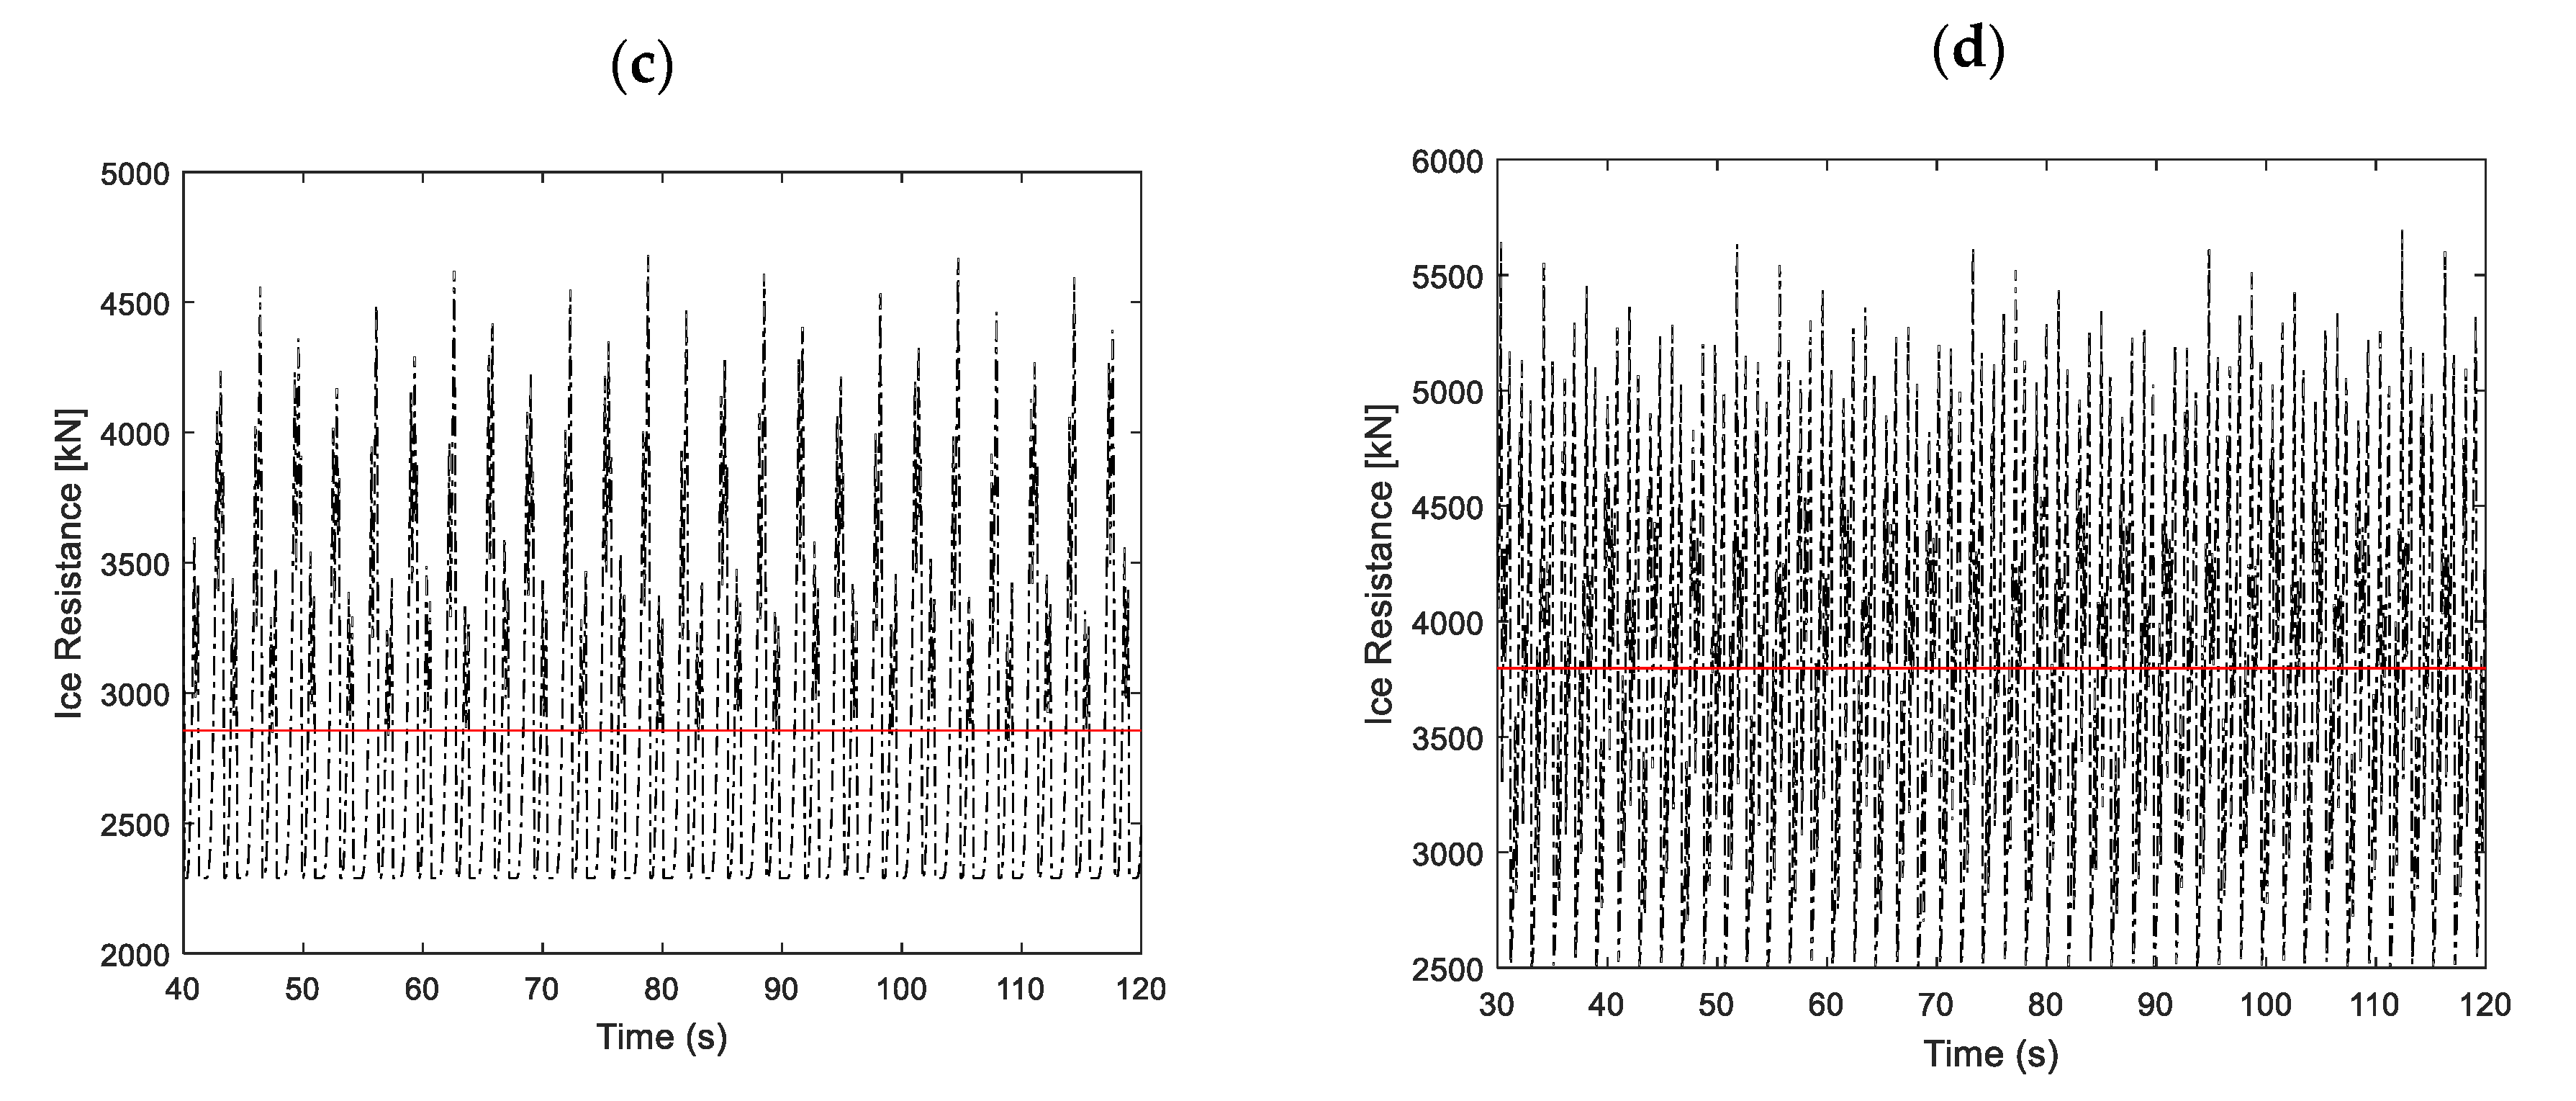
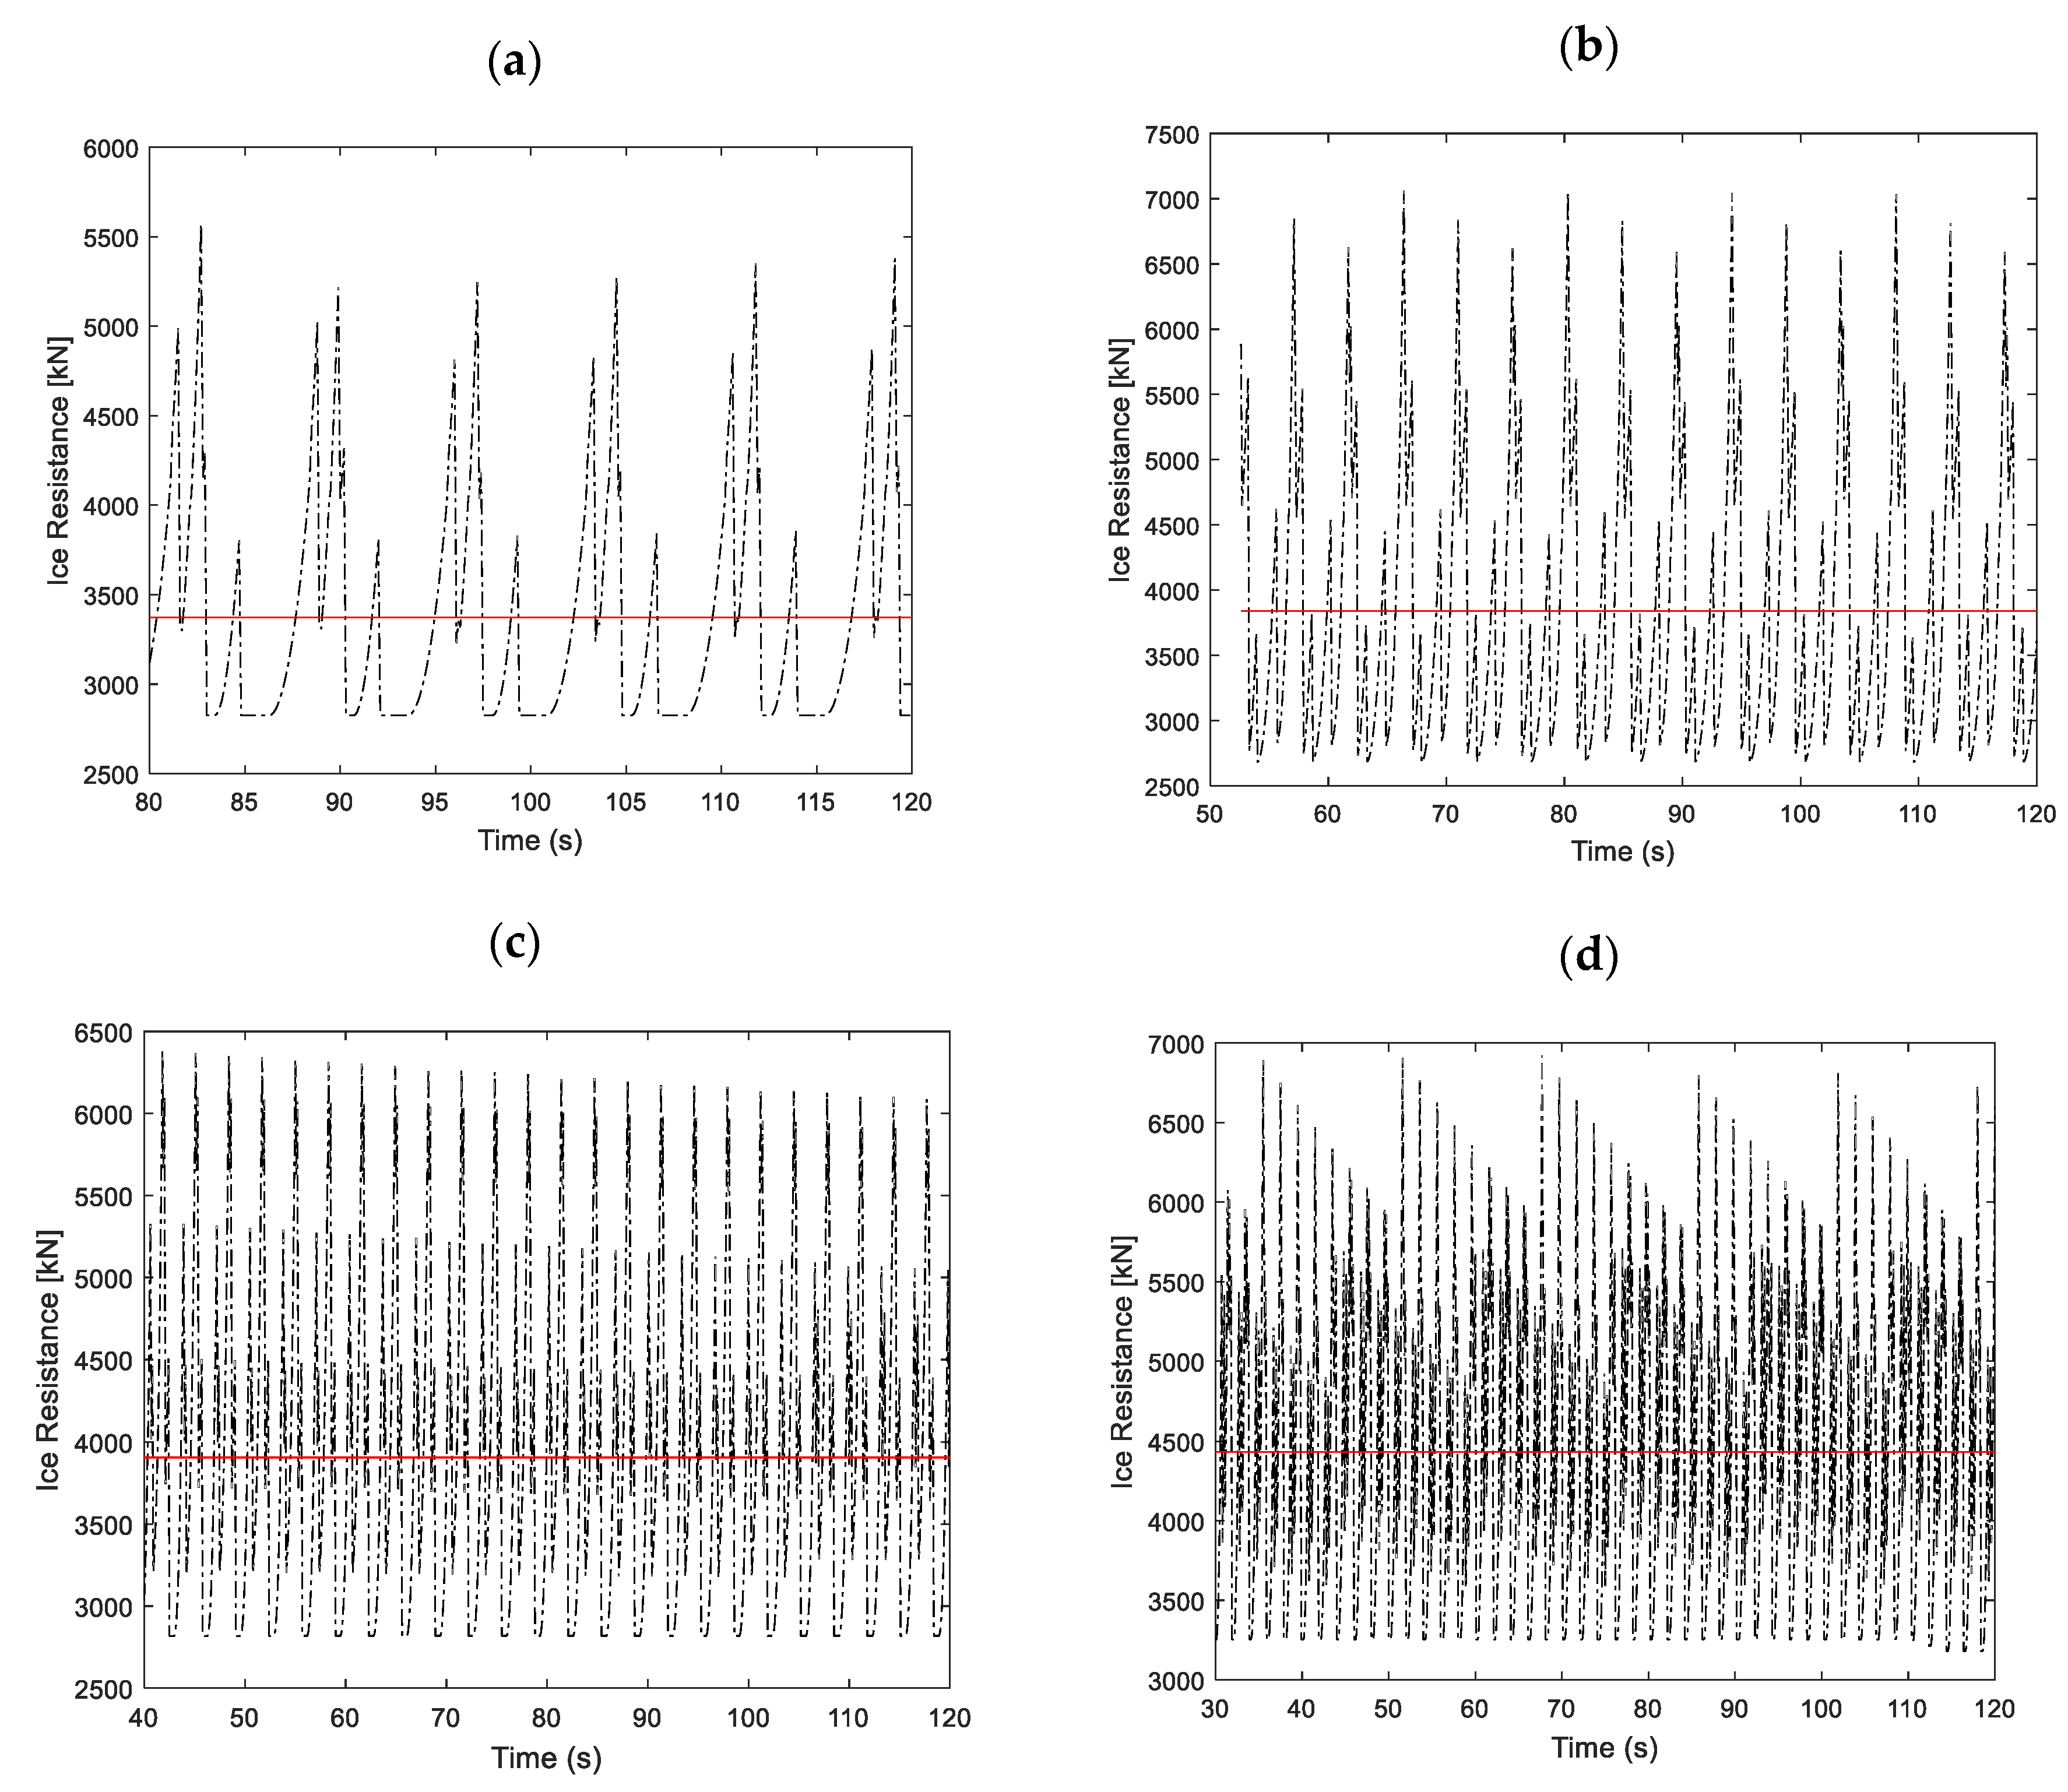
The ahead running tests were first considered with input parameters shown in Table 2 and Table 3. By using different towing speeds of the hull, four tests in ice sheet with a thickness of 1.3 m were simulated. The transition stage of ice force was ignored. The steady state was studied after the bow was completely inside the ice sheet. The time series of the ice force are shown in Figure 17. The time series of the ice force present a similar trend. The ice force is cyclic with several typical peaks. As the speed increases, the number of peaks increases because of the higher number of ice grid failures within the same time length. The maximum ice forces are around 5000 kN for Test 11~13 and 6000 kN for Test 14. Test 21~24 were also simulated by increasing ice thickness to 1.6m and the numerical results are displayed in Figure 18.
Figure 17.
Time series of the ice forces during the ahead running operation in ice sheet with a thickness of 1.3 m. (a) Test 11 (b) Test 12. (c) Test 13 (d) Test 14.
Figure 18.
Time series of the ice forces during the ahead running operation in ice sheet with a thickness of 1.6 m. (a) Test 21 (b) Test 22. (c) Test 23 (d) Test 24.
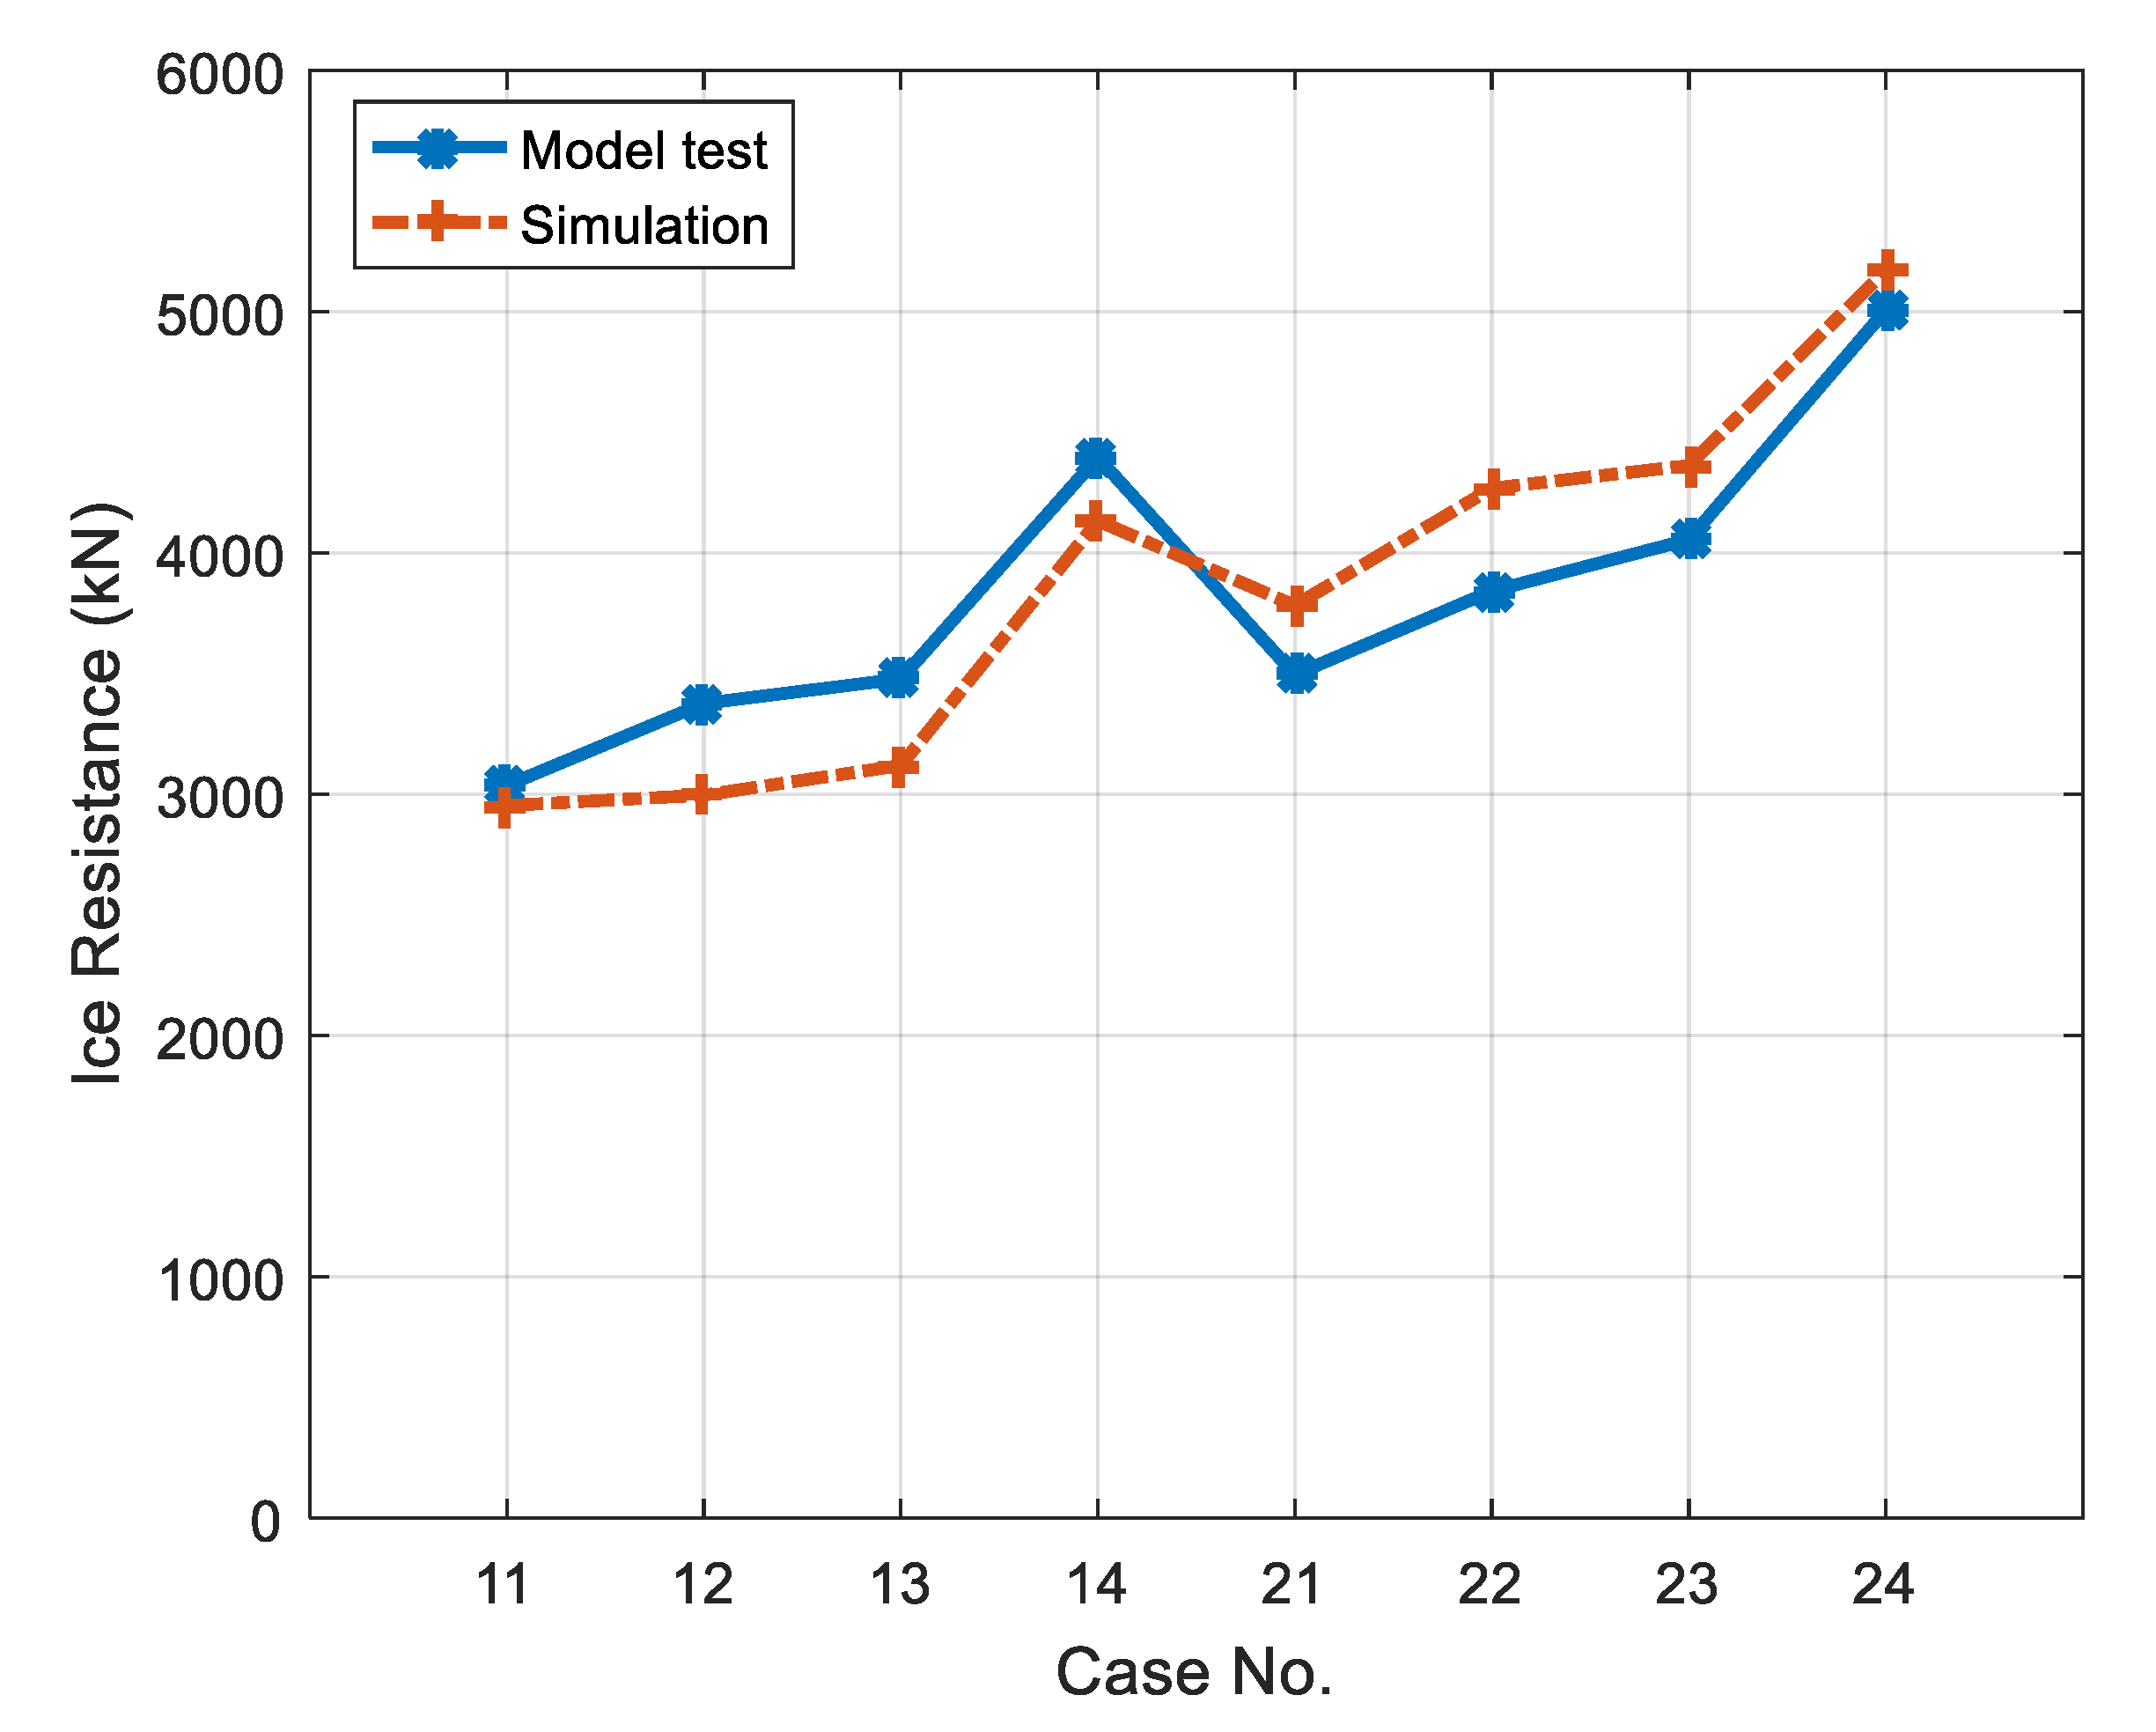
The ice force was averaged as ice resistance. The ice resistances derived from numerical simulation as well as model test were compared herein and are presented in Figure 19. It is indicated that the general trend of two curves agree well with each other. The ice resistance curves go up as the towing speed increases. The relative errors between the calculated and measured ice resistance values are discussed in a subsequent section.
Figure 19.
Comparison of the ice resistance for the ahead running mode.
4.4.2. Icebreaking Astern
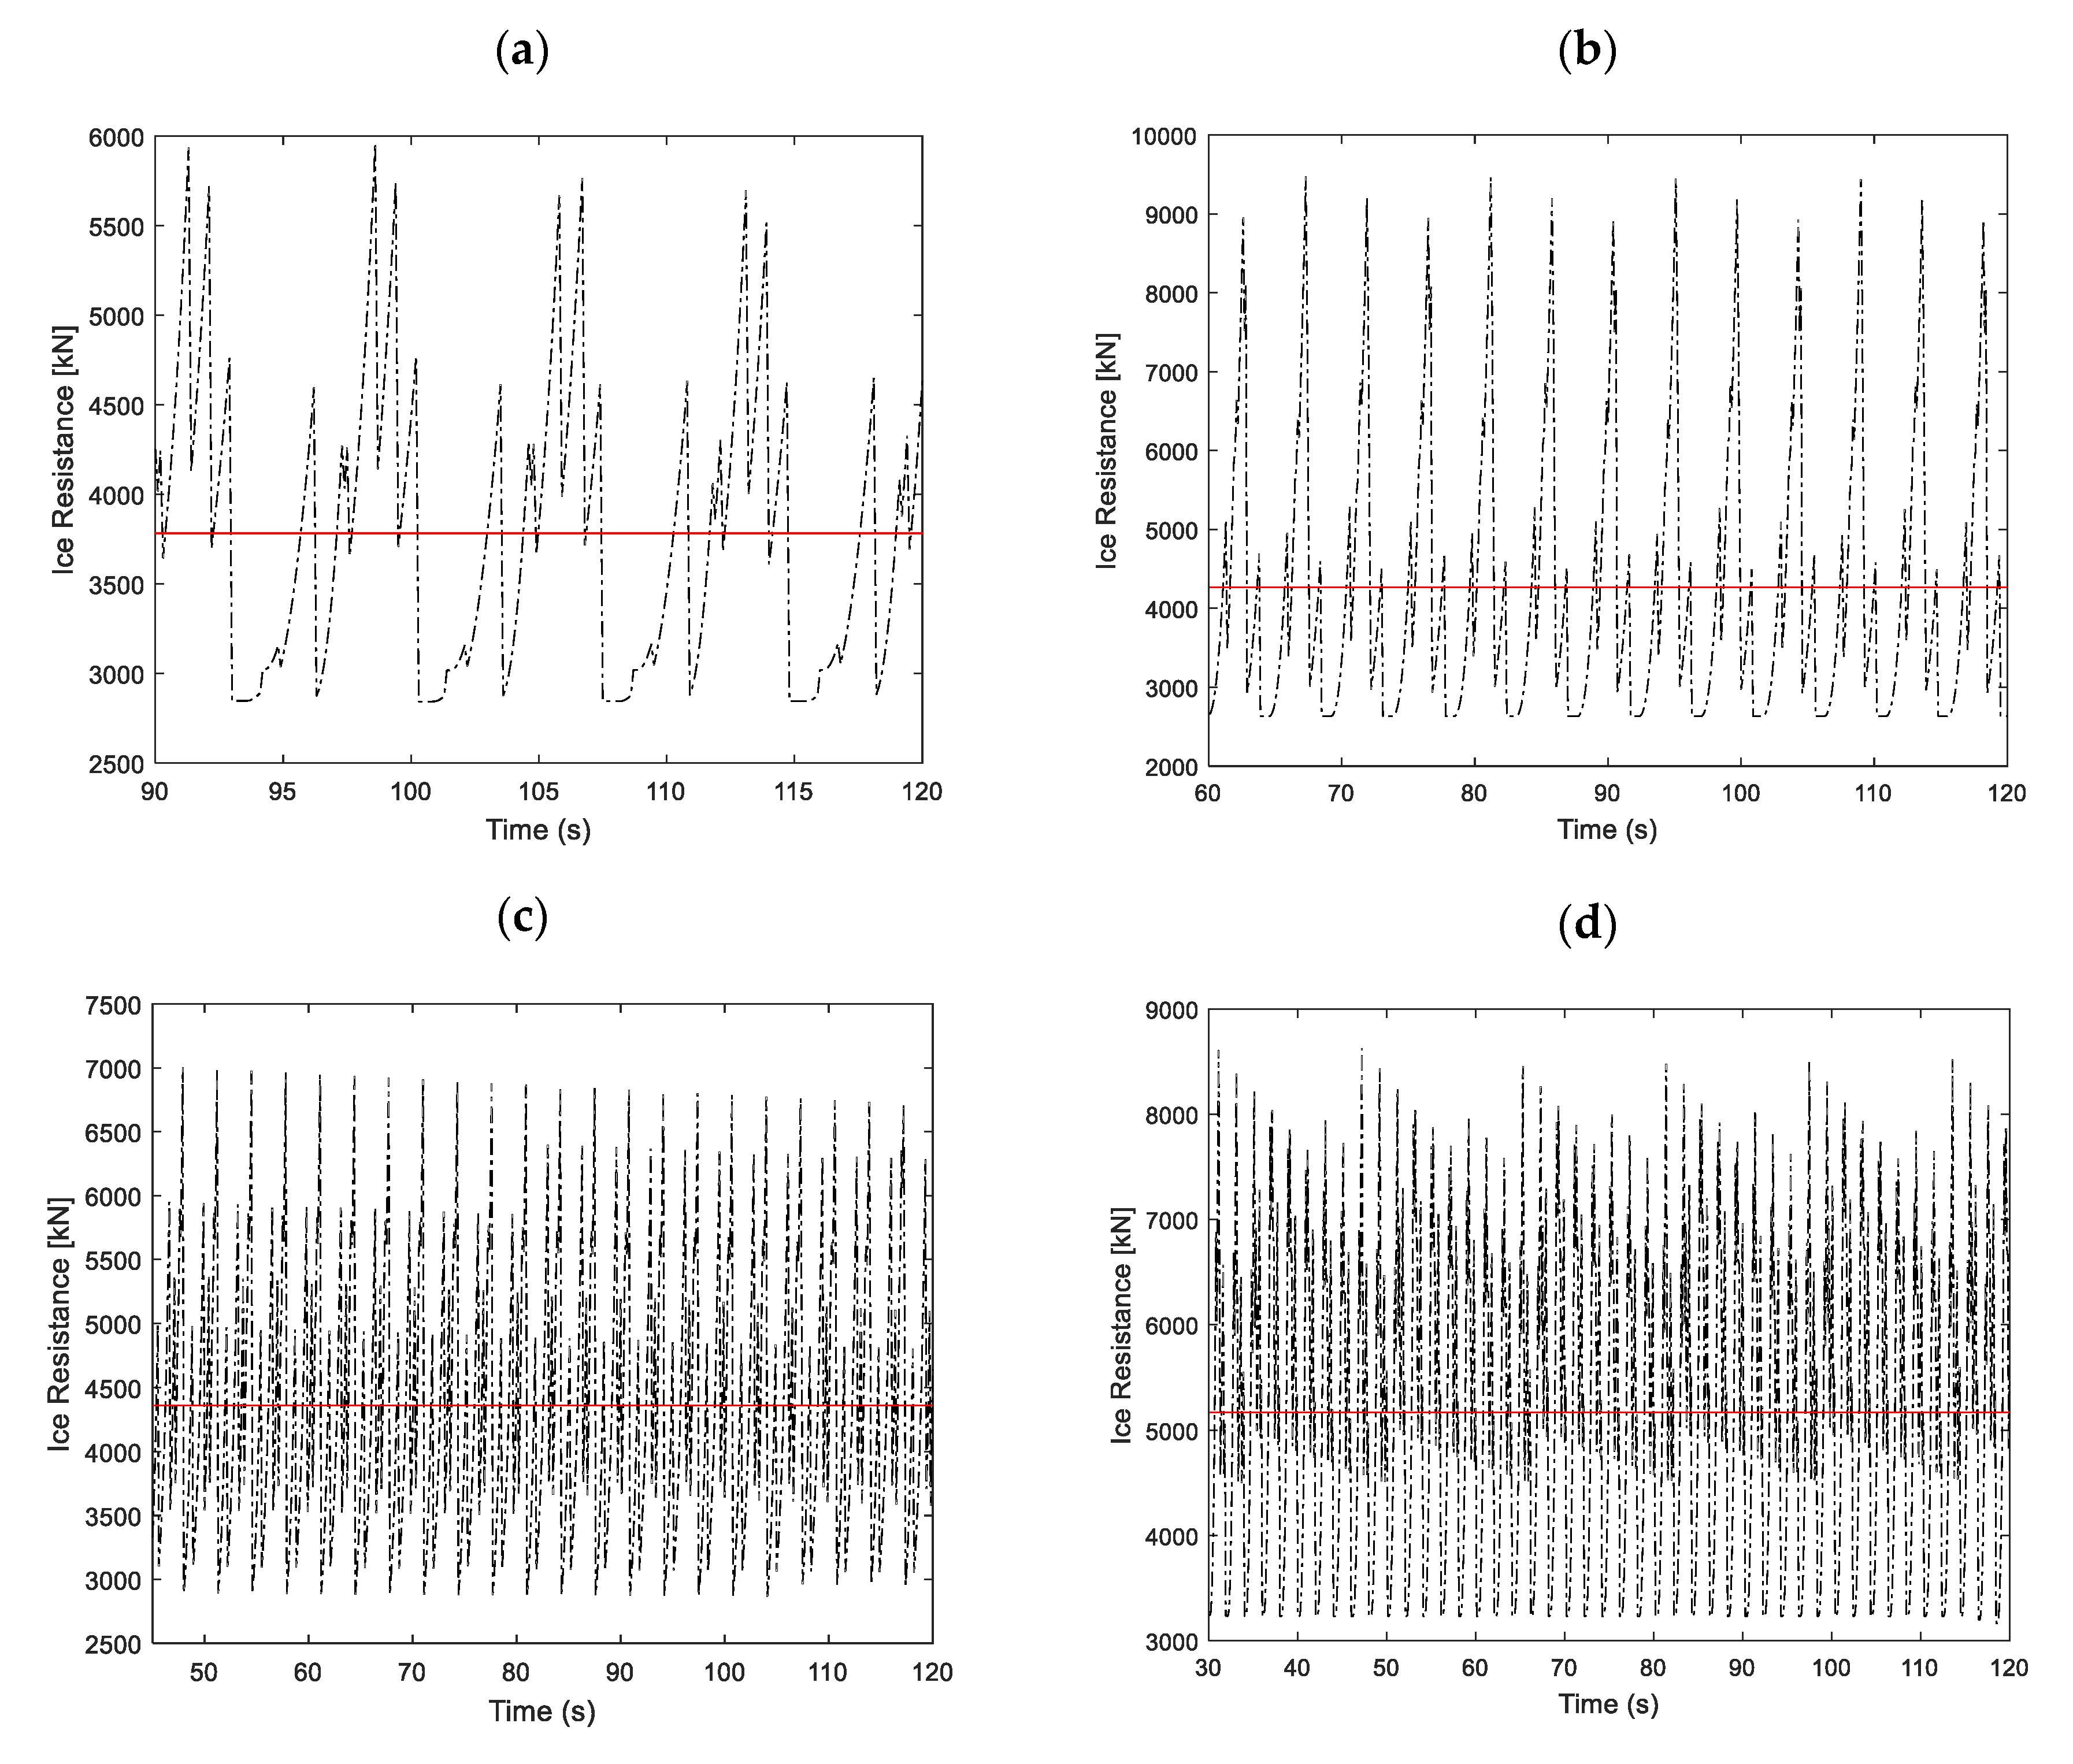
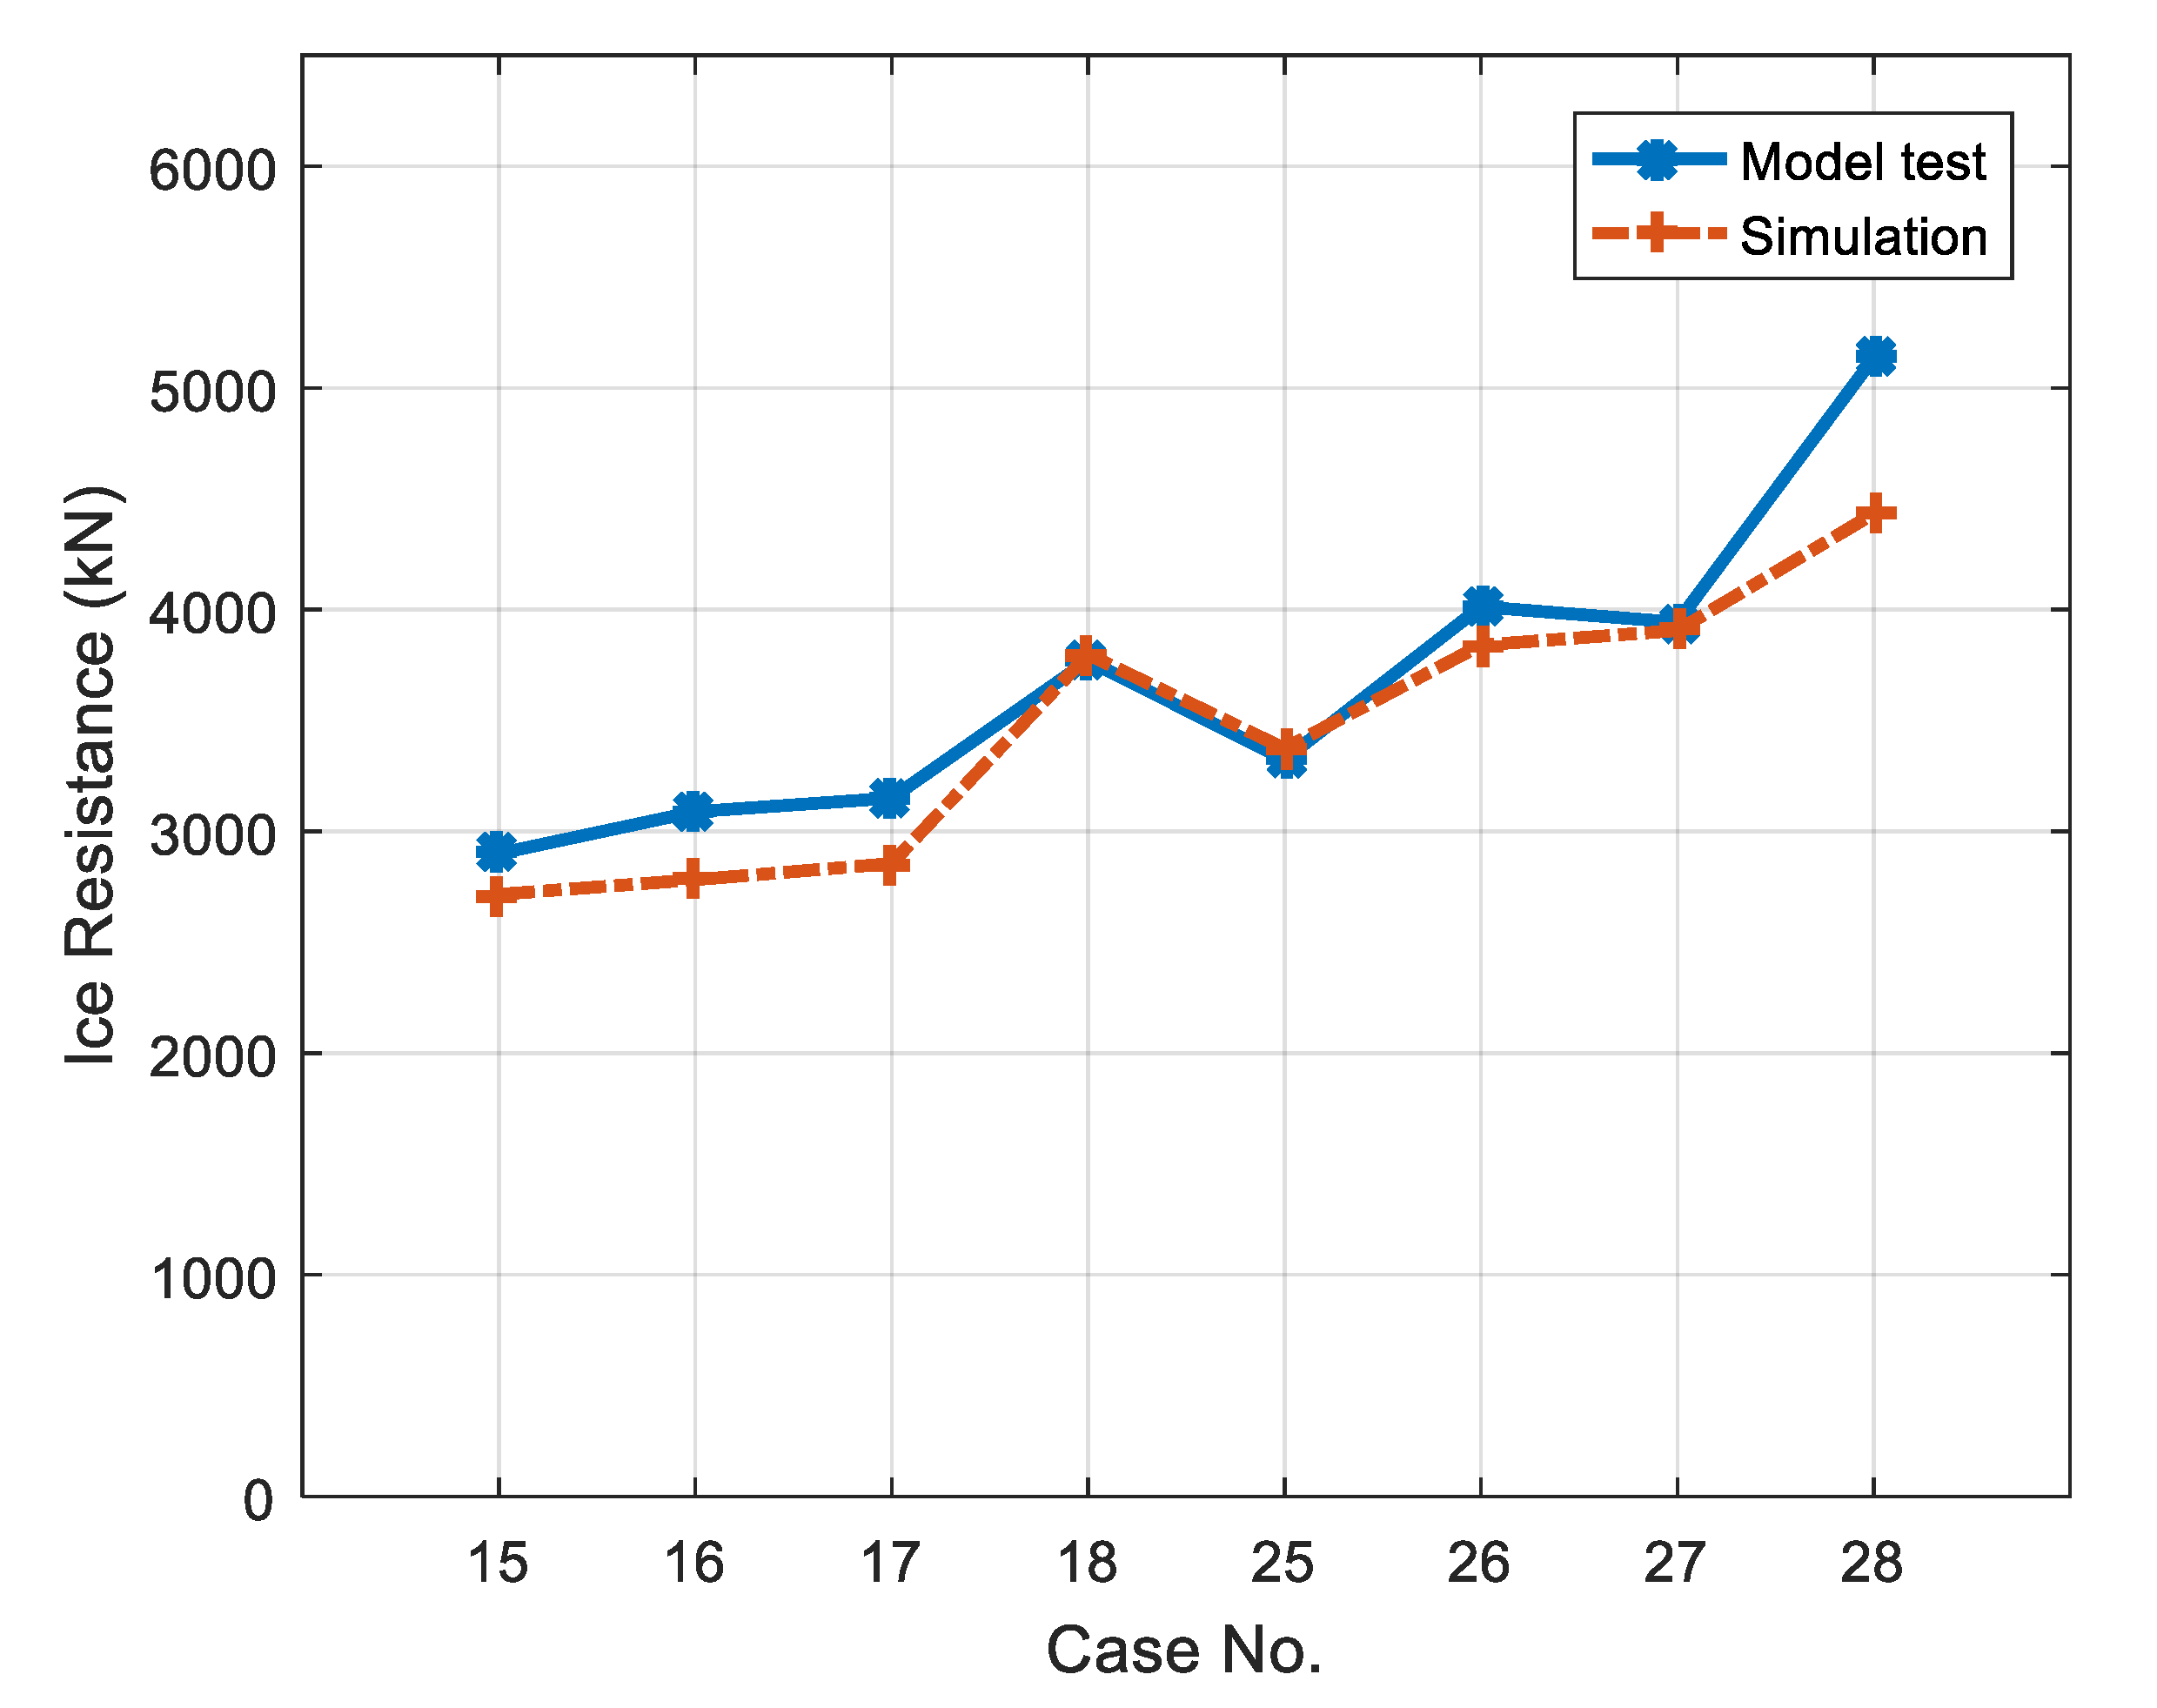
The astern running tests were included with the input parameters shown in Table 2 and Table 3 as well. Eight tests were simulated in ice sheets with thicknesses of 1.3 and 1.6 m with different towing speeds of the hull. The time series of the ice force at the steady state are shown in Figure 20 for Tests 15~18 and Figure 21 for Tests 25~28. The simulated and measured ice resistances are compared in Figure 22.

Figure 20.
Time series of the ice forces during the astern running operation in ice sheet with a thickness of 1.3 m. (a) Test 15 (b) Test 16. (c) Test 17 (d) Test 18.
Figure 21.
Time series of the ice forces during the astern running operation in ice sheet with a thickness of 1.6 m. (a) Test 25 (b) Test 26 (c) Test 27 (d) Test 28.
Figure 22.
Comparison of the ice resistance for the astern running mode.
The discrepancy between the model test and simulation results are summarized in Table 4 for all the tests. The minimum absolute error is 0.7% while the maximum is up to 13.7%. The average absolute error is 6.7%. With the assistance of aft propellers, the astern running operation causes a lower ice resistance than the ahead running operation in a 1.3-m-thick ice sheet.
Table 4.
Comparison of the ice resistance for all tests from the model test and simulation.
4.5. Comparison of Icebreaking Capability
4.5.1. Static Method
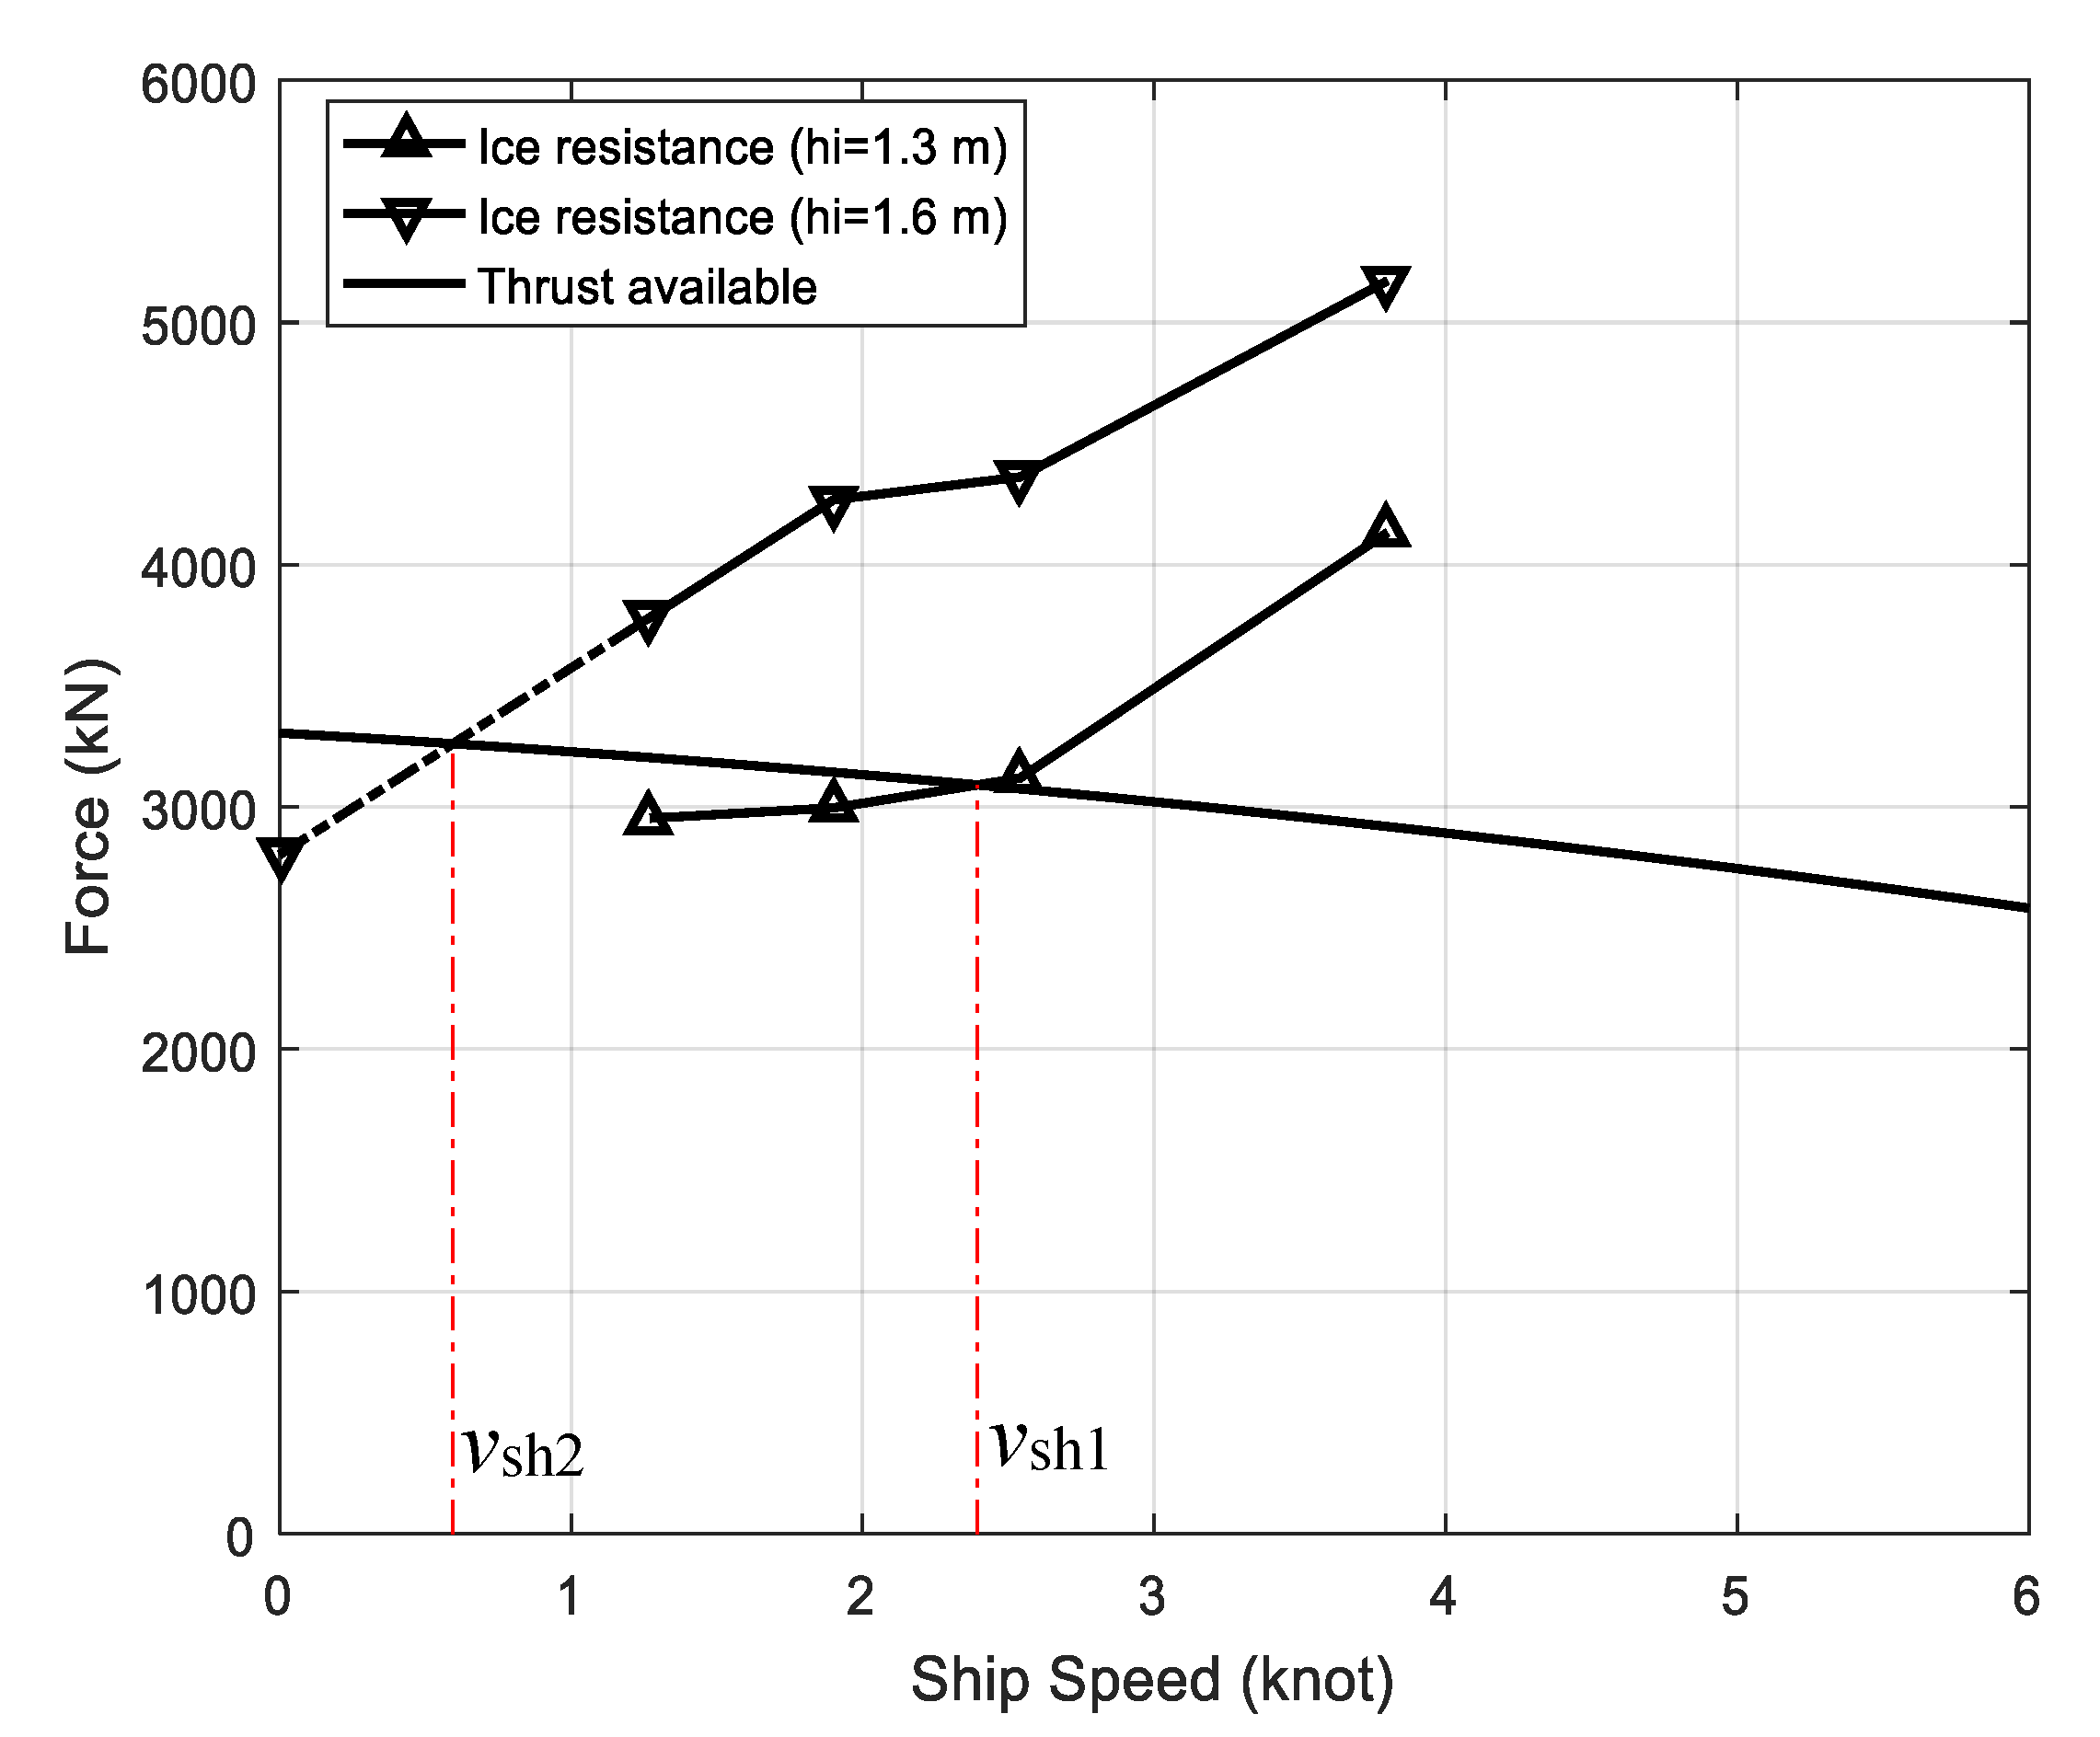
As described above, the static method is based on the static balance of the ice resistance and thrust delivered by propellers. The bollard for the heading forward operation is 3305 kN and the open water speed of the ship could reach up to 16 kn. The thrust curve as a function of ship speed is calculated according to Equation (3) and presented in Figure 23. The simulated ice resistances are also plotted in Figure 23 for all the ahead running tests. For the curve composed of tests with an ice thickness of 1.3 m, the ice resistance counteracts 3261 kN thrust. The ship speed vsh1 at balance is 2.39 kn. For the curve of the tests with an ice thickness of 1.6m, there is no intersection with the thrust curve. The ice resistance has to be extrapolated as a dashed line in Figure 23. The corresponding speed vsh2 is 0.59 kn at the intersection.
Figure 23.
Simulated ice resistance and evaluated thrust as a factor of ship speed for ahead running.
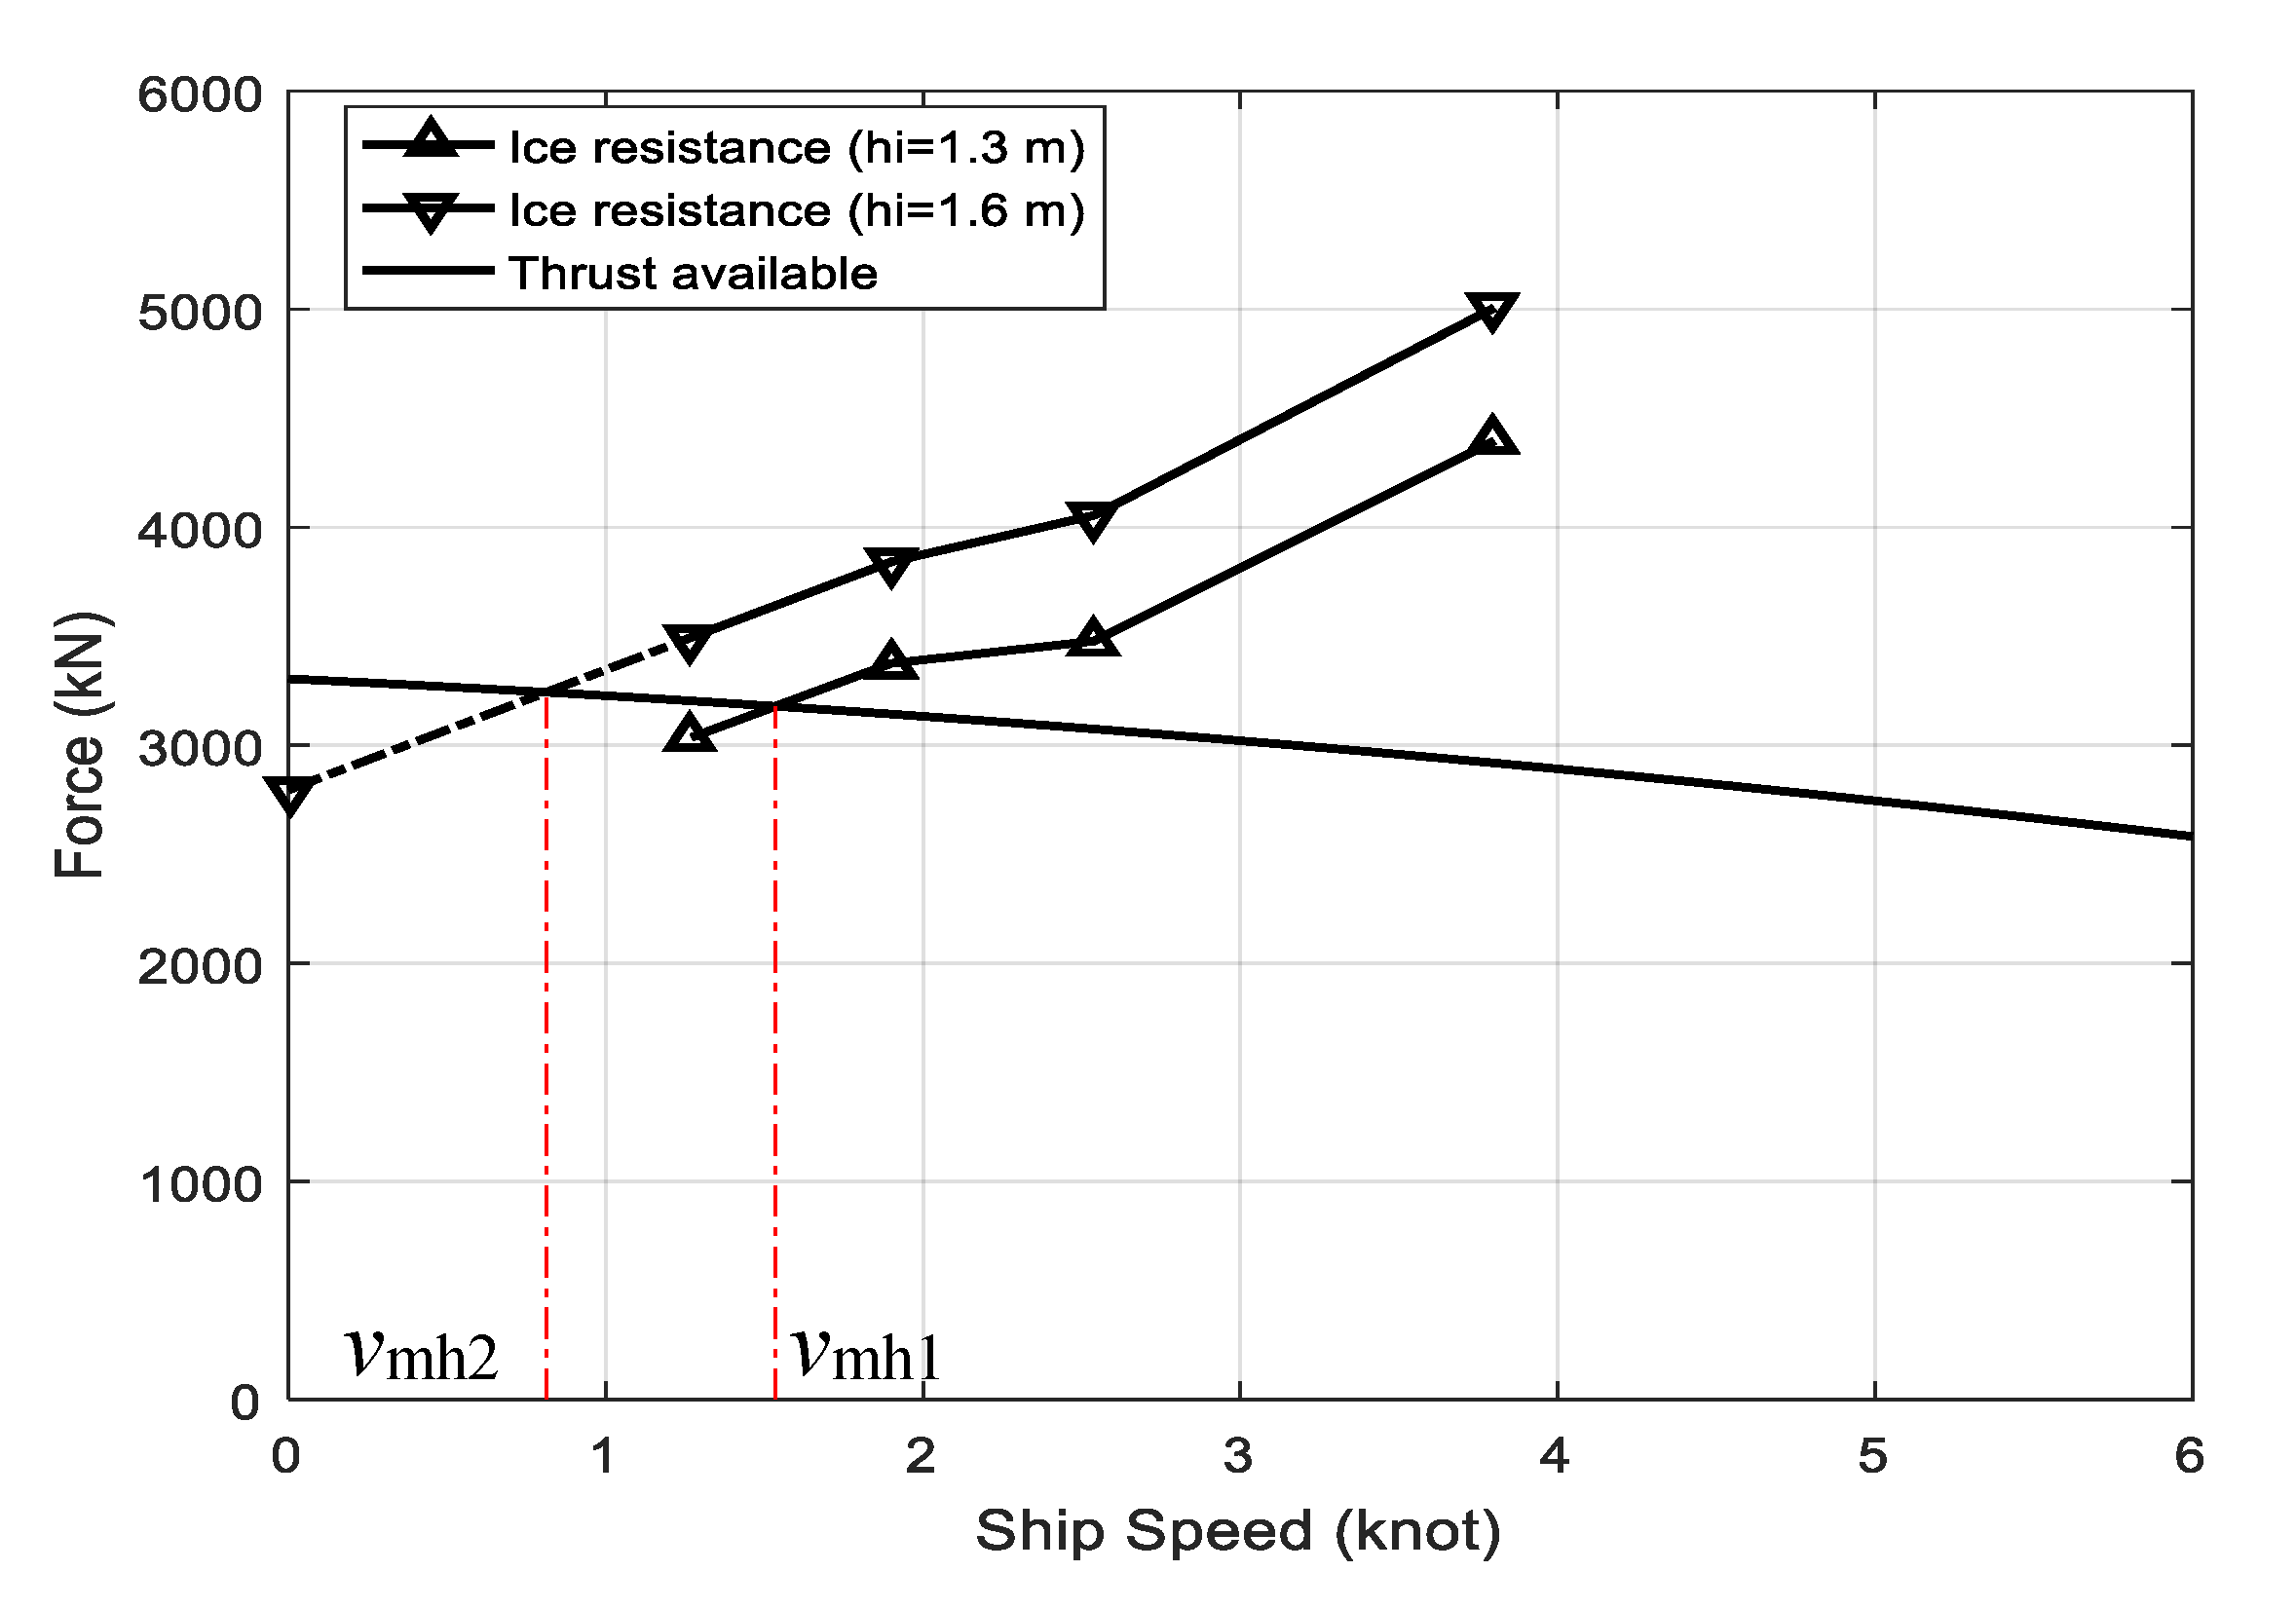
The measured ice resistances and evaluated thrust force are shown in Figure 24 for all the ahead running tests. For the curve composed of the tests with an ice thickness of 1.3 m, the ice resistance counteracts thrust with 3179 kN. The ship speed vmh1 at balance is 1.54 kn. For the curve with an ice thickness of 1.6 m, there is no intersection with the thrust curve. The ice resistance has to be extrapolated as a dashed line in Figure 24. The corresponding speed vmh2 is 0.81 kn at the intersection.
Figure 24.
Measured ice resistance and evaluated thrust as a factor of ship speed for ahead running.
The ice thickness–speed curve (h–v curve) is derived based on the obtained ship speeds. The results of the h–v curve are shown in Figure 25. It is indicated that at the astern running speed of 1 knot, the ice-breaking capability is 1.52 m based on the measurement and 1.53 m from the simulation. The simulated result is close to the measured value.
Figure 25.
h–v curves from the measurement and the simulation using the static method for ahead running.
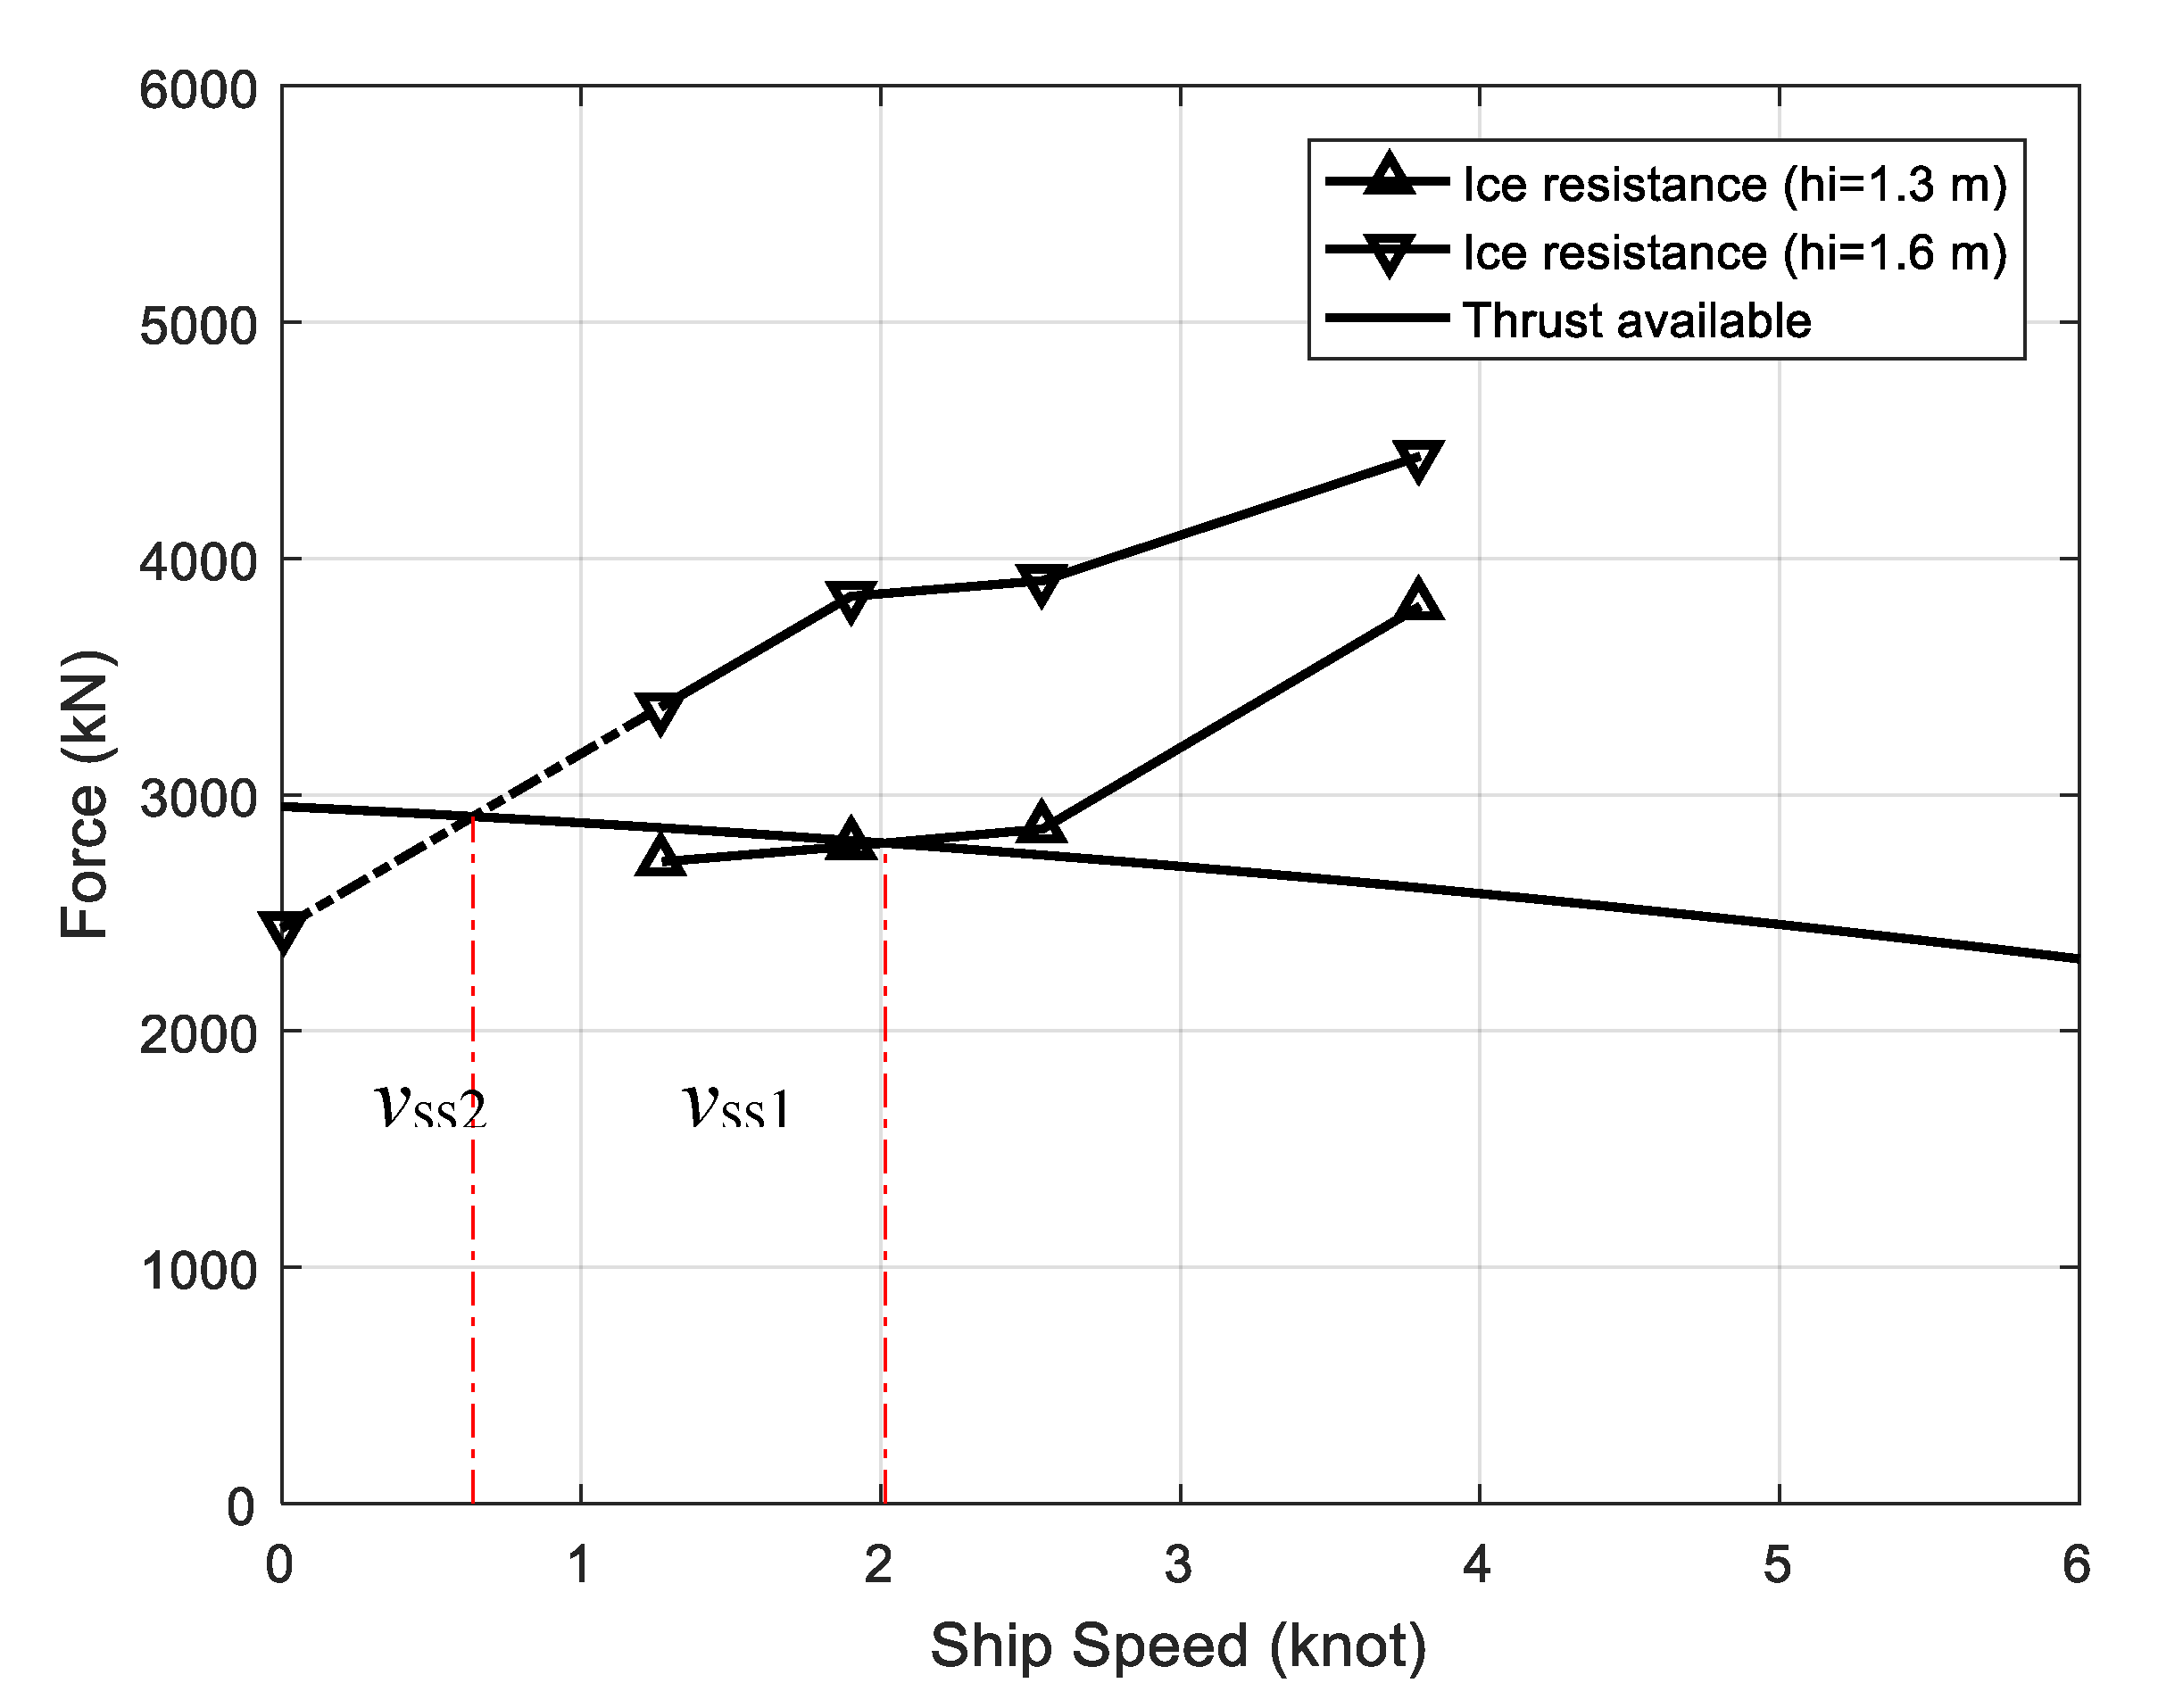
The simulated ice resistances are given in Figure 26 for all astern running tests. For the curve composed of tests with an ice thickness of 1.3 m, the ice resistance counteracts the thrust with 2795 kN. The ship speed vss1 at balance is 2.01 kn. For the curve of tests with an ice thickness of 1.6m, there is no intersection with the thrust curve. The ice resistance has to be extrapolated as a dashed line in Figure 26. The corresponding speed vss2 is 0.64 kn at the intersection.
Figure 26.
Simulated ice resistance and evaluated thrust as a factor of ship speed for astern running.
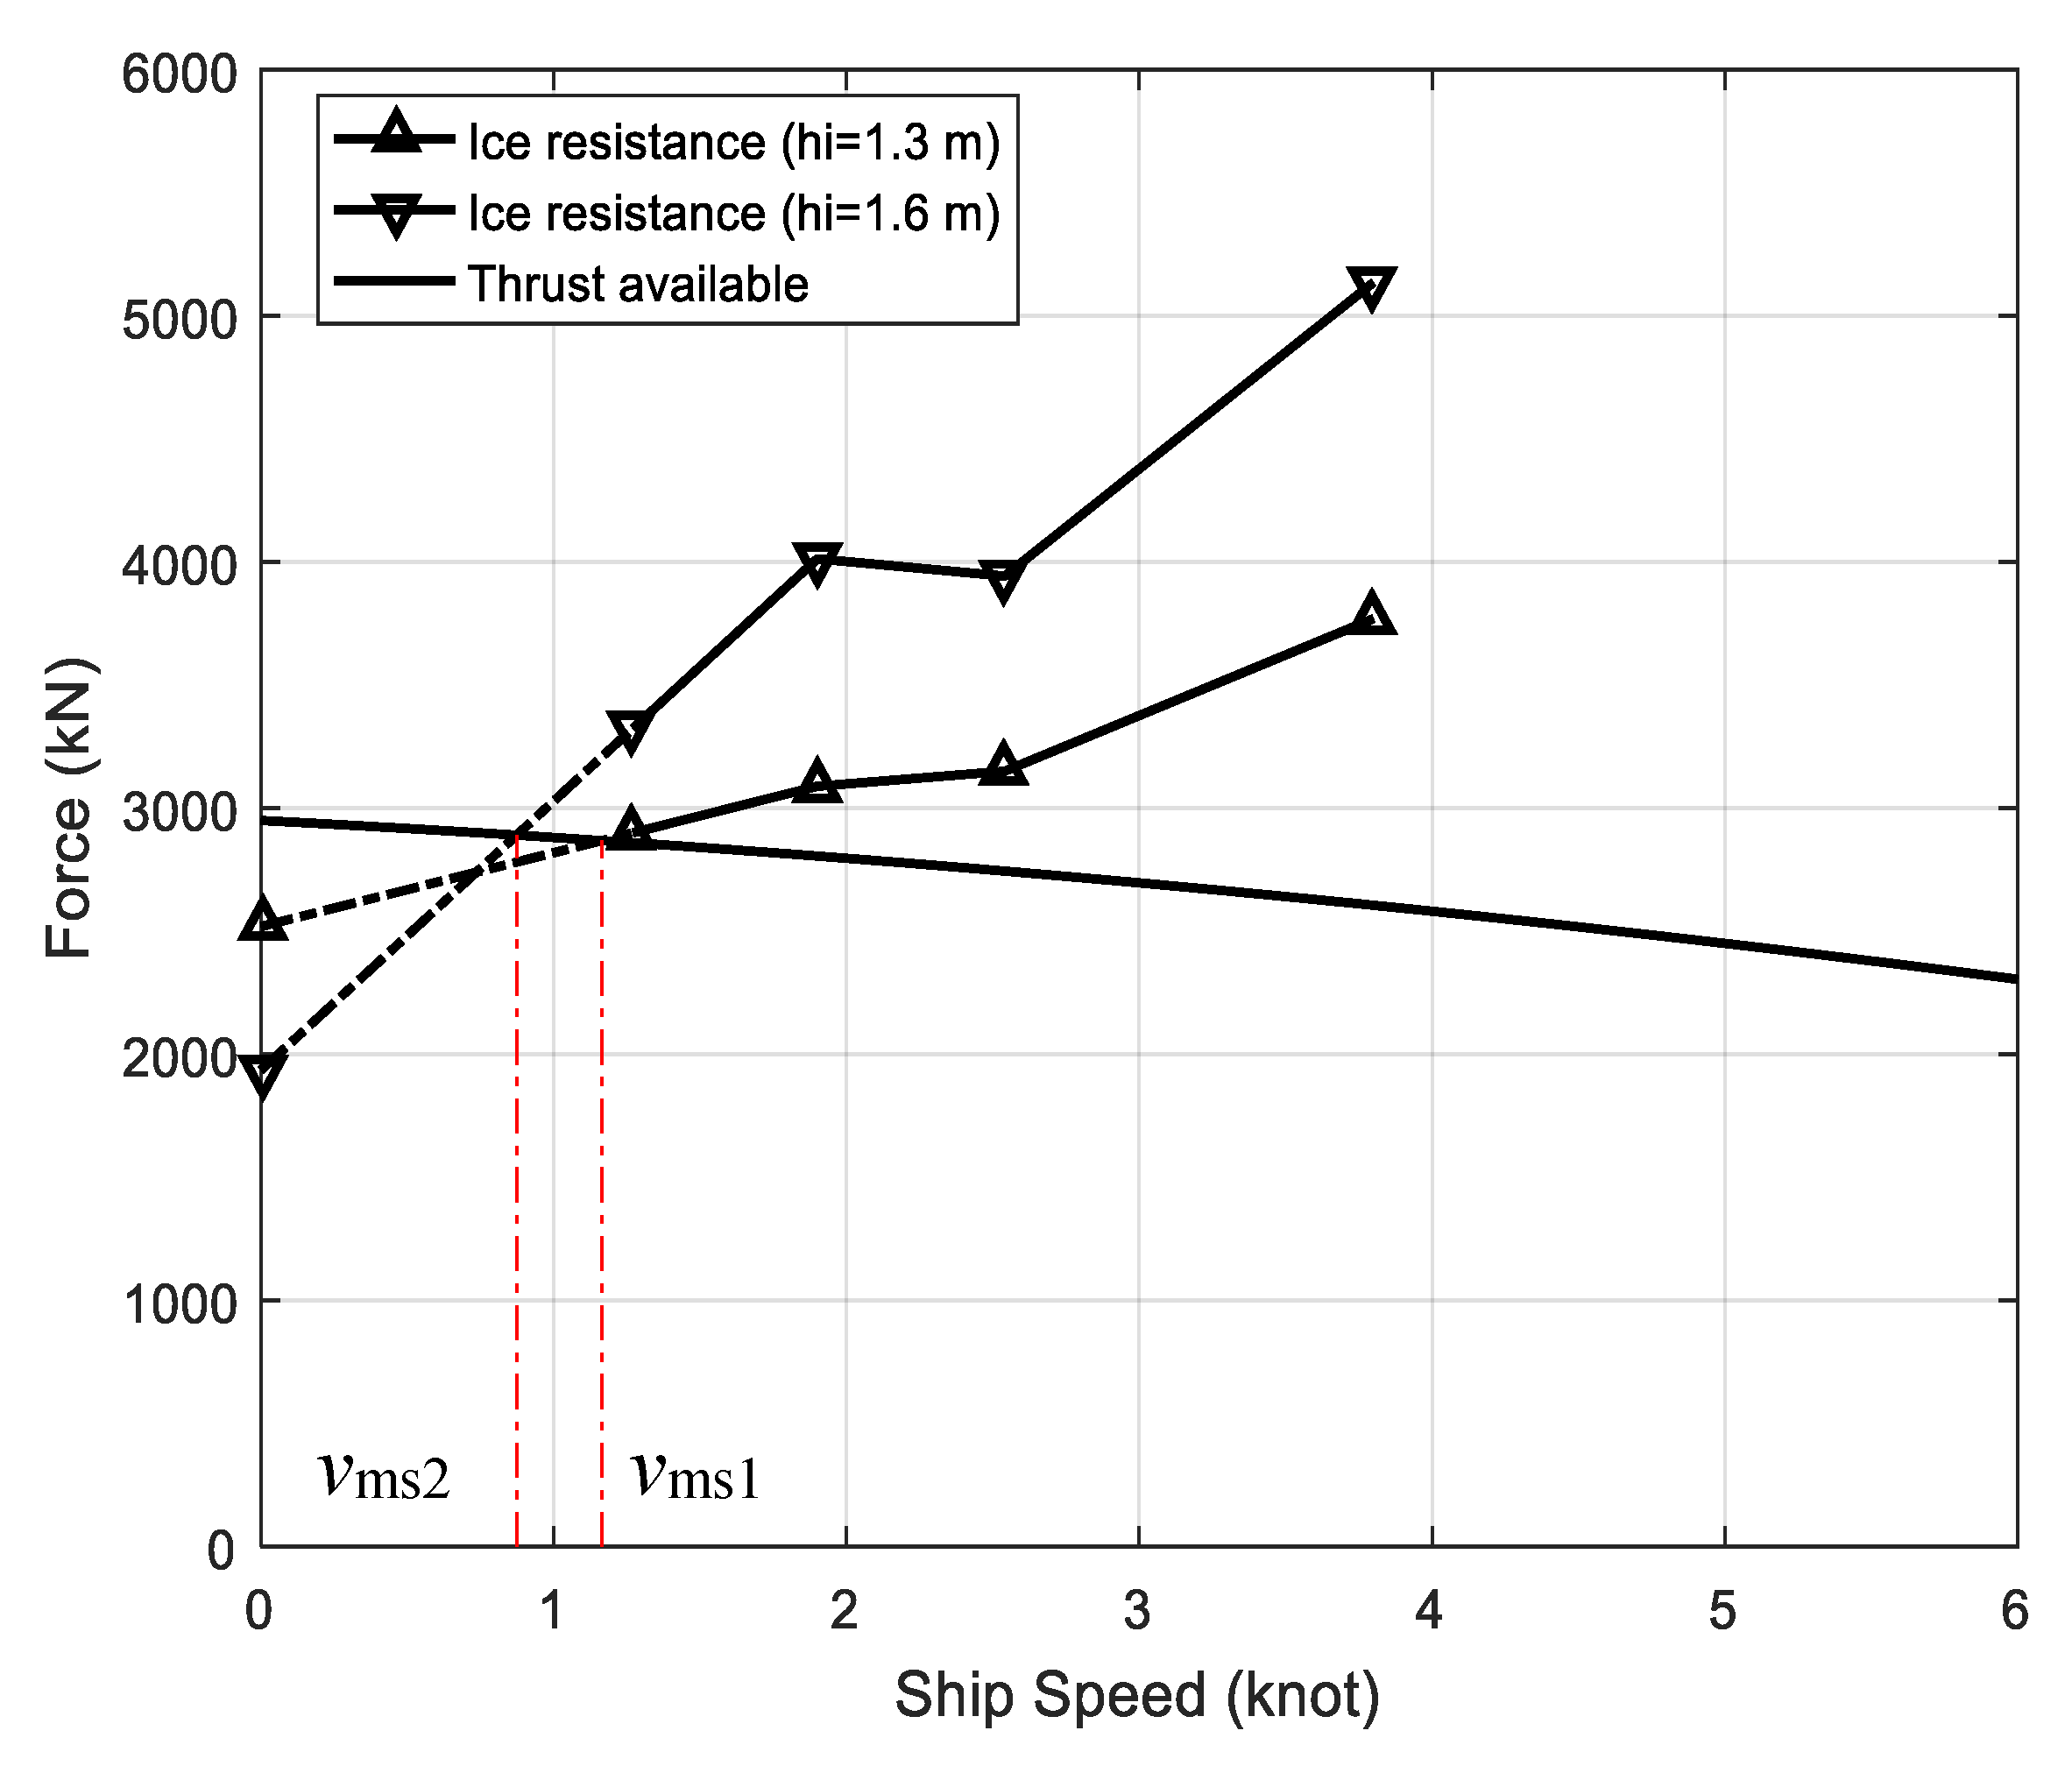
The measured ice resistances and evaluated thrust force are shown in Figure 27 for all ahead running tests. For both ice resistance curves with ice thicknesses of 1.3 and 1.6 m, there is no intersection with the thrust curve. The ice resistances have to be extrapolated. At the intersections, the corresponding speeds vms1 and vms2 are 1.16 kn, 0.87 kn respectively. The h–v curves for both the simulation and the measurement are expressed in Figure 28. The results show that at the astern running speed of 1 knot, the ice-breaking capability is 1.47 m based on the measurement and 1.52 m from the simulation. The discrepancy was minor and could be accepted.
Figure 27.
Measured ice resistance and evaluated thrust as a factor of ship speed for astern running.
Figure 28.
h–v curves from the measurement and the simulation using the static method for astern running.
4.5.2. Dynamic Method
By solving the equation of motion (Equation (4)), the ship speed could be calculated in time domain. The Dof of the equation was reduced to surge. This is enough for an icebreaking capability analysis. The added mass of the ship in surge is taken as 3.5% of the initial mass. The potential damping and restoring terms are set to be zero. The thrust due to propellers is included by application of Equation (3). The properties of the ice sheet in Table 3 are used.
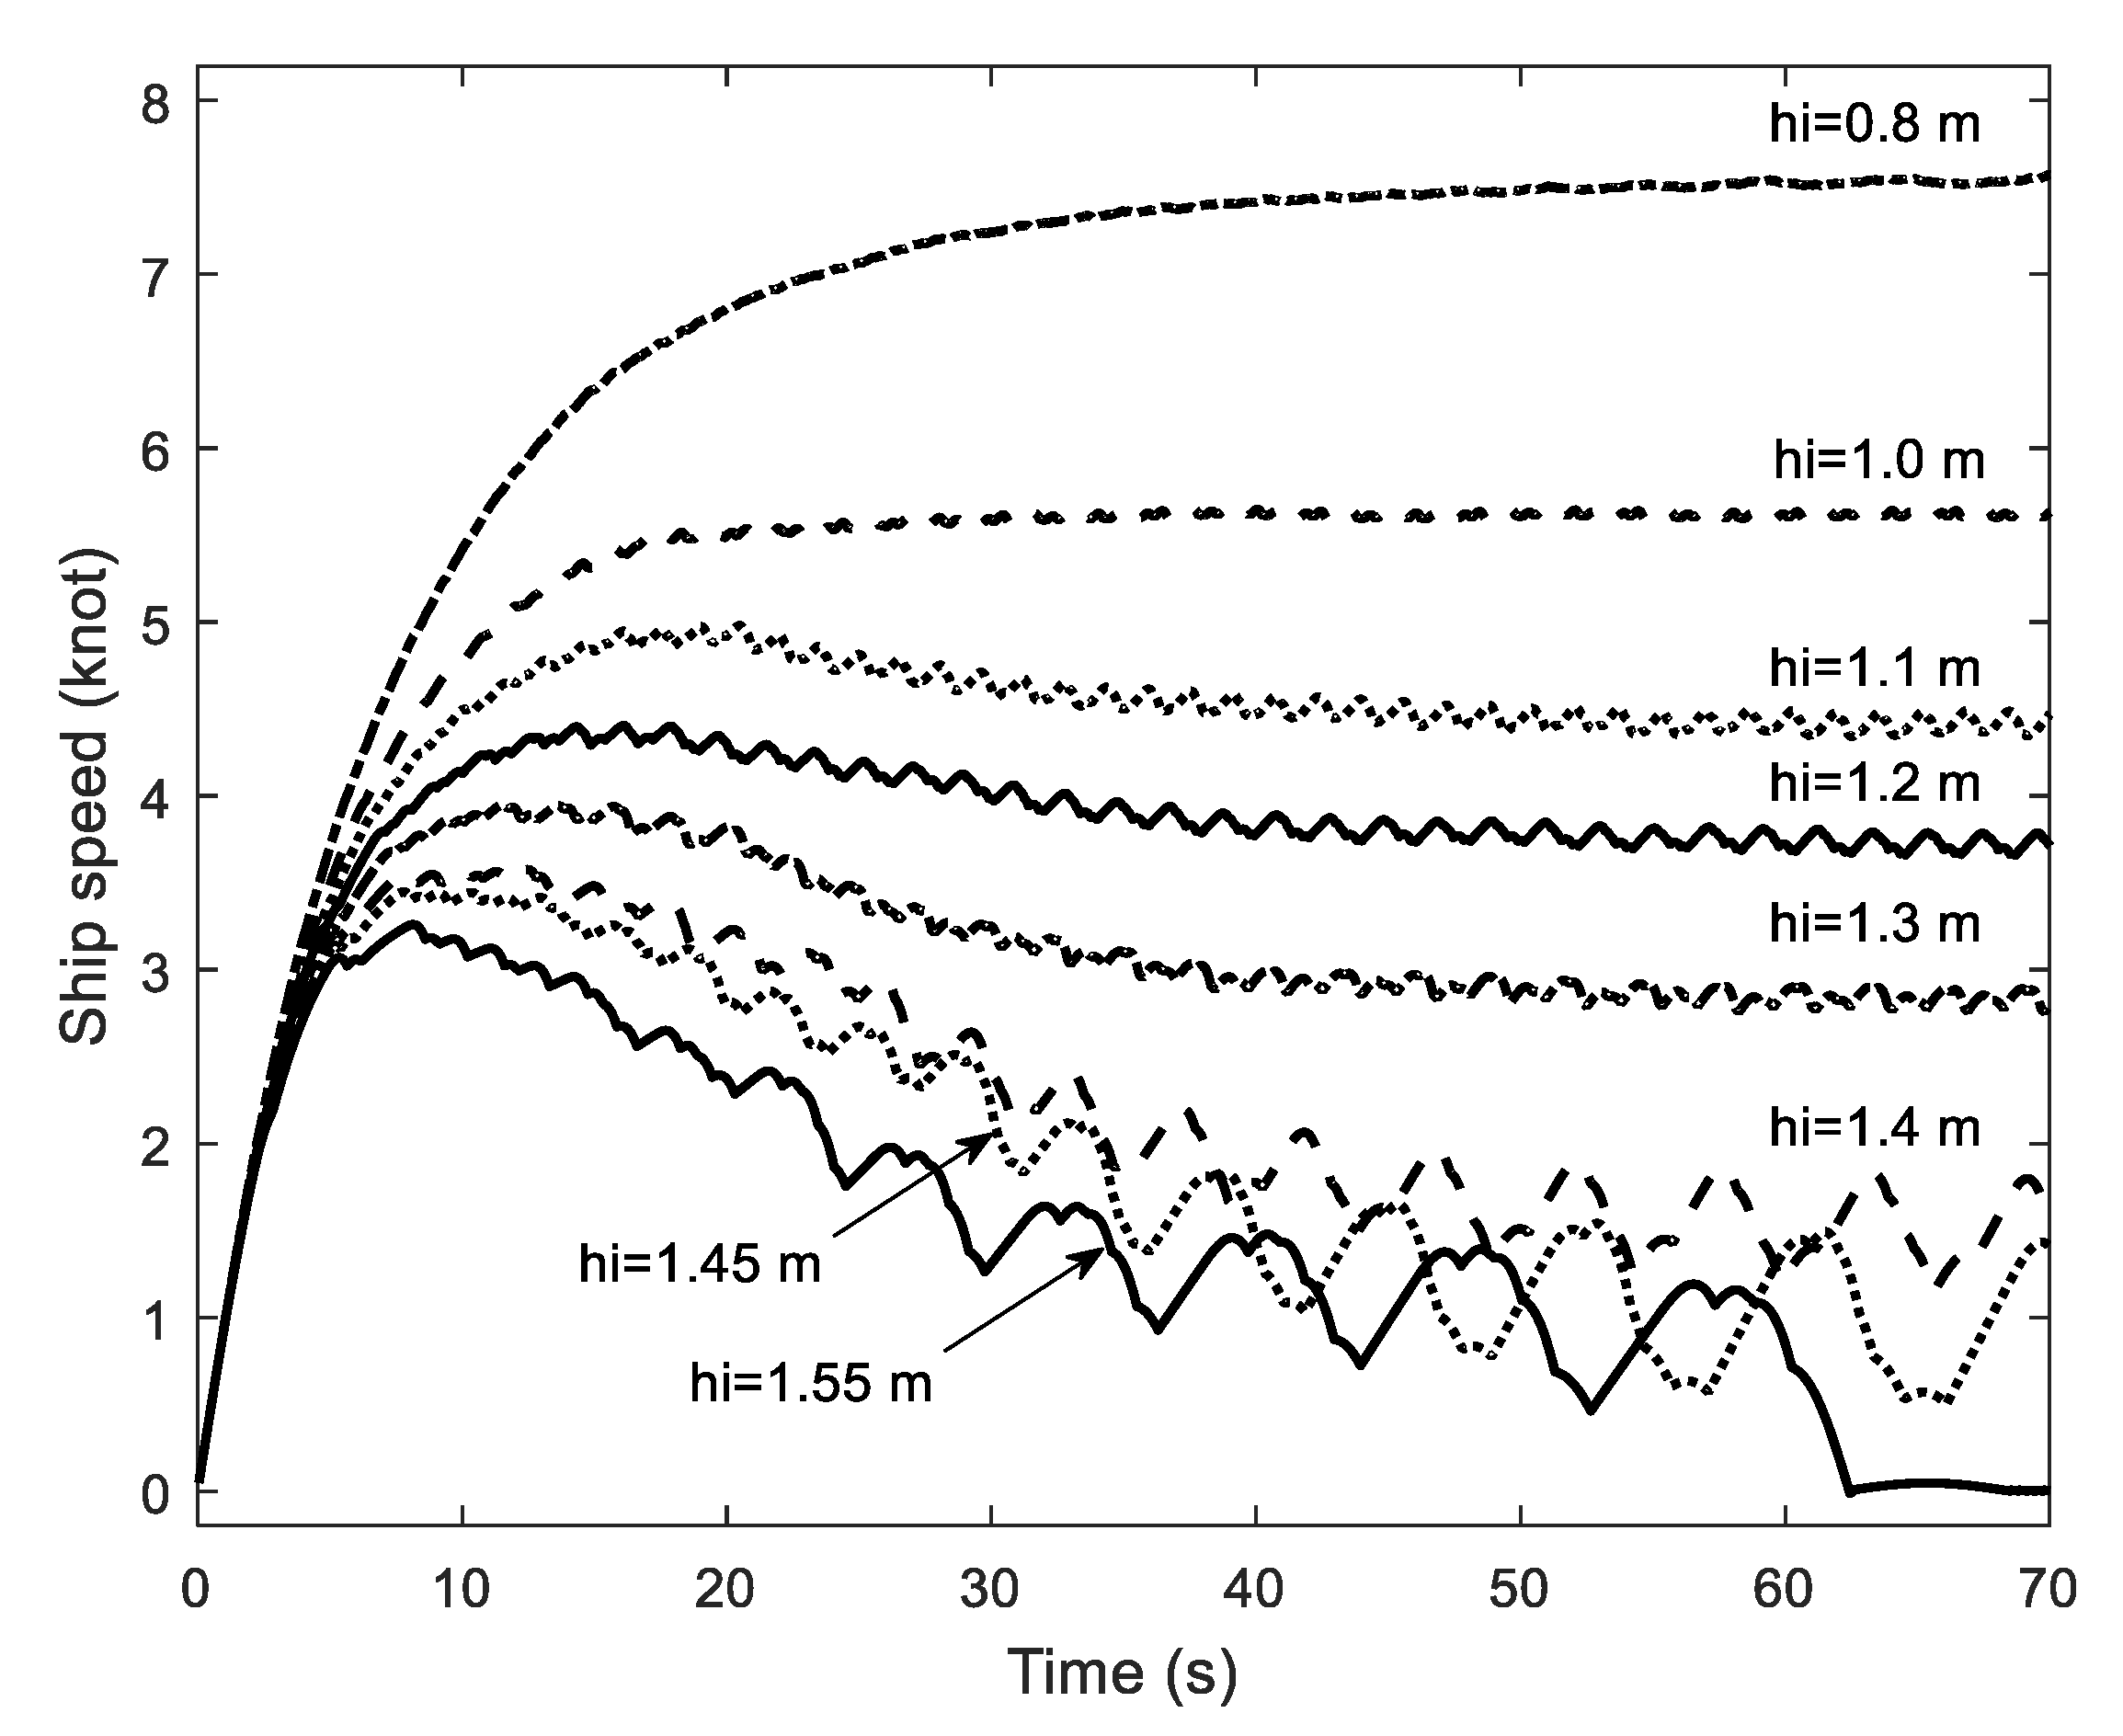
For ahead running, there are eight ice thicknesses ranging from 0.8 to 1.55 m considered in the simulation. The simulation stops when the ship speed becomes relatively stable. The simulated time series of ship speeds under different ice thicknesses are shown in Figure 29. The ship starts to accelerate under maximum thrust and zero ice resistance at the beginning. Then, the thrust decreases and the ice resistance increases eventually as the ship speed increases. If the ice resistance is lower than the ice resistance before reaching the maximum speed, the ship speed will increase to a steady value in ice thicknesses of 0.8 m and 1.0, as shown in Figure 29. If the ice resistance is larger than the thrust when the speed reaches the peak, the ship speed will drop afterwards and come to a relatively steady value under ice thicknesses of 1.1, 1.2, 1.3, 1.4, 1.45, and 1.55 m. For the simulation in 1.55 m ice, the ship comes to stop completely and gets stuck in ice because the maximum thrust is not enough to overcome the ice resistance. As the ice thickness increases, the ship tends to vibrate severely. The amplitude of the speed vibration could be up to 0.17 m/s for the test in 1.5 m ice.
Figure 29.
Simulated time series of the dynamic ship speed in the ice sheets with different thicknesses for ahead running.
The attainable speeds of the ship were collected based on Figure 29. Then, h–v curves from the dynamic simulation and the model test are compared and given in Figure 30. The results show that the icebreaking capability of the ship is 1.45 m at a speed of 1 kn by using the dynamic analysis method. The simulated result is slightly lower than the model test result at 1.52.
Figure 30.
h–v curves from the measurement and the simulation using the dynamic method for ahead running.
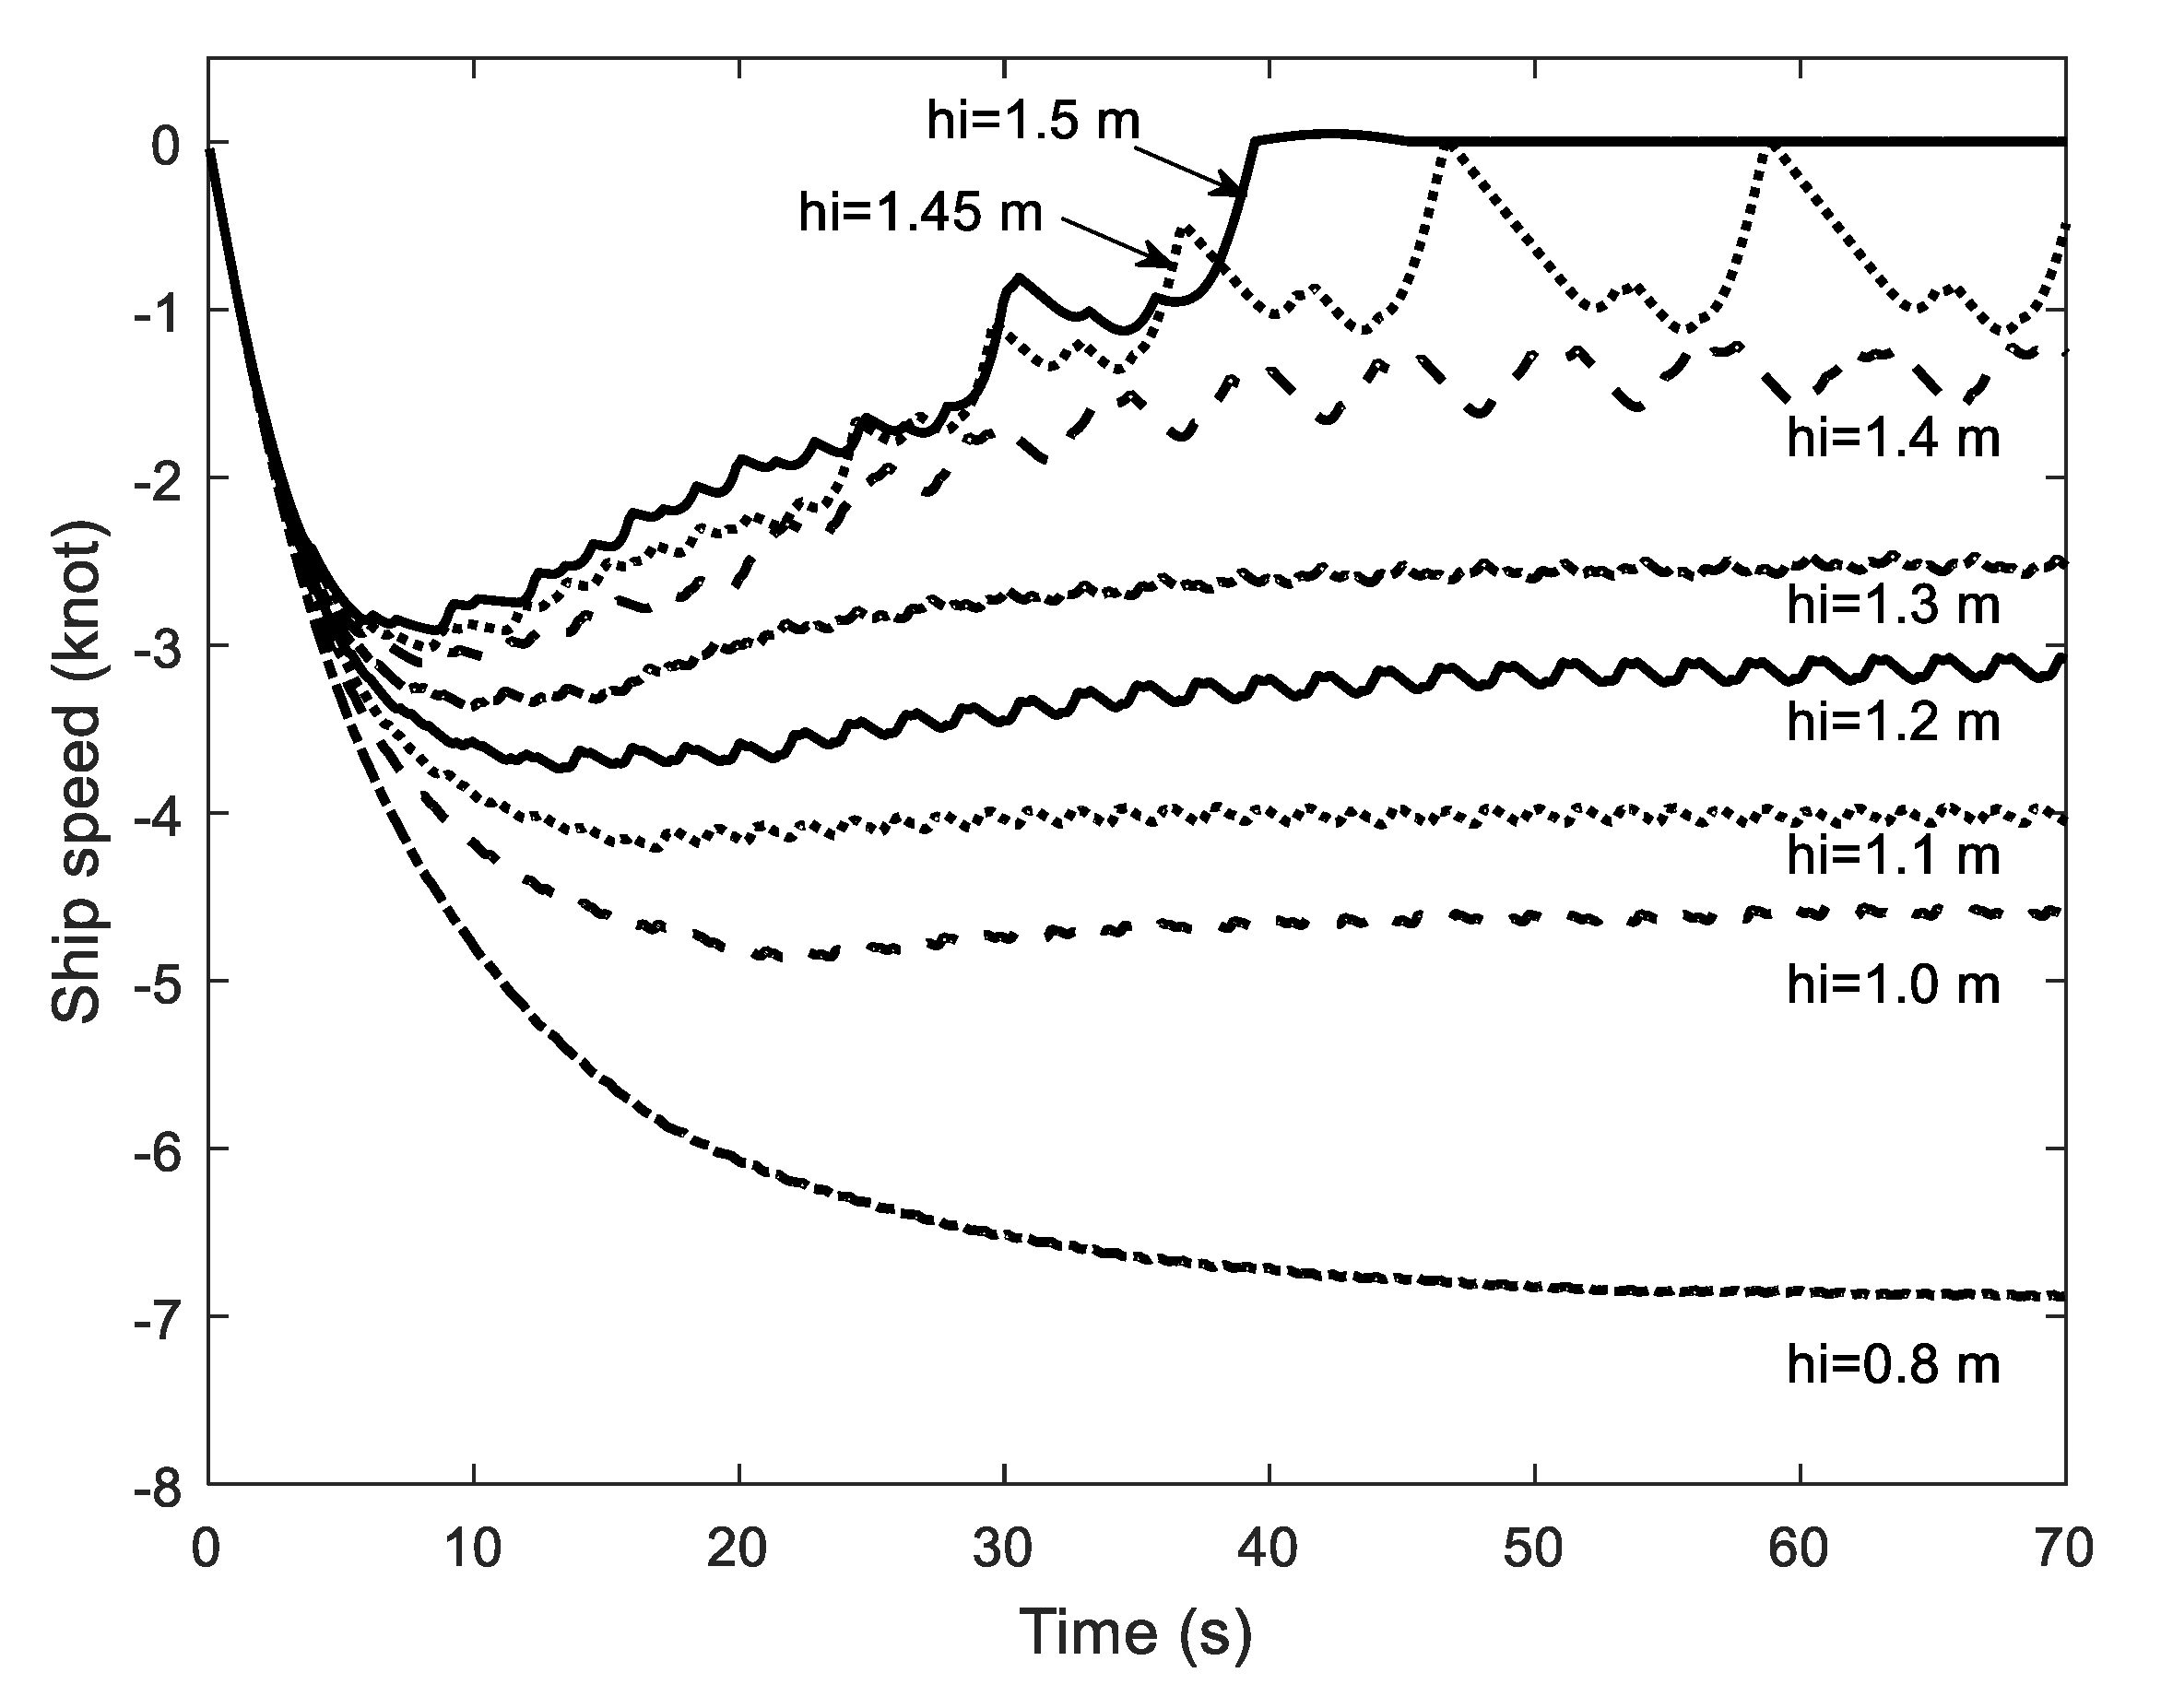
For astern running, there are also eight ice thicknesses ranging from 0.8 to 1.5 m considered in the simulation. The simulation stops when the ship speed becomes relatively stable. The simulated time series of the ship speeds under different ice thicknesses are shown in Figure 31. The phenomenon is quite similar to that that occurred to the ahead running tests in Figure 29. We are not going into details herein. For the simulation in 1.5 m ice, the ship comes to halt completely because of the inefficient thrust. The attainable ship speeds are collected as a factor of ice thickness. Then, h–v curves obtained from dynamic simulation and model test are c given in Figure 32. The results show that the icebreaking capability of the ship is 1.42 m at a speed of 1 kn for astern running. The simulated result is slightly lower than the model test result at 1.47.
Figure 31.
Simulated time series of the dynamic ship speed in ice the sheets with different thicknesses for astern running.
Figure 32.
h–v curves from measurement and simulation using the dynamic method for astern running.
The calculated and measured icebreaking capabilities of the polar ship at the speed of 1 kn are summarized in Table 5.
Table 5.
Calculated and measured icebreaking capability.
5. Conclusions
This paper presents a static method and a dynamic method to calculate icebreaking capability numerically. The simulated ice results were compared with the model tests results. The following conclusions could be derived based on the present study.
(1) The ice resistance is very sensitive to the speed-dependent icebreaking length coefficient and the bending capacity coefficient.
(2) The scatter between the measured and simulated ice resistance is small and less than 13.7%. This means that the proposed formula to calculate the speed-dependent icebreaking length coefficient and bending capacity coefficient are reasonable.
(3) Considering the balance between ice resistance and thrust available, the icebreaking capability for ahead running is relatively high compared to astern running based on both the model test and the simulation results.
(4) The static method gives a higher estimation on the icebreaking capability than the model test, but the difference is within 3.4%.
(5) The static method underestimates the icebreaking capability by 3.4%~4.6%. This could be accepted in early design of polar ship.
It should be noted that the effect of the propeller washing on icebreaking capability is not considered in both present numerical simulation and model test. The high-speed wake may assist the polar ship to break ice and thus, the capability. All conclusions are made based on the present polar tanker herein. More studies are needed to validate the present method further.
Author Contributions
Conceptualization, L.Z.; methodology, L.Z.; software, L.Z. and M.S.; validation, L.Z. and S.D. and Y.H.; formal analysis, L.Z. and F.D.; investigation, L.Z; resources, L.Z. and F.D.; data curation, Y.H.; writing—original draft preparation, S.D; writing—review and editing, L.Z.; visualization, M.S.; supervision, L.Z.; project administration, L.Z.; funding acquisition, L.Z. and S.D. All authors have read and agreed to the published version of the manuscript.
Funding
This research was funded by the National Natural Science Foundation of China, grant number 51809124, 51911530156, 51709039; Natural Science Foundation of Jiangsu Province of China, grant number BK20170576; Natural Science Foundation of the Higher Education Institutions of Jiangsu Province of China, grant number 17KJB580006; State Key Laboratory of Ocean Engineering (Shanghai Jiao Tong University), grant number 1704 and 1807.
Acknowledgments
The authors would like to thank the Jiangsu University of Science and Technology (JUST).
Conflicts of Interest
The authors declare no conflict of interest.
Nomenclature
| Fbi | Local forces |
| vrel | Relative velocity between the ship and the drifting level ice sheet |
| L | Length of the ship |
| ρi | Ice density |
| ρw | Water density |
| g | Acceleration of gravity |
| B | Width of the hull |
| T | Draught of the hull |
| μ | Friction coefficient between ice and hull |
| Af | Area of the bow |
| vow | Maximum open water speed |
| Tpull | Bollard pull of the ship |
| M | Inertial mass |
| A | Added mass matrix |
| B | Damping term |
| C | Hydrostatic restoring coefficient |
| Fb | Icebreaking force |
| Fs | Ice force due to ice submersion |
| Tnet | Thrust available from propellers |
| Cvs and Cls | Icebreaking radius |
| hi | Thickness of the ice |
| l | Characteristic length of the ice |
| Ei | Elastic modulus |
| γ | Poisson ratio |
| Cf | Ice bending capacity coefficient |
References
- Riska, K. Ship-ice interaction in ship design: Theory and practice. In Encyclopedia of Life Support Systems (EOLSS); Developed under the Auspices of the UNESCO; Eolss Publishers: Oxford, UK, 2010. [Google Scholar]
- Lindqvist, G. A Straightforward Method for Calculation of Ice Resistance of Ships. In Proceedings of the International Conference on Port and Ocean Engineering under Arctic Conditions (POAC), Lulea, Sweden, 12–16 June 1989; pp. 722–735. [Google Scholar]
- Keinonen, A.J.; Browne, R.; Revill, C.; Reynolds, A. Icebreaker Characteristics Synthesis. In Report for the Transportation Development Centre; Report TP 12812E; Transport Canada: Ottawa, ON, Canada, 1996. [Google Scholar]
- Riska, K.; Wilhelmson, M.; Englund, K.; Leiviskä, T. Performance of Merchant Vessels in the Baltic; Research Report No. 52; Winter Navigation Research Board; Helsinki University of Technology: Espoo, Finland, 1997. [Google Scholar]
- Valanto, P. The resistance of ships in level ice. Trans. Soc. Naval Archit. Mar. Eng. SNAME 2001, 109, 53–83. [Google Scholar]
- Liu, J.C.; Lau, M.; Williams, F.M. Mathematical modeling of ice–hull interaction for ship maneuvering in ice simulations. In Proceedings of the 7th International Conference and Exhibition on Performance of Ships and Structures in Ice (ICETECH), Banff, AB, Canada, 16–19 July 2006. [Google Scholar]
- Martio, J. Numerical Simulation of Vessel’s Maneuvering Performance in Uniform Ice; Report No. M-301; Ship Laboratory; Helsinki University of Technology: Espoo, Finland, 2007. [Google Scholar]
- Sawamura, J.; Tsuchiya, H.; Tachibana, T.; Osawa, N. Numerical modeling for ship maneuvering in level ice. In Proceedings of the 20th International Symposium on Ice (IAHR), Lahti, Finland, 14–17 June 2010. [Google Scholar]
- Su, B.; Riska, K.; Moan, T. A Numerical Method for the Prediction of Ship Performance in Level Ice. Cold Reg. Sci. Technol. 2010, 60, 177–188. [Google Scholar] [CrossRef]
- Lubbad, R.; Løset, S. A numerical model for real-time simulation of ship–ice interaction. Cold Reg. Sci. Technol. 2011, 65, 111–127. [Google Scholar] [CrossRef]
- Zhou, L.; Ding, S.F.; Song, M.; Han, Y. A Numerical Model for Towing Operations of Arctic Gravity based Structure in Managed Ice Fields. J. Mar. Sci. Eng. 2020. under review. [Google Scholar]
- Zhou, L.; Chuang, Z.; Ji, C. Ice forces acting on towed ship in level ice with straight drift. Part I: Analysis of model test data. Int. J. Naval Archit. Ocean Eng. 2018, 10, 60–68. [Google Scholar] [CrossRef]
- Su, B. Numerical Predictions of Global and Local Ice Loads on Ships. Ph.D. Thesis, Cesos, Norwegian University of Science and Technology, Trondheim, Norway, 2011. [Google Scholar]
- Zhou, L.; Chuang, Z.; Bai, X. Ice forces acting on towed ship in level ice with straight drift. Part II: Numerical simulation. Int. J. Naval Archit. Ocean Eng. 2018, 10, 119–128. [Google Scholar] [CrossRef]
- Zhou, L.; Riska, K.; Ji, C. Simulating transverse icebreaking process considering both crushing and bending failures. Mar. Struct. 2017, 54, 167–187. [Google Scholar] [CrossRef]
- Juva, M.; Riska, K. On the Power Requirement in the Finnish–Swedish Ice Class Rules; Research Report No. 47; Winter Navigation Research Board: Sweeden and Finland; Helsinki University of Technology Ship Laboratory: Espoo, Finland, 2002. [Google Scholar]
- Zhou, L.; Riska, K.; Moan, T.; Su, B. Numerical modelling of ice load on an icebreaking tanker: Comparing simulations with model tests. Cold Reg. Sci. Technol. 2013, 87, 33–46. [Google Scholar] [CrossRef]
- Zhou, L.; Gao, J.; Xu, S.; Bai, X. A numerical method to simulate ice drift reversal for moored ships in level ice. Cold Reg. Sci. Technol. 2018, 152, 35–47. [Google Scholar] [CrossRef]
- Timco, G.W.; Weeks, W.F. A review of the engineering properties of sea ice. Cold Reg. Sci. Technol. 2010, 60, 107–129. [Google Scholar] [CrossRef]
© 2020 by the authors. Licensee MDPI, Basel, Switzerland. This article is an open access article distributed under the terms and conditions of the Creative Commons Attribution (CC BY) license (http://creativecommons.org/licenses/by/4.0/).