Abstract
Enclosure aquaculture is a healthy and ecological aquaculture pattern developed in recent years to relieve the pressure due to the wild fish stock decline and water pollution. The object of this paper was a floating rope enclosure, which mainly consisted of floaters, mooring lines, sinkers and a net. In order to optimize mooring design factors, the hydrodynamic responses of the floating rope enclosure with different mooring systems in combined wave-current were investigated by experimental and numerical methods. Physical model experiments with a model scale of 1:50 were performed to investigate the hydrodynamic characteristics of a floating rope enclosure with 12 mooring lines. Based on the lumped mass method, the numerical model was established to investigate the effects of mooring design factors on the mooring line tension, force acting on the bottom, and the volume retention of the floating rope enclosure. Through the analysis of numerical and experimental results, it was found that the maximum mooring line tension of the floating rope enclosure occurs on both sides of the windward. Increasing the number of mooring lines on the windward side is helpful to reduce the maximum mooring line tension. Waves and current both have an influence on the mooring line tension; in contrast, currents have a more obvious effect on the mooring line tension than waves. However, the influence of the wave period on the maximum mooring line tension is small. The force endured by the bottom of the floating rope enclosure also changes periodically with the wave period. Yet, the maximum force endured by the bottom of floating rope enclosure occurred at the windward and leeward of the structure. The volume retention of the floating rope enclosure increased with the increasing amount of mooring lines.
1. Introduction
There are many types of marine aquaculture structures widely used to produce more intensive production to meet the rapidly growing demand. The large increase in the aquaculture industry generates great pressure on the protection of the ecological environment [1]. It is of great importance to develop a healthy, sustainable and ecological structure to promote production increase and environment protection. The object of this paper is a type of floating rope enclosure which has many advantageous characteristics compared with the traditional net cage, such as the high utilization rate of the life food and the low unit cost, high quality of aquaculture products, low possibility of fish disease (due to large aquaculture water body and low breading density) and high breeding efficiency. A floating rope enclosure consists of a flexible net as the main structural component. Compared with the rigid body, the flexible elements have the advantage of resisting external loads and reducing local stress [1]. Due to its advantageous characteristics, a floating rope enclosure is increasingly applied for offshore aquaculture in China.
To our knowledge, for plane nets and net cages, many investigations have been done by scholars. However, there are few studies on the hydrodynamic characteristics of floating rope enclosure. The resulting hydrodynamic loads on the net are dependent on various factors, such as net solidity, the Reynolds number (Re), the flow angle relative to the mesh, and local accelerations of the flow between the twines [2,3]. The interaction between waves and nets and net deformations are both important research contents for net-based structures; a number of experiments have been carried out on these subjects [4,5,6,7,8]. Both the mesh geometry and net solidity have an influence on the hydrodynamic load of the net. Balash et al. [9] and Moe-Føre et al. [10] carried out experimental research on the above aspects. Biofouling is a common phenomenon which has a serious impact on the hydrodynamics of a net. In order to assess the drag force increase on biofouling net, Swift et al. [11] and Bi et al. [12] adopted an experimental method to explore the drag force increase due to biofouling. Numerical simulation as a research method has been used by many scholars to study the hydrodynamic characteristics of a net-based structure. Li et al. [13] investigated the net deformation and tension distribution by the lumped mass method. Then, Zhao et al. [14] applied this method to the three-dimensional net cage and obtained good agreement with the experimental results. Yang et al. [15] used the experimental and numerical methods to analyze the motion of fish cage in waves. Tsukrov et al. [16,17] put forward the concept of consistent finite element and through adding nonlinear elements to optimize the numerical model for the calculation of the hydrodynamic response of net panel. Kristiansen and Faltinsen [18] applied a screen type of a force model to investigate the current loads on the fish cage. In reality, the structures are exposed to combined waves and currents. Thus, the study on the hydrodynamic characteristics of net-based structures exposed to waves and current is more practical for engineering [1,19,20,21]. The design factors of a mooring system have a significant influence on the hydrodynamic characteristics of the marine structure. Fredriksson et al. [22], Huang and Pan [23] and Decew et al. [24] have studied the hydrodynamic behavior of fish cages with different mooring systems for reference.
This paper is concerned with the hydrodynamic characteristics of floating rope enclosure with different mooring systems by means of a physical model experiment and numerical simulation. The design of a mooring system for a floating rope enclosure is not only related to the input cost, but also closely related to its safety. This study mainly focused on the maximum net tension force acting on the bottom and volume retention, which provide the basis for the design of the mooring system of a floating rope enclosure.
The remainder of this paper is organized as follows. The description of a numerical model based on the lump mass method, wave-current field and calculation of volume retention are given in Section 2. A brief description of the physical model test and the comparison between numerical simulations and experimental results are presented in Section 3. In Section 4, the hydrodynamic characteristics of a floating rope enclosure with various mooring systems are analyzed and discussed. Section 5 presents some conclusions for this study.
2. Numerical Method
The floating rope enclosure generally consists of the net, mooring lines, floaters, weight system and anchor system, as shown in Figure 1. The size of the prototype is also shown in Figure 1. The numerical model is based on the lumped mass method. The 4th-order Runge-Kutta (RK4) time-integration scheme was adopted for the time stepping process.
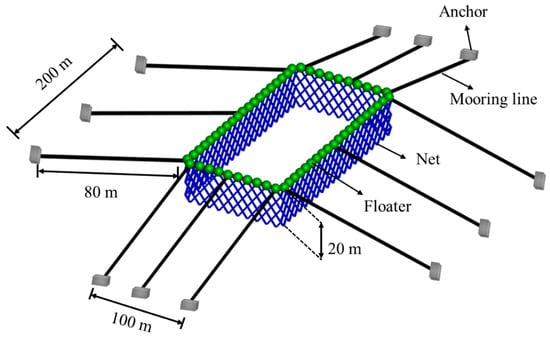
Figure 1.
Schematic of floating rope enclosure.
2.1. Wave-Current Field
The combination of waves and currents changes the characteristics of waves, and here, we assume that the current is uniform across the entire water depth. The wave celerity in a current can be calculated by
where is the wave celerity relative to the current, is the current velocity.
The wave velocity relative to current can be calculated by
where represents the wave number, represents the wave length in current, is the acceleration of gravity, and is the water depth.
The change of wave length in current can be calculated based on the linear theory by the following formula:
where represents the wave length in still water and represents the wave number in still water.
The transformation of wave height can be obtained by
where represents the wave length in still water, represents the wave number in still water. and represent the wave length in current and still water, respectively; represents the wave height in the current.
The velocity and acceleration of water particles and water surface elevation for the numerical simulation are all calculated by the linear wave theory.
2.2. Model for Floaters
Floaters are usually floating or partially submerged in water. The hydrodynamic force on floaters can be calculated by the modified Morison formula:
where represents the drag coefficient and represents the added mass coefficient, represents water displaced volume, represents the projected area, and represents the relative velocity. Referring to the study of Xu et al. [25], the relation between the drag coefficient and Reynolds number can be obtained as shown in Table 1, where Re is the Reynolds number. After the Reynolds number is obtained by calculation, the drag coefficient can be calculated by linear interpolation based on Table 1.

Table 1.
Drag coefficient of the floater.
Under the marine environment, the floater is affected by gravity, buoyancy and hydrodynamic force. The sketch of the floater is shown in Figure 2. Assuming that the center of the ball is , the depth of the floater is
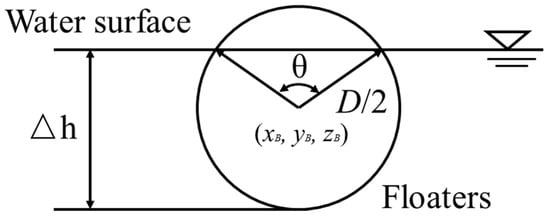
Figure 2.
Sketch of the floater.
The underwater projected area of a floater along a coordinate axis:
where D represents the diameter of the floater, and θ represents the central angle corresponding to the water surface, calculated by the following formula:
2.3. Model for Net
2.3.1. Force Equation of Net
In order to calculate the force acting on the net, the lumped mass method is adopted to establish the numerical model. By means of the lumped mass method, the net is divided into many mass points which are interconnected by massless springs (Figure 3). The mass point is set at every corner and the center of the mesh bar. There are more than 22800 mass points for net which makes the calculation difficult, so the mesh grouping method [26] was adopted to reduce the computational difficulty. Equivalent meshes are applied to modeling the actual meshes. Equivalent meshes have the same projected area of the netting, specific mass and the weight as the actual meshes. The net used in experiment is 300 ×15 diamond meshes with a mesh size of 20 mm and a diameter 1 mm. The equivalent meshes in the numerical simulation have a mesh size of 100 mm and a diameter 5 mm.
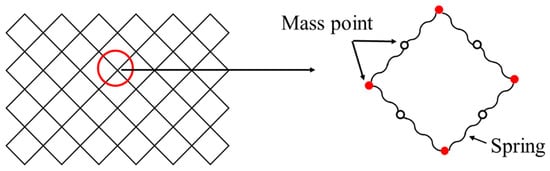
Figure 3.
Mass-spring model for net.
As shown in Figure 4, a local coordinate system is defined to consider the forces acting each net bar. Compared with the characteristic wave length, elements are a small body which make the scattering effects negligible, so the drag forces on the component can be calculated by the modified Morison equation [27]:
where represents the drag coefficients for the component; represents the velocity vectors of the water particles; represents the velocity vectors of the element of the component; is the water particles’ acceleration vectors; represents the density of water, represents water displaced volume and represents the projected area of the component, respectively. and represent the drag force for the and component.
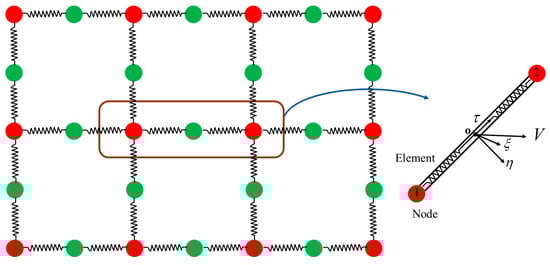
Figure 4.
Local coordinate system for a net element.
2.3.2. Hydrodynamic Coefficents of Net
According to Choo and Casarella [28], the drag coefficient (normal drag coefficient) and (tangential drag coefficient) based on the Reynolds number () can be calculated as follows:
where ; ; is the viscosity of water; and are the normal and tangential drag coefficients for mesh bar, respectively; is the normal component of the fluid velocity relative to the bar, and is the density of water. The range of for sphere knot is suggested to be 1.0–2.0 by Fredheim and Faltinsen [29], is 1.0 here.
2.3.3. MotionEequation of Net
According to Newton’s second law, the motion equations for lumped mass can be calculated by the following formula:
where is the mass point acceleration, is the drag force, is the inertia forces, is the twine tension, is the buoyancy force, and is the gravity force.
In the numerical calculation, the tension can be calculated by the formula proposed by Wilson [30]. The formula reveals the relations between twine tension and elongation:
where T is the twine tension; is the original length of twine; represents the deformed twine length; and according to Gerhard [31].
2.4. Model for Mooring lines
The mooring line tension is calculated as follows:
where represents the mooring line tension, represents the mooring line elongation; represents the original mooring line length.
In numerical calculations, the mooring line is also simplified to a series of lumped mass points connected by massless springs. In this part, the lumped points are called nodes and massless springs are called elements. Mooring lines endure gravity, buoyancy, hydrodynamic and tension forces. To calculate the hydrodynamic forces of the mooring line, a local coordinate system similar to net is also established, as shown in Figure 5b. The specific calculation of hydrodynamic force acting on the jth element is shown in our previous study [25]. Once forces acting on every element are obtained, the forces are distributed evenly along the adjacent lumped mass points. According to Newton’s second law, the motion equations for every lumped mass point can be calculated by the following formula:
where subscript denotes the node’s sequential number, the subscript represents the neighboring elements associated with node i.
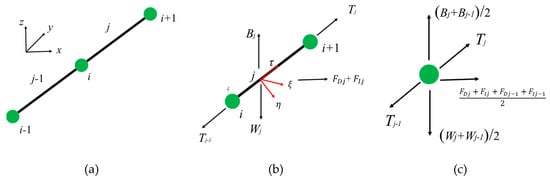
Figure 5.
Diagram for the mooring line calculation: (a) modelling method for mooring line, (b) calculation for element; (c) calculation for node.
2.5. Volume Retention
The net deformation is difficult to measure by the experimental method but it can be achieved by the numerical method. The volume retention is the numerical parameter defined to visualize the deformation of the floating rope enclosure.
where represents the initial volume of the floating rope enclosure in still water and represents the transient volume of the floating rope enclosure under the action of waves and currents.
3. Physical Model
3.1. Laboratory Setup
A wave-current flume with a length of 40.0 m, a width of 24.0 m and a depth of 1.2 m at the State Key Laboratory of Coastal and offshore Engineering of the Dalian University of Technology, China, was used for this experiment.
A floating rope enclosure with a twelve-point mooring system was used for the investigation of the hydrodynamic characteristics (Figure 6). The floating rope enclosure mainly consists of floaters, nets, mooring lines and sinkers. Floaters as a buoyancy system are mounted on the top of the net; sinkers as a weight system are connected to the bottom of the net.
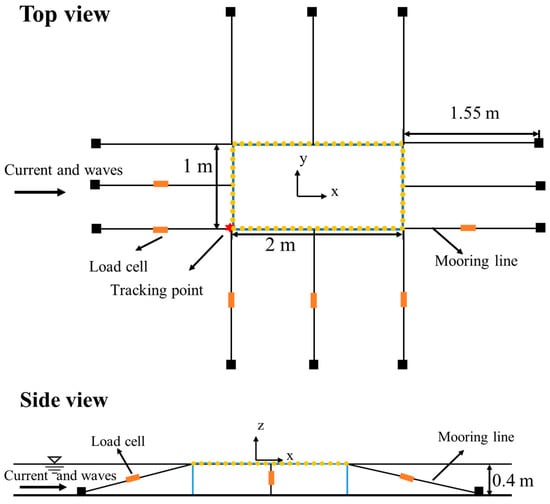
Figure 6.
Model test set-up.
The whole structure should theoretically satisfy geometric, dynamic and kinematic similarity at the same time, but this is difficult to accomplish for thin yarns such as nets, mooring lines and small floaters. Since the size of the float is too small according to the scale and the entire floating system adopts equivalent buoyancy, the floater size not scaled according to the prototype, but can provide equal buoyancy. The extended gravity similarity criteria are applied for the model net according to the study by Gui [32] and Li [33]. The global size of net adopts a geometry scale λ (1:50). The floating rope enclosure is a rectangle with a length of 2 m, a width of 1 m and a height of 0.4 m, corresponding to a prototype length of 100 m, a width of 50 m and a height of 20 m high. The size of the yarn diameter and mesh adopted scale λ’ (1:5) to avoid the difficulties for manufacture and the significantly change of the net Reynolds numbers. Table 2 shows the specific parameters of the various components of the floating rope enclosure. In Figure 6, the direction parallel to the wave is defined as x, the direction perpendicular to the wave and current is defined as y and the upward direction is z. In still water, the mesh is shaped as a diamond. The net is in a relatively relaxed state. When the structure is in a balancing state, about half of the floaters are submerged in the water. There are 12 mooring lines for the whole structure with a length of 1.6 m (corresponding to 4 times of water depth). The whole structure is equipped with six load cells with a capacity of 10 N to gain the tension of mooring lines at different positions. The pre-tension of every mooring line is 0.03 N. The red asterisk in Figure 6 represents the tracking point, whose motion information is collected by a CCD camera with a frame rate of 15 frames per second. The combined wave-current conditions are given in Table 3.
Table 2.
Parameter of the floating rope enclosure.
Table 3.
Wave conditions for the numerical calculation and the physical experiment.
3.2. Verification of the Accuracy of the Numerical Model
This section provides the comparative analysis of experimental results and numerical results to verify the reliability of the numerical model. The convergence test is first carried out with respect to different time steps using dt = 0.002 s, 0.001 s and 0.0005 s, as shown in Figure 7. It is seen that the numerical results are almost identical and thus, dt = 0.001 s is chosen for each of the following cases. In the numerical simulation, the pre-tension of every mooring line is also 0.03 N, corresponding to the experimental value. The comparison object is the maximum mooring line tension and the maximum horizontal and vertical movements of the tracking point. The comparison of maximum mooring line tension between numerical simulations and experiment results is shown in Figure 8. The comparison of maximum horizontal and vertical movement amplitude of tracking points between the numerical results and the experimental results are shown in Figure 9 and Figure 10, respectively.
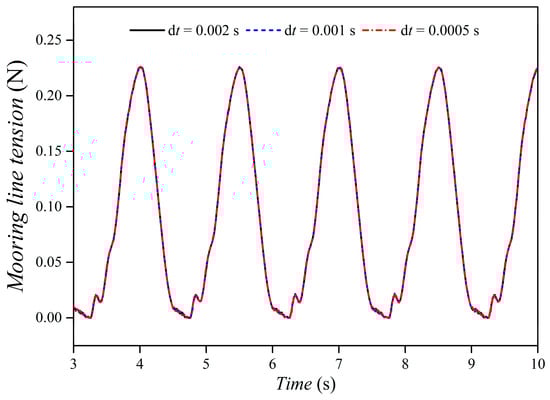
Figure 7.
Convergence analysis results.
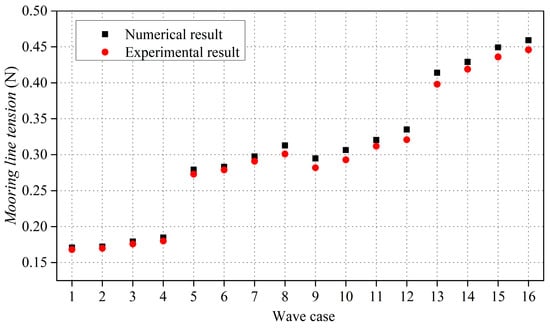
Figure 8.
The comparison of peak value of mooring line tension between numerical simulations and experiment results.
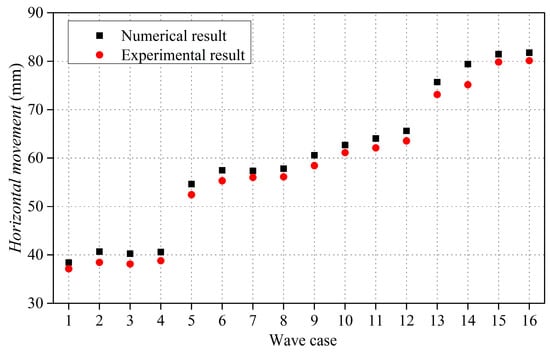
Figure 9.
The comparison of horizontal movement of the net between the numerical and experiment results.
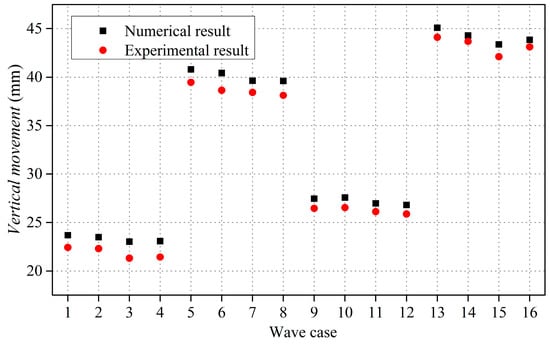
Figure 10.
The comparison of vertical movement of the net between the numerical and experiment results.
Experimental and calculation errors led to the difference between experimental and numerical results. The relative error can be calculated by the following formula,
where represents the numerical maximum mooring line tension or motion response; represents the experimental maximum mooring line tension or motion response.
By analyzing the data in Figure 8, the maximum relative error and mean error between the experimental and numerical results of maximum mooring line tension under different conditions are 4.6% and 3.0%, respectively. The largest relative errors of the horizontal movement is 5.8% and the mean relative errors is 3.8%; the largest relative and mean errors of the vertical movement are 8.0% and 4.3%, respectively. The relative errors between the numerical and experimental results on the mooring line tension and motion response are in the range of approximately ±10%. There is good agreement between the experimental results and the numerical simulation. Therefore, the established numerical model is suitable for calculating the hydrodynamic response of a floating rope enclosure in combined wave current.
4. Results and Discussion
In the actual engineering, the mooring system of the floating rope enclosure is usually composed of different numbers of mooring lines due to complex sea conditions and special characteristics of the floating rope enclosure. The numerical results of mooring line tension distribution, force acting on the bottom of the structure, maximum mooring line tension, and the volume retention are the main focuses for this part.
4.1. Analysis for Configurations with Different number of Mooring Lines
4.1.1. Maximum Mooring Line Tension for Configurations with Different Number of Mooring Lines
Take a twelve-point floating rope enclosure under an 8 cm wave height with a period of 1.5 s combined with current of 20 cm/s as an example to find out where the maximum mooring line tension occurs in the floating rope enclosure. Due to the large number of mooring lines for mooring system and symmetry of the structure, mooring line tension on the windward side numbered in the Figure 11a is calculated by numerical model. Figure 11b shows the time history of mooring line tension of each mooring line, the mooring line tension reaches the steady state after 5 s. Compared the maximum mooring line tension of these three mooring lines, the maximum mooring line tension of No. 2 is the biggest for 0.45 N. The maximum mooring line tension for number 1 is 0.34 N and the maximum mooring line tension of number 3 mooring line is 0.29 N. The above results show that the maximum mooring line tension of the floating rope enclosure occurs on both sides of the windward and the windward side experiences more external hydrodynamic loads. This result is consistent with the results that have been found by Xu et al. [19] and Zhao et al. [3]. They investigated the mooring loads for multiple net cages and their research also shows that the maximum mooring line tension of different configurations appears at the windward of the structure and the windward endures more loads. Based on the above analyses, it may be a better choice to reinforce the windward mooring lines to withstand the external loads.
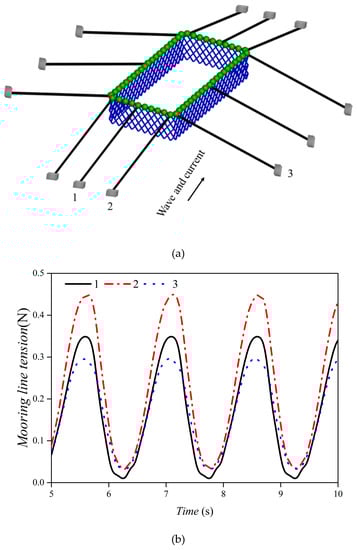
Figure 11.
Comparison of mooring line tension for different mooring lines: (a) Diagram of mooring line number, (b)Time history of mooring line tension.
4.1.2. Analysis of the Effect of Incident Wave-Current Angles
Practically at most sites, the waves are not parallel to the current. In this part, several currents and wave directions were investigated to properly represent the design site conditions. The incident wave forward along the X-axis was kept constant but the incident direction of the current was changed to investigate its influence on the maximum mooring line tension. When the wave and current are in the same direction, the angle between waves and currents is 0°. Three angles between waves and currents were set, respectively, 0°, 30° and 60°. The maximum mooring line tension of the floating rope enclosure at different angles are shown in Figure 12. With the increase of the angle between waves and currents, the maximum mooring line tension tended to decrease. When the current velocity was 0.1m /s and the wave height was 4 cm, the maximum mooring line tension under 30° and 60° decreased 4.69% and 9.17% on average compared with that under 0°; When the current velocity was 0.1 m/s and the wave height was 8 cm, the maximum mooring line tension under 30° and 60° decreased by 3.99% and 11.86% on average compared with that under 0°; when the current velocity was 0.2 m/s and the wave height was 4 cm, the maximum mooring line tension under 30° and 60° decreased to 9.93% and 13.17% on average compared with that under 0°; when the current velocity was 0.2 m/s and the wave height was 8 cm, the maximum mooring line tension under 30° and 60° decreased 6.67% and 17.8% on average compared with that under 0°. From the above analysis, when the wave and the current were in the same direction, the mooring line tension was the largest. Increasing the incident angle between waves and currents helps to reduce the maximum mooring line tension. Increasing the angle between waves and currents has a better effect on reducing the maximum mooring line tension under a higher current velocity.
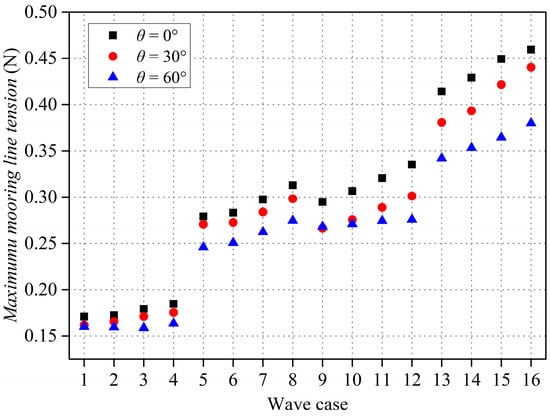
Figure 12.
Comparison of mooring line tension for different angles between currents and waves.
4.1.3. Analysis of Net Tension in Representative Position
The bottom of the floating rope enclosure is important for fixing the shape of the whole structure and preventing fish from escaping. Excessive force acting on the bottom may cause the net to separate from the seabed, or the motion of the gravity system, which is harmful for the security of the whole structure. The net tension of the bottom is closely related to the design of the weight system. The connection between the net and the mooring line is at a relatively weak position because the net here bears more mooring line tension than in other positions. Therefore, it is of great importance to study the net tension in connection to ensure the safety of the whole structure. Figure 13 shows the maximum net tension in the bottom and the net tension of three connections between mooring lines and net (shown in Figure 11a). As seen from Figure 13a, the maximum net tension of the bottom under combined waves and currents is much less than that of the connection. This can be explained by the attenuation effect of waves as water depth increases. The net tension of connection 2 under combined waves and currents is the largest compared with other connections and the mooring line tension here is also the largest. However, when the wave height is 4 cm, the net tension at connection 1 is less than that of connection 3; when the wave height is 8 cm, the net tension is slightly greater than the net tension at connection 3. This difference may be due to the inconsistent orientation of the mooring lines. Figure 13b shows the maximum net tension under current only. Under the action of the current only, the net tension at connection 2 is still the largest and the net tension at the bottom is the smallest. As for connections 1 and 3, when the current velocity is 0.1 m/s and 0.2 m/s, the net tension at connection 1 is less than that at connection 3. When the current velocity is greater than 0.2 m/s, the net tension at connection 1 is greater than that at connection 3, and as the current velocity increases, the difference between them increases.
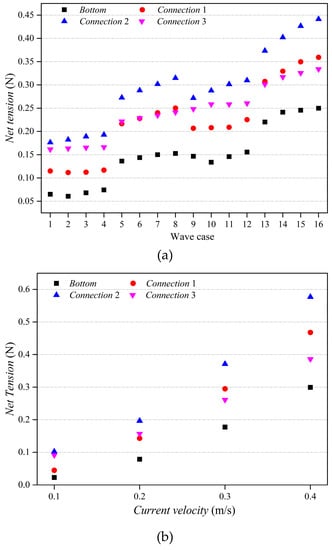
Figure 13.
Maximum mooring line tension for floating rope enclosure induced by various wave-current conditions: (a) net tension under combined waves and currents, (b) net tension under currents only.
4.2. Influence of Different Mooring Arrangements on the Hydrodynamic Characteristics of Floating Rope Enclosure
The number of mooring lines is a significant design factor that needs to be analyzed. The enclosure may have a violent deformation and give rise to damage of the structure with a small number of mooring lines. A large number of mooring lines affects the flexible characteristics of the floating rope enclosure. Therefore, in this part, four configurations with different amounts of mooring lines are proposed. Through these configurations, the effect of the number of mooring lines on the mooring line tension and volume retention is analyzed. Figure 14 shows the three-dimensional representation of the floating rope enclosure with various mooring systems.
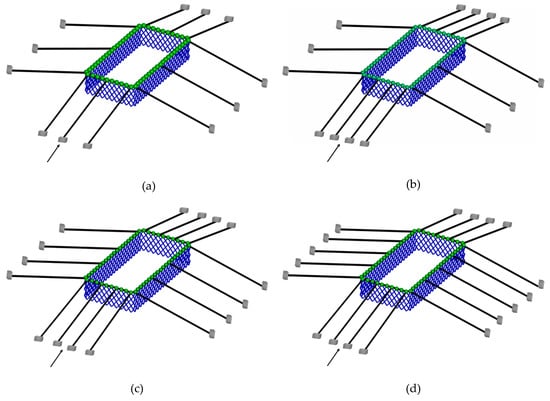
Figure 14.
Diagram of floating rope enclosure with different amount of mooring system. (a) Configuration A; (b) Configuration B; (c) Configuration C; (d) Configuration D.
According to the combined wave current given in the third part of the paper, the changes of the maximum mooring line tension and volume retention under four different configurations are calculated by a numerical model. Figure 15 shows the variation trend of the maximum mooring line tension for the four configurations. Figure 16 shows the comparison of the volume retention among the four configurations. The maximum mooring line tension of Configuration A is the largest. Compared with Configuration A, the maximum mooring line tension of Configurations B-D, reduced by 7.0% on average. However, the gap between maximum mooring line tension of Configurations B-D is very small. The maximum mooring line of the whole structure appears on the mooring lines at both ends of the windward. Compared with Configuration A, there are more mooring lines for Configuration B on the windward side to help reduce the maximum mooring line tension. Although the total number of mooring lines for Configurations C-D increased, the number of windward mooring line did not change, only the number of lateral mooring lines increased, so there is almost no change for the maximum mooring line tension of Configurations C-D compared with Configuration B. It can be concluded by the above analysis that increasing the number of windward mooring lines is of great help in reducing the maximum mooring line tension but increasing the number of lateral mooring lines does little to reduce the maximum mooring line tension.
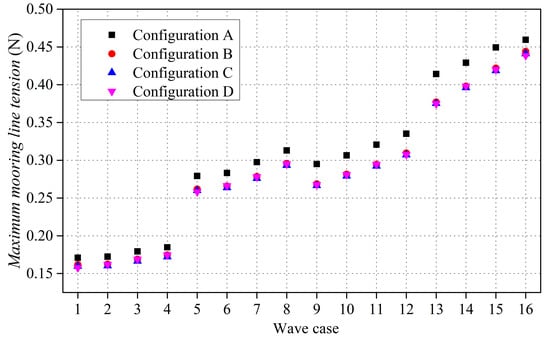
Figure 15.
Maximum mooring line tension for Configurations A-D under waves and currents.
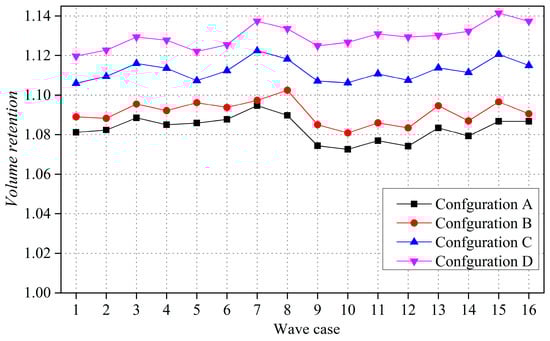
Figure 16.
Volume retention for Configurations A-D under waves and currents.
Volume retention is used to represent the change of floating rope enclosure volume under the action of current. Under the action of combined wave-current, the flexible structure endures serious deformation, which makes the volume of aquaculture water smaller and even scratches the fish. The aquaculture water area of floating is much larger than that of the net cage, the volume loss may be small relative to the total volume, so volume loss is not a big problem for a floating rope enclosure. However, due to the flexibility, the volume of floating rope enclosure increases with the action of combined wave current. The increase of volume indicates that the net deformation increases and a too large deformation may cause the net to tear, which endangers the safety of the whole structure. Therefore, for the floating rope enclosure, it is appropriate to keep the volume relatively stable. Variations in volume retention of different configurations are shown in Figure 16. Configuration A has the smallest volume retention, that is to say that it is also the most stable. The volume retention of Configurations B-D increases with the increase of the amount of mooring lines. This may be due to the fact that the floating rope enclosure is a pure flexible structure. The more mooring lines there are, the stronger the pulling force acting on it, which results in an increase of the increasing volume.
5. Conclusions
In this study, the hydrodynamic response of a floating rope enclosure with different mooring systems exposed to combined wave current was investigated by experimental test and numerical simulation. By comparing the numerical simulation results and the experimental results, it is indicated that the numerical model based on the lump mass method is suitable for analyzing the hydrodynamic response of a floating rope enclosure.
- (1)
- For the floating rope enclosure, the maximum mooring line tension of the floating rope enclosure occurs on both sides of the windward and the windward side experiences the largest external hydrodynamic loads. Increasing the amount of mooring lines on the windward side is helpful to reduce the maximum mooring line tension.
- (2)
- At most sites, the waves are not parallel to the current. When the wave and the current are in the same direction, the mooring line tension is the largest. Increasing the incident angle between waves and currents helps to reduce the maximum mooring line tension. Increasing the angle between waves and currents will have a better effect on reducing the maximum mooring line tension under a higher current velocity.
- (3)
- The maximum net tension of the bottom is much less than that of the connection. The net tension of connection 2 (side of the windward) under combined waves and currents is the largest compared with other connections.
- (4)
- The volume retentions of four configuration of the floating rope enclosure with different mooring system were compared. The numerical results indicate that the volume retention of the floating rope enclosure increases with the increasing amount of mooring lines.
Author Contributions
Conceptualization, Y.-P.Z.; formal analysis, H.Y.; funding acquisition, Y.-P.Z. and Y.C.; investigation, C.-W.B.; methodology, H.Y. and C.-W.B.; resources, Y.C.; supervision, Y.-P.Z. and Y.C.; writing—original draft, H.Y.; writing—review and editing, Y.-P.Z. and C.-W.B. All authors have read and agreed to the published version of the manuscript.
Funding
This work was financially supported by the Maritime S&T Fund of Shandong Province for Pilot National Laboratory for Marine Science and Technology (Qingdao), project no. 2018SDKJ0303-4; National Natural Science Foundation of China (NSFC), project nos. 51822901, 31872610, and 31972843; and China Agriculture Research System, no. CARS-47-22.
Acknowledgments
The authors acknowledge the financial support from National Natural Science Foundation of China, Maritime S&T Fund of Shandong Province for Pilot National Laboratory for Marine Science and Technology (Qingdao) and China Agriculture Research System.
Conflicts of Interest
The authors declare no conflict of interest.
References
- Lader, P.F.; Fredheim, A. Dynamic properties of a flexible net sheet in waves and current—A numerical approach. Aquacult. Eng. 2006, 35, 228–238. [Google Scholar] [CrossRef]
- Moe, H.; Fredheim, A.; Hopperstad, O.S. Structural analysis of aquaculture net cages incurrent. J. Fluids Struct. 2010, 26, 503–516. [Google Scholar] [CrossRef]
- Zhao, Y.P.; Bi, C.W.; Chen, C.P.; Li, Y.C.; Dong, G.H. Experimental study on flow velocity and mooring loads for multiple net cages in steady current. Aquacult. Eng. 2015, 67, 24–31. [Google Scholar] [CrossRef]
- Lader, P.F.; Olsen, A.; Jensen, A.; Sveen, J.K.; Fredheim, A.; Enerhaug, B. Experimental investigation of the interaction between waves and net structures—Damping mechanism. Aquacult. Eng. 2007, 37, 100–114. [Google Scholar] [CrossRef]
- Lader, P.F.; Jensen, A.; Sveen, J.K.; Fredheim, A.; Enerhaug, B.; Fredriksson, D. Experimental investigation of wave forces on net structures. Appl. Ocean Res. 2007, 29, 112–127. [Google Scholar] [CrossRef]
- Lader, P.; Dempster, T.; Fredheim, A.; Jensen, Ø. Current induced net deformations in full-scale sea-cages for Atlantic salmon (Salmo salar). Aquacult. Eng. 2008, 38, 52–65. [Google Scholar] [CrossRef]
- Dong, G.H.; Zheng, Y.N.; Li, Y.C.; Teng, B.; Guan, C.T.; Lin, D.F. Experiments on wave transmission coefficients of floating breakwaters. Ocean Eng. 2008, 35, 931–938. [Google Scholar] [CrossRef]
- Zhao, Y.P.; Guan, C.T.; Bi, C.W.; Liu, H.F.; Cui, Y. Experimental Investigations on Hydrodynamic Responses of a Semi-Submersible Offshore Fish Farm in Waves. J. Mar. Sci. Eng. 2019, 7, 238. [Google Scholar] [CrossRef]
- Balash, C.; Colbourne, B.; Bose, N.; Raman-Nair, W. Aquaculture net drag force and added mass. Aquacult. Eng. 2009, 41, 14–21. [Google Scholar] [CrossRef]
- Moe-Føre, H.; Lader, P.F.; Lien, E.; Hopperstad, O.S. Structural response of high solidity net cage models in uniform flow. J. Fluids Struct. 2016, 65, 180–195. [Google Scholar] [CrossRef]
- Swift, M.R.; Fredriksson, D.W.; Unrein, A.; Fullertonc, B.; Patursson, O.; Baldwin, K. Drag force acting on biofouled net panels. Aquaclt. Eng. 2006, 35, 292–299. [Google Scholar] [CrossRef]
- Bi, C.W.; Zhao, Y.P.; Dong, G.H.; Wu, Z.M.; Zhang, Y.; Xu, T.J. Drag on and flow through the hydroid-fouled nets in currents. Ocean Eng. 2018, 161, 195–204. [Google Scholar] [CrossRef]
- Li, Y.C.; Zhao, Y.P.; Gui, F.K.; Teng, B. Numerical simulation of the hydrodynamic behavior of submerged plane nets in current. Ocean Eng. 2006, 33, 2352–2368. [Google Scholar] [CrossRef]
- Zhao, Y.P.; Li, Y.C.; Dong, G.H.; Gui, F.K.; Teng, B. Numerical simulation of the effects of structure size ratio and mesh type on three-dimensional deformation of the fishing-net gravity cage in current. Aquacult. Eng. 2007, 36, 285–301. [Google Scholar] [CrossRef]
- Yang, C.K.; Choi, Y.R.; Kim, H.J.; Hong, K. A study on the hydrodynamic behavior of fisheries cages in waves. In Proceedings of the Twelfth International Offshore and Polar Engineering Conference, Kitakyushu, Japan, 26–31 May 2002; pp. 726–732. [Google Scholar]
- Tsukrov, I.; Eroshkin, O.; Fredriksson, D.W.; Swift, M.R.; Celikkol, B. Finite element modeling of net panels using a consistent net element. Ocean Eng. 2003, 30, 251–270. [Google Scholar] [CrossRef]
- Tsukrov, I.; Eroshkin, O.; Paul, W.; Celikkol, B. Numerical modeling of nonlinear elastic components of mooring systems. IEEE J. Oceanic Eng. 2005, 30, 37–46. [Google Scholar] [CrossRef]
- Kristiansen, T.; Faltinsen, O.M. Modelling of current loads on aquaculture net cages. J. Fluids Struct. 2012, 34, 218–235. [Google Scholar] [CrossRef]
- Xu, T.J.; Zhao, Y.P.; Dong, G.H.; Li, Y.C.; Gui, F.K. Analysis of hydrodynamic behaviors of multiple net cages in combined wave-current flow. J. Fluids Struct. 2013, 39, 222–236. [Google Scholar] [CrossRef]
- Fredriksson, D.W.; Swift, M.R.; Eroshkin, O.; Tsukrov, I.; Irish, J.D.; Celikkol, B. Moored fish cage dynamics in waves and currents. IEEE J. Oceanic Eng. 2005, 30, 28–36. [Google Scholar] [CrossRef]
- Lee, C.W.; Kim, Y.B.; Lee, G.H.; Choe, M.Y.; Lee, M.K.; Koo, K.Y. Dynamic simulation of a fish cage system subjected to currents and waves. Ocean Eng. 2008, 35, 1521–1532. [Google Scholar] [CrossRef]
- Fredriksson, D.W.; DeCew, J.C.; Tsukrov, I.; Swift, M.R.; Irish, J.D. Development of large fish farm numerical modeling techniques with in-situ mooring tension comparisons. Aquacult. Eng. 2007, 36, 137–148. [Google Scholar] [CrossRef]
- Huang, C.C.; Pan, J.Y. Mooring line fatigue: A risk analysis for an SPM cage system. Aquacult. Eng. 2010, 42, 8–16. [Google Scholar] [CrossRef]
- Decew, J.; Tsukrov, I.; Risso, A.; Swift, M.R.; Celikkol, B. Modeling of dynamic behavior of a single-point moored submersible fish cage under currents. Aquacult. Eng. 2010, 43, 38–45. [Google Scholar] [CrossRef]
- Xu, T.J.; Dong, G.H.; Zhao, Y.P.; Li, Y.C.; Gui, F.K. Numerical investigation of the hydrodynamic behaviors of multiple net cages in waves. Aquacult. Eng. 2012, 48, 6–18. [Google Scholar] [CrossRef]
- Théret, F. Etude de l’ équilibre de surfaces reticules places dans un courant uniforme (application aux chalets). Ph.D. Thesis, Université de Nantes, Ecole Centrale de Nantes, Nantes, France, July 1993. [Google Scholar]
- Brebbia, C.A.; Walker, S. Dynamic Analysis of Offshore Structures; Newnes-Butterworths: London, UK, 1979; pp. 109–143. [Google Scholar]
- Choo, Y.I.; Casarella, M.J. Hydrodynamic resistance of towed cables. J. Hydronautics 1971, 5, 126–131. [Google Scholar]
- Fredheim, A.; Faltinsen, O.M. Hydroelastic analysis of a fishing net in steady inflow conditions. In Proceedings of the 3rd International Conference on Hydroelasticity in Marine Technology, University ofOxford, Oxford, UK, 15–17 September 2003. [Google Scholar]
- Wilson, B.W. Elastic characteristics of moorings. J. Waterways Harbors Div. 1967, 93, 27–56. [Google Scholar]
- Gerhard, K. Fiber Ropes for Fishing Gear. FAO Fishing Manuals; Fishing News Books Ltd.: Farnham, UK, 1983; pp. 81–124. [Google Scholar]
- Gui, F.K. Hydrodynamic behaviors of deep-water gravity cage. Ph.D. Thesis, Dalian University of Technology, Dalian, China, May 2006. [Google Scholar]
- Li, Y.C.; Gui, F.K.; Teng, B. Hydrodynamic behavior of a straight floating pipe under wave conditions. Ocean Eng. 2006, 34, 552–559. [Google Scholar] [CrossRef]
© 2020 by the authors. Licensee MDPI, Basel, Switzerland. This article is an open access article distributed under the terms and conditions of the Creative Commons Attribution (CC BY) license (http://creativecommons.org/licenses/by/4.0/).