Article

Sea Level Rise Scenario for 2100 A.D. in the Heritage Site of Pyrgi (Santa Severa, Italy)

1
Istituto Nazionale di Geofisica e Vulcanologia, 56126 Pisa, Italy
2
Radboud Radio Lab, Department of Astrophysics/IMAPP, Radboud University— Nijmegen, 6500GL Nijmegen, The Netherlands
3
Lesia Observatoire de Paris, Université PSL, CNRS, Sorbonne Université, Université de Paris, 92195 Meudon, France
4
School of Engineering, Università della Basilicata, 85100 Potenza, Italy
5
Museo del Mare e della Navigazione Antica, 00058 Santa Severa, Italy
*
Author to whom correspondence should be addressed.
J. Mar. Sci. Eng. 2020, 8(2), 64; https://doi.org/10.3390/jmse8020064
Submission received: 29 November 2019 / Revised: 9 January 2020 / Accepted: 15 January 2020 / Published: 21 January 2020
(This article belongs to the Special Issue Remote Sensing in Coastline Detection)

Abstract

:
Sea level rise is one of the main risk factors for the preservation of cultural heritage sites located along the coasts of the Mediterranean basin. Coastal retreat, erosion, and storm surges are posing serious threats to archaeological and historical structures built along the coastal zones of this region. In order to assess the coastal changes by the end of 2100 under the expected sea level rise of about 1 m, we need a detailed determination of the current coastline position based on high resolution Digital Surface Models (DSM). This paper focuses on the use of very high-resolution Unmanned Aerial Vehicles (UAV) imagery for the generation of ultra-high-resolution mapping of the coastal archaeological area of Pyrgi, Italy, which is located near Rome. The processing of the UAV imagery resulted in the generation of a DSM and an orthophoto with an accuracy of 1.94 cm/pixel. The integration of topographic data with two sea level rise projections in the Intergovernmental Panel on Climate Change (IPCC) AR5 2.6 and 8.5 climatic scenarios for this area of the Mediterranean are used to map sea level rise scenarios for 2050 and 2100. The effects of the Vertical Land Motion (VLM) as estimated from two nearby continuous Global Navigation Satellite System (GNSS) stations located as close as possible to the coastline are included in the analysis. Relative sea level rise projections provide values at 0.30 ± 0.15 cm by 2050 and 0.56 ± 0.22 cm by 2100 for the IPCC AR5 8.5 scenarios and at 0.13 ± 0.05 cm by 2050 and 0.17 ± 0.22 cm by 2100, for the IPCC Fifth Assessment Report (AR5) 2.6 scenario. These values of rise correspond to a potential beach loss between 12.6% and 23.5% in 2100 for Representative Concentration Pathway (RCP) 2.6 and 8.5 scenarios, respectively, while, during the highest tides, the beach will be provisionally reduced by up to 46.4%. In higher sea level positions and storm surge conditions, the expected maximum wave run up for return time of 1 and 100 years is at 3.37 m and 5.76 m, respectively, which is capable to exceed the local dune system. With these sea level rise scenarios, Pyrgi with its nearby Etruscan temples and the medieval castle of Santa Severa will be exposed to high risk of marine flooding, especially during storm surges. Our scenarios show that suitable adaptation and protection strategies are required.

1. Introduction

Observational and instrumental data collected worldwide since the last two-three centuries show that the global sea level is continuously rising with an accelerated trend in recent years, which coincides with the rise in global temperatures [1]. Global mean sea level is expected to rise by about 75 to 200 cm by 2100 in the worst scenarios [2,3,4,5], i.e., the most serious effects of climate change that might occur in future decades. These values will be even larger in subsiding coasts of the Mediterranean, entailing widespread environmental changes, coastal retreat, marine flooding, and loss of land, which will be disadvantages for human activities. The sea level rise will amplify the impacts exerted by a multitude of hazards (i.e., storm surges, flooding, coastal erosion, and tsunamis) on the infrastructure and building integrity, people safety, economic assets, and cultural heritage.
Therefore, it is important to mitigate these risks by providing multi-temporal scenarios of expected inland extension of marine flooding as a consequence of the sea level rise for a cognizant coastal management [6,7,8].
This is particularly true for the Mediterranean region where ancient civilizations were born and developed along its coasts [9,10]. A large number of heritage sites are located at the waterfront or very close to the sea level and are exposed to marine flooding under the effects of ongoing climate change. A large part of these sites, which are dated back to the Greek, Roman, and Medieval ages, are exposed at increasing risks to coastal hazards that are related to a sea-level rise [10].
Aerial photogrammetric surveys performed by small Unmanned Aerial Vehicles (UAVs) can provide accurate topography at low costs and, in short time, for small areas with respect to conventional aerial surveys [11]. Results, when analyzed in combination with sea level rise projections and vertical land movements (VLM), can support the realization of the expected sea-level rise and storm surge scenarios for future decades [12].
In this study, we show an effective application for the coastal archaeological area of Pyrgi, Italy, which is near Rome (Figure 1). High resolution maps of expected flooded areas and coastal positions for 2100, even in storm surge conditions, are reported in this paper.
Our approach is to apply a multidisciplinary methodology previously tuned in the savemedcoasts project (www.savemedcoasts.eu), which includes topography, geodesy, sea level data, and climatic projections to estimate realistic sea level rise scenarios for targeted coastal areas. Our approach provides a useful analytical tool to identify the best adaptation and defense strategies against the sea level rise impact, and to protect heritage sites. The results help decision-makers in the selection of the best practical actions aimed at preserving the archaeological and historical sites located in coastal areas that are subjected to sea level-related risks. The proposed methodology can be exported in other areas of the Mediterranean region and beyond its borders.

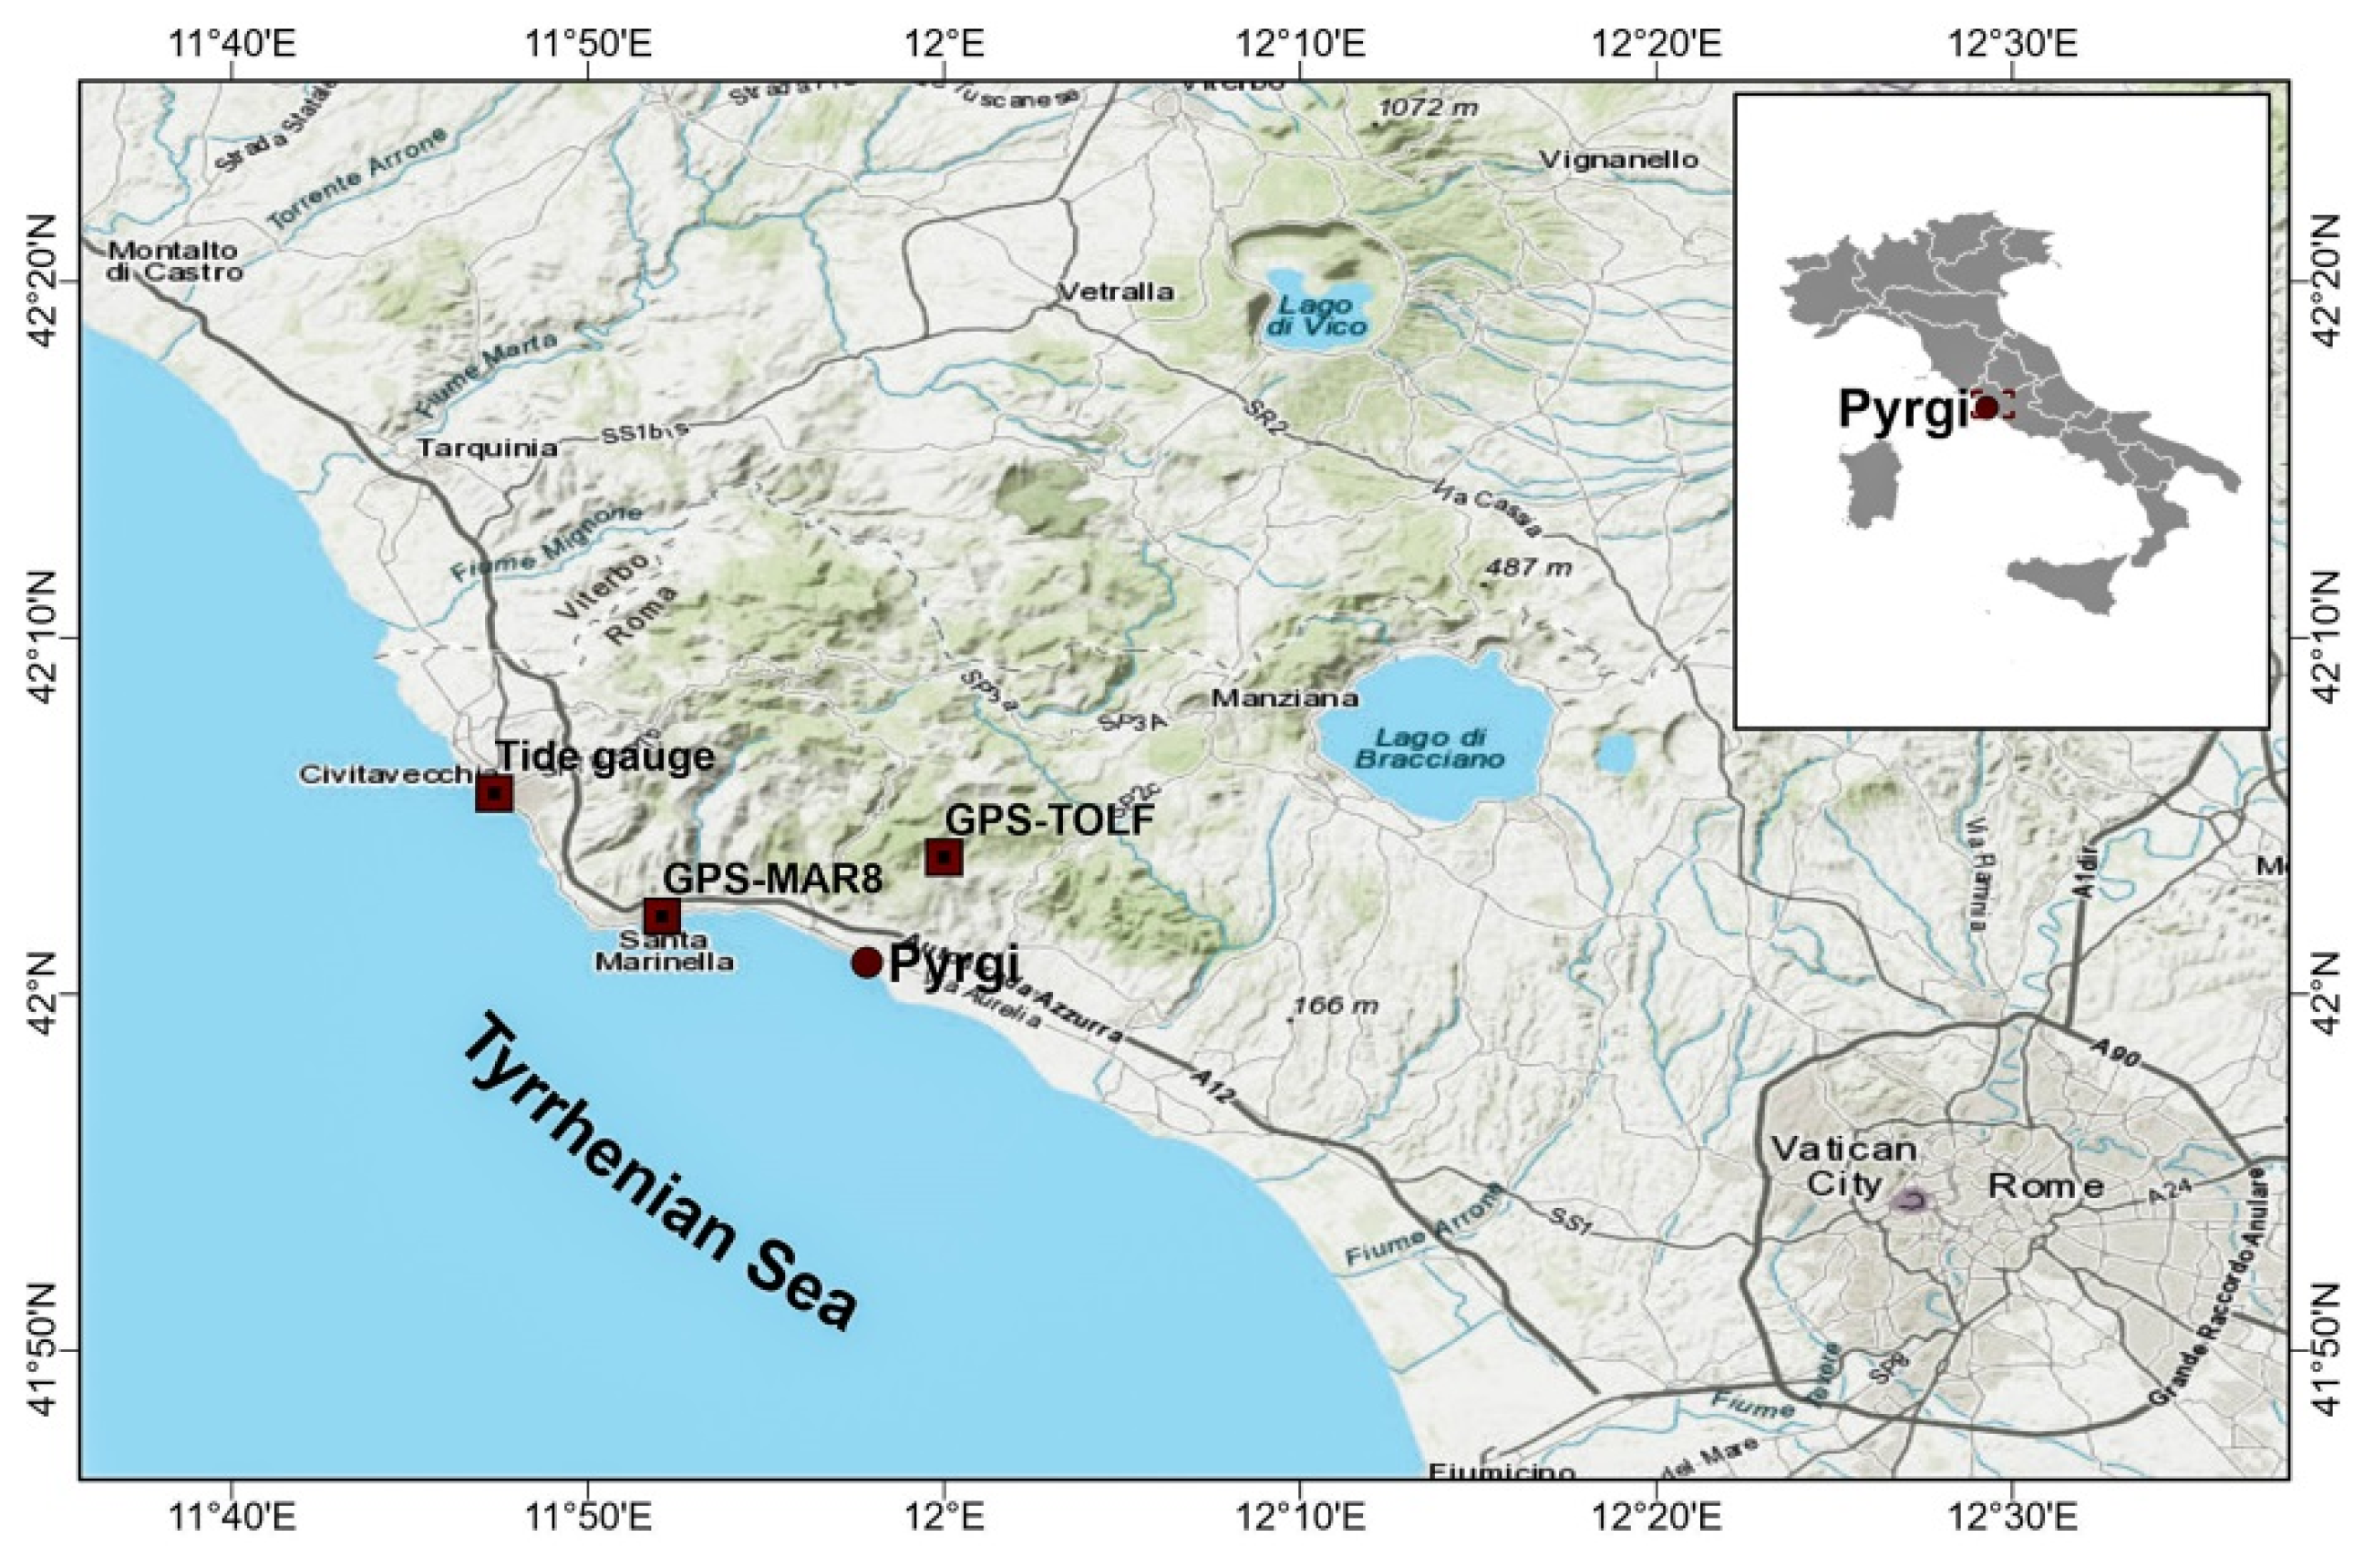
2. Geo-Archaeological Setting

The heritage site of Pyrgi is located along the coasts of Northern Latium, between the villages of Santa Severa and Cerveteri, which is about 50 km north of Rome (Italy) (Figure 1). The area includes the Castle of Santa Severa that, with Pyrgi, is one of the most important heritage sites of the Tyrrhenian coast. The area has been settled since the V-IV millennium B.C. [13] and continuously developed during the Neolithic Age, during the Bronze Age (II millennium B.C.), and during the Iron Age (IX-VIII century B.C.), thanks to its good environmental conditions. In the Etruscan phase (VII-IV century B.C.), Pyrgi was the port of the ancient Etruscan city of Caere and played an important role in the maritime commerce being frequented by Greeks and Phoenicians ships. The area includes a sanctuary and the temples of Eileithyia-Leukothea and Apollo, Cavatha, Suri, and the Etruscan Uni analogue to the Phoenician Astarte [13].
After the Romanization of this area (III century B.C.), Pyrgi became a maritime colony and a tall fortress surrounded by a polygonal wall was built on part of the Etruscan settlement.
During the Roman imperial age, the city of Pyrgi continued to be frequented until the 5th-6th century A.D. when a Byzantine castrum was built on its remains with the early Christian church of Santa Severa inside.
Later, the medieval and renaissance village became a large farm located in a strategic position between the main harbors of Rome and Civitavecchia [13,14,15,16]. In terms of its geological setting, the coast of Pyrgi belongs to the roman co-magmatic province [17] that underwent major volcanic activity during the Plio-Pleistocene era (Figure 2). The surface geology is characterized by a bedrock belonging to the allochthonous Outer Ligurids [18], represented by the Tolfa Formation, spanning from the Late Cretaceous to Palaeogene [19], defined as the Pietraforte formation and “comprehensive succession” [20]. The latter consists of a series of marl limestone and grey marl beds that outcrop between Rome and Civitavecchia underlying the Pietraforte unit. Biogenic sandstones of the Early-Middle Pleistocene Panchina Formation partly overlies the Pietraforte [21].
The Holocene deposits are represented by travertines, slope debris, alluvial, weathering deposits, gravels, and sandy beaches [22]. The neotectonic of this sector of the Tyrrhenian coast of Italy is marked by the elevation of the MIS 5.5 marine terraces that show stability and a weak uplift of the inland sector for the last 124 years [23,24], which is related to magmatic injections under the Vulsini and Sabatini volcanic complexes [24]. Reference [25] underlines that the long-term uplift may not be an appropriate description for all the past two millennia since some weak subsidence may have occurred at Pyrgi and along the nearby coasts.

3. Methods

We applied a multidisciplinary approach using coastal topography, geodesy, and climatic-driven estimates of the sea-level rise to provide maps of flooding scenarios for the year 2100 A.D. for the coast of Pyrgi. Our study consists of three main steps: (1) the realization of UAV surveys to obtain an ultra-high-resolution orthophoto and a DSM model of the coastal area to map the current and the projected coastline positions including sea level data in the analysis, (2) the estimation of the current vertical land movements from the analysis of geodetic data from the nearest GPS stations, and, (3) by combining these data with the regional IPCC-AR5 projections (RCP-2.6 and RCP-8.5 scenarios), the calculation of the upper bounds of the expected sea levels for the targeted epochs of 2050 and 2100 A.D. and the corresponding expected inland extent of the marine flooding and shoreline positions were calculated. Lastly, storm surge scenarios were implemented for return times of 1 and 100 years, for sea level rise conditions.

4. Digital Terrain Model Reconstruction

To realize the ultra-high-resolution Digital Surface Model (DSM), an aerial photogrammetric survey was performed using a radio-controlled multi-rotor Da Jiang Innovation (DJI) Phantom 4pro UAV system, equipped with a high resolution lightweight digital camera, to capture a set of aerial images of the investigated area (Table 1).
The UAV was controlled by an autopilot system using waypoints previously planned by PIX4D® capture IOs App as a Ground Control Station system. To optimize the photogrammetric spatial resolution and coverage of the surveyed area, a constant altitude of 70 m was maintained during the flight and 306 partly overlapping (70% of longitudinal and 70% lateral overlapping between subsequent photos) aerial digital photos were acquired during three successful flights of 13, 11 and 15 min of duration each. To scale the aerial images, we used a dual-frequency geodetic Global Positioning System Real Time Kinematic (GPS/RTK) receiver STONEX S900A® to measure the coordinates of a set of reference Ground Control Points (GCPs) falling in the investigated areas. GCPs positions were estimated in real time by the RTK technique with about 1 to 2 cm of accuracy, with respect to the reference GPS station TOLF. The latter is part of the GNSS network of the Istituto Nazionale di Geofisica e Vulcanologia (INGV) [26] and also pertains to the Leica SmartNet ItalPoS network (https://hxgnsmartnet.com/en-gb/) for real-time positioning services. We used the Agisoft PhotoScan® software package (http://www.agisoft.com) based on the Structure-from-Motion photogrammetry technique [27] to process the acquired georeferenced images. The analysis included: (1) camera alignment with image position and orientation, (2) generation of a dense points cloud, and (3) generation of an orthophoto covering a land surface of 0.226 km2 with a ground resolution of 1.94 cm/pixel as well as the DSM creation in the WGS84-UTM32 coordinate system.
The obtained ortho-rectified images (orthophotos) and digital elevation models were also managed by Global Mapper® and ESRI ArcGis® software to create cross sections, slope maps, surfaces, and coastline positions as well as calculate the dimension of the potential flooded areas. The extracted Digital Surface Model has a resolution of 15.5 cm/pixel and a point density of 41.5 points/m2
As targets for GCPs measured by GPS/RTK, we used a set of i) natural markers belonging to fixed structures (e.g., the center of manholes, wall and sidewalk corners, small structures, or large stones), and ii) mobile targets for the time of the flight, such as thin metal crosses of 60 × 60 cm of size, deployed in the investigated area. All these GCPs were chosen as areas recognizable on the images during data analysis.
In total, 22 Ground Control Points (GCPs) and Check Points (CPs) were used to geo-reference the orthophoto with the ground control point toolset of AGISOFT photo scan (Figure 3). The 3D coordinates of these points have been estimated with a mean RMS of 0.6 and 0.9 cm for the horizontal and vertical components, respectively, and were used to evaluate the vertical accuracy of our final DSM. Figure 3 shows the orthophoto while Figure 4 shows the DSM.

5. Tidal Correction and Coastline Position

The coast of Pyrgi, similar to most of the coasts of the Mediterranean Sea, is characterized by a micro-tidal environment and tides are generally in the range of ±30 cm. Only in the Gulf of Gabes (Tunisia) and the North Adriatic Sea (Italy), tides may reach amplitudes up to about 2 m [27,28,29,30]. We used the tidal data collected by the Italian tidal network managed by the Italian Institute for Environmental Protection and Research (ISPRA) (data are freely available at www.mareografico.it) at the sea level station of Civitavecchia (located at LAT 42°05′38.25″, LON 11°47′22.73′), which is placed near Pyrgi (Figure 1), to estimate the tide level (TL) and the local mean sea level (LMSL) at the time of the UAV surveys (26 April, 2019 at 07:30 or 05:30 UTC). We considered the complete time series to account for a long-term linear trend, representative of the mean sea level during UAV surveys, with respect to which the TL is defined. This tide gauge station shows a valid recording period of about eight years (2011–2019) with a sea level trend of 0.25 ± 0.1 mm/a, which is calculated from a linear fit on the monthly data (Figure 5a). From the data analysis, a mean tide amplitude of ~35 cm and a maximum tidal range up to ~60 cm has been estimated (Figure 5b). To define a reference level for elevation data, the mean sea level was computed propagating the linear trend from the time of surveys, assuming the mean sea level as a reference value for the year 2018. A mean sea level of 4.8 ± 11.8 cm above the topographic benchmark was estimated from the hourly tidal data. Since the UAV surveys have been performed during a high tide of 4 cm, as shown by the tidal recordings (www.mareografico.it), then the reference sea level at the time of surveys corresponds to a position of only 0.8 cm above the mean sea level for 2018.
This value is negligible compared to the DSM accuracy, so we did not consider it for the analysis of sea level rise scenarios. Lastly, we used the local mean sea level calculated at the tide station of Civitavecchia as elevation data, given the small distance between this location and Pyrgi. The obtained value was used to define the position of the coastline during the surveys and the one expected from the sea level rise scenarios to 2100 A.D.
We preferred to adopt this local vertical datum instead of the value of the geoid elevation for the Italian region provided by the International Service for the Geoid-ISG-ITG2009 (http://www.isgeoid.polimi.it/Geoid/Europe/Italy/ITG2009_g.html) [31] since it is an independent and more accurate elevation datum. The International Service for the Geoid (ISG) estimates a geoid height in the Italian Geoid (ITG) 2009 for the coastline of Pyrgi at 48.319 m. This elevation corresponds to the contour line equal to zero in the Italian height reference frame. The DSM height reference frame is 0.42 m, as estimated by GPS/RTK data at a GCP located at the sea level along the coastline. Its elevation was corrected for the tidal range at the time of the surveys. The reference mean sea level estimated by the tidal analysis provided a local mean sea level with an uncertainty of ±11.8 cm.

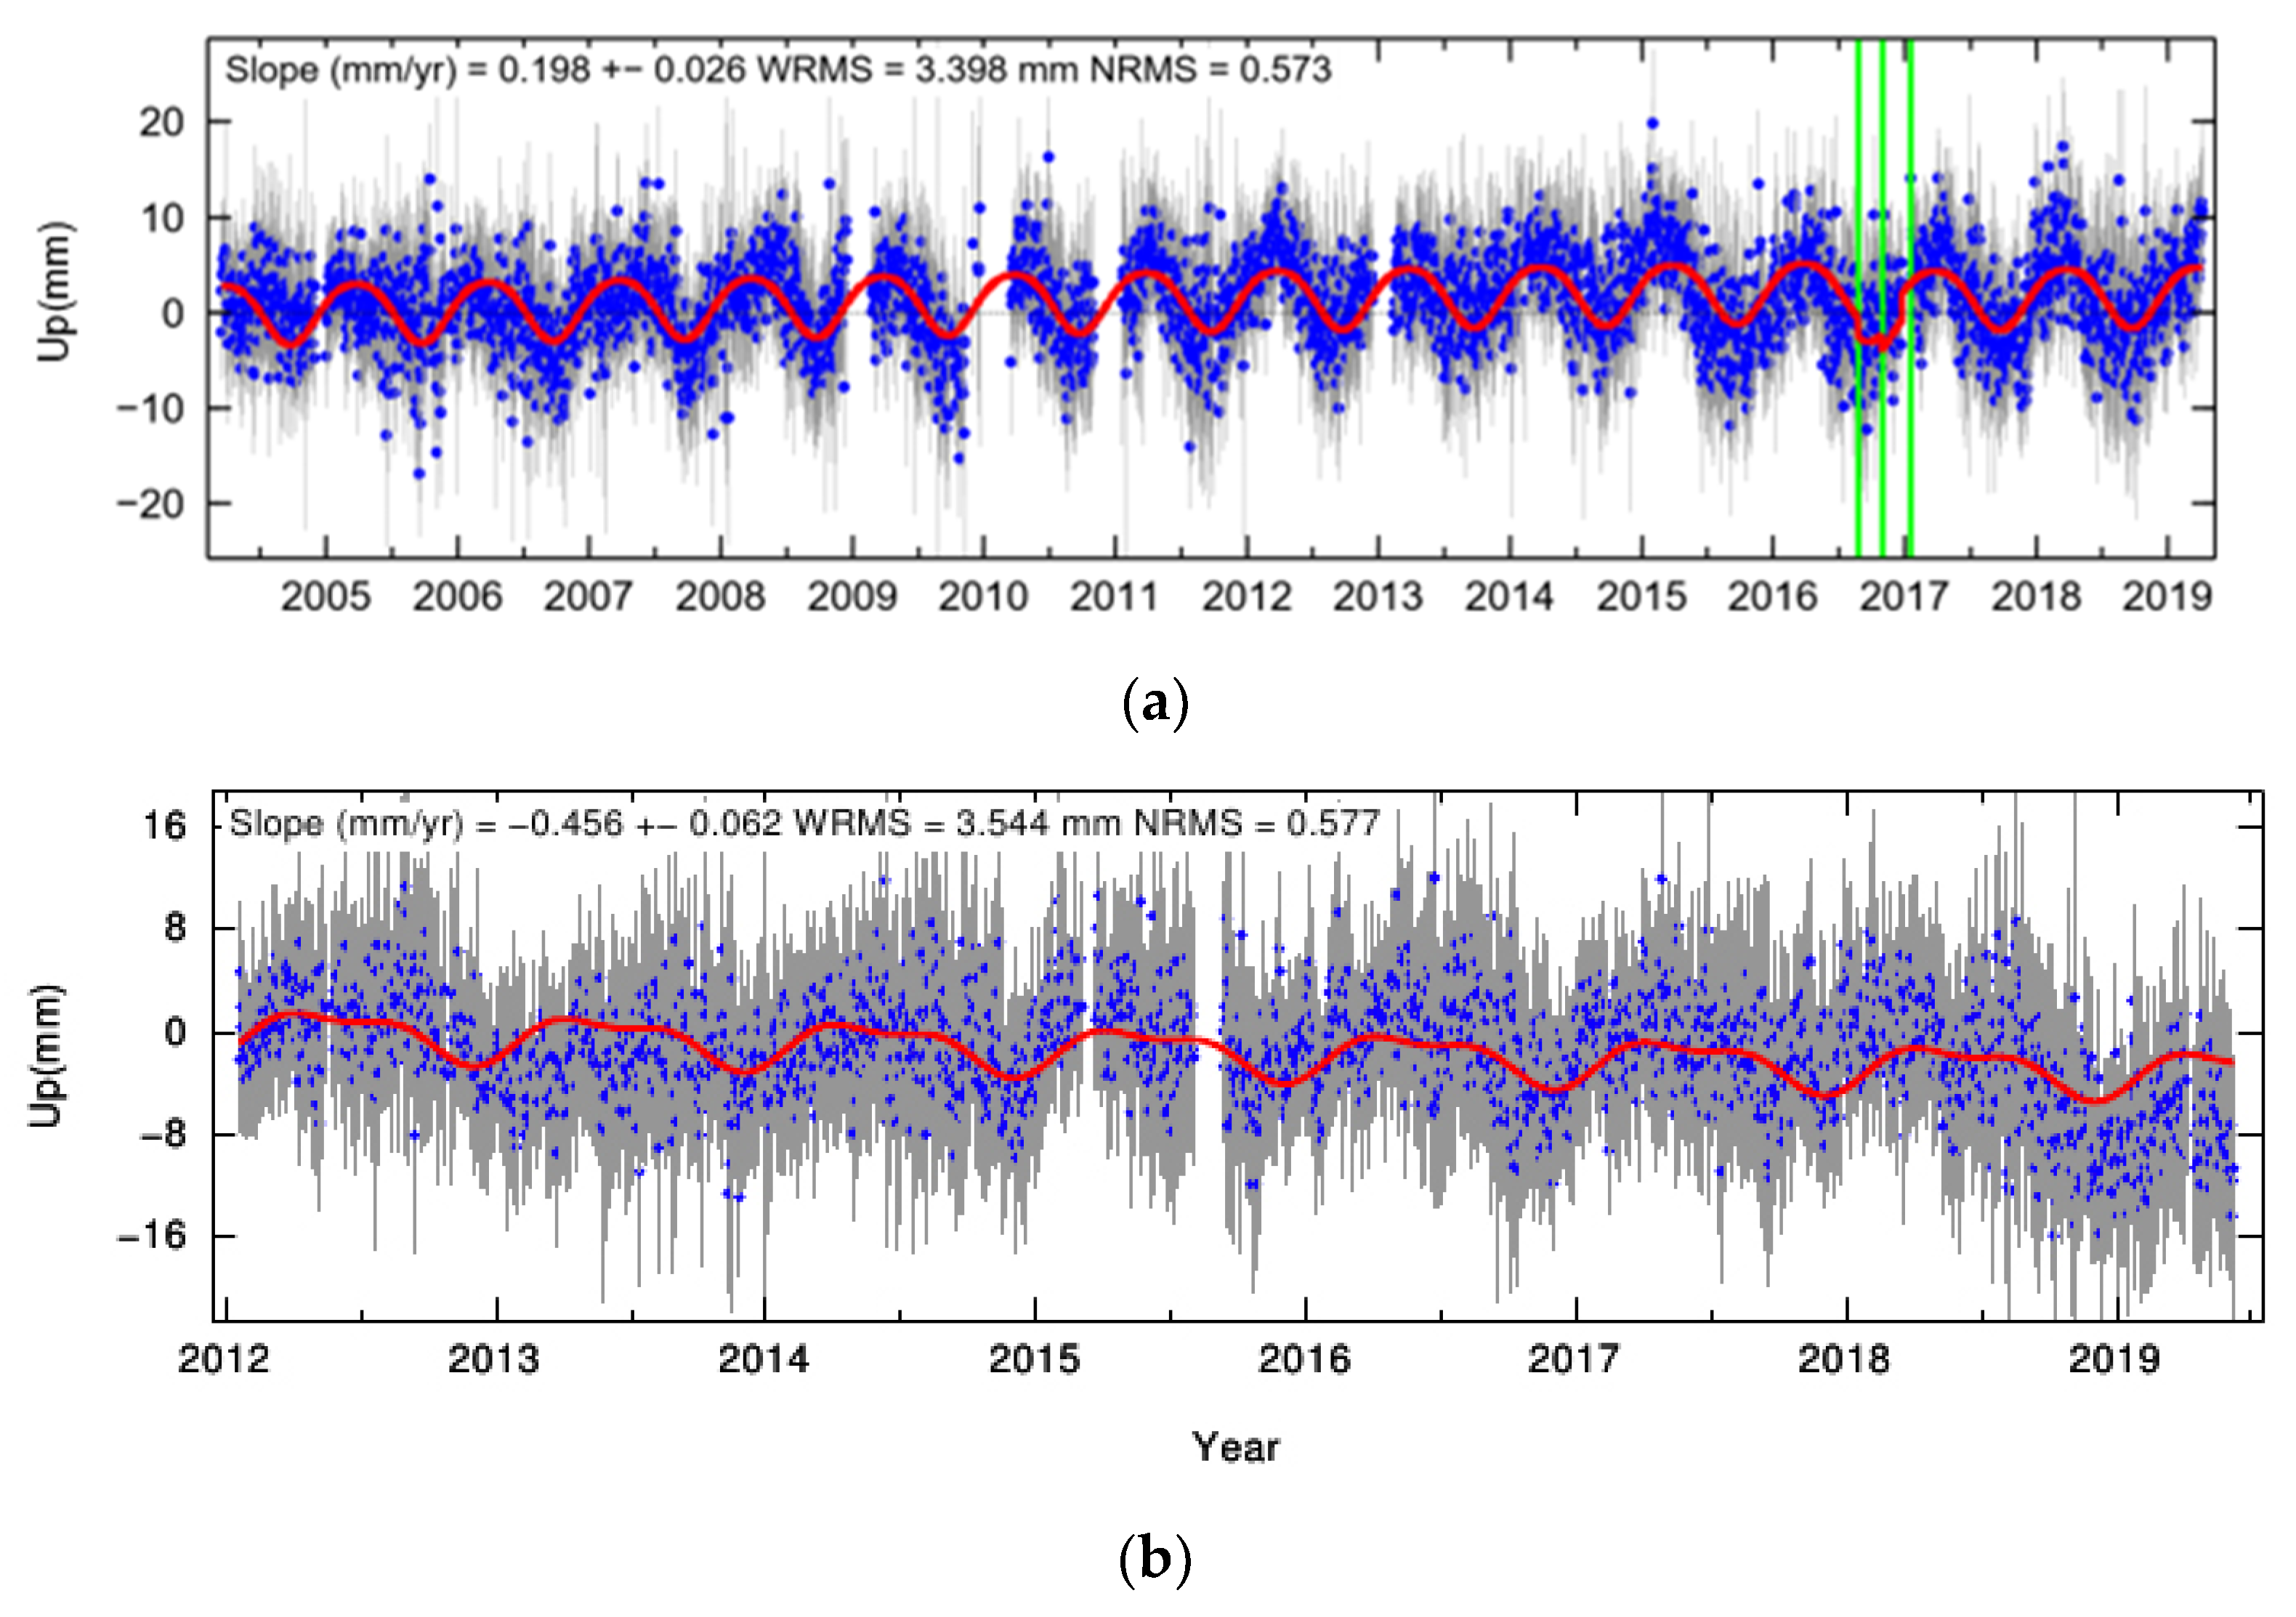
6. Vertical Land Motion (VLM) at Pyrgi

The current rate of VLM at Pyrgi was estimated by the analysis of the available GPS data collected at the nearest GNSS stations of TOLF, belonging the INGV Rete Integrata Nazionale GPS (RING) network (DOI:10.13127/RING) and MAR8, belonging to the Topcon-NetGeo network (http://www.netgeo.it). These stations, which are located at about 6.5 km and 0.3 km of distance from the study site, respectively (Figure 1), have a robust time series that span for 2004–2019 for TOLF (15.23 years) and 2012–2019 for MAR8 (7.38 years) (Figure 6).
GPS data analysis has been carried out following the procedures already described in Reference [32] and updated in Reference [33] by adopting a three-step procedure using the GAMIT/GLOBK V10.7 [34] and QOCA software. This is part of a continental-scale GPS solution including >3000 stations [34]. The daily positions of TOLF and MAR8 have been estimated in the GPS realization of the ITRF2008 frame [35], i.e., the IGb08 reference. The position time series have been analyzed in order to estimate and correct offsets due to station equipment changes while, simultaneously, estimating annual and semi-annual periodic signals and a linear velocity term, whereas velocity uncertainties have been estimated adopting a power law + white noise stochastic model, as in Reference [36]. The results show that both sites are relatively stable in the IGb08 reference frame with a vertical velocity of −0.061 ± 0.135 mm/year for TOLF and −0.456 ± 0.344 mm/year for MAR8. We remark that uncertainties associated on the vertical velocities are about ±0.5 mm/year and are barely significant in view of unresolved questions about the GPS reference frame stability and additional factors [30].
In addition to GPS data, the tectonic stability of this region is also inferred from the low level of seismicity deduced from historical data [37] and instrumental recordings of earthquakes (www.ingv.it), which do not report the occurrence of significant events for the last 3000 years BP.
Lastly, assuming that the area will continue in the near future to have the same tectonic trend shown in the past, it is reasonable to neglect the contribution of VLM in the sea level rise projections and flooding scenarios for 2100 A.D.

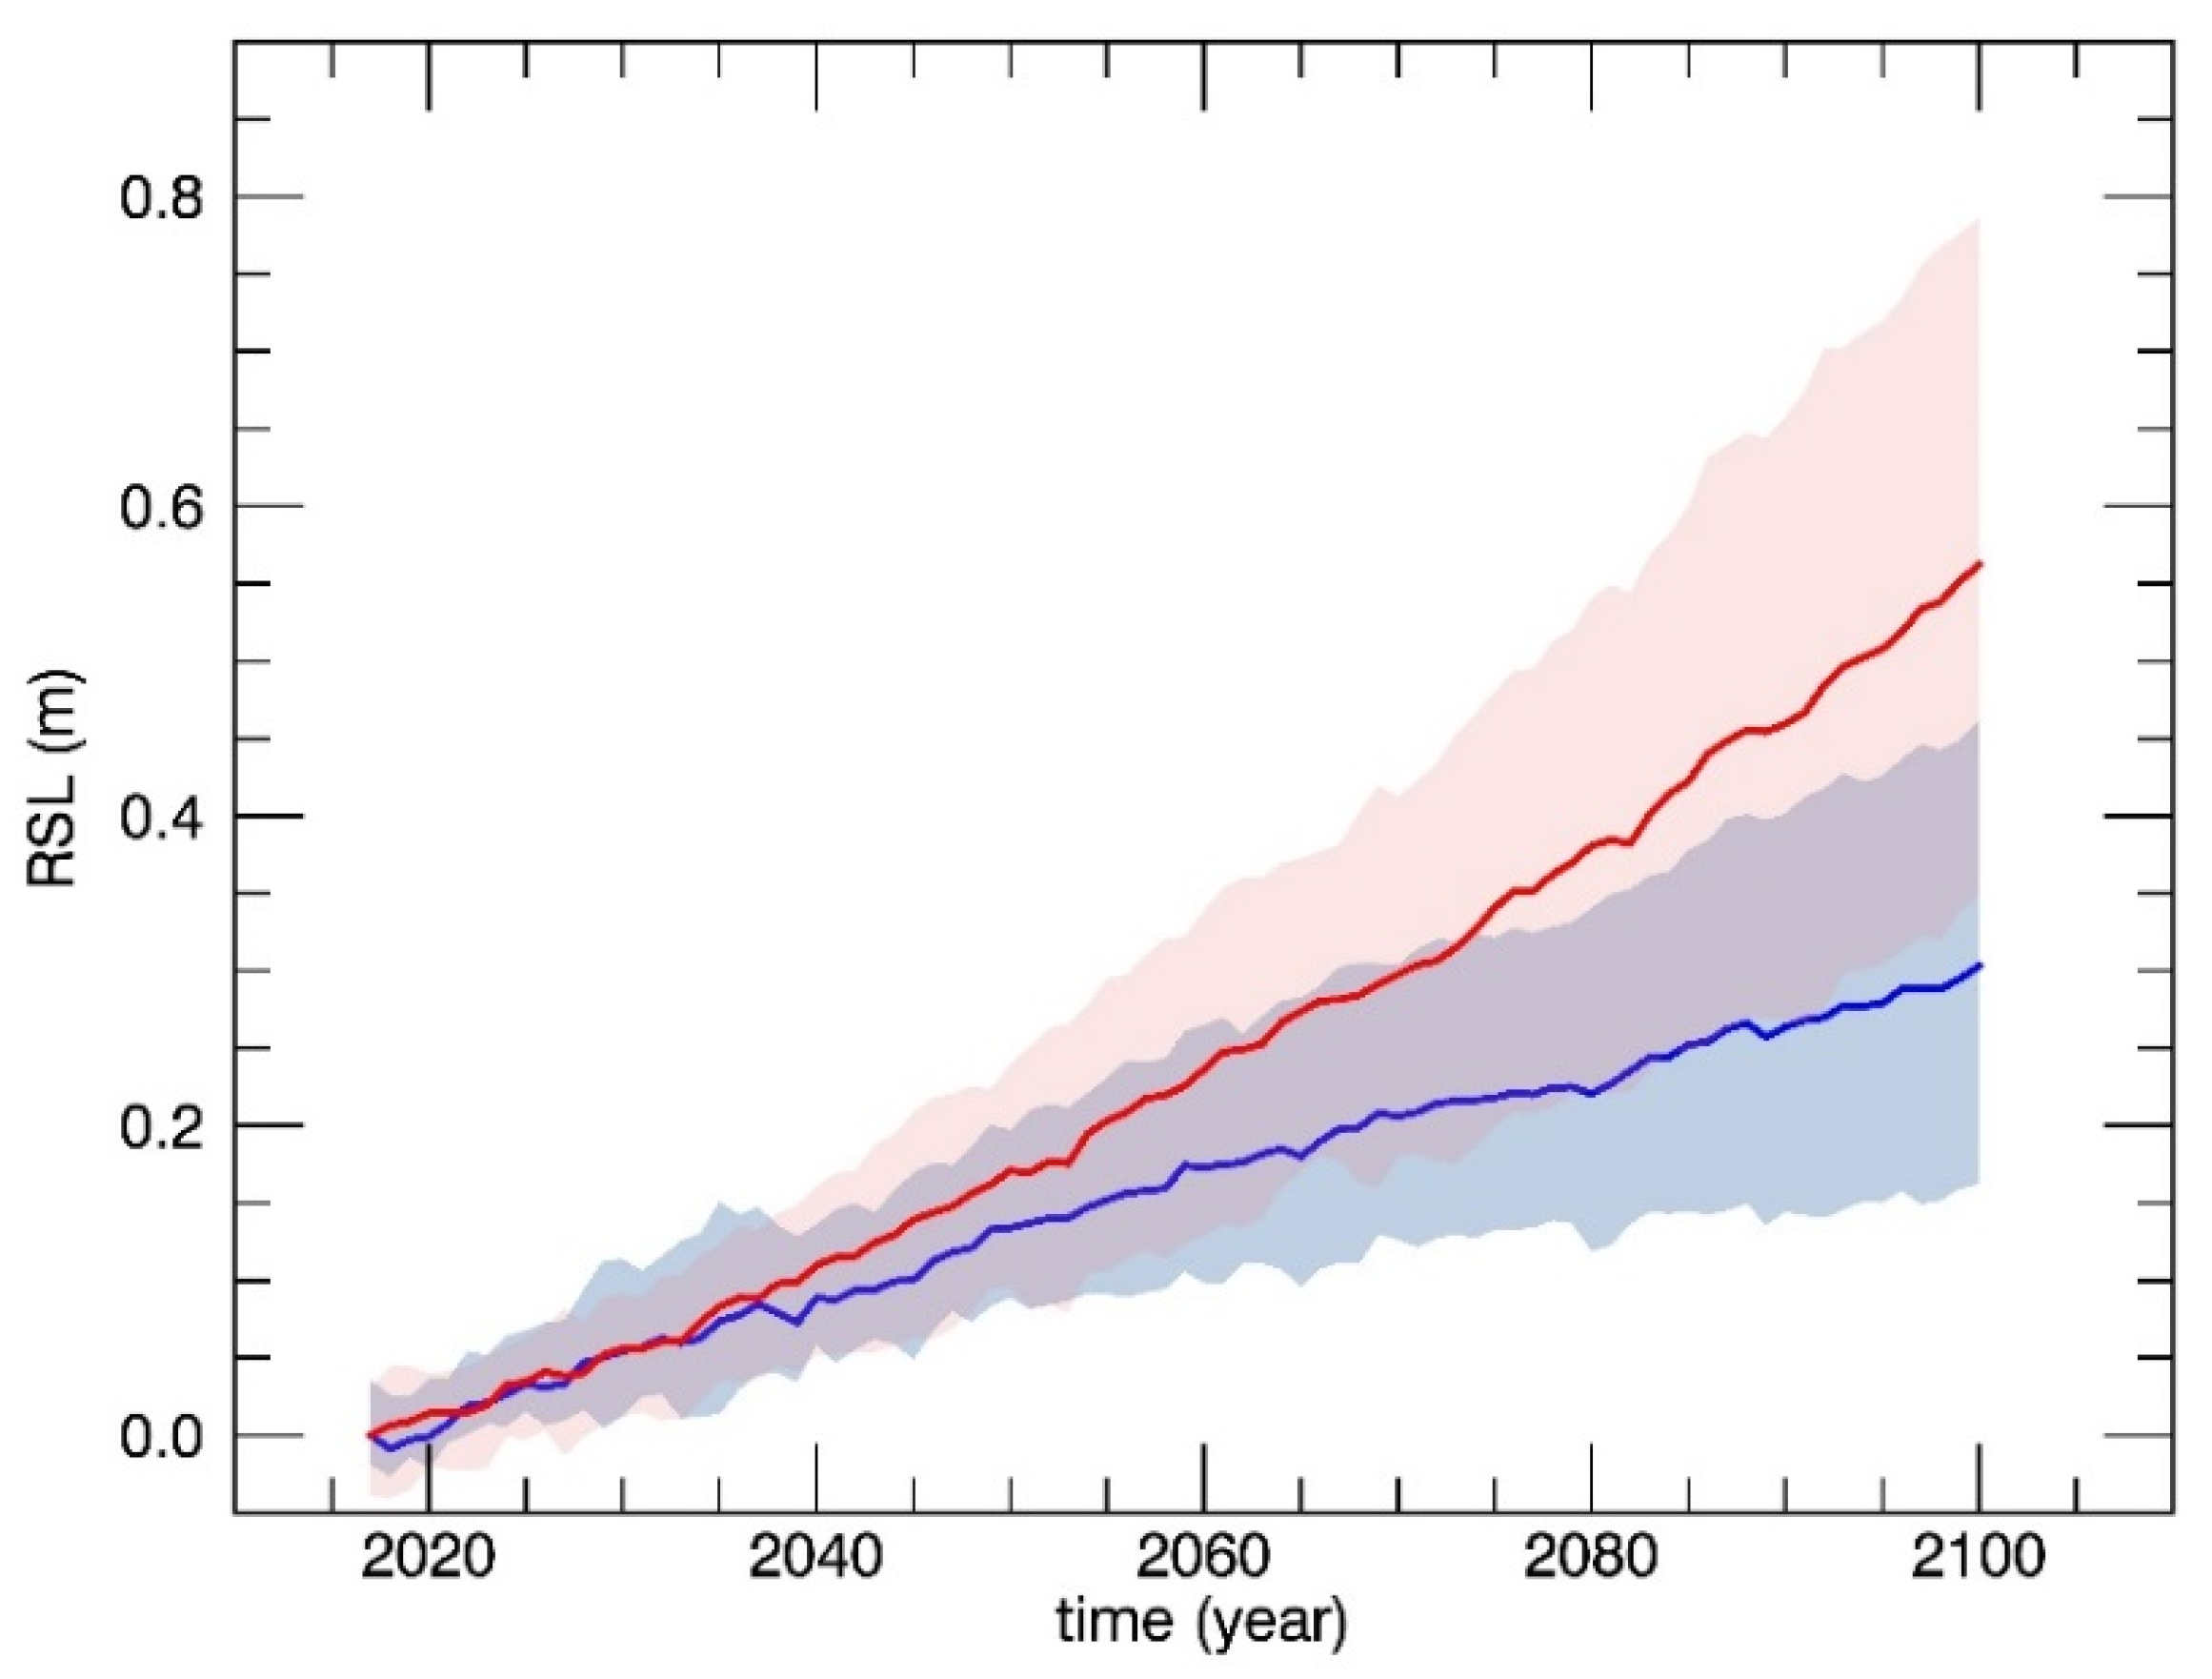
7. Relative Sea-Level Rise Projections and Flooding Scenarios for 2050 and 2100 A.D.

To estimate the sea-level rise for 2050 and 2100 A.D. at Pyrgi, we referred to the regional IPCC AR5 sea-level projections discussed in the Fifth Assessment Report of the IPCC-AR5 [3], www.ipcc.ch (data available from the Integrated Climate data Center-ICDC of the University of Hamburg, http://icdc.cen.uni hamburg.de/1/daten/ocean/ar5-slr.html). These data consist of the sea-level ensemble mean values and upper/lower 90% confidence bounds of the sea level on a global grid (spatial resolution 1° × 1°), obtained by adding the contributions of several geophysical sources driving long-term sea-level changes: (1) the thermosteric/dynamic contribution (from 21 CMIP5 coupled atmosphere-ocean general circulation models AOGCMs), (2) the surface mass balance and dynamic ice sheet contributions from Greenland and Antarctica, (3) the glacier and land water storage contributions, (4) the Glacial Isostatic Adjustment (GIA), and (5) the inverse barometer effect [1]. Projections, which are based on two different Representative Concentration Pathways RCP 2.6 and RCP 8.5 while providing the least and most amounts of future sea level rise, respectively, were used. The IPCC regional sea-level rate at the grid point closest to the location of the tide gauge station (Civitavecchia) was considered. By accounting for VLM from GPS data, very high-resolution DSM and regional IPCC sea level projections at the grid point corresponding to the investigated area, the first marine flooding scenarios for Pyrgi for 2050 and 2100 A.D. have been realized. To include the VLM effect in sea-level projections, we substituted the modelled GIA contribution to the IPCC rates with the GPS vertical velocities, which includes both GIA and tectonic components. Uncertainties for the sea-level estimations were calculated by combining lower and upper sea level bounds from IPCC projection and errors from GPS measurements. In any case, given the tectonic stability of the area, the VLM have a null contribution in the analysis. The relative sea-level rise in RCP2.6 and RCP8.5 scenarios at 2050 and 2100 A.D. with respect to the chosen reference epoch 2017 are shown in Figure 7, and numerical values are reported in Table 2.
The projected coastline positions for 2100 A.D., corresponding to the RCP2.6 and RCP8.5 scenarios, are obtained from the DSM for the sea levels listed in Table 2 and shown in Figure 8. The computed and the represented scenarios correspond to the local mean sea level (estimated with the uncertainty of ±11.8 cm), and are obtained by neglecting the periodical contribution due to diurnal and semidiurnal tides. To account for it, in order to estimate the maximum inundation scenarios, the time series of daily hydrometric sea levels at Civitavecchia tidal station from January 2010 to December 2018 were included in the analysis. The average half amplitude of the daily tides was estimated as high as about 30 cm (Figure 5b). Consequently, in the RCP 8.5 scenario for 2100, if we take into account both the sea-level rise (56 cm) and the mean daily tides (30 cm), we can infer a maximum water level of 86 cm. Since the highest sea levels may reach 45 cm for a few hours a year during temporary meteorological conditions when a decrease in atmospheric pressure and wind push water from the sea onto the land (Figure 5b), the maximum expected water level may reach up to 101 cm above the current level.
For the RCP 2.6 scenario for 2100, considering a sea-level rise of 30 cm and the same mean daily tides (30 cm), a maximum sea-level rise of 60 cm can be inferred. During the rare maximum highest sea levels (45 cm) (Figure 5b), the maximum expected water level would reach 75 cm above the 2019 level.
The sea level rise scenarios for 2100 A.D. depicts the impact of the marine flooding for the coast surrounding the castle of Santa Severa, the temples of Pyrgi, and nearby beaches. The cross sections shown in Figure 9 traced along a direction that is normal to the coast and across the archaeological area of Pyrgi, which highlights the presence of a soft dune system running parallel to the shore. This system is well developed south of the castle for the whole bay of Pyrgi, while, in the north side, it is buried by the modern buildings of the Santa Severa village.
Since the Etruscan time (2450 years BP), the coastline has retreated at about 80 m, at a mean rate of 3.3 cm/yr [38]. The temple of Pyrgi was originally placed at more than 120–125 m from the present-day shore and well protected from the sea by the dune system. Today, it is placed at about 40–45 m from the coastline and is undergoing water intrusion and frequent flooding, especially during storm surges (Figure 8 and Figure 9). The proximity of the sea and the accelerated erosion of the dune system, which is highly exposed to waves especially during storm surges, are causing a continuous coastal erosion and beach retreat. Based on our sea level rise projections, a beach retreat of about 10 m is expected for 2100 A.D. (see cross sections B, C, and D in Figure 8 and Figure 9).
This rapid retreat will accelerate the erosion process and the likely dismantling of the soft dune system with the consequent direct exposure of the temples to the sea. At the same time, the beach located along the north-west side of the castle, which is lacking a dune system and characterized by a gentle slope, is expected to retreat up to about 25 m (see cross section A), exposing the foot of the castle to severe erosion and flooding.
Lastly, Table 3 shows the expected flooded areas in 2050 and 2100 A.D. for the RCP 8.5 and RCP 2.6 climatic scenarios, together with the corresponding percentage of beach loss, which may reach up to 46% during the highest tides.

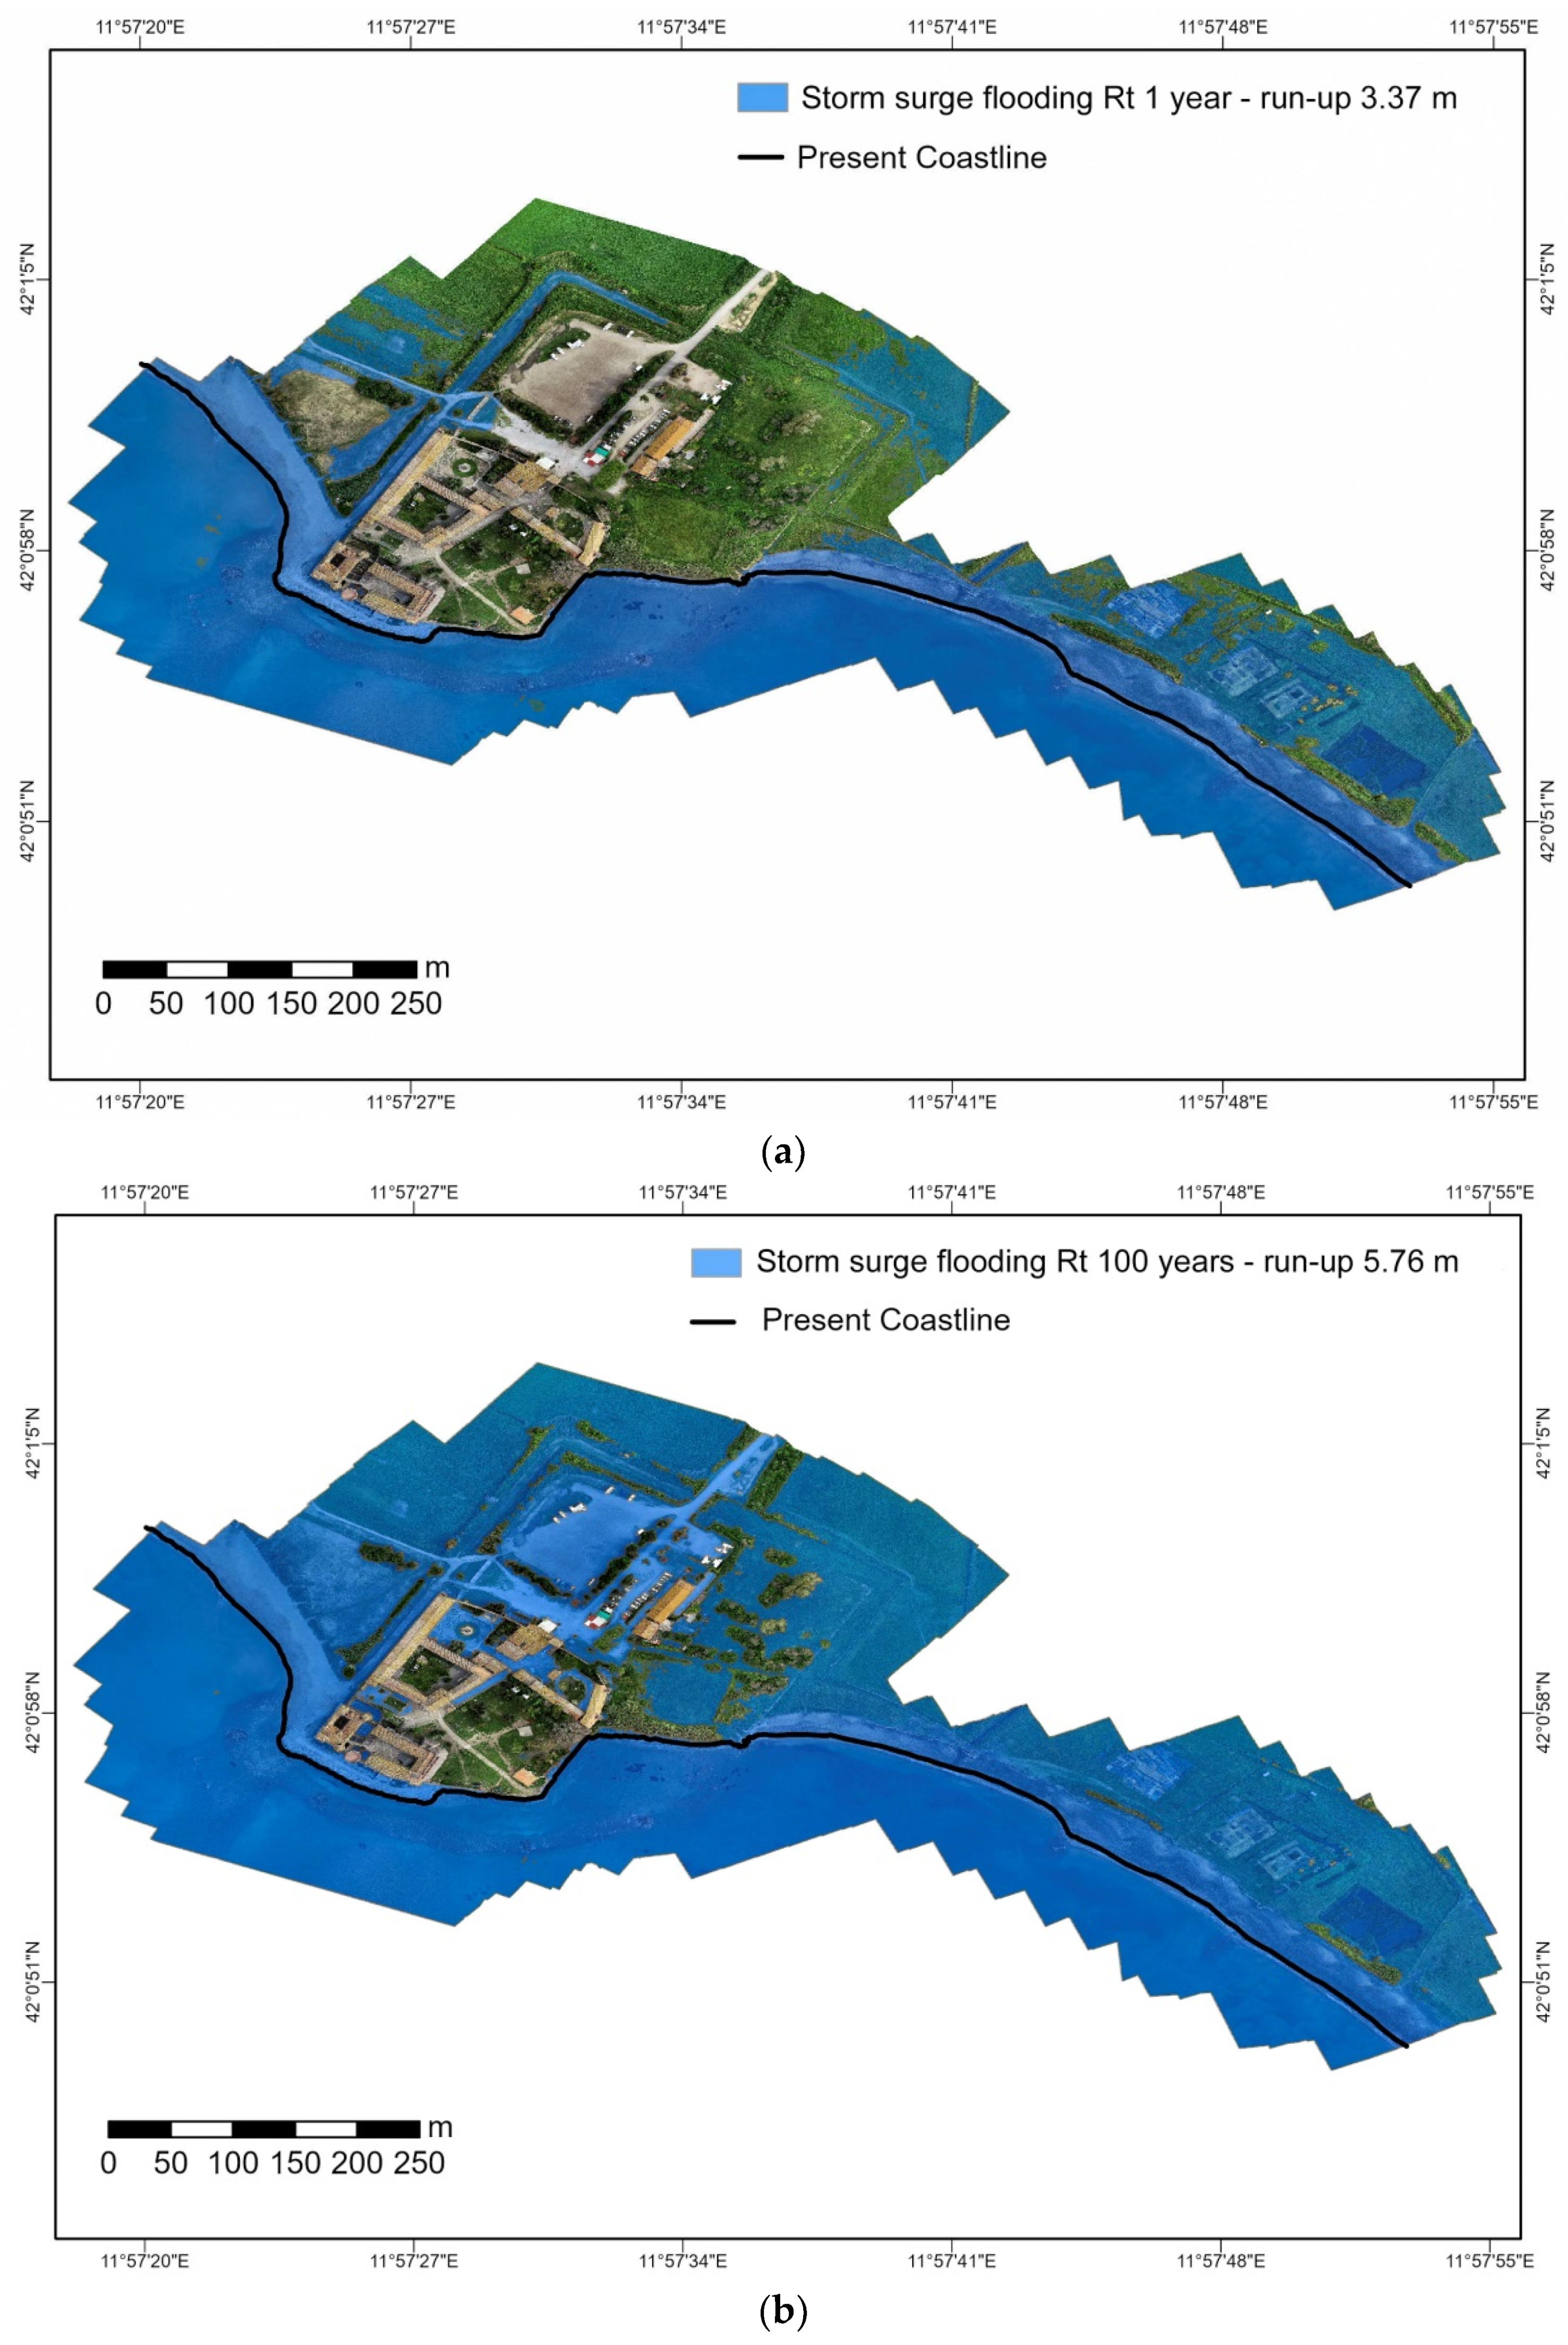
8. Storm Surge Scenarios

To evaluate the storm surge scenario for Pyrgi, a local climate wave assessment was performed using the Weibull distribution and the Equivalent Triangular Storm model originally proposed by Boccotti [39]. The return values of the significant wave heights and related peak wave periods (Table 4) have been evaluated on the parameters of the Weibull distribution [40] using data collected at the wave buoy of Ponza (wave data are freely available at http://dati.isprambiente.it/), which is located in the central Tyrrhenian sea in front of the coasts of Latium (at coordinates Latitude 40.867°N and Longitude 12.950°E).
The climate wave data for ordinary and extreme storm wave conditions in terms of the return period (RT) for RT = 1 year and RT = 100 years in a sea level rise condition for 2100 in the RCP8.5 climatic scenario reported in Table 2 and Table 3 were used to estimate wave setup and wave run-up during the event for both return times (Figure 10).
In the present analysis, wind set up was neglected and the precautionary assumption that the direction of wave travel does not produce refraction was considered. The expression derived by Weggel [41] and the relation of Komar and Gaughan estimated breaker depth index and breaker height index [42]. The breaker type was correlated with the surf similarity parameter, which allows the run-up estimation by the use of the predictive equations [43,44]. Based on our topographic surveys, a mean beach slope of 3.7% for the investigated coast, was assumed for the wave run-up assessment.
The results of the wave run-up analysis in ordinary and extreme storm conditions (Table 5 and Figure 11), were estimated at 3.37 m and 5.76 m for return time of 1 and 100 years, respectively.

9. Discussion and Conclusions

In this study, we assessed the marine flooding scenarios for 2050 and 2100 for the relevant heritage sites of Pyrgi on the basis of (a) a high-resolution DSM, (b) rates of VLM from GPS data, and (c) tidal data from the nearby tide gauge and the RCP 2.6 and 8.5 climatic scenarios released by the IPCC. The results highlight how the flooding might impact both the beach and archaeological sites with a potential local sea-level rise for the IPCC 8.5 scenario of about 56 cm for 2100 A.D. During the highest sea levels estimated by the tidal data at the nearby Civitavecchia station, the sea-level could potentially reach more than 86 cm and up to 101 cm. In addition, 2450 years ago, the shoreline was extended seaward of about 80 m more than today while, during the ancient Roman period, the sea level was at about 1.2 m below the current position, as estimated by the fish tank data [34]. Hence, a continuous sea level rise is occurring since the last millennia with an acceleration that started about 100 ± 53 years ago, at the beginning of the Industrial Era [25]. Due to the potential significant impacts on both the coast and the heritage sites of the Temple of Pyrgi and the Santa Severa Castle with a beach retreat up to about 25 m, the expected scenario reported in this study can support adaptation plans at different time scales, which are in agreement with the Protocol on Integrated Coastal Zone Management (ICZM, https://eur-lex.europa.eu/eli/prot/2009/89/oj) in the Mediterranean.
Our results detail previous studies for the Italian [7,8,9,12,45,46,47] and the Mediterranean [10,48] regions and can contribute to raise awareness of policymakers and heritage managers toward the coastal hazard by highlighting the need to adapt actions to protect Pyrgi from marine flooding and erosion under the current conditions due to the expected sea level rise and storm surge scenarios.
We remark that the unceasing coastal erosion since the Etruscan time [38] and the retreat of the soft cliffs characterizing the Pyrgi coastline mostly occurs during high energy marine events. During storm surges, the waves approaching the coast from the Northwest, West, and Southwest marine sectors are particularly dangerous for Pyrgi. The waves approaching the coast with fetches up to about 400 km are weakly slowed down by the seafloor morphology, which results in an increase of wave energy in sea level rise conditions [49] and leads to a maximum wave run-up of 5.76 m for a return time of 100 years. The impact of extreme events may be significantly amplified by the effects of climate change. In this scenario, the intensities of the strongest future storms will exceed the strength of any in the past in the Mediterranean Sea and the oceans [50,51,52,53]. The effects of the sea-level rise in the projected scenarios include severe coastal erosion and potential enhanced damages to the heritage site of Pyrgi, which, as many other coastal areas of the Mediterranean, deserves rapid actions for their future preservation.

Author Contributions

Conceptualization, M.A. and A.V. Methodology, M.A. Software; validation, M.A., A.V., and M.G. Formal analysis, A.V., F.D., E.S., M.G., and G.M. Investigation, L.P., R.C., M.A., and F.D. Resources, M.A. Data curation, M.A., A.V., F.D., and M.G. Writing—original draft preparation, M.A., A.V., and F.E. Writing—review and editing, M.A. and M.G. Visualization, M.A. and L.P. Supervision, M.A. Project administration, M.A. Funding acquisition, M.A. All authors have read and agreed to the published version of the manuscript.

Funding

This research received no external funding.

Acknowledgments

The SAVEMEDCOASTS Project, funded by the EU (Agreement Number: ECHO/SUB/2016/742473/PREV16, coordinator Marco Anzidei) and Istituto Nazionale di Geofisica e Vulcanologia partially supported this study. We are thankful to Vincenzo Sepe of the INGV, for his contribution during preliminary GPS/RTK surveys.

Conflicts of Interest

The authors declare no conflict of interest.

References

  1. Church, J.A.; Clark, P.U.; Cazenave, A.; Gregory, J.M.; Jevrejeva, S.; Levermann, A.; Merrifield, M.A.; Milne, G.A.; Nerem, R.S.; Nunn, P.D.; et al. Sea-level rise by 2100. Science 2013, 342, 1445. [Google Scholar] [CrossRef] [PubMed] [Green Version]
  2. Kopp, R.E.; Kemp, A.C.; Bittermann, K.; Horton, B.P.; Donnelly, J.D.; Gehrels, W.R.; Hay, C.C.; Mitrovica, J.X.; Morrow, E.D.; Rahmstorf, S. Temperature-driven global sea-level variability in the Common Era. Proc. Natl. Acad. Sci. USA 2016. [Google Scholar] [CrossRef] [PubMed] [Green Version]
  3. Church, J.A.; Clark, P.U.; Cazenave, A.; Gregory, J.; Jevrejeva, S.; Levermann, A.; Merrifield, M.; Milne, G.; Nerem, R.S.; Nunn, P.; et al. Sea Level Change Supplementary Material. In Climate Change 2013: The Physical Science Basis; Contribution of Working Group I to the Fifth Assessment Report of the Intergovernmental Panel on Climate Change; Stocker, T.F., Qin, D., Plattner, G.-K., Tignor, M., Allen, S.K., Boschung, J., Nauels, A., Xia, Y., Bex, V., Midgley, P.M., Eds.; Cambridge University Press: Cambridge, UK; New York, NY, USA, 2013. [Google Scholar]
  4. Bamber, J.L.; Oppenheimer, M.; Koppd, R.E.; Aspinallf, W.P.; Cooke, R.M. Ice Sheet Contributions to Future Sea-Level Rise from Structured Expert Judgment. 2019. Available online: www.pnas.org/cgi/doi/10.1073/pnas.1817205116 (accessed on 8 April 2019).
  5. Veermer, M.; Rahmstorf, S. Global sea level linked to global temperature. PNAS 2009, 106, 21527–21532. [Google Scholar] [CrossRef] [PubMed] [Green Version]
  6. Casella, E.; Rovere, A.; Pedroncini, A.; Mucerino, L.; Casella, M.; Cusati, L.A.; Vacchi, M.; Ferrari, M.; Firpo, M. Study of wave runup using numerical models and low altitude aerial photogrammetry: A tool for coastal management. Estuar. Coast. Shelf Sci. 2014, 149, 160–167. [Google Scholar] [CrossRef]
  7. Antonioli, F.; Anzidei, M.; Amorosi, A.; Lo Presti, V.; Mastronuzzi, G.; Deiana, G.; De Falco, G.; Fontana, A.; Fontolan, G.; Lisco, S.; et al. Sea-level rise and potential drowning of the Italian coastal plains: Flooding risk scenarios for 2100. Quat. Sci. Rev. 2017, 158, 29–43. [Google Scholar] [CrossRef] [Green Version]
  8. Lambeck, K.; Antonioli, F.; Anzidei, M.; Ferranti, L.; Leoni, G.; Scicchitano, G. and Silenzi, S. Sea level change along the Italian coast during the Holocene and projections for the future. Quat. Int. 2011, 232, 250–257. [Google Scholar] [CrossRef]
  9. Ravanelli, R.; Riguzzi, F.; Anzidei, M.; Vecchio, A.; Nigro, L.; Spagnoli, F.; Crespi, M. Sea level rise scenario for 2100 AD for the archaeological site of Motya. Rend. Lincei. Sci. Fis. e Nat. 2019. [Google Scholar] [CrossRef]
  10. Anzidei, M.; Lambeck, K.; Antonioli, F.; Furlani, S.; Mastronuzzi, G.; Serpelloni, E.; Vannucci, G. Coastal structure, sea-level changes and vertical motion of the land in the Mediterranean. Geol. Soc. Lond. Spec. Publ. 2014, 388, 453–479. [Google Scholar] [CrossRef]
  11. Colomina, I.; Molina, P. Unmanned aerial systems for photogrammetry and remote sensing: A review. ISPRS J. Photogramm. Remote Sens. 2014, 92, 79–97. [Google Scholar] [CrossRef] [Green Version]
  12. Anzidei, M.; Bosman, A.; Carluccio, R.; Casalbore, D.; D’Ajello Caracciolo, F.; Esposito, A.; Nicolosi, I.; Pietrantonio, G.; Vecchio, A.; Carmisciano, C.; et al. Flooding scenarios due to land subsidence and sea-level rise: A case study for Lipari Island (Italy). Terra Nova 2017, 29, 44–51. [Google Scholar] [CrossRef]
  13. Enei, F. Santa Severa tra Leggenda e Realtà Storica. Pyrgi e il Castello di Santa Severa Alla Luce Delle Recenti Scoperte; WordPress: Grotte di Castro, Municipality of Santa Marinella, Italy, 2013; pp. 1–413. [Google Scholar]
  14. Colonna, G. Il santuario di Pyrgi dalle origini mitistoriche agli altorilievi frontonali dei Sette e di Leucotea; Scienze dell’Antichità; Poligrafico dello Stato: Roma, Italy, 2000. [Google Scholar]
  15. Enei, F. Pyrgi Sommersa. Ricognizioni archeologiche subacquee nel porto dell’antica Caere; Museo civico Santa Marinella: Santa Marinella, Italy, 2008; pp. 1–115. [Google Scholar]
  16. Enei, F. Dal sito di Pyrgi, antico porto di Caere, nuovi dati per lo studio della linea di costa di epoca etrusca; Serra, F., Ed.; Archaeologia Maritima Mediterranea: Pisa, Italy, 2013; pp. 165–176. [Google Scholar]
  17. Mattei, M.; Conticelli, S.; Giordano, G. The Tyrrhenian margin geological setting: From the Apennine orogeny to the K-rich volcanism. In The Colli Albani Volcano; Special Publications of IAVCEI; Funiciello, R., Giordano, G., Eds.; Geological Society: London, UK, 2010; Volume 3, pp. 7–27. [Google Scholar]
  18. Sestini, G.; Bruni, P.; Sagri, M. The Flysch Basins of the Northern Apennines: A Review of Facies and of Cretaceous-Neogene Evolution. Memorie della Società Geologica Italiana 1986, 31, 87–106. [Google Scholar]
  19. Abbate, E.; Sagri, M. The eugeosynclinal sequences. Sediment. Geol. 1970, 4, 251–340. [Google Scholar] [CrossRef]
  20. Alberti, A.; Bertini, M.; Del Bono, G.L.; Nappi, G.; Salvati, L. Note illustrative della Carta Geologica d’Italia alla scala 1: 100000; Tuscania-Civitavecchia Fogli 136–142; Poligrafica & Cartevalori: Ercolano, Italy, 1970. [Google Scholar]
  21. Chiocchini, U.; Gisotti, G.; Macioce, A.; Manna, F.; Bolasco, A.; Lucarini, C.; Patrizi, G.M. Environmental geology problems in the Tyrrhenian coastal area of Santa Marinella, Province of Rome, central Italy. Environ. Geol. 1997, 3, 1–8. [Google Scholar] [CrossRef]
  22. Ferranti, L.; Antonioli, F.; Mauz, B.; Amorosi, A.; Dai Pra, G.; Mastronuzzi, G.; Monaco, C.; Orrù, P.; Pappalardo, M.; Radtke, U.; et al. Markers of the last interglacial sea-level high stand along the coast of Italy: Tectonic implications. Quat. Int. 2006, 145, 30–54. [Google Scholar] [CrossRef]
  23. Ferranti, L.; Antonioli, F.; Anzidei, M.; Monaco, C.; Stocchi, P. The timescale and spatial extent of vertical tectonic motions in Italy: Insights from coastal tectonic studies. Rendiconti Online Societa Geologica Italiana 2010, 11, 683–684. [Google Scholar]
  24. Karner, D.; Marra, F.; Florindo, F.; Boschi, E. Pulsed uplift estimated from terrace elevations in the coast of Rome: Evidence for a new phase of volcanic activity? Earth Planet. Sci. Lett. 2001, 188, 135–148. [Google Scholar] [CrossRef]
  25. Lambeck, K.; Anzidei, M.; Antonioli, F.; Benini, A.; Esposito, A. Sea level in Roman time in the Central Mediterranean and implications for recent change. Earth Planet. Sci. Lett. 2004, 224, 563–575. [Google Scholar] [CrossRef]
  26. Avallone, A.; Selvaggi, G.; D’Anastasio, E.; D’Agostino, N.; Pietrantonio, G.; Riguzzi, F.; Serpelloni, E.; Anzidei, M.; Casula, G.; Cecere, G.; et al. The RING network: Improvement of a GPS velocity field in the central Mediterranean. Ann. Geophys. 2010, 53, 39–54. [Google Scholar]
  27. Ullman, S. The interpretation of structure from motion. Proc. R. Soc. Lond. Ser. B 1979, 203, 405–426. [Google Scholar]
  28. Sammari, C.; Koutitonsky, V.G.; Moussa, M. Sea level variability and tidal resonance in the Gulf of Gabes, Tunisia. Cont. Shelf Res. 2006, 26, 338–350. [Google Scholar] [CrossRef]
  29. Lambeck, K.; Woodroffe, C.D.; Antonioli, F.; Anzidei, M.; Geherls, W.R.; Laborel, J.; Wright, A. Palaeoenvironmental records, geophysical modelling and reconstruction of sea-level trends and variability on centennial and longer time scales. In Understanding Sea Level Rise and Variability; Wiley-Blackwell: Oxford, UK, 2010; pp. 61–121. [Google Scholar]
  30. Antonioli, F.; Lo Presti, V.; Anzidei, M.; Deiana, G.; de Sabata, E.; Ferranti, L.; Furlani, S.; Mastronuzzi, G.; Orru, P.E.; Pagliarulo, R.; et al. Tidal notches in Mediterranean Sea: A comprehensive analysis. Quat. Sci. Rev. 2015, 119, 66–84. [Google Scholar] [CrossRef]
  31. Corchete, V. The high-resolution gravimetric geoid of Italy: ITG2009. J. Afr. Earth Sci. 2010, 58, 580–584. [Google Scholar] [CrossRef]
  32. Serpelloni, E.; Faccenna, C.; Spada, G.; Dong, D.; Williams, S.D.P. Vertical GPS ground motion rates in the Euro-Mediterranean region: New evidence of velocity gradients at different spatial scales along the Nubia-Eurasia plate boundary. J. Geophys. Res. Solid Earth 2013, 118, 6003–6024. [Google Scholar] [CrossRef] [Green Version]
  33. Serpelloni, E.; Pintori, F.; Gualandi, A.; Scoccimarro, E.; Cavaliere, A.; Anderlini, L.; Belardinelli, M.E.; Todesco, M. Hydrologically Induced Karst Deformation: Insights from GPS Measurements in the Adria-Eurasia Plate Boundary Zone. J. Geophys. Res. Solid Earth 2017, 123, 4413–4430. [Google Scholar] [CrossRef]
  34. Herring, T.; King, R.W.; McClusky, S. GAMIT Reference Manual, Release 10.4; Massachussetts Institute of Technology: Cambridge, MA, USA, 2010. [Google Scholar]
  35. Altamimi, Z.; Collilieux, X.; Métivier, L. ITRF2008: An improved solution of the international terrestrial reference frame. J. Geod. 2011, 85, 457. [Google Scholar] [CrossRef] [Green Version]
  36. Devoti, R.; D’Agostino, N.; Serpelloni, E.; Pietrantonio, G.; Riguzzi, F.; Avallone, A.; Cavaliere, A.; Cheloni, D.; Cecere, G.; D’Ambrosio, C.; et al. The mediterranean crustal motion map compiled at INGV. Ann Geophys. 2017. [Google Scholar] [CrossRef] [Green Version]
  37. Guidoboni, E.; Comastri, A.; Traina, G. Catalogue of Ancient Earthquakes in the Mediterranean Area up to the 10th Century; Istituto Nazionale di Geofisica: Roma, Italy, 1994. [Google Scholar]
  38. Rovere, A.; Antonioli, F.; Enei, F.; Giorgi, S. Relative sea level change at the archaeological site of Pyrgi (Santa Severa, Rome) during the last seven millennia. Quat. Int. 2011, 232, 82–91. [Google Scholar] [CrossRef]
  39. Boccotti, P. Wave Mechanics for Ocean Engineering; Elsevier Science: Amsterdam, The Netherlands, 2000; Volume 64. [Google Scholar]
  40. Arena, F.; Laface, V.; Malara, G.; Romolo, A.; Viviano, A.; Fiamma, V.; Sannino, G.; Carillo, A. Wave climate analysis for the design of wave energy harvesters in the Mediterranean Sea. Renew. Energy 2015, 77, 125–141. [Google Scholar] [CrossRef]
  41. Weggel, J.R. Maximum breaker height. J. Waterw. Harb. Coast. Eng. Div. 1972, 98, 529–548. [Google Scholar]
  42. Komar, P.D.; Gaughan, M.K. Airy wave theory and breaker height prediction. In Proceedings of the 13th Conference on Coastal Engineering, Vancouver, BC, Canada, 29 January 1972. [Google Scholar] [CrossRef] [Green Version]
  43. U.S. Army Corps of Engineers. Coastal Engineering Manual, Part II; U.S. Army Corps of Engineers: Washington, DC, USA, 2006. [Google Scholar]
  44. Mase, H. Random wave run-up height on gentle slope. J. Waterw. Port Coast. Ocean Eng. 1989, 115, 649–661. [Google Scholar] [CrossRef]
  45. Lambeck, K.; Anzidei, M.; Antonioli, F.; Benini, A.; Verrubbi, V. Tyrrhenian sea level at 2000 BP: Evidence from Roman age fish tanks and their geological calibration. Rend. Fis. Acc. Lincei 2018, 29, 69–80. [Google Scholar] [CrossRef]
  46. Anzidei, M.; Scicchitano, G.; Tarascio, S.; De Guidi, G.; Monaco, C.; Barreca, G.; Mazza, G.; Serpelloni, E.; Vecchio, A. Coastal retreat and marine flooding scenario for 2100: A case study along the coast of Maddalena Peninsula (southeastern Sicily). Geogr. Fis. Dinam. Quat. 2018, 41, 5–16. [Google Scholar] [CrossRef]
  47. Vecchio, A.; Anzidei, M.; Serpelloni, E.; Florindo, F. Natural Variability and Vertical Land Motion Contributions in the Mediterranean Sea-Level Records over the Last Two Centuries and Projections for 2100. Water 2019, 11, 148. [Google Scholar] [CrossRef] [Green Version]
  48. Reimann, L.; Vafeidis, A.T.; Brown, S.; Hinkel, J.; Tol, R.S.J. Mediterranean UNESCO World Heritage at risk from coastal flooding and erosion due to sea-level rise. Nat. Comm. 2018, 9, 4161. [Google Scholar] [CrossRef] [Green Version]
  49. Masselink, G.; Hughes, M.G. Introduction to Coastal Processes and Geomorphology; McCann, S.B., Ed.; Edward Arnold: London, UK, 1980; p. 354. [Google Scholar]
  50. Sobel, A.H.; Camargo, S.J.; Hall, T.M.; Lee, C.Y.; Tippett, M.K.; Wing, A.A. Human influence on tropical cyclone intensity. Science 2016, 353, 242–246. [Google Scholar] [CrossRef] [Green Version]
  51. Rahmstorf, S. Rising hazard of storm-surge flooding. PNAS 2017, 114, 45. [Google Scholar] [CrossRef] [Green Version]
  52. Menéndez, M.; Woodworth, P. Changes in extreme high water levels based on a quasi-global tide-gauge data set. J. Geophys. Res. 2010, 115, C10011. [Google Scholar] [CrossRef] [Green Version]
  53. Lowe, J.A.; Gregory, J.M. The effects of climate change on storm surges around the United Kingdom. Philos. Trans. R. Soc. 2005, 363. [Google Scholar] [CrossRef]
Figure 1. The investigated area of Pyrgi with the location of the GNSS stations of MAR8 and TOLF and the nearby tide gauge station of Civitavecchia.
Jmse 08 00064 g001
Figure 2. Simplified geological map of the study area (from http://dati.lazio.it/catalog/it/dataset/carta-geologica-informatizzata-regione-lazio-25000). Legend: (1) anthropic debris, (2) coastal and marsh sands and recent dunes, (3) calcareous marls and clays, (4) flysch, (5) clays with chalks, (6) landslide de posits, (7) alluvial deposits, (8) lavas, (9) travertines, (10) sandy deposits, and (11) sandy deposits of marine facies.
Jmse 08 00064 g002
Figure 3. The orthophoto with the Ground Control Points (red dots) position used during the UAV surveys.
Jmse 08 00064 g003
Figure 4. The Digital Surface Model (DSM) of the coastal sector of Pyrgi, from the analysis of the aerial photos.
Jmse 08 00064 g004
Figure 5. Sea level data analysis for the tide gauge of Civitavecchia, which is located a few km north of Pyrgi (see Figure 1 for location). (a) Monthly data of sea level recordings collected in the time span 2011–2019 (about nine years). The red line is the linear fit of the sea level trend at 0.25 ± 0.1 mm/yr. (b) Statistical diagram of sea level heights (cm) versus time (hours/year). The values of sea level height frequency are reported during one year, including maximum sea level heights of about 45 cm that may exceed the tide amplitudes. These can be related to storm surge events that occur only a few hours in a year, when water is pushed from the sea onto the land due to a temporary decrease in atmospheric pressure and wind.
Jmse 08 00064 g005
Figure 6. The vertical components (UP) of the time series of the GNSS station for (a) TOLF (time span 2004–2019, about 15 years) and (b) MAR8 (time span 2012–2019), both located near Pyrgi (see Figure 1 for location).
Jmse 08 00064 g006
Figure 7. Relative sea level with respect to the 2017 level as obtained from the regional IPCC sea-level projections, AR5 RCP2.6 (blue line), and RCP8.5 (red line) for a null VLM. Color bands represent the 90% confidence interval. The small-scale variations observed in the data are related to the ocean component contribution accounting for the effects of dynamic Sea Surface Height (SSH), the global thermosteric SSH anomaly, and inverse barometer effects (Church et al., 2013a, b, http://icdc.cen.unihamburg.de/). Given the vertical tectonic stability of the area, the VLM have a null contribution in the projections.
Jmse 08 00064 g007
Figure 8. Projected coastline positions for 2100 A.D. for the 2.6 and 8.5 IPCC scenarios (see legend for details). Coastline positions include the uncertainty of ±11.8 cm in the reference mean sea level position as estimated from the analysis of tide gauge data. The cross sections along the shore are also shown in the figure.
Jmse 08 00064 g008
Figure 9. Return time (years) values of the significant wave heights (m).
Jmse 08 00064 g009
Figure 10. Projected flooded areas corresponding to the maximum run-up levels for storm surges with return times for: (a) 1 year (in blue at 3.37 m) and (b) 100 years (in blue at 5.76 m). The coastline position on 26 April 2019 is in black, which is estimated with an uncertainty of ±11.8 cm from the analysis of tide gauge data.
Jmse 08 00064 g010
Figure 11. Cross sections of the coastline. See Figure 7 for cross section positions. A-A’ (Beach North–Castle) north of the castle of Santa Severa; B-B’, C-C’ and D-D’ (Beach South–Temples) across the beach and the three structures of the temple of Pyrgi. The expected sea levels for 2100 in the RCP8.5 scenario and in the maximum RCP8.5 high tide condition, are shown by the yellow and red lines, respectively. Light blue is the current mean sea level position. For storm surge scenarios for return time 1 and 100 years in sea level rise conditions, the area is almost entirely flooded with the possible exception across D-D’, which remains protected by the high dune system. Projected coastlines include the uncertainty of ±11.8 cm in the mean sea level position as estimated from the analysis of tide gauge data.
Jmse 08 00064 g011
Table 1. Survey features.
Survey and Camera Features
Number of images306Camera stations286
Flying altitude79.8 mTie points1,158,646
Ground resolution1.94 cm/pixProjections3,891,753
Coverage area0.226 km2Reprojection error0.528 pix
Camera modelFC6310 (8.8 mm)Focal length8.8 mm
Camera resolution5472 × 3648Pixel size2.41 × 2.41 μm
Table 2. Relative Sea Level Rise (RSLR, cm) above the current mean sea level at Pyrgi for 2050 and 2100 for the IPCC 2.6 and 8.5 climatic scenarios, in the mean and maximum high tide conditions. Given the vertical tectonic stability of the area, the VLM were not considered in the analysis.
Sea Level 2050 IPCC 8.5 (cm)Sea Level 2050 IPCC 2.6 (cm)
RSLRRSLR + Mean high tide (30 cm)RSLR + Max high tide (45 cm)RSLRRSLR + Mean high tide (30 cm)RSLR + Max high tide (45 cm)
17 ± 0.074762134358
Sea level 2100 IPCC 8.5 (cm)Sea level 2100 IPCC 2.6 (cm)
RSLRRSLR + Mean high tide (30 cm)RSLR + Max high tide (45 cm)RSLRRSLR + Mean high tide (30 cm)RSLR + Max high tide (45 cm)
56 ± 0.2286101306075
Table 3. IPCC scenarios, relative sea level rise projections for 2100, expected land loss (m2), and percentage of land loss with respect to the current surface for the given Relative Sea Level Rise (RSLR) projections. Given the vertical tectonic stability of the area, the VLM were considered in the analysis.
IPCC ScenarioRSLR 2100 (cm)Land Loss (m2)Percent of Land Loss (16113.55 m2)
IPCC 2.617 ± 0.072033.3312.6
IPCC 2.6 + max high tide75 ± 0.225387.8733.4
IPCC 8.556 ± 0.223790.4723.5
IPCC 8.5 + max high tide101 ± 0.227480.0246.4
Table 4. Return values RT (years) of the significant wave height HS (m) and the related peak wave period TP (s).
RT (Years)HS (m)TP (s)
15.289.80
56.6310.98
107.1911.43
207.7511.87
508.4812.41
1009.0212.80
50010.2713.66
100010.8014.01
Table 5. Values of maximum Rmax and medium Rmed wave run-up (m) estimated in the offshore wave conditions (HS and TP), beach slope (s m/m), breaking depth db (m), and self-similarity parameter (ξ0).
RT (Years)Hs (m)Tp (sec)s(m/m)db (m)ξ0Rmax (m)Rmed (m)
15.289.800.0376.270.1873.371.46
1009.0212.800.03710.710.1875.762.50

