1. Introduction
The beach is an important ecosystem that has many benefits, including recreation, fisheries, and a buffer near the ocean. Recreation opportunities on the beach affect economic growth in many coastal areas. In this study, Pattaya beach and Chalatat beach were chosen to be the study areas because they represent the character of well-known beaches for tourists who travel to Thailand and the character of recreational use for local people in those areas, respectively. Approximately 14 million tourists visit Pattaya annually, while 7 million tourists visit Songkhla (located at Chalatat beach), according to statistical data from the Ministry of Tourism and Sports. Due to climate change, the global sea level is rising and will increase during the early twenty-first century because of increasing temperatures [
1]. The data from the tidal gauge near the study area reveals that the sea level has risen approximately 14.2 mm per year from 1992 to 2006 at Pattaya beach and 7.4 mm per year from 1987 to 2011 at Chalatat beach [
2]. From a previous study, the national beach loss rate projections using the Bruun rule for 2081–2100 are 45.8% for the RCP2.6 scenario and 71.8% for RCP8.5. Also, 23 of 64 beach zones in Thailand will be completely lost [
3]. To address these concerns, beach area loss from sea-level rise will be an essential issue for beach tourism. The Bruun rule is the widely applied method for projecting shoreline retreat from sea level rise [
4].
Tourism carrying capacity (TCC) is a tool to measure and determine the development of the beach when combining it with other management tools [
5]. TCC is defined as the physical and social capacity of the environment related to tourist activity and beach development. Carrying capacity is “the maximum number of people that may visit a tourist destination at the same time, without destroying the physical, economic, socio-cultural environment and an unacceptable decrease in the quality of visitors’ satisfaction” [
6]. A TCC assessment consists of physical carrying capacity (PCC), real carrying capacity (RCC), and effective carrying capacity (ECC) [
7]. Beach area loss from sea-level rise decreases the carrying capacity of the beach, especially in physical terms. Moreover, the different forms of management at each beach affects that beach’s ECC.
Several studies have used the Bruun rule to examine the impacts of sea-level rise on shoreline retreat that affect TCC, such as at Catalan beaches where PCC will decrease in proportion to the sea level rise [
8]. In Thailand, the TCC has been analysed at Jomtien beach (Southern part) in Chonburi province. The PCC can support the tourists but the inefficient management of Jomtien beach decreases the facility carrying capacity [
9]. Furthermore, the study of TCC at Jomtien beach examined present-day scenarios, which do not account for the sea level rise from climate change in future scenarios.
The purpose of this study is to evaluate the change in the area of the locations under study expected to be caused by sea-level rise and the TCC of the beaches in future scenarios. The shoreline recession from sea level rise was analysed using the Bruun rule and the detection of shoreline position from satellite images using the tidal correction method. The shoreline retreat was used to calculate the changes in beach area. The areas required per-user data; the average visit time was obtained using a survey. The correction factor (a rainy day) was measured by the Thailand Meteorological Department. Then, data on beach management were collected by field observation of the two beaches. These findings should be considered in the planning of near-future coastal zone management to protect the tourism carrying capacity and beach areas from future sea level rise.
2. Study Areas and Data
2.1. Study Areas
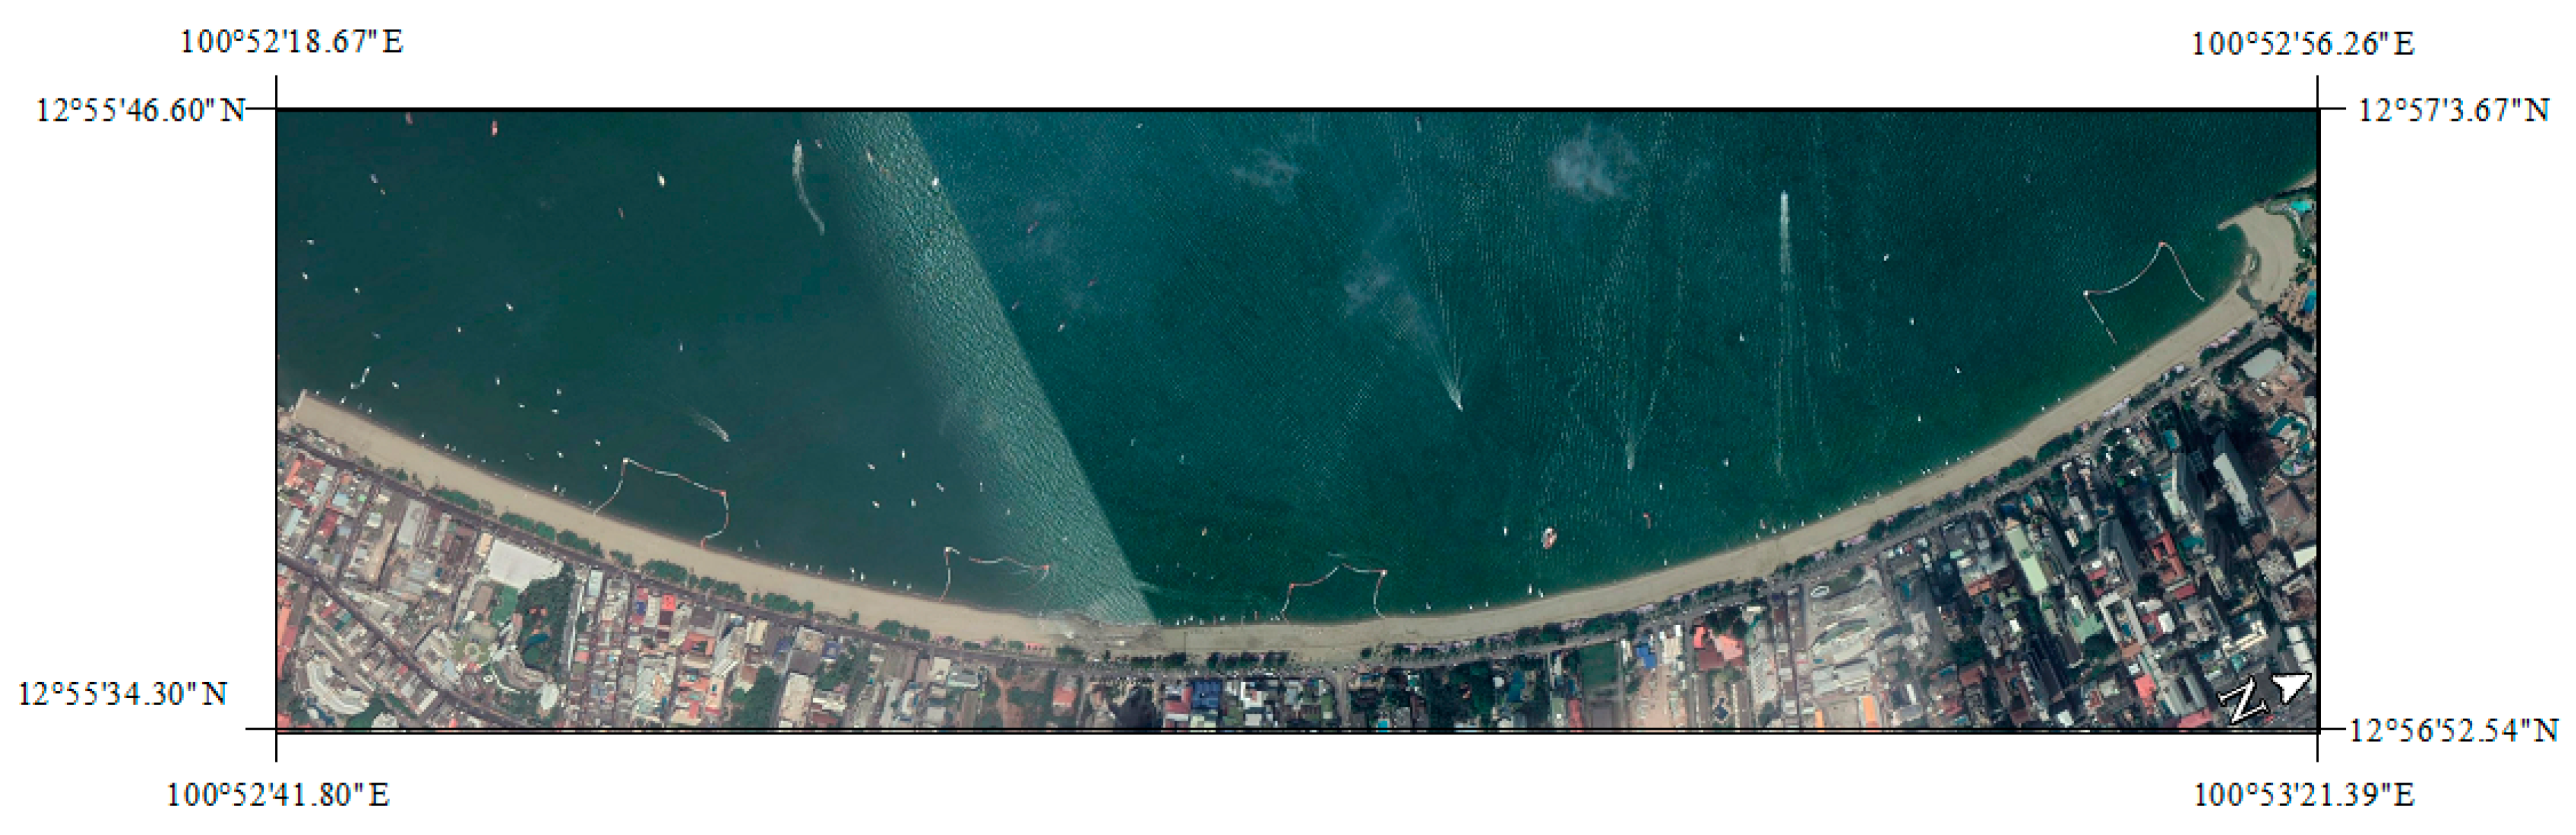
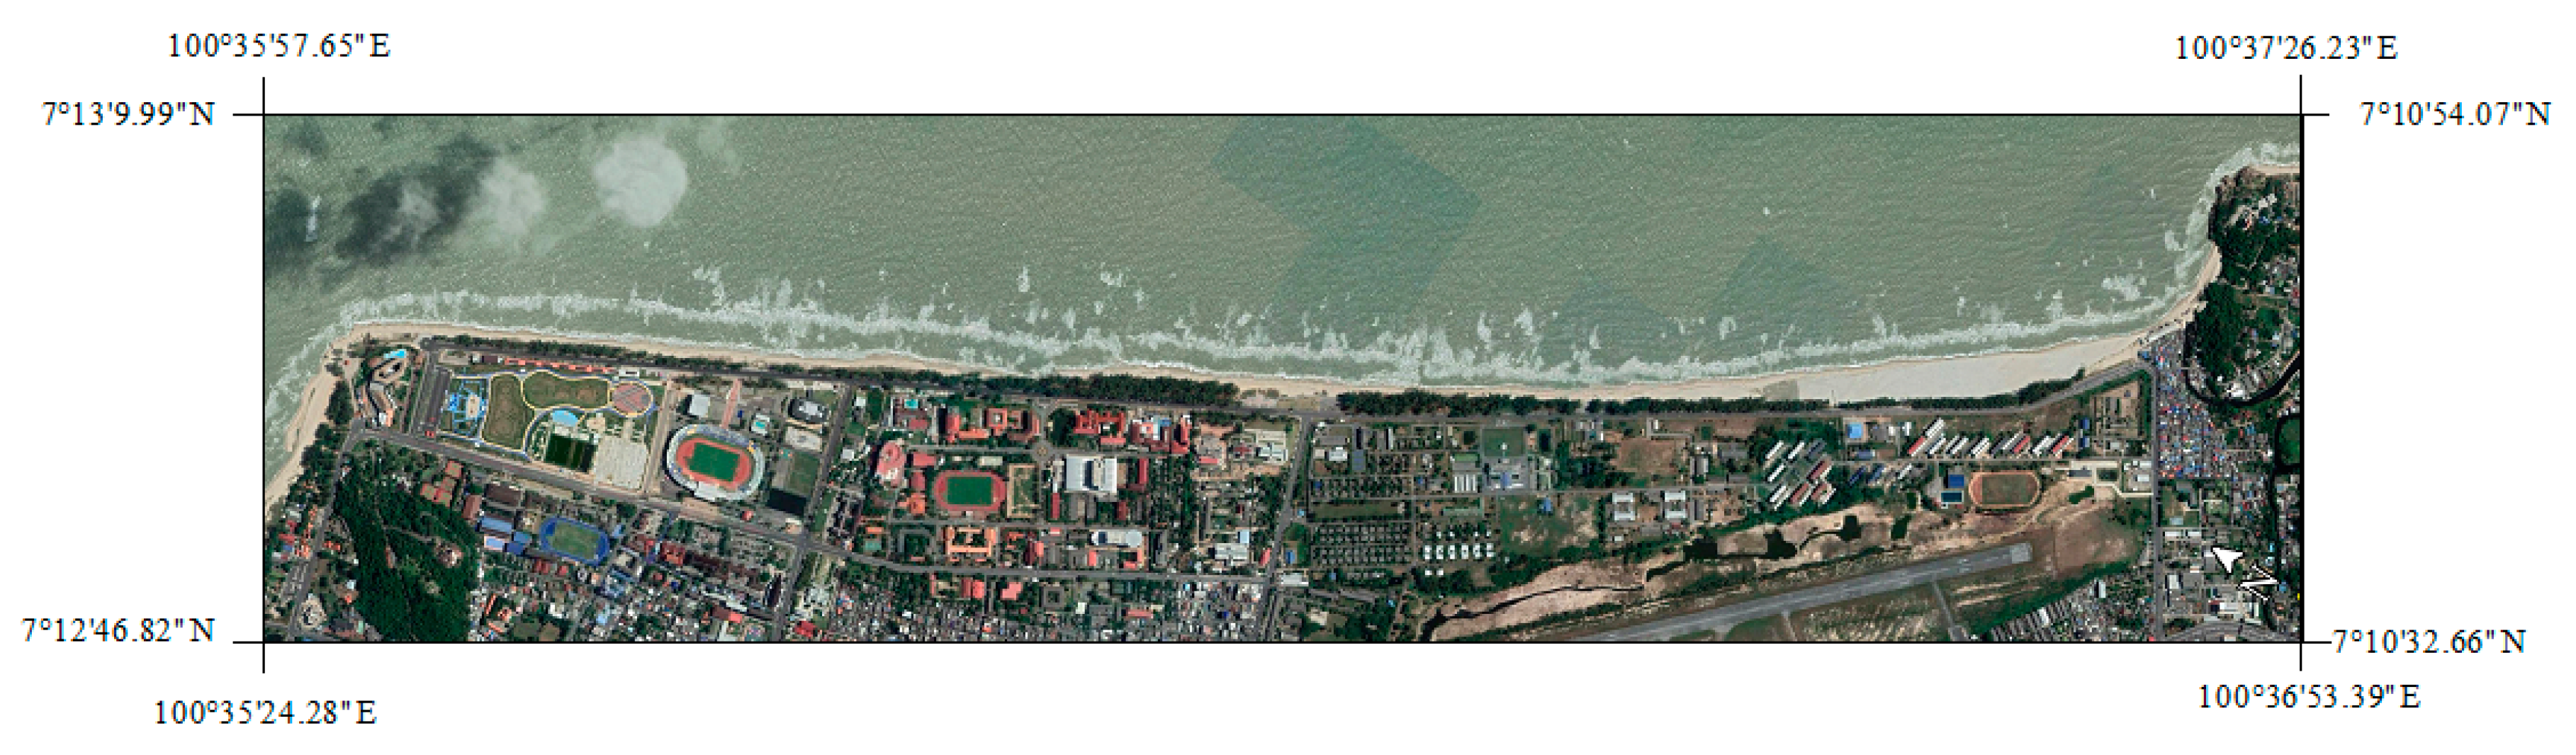
In this study, Pattaya beach represents the characteristics of a well-known beach, while Chalatat beach represents the domestic tourism of the local area in Thailand (
Figure 1). Thailand is affected by northeastern monsoons from the middle of October to the middle of February and southwestern monsoons that cause heavy rain and high waves.
Pattaya beach is located in Chonburi province on the eastern side of the Gulf of Thailand. Pattaya beach is 3 km long and divided into three areas: North Pattaya, Central Pattaya, and South Pattaya. There are many hotels and shops along the streets in front of the beach. The diverse activities at Pattaya beach include sunbathing, swimming, banana boats, jet skis, and parachuting. Moreover, snorkelling and scuba diving tours to Koh Lan are provided by tour services at Pattaya beach.
Chalatat beach is 4.8 km long and located in Songkhla province in the southern part of Thailand. It is crowded with people on the weekend and during special festivals in Thailand.
2.2. Data
The data used in this study contains satellite images from Google Earth, sea level rise data, wave data, slope and sediment size, the average visit time and area required per user, and management capacity.
2.2.1. Satellite Images from Google Earth
In this study, satellite images from Google Earth were used to detect the shoreline positions for Pattaya and Chalatat beaches for the periods listed in
Table 1.
2.2.2. Sea Level Rise Data
This study used sea-level rise data from 21CMIP5 models, which are the ensemble-mean regional sea-level rise data (1-degree latitude-longitude resolution) for the RCP2.6, RCP4.5, RCP6.0, and RCP8.5 scenarios that relate to 1986–2005 [
1]. The ensemble-mean sea level rise data ranges are 0.36–0.60 m for Pattaya beach and 0.38–0.62 m for Chalatat beach.
2.2.3. Wave Data
This study used 3-h significant wave data and 12-h exceeds significant wave height re-analysed data (1-degree latitude-longitude resolution) provided by The European Centre for Medium-Range Weather Forecasts (ECMWF; see
www.ecmwf.int), averaged over the 30-year period (1980–2010). The significant wave height is 0.92 m for Pattaya beach and 0.77 m for Chalatat beach. The significant wave period is 7.15 s for Pattaya beach and 6.85 s for Chalatat beach.
2.2.4. Slope and Sediment Size
From field observations, the average foreshore beach slope (
Figure 2,
Table 2,
Figure 3 and
Table 3) is 9.34 degrees for Pattaya beach and 6.43 degrees for Chalatat beach. The average sediment grain size is 0.30 mm for Pattaya beach and 0.27 mm for Chalatat beach. Sediment size (D
50) was analysed using the sieve analysis American Society for Testing and Materials (ASTM) D422-63 (2007) standard test method. The foreshore beach slope was measured using beach profiling. The closure depths of Pattaya beach and Chalatat beach are 7.72 m and 7.60 m, respectively.
2.2.5. Average Visit Time and Area Required per User
From the questionnaire survey, this study collected a sample size with a 99% confidence factor and 10% precision. The sample included 166 of the 40,221 tourists who visited Pattaya beach each day and 165 of the 20,919 tourists who visited Songkhla each day. Based on information gathered from beachgoers, the average visit time at both Pattaya and Chalatat beach was 3 h. Furthermore, the area required per user was 3 m2 for Pattaya beach and 11 m2 for Chalatat beach.
2.2.6. Management Capacity
The management capacity (
Table 4) was determined by the facilities and infrastructure in the study areas, where 0 = absent, 1 = little, and 2 = adequate. The maximum possible score was 30.
3. Methods
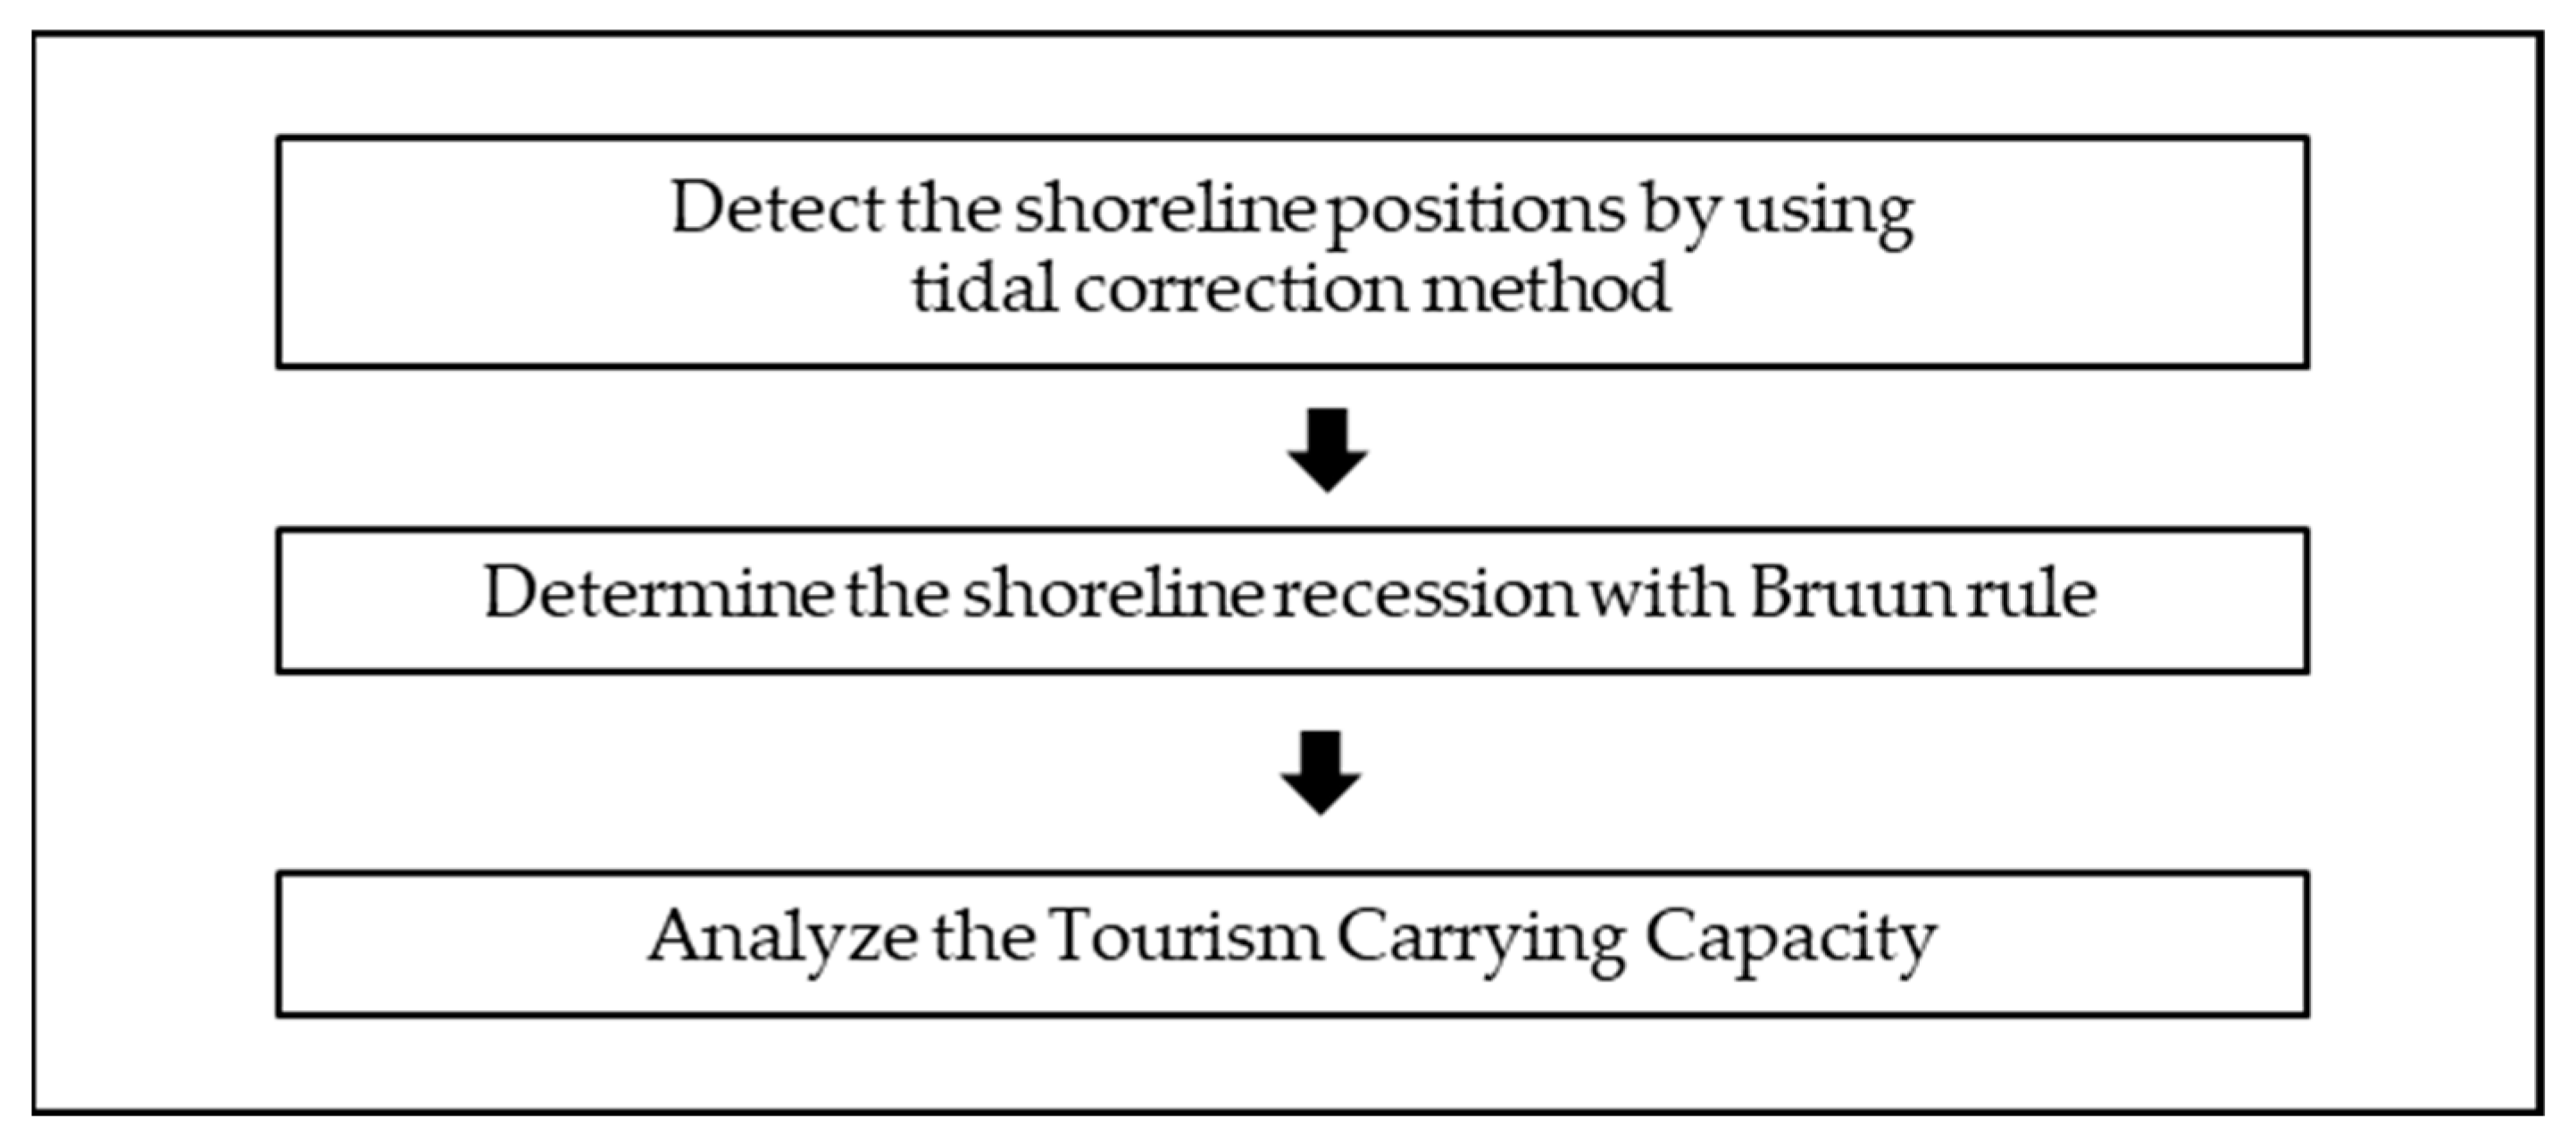
The method used in this study is depicted in
Figure 4. The first step was to detect the shoreline position using the tidal correction method. The next step was to determine the shoreline retreat using the Bruun rule. The last step was to analyse TCC.
3.1. Detection of the Shoreline Position Using the Tidal Correction Method
The tidal correction method was developed to obtain the shoreline position by detecting the mean sea level as the reference and correcting for the tidal effect [
10]. To detect the shoreline position from Google Earth images using the tidal correction method, ground control points were taken in the images to rectify them. An image-processing method was used to analyse the pixels in the images, and the shoreline position was detected automatically with MATLAB software. In the tidal correction step, the capture time of the images was estimated by measuring the solar azimuth angle from the shadow object on the images. As depicted in
Figure 5,
θ is the foreshore slope of the beach. The shoreline position was corrected with a trigonometric function to become the shoreline position at mean sea level as follows:
3.2. Shoreline Retreat Base on the Bruun Rule
The Bruun rule [
4] was developed by Bruun to estimate future shoreline retreat from the changes in sea level with a linear relationship based on equilibrium profile theory, as follows:
where Δ
y is the shoreline recession,
y* is the distance in the horizontal to the depth of closure,
S is the sea level rise,
h* is the depth of closure, and
Bh is the berm height.
To calculate the depth of closure [
12], we used the significant wave height and significant wave period as follows:
where
He,t is the significant wave height, which is exceeded 12 h per
t years,
g is the gravitational acceleration, and
Te,t is the significant wave period with 12-h-per-
t-year exceedance.
To determine the distance to the depth of the closure point,
y*, which depends on grain size [
13] and the depth of closure, we used the following:
where A is the scaling parameter based on the sediment size (d
50) and h
* is the depth of closure from Equation (3).
To calculate the berm height (
Bh) with Equations (5) [
14] and (6) [
15], the significant wave data and wave period were required:
where
Bh is berm height,
Hb is breaking wave height, and
Ts is mean significant wave period, and:
where
Hs is mean significant wave height, tan
α is beach slope, and
Ls is significant wave length. The shoreline retreat can be calculated by including all parameters in Equation (2).
3.3. TCC
As defined previously, TCC consists of PCC, RCC, and ECC.
In this study, PCC was calculated from the beach areas, area required per user (Equation (7)), and rotation factor (Equation (2)) [
16], where A is beach areas, Au is area required per user, and Rf is the rotation factor (the daily open period divided by average visit time):
RCC was calculated using Equation (8), and the correction factors were calculated using Equation (9):
where Cf is the correction factors, and:
where Lmx is the limiting magnitude of variable x and Tmx is the total magnitude of variable x. The correction factors were determined by considering the factors that limit tourism activities.
ECC is the maximum number of tourists that the area can sustain. ECC is calculated by combining the RCC with management capacity (indicates the present condition of tourism management) [
17], as follows:
where Mc is the management capacity.
4. Results
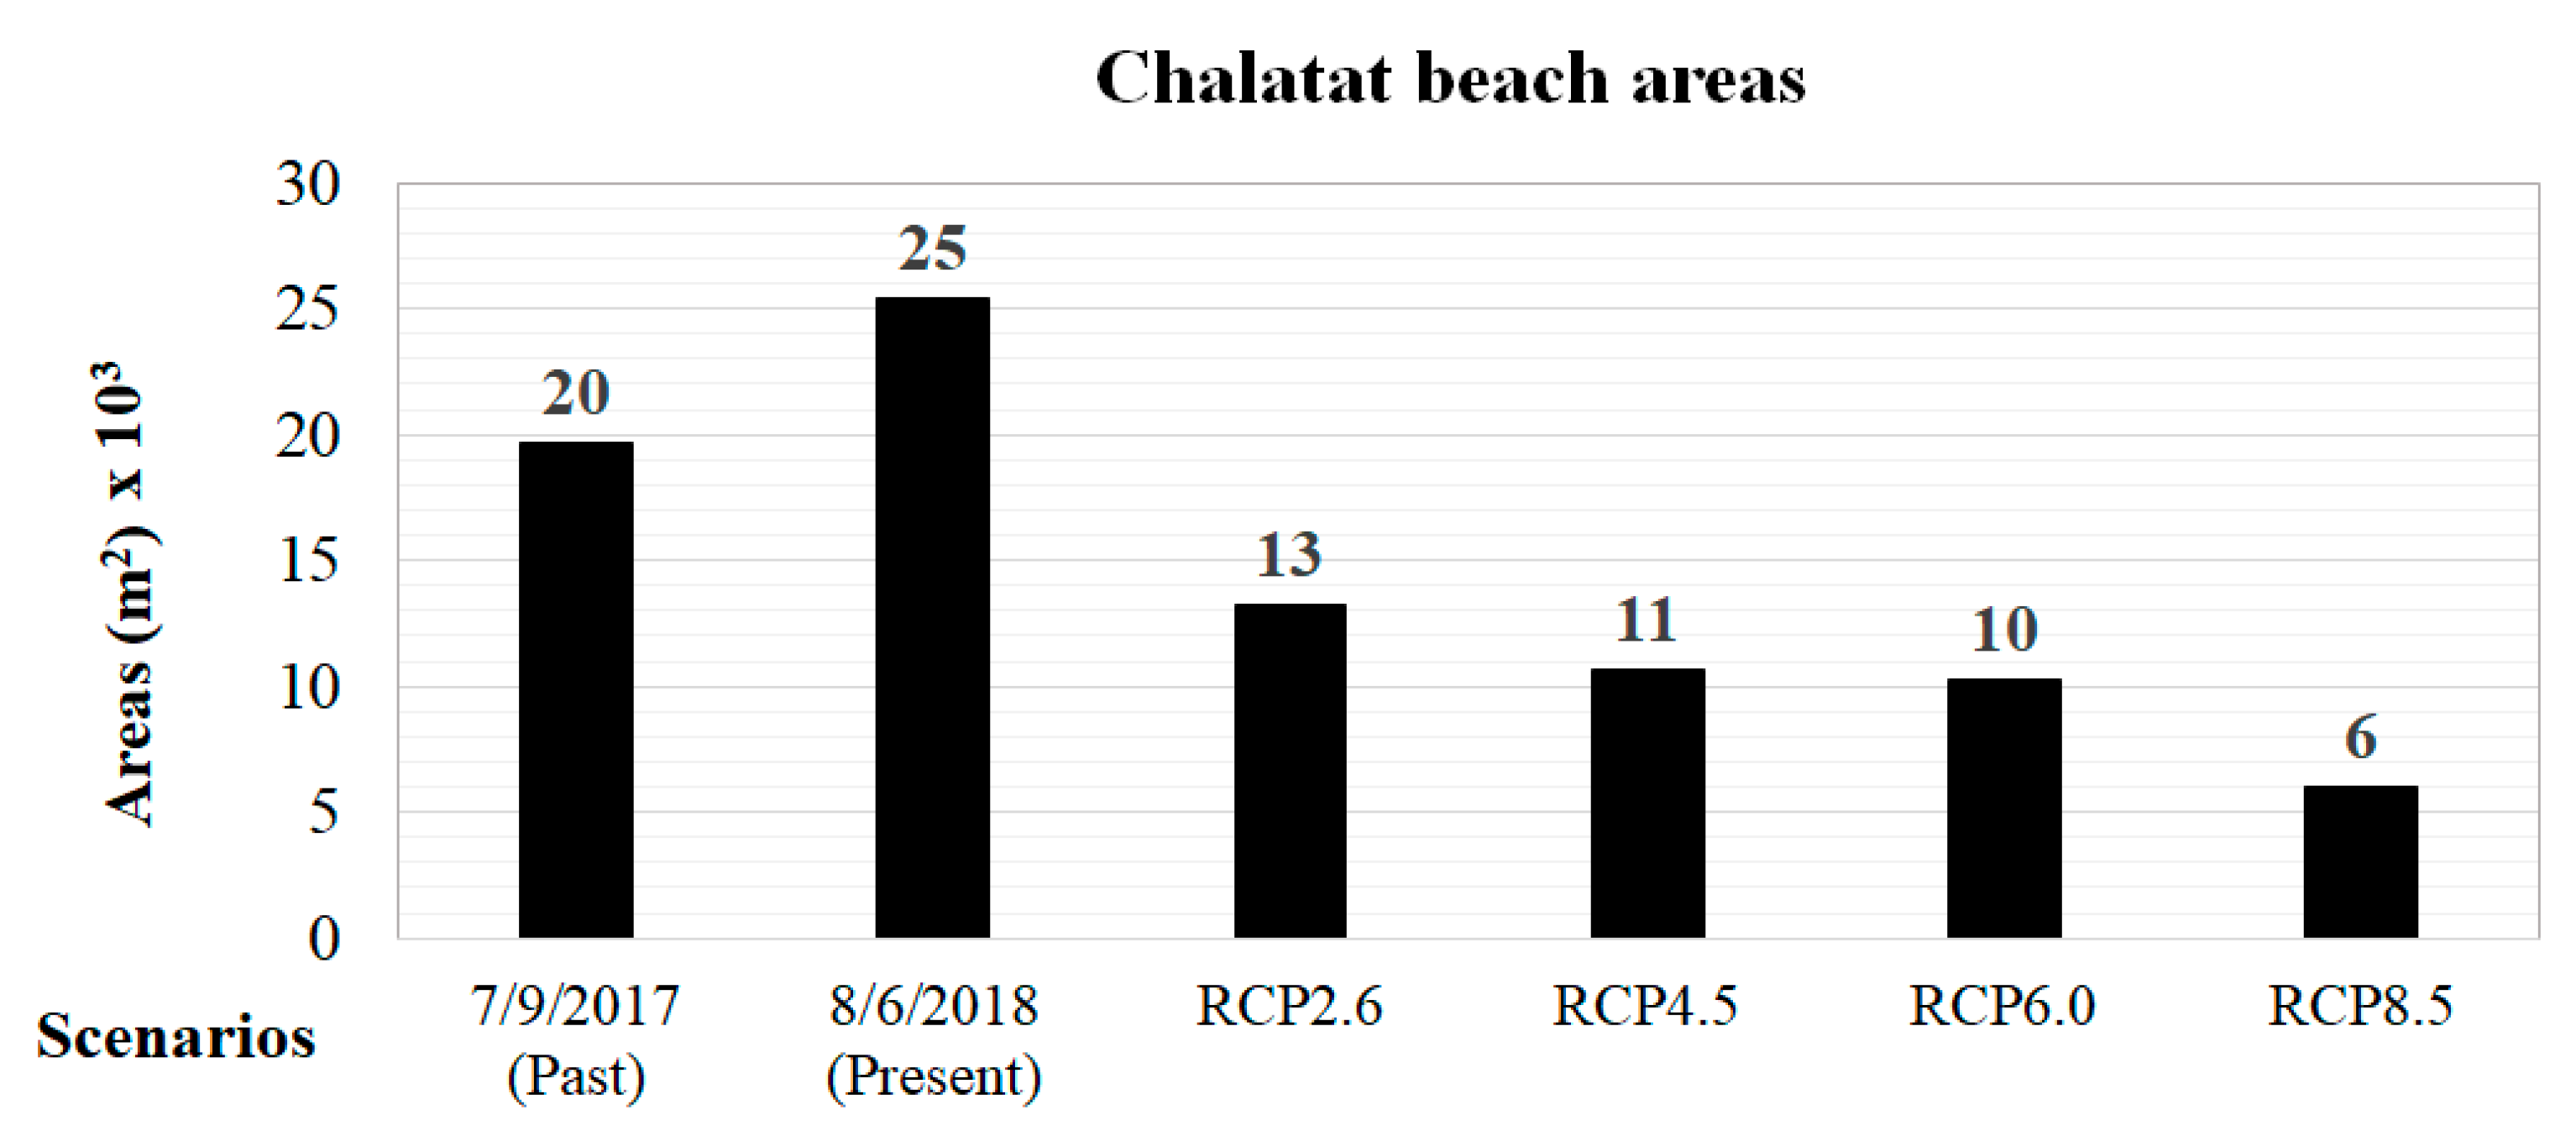
4.1. Beach Areas for Each Scenario
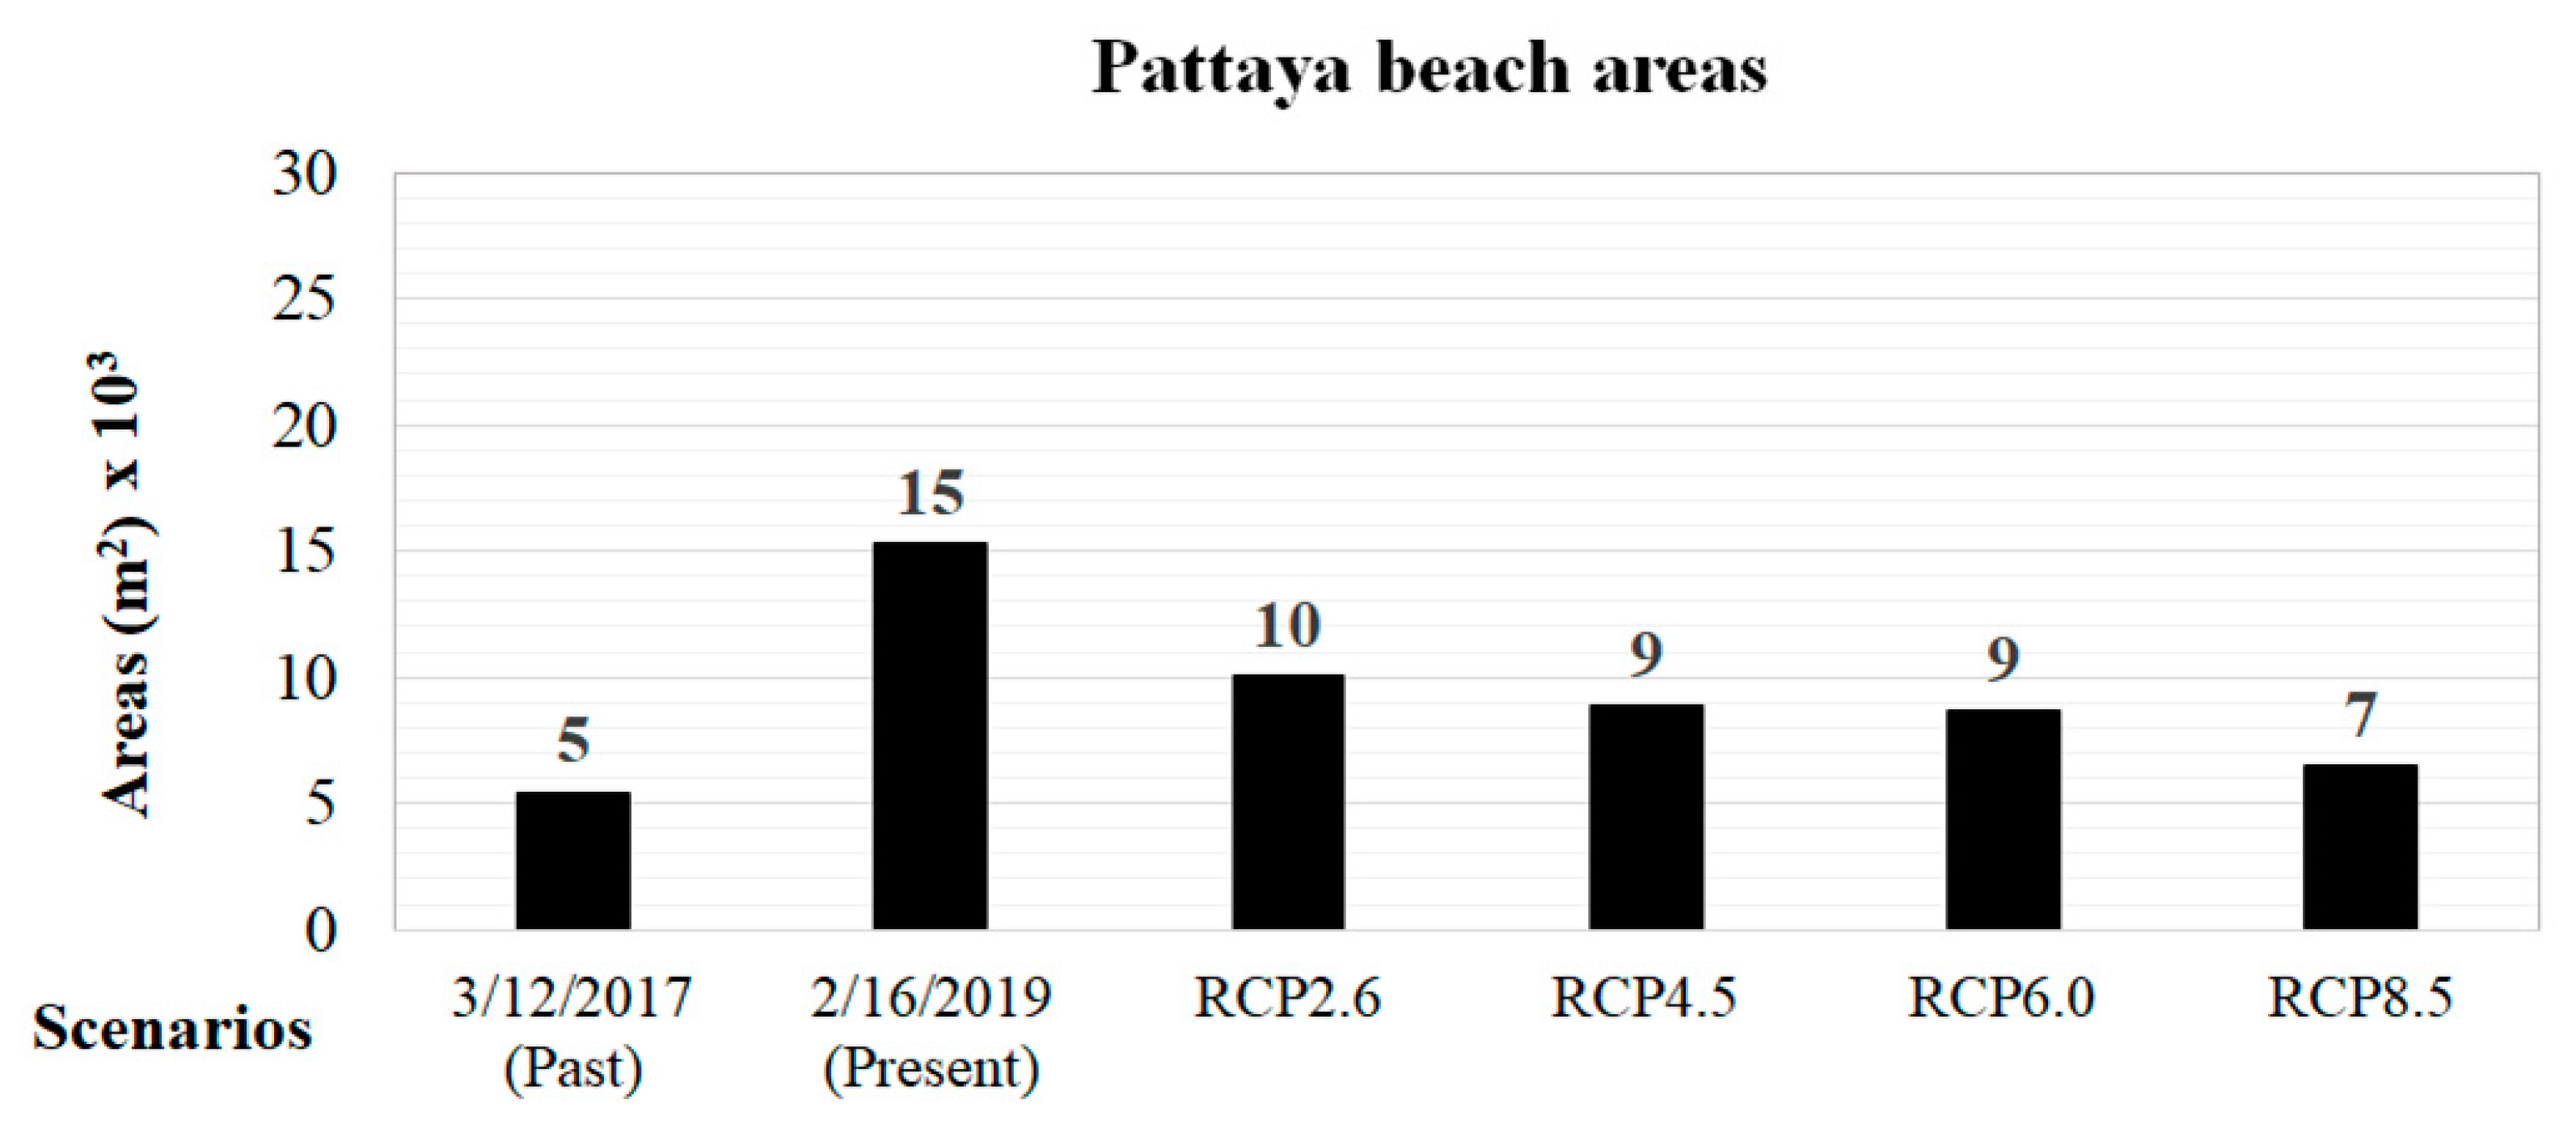
From the detection of shoreline position using the tidal correction method combined with the Bruun rule, the beach areas for past, present, and future scenarios are depicted in
Figure 6 for Pattaya beach and
Figure 7 for Chalatat beach. The results demonstrate that the present scenario in the study areas is the maximum beach area compared to the other scenarios, due to sea-level rise.
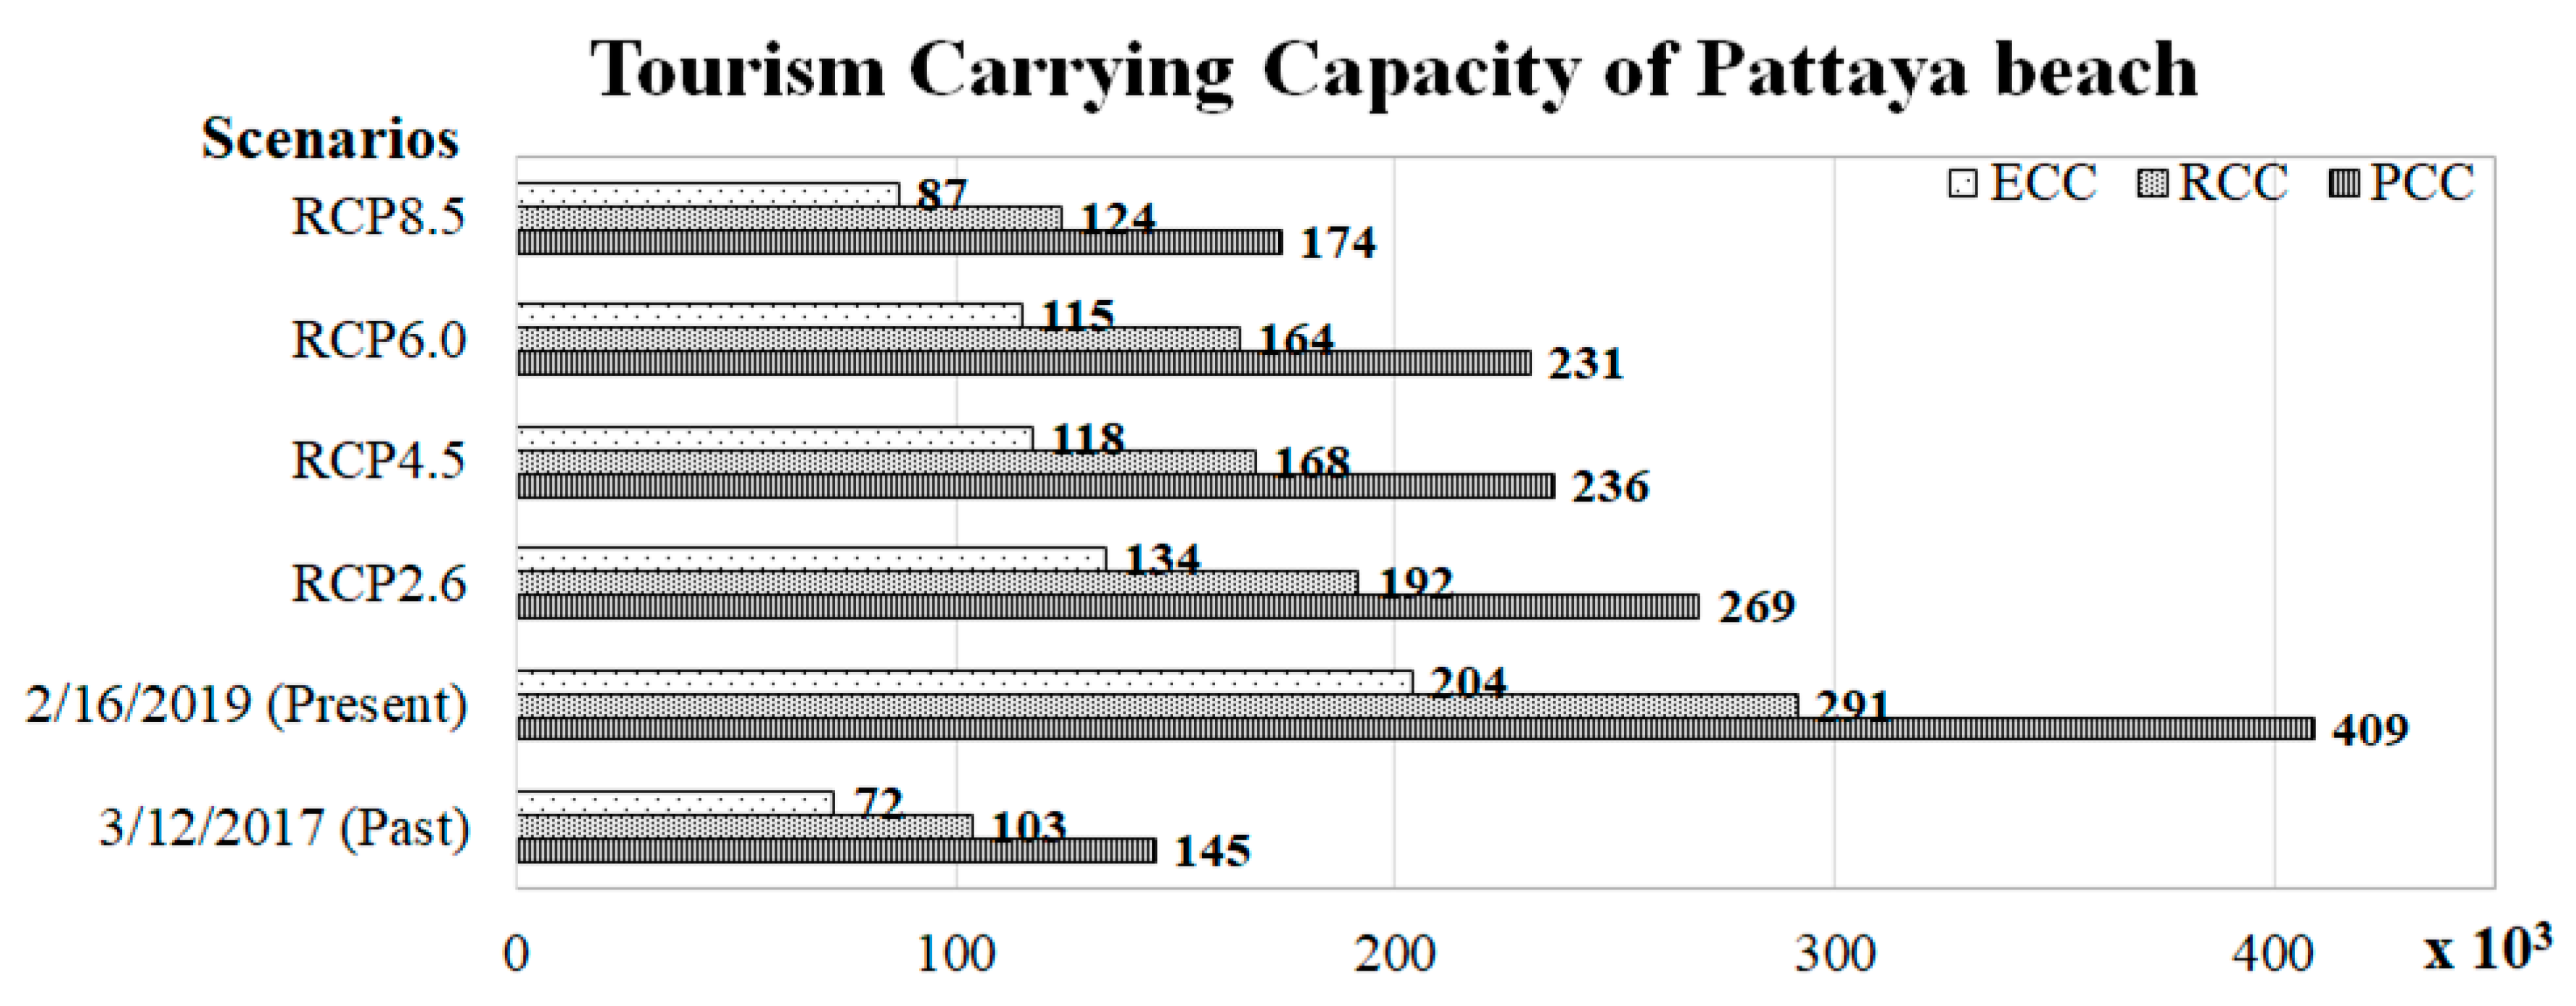
4.2. Tourism Carrying Capacity
The TCCs are depicted in
Figure 8 for Pattaya beach and
Figure 9 for Chalatat beach. The present scenario has the maximum TCC in both of the study areas. The results indicate that beach area, correction factors, and management affect the TCC. In terms of PCC, Pattaya beach areas are more significant than Chalatat beach areas, but the PCC at Pattaya beach is higher than Chalatat beach because of the larger area required per user at Chalatat beach. Thus, the PCC depends on the area required per user and the average visit time, which affect the physical characteristic of tourism beach capacity. The RCC at Pattaya beach is higher than at Chalatat beach because of the larger number of correction factors at Chalatat beach. The correction factors depend on the rainy days that are a factor of the climate zone of the study areas. Chalatat beach is located on the east coast in the southern part of Thailand, which has a longer rainy season than Pattaya beach, located in the eastern region. Moreover, Pattaya beach has a higher management capacity than Chalatat beach, resulting in a significantly higher ECC at Pattaya beach. In conclusion, ECC relies on the parameters of management capacity where Pattaya beach is a well-known beach for international tourists, but Chalatat beach is known as a domestic tourism beach. Pattaya beach contributes great benefits to economic development in the tourism sector of Thailand. Consequently, Pattaya beach has more efficient management owing to government expenditure on the area.
Moreover, the increase in TCC will explicitly affect the beach environment and ecosystem. The culture and lifestyle of local people in coastal communities are likely to adjust to the tourists. These are interesting topics to study further in the future.
5. Conclusions
This study presented the TCC of the Pattaya and Chalatat beaches due to sea-level rise under a range of different scenarios. Pattaya beach represented the character of the well-known beaches of Thailand while Chalatat beach represented the character of beaches that are the focus of domestic tourism. This study detected the shoreline position using Google Earth images with tidal correction to analyse beach areas and calculate the shoreline retreat with the Bruun rule. Then, the TCC was assessed using the beach area, correction factors, and management capacity. The results suggest that the ECC of Pattaya beach in the present is about 200,000, while it is 49,000 for Chalatat beach. Our analysis showed that the ECC of Pattaya beach will be more extensive than the ECC of Chalatat beach in all situations, even though there is more abundant beach area at Chalatat than at Pattaya. The factors contributing to the TCC are the beach areas, correction factors and management capacity. Sea-level rise directly affects the beach areas, so the possibility of future beach loss could be a concern. Also, the effective management of facilities and infrastructure around beach areas will affect the development of TCC. Nevertheless, the protection of tourism beaches should be considered in the future.
Author Contributions
Project administration, S.R.; supervision, S.R. and K.U.; validation, S.R.; formal analysis, P.N.; data curation, P.N.; writing—original draft preparation, P.N.; writing—review and editing, S.R. All authors have read and agreed to the published version of the manuscript.
Funding
This research received no external funding.
Acknowledgments
This research was supported by Advancing Co-design of Integrated Strategies with Adaptation to Climate Change on Thailand (ADAP-T) supported by the Science and Technology Research Partnership for Sustainable Development (SATREPS), JST-JICA.
Conflicts of Interest
The authors declare no conflict of interest.
References
- IPCC. Working Group I Contribution to the Ipcc Fifth Assessment Report Climate Change 2013, the Physical Science Basis; Final draft underlying scientific-technical assessment IPCC, Stockholm; Cambridge University Press: Cambridge, UK, 2013. [Google Scholar]
- Patcharapitchakorn, K.; Ritphring, S. Sea Level Change in Thailand. Ladkrabang Eng. J. 2012, 29, 56–60. [Google Scholar]
- Ritphring, S.; Somphong, C.; Udo, K.; Kazama, S. Projections of Future Beach Loss due to Sea Level Rise for Sandy Beaches along Thailand’s Coastlines. J. Coast. Res. 2018, 85, 541–545. [Google Scholar] [CrossRef]
- Bruun, P. Sea-level rise as a cause of shore erosion. J. Waterw. Harb. Div. 1962, 88, 117–132. [Google Scholar]
- Zacarias, D.A.; Williams, A.T.; Newton, A. Recreation carrying capacity estimations to support beach management at Praia de Faro, Portugal. Appl. Geogr. 2011, 31, 1075–1081. [Google Scholar] [CrossRef]
- UNWTO. Saturation of Tourist Destinations, Report of the Secretary General; World Tourism Organization: Canberra, Austrania, 1981. [Google Scholar]
- Fayos-Solà, E.; Weiss, B.; Del Río, I. Tourism’s potential as a sustainable development strategy. In Proceedings of the 2004 WTO tourism policy forum at the George Washington University, Washington, DC, USA, 18–20 October 2004; World Tourism Organization (WTO): Madrid, Spain, 2005. [Google Scholar]
- López-Dóriga, U.; Jiménez, J.A.; Valdemoro, H.I.; Nicholls, R.J. Impact of sea-level rise on the tourist-carrying capacity of Catalan beaches. Ocean Coast. Manag. 2019, 170, 40–50. [Google Scholar] [CrossRef]
- Ministry of Tourism and Sports. Sea Sun Sand Tourism Economics Competitiveness; 9; Ministry of Tourism and Sports: Bangkok, Thailand, 2018. (In Thai) [Google Scholar]
- Hoang, V.; Tanaka, H.; Mitobe, Y. A method for correcting tidal effect on shoreline position extracted from an image with unknown capture time. Geosciences 2017, 7, 62. [Google Scholar] [CrossRef]
- Nidhinarangkoon, P.; Ritphring, S. Shoreline changes by using google earth images with tidal correction: A case study of samui island, thailand. In International Conference on Fluid Mechanics 8; Tohoku University: Sendai, Japan, 2018. [Google Scholar]
- Nicholls, R.J.; Birkemeier, W.A.; Hallermeier, R.J. Application of the depth of closure concept. Coast. Eng. 1996, 1997, 3874–3887. [Google Scholar]
- Dean, R.G. Equilibrium beach profiles: Characteristics and applications. J. Coast. Res. 1991, 7, 53–84. [Google Scholar]
- Takeda, I.; Sunamura, T. Formation and spacing of beach cusps. Coast. Eng. Jpn. 1983, 26, 121–135. [Google Scholar] [CrossRef]
- Sunamura, T. Coastal and beach changes by waves. Trans. Jpn. Geomorphol. Union 1983, 4, 179–188. (In Japanese) [Google Scholar]
- Sridhar, R.; Yuvaraj, E.; Sachithanandam, V.; Mageswaran, T.; Purvaja, R.; Ramesh, R. Tourism Carrying Capacity for Beaches of South Andaman Island, India. Tour. Empir. Res. Pract. Appl. 2016, 4, 61. [Google Scholar]
- Bera, S.; Majumdar, D.D.; Paul, A. Estimation of tourism carrying capacity for Neil Island, South Andaman, India. J. Coast. Sci. 2015, 2, 46–53. [Google Scholar]
© 2020 by the authors. Licensee MDPI, Basel, Switzerland. This article is an open access article distributed under the terms and conditions of the Creative Commons Attribution (CC BY) license (http://creativecommons.org/licenses/by/4.0/).


