Underwater Pipeline Oil Spill Detection Based on Structure of Root and Branch Cells


Abstract
1. Introduction
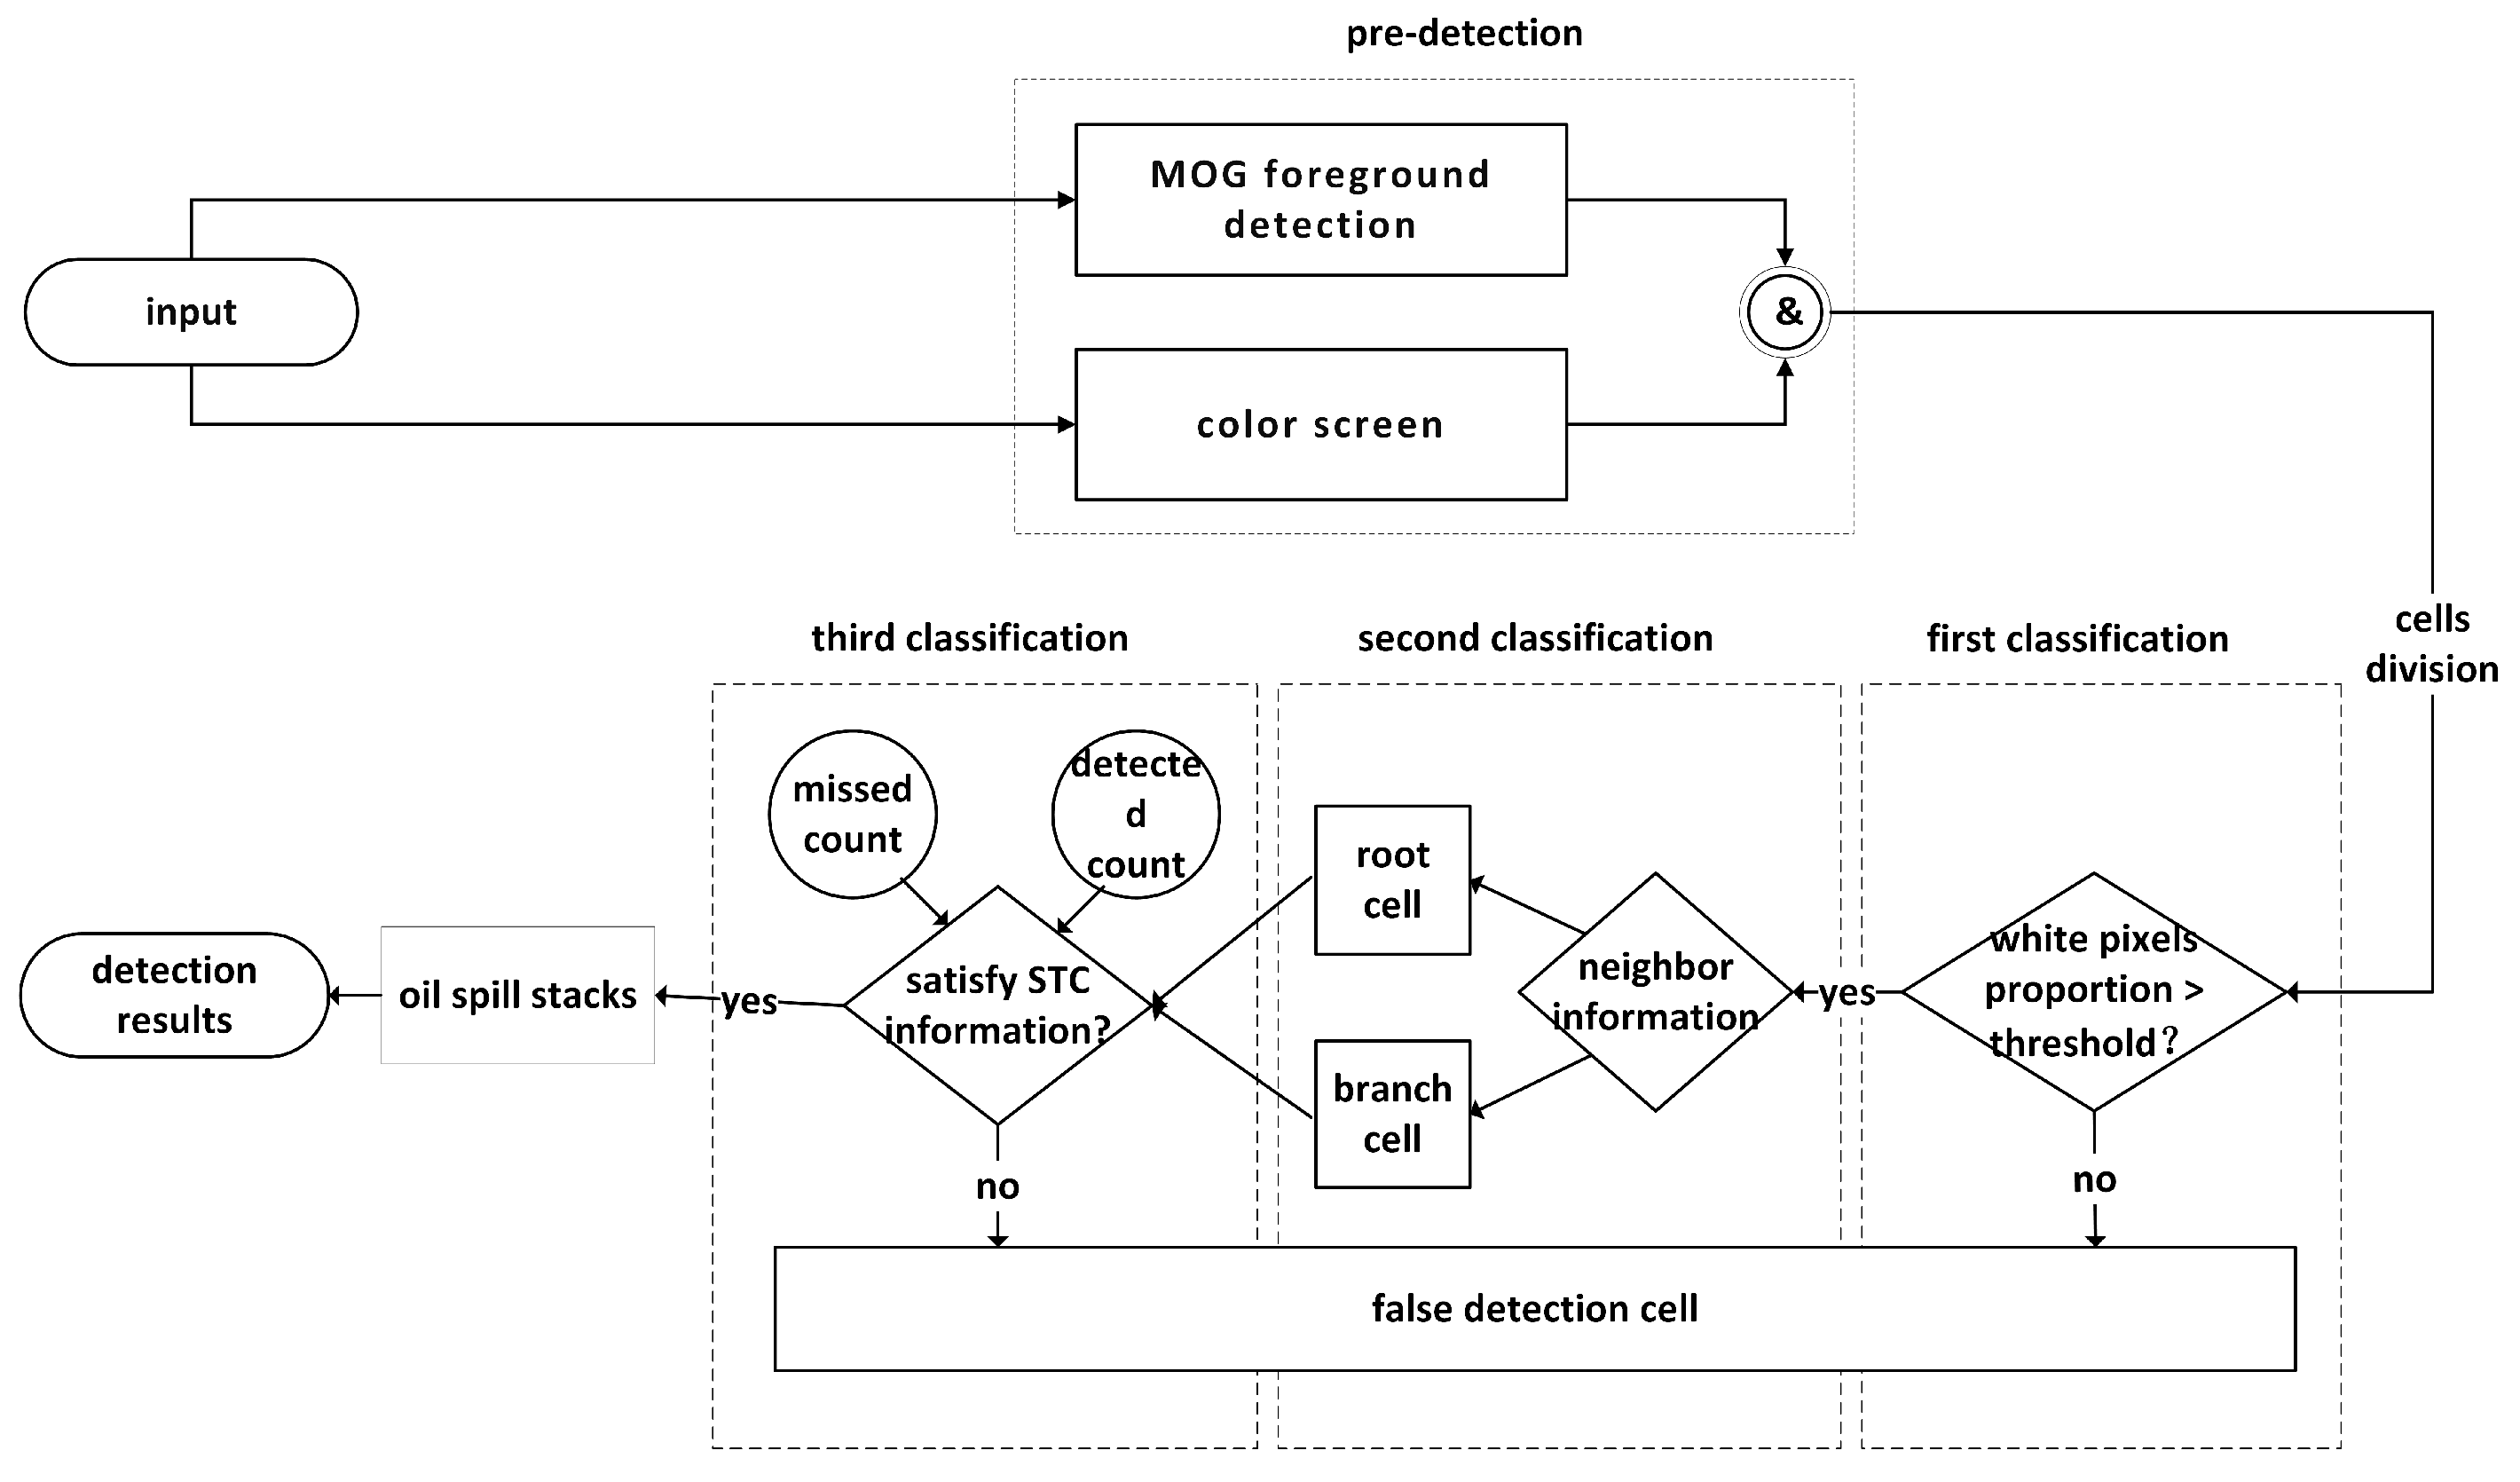
2. Method
2.1. Foreground Detection
- If a pixel belongs to a certain Gaussian distribution, then the pixel belongs to the category represented by the Gaussian distribution.
- If a pixel is not attributed to a Gaussian distribution, then the pixel is attributed to the motion foreground.
2.2. Color Screening
2.3. False Detection Elimination
- Oil spillage is always produced from bottom to top.
- The movement of oil spillage occurs locally.
3. Results and Discussion
4. Conclusions
Author Contributions
Funding
Conflicts of Interest
Abbreviations
| HSV | Hue, Saturation, Value | STC | spatiotemporal context |
| CNN | convolutional neural networks | VOC | visual object classes |
| COCO | common objects in context | SSD | single shot multibox detector |
| YOLO | you only look once | T2FMOG | type-2 fuzzy mixture of Gaussian model |
| MF | membership function | FOU | footprint of uncertainty |
| RGB | red, green, blue | ROV | remote operated vehicle |
| P-R | precision-recall | AP | average precision |
| IoU | intersection over union | AUC | area under curve |
References
- Brkić, D.; Praks, P. Proper Use of Technical Standards in Offshore Petroleum Industry. J. Mar. Sci. Eng. 2020, 8, 555. [Google Scholar] [CrossRef]
- Dhont, D.; Jatiault, R.; Lattes, P. Combined Use of SAR and Underwater Gliders for Oil Seeps Detection. In Proceedings of the 2019 IEEE International Geoscience and Remote Sensing Symposium (IGARSS 2019), Yokohama, Japan, 28 July–2 August 2019; IEEE: Piscataway, NJ, USA, 2019; pp. 7865–7868. [Google Scholar] [CrossRef]
- Johansen, Ø. DeepBlow—A Lagrangian plume model for deep water blowouts. Spill Sci. Technol. Bull. 2000, 6, 103–111. [Google Scholar] [CrossRef]
- Johansen, Ø.; Rye, H.; Cooper, C. DeepSpill—-field study of a simulated oil and gas blowout in deep water. Spill Sci. Technol. Bull. 2003, 8, 433–443. [Google Scholar] [CrossRef]
- Johansen, Ø. Development and verification of deep-water blowout models. Mar. Pollut. Bull. 2003, 47, 360–368. [Google Scholar] [CrossRef]
- Bescond, C.; Kruger, S.E.; Levesque, D.; Brosseau, C. Photoacoustic detection and monitoring of oil spill. In AIP Conference Proceedings; AIP Publishing LLC.: Melville, NY, USA, 2019; p. 020025. [Google Scholar] [CrossRef]
- Osman, A.; Ovinis, M.; Hashim, F.; Faye, I. Wavelet-based optical velocimetry for oil spill flow rate estimation. Measurement 2019, 138, 485–496. [Google Scholar] [CrossRef]
- Qasem, F.; Susilo, T.; Said, S.; Alarbash, Z.; Hasan, M.; Jabakhanji, B.; Beyrouthy, T. Preliminary Engineering Implementation on Multisensory Underwater Remotely Operated Vehicle (ROV) for Oil Spills Surveillance. In Proceedings of the 2019 3rd International Conference on Bio-Engineering for Smart Technologies (BioSMART), Paris, France, 24–26 April 2019; IEEE: Piscataway, NJ, USA, 2019; pp. 1–5. [Google Scholar] [CrossRef]
- Oh, S.; Lee, M.; Seo, S.; Roy, M.; Seo, D.; Kim, J. Underwater multispectral imaging system for environmental monitoring. In OCEANS 2014-TAIPEI; IEEE: Piscataway, NJ, USA, 2014; pp. 1–3. [Google Scholar] [CrossRef]
- Everingham, M.; Gool, L.V.; Williams, C.K.I.; Winn, J.; Zisserman, A. The Pascal Visual Object Classes (VOC) Challenge. Int. J. Comput. Vis. 2010, 88, 303–338. [Google Scholar] [CrossRef]
- Lin, T.Y.; Maire, M.; Belongie, S.; Hays, J.; Perona, P.; Ramanan, D.; Dollár, P.; Zitnick, C.L. Microsoft coco: Common objects in context. In European Conference on Computer Vision; Springer: Berlin, Germany, 2014; pp. 740–755. [Google Scholar] [CrossRef]
- Deng, J.; Dong, W.; Socher, R.; Li, L.J.; Li, K.; Fei-Fei, L. Imagenet: A large-scale hierarchical image database. In Proceedings of the 2009 IEEE Conference on Computer Vision and Pattern Recognition, Miami, FL, USA, 20–25 June 2009; IEEE: Piscataway, NJ, USA, 2009; pp. 248–255. [Google Scholar] [CrossRef]
- Zou, Z.; Shi, Z.; Guo, Y.; Ye, J. Object detection in 20 years: A survey. arXiv 2019, arXiv:1905.05055. [Google Scholar]
- Liu, W.; Anguelov, D.; Erhan, D.; Szegedy, C.; Reed, S.; Fu, C.Y.; Berg, A.C. Ssd: Single shot multibox detector. In European Conference on Computer Vision; Springer: Berlin, Germany, 2016; pp. 21–37. [Google Scholar] [CrossRef]
- Ren, S.; He, K.; Girshick, R.; Sun, J. Faster R-CNN: Towards Real-Time Object Detection with Region Proposal Networks. IEEE Trans. Pattern Anal. Mach. Intell. 2017, 39, 1137–1149. [Google Scholar] [CrossRef]
- Redmon, J.; Farhadi, A. Yolov3: An incremental improvement. arXiv 2018, arXiv:1804.02767. [Google Scholar]
- Zivkovic, Z. Improved adaptive Gaussian mixture model for background subtraction. In Proceedings of the 17th International Conference on Pattern Recognition (ICPR), Cambridge, UK, 23–26 August 2004; IEEE: Piscataway, NJ, USA, 2004; Volume 2, pp. 28–31. [Google Scholar] [CrossRef]
- Zivkovic, Z.; Van Der Heijden, F. Efficient adaptive density estimation per image pixel for the task of background subtraction. Pattern Recognit. Lett. 2006, 27, 773–780. [Google Scholar] [CrossRef]
- Das, B.P.; Jenamani, P.; Mohanty, S.K.; Rup, S. On the development of moving object detection from traditional to fuzzy based techniques. In Proceedings of the 2017 2nd IEEE International Conference on Recent Trends in Electronics, Information & Communication Technology (RTEICT), Bangalore, India, 19–20 May 2017; IEEE: Piscataway, NJ, USA, 2017; pp. 658–661. [Google Scholar] [CrossRef]
- Lim, L.A.; Keles, H.Y. Foreground segmentation using convolutional neural networks for multiscale feature encoding. Pattern Recognit. Lett. 2018, 112, 256–262. [Google Scholar] [CrossRef]
- Lim, L.A.; Keles, H.Y. Learning multi-scale features for foreground segmentation. Pattern Anal. Appl. 2019, 1–12. [Google Scholar] [CrossRef]
- Wang, Y.; Jodoin, P.M.; Porikli, F.; Konrad, J.; Benezeth, Y.; Ishwar, P. CDnet 2014: An expanded change detection benchmark dataset. In Proceedings of the IEEE Conference on Computer Vision and Pattern Recognition Workshops, Columbus, OH, USA, 23–28 June 2014; pp. 387–394. [Google Scholar] [CrossRef]
- Garcia-Garcia, B.; Bouwmans, T.; Silva, A.J.R. Background subtraction in real applications: Challenges, current models and future directions. Comput. Sci. Rev. 2020, 35, 100204. [Google Scholar] [CrossRef]
- El Baf, F.; Bouwmans, T.; Vachon, B. Type-2 fuzzy mixture of Gaussians model: Application to background modeling. In International Symposium on Visual Computing; Springer: Berlin, Germany, 2008; pp. 772–781. [Google Scholar] [CrossRef]
- Sobral, A. BGSLibrary: An opencv c++ background subtraction library. In Proceedings of the IX Workshop de Visao Computacional: Botafogo, Rio de Janeiro, Brazil, 3–5 June 2013; CRC Press: Boca Raton, FL, USA, 2013; Volume 2, p. 7. Available online: https://github.com/andrewssobral/bgslibrary (accessed on 10 December 2020). [CrossRef]
- St-Charles, P.L.; Bilodeau, G.A. Improving background subtraction using local binary similarity patterns. In IEEE Winter Conference on Applications of Computer Vision; IEEE: Piscataway, NJ, USA, 2014; pp. 509–515. [Google Scholar] [CrossRef]
- St-Charles, P.; Bilodeau, G.; Bergevin, R. SuBSENSE: A Universal Change Detection Method With Local Adaptive Sensitivity. IEEE Trans. Image Process. 2015, 24, 359–373. [Google Scholar] [CrossRef] [PubMed]
- Van Droogenbroeck, M.; Barnich, O. ViBe: A disruptive method for background subtraction. Backgr. Model. Foreground Detect. Video Surveill. 2014, 7–11. [Google Scholar] [CrossRef]
- Zhao, X.; Wang, X.; Du, Z. Research on Detection Method for the Leakage of Underwater Pipeline by YOLOv3. In Proceedings of the 2020 IEEE International Conference on Mechatronics and Automation (ICMA), Beijing, China, 2–5 August 2020; IEEE: Piscataway, NJ, USA, 2020; pp. 637–642. [Google Scholar] [CrossRef]


| Video | |||
|---|---|---|---|
| 1 | 0.958 | 0.662 | 0.369 |
| 2 | 0.943 | 0.659 | 0.192 |
Publisher’s Note: MDPI stays neutral with regard to jurisdictional claims in published maps and institutional affiliations. |
© 2020 by the authors. Licensee MDPI, Basel, Switzerland. This article is an open access article distributed under the terms and conditions of the Creative Commons Attribution (CC BY) license (http://creativecommons.org/licenses/by/4.0/).
Share and Cite
Song, H.; Song, J.; Ren, P. Underwater Pipeline Oil Spill Detection Based on Structure of Root and Branch Cells. J. Mar. Sci. Eng. 2020, 8, 1016. https://doi.org/10.3390/jmse8121016
Song H, Song J, Ren P. Underwater Pipeline Oil Spill Detection Based on Structure of Root and Branch Cells. Journal of Marine Science and Engineering. 2020; 8(12):1016. https://doi.org/10.3390/jmse8121016
Chicago/Turabian StyleSong, Huajun, Jie Song, and Peng Ren. 2020. "Underwater Pipeline Oil Spill Detection Based on Structure of Root and Branch Cells" Journal of Marine Science and Engineering 8, no. 12: 1016. https://doi.org/10.3390/jmse8121016
APA StyleSong, H., Song, J., & Ren, P. (2020). Underwater Pipeline Oil Spill Detection Based on Structure of Root and Branch Cells. Journal of Marine Science and Engineering, 8(12), 1016. https://doi.org/10.3390/jmse8121016