Abstract
A new thermodynamic hydrate inhibitor (THI), is being proposed based on the analysis of its rheological properties leading to improvement of the injection process. The method is based on the viscosity changes during the injection process. The experimental tests analysing the viscosity, shear stress related to drag force of the MEG and ethanol mixture allowed us to develop a better injectable THI. Considering the results that we obtained, it can be said that the mixture of MEG/EtOH is more convenient for transportation and injection process, and also to be stored on the platform. The use of ethanol and MEG mixture as THI is novel in this field. It turns out that the benefits of the mixture overcome the benefits of using them alone. This discovery opens a window for more improvements to natural gas hydrate suppression. The mixture could also change the formation of gas hydrates, thereby destabilizing the ice-like structure. Since the hydrate suppression process is stoichiometric—directly proportional to water production—it is necessary to inject large amounts of THI, thus improving the injection with the proposed mixture could lead to a more economical process.
1. Introduction
1.1. Gas Hydrates Overview
Offshore oil and gas production lately has gone to facilities further from the coast and to deeper sub-sea production systems. These characteristics have conditioned the technology and equipment necessary to allow the production to continue flowing without issues. In these locations, where the working pressures are very high and the temperatures are low, the formation of gas hydrates inside the production systems is quite frequent. Gas hydrates form when gas molecules are inside ice-like lattice and are tied with water molecules by van der Waals forces. These forces make the gas hydrate very stable. Due to the low temperature these water molecules, the hosts, get frozen trapping the gas molecules, the guests. The variety of the gas hydrates depends primarily on the size and concentration of the guest molecules, as can be seen in Table 1.

Table 1.
Gas hydrates structures and guest molecules.
1.2. Methane Hydrates Potential by Global Regions
In gas and oil production the hydrates are mostly formed with methane as a guest molecule. This is one of the reasons why the investment interest in methane gas hydrates has been growing, as it represents another option for the energy market, with average world resource potential of 43311 TCF. The regions with the most methane hydrates exploitable zones can be seen in Figure 1. They are all over the globe. It can be seen that some regions such as North (21.37%) and Latin America (11.41%) have a big portion of the resources, among the Arctic (15.29%) and former Soviet Union (8.84%).
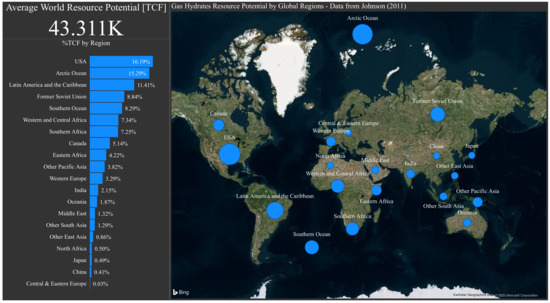
Figure 1.
Methane hydrates resource potential by global regions [TCF]—Data from Johnson (2011) [1].
As methane hydrates can be encountered all over the world, it means that the problems related to gas hydrates follow and may develop in any of these zones. The problem with the formation of gas hydrates is not just the reduction of the production flow rate to the extreme of stopping the flow [2,3,4,5]. Also, the fact that once the ice structures are formed, the upward production along with the decreasing pressure going up, these structures can become on-ice projectile that would cause damages to the sub-sea production systems, the flowlines, Pipeline End Manifolds (PLEMs), Pipeline End Terminations (PLETs), In-Line Tees (ILTS), connectors, valves, jumpers, etc. Other problems that may happen during oil and gas production in zones where gas hydrates are present are an uncontrolled gas release while drilling, damage to the well casing. Also, the disruption of a gas hydrates sediment could fracture the seafloor compromising the stability for the wellbore among other sub-sea equipment on the sea floor [6].
1.3. Inhibition of Gas Hydrates
There are several methods used to avoid the formation of gas hydrates, the injection of THI being one of the most-used at the moment. The injection of THI is done using a chemical delivery system. In some cases, it is continuous through capillary systems installed on completions systems. The use of THI is a common practice, as they allow the production of oil and gas under harsh conditions with reduced risks and increased safety.
The main characteristic of the THI is that they shift the hydrates formation conditions towards higher pressures and lower temperatures, like the ones encountered under normal production circumstances [7,8]. Some of the most used THI are MEG, methanol and ethanol. Some advantages of using methanol when comparing it with MEG include higher hydrate suppression and lower viscosity. Unfortunately, it is more contaminant for downstream processes and also more strict environmental regulations. On the MEG side, it is highly recoverable and reusable, small losses to the hydrocarbon phase but due to its high viscosity, transporting MEG needs more powerful pumping system [9].
Figure 2 shows the usual change a gas hydrate formation scenario has under the effect of THI, such as MEG, methanol or ethanol. As it can be seen, the hydrates formation curves move to the left when injecting said proportion of THI. The influence of the quantity of the THI injected can also be seen. The more THI is injected, the further left the curve shifts, i.e., to a condition of higher pressure and lower temperature needed for the gas hydrates to be formed.

Figure 2.
Hydrate formation zones shift caused by the use of 20% of THI—Adapted from Kim (2018) [10].
The No THI hydrate curve was adapted from Kim (2018) [10]. The composition of the fluid can be found in Kim (2018) [10]. The curves considering 20% of THI were calculated using the Hammerschmidt method, Equation (1). The data for these curves can be found in Table A1. Figure 2 demonstrates the effect of the THI decreasing the temperature and shifting the curves. In this case, we used a 20 wt% of mentioned THI. Hammerschmidt Equation as is shown in Equation (1) [11].
where:
| DT | Temperature shift, hydrate depression [C] |
| K | Constant, from Table 2 |
| W | Concentration of the inhibitor in weight per cent in the aqueous phase |
| M | Molecular weight of the inhibitor divided by the molecular weight of water, from Table 3 |
Table 2.
K-value for Hammerschmidt equation found in literature [12,13].
Table 3.
Properties of fluids.
As seen in Figure 2, the area to the right of the curve will be free of hydrates, whereas the area to the left represents conditions of pressure and temperature where hydrates can form. The K values for methanol MEG and ethanol used to calculate the temperature decrease using the Equation (1) were 1297, 1500 and 1297, respectively.
1.4. Chemical Delivery of THI
Figure 3 shows a general configuration of a chemical injection system, consisting of tanks, pumps and control panel. When using chemical injection systems, MEG is usually injected into the borehole directly through valves [14]. Methanol can be injected at the Christmas Tree to prevent freezing of the line in a start-up condition. MEG is also injected directly into the flow lines during normal operation [15].

Figure 3.
Schematic of an offshore downhole chemical injection system.
The logistics of these treatments can be highlighted as follows:
Taking the THI from shore to platforms where they are being stored in tanks. The temperature and pressure of the tanks need to be controlled. Their volume depends on the injection rate, usually with a margin to assure the treatments. It is important that the tanks be redundant to enable cleaning/repair without platform shutdown [10]. It is also important to avoid corrosion and to be reactive to the injection fluids.
Using a pumping system to take them to the bottom of the sea using umbilicals. Pumps are usually displacement-type pumps. It is necessary to be able to give as much pressure as the flowing pressure when injecting to the well. In the other case, it should be platform design pressure when injecting to the export line [10]. As we are dealing with pumps, narrow pipes (umbilicals for MEG injection usually are 1/4–3/8 inches), high pressure, high to low temperatures. Characteristics taken into account are viscosity, density, chemical compatibility of the injection fluids, among others.
Besides these two, other components are important in the chemical delivery system. The control panel used to control the pumps, valves, and also items like pressure gauges and transmitters for the pumps and tanks, reduction valves, bypass sections, etc. A downhole continuous chemical injection system can be used to inject the fluids into the well or directly into the production flowlines.
1.5. Safety of THI
When working with THI, some considerations need to be made to assure safety and low operational risk on platforms. Methanol has a low flash point, as shown in Table 3, making it easily flammable. Unfortunately, when burning its flame is smokeless and almost invisible during the day. On its behalf, MEG is non-flammable. Methanol is toxic and a classified hazardous chemical. Since pressure is a big player in offshore production, vapour pressure is a characteristic to be considered. Due to its high vapour pressure, it is easy to inhale, causing breathing problems [16,17].
1.6. Partition of THI into Hydrocarbon Phase
MEG has a lower vapour pressure so it is considered safer. Another consideration undertaken is the high volatility of methanol. Some of it gets lost to the hydrocarbon phase, where it has no use. The amount of methanol or MEG lost to the hydrocarbon phase can be obtained using the equations for distribution constants. However, the amount of MEG lost to gas phase is almost negligible [18].
The distribution constant of methanol in the gas follows;
The distribution constant of methanol or MEG in the condensate follows;
1.7. Justification
Considering the harsh environment, there are some events that may occur. The low temperatures may cause gelling of the injection fluids, incompatible fluids can react and inflict damage on the injection system or become more viscous, causing extra work to the pumping system. In this research, we want to have a fluid that is easier to move downhole.
A particularity of these treatments is that the quantity of THI injected is directly related to how much water is being produced, and also to the decrease of the temperature needed to avoid the hydrate formation zones. As the hydrates form in the aqueous phase, MEG has an advantage over methanol as it can be used, cleaned and re-injected. To its advantage, methanol has a better efficiency dissolving hydrates but is more contaminant and hazardous. Ethanol, considering the production and availability in Brazil, is being used as THI as well.
Others have tested mixtures of MEG and methanol, showing that changing properties of the fluid, like the density and viscosity, cause improvement on the injection process and also on the efficiency dissolving hydrates. Aminaji et al. showed that the mixture of MEG and methanol presented a higher hydrate dissociation rate than that of MEG or methanol alone [19].
Considering these, we believe that a mixture of ethanol and MEG is a good idea. To support the advantages of the mixture on the injection process, we performed experimental tests to study the rheological properties of the mixture. The viscosity of the THI under different conditions of concentration, temperature, shear rate, shear stress was measured. These results would let us know how the fluids being injected would behave, considering changing temperature of the sea during the injection process and how the fluid would behave when changes on the pressure of the production line would cause different flow rates to be used for the injection of THI.
2. Materials and Methods
Characteristics of the THI are shown in Table 3.
2.1. Experimental Tests
Initially, a 50 wt% MEG and 50 wt% ethanol stock solution was made. Later, we made different solutions for MEG/Ethanol mixture using the stock solution and adding distilled water at room temperature until the desired concentration was achieved, as shown in Table 4. Each final solution was agitated to assure they were homogeneous. The solutions were stored and taken to be analyzed.
Table 4.
Experimental tests for the dynamic viscosity of the MEG/EtOH mixture.
An Anton Paar rheometer was used to see how the concentration of the THI would change the viscosity of the injection fluid. The rheometer is able to control shear rate, temperature and pressure. A configuration of concentric cylinders was used in the rheometer to measure the viscosity of the solutions. Initially, the solution would be taken to the lowest temperature where the measures of viscosity would start until reaching the highest temperature. At the same time, the shear rate would be changing. All these changes were controlled using control settings on the rheometer software. All the viscosity measurements at a given shear rate and temperature were obtained.
The range of temperatures and shear rates considered for the experimental tests that were performed are shown in Table 4. Some of the variables included a range of temperature from 4–60 C, shear rate from 1–1000 1/s and fluid concentration from 5–75% weight. It has to be stated that the concentration refers to the quantity of the MEG/EtOH mixture mixed with distilled water. With the results, we would be able to analyze the changes in the viscosity of the solutions.
The effect of shear rate can be related to the effect of the flow velocity. The rheometer is used to measure the response of a liquid to an applied force, in this case, the shear stress. The shear stress corresponds to the force applied by the rheometer to deform the fluid.
2.2. Cost Comparison of the Most Used THI
The data used for the economic model was obtained from Kim [10]. In the document, a detailed analysis of the reservoir fluids and simulation of the quantity of methanol and MEG necessary to inhibit hydrate formation can be found [10]. In the modelled case, the MEG injected was assumed to have a concentration of 90% weight, consistent with regenerated MEG generally used in these treatments [20,21].
In this study, we used the NPC for different chemical treatments as the economic comparative parameter. The cost of methanol was based on the quantity needed for the treatment [10]. Meanwhile, for the cost of the MEG, it was necessary to consider the regeneration process that occurs after each injection [10]. In short, all methanol would be spent but not all the MEG would. Only a small percentage of it would be considered as a margin for losses [10]. In the case of ethanol, the costs were based on the quantity of ethanol that would cause the same decrease on temperature as a quantity of methanol. Using Equation (1) we were able to approximate that 30% ethanol could cause a similar effect as 20% methanol. This information was used to simulate and compare the cost of a methanol treatment with the cost of ethanol treatment. This method was used to approximate the quantity of ethanol, as there is not enough data for ethanol to use with common software to determine the quantity of THI needed. To determine the cost of the MEG/EtOH mixture, the quantity of MEG in the mixture, the MEG regeneration and the quantity of ethanol in the mixture was considered. Even though the ethanol could be distilled from the water, this process is yet to be considered. We used a MEG, methanol and ethanol price of 900, 400 and 360 USD/MTon, respectively.
3. Results and Discussion
Table 5 shows a representation of the results we obtained in this research. Considering the volume of the results, only the results for a single temperature and a single shear rate with changing concentration of MEG/EtOH mixture are being presented. The other results are shown in Figure A1 on Appendix A.
Table 5.
Tests results for the dynamic viscosity of the MEG/EtOH Mixture − Shear rate = 100 [1/s].
3.1. Viscosity of THI as Function of the Temperature of the Fluid
In Figure 4 we can see both effects. First the temperature effect: it is evident in this case that the temperature plays an important role in the viscosity of the injection fluid, as this property shows a decreasing tendency when the temperature is increasing. In this way the higher the temperature is, the lower the viscosity of the injection fluid is. Considering that the average temperature of the seawater is near 4 C, it means that the closer we get to the bottom of the sea, the more viscous the fluid will be, increasing the drag force between the pipeline surface and the fluid boundary layer, making its transport more difficult, traducing this effect on the need of a more powerful pumping system as much deeper as the injection fluid gets.

Figure 4.
Comparison between the dynamic viscosity of the MEG/EtOH mixture as function of temperature for different %MEG/EtOH using a shear rate of 100 1/s and the dynamic viscosity of a pure MEG solution (Blank).
In Figure 4 it is possible to see a hint of the concentration-effect: the higher the concentration, the higher the viscosity. We can also see that the viscosity of the mixture of MEG/EtOH is lower than the viscosity of pure MEG. The data series Blank corresponds to pure MEG viscosity tendency, adapted from Yua et al. [22].
3.2. Viscosity of THI as Function of the Concentration of MEG/EtOH Mixture in the Fluid
In Figure 5 it is easier to see the concentration effect. It is valid to say that for the 25% MEG/EtOH, the remaining 75% is distilled water, with a similar relation for the other solutions. As it can be seen in Figure 5, the concentration of the fluid has a thickening effect: the higher the concentration, the higher the viscosity. It can be said that working with thicker or more viscous fluids, more power is needed for the pumping system. That is why it is important to have a THI with as low a viscosity as possible, without compromising the effectiveness as a gas hydrate inhibitor.
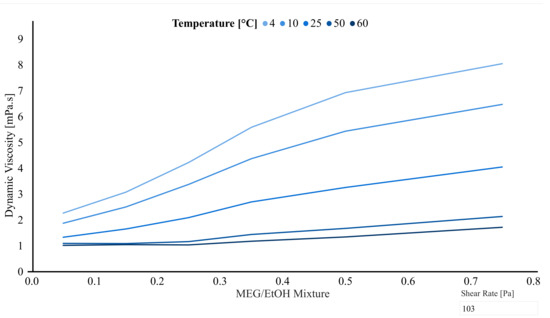
Figure 5.
Dynamic viscosity of the MEG/EtOH mixture as function of %MEG/EtOH for different temperatures using a shear rate of 103 1/s.
Paulo et al. [23], presented results considering the effect of the changing viscosity on the injection process. They used the pressure drop within a vertical column to analyze which of them would need a more powerful pressure system. Some of their conclusions were that pure MEG would need the higher injection pressure coming from the pressure system, followed by the MEG/EtOH mixture and then the pure alcohols [23]. Of course, considerations such as safety, hazard and even green chemistry need to be taken into account to make the best choice.
3.3. Viscosity of THI as Function of the Shear Rate
In Figure 6, we can see the effect of the shear effect. Increasing shear rate effect can be similar to increasing flow velocity effect. The shear rate is related to the drag effect that the solid-fluid interaction between the pipeline surface and the boundary layer of the liquid has. We can see a near-Newtonian fluid behaviour as the viscosity of the fluid is almost constant for increasing shear rate. There is more near-constant viscosity, meaning that at low flow velocities or low shear rate the fluid is almost Newtonian. On the section where the viscosity increases, the effect can be called shear thickening proper of dilatant fluids. To the extent of this research, the effect of Newtonian or No-Newtonian behaviour will not be discussed. We are working towards more substantive results on this matter.

Figure 6.
Dynamic viscosity of the MEG/EtOH mixture as function of shear rate for different temperatures, 75%MEG/EtOH solution.
In the case of Figure 6, the results correspond to the 75% MEG/EtOH mixture. It is evident how temperature plays an important role in the rheology of the fluid. For high temperatures, as much as 50 or 60 C, the shear-thickening effect is more notorious than for low temperatures as 4 or 10 C. For these temperatures, it seems like the shear-thickening effect is more important when dealing with high shear rates, which can be related to high flow rates or high pressures.
3.4. Shear Stress and Shear Rate Effect
In Figure 7 we can see how the shear stress is directly proportional to shear rate. This is consistent with Newtonian fluids and sometimes for dilatant fluids as well.

Figure 7.
Shear stress Vs. Shear rate for different temperatures for a 75% MEG/EtOH.
It seems like the temperature of the fluid has a larger effect on the shear-thickening behaviour of the fluid. In this case, the results correspond to the 75% MEG/EtOH mixture, and shear rate between 100–1000 1/s. For other concentrations or shear rate please go to the supporting documents section. Considering the proportional relation between shear stress and shear rate for 4 C, it seems like the behaviour of the fluid is Newtonian for low temperatures. This is convenient taking into account the average temperature of the ocean, around 4 C, making the temperature of the injected fluid around 4 C too.
3.5. Cost Comparison
Although the MEG injected could be regenerated, this cost is one of the biggest drawbacks when using MEG, making the MEG system costs higher than those of a methanol injection system. This is the case for the ethanol and MEG/EtOH system as well. Higher capital investment and more expensive MEG cost make the other systems more economical than MEG system based on an annual injection. In this case, the most cost-effective treatment in increasing order is methanol, ethanol, MEG/EtOH and MEG, as can be seen in Figure 8.

Figure 8.
Net present cost for each THI as function of frequency of injections per year.
From Figure 8, it can be seen that the pure MEG and the MEG/EtOH treatment rendezvous when the number of injections per year is more than 2.9 times per year. From this moment, pure MEG treatment starts to become more economical.
When the injection frequency per year increases, it is evident that the operational costs increased too. This effect seems to be more important for the injection of methanol and ethanol treatments rather than for the MEG treatment. For methanol and ethanol, the increase in the cost is proportional to the increase of the injection frequency. One of the reasons for this behaviour is the possibility to regenerate MEG on the topside.
The increase of the MEG treatment is slower as the regeneration process helps with the operational costs. As less MEG is needed to be purchased every year, it was considered a small margin of losses which is evident in a small increase in the cost. This characteristic made pure MEG treatment more convenient for others. In the case of the treatment using the MEG/EtOH mixture, this effect seems only important for high frequency per year injection treatments, as its cost is almost always lower than the pure MEG treatment cost. In Figure 9 it can be seen as a comparison for each THI and how the cost would increase taking into consideration the number of injection treatments per year.
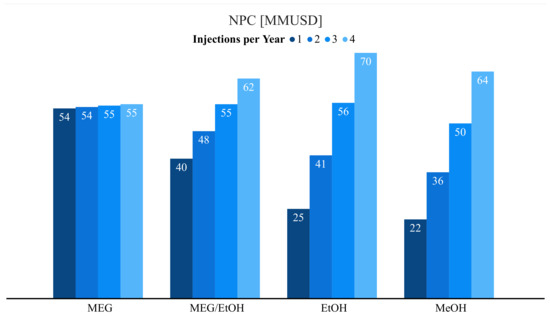
Figure 9.
Net present cost Vs Injections per year.
On the question of choosing between MEG or MEG/EtOH mixture as a hydrate inhibitor, it is necessary to consider not only the cost but also the effect of the viscosity and density of the fluids, as they would translate to lower needs of power coming from topside.
Pure MEG injection offered advantages, considering MEG can be regenerated. On the other hand, when a small number of injections is required, the best option would be ethanol or MEG/EtOH mixture.
Setting aside the low cost, safety concerns, and hazardous characteristics of methanol, another issue with the use of methanol is that when it evaporates into the hydrocarbon phase, it could cause problems in the processing units. Also, depending on the quantity of methanol in the hydrocarbon phase, this could cause penalties on the sale price. For instance, methanol concentration higher than 50 ppm could lead to an oil price reduction between 2–4 USD/MTon and most of the refineries cannot operate with it if the methanol concentration is over 200 ppm [10]. For these cases, there is a need for a pre-treatment to remove the methanol which would induce higher operative costs. In the case of MEG, it does not affect the price of the production from the oil field [24].
4. Conclusions
The conclusions for this research are as follows:
- This work compared the economic feasibility of the use of methanol and MEG with others, such as ethanol and MEG/EtOH mixture, based on the mixture injection in terms of injection frequency and inhibitor amount when hydrate inhibitor is injected intermittently for preventing hydrate in sub-sea flowlines.
- Considering the shear-thickening effect, we can say that having a low shear rate or low flow velocity is more convenient as the fluid behaves as a Newtonian fluid and the force against its movement is lower. This effect needs to be considered when designing the pumping system.
- The viscosity of the mixture of MEG/EtOH is lower than the viscosity of the MEG alone. As the viscosity is lower, it would be easier to pump the mixture downhole than MEG alone.
- Even though increasing the concentration increases the viscosity, the higher concentration of 75% mixture of MEG/EtOH has a much lower viscosity than pure MEG.
- Based on the economic analysis, the MEG/EtOH mixture shows good results when compared with pure MEG treatments. The frequency and quantity of THI needed have to be analysed.
- The loss of MEG/EtOH to the vapour phase would be reduced when compared to pure methanol. When using MEG/EtOH mixture, we assumed the loss of MEG would be negligible. The loss of EtOH would be less than the loss of pure MeOH, as the quantity of EtOH in solution is quite smaller to that of a pure MeOH treatment.
- To make the best decision it is important to take into consideration the fluid dynamics and rheology effects of the fluid, as having a lower viscosity is better. On this front, the MEG/EtOH presents good advantages compared to the MEG. To its advantage, the MEG used in the treatments can be regenerated. At some point, there is a need for a trade-off between a better injection process based on fluid effects and the price effect lead by MEG.
- With the advantage of injection, the next step is to prove its efficiency as a THI in a batch system.
Author Contributions
Conceptualization, P.P. and T.A.N.; methodology, P.P.; software, P.P.; validation, P.P.; formal analysis, P.P.; investigation, P.P.; resources, T.A.N.; data curation, P.P.; writing—original draft preparation, P.P.; writing—review and editing, P.P. and T.A.N.; visualization, P.P.; supervision, T.A.N.; project administration, T.A.N.; funding acquisition, T.A.N. All authors have read and agreed to the published version of the manuscript.
Funding
This research was funded in part by Coordenação de Aperfeiçoamento de Pessoal de Nível Superior—Brasil (CAPES)—Finance Code 001.
Acknowledgments
I would like to acknowledge the support given by the LRAP Laboratory at COPPE/UFRJ and Monica Sant’anna for her technical support with the rheometer and tests.
Conflicts of Interest
The authors declare no conflict of interest.
Abbreviations
The following abbreviations are used in this manuscript:
| MEG | Mono Ethylene Glycol |
| TEG | Triethylene Glycol |
| MeOH | Methanol |
| EtOH | Ethanol |
| CO | Carbon Dioxide |
| THI | Thermodynamic Hydrate Inhibitors |
| PLEMs | Pipeline End Manifold |
| PLETs | Pipeline End Termination |
| ILTs | In-Line Tee |
| NPC | Net Present Cost |
| NPV | Net Present Value |
| TCF | Trillion Cubic Feet |
Appendix A
Appendix A.1. Dynamic Viscosity of the MEG/EtOH Mixture as Function of Shear Rate for Different Temperatures
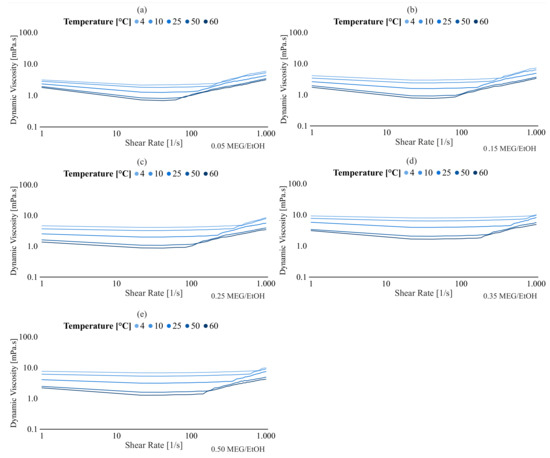
Figure A1.
Dynamic viscosity of the MEG/EtOH mixture as function of shear rate for different temperatures, (a) 5%MEG/EtOH, (b) 15%MEG/EtOH, (c) 25%MEG/EtOH, (d) 35%MEG/EtOH, (e) 50%MEG/EtOH.
Appendix A.2. Hydrates Curves using Equation (1)
Table A1.
Data used in Figure 2.
Table A1.
Data used in Figure 2.
| P [bar] | T [C] | 20% MeOH | 20% MEG | 20% EtOH |
|---|---|---|---|---|
| 11 | 3 | 1.54 | 2.13 | 1.98 |
| 13 | 4 | 2.54 | 3.13 | 2.98 |
| 15 | 5 | 3.54 | 4.13 | 3.98 |
| 17 | 6 | 4.54 | 5.13 | 4.98 |
| 20 | 7 | 5.54 | 6.13 | 5.98 |
| 23 | 8 | 6.54 | 7.13 | 6.98 |
| 27 | 9 | 7.54 | 8.13 | 7.98 |
| 32 | 10 | 8.54 | 9.13 | 8.98 |
| 36 | 11 | 9.54 | 10.13 | 9.98 |
| 41.5 | 12 | 10.54 | 11.13 | 10.98 |
| 48 | 13 | 11.54 | 12.13 | 11.98 |
| 56 | 14 | 12.54 | 13.13 | 12.98 |
| 66 | 15 | 13.54 | 14.13 | 13.98 |
| 77 | 16 | 14.54 | 15.13 | 14.98 |
| 89 | 17 | 15.54 | 16.13 | 15.98 |
| 105 | 18 | 16.54 | 17.13 | 16.98 |
| 109 | 18.2 | 16.74 | 17.33 | 17.18 |
| 113 | 18.4 | 16.94 | 17.53 | 17.38 |
| 117 | 18.6 | 17.14 | 17.73 | 17.58 |
| 121 | 18.8 | 17.34 | 17.93 | 17.78 |
| 125 | 18.9 | 17.44 | 18.03 | 17.88 |
| 140 | 19 | 17.54 | 18.13 | 17.98 |
| 160 | 19.4 | 17.94 | 18.53 | 18.38 |
References
- Johnson, A.H. Global Resource Potential of Gas Hydrate—A New Calculation. In Proceedings of the 7th International Conference on Gas Hydrates (ICGH 2011), Edinburgh, Scotland, UK, 17–21 July 2011; Available online: https://www.pet.hw.ac.uk/icgh7/papers/icgh2011Final00070.pdf (accessed on 24 July 2020).
- Sloan, E.D.; Koh, C.A. Clathrate Hydrates of Natural Gases, 3rd ed.; CRC Press (Taylor and Francis Group): Boca Raton, FL, USA, 2008. [Google Scholar]
- Sloan, E.D. Hydrates: State of the art inside and outside flowlines. J. Petrol. Technol. 2009, 61, 89–94. [Google Scholar] [CrossRef]
- Ning, F.; Zhang, L.; Tu, Y.; Jiang, G.; Shi, M. Gas-hydrate formation, agglomeration and inhibition in oil-based drilling fluids for deep-water drilling. J. Nat. Gas Chem. 2010, 19, 234–240. [Google Scholar] [CrossRef]
- Kim, J.; Shin, K.; Seo, Y.; Cho, S.J.; Lee, J.D. Synergistic hydrate inhibition of monoethylene glycol with poly(vinylcaprolactam) in thermodynamically underinhibited system. J. Phys. Chem. B 2014, 118, 9065–9075. [Google Scholar] [CrossRef] [PubMed]
- Folger, P. Gas Hydrates: Resources and Hazard. Congressional Research Service. 25 May 2010. Available online: https://fas.org/sgp/crs/misc/RS22990.pdf (accessed on 10 July 2020).
- Kan, A.T.; Fu, G.; Watson, M.A.; Tomson, M.B. Effect of Hydrate Inhibitors on Oilfield Scale Formation and Inhibition, International Symposium on Oilfield Scale. Soc. Petrol. Eng. 2002. [Google Scholar] [CrossRef]
- Matthews, P.; Subramanian, S.; Creek, J. High Impact, Poorly Understood Issues with Hydrate in Flow Assurance. In Proceedings of the 4th International Conference on Gas Hydrates, Yokohama, Japan, 19–23 May 2002; pp. 19–23. [Google Scholar]
- Cochran, S.; Gudimetla, R. Hydrate management: Its importance to deepwater Gas Development succes. World Oil 2004, 225, 55–61. [Google Scholar]
- Kim, H.; Yoo, W.; Lim, Y.; Seo, Y. Economic evaluation of MEG injection and regeneration process for oil FPSO. J. Petrol. Sci. Eng. 2018, 164, 417–426. [Google Scholar] [CrossRef]
- Bai, Y.; Bai, Q. Subsea Pipelines and Risers; Elsevier Science Ltd.: Oxford, UK, 2005; pp. 357–382. [Google Scholar]
- Di Lullo, A.; Hester, K.C. Revisiting the Hammerschmidt Equation: Effect of Operating Conditions on the Selection of the Hammerschmidt Constant. In Proceedings of the 13th Offshore Mediterranean Conference and Exhibition, Ravena, Italy, 29–31 March 2017. [Google Scholar]
- Carroll, J. Natural Gas Hydrates: A Guide for Engineers; Gulf Professional Publishing an imprint of Elsevier Science: Waltham, MA, USA, 2003; p. 117. [Google Scholar]
- Chemical Injection Package Enables MEG Injection for Extraordinary Requirements on Vibrations and Noise Emissions. Available online: https://www.lewa-nikkiso.kr/en/lewa-group/news-detail/chemical-injection-package-enables-meg-injection-for-extraordinary-requirements-on-vibrations-and-noise-emissions (accessed on 25 June 2020).
- Samie, N.N. Chapter 3—Systems and Equipment for Offshore Platform Design. In Practical Engineering Management of Offshore Oil and Gas Platforms; Gulf Professional Publishing: Cambridge, MA, USA, 2016. [Google Scholar] [CrossRef]
- Bullin, K.A.; Bullin, J.A. Optimizing Methanol Usage for Hydrate Inhibition in a Gas Gathering System. In Proceedings of the 3rd Annual GPA Convention, March 2004; Available online: https://bre.com/PDF/Optimizing-Methanol-Usage-for-Hydrate-Inhibition-in-a-Gas-Gathering-System-GPA-2004.pdf (accessed on 27 July 2020).
- Brustad, S.; Løken, K.P.; Waalmann, J.G. Hydrate Prevention Using MEG Instead of MeOH: Impact of Experience from Major Norwegian Developments on Technology Selection for Injection and Recovery of MEG. Offshore Technol. Conf. 2005. [Google Scholar] [CrossRef]
- Sloan, E.D. Hydrate Engineering; Society of Petroleum Engineers: Richardson, TX, USA, 2000. [Google Scholar]
- Aminaji, M.; Tohidi, B.; Gurgass, R.; Atilhan, M. Effect of injected chemical density on hydrate blockage removal in vertical pipes: Use of MEG/MeOH mixture to remove hydrate blockage. JNGSE 2017. [Google Scholar] [CrossRef]
- Zakarian, E.; Holm, H.; Saha, P.; Lisitskaya, V.; Suleymanov, V. Shtokman: The Management of Flow Assurance Constraints in Remote Arctic Environment. In Proceedings of the 24th World Gas Conference, Buenos Aires, Argentina, 5–9 October 2009; pp. 5–9. [Google Scholar]
- Sandengen, K. Hydrates and Glycols. 2010. Available online: http://www.ipt.ntnu.no/~jsg/undervisning/naturgass/lysark/LysarkSandengen2010.pdf (accessed on 5 October 2012).
- Yua, W.; Xie, H.; Li, Y.; Chen, L.; Wang, Q. Experimental investigation on the thermal transport properties of ethylene glycol based nanofluids containing low volume concentration diamond nanoparticles, Colloids and Surfaces A: Physicochem. Eng. Asp. 2011, 380, 1–5. [Google Scholar] [CrossRef]
- Paz, P.; Netto, T.A. Introducing a Novel MEG/EtOH Mixture to Improve Gas Hydrate Blockages Removal During Offshore Oil and Gas Production. In Proceedings of the ASME 2019 38th International Conference on Ocean, Offshore and Arctic Engineering, Volume 5A: Pipelines, Risers, and Subsea Systems, Glasgow, UK, 9–14 June 2019. [Google Scholar] [CrossRef]
- Son, K.; Wallace, C. Reclamation/regeneration of Glycols Used for Hydrate Inhibition. Deep Offshore Technol. 2003. Available online: https://www.semanticscholar.org/paper/RECLAMATION-%2F-REGENERATION-OF-GLYCOLS-USED-FOR-Son/81e24ee5eef1eba2e43ca8925413868beea78e9c?p2df (accessed on 22 October 2020).
Publisher’s Note: MDPI stays neutral with regard to jurisdictional claims in published maps and institutional affiliations. |
© 2020 by the authors. Licensee MDPI, Basel, Switzerland. This article is an open access article distributed under the terms and conditions of the Creative Commons Attribution (CC BY) license (http://creativecommons.org/licenses/by/4.0/).