Article

Parent Nested Optimizing Structure for Vibration Reduction in Floating Wind Turbine Structures

1
School of Mechanical Engineering, Chung-Ang University, 84 Heukseok-ro, Dongjak-gu, Seoul 06974, Korea
2
School of Energy Systems Engineering, Chung-Ang University, 84 Heukseok-ro, Dongjak-gu, Seoul 06974, Korea
3
School of Intelligent Energy and Industry, Chung-Ang University, 84 Heukseok-ro, Dongjak-gu, Seoul 06974, Korea
*
Authors to whom correspondence should be addressed.
J. Mar. Sci. Eng. 2020, 8(11), 876; https://doi.org/10.3390/jmse8110876
Submission received: 24 September 2020 / Revised: 29 October 2020 / Accepted: 2 November 2020 / Published: 4 November 2020
(This article belongs to the Section Ocean Engineering)

Abstract

:
A tuned mass damper (TMD) is a system that effectively reduces the vibrations of floating offshore wind turbines (FOWTs). To maximize the performance of TMDs, it is necessary to optimize their design parameters (i.e., stiffness, damping, and installation location). However, this optimization process is challenging because of the existence of multiple local minima. Although various methods have been proposed to determine the global minimum (e.g., exhaustive search, genetic algorithms, and artificial fish swarm algorithms), they are computationally intensive. To address this issue, a novel optimization approach based on a parent nested optimizing structure and approximative search is proposed in this paper. The approximative search determines an initial parameter set (close to the optimal set) with fewer calculations. Then, the global minimum can be rapidly determined using the nested and parent optimizers. The effectiveness of this approach was verified with an FOWT exposed to stochastic winds. The results show that this approach is 30–55 times faster than a conventional global optimization method.

1. Introduction

Offshore wind farms experience approximately 90% greater wind speed than onshore wind farms [1]. However, offshore wind farms located near coastlines suffer from visual and noise issues. In addition, large seabed footprints are created by their foundations [2]. Floating offshore wind turbines (FOWTs) are promising alternative structures for generating and harnessing offshore wind energy that can overcome the aforementioned problems; furthermore, installing wind turbines on floating platforms away from coastlines requires less space and enhances power generation. Additionally, FOWTs are less dependent on seabed conditions than bottom-fixed structures because they do not rely on the ocean floor for support [3]. However, FOWTs are exposed to strong dynamic loads caused by harsh wave and wind conditions [4]. These loads cause considerable vibration, which is harmful to the robustness of the entire structure. For example, the fatigue damage induced by tower bending moments on spar-type FOWTs is 2.5 times that induced on onshore wind turbines [5]. This leads to higher operational and maintenance costs.
To reduce the structural vibration of FOWTs, a tuned mass damper (TMD) system has been studied. Murtagh et al. [6] constructed a dynamic model for FOWTs and calculated the vibration reduction effect of a TMD installed at the top of an FOWT. Their results showed structural vibration reductions when the stiffness value was tuned to the dominant frequency of the structure. Based on the wind turbine numerical simulator known as FAST (which stands for fatigue, aerodynamics, structures, and turbulence) [7], Lackner et al. [8] developed a new wind turbine simulation tool named FAST-SC (where SC stands for structural control). This tool is able to incorporate TMDs into the nacelle or platform of the wind turbine for vibration reduction. Using this code, they presented more realistic results for barge-type and monopile wind turbines. This study revealed that the optimized TMD parameters (i.e., stiffness, damping ratio, and TMD location) are considerably different for these two foundation types.
TMD optimization is necessary to minimize the structural vibration of FOWTs. However, finding the optimal values for TMD parameters is difficult because numerous local minima exist for the cost function employed for optimizing the TMD performance [9]. An exhaustive search has been conducted to obtain a global optimal point [3,10,11]. Stewart et al. [3] used a genetic algorithm (GA) to optimize the TMD parameters for various types of platforms (i.e., fixed monopile, floating spar-type, floating barge, and tension leg platforms). GAs were also used in other studies to optimize TMD parameters [12,13,14]. Moreover, several optimization methods were compared for maximizing TMD performance. Si et al. [15] adopted a simplex coding genetic algorithm (SCGA) for the optimization of various TMD parameters (i.e., spring coefficient, damping coefficient, and TMD location) for FOWTs. An SCGA is a combination of a GA and the Nelder-Mead method, which is applied to improve the quality of populations corresponding to the initial and all intermediate steps. They also adopted other optimization methods, including exhaustive search and Tsai’s method, and compared their performance. The results showed that SCGA is a more accurate and efficient optimization method compared to other methods used in previous works. Jin et al. [16] used the artificial fish swarm algorithm (AFSA) for a global search to optimize a TMD installed in a barge floating wind turbine. The AFSA mimics several behaviors of fish, such as preying, swarming, randomly moving, and following, based on a local search of individual fish [17]. However, this algorithm is likely to obtain solutions corresponding to local minima [17]. In an attempt to overcome this limitation, He et al. [18] applied an improved AFSA for TMD optimization. The improved AFSA used the crossover and mutation strategies of the differential evolution algorithm, demonstrating a better performance when solving complicated global optimization problems [19]. Although several methods have been proposed to find a global minimum for TMD parameters, such methods remain computationally intensive and risk confusing a local minimum with a global optimum.
To address the aforementioned limitations of previous methods, a more robust optimization method which focuses on the TMDs employed in FOWTs was developed in this study. In the parameter space of the TMD, if one of the parameters is fixed as a constant, a single minimum exists for the remaining parameters. Thus, the global minimum can be easily obtained with a small number of iterations. This was achieved using the parent nested optimizing structure. Additionally, an initial guess close to the optimal parameters was rapidly estimated by introducing an approximative cost function.
This paper is organized as follows. Section 2 describes the mathematical model of a spar-type FOWT derived using Lagrange’s equation. The model validation, which was conducted by comparing the model prediction and the results obtained from FAST-SC, is presented in Section 2. Section 3 describes the mathematical definition and properties of the optimization problem considered in this study. Then, the proposed optimization approach is described in Section 4. In Section 5, the performance of the newly proposed optimization approach and case studies on the optimization of various TMDs are shown and discussed. Finally, the main conclusions of this study are outlined in Section 6.

2. Mathematical Model

In this study, a mathematical model was established to predict the motion of a FOWT and its TMD. Various dynamic loads were considered: thrust force, hydrodynamic load, gravitational force, buoyancy force, and interaction with mooring lines [4]. The model is composed of the rotor-nacelle assembly, tower, and platform, as shown in Figure 1. This study focuses on pitch, surge, and heave motions of the tower and platform. The deformation of the structure was not incorporated into the model because it is very small compared to the pitch, surge, and heave motions. Note that a spar-type FOWT was investigated in this study. However, this approach could be applied to other types of FOWTs if the model parameters are replaced by the appropriate parameters associated with the FOWT type to be investigated.

2.1. Equations of Motion

The dynamics of the FOWT with the TMD can be described with four variables, y c , z c , θ , and u, where y c is the surge displacement at point C, at which the structure meets the water surface, as depicted in Figure 1;   z c is the heave displacement of C; θ   is the pitch angle; and u is the displacement of the TMD mass with respect to its equilibrium position. The dimensions and mechanical properties of the FOWT were obtained from the 5 MW OC3-Hywind model [20,21]. The equations of motion can be derived using Lagrange’s equation [3,9,18,22]:
d d t ( T y ˙ c ) T y c + V y c = F y , d d t ( T z ˙ c ) T z c + V z c = F z , d d t ( T θ ˙ ) T θ + V θ = M θ , d d t ( T u ˙ ) T u + V u = c u ˙ ,
where T and V are the sum of the kinetic energy and total potential energy, respectively, of the FOWT structure and TMD assembly. F y , F z , and M θ are the forces and moment along y, z, and θ , respectively; these forces and moments include the thrust force (or aerodynamic load), the hydrodynamic load caused by waves, and the force interacting with the mooring lines. To consider the OC3-Hywind mooring system, Jonkman et al. provided a mathematical model of the force acting between the platform and the mooring lines [20]; the mooring force comprises the weight of the mooring lines and the linearized restoring forces. Details of a simplified mooring line are provided in the Supplementary Material. c is the damping coefficient of the TMD. The stiffness of the TMD was considered in evaluating V . Details regarding the energy and forces in Equation (1) are provided in the Supplementary Material. The solution of Equation (1) was numerically obtained with the ode15i function in MATLAB. Note that the TMD is installed inside the platform, and thus in this study TMD displacement u is constrained to ±4 m using a virtual spring and damper. Table 1 presents the values of the structural parameters used in this study which are provided in [20].

2.2. Validation

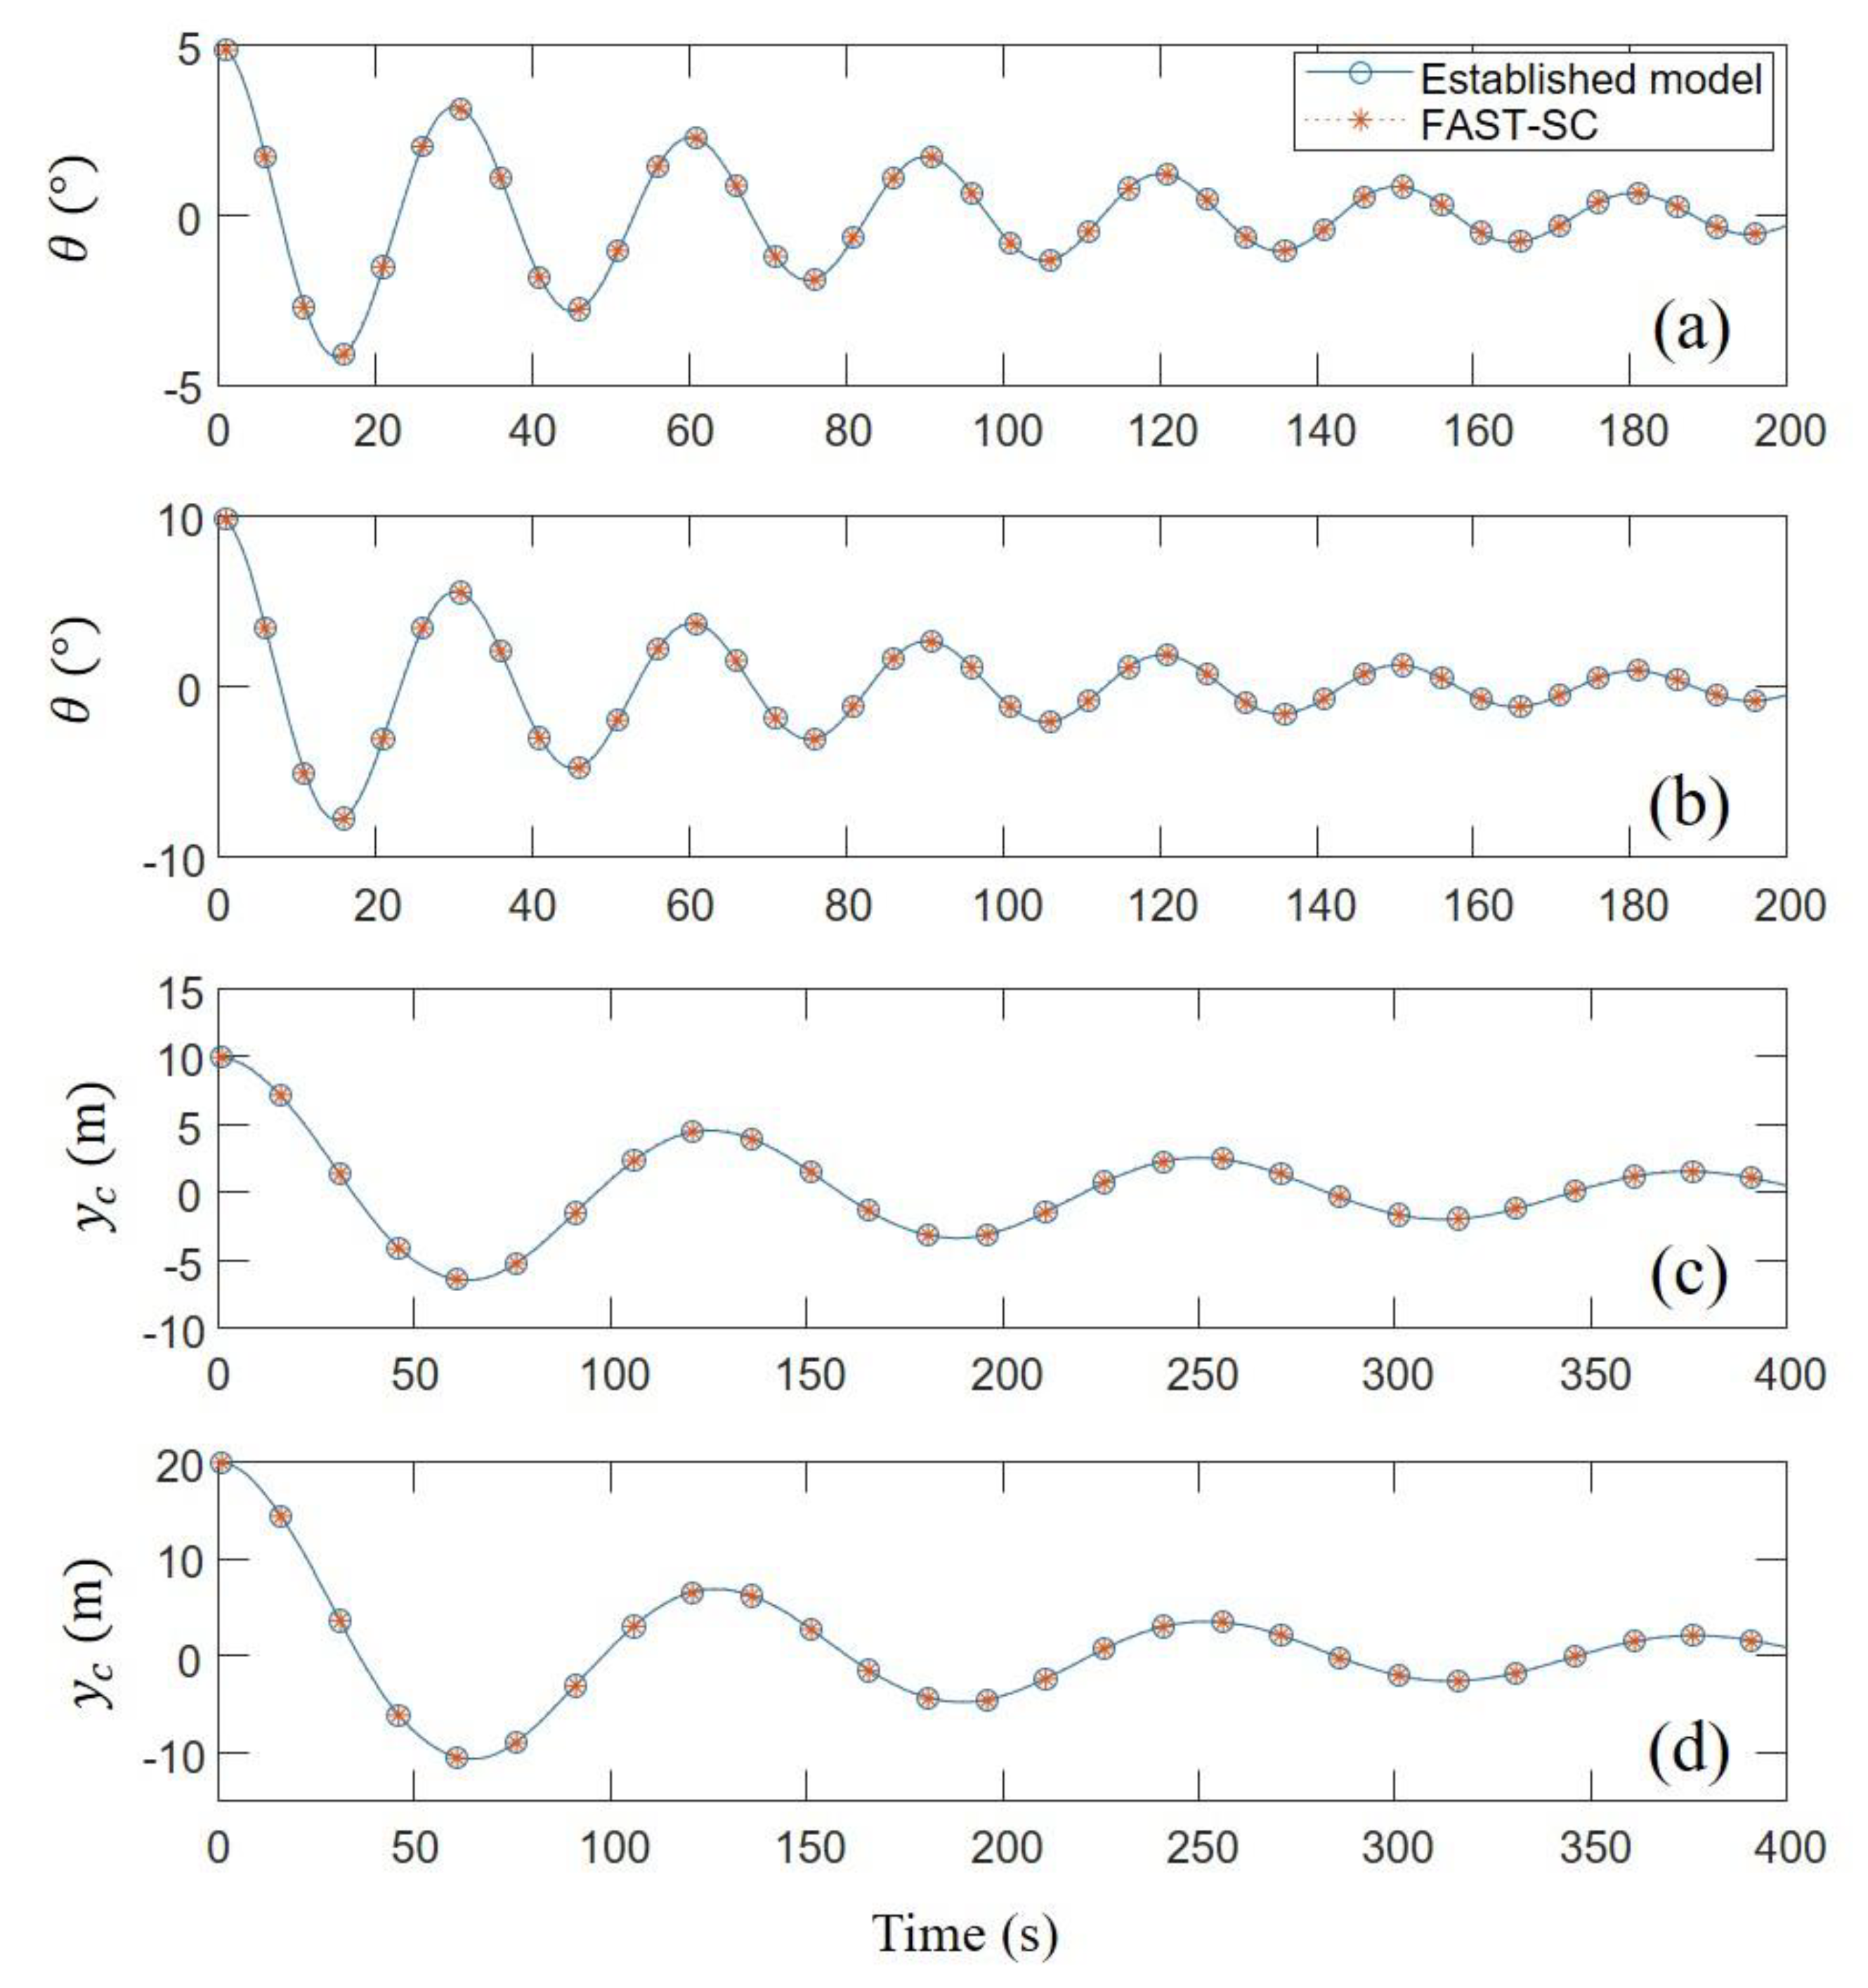
To validate the established model, its free response was compared with the response obtained with the FAST-SC simulator [22,23,24]; notably, the FAST-SC simulators [7] have been extensively used to study the dynamics of wind turbines and TMDs. The motion predicted from the established model is almost identical to that of FAST-SC, as shown in Figure 2. The free response was calculated with four different initial conditions. First, the initial platform pitch angle θ   is 5 ° and the initial surge displacement y c is 0 m (Figure 2a); the coefficient of determination (R2) is 0.999. Second, the initial θ   is 10 ° and the initial y c is 0 m (Figure 2b); R2 is 0.998. Third, the initial θ   is 0 ° and the initial y c is 10 m (Figure 2c); R2 is 0.999. Lastly, the initial θ is 0 ° and the initial y c is 20 m (Figure 2d); R2 is 0.994. These high coefficients of determination suggest that the model is capable of accurately predicting the dynamics of the FOWT and TMD.

3. Optimization Problem

3.1. Optimization Problem Specification

The TMD optimization problem can be specified as:
minimize   h ( x 1 , x 2 , x 3 ) , subject   to   x 1 0 , x 2 0 , 20 x 3 100 ,
where h = 1 t f 0 t f θ AC 2 ( τ ) d τ and
θ AC ( t ) = θ ( t ) 1 t f 0 t f θ ( τ ) d τ .
In this problem, x 1 is the natural frequency of the TMD (Hz), x 2 is the damping ratio of the TMD (dimensionless), and x 3 is the installation position of the TMD (m). Specifically, the TMD performance is determined by its stiffness, damping coefficient, and mass. Note that the TMD performance increases monotonically with the TMD mass; therefore, mass is not used as an optimization variable. Instead, the TMD mass is fixed as 322,640 kg in the present optimization approach (Section 4), which corresponds to 4% of the total FOWT mass. This mass ratio is referred to as mass ratio γ . Note that the TMD mass is also subsequently varied to consider its effects; this is elucidated in Section 5. The stiffness and damping coefficients can be replaced by the natural frequency and the damping ratio of the TMD, which are defined as 1 2 π k m and c 2 m k , respectively. θ AC represents the FOWT pitch angle fluctuation about the mean value of the pitch. Thus, the cost function h specifies the FOWT vibration motion intensity; note that strong fluctuations lead to a large h . t f is the simulation time. The response was predicted for 1000 s because the period of the first mode is about 125 s. Accordingly, the response in the first 400 s was not considered for calculating the cost function because this response is transient. Therefore, the motion corresponding to the remaining 600 s was employed to study the performance of the TMD. Thus, t f is determined as 600 s. The motion of the FOWT structure was obtained for stochastic winds and waves because the FOWT is operated under such environmental conditions. The average wind speed is determined as 11 m/s, because the thrust force is the strongest under this condition due to the control of the blade pitch angle.
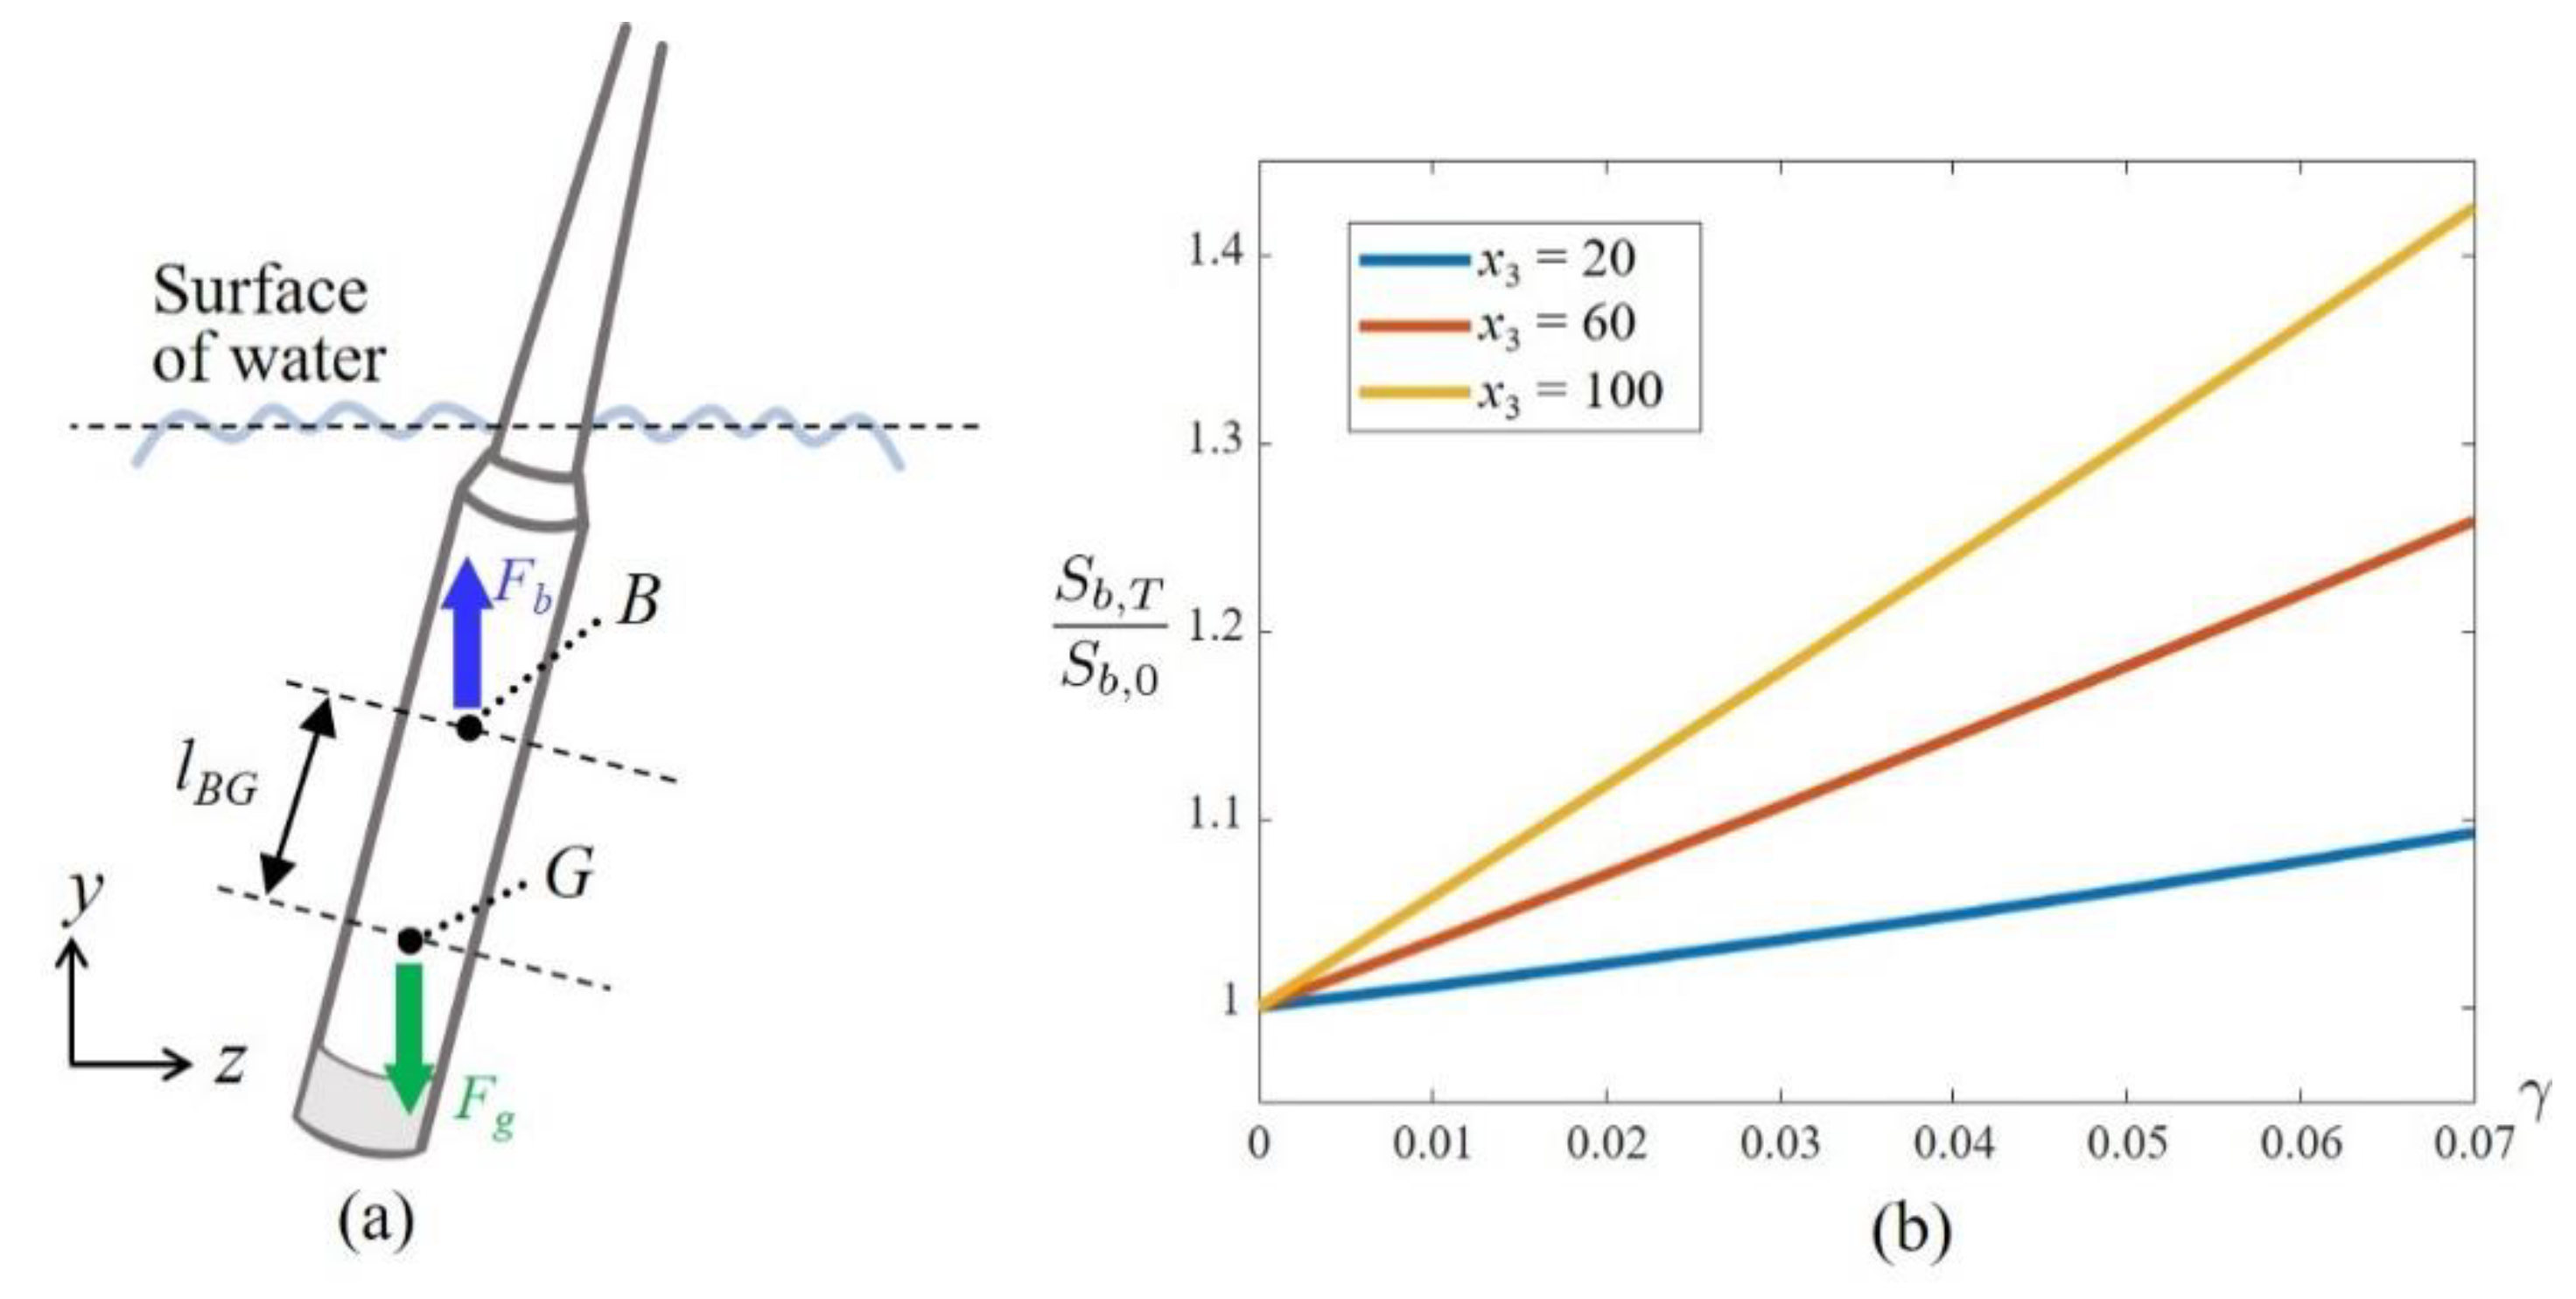
The effects of the TMD mass and location on the stability were studied before focusing on the vibration of the FOWT platform. The stability of the FOWT depends on the restoring moment τ R caused by gravitational force and buoyancy. When the restoring moment is calculated about the center of mass G, it can be approximated as τ R = F b l B G sin θ because the range of the TMD displacement is very small compared to the distance l B G . Here, F b is the buoyancy force, and l B G is the distance between the center of mass and the center of buoyancy, as shown in Figure 3a. Thus, the change in stability can be evaluated using F b l B G . This product is referred to as S b , which can be affected by the TMD mass ratio γ and the installation position x 3 . The detailed mathematical relations between S b , γ , and x 3 are provided in the Supplementary Material. Figure 3b shows the ratio of S b , 0 and S b , T , where S b , 0 is the value of S b in the absence of TMD and S b , T is the value in the presence of TMD. If this ratio is larger than 1, the stability of the FOWT is increased by the TMD. The results showed that the TMD improves the stability of the platform for various values of γ and x 3 . Thus, the dynamic benefits of the TMD can be confirmed based on whether it can considerably reduce the platform vibration.
In order to evaluate the TMD performance, a performance index, P v , is defined as:
P v = ( 1 h h 0 ) × 100   ( % ) ,
where h 0 is the vibration intensity value in the absence of the TMD. If the FOWT motion is not affected by the TMD (i.e., h = h 0 ) , P v is 0%. If the TMD completely absorbs the FOWT vibrations (i.e., h = 0 ) , P v is 100%.
Before performing the optimization, the TMD parameters were roughly determined and the corresponding results were obtained to demonstrate the necessity of the optimization; the parameters can be determined such that the natural frequency of the TMD is highly similar to the natural frequency associated with the pitch motion of the FOWT structure under a small damping ratio [9]. Then, the parameters are determined as x 1 = 0.0342, x 2 = 0.2, and x 3 = 100. Figure 4 shows the FOWT response with this TMD when stochastic winds and waves were applied (with the average wind speed of 11 m/s). As shown in Figure 4, when the TMD parameters were simply determined using the FOWT natural frequency, the fluctuation reduction owing to the TMD is negligible; the vibration intensity was 1.1373 and 1.1062 without and with the TMD, respectively, and the performance index was very small (2.73%). This small change suggests that the TMD optimization is indeed needed.

3.2. Existence of Multiple Local Minima

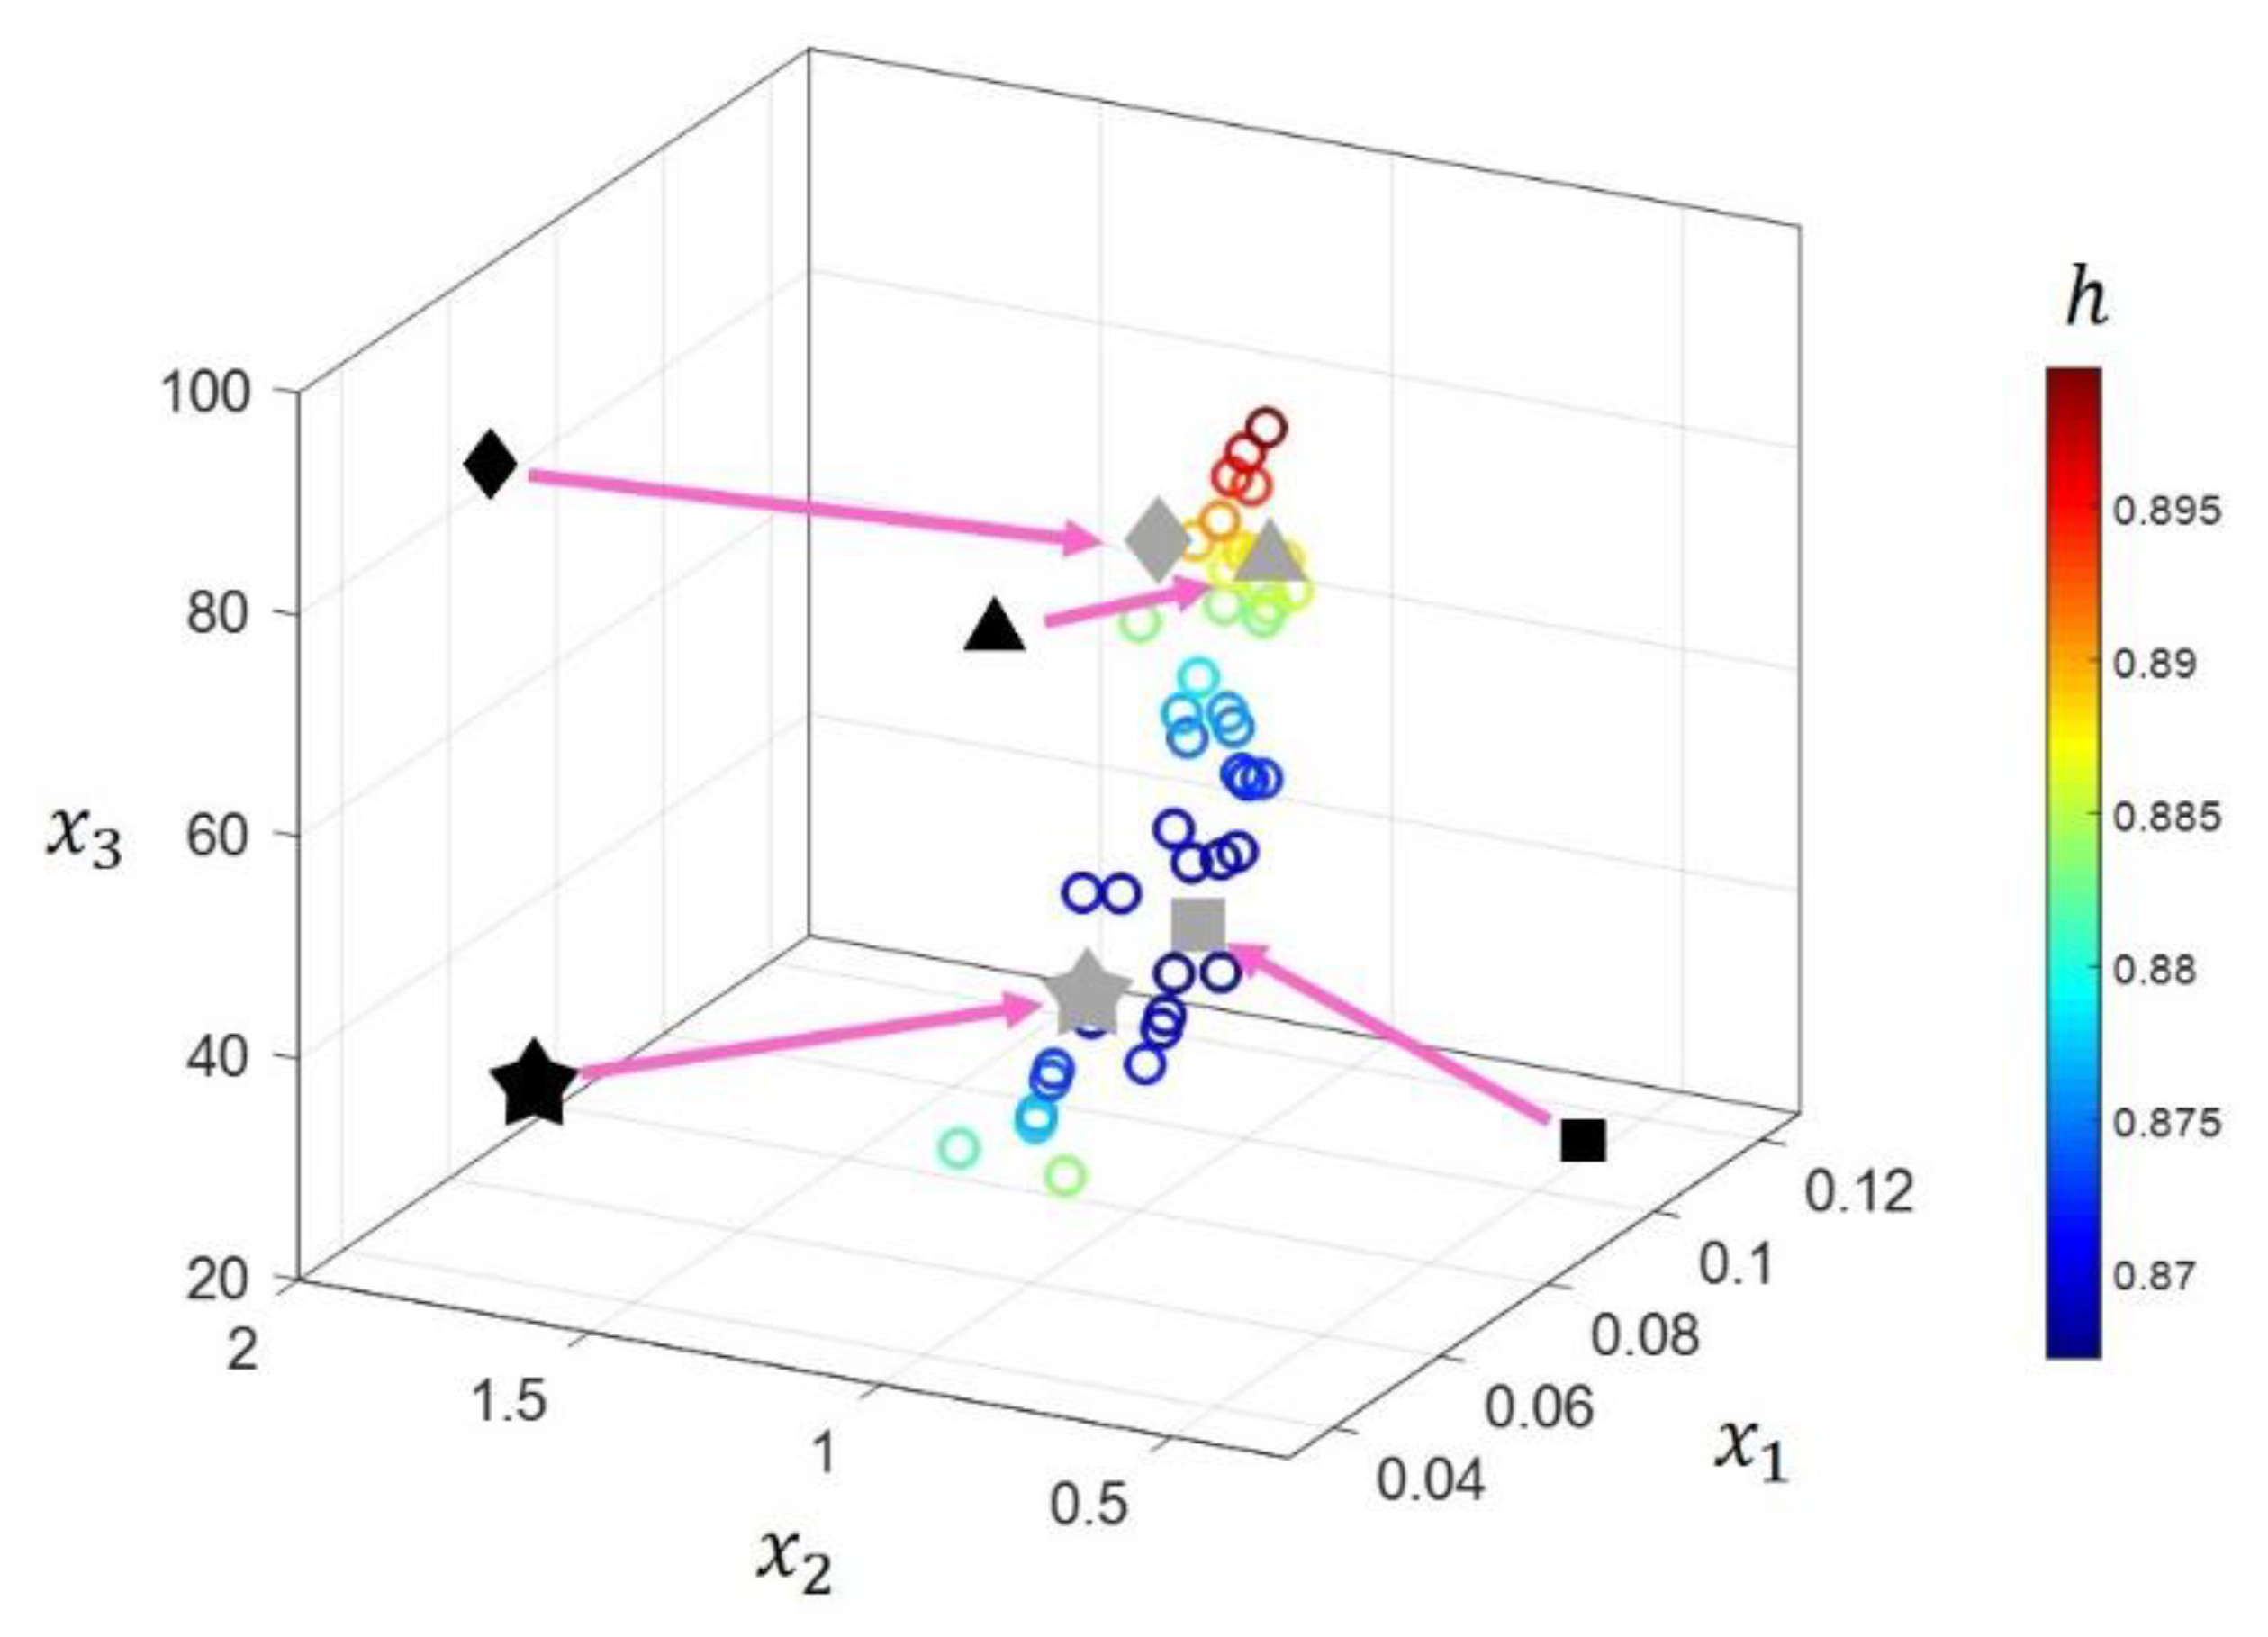
If the cost function h ( x 1 , x 2 , x 3 ) has multiple local minima, the optimization process becomes challenging. To verify this possibility, a gradient-based optimization was carried out with several initial parameter sets. The interior-point method (the fmincon function in MATLAB) was employed because it is commonly used in convex optimization problems. If the function h contains a single minimum, every set of initial parameter values will converge to the same solution. Otherwise, different initial sets will return different solutions.
Unfortunately, numerous local minima were found in the case of this TMD, as shown in Figure 5, where the hollow circles represent the local minima. The black stars, triangles, and diamonds represent examples of initial points; the gray stars, triangles, and diamonds are their corresponding solutions. Note that there is no specific reason to select the initial points shown in Figure 5; they were randomly chosen for visualization. Based on this result, it is confirmed that the TMD parameters have multiple local minima, and thus an optimization approach to obtain a global minimum is needed.

3.3. Mathematical Properties of the Cost Function

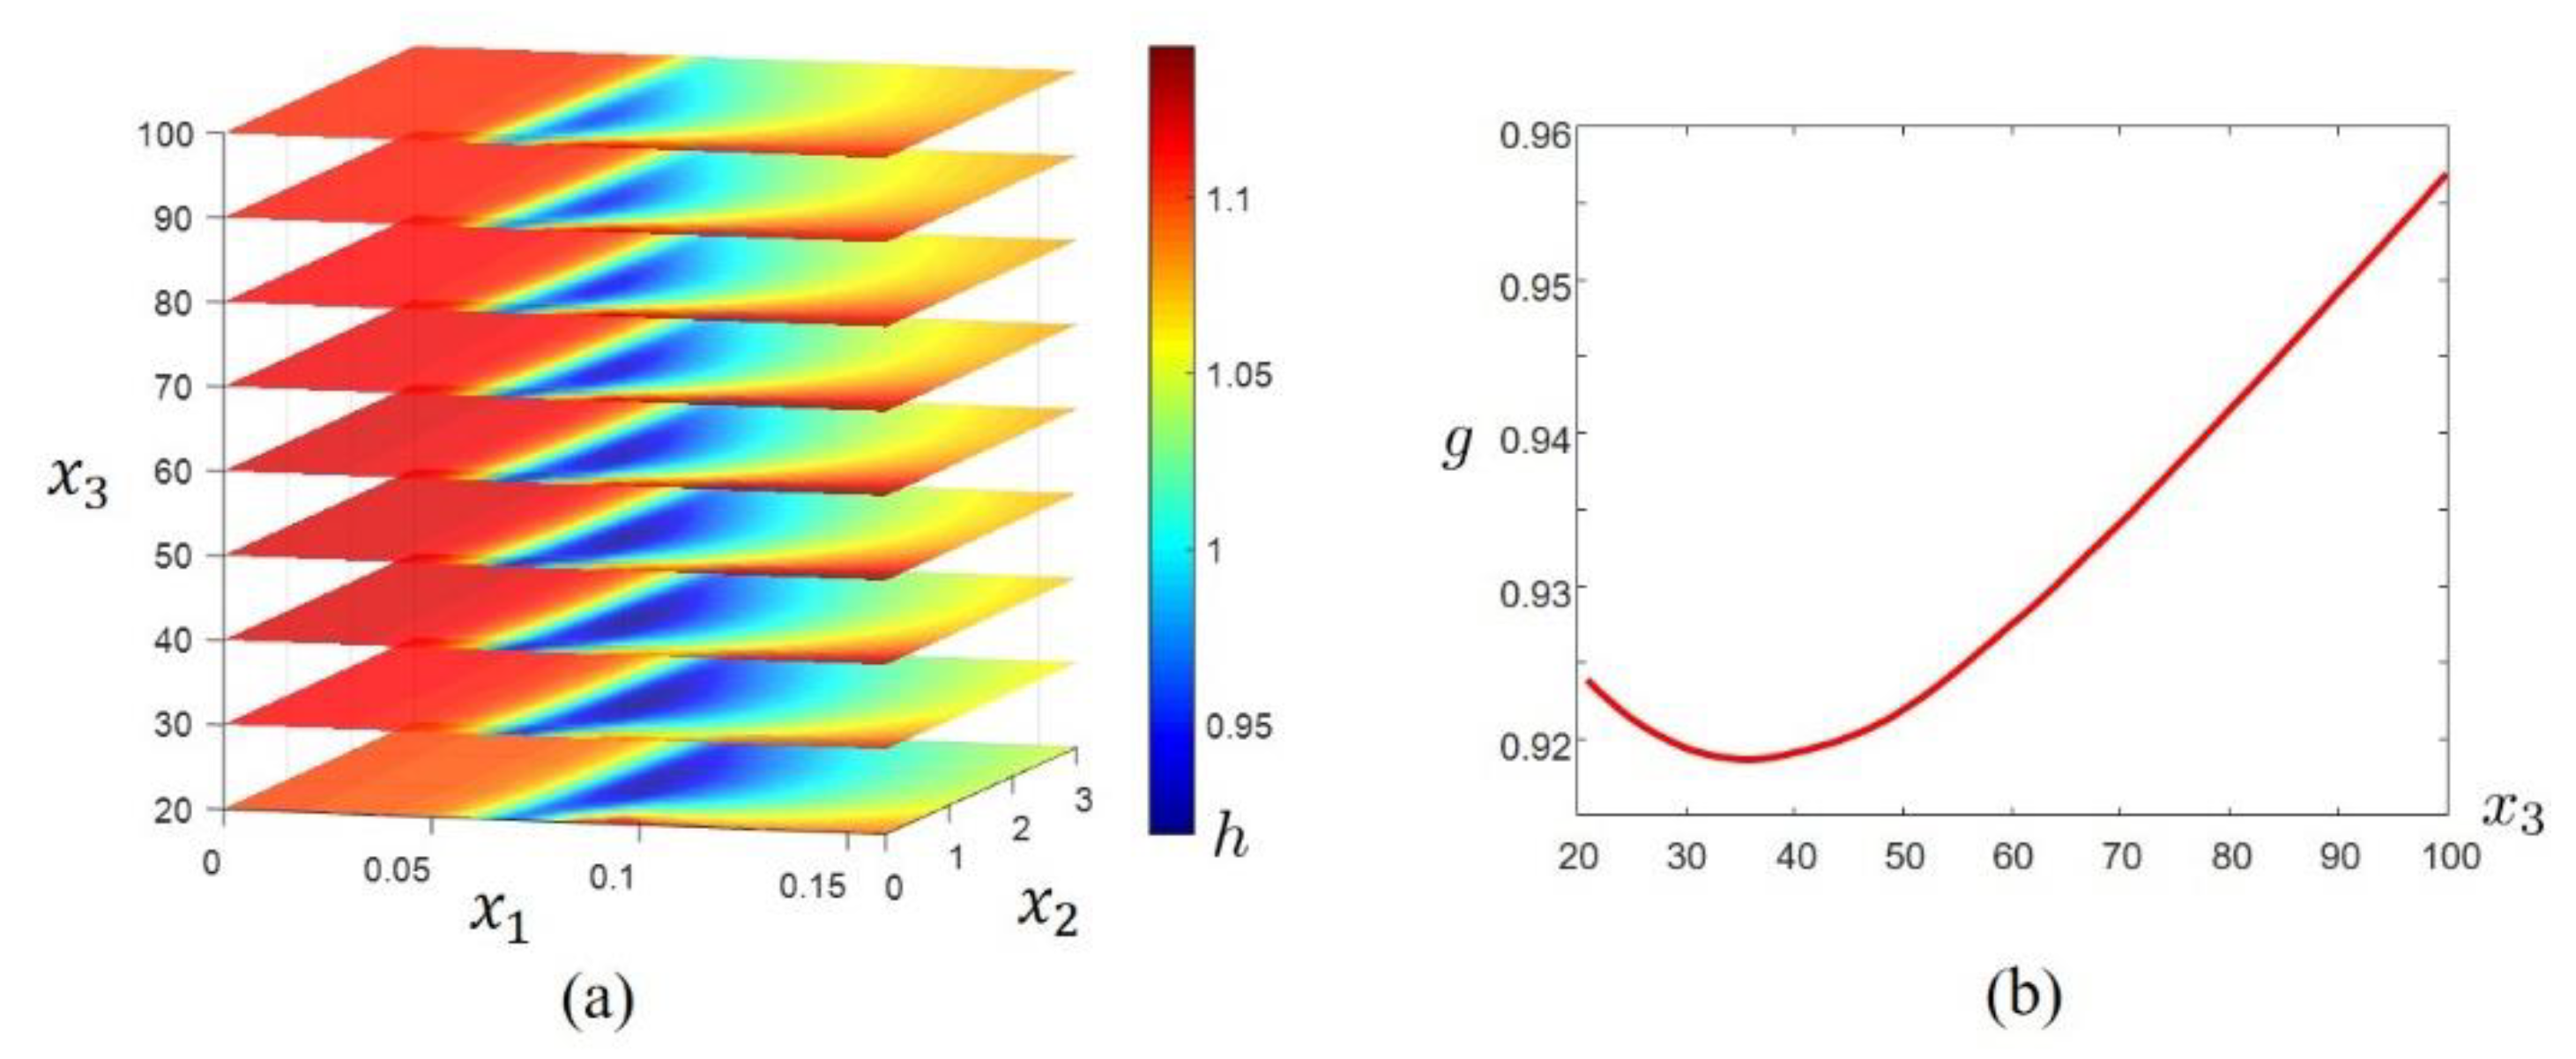
Distinct cost function characteristics were observed with the value of the cost function in the parameter space. First, if one parameter is fixed, the cost function h shows a single minimum point with respect to the other parameters. For example, if x 3 is fixed, there is only one optimal set for x 1 and x 2 , as shown in Figure 6a. The same characteristic is observed when x 1 or x 2 are fixed. To mathematically represent this optimization under this constraint, a parent function g was defined as:
g ( x 3 ) =   min x 1 , x 2   h ( x 1 ,   x 2 ; x 3 ) .
Note that x 3 is fixed for the minimization in Equation (4). Second, the parent function g is convex with respect to the fixed parameter-i.e., x 3 , as shown in Figure 6b. Furthermore, this behavior was found for different TMD mass ratios.

4. New Optimization Approach

Based on the mathematical properties of the cost function, a new optimization approach was developed. This approach reduces the computation time for the optimization process by introducing a parent nested optimizing structure and approximative search.

4.1. Parent Nested Optimizing Structure

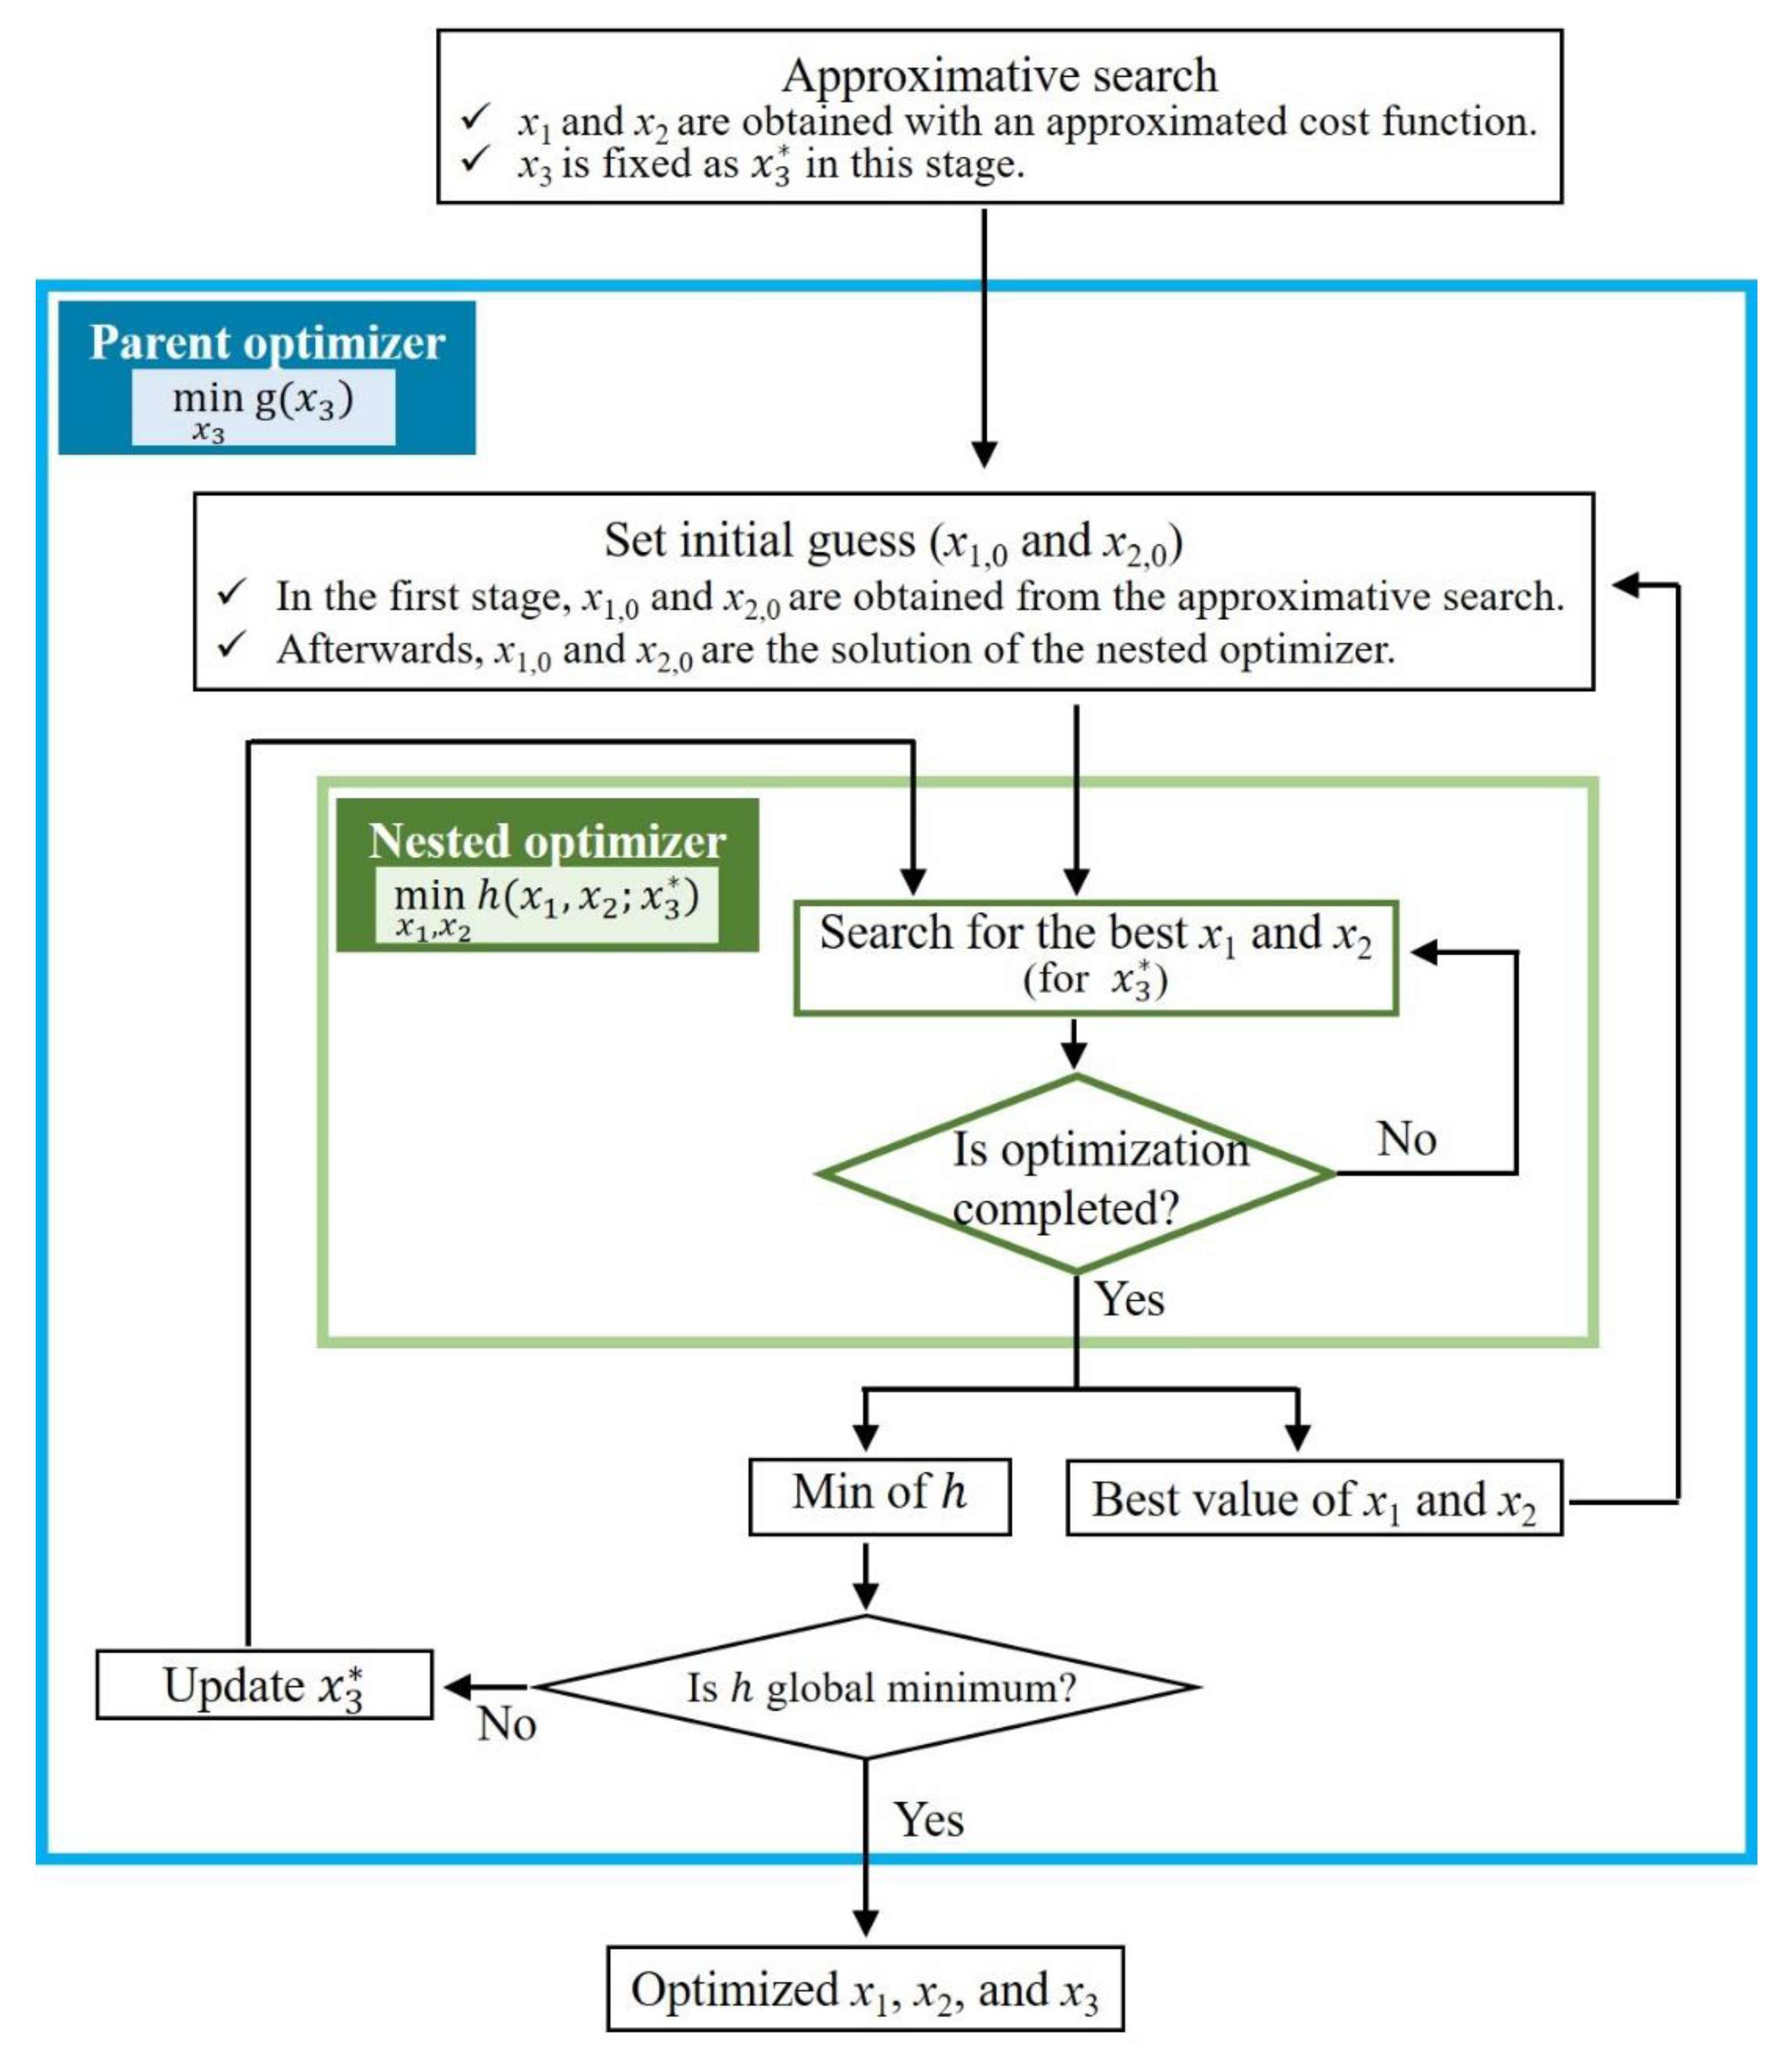
The optimization of h can be effectively achieved using a parent nested optimizing structure because of the characteristics described in Section 3.3. The nested optimizer is a low-level optimization engine that minimizes h when x 3 is fixed, whereas the parent optimizer is a high-level optimizer to search for minimum values among the results of the nested optimizer. As previously observed, h has a single minimum set when x 3 is fixed. Thus, this minimum set can be easily obtained via a gradient descent. Then, the value of x 3 is updated via the minimization procedure of the parent function defined in Equation (4). Because the parent function is convex with respect to x 3 , as shown in Figure 6b, the optimal value of x 3 can be rapidly obtained using the gradient descent method.

4.2. Approximative Search of the Initial Set

To reduce computation time, it is necessary to select initial parameter values that are close to an optimal set. Generally, this initial set can be estimated via a cost function evaluation with several sets. However, if the calculation time for the cost function is not short, this search requires substantial computational efforts. For example, the FOWT cost function h should be calculated based on the FOWT motion for 1000 s, as mentioned in Section 3.1. Accordingly, a large number of function evaluations are required to obtain the motion for 1000 s.
An approximative search can address this issue. Instead of calculating exact function values, an approximative function can be derived and employed to estimate the initial guess. For this purpose, three strategies were developed. First, the long transient state prediction computation was replaced by a substantially short calculation. Previously, the motion of the system was calculated for 1000 s by setting all initial conditions to zero. The first 400 s in the simulation correspond to the transient state. Although this transient motion was not used in the optimization, it is needed to calculate the TMD effects after the transient. To reduce the computation time dedicated to the transient state, the equilibrium state was used as the initial condition, and the simulation for the transient state was not conducted. The static solution for surge and pitch under constant wind speed conditions (i.e., 11 m/s) was used as the initial condition in this study.
Second, the motion for only a short period was considered; instead of considering the motion for 1000 s, the motion for only 125 s is calculated. Although this short simulation provides an inaccurate h value, this period is long enough to obtain an initial set close to the optimal set, as shown in Figure 7. Note that the first and second strategies were only used at the beginning of the optimization. Once the nested optimizer is operated, the initial guess can be obtained with another strategy; the minimum set obtained in the previous iteration of the parent optimizer can be used as the initial guess in the current iteration, as shown in Figure 8. This strategy can be used from the 2nd iteration onward, and it is more effective than the first and second strategies.

4.3. Detailed Optimization Procedure

The approximative search and parent nested optimizing structure were combined to achieve fast optimization. Figure 8 shows the flowchart for the newly developed optimization approach. First, the value of x 3 is arbitrarily determined and the initial values of x 1 and x 2 are obtained with the approximative search. Next, the optimal values of x 1 and x 2 for a fixed x 3 are obtained via gradient descent. Then, the value of x 3 is updated based on the previous and current values of the parent function g ( x 3 ) . Afterwards, x 3 is fixed with the updated value, and the initial values of x 1 and x 2 are replaced with the previous solution of the nested optimizer. Finally, the nest optimization is performed again with the new x 3 and initial values. This procedure is repeated until the parent function minimum is determined. Note that the proposed approach was used in an optimization problem with three parameters. However, this approach can be extended to more complex problems, with four or more parameters. More details are provided in the Supplementary Material.

5. Results

5.1. Performance of the New Optimization Approach

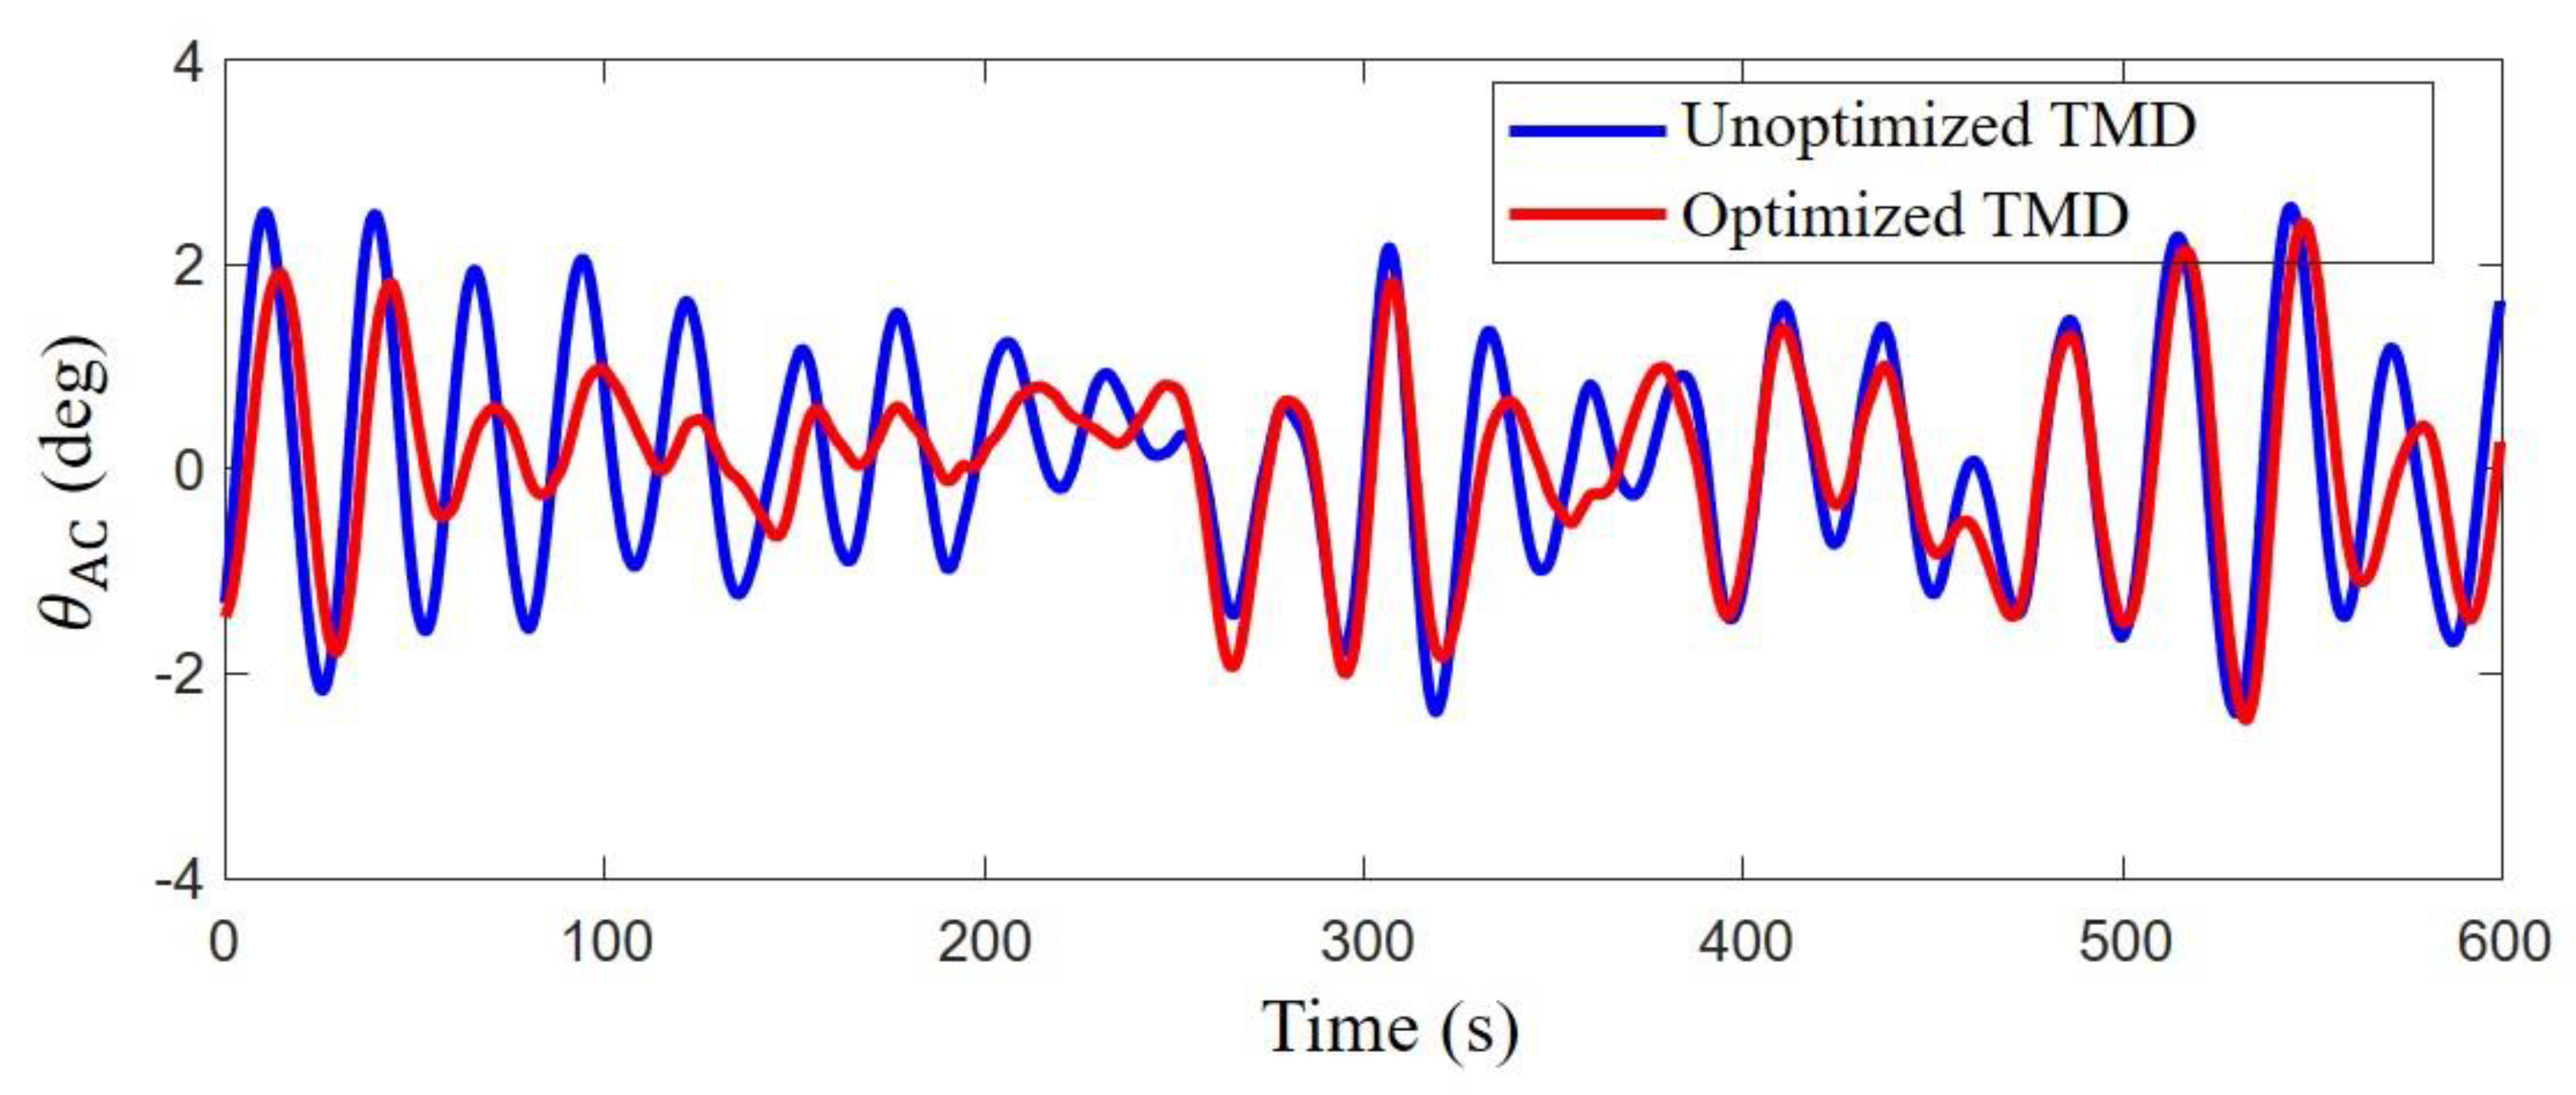
The TMD optimized using the new approach provides less fluctuating pitch motion when compared with the unoptimized TMD. This significant performance improvement is demonstrated in Figure 9. The parameters of the unoptimized TMD were determined based on the natural frequency of the FOWT. It is worth noting that such TMD parameter selection is a widely used approach in the study of FOWTs [9]. However, the TMD optimized with the load conditions reduces vibrations more effectively. This suggests that performing optimization by considering the load conditions is necessary for FOWTs.
To quantitatively assess the performance of the proposed optimization approach, the results obtained using this approach were compared with those obtained using the exhaustive search method. Accuracy is evaluated using the final value of the cost function. The optimization speed was estimated using the number of cost function evaluations required to find the optimized parameters. The accuracy and speed obtained for various TMD mass ratios and wind conditions are presented in Table 2 and Table 3, respectively. As mentioned before, the mass ratio defined as the ratio of the TMD mass to the FOWT mass. The optimization performed with the proposed approach was completed after 1000–1800 cost function evaluations. When a computer equipped with a 14-core processor (2.4 GHz) and 64 GB memory is used, approximately 0.852 s is required to obtain the value of the cost function. Thus, it takes approximately 47,200 s to conduct optimization using the exhaustive method, which requires 55,500 evaluations of the cost function. In contrast, when the proposed approach is used, the optimization can be completed after 1000–1800 cost function evaluations, which corresponds to only 852–1540 s. This is a noticeable improvement, considering that the conventional method requires 55,500 cost function evaluations. Furthermore, the value of the vibration intensity (i.e., the cost function) obtained using the new approach is very similar to the value obtained using the exhaustive search. This suggests that the proposed approach can accurately provide optimized parameters under various environmental conditions.

5.2. Case Study

Owing to the fast and accurate computation ability of the new approach, several studies on FOWTs can be conducted. In this study, the mass ratio was varied between 1% and 7% so that its effect could be investigated, as presented in Table 4. First, as the mass ratio increased, the performance of the TMD improved: whereas the performance index is 6.2% for a TMD mass ratio of 1%, the performance index increases to 29.7% for a TMD mass ratio of 7%. Interestingly, the performance index increases linearly with mass. Second, the optimal values of x 1 and x 2 are almost the same for the different mass ratios. However, the value of x 3 noticeably increases over the mass ratio. Note that x 3 is the installation location ( L t ) of the TMD, as shown in Figure 1. This result suggests that the location of the TMD has to be determined taking its mass into account.
The optimized parameters and corresponding TMD performance under various wind conditions are presented in Table 5. The mass ratio was fixed as 4% for this investigation. The platform vibration was reduced by 20–30% compared with the vibration without the TMD. Note that x 1 is the maximum when the average wind speed is 11 m/s. The thrust force caused by the rotation of the blades is almost the maximum at 11 m/s due to the pitch control of the blades. Consequently, the platform will be considerably tilted at this wind speed. This tilted posture will cause the TMD mass to move closer to the wall of the platform. This dynamic behavior will narrow the range of the TMD displacement, thereby degrading the performance of the TMD. Thus, the value of the TMD spring coefficient is the largest under this wind condition to ensure that the distance between the TMD and the wall is increased.
The effects of sea states can be considered using the wind condition. Specifically, the probability distribution of wave depends on the average wind speed. Details on this correlation is provided in Supplementary material. Moreover, the wind (and sea) condition should be selected based on a candidate site for FOWT. If the average wind speed does not considerably change in the site, a single condition is sufficient to optimize the TMD. If the seasonal changes in the wind speed are large, the TMD parameter should be determined by considering several wind (and sea) conditions. In this case, the probability of average wind speed has to be considered in the optimization.

6. Conclusions

The vibrations of FOWTs should be reduced because they negatively affect the stable operation and lifespan of FOWTs. Although TMD is a promising solution to address this problem, the design of TMDs is challenging owing to the existence of multiple minima. Although several mathematical techniques have been applied to resolve this issue, they require heavy computations.
To address this problem, this paper proposes a novel and specialized optimization approach. The newly developed approach can provide accurate results with relatively short computation times. Interestingly, when one of the TMD parameters is fixed as a constant, an optimal set for the other parameters can be easily obtained. To further utilize this cost function property, a parent nested optimizing structure was developed. Additionally, an approximative search was proposed to rapidly obtain a good initial guess for optimization. The performance of this method, in terms of accuracy and optimization speed, was compared with that of a previous method (i.e., the exhaustive method) for validation purposes. The new approach outperformed the previous method regarding both metrics used.
The proposed optimization approach is especially useful when several factors have to be considered to design floating offshore wind turbines (FOWTs) and TMDs. Although several environmental and design factors were assumed to be invariant during the optimization, these factors can change and have to be taken into account in practice. Then, the optimization should be conducted several times to study the effects of the environmental and design factors. For example, the optimization should be performed over various wind conditions, wave forces, dimensions, dimensions of structures, and masses of structures, etc. Thus, when a large number of optimizations should be conducted, the proposed approach (which is approximately 50 times faster than the exhaustive search) is very useful.
The new method was also applied to study the effects of TMD mass and wind conditions on TMD design. This case study revealed that the performance of the TMD linearly increases with its mass. Thus, the TMD mass has to be determined considering the vibration intensity and cost of the TMD. Additionally, it was found that a light TMD showed a high performance when installed close to the mean sea water level, whereas a heavy TMD operates more effectively when installed close to the bottom of the platform. The TMD performance also varied over the average wind speed. Specifically, the vibration reduction capability of this single TMD is maximum when the average wind speed is approximately 13 m/s. Furthermore, the proposed method could be useful in other studies, such as the optimization of TMDs with multi-TMD systems.

Supplementary Materials

A supplementary document is available online https://www.mdpi.com/2077-1312/8/11/876/s1.

Author Contributions

Conceptualization, W.N. and K.-Y.O.; methodology, W.N.; validation, G.P. and W.N.; formal analysis, G.P.; investigation, G.P. and W.N.; writing—original draft preparation, G.P., W.N., and K.-Y.O.; writing—review and editing, W.N. and K.-Y.O.; visualization, G.P. and W.N.; supervision, W.N. and K.-Y.O.; project administration, W.N. and K.-Y.O.; funding acquisition, W.N. and K.-Y.O. All authors have read and agreed to the published version of the manuscript.

Funding

This research was supported by the Korea Electric Power Corporation (No. R19XO01-38) and the Chung-Ang University Graduate Research Scholarship in 2019.

Conflicts of Interest

The authors declare no conflict of interest.

References

  1. Kaldellis, J.; Kapsali, M. Shifting towards offshore wind energy—Recent activity and future development. Energy Policy 2013, 53, 136–148. [Google Scholar] [CrossRef]
  2. Musial, W.; Butterfield, S.; Ram, B. Energy from Offshore Wind. In Proceedings of the Offshore Technology Conference, Houston, TX, USA, 1–4 May 2006. [Google Scholar] [CrossRef]
  3. Stewart, G.; Lackner, M. Offshore Wind Turbine Load Reduction Employing Optimal Passive Tuned Mass Damping Systems. IEEE Trans. Control. Syst. Technol. 2013, 21, 1090–1104. [Google Scholar] [CrossRef]
  4. Butterfield, S.; Musial, W.; Jonkman, J. Engineering challenges for floating offshore wind turbines. In Proceedings of the 2005 Copenhagen Offshore Wind Conference, Copenhagen, Denmark, 26–28 October 2005. [Google Scholar]
  5. Jonkman, J.; Matha, D. A quantitative comparison of the responses of three floating platforms. In Proceedings of the European Offshore Wind 2009 Conference, Stockholm, Sweden, 14–16 September 2009. NREL. [Google Scholar]
  6. Murtagh, P.J.; Ghosh, A.; Basu, B.; Broderick, B.M. Passive control of wind turbine vibrations including blade/tower interaction and rotationally sampled turbulence. Wind Energy 2008, 11, 305–317. [Google Scholar] [CrossRef]
  7. Jonkman, J.M.; Buhl, M.L., Jr. FAST User’s Guide; National Renewable Energy Laboratory: Golden, CO, USA, 2005.
  8. Lackner, M.A.; Rotea, M.A. Passive structural control of offshore wind turbines. Wind Energy 2011, 14, 373–388. [Google Scholar] [CrossRef]
  9. Si, Y.; Karimi, H.R.; Gao, H. Modelling and optimization of a passive structural control design for a spar-type floating wind turbine. Eng. Struct. 2014, 69, 168–182. [Google Scholar] [CrossRef]
  10. Li, C.; Zhuang, T.; Zhou, S.; Xiao, Y.Q.; Hu, G. Passive Vibration Control of a Semi-Submersible Floating Offshore Wind Turbine. Appl. Sci. 2017, 7, 509. [Google Scholar] [CrossRef] [Green Version]
  11. Park, S.; Lackner, M.A.; Pourazarm, P.; Tsouroukdissian, A.R.; Cross-Whiter, J. An investigation on the impacts of passive and semiactive structural control on a fixed bottom and a floating offshore wind turbine. Wind Energy 2019, 22, 1451–1471. [Google Scholar] [CrossRef]
  12. Yang, J.; He, E.; Hu, Y. Dynamic modeling and vibration suppression for an offshore wind turbine with a tuned mass damper in floating platform. Appl. Ocean Res. 2019, 83, 21–29. [Google Scholar] [CrossRef]
  13. He, E.-M.; Hu, Y.-Q.; Zhang, Y. Optimization design of tuned mass damper for vibration suppression of a barge-type offshore floating wind turbine. Proc. Inst. Mech. Eng. Part M J. Eng. Marit. Environ. 2016, 231, 302–315. [Google Scholar] [CrossRef]
  14. Hu, Y.; He, E. Active structural control of a floating wind turbine with a stroke-limited hybrid mass damper. J. Sound Vib. 2017, 410, 447–472. [Google Scholar] [CrossRef]
  15. Si, Y.; Karimi, H.R.; Gao, H. Modeling and Parameter Analysis of the OC3-Hywind Floating Wind Turbine with a Tuned Mass Damper in Nacelle. J. Appl. Math. 2013, 2013, 679071. [Google Scholar] [CrossRef] [Green Version]
  16. Jin, X.; Xie, S.; He, J.; Lin, Y.; Wang, Y.; Wang, N. Optimization of tuned mass damper parameters for floating wind turbines by using the artificial fish swarm algorithm. Ocean Eng. 2018, 167, 130–141. [Google Scholar] [CrossRef]
  17. Neshat, M.; Adeli, A.; Sepidnam, G.; Sargolzaei, M.; Toosi, A.N. A review of artificial fish swarm optimization methods and applications. Int. J. Smart Sens. Intell. Syst. 2012, 5, 108–148. [Google Scholar] [CrossRef] [Green Version]
  18. He, J.; Jin, X.; Xie, S.; Cao, L.; Lin, Y.; Wang, N. Multi-body dynamics modeling and TMD optimization based on the improved AFSA for floating wind turbines. Renew. Energy 2019, 141, 305–321. [Google Scholar] [CrossRef]
  19. Mohamed, A.W. A novel differential evolution algorithm for solving constrained engineering optimization problems. J. Intell. Manuf. 2017, 29, 659–692. [Google Scholar] [CrossRef]
  20. Jonkman, J. Definition of the Floating System of Phase lV of OC3; NREL: Golden, CO, USA, 2010.
  21. Jonkman, J.M.; Butterfield, S.P.; Musial, W.D.; Scott, G.W. Definition of a 5-MW Reference Wind Turbine for Offshore System Development; Technical report; National Renewable Energy Laboratory: Golden, CO, USA, 2009. [CrossRef] [Green Version]
  22. Al-Solihat, M.K.; Nahon, M.; Behdinan, K. Dynamic Modeling and Simulation of a Spar Floating Offshore Wind Turbine With Consideration of the Rotor Speed Variations. J. Dyn. Syst. Meas. Control. 2019, 141. [Google Scholar] [CrossRef]
  23. Anferson, M.T.; Wendt, F.F.; Robertson, A.N.; Jonkman, J.M.; Hall, M. Verification and Validation of Multisegmented Mooring Capabilities in FAST v8; NREL: Golden, CO, USA, 2016.
  24. Browing, J.R.; Jonkman, J.; Robertson, A.; Goupee, A.J. Calibration and validation of a spar-type floating offshore wind turbine model using the FAST dynamic simulation tool. J. Phys. 2014, 555, 012015. [Google Scholar]
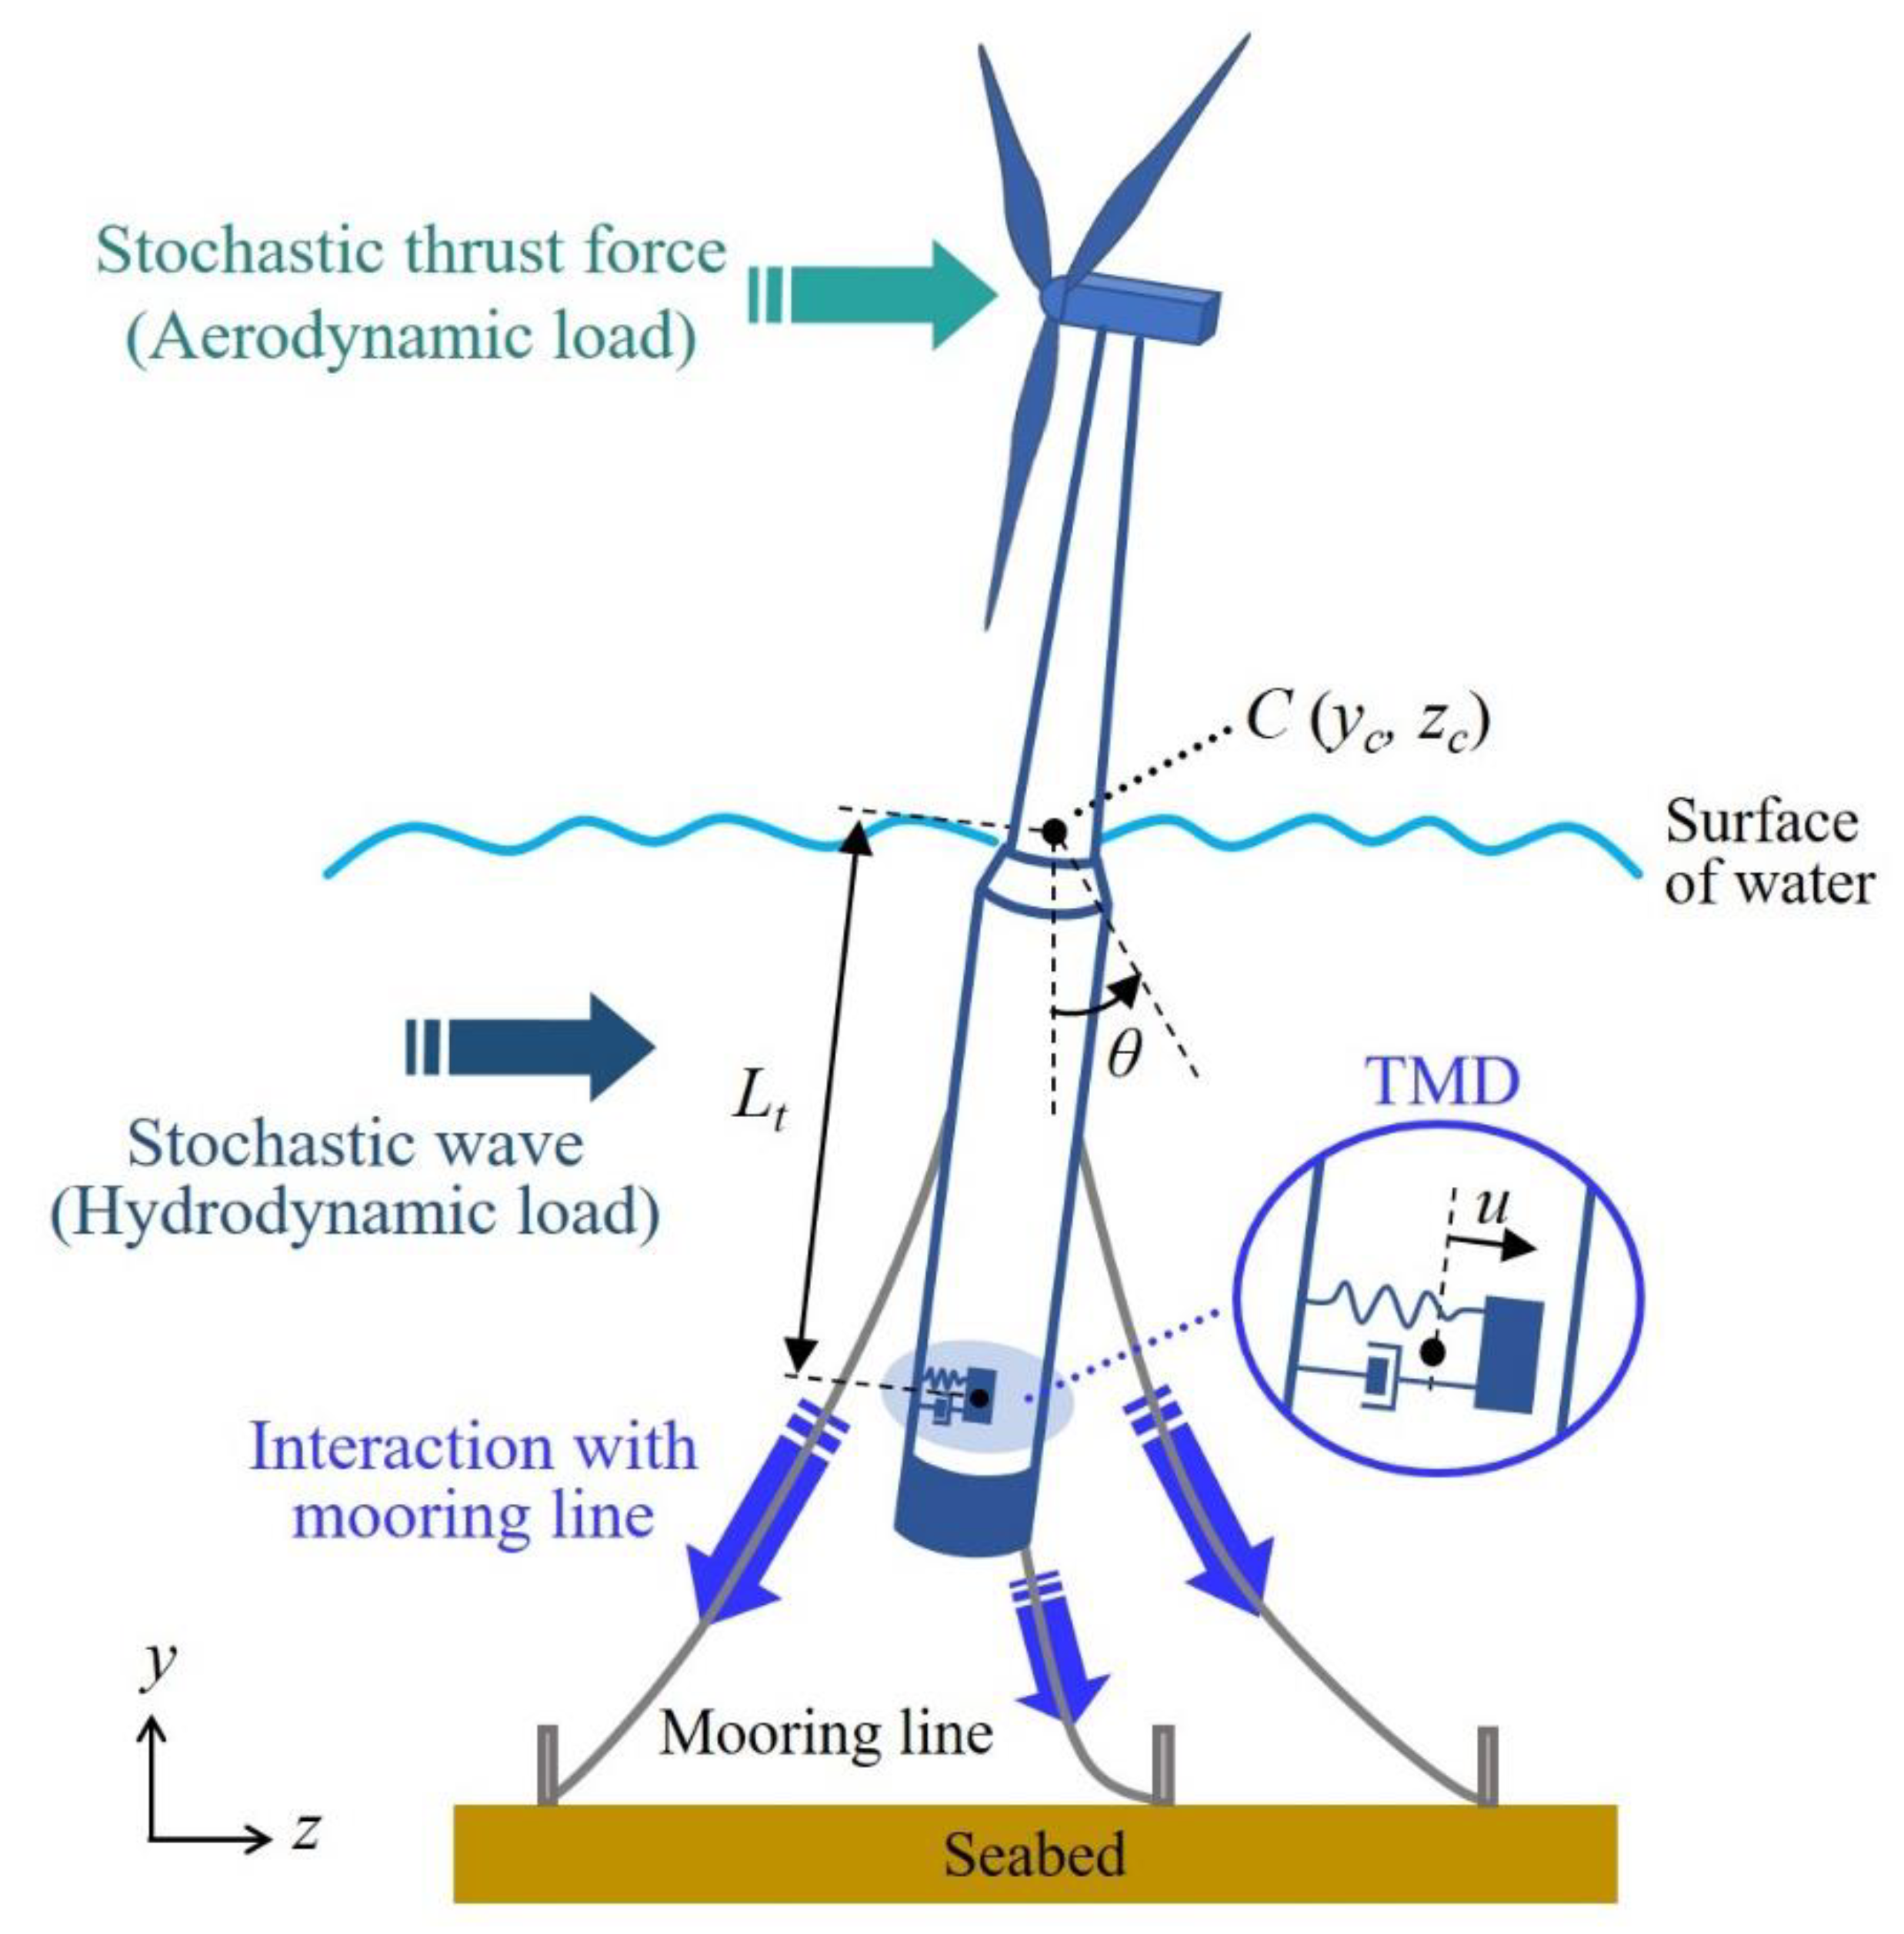
Figure 1. Schematic of the floating offshore wind turbine model.
Jmse 08 00876 g001
Figure 2. Free decay response comparison. (a) pitch angle with the initial value of 5 ° ; (b) pitch angle with the initial value of 10 ° ; (c) surge motion with the initial value of 10 m; (d) surge motion with the initial value of 5 m.
Jmse 08 00876 g002
Figure 3. Restoring effect due to buoyancy force. (a) Buoyancy force and gravitational force acting on FOWT platform. (b) Changes in stability due to tuned mass damper.
Jmse 08 00876 g003
Figure 4. Pitch motion of the FOWT in the presence of stochastic winds and waves. The average wind speed is 11 m/s.
Jmse 08 00876 g004
Figure 5. Local minima of the vibration intensity function.
Jmse 08 00876 g005
Figure 6. Cost function properties. (a) Variation in h for fixed x 3 ; (b) convexity of the parent function with respect to x 3 .
Jmse 08 00876 g006
Figure 7. Cost function values for x 3 = 60 m. (a) Function values for a 1000 s simulation time and fine grid. (b) Function values for a 125 s simulation time and coarse grid. The white crosses represent the minimum point acquired from each calculation.
Jmse 08 00876 g007
Figure 8. Flowchart of the new optimization approach.
Jmse 08 00876 g008
Figure 9. Motion fluctuation of the FOWT before and after optimization.
Jmse 08 00876 g009
Table 1. Structural parameters of OC3-Hywind.
ParameterValue
Tower length77.6 m
Platform length130 m
Taper length8 m
Submerged length120 m
Platform diameter above taper6.5 m
Platform diameter below taper9.4 m
Tower diameter (top, bottom)3.87 m, 6.5 m
Platform mass7,466,330 kg
RNA mass350,000 kg
Tower mass249,718 kg
Table 2. Comparison between the exhaustive method and the proposed approach for various TMD masses.
Mass RatioMethodNumber of Function EvaluationsVibration Intensity
h
2%Exhaustive search55,4491.0133
New approach13751.0127
3%Exhaustive search55,4490.9667
New approach10200.9666
4%Exhaustive search55,4490.9199
New approach15670.9185
5%Exhaustive search55,4490.8682
New approach18650.8676
Table 3. Comparison between the exhaustive method and the proposed approach for various wind conditions.
Mean Wind VelocityMethodNumber of Cost Function EvaluationsVibration Intensity
h
Performance Index
P v ( % )
9 m/sExhaustive search55,4491.230419.406
New approach13751.230119.422
11 m/sExhaustive search55,4490.919919.181
New approach10200.918519.238
13 m/sExhaustive search55,4491.026330.763
New approach15671.026230.769
Table 4. Optimized parameters and TMD performance for various mass ratios.
Optimized ParametersTMD Performance
Mass Ratio x 1 x 2 x 3 P v (%)
1%0.08341.0511206.216
2%0.08431.25212010.956
3%0.08261.198826.54115.012
4%0.08101.223134.16719.238
5%0.07920.850243.20323.714
6%0.08081.009248.26127.143
7%0.07680.924857.59229.746
Table 5. Optimized parameters and TMD performance for various wind conditions.
Optimized ParametersTMD Performance
Average Wind Velocity x 1 x 2 x 3 P v (%)
9 m/s0.07191.30110019.406
11 m/s0.08101.223134.16719.238
13 m/s0.07271.604310030.763
15 m/s0.06970.953380.53222.976
Publisher’s Note: MDPI stays neutral with regard to jurisdictional claims in published maps and institutional affiliations.