1. Introduction
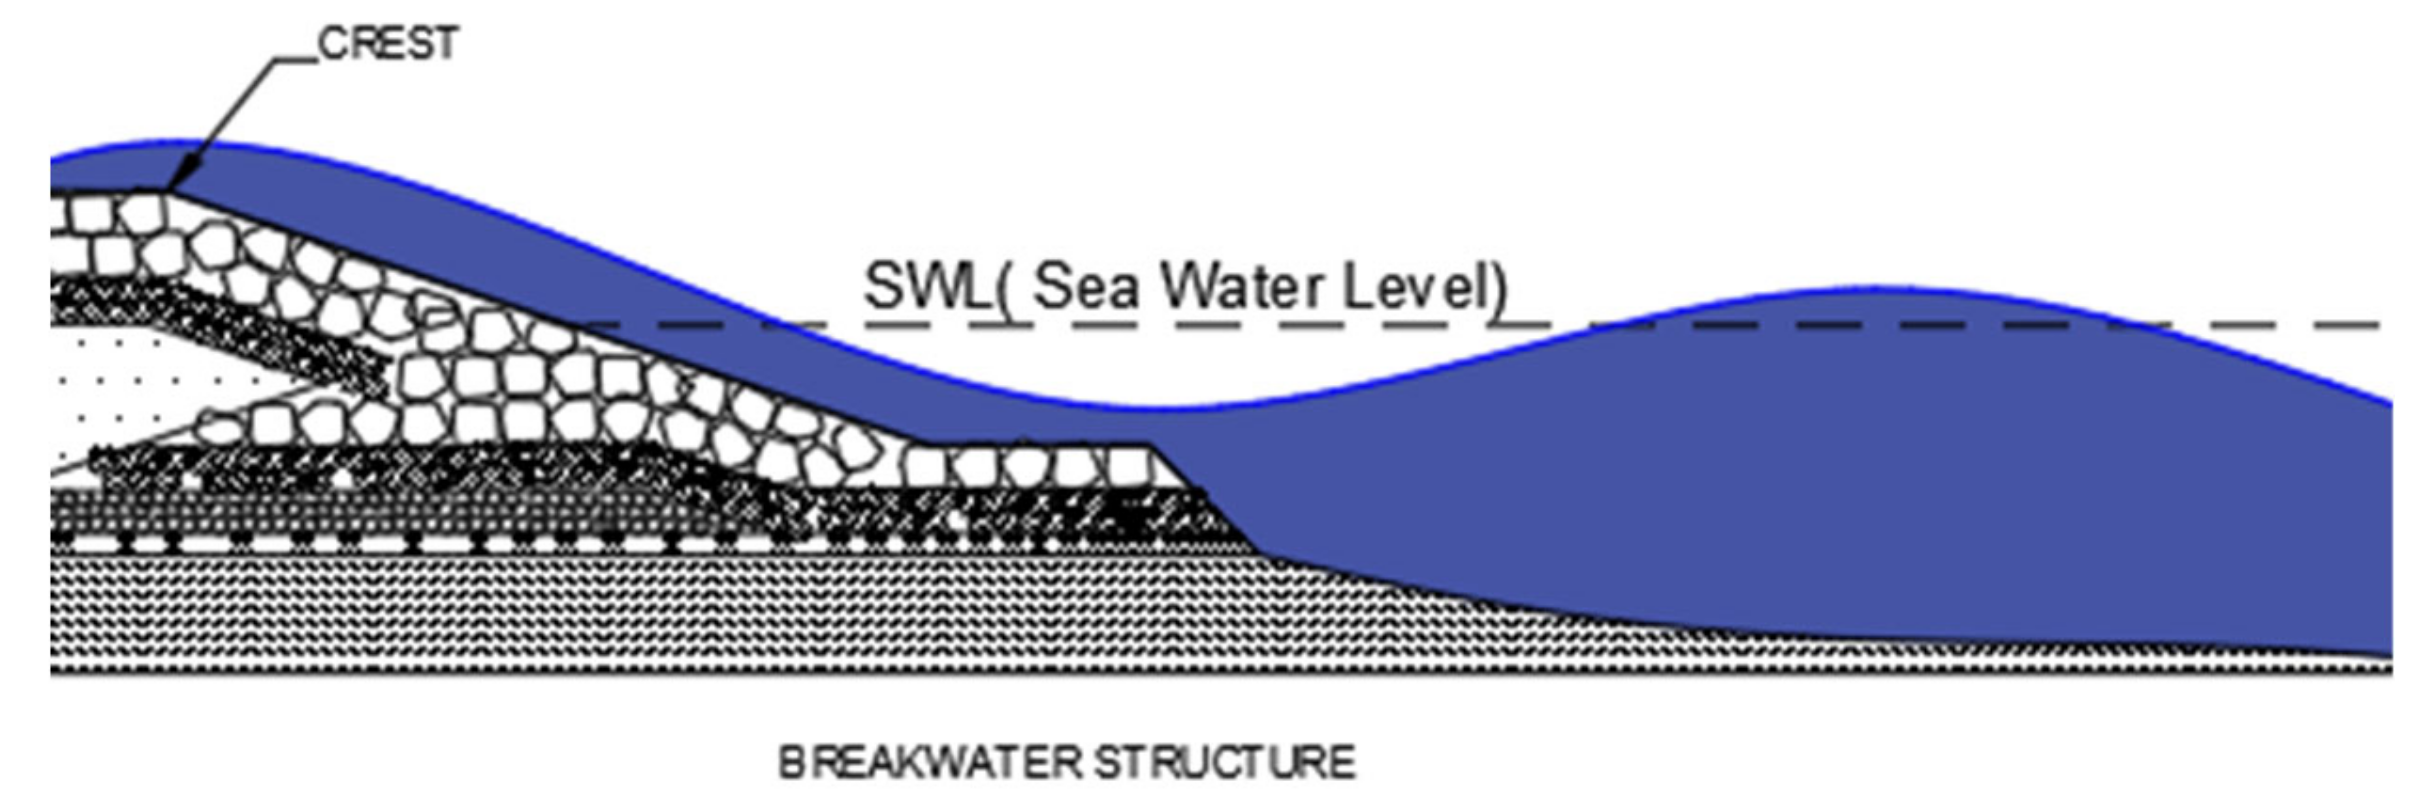
Over the past few years, there has been interest among researchers in converting wave energy into electricity. One of the famous approaches created is the conversion of wave energy through the OverTopping Wave Device (OTD). It used water collected from an overtopping wave that passes through the structure crest (
Figure 1). Up till now, there are various designs, models, and prototype concepts developed subscribing to this idea starting from the development of coastal based concept such as Tapered Channel (TapCHAN) in 1985 [
1], Composite Sea Wall (CSWEC) in 2010 [
2], and Sea Slot cone Generator (SSG) in 2012 [
3]. Then it was continued with innovation into offshore based structure such as Wave Dragon (WD) in year 2000 [
4], Spiral Reef in 2007 [
5], Wave Plane (WP) in 2008 [
6], and Wave Catamaran (WaveCAT) in 2012 [
7] (see
Table 1). Although some of the OTD devices (such as WD) have achieved full-scale implementation, unfortunately, they were unable to reach the level of commercialization due to low economic contribution, such as the high cost of construction, deploying, and maintaining testable large-scale prototypes [
8,
9].
The only option to make OTD concept a reasonable energy resource is to add functionality to the coastal structure and breakwaters This can be done by integrating a standalone device with hybrid systems embedded in the current structure. The integration and sharing of costs thus become a key for OTD to be more competitive than a standalone device [
10]. This paper will focus on the integration of the current traditional breakwater with an OTD device, introduced by Vicinanza et al. [
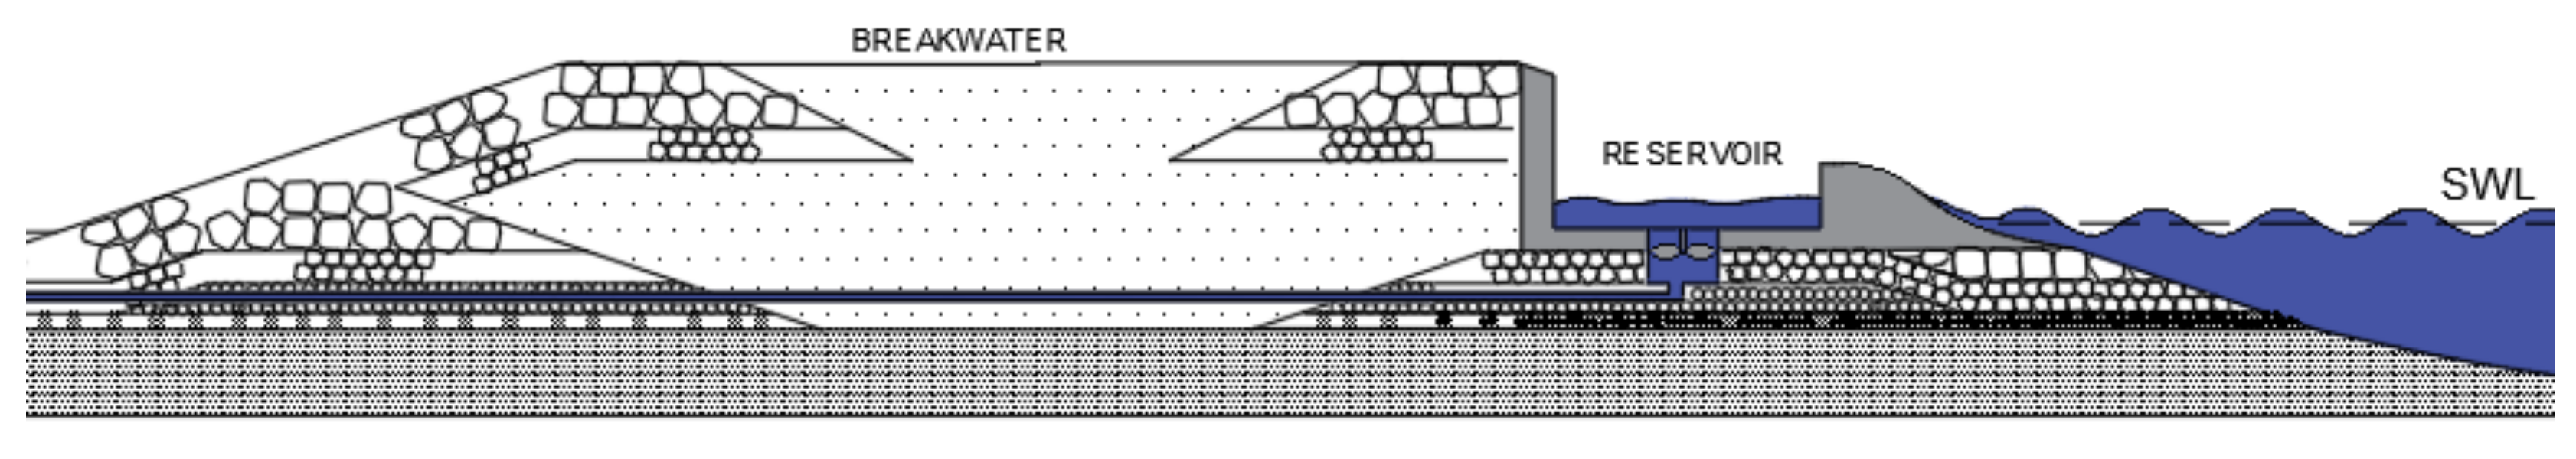
8]. The innovation is known as “overtopping breakwater for energy conversion (OBREC)” and can be classified as a multifunctional device combining the OTD concept and current rubble mound breakwaters. The concept uses the overtopping phenomenon where the incoming waves will run up the breakwater ramp, over the crest limit, and then fill the reservoir. As the water flows down the reservoir, the energy will be extracted via a low head turbine (
Figure 2). The advantages of OBREC have been described in detail by previous researchers, where, it could be sharing the costs, easy to operate and maintain, reduce the environmental impact, and easier to construct as it has a similar structure with current traditional breakwaters [
11].
However, OBREC has been reported as capable of generating electricity only 2 kW in mild wave condition, which is considered low compared to other OTD devices [
8,
12]. This is related to the existing breakwater surface structure or ramp, which has been designed with steep armor and stone layer in order to create more resistance to avert erosion. It indirectly reduces overtopping waves and energy generated by the OBREC device. Thus, to meet both economic and energy requirements, an OBREC parameter modification is necessary to be explored in minimum and optimum condition. This calls for a more fundamental and comprehensive study on the existing OBREC parameters, particularly on their ramp surface. Several ramp shape modifications have been explored by previous researchers to enhance overtopping water on an OBREC device. In 2016, Iuppa et al. conducted few experimental studies to assess the OBREC behavior using two types of ramp (curve and flat) aiming to improve their performance. In their findings, the curve (convex) shape has reduced reflection and overtopping approximately by 20% compared to a flat ramp [
13,
14]. From their series of test campaigns, a full-scale prototype has been constructed at Naple port in 2016 [
15]. However, authors have never reported the capability and result of the device till now. In the other article published by the same authors, the stability of OBREC has been discussed through investigation of the pressure distribution and resultant force on both curve and flat ramps [
16]. Meanwhile, a numerical study using Openform software on the ramp curvature effect on overtopping discharge of OBREC devices has been reported by Barbosa et al., in 2018 [
17]. It stated that the convex shape gave the maximum water waste at lower ramp L:B (height/length) ratio as opposed to the highest L:B ratio, where the concave ramp tends to bring more overtopping waves [
17]. The research on ramp shape parameters was also found on other OTW devices such as parabolic shape on Spiral reef device, linear and convex shape on SSG, and the most comprehensive ramps shape study (concave, convex, ellipse, and linear shape) on WD devices (see
Table 1). Various conclusions and findings have been reported, and it is believed that overtopping is relatively dependent on the seaward face/ramp shape parameters, respective to the accumulation of wave run-up [
18].
Thus, this paper attempts to investigate the effect of ramp shapes into OBREC devices by exploring more shape parameters. The aims are to extend the available knowledge on ramp shape study over the OBREC as well as improving their efficiency. Seven polynomial shapes are tested and simulated under local wave parameters.
2. Materials and Methods
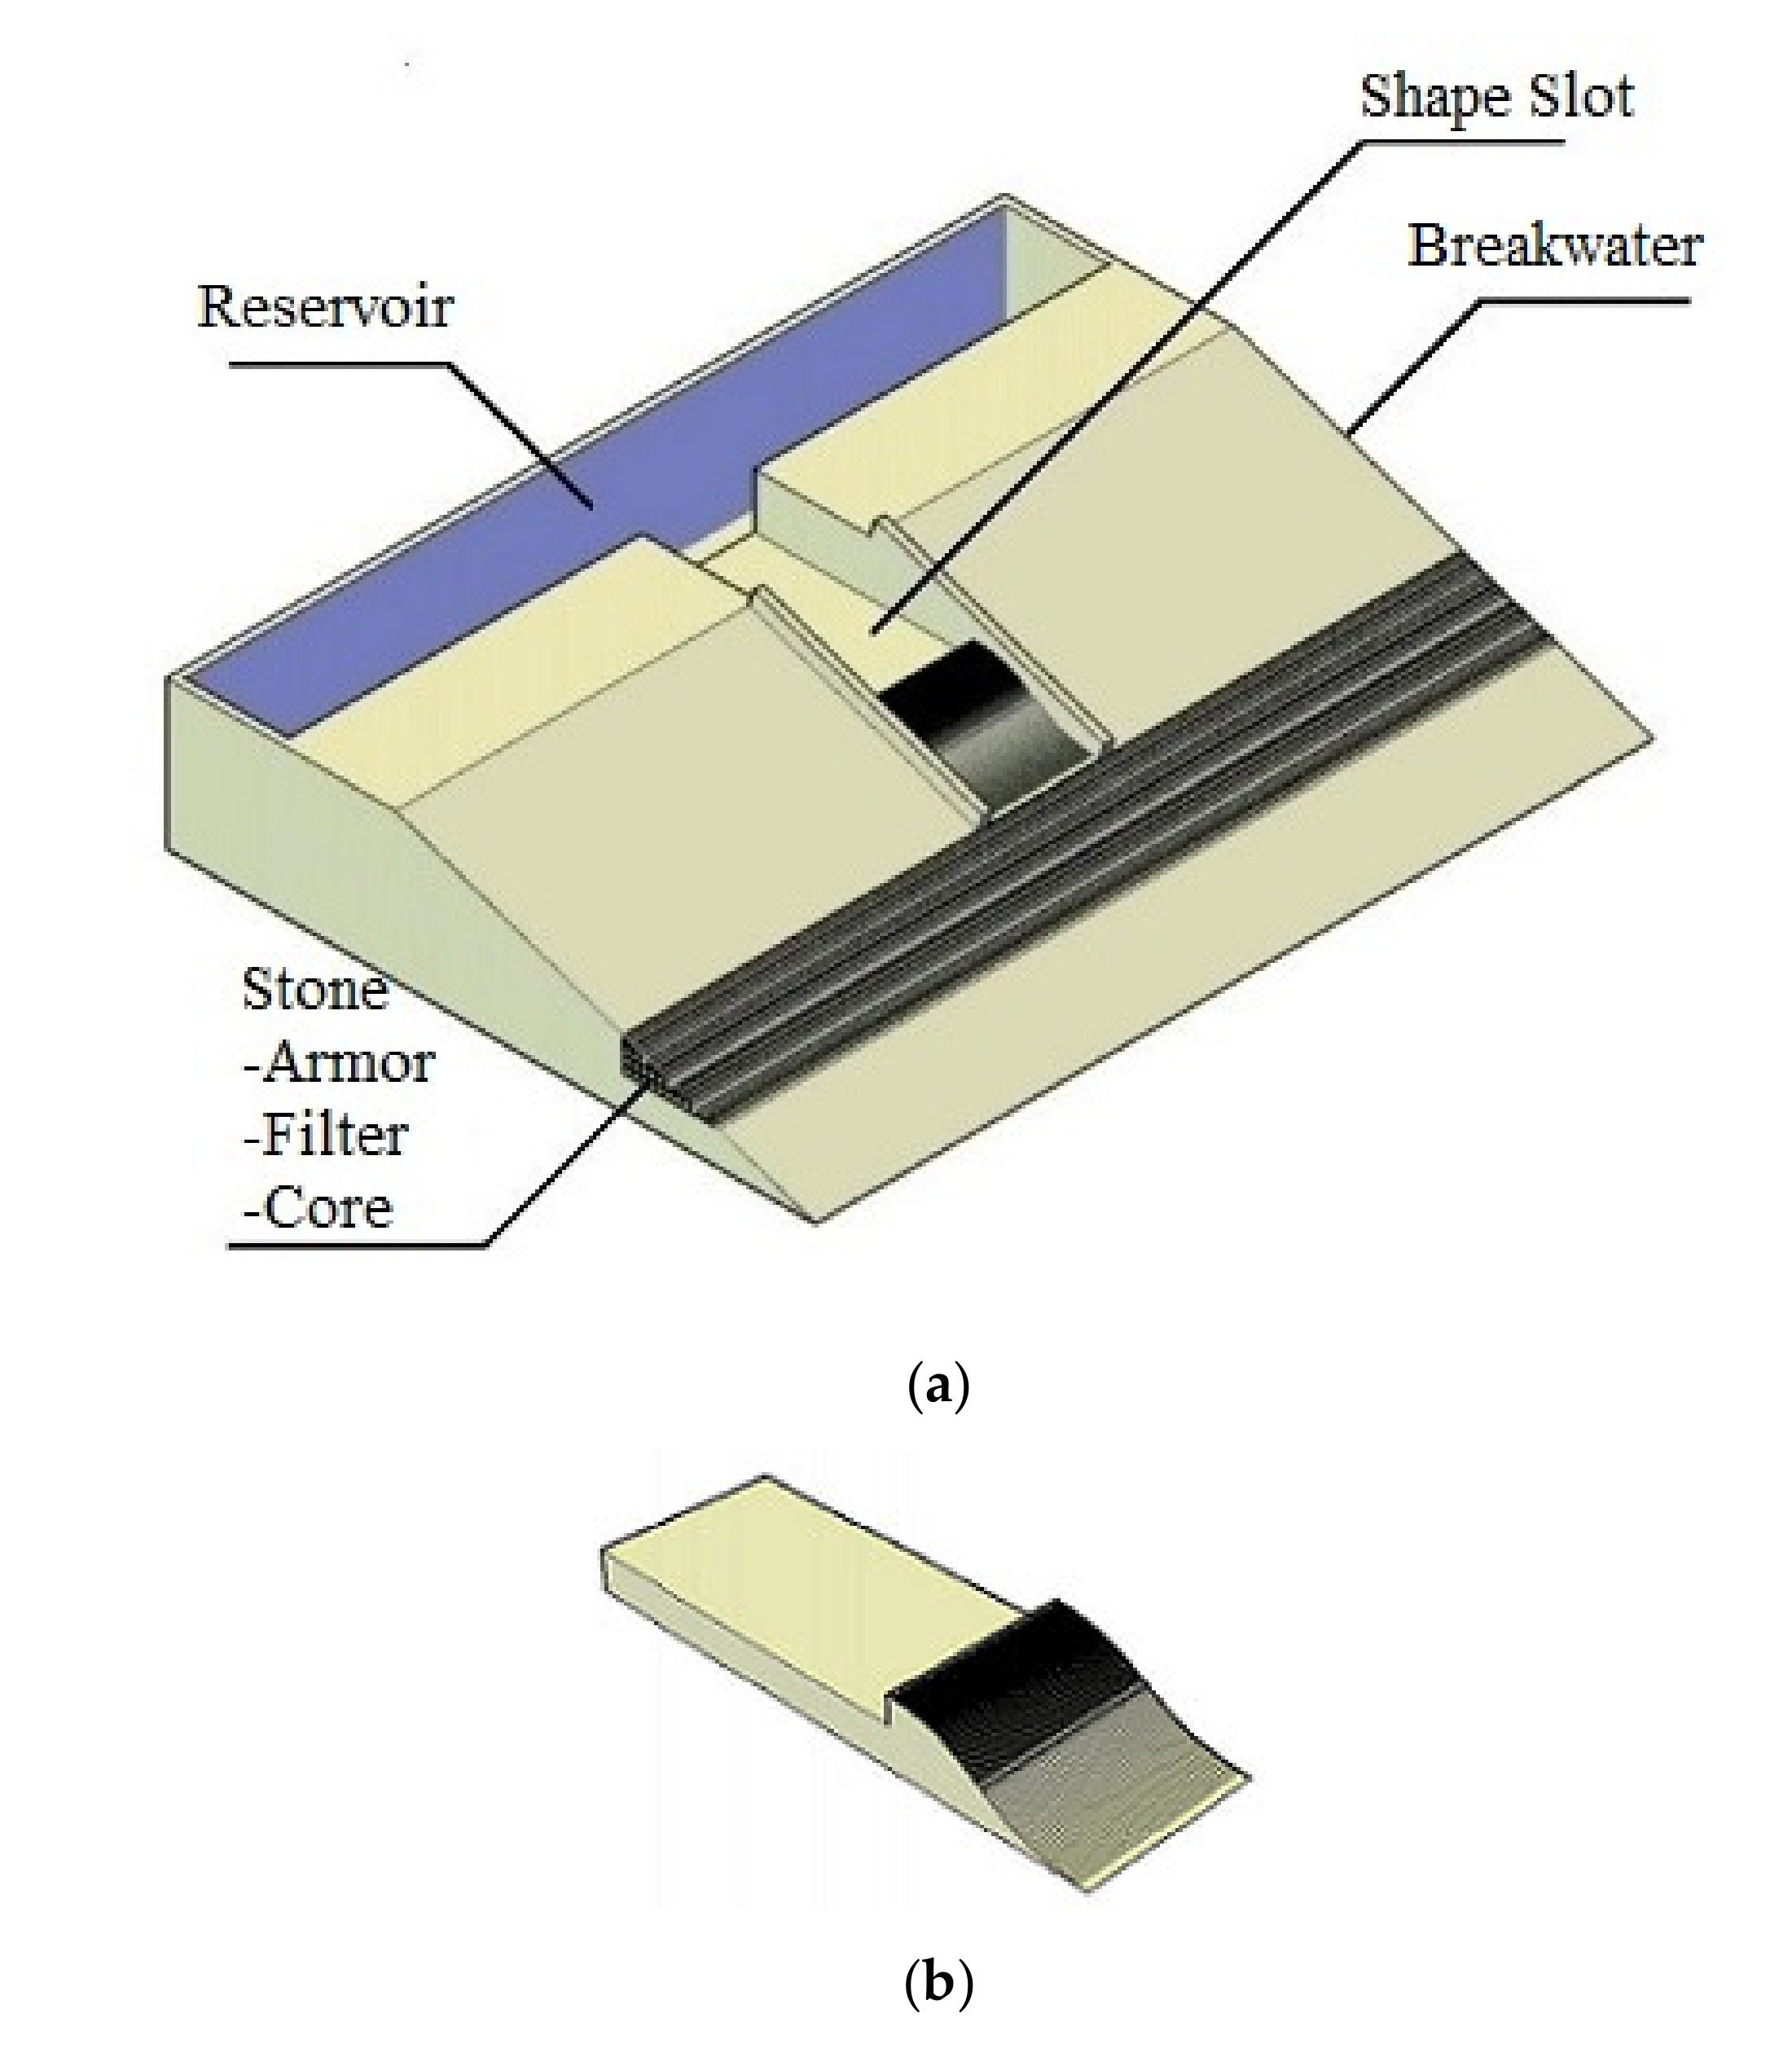
In order to investigate the influence of ramp shape, seven different shape parameters (examples as
Figure 3b) with polynomial order variations, up to 5th was tested under Malaysia’s wave condition. Both actual and computer fluid dynamic (using FLOW 3D software) approaches were used for comparison evaluation. The comparison is mainly focused on volume of overtopping discharge output in the reservoir attached at the back of main device structures as shown in
Figure 3a.
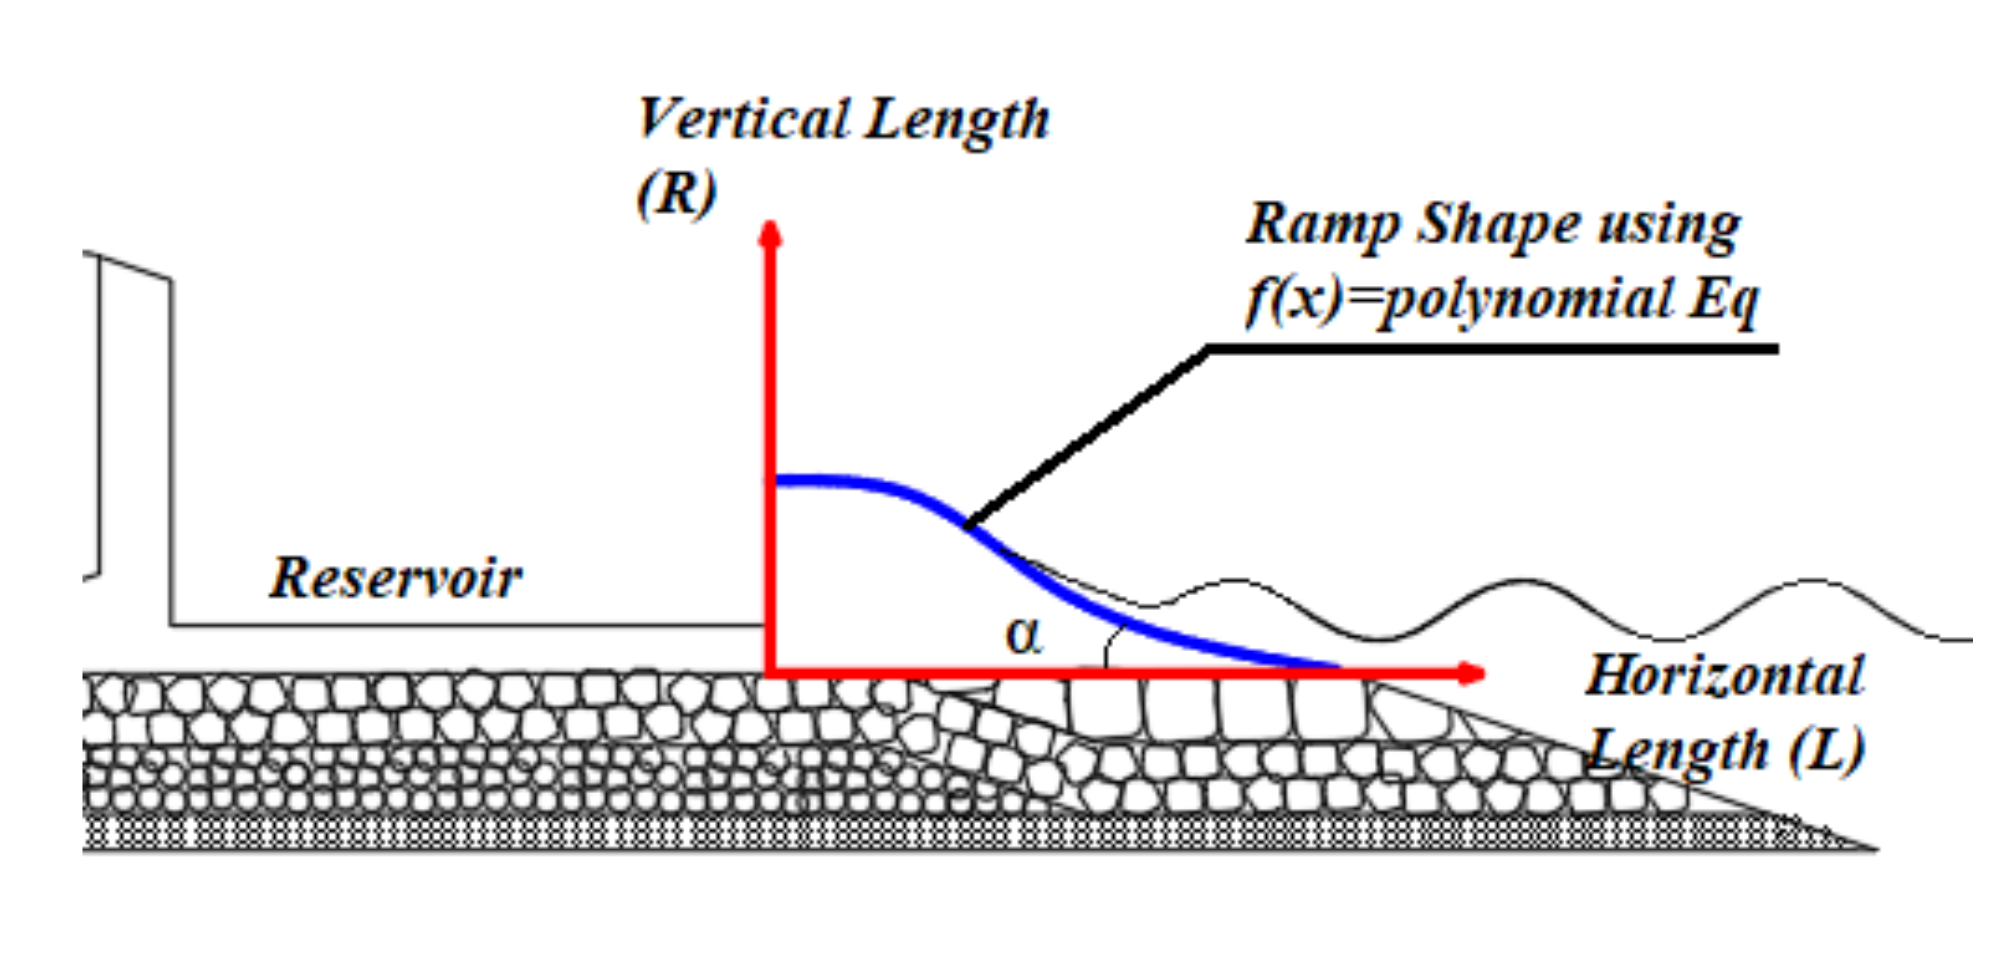
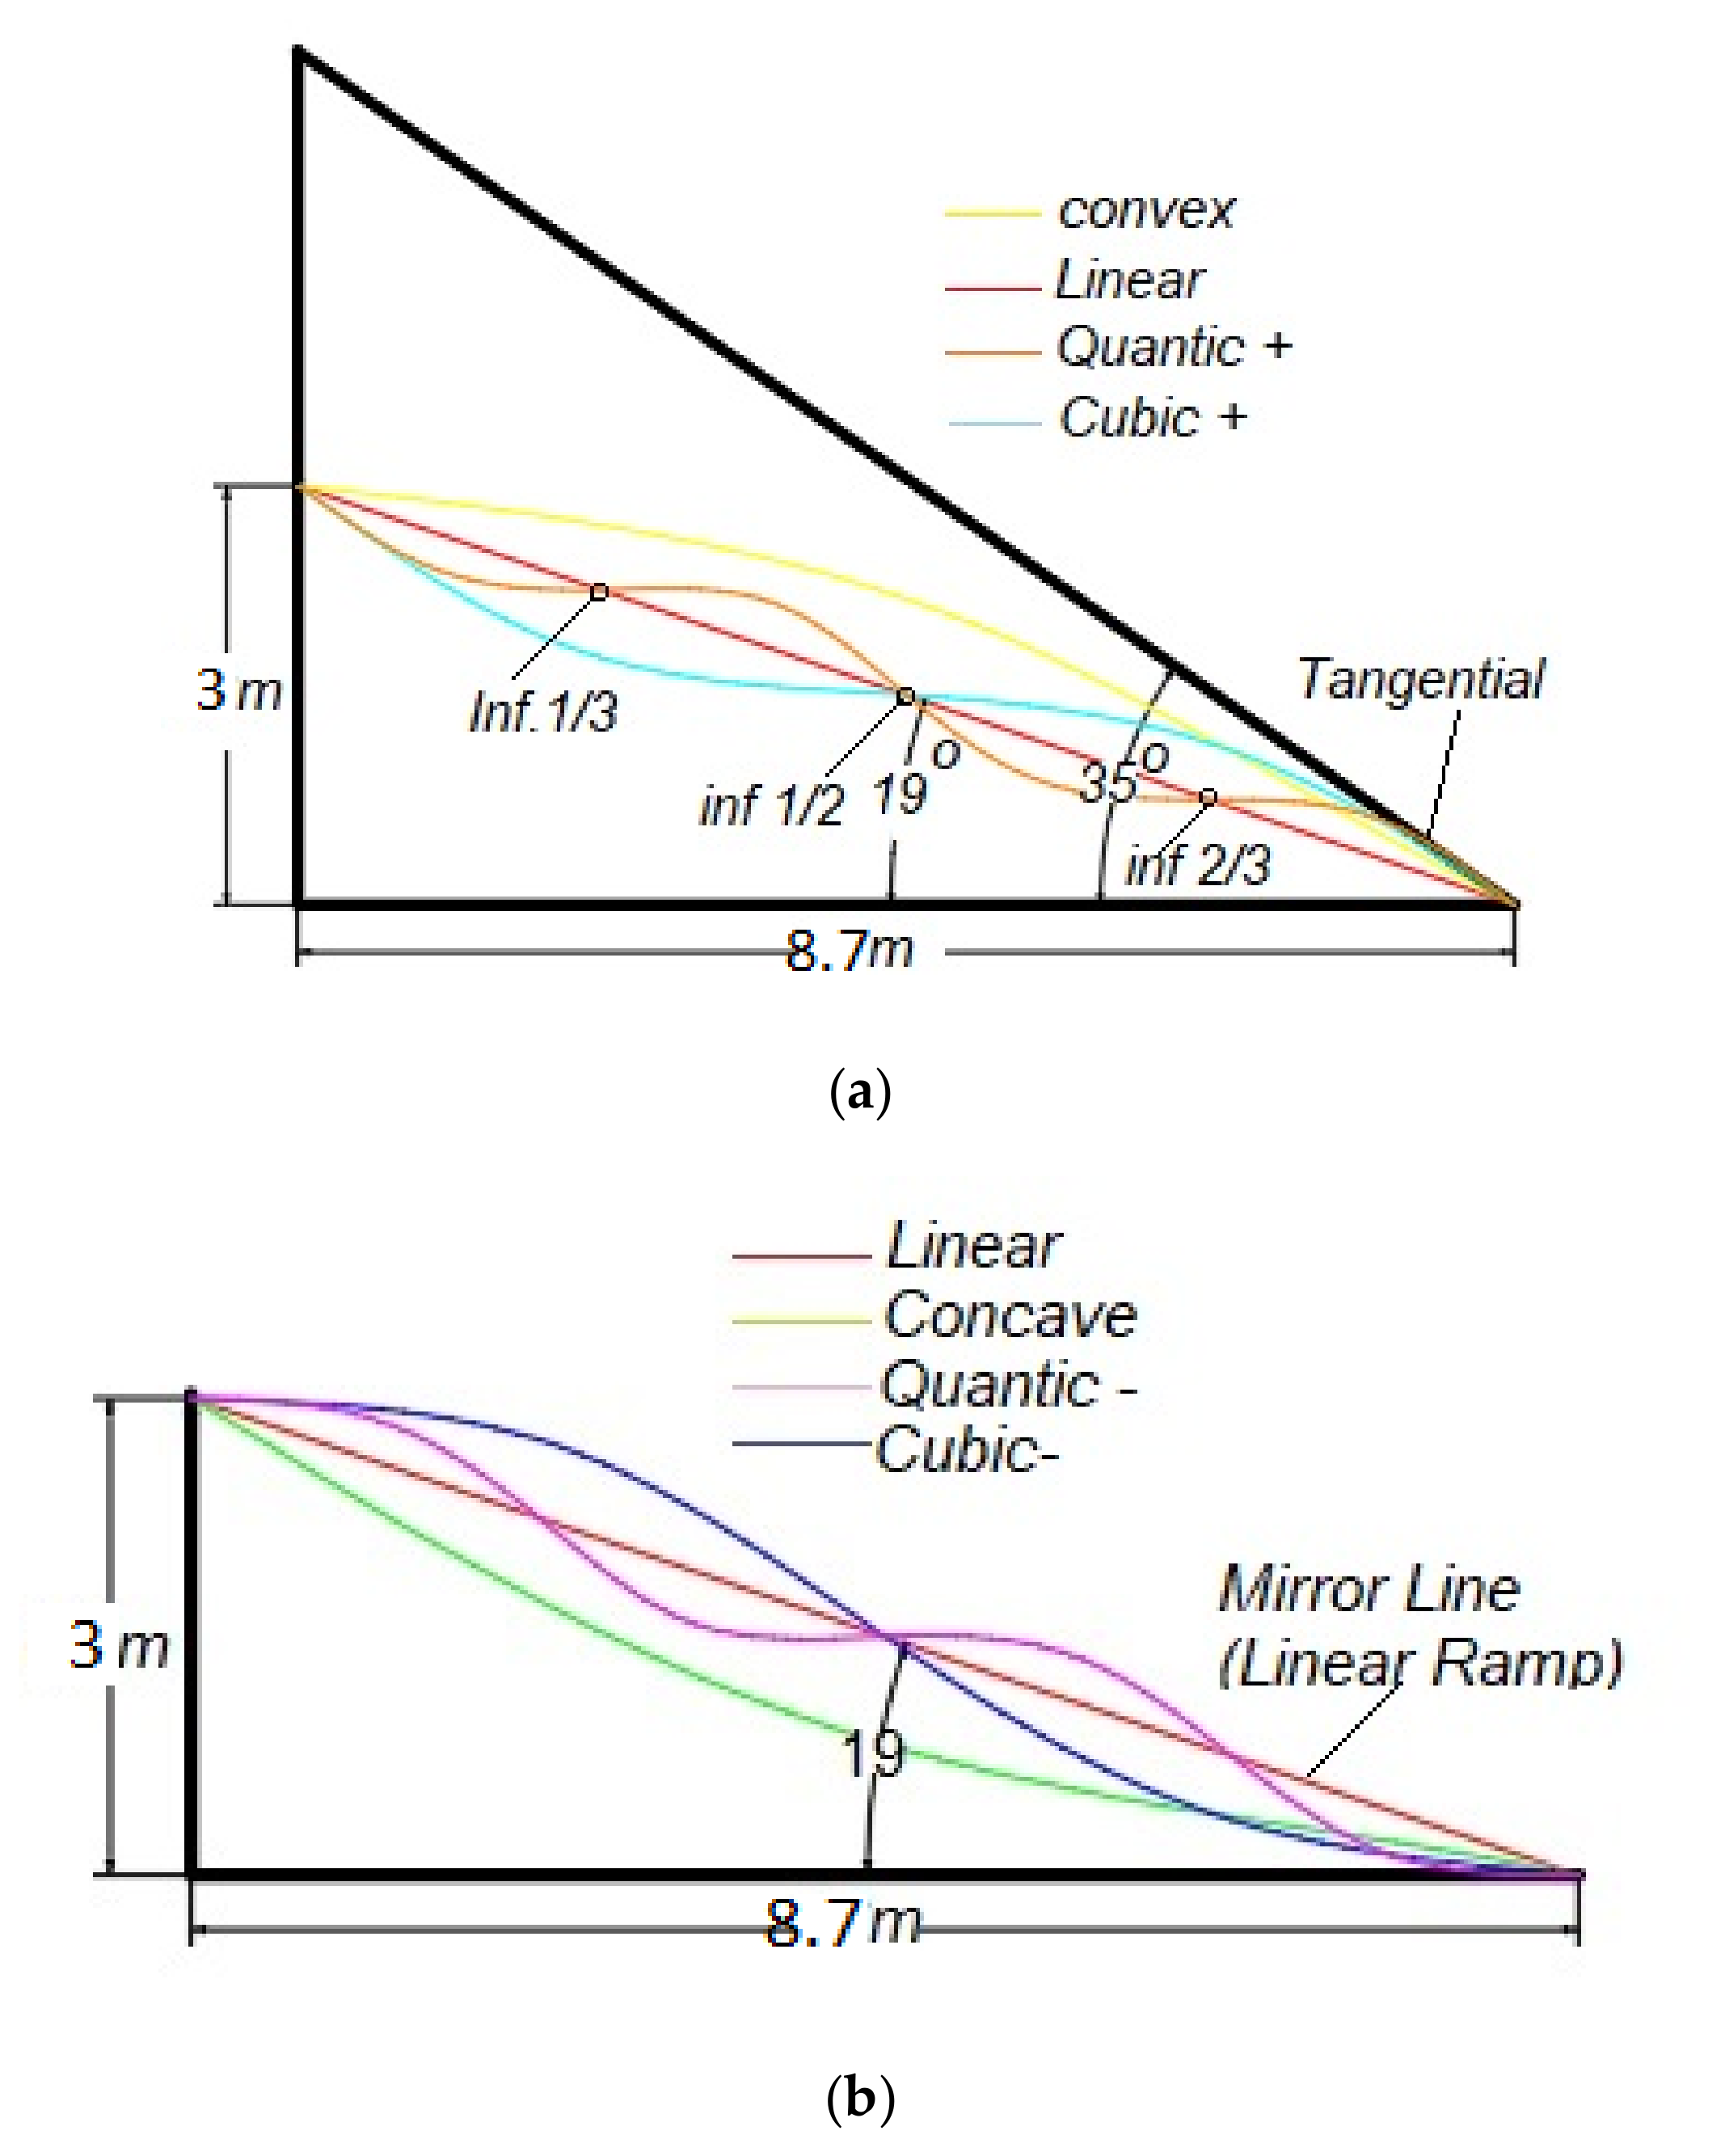
The physical art of the ramp shape geometries definition in polynomial equation and OBREC device are demonstrated in
Figure 4. The ratio between vertical (R) and horizontal (L) length geometries are based on local traditional breakwater parameters with constant ramp angle 19 degree. It was also suggested by Vicinanza et al., in 2012 [
21], who found that the optimal performance of overtopping discharge for SSG device is at 19 degree ramp angle. In the same statement he proposed to use a ramp angle of 35 degrees to avoid the possibility of wave breaking. It was also recommended by the findings in the literature on wave overtopping and run up studies [
24]. Thus, the similar reasons were used in this study, where a minimum of 19 degrees and maximum 35 degrees of linear ramp angle were applied for developing curvature of other ramp shapes (cubic-, quantic-, and convex) by using the tangential approach. The inflection point of cubic shapes is set at mid line (1/2) of linear shape, while, the inflection point of quantic shapes is at 1/3, 1/2, and 2/3 of linear shapes, respectively (
Figure 5a). In addition, an extension of the ramp shapes parameters study was proposed by designing a mirrored curve to the cubic-, quantic-, and convex shapes, which created cubic +, quantic +, and concave (
Figure 5b). The shapes in polynomial expressions are shown in
Table 2. It defines all seven ramp construction surface functions.
In this study, several wave parameters were used to see an overall effect of ramp shape into overtopping discharge. Four types of normal Malaysian wave characteristics were generated in both simulations and experiment. These waves represent average waves during non-monsoon season (R1), average waves in the year of 2013 (R2), average waves peak waves in the year of 2013 (R3), and average during monsoon season (R4). The corresponding wave parameters are given in
Table 3.
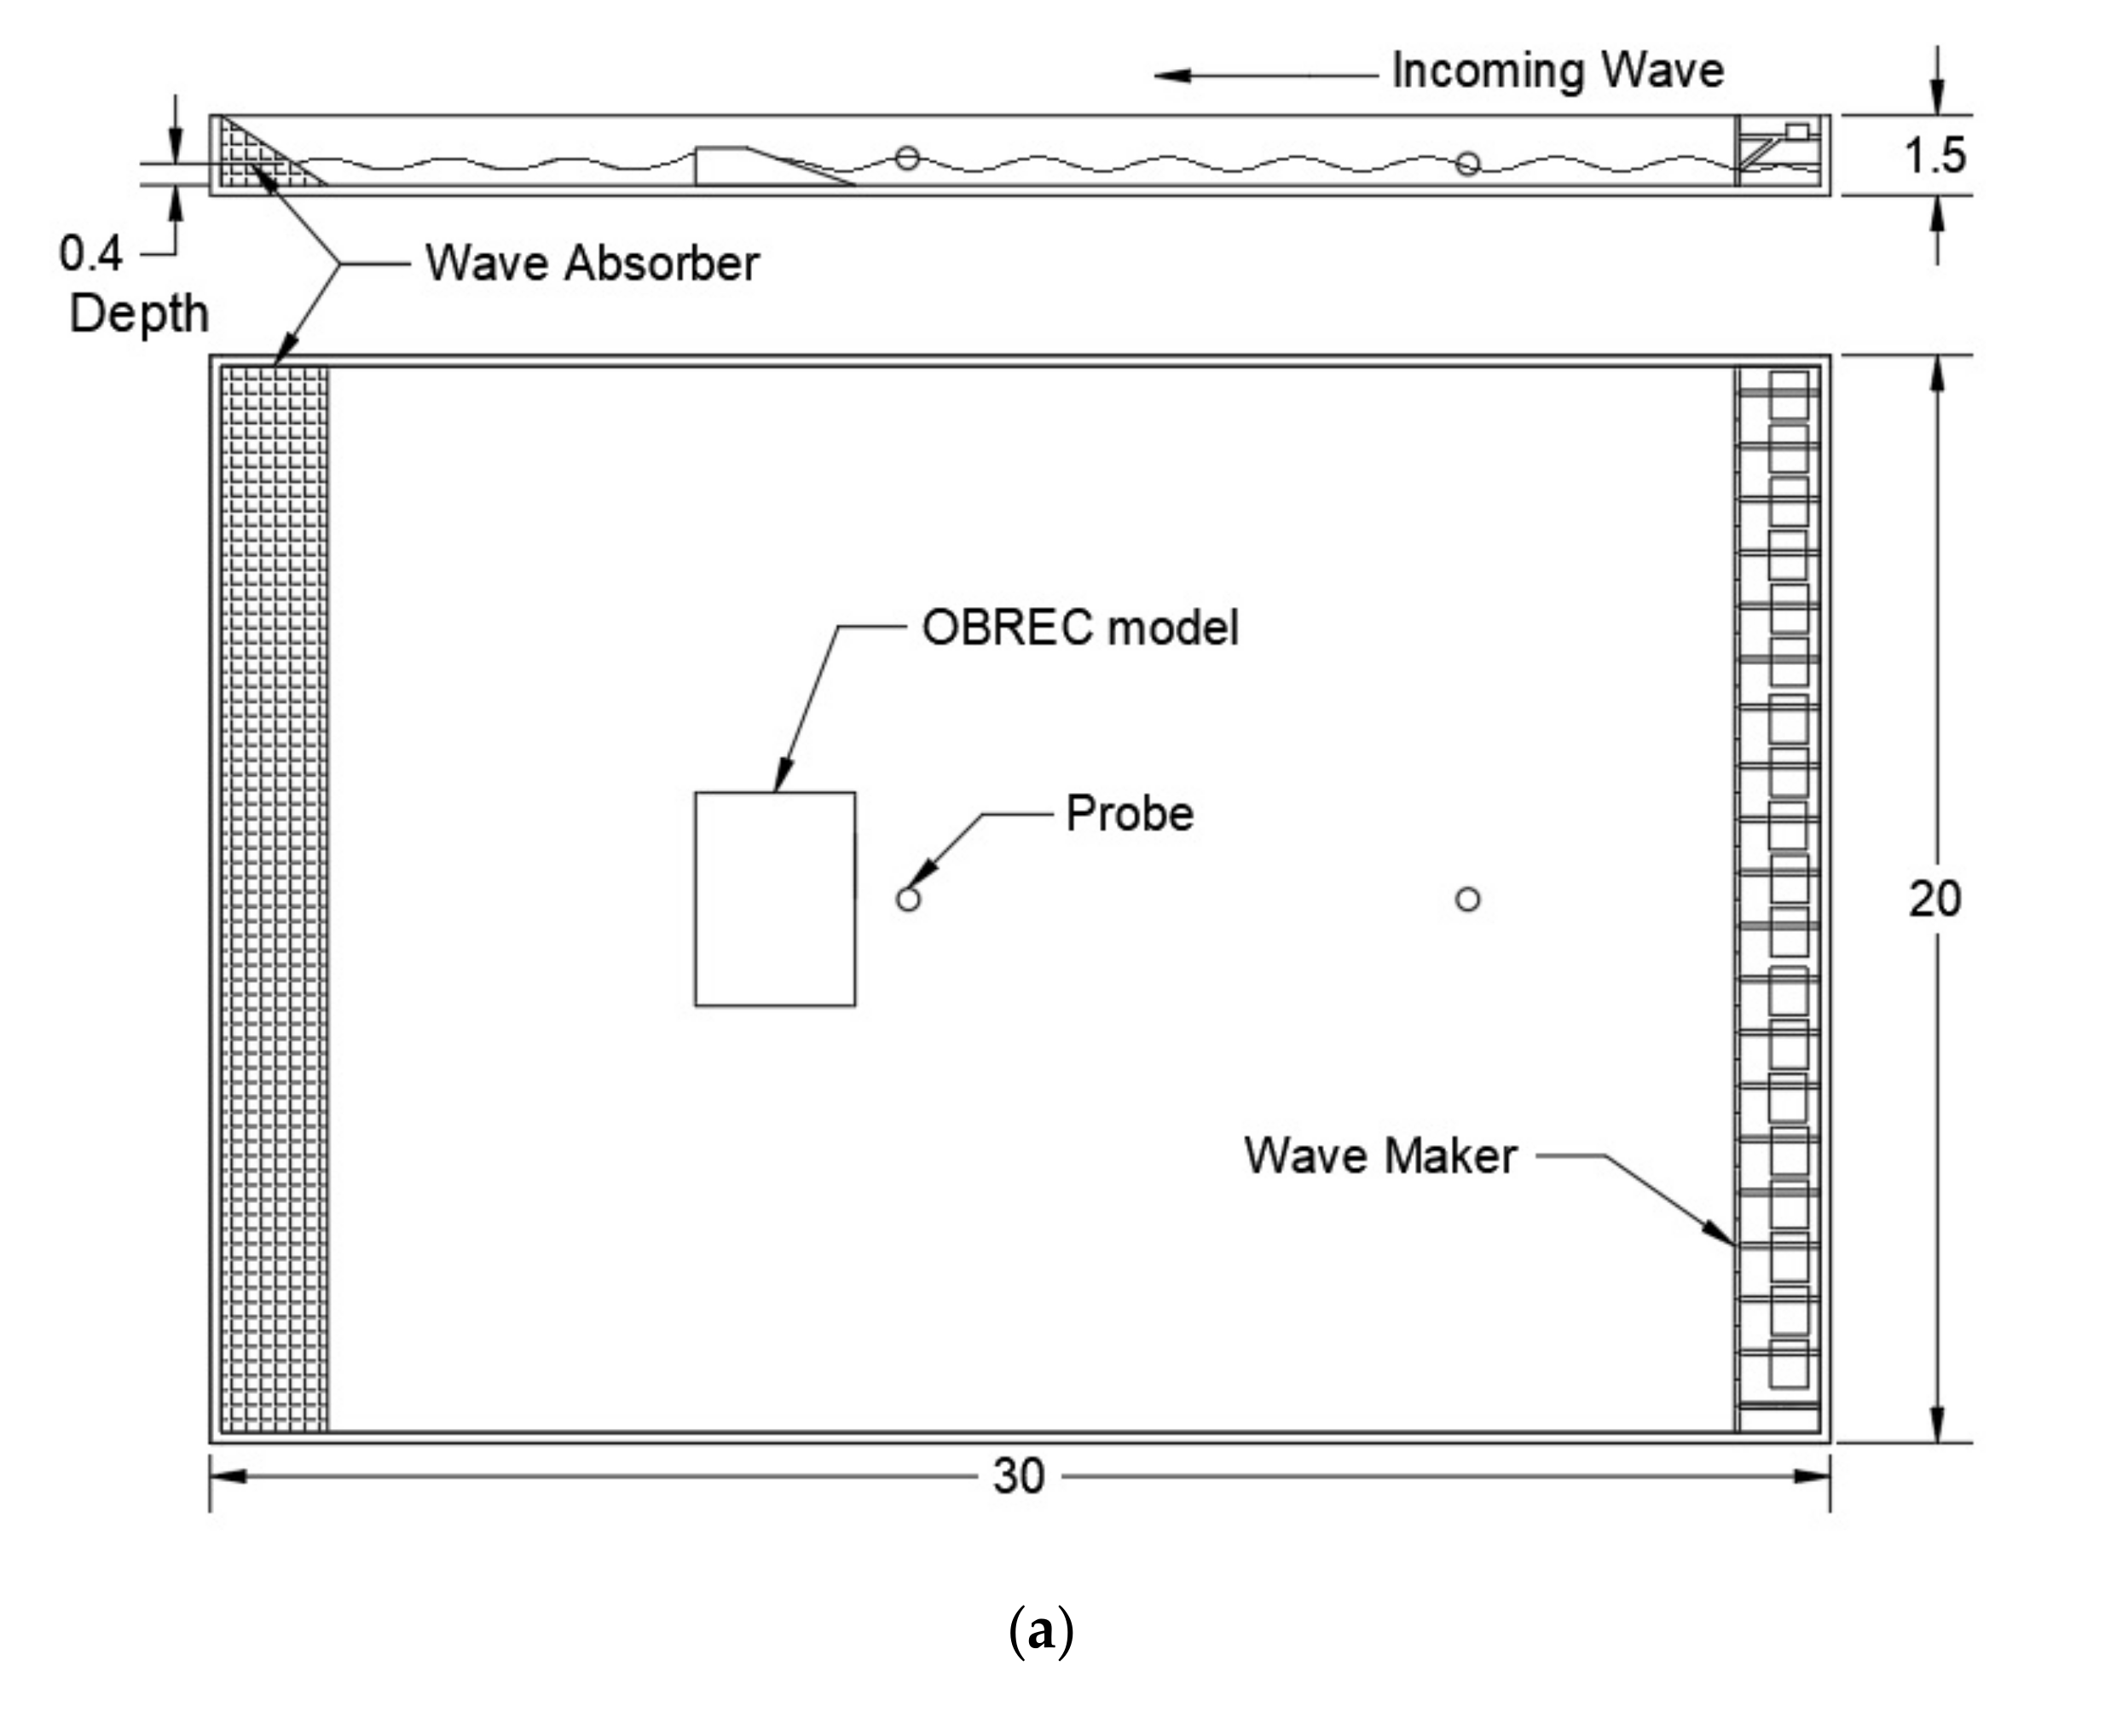
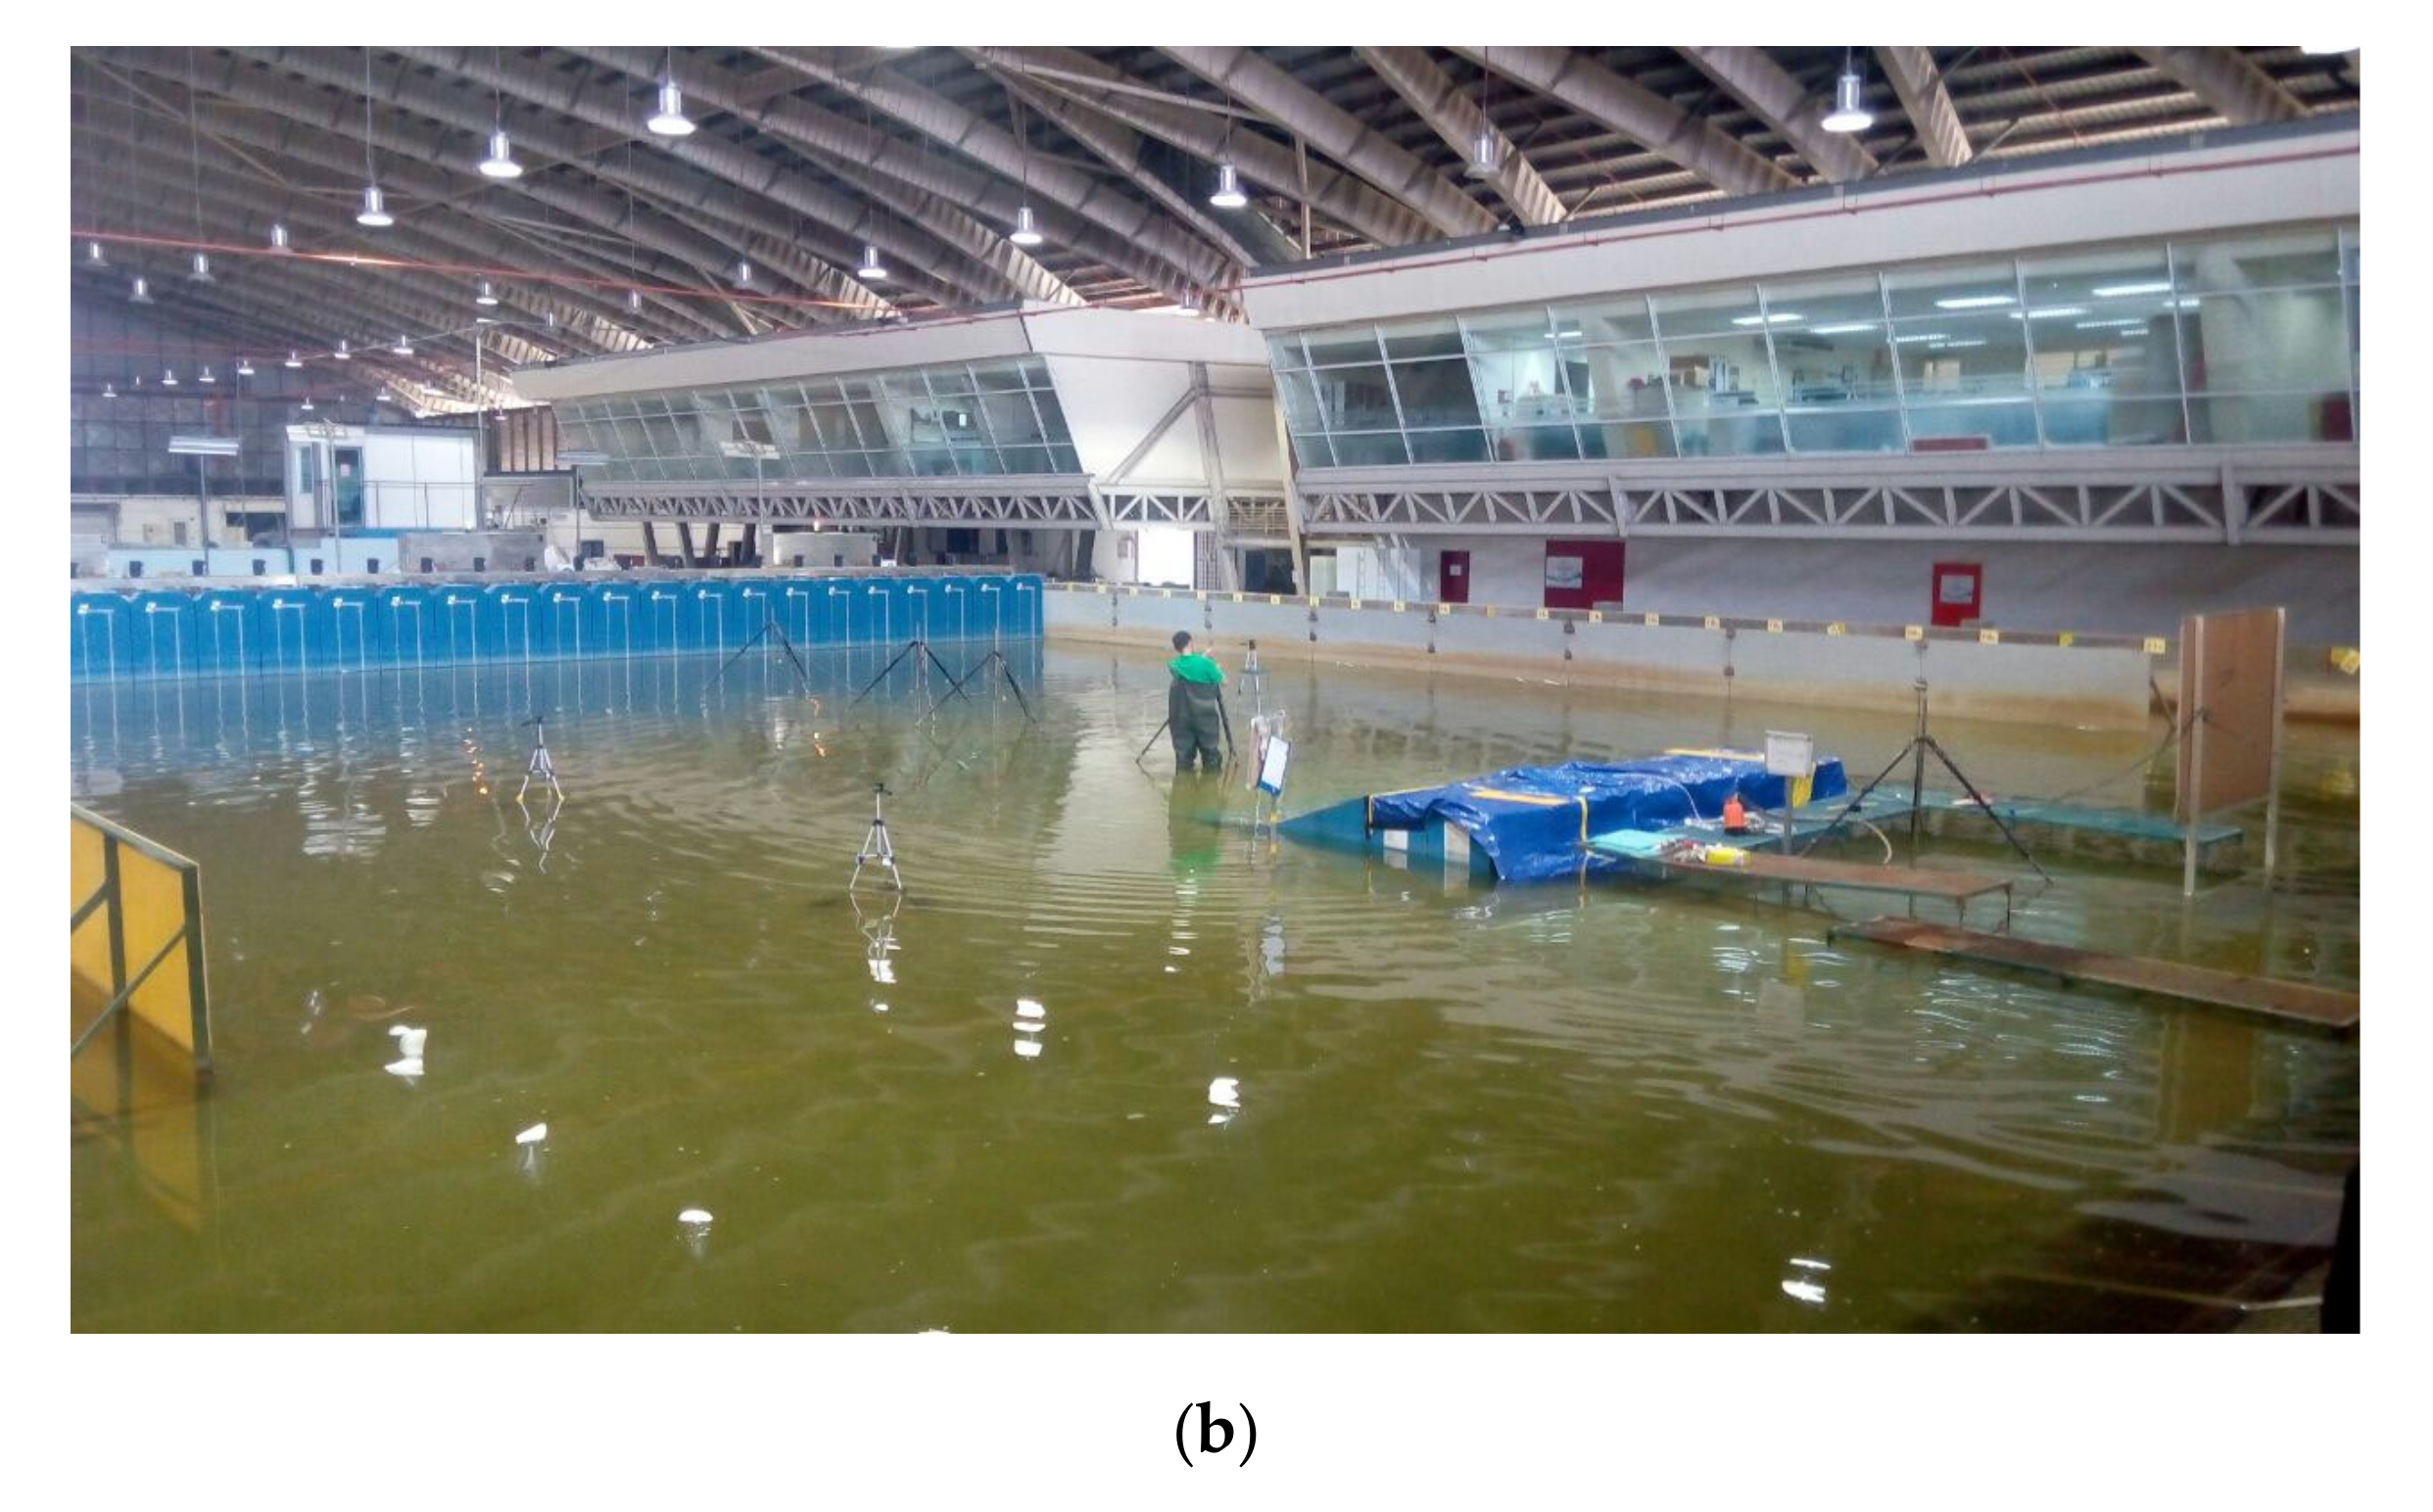
2.1. Experimental Setup
The experiments were carried out at Port and Harbor 3D wave basin at National Hydraulic Research Institute Malaysia (NAHRIM) using 1:15 length scale (Froude scaling) compared to the real prototype parameters. The basin’s dimension is approximately 30 m long, 30 m wide, and 1.5 m deep. The basin was equipped with 30 paddles as wave maker and used a passive wave absorber to avoid the reflection of wave. The basin configuration in 2D top, 2D side, and actual view are shown in
Figure 6a,b.
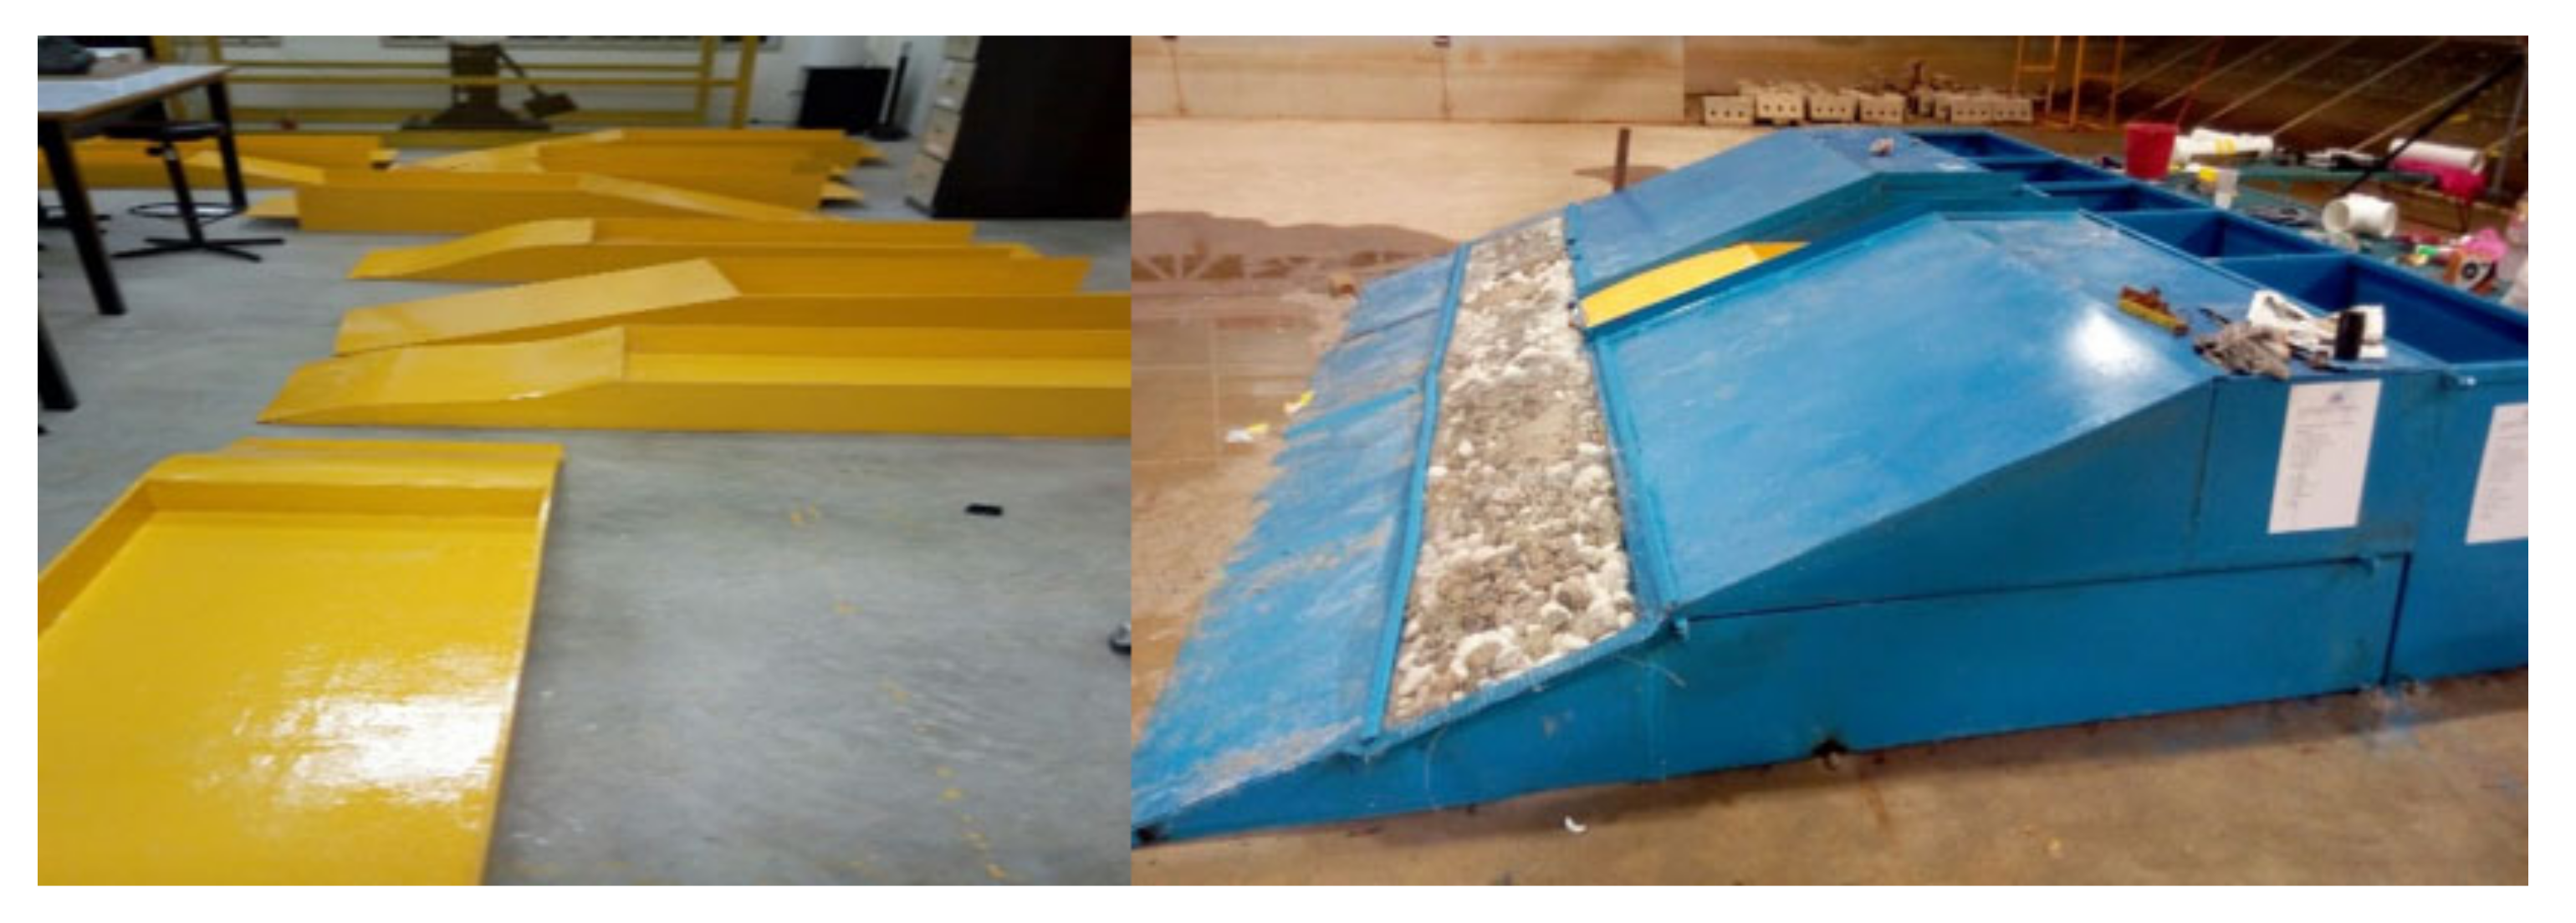
The main structure and ramp slot models (
Figure 3a,b) were designed using computer aided design (CAD) with scale 1:15 and estimated to be 4 (wide) × 4.1 (length) × 0.7 m (height). The slot ramp models were cut using a CNC machine with the precision level adjustable up to ± 1 mm. An image of finished cutting and assembled model into the main structure is shown in
Figure 7.
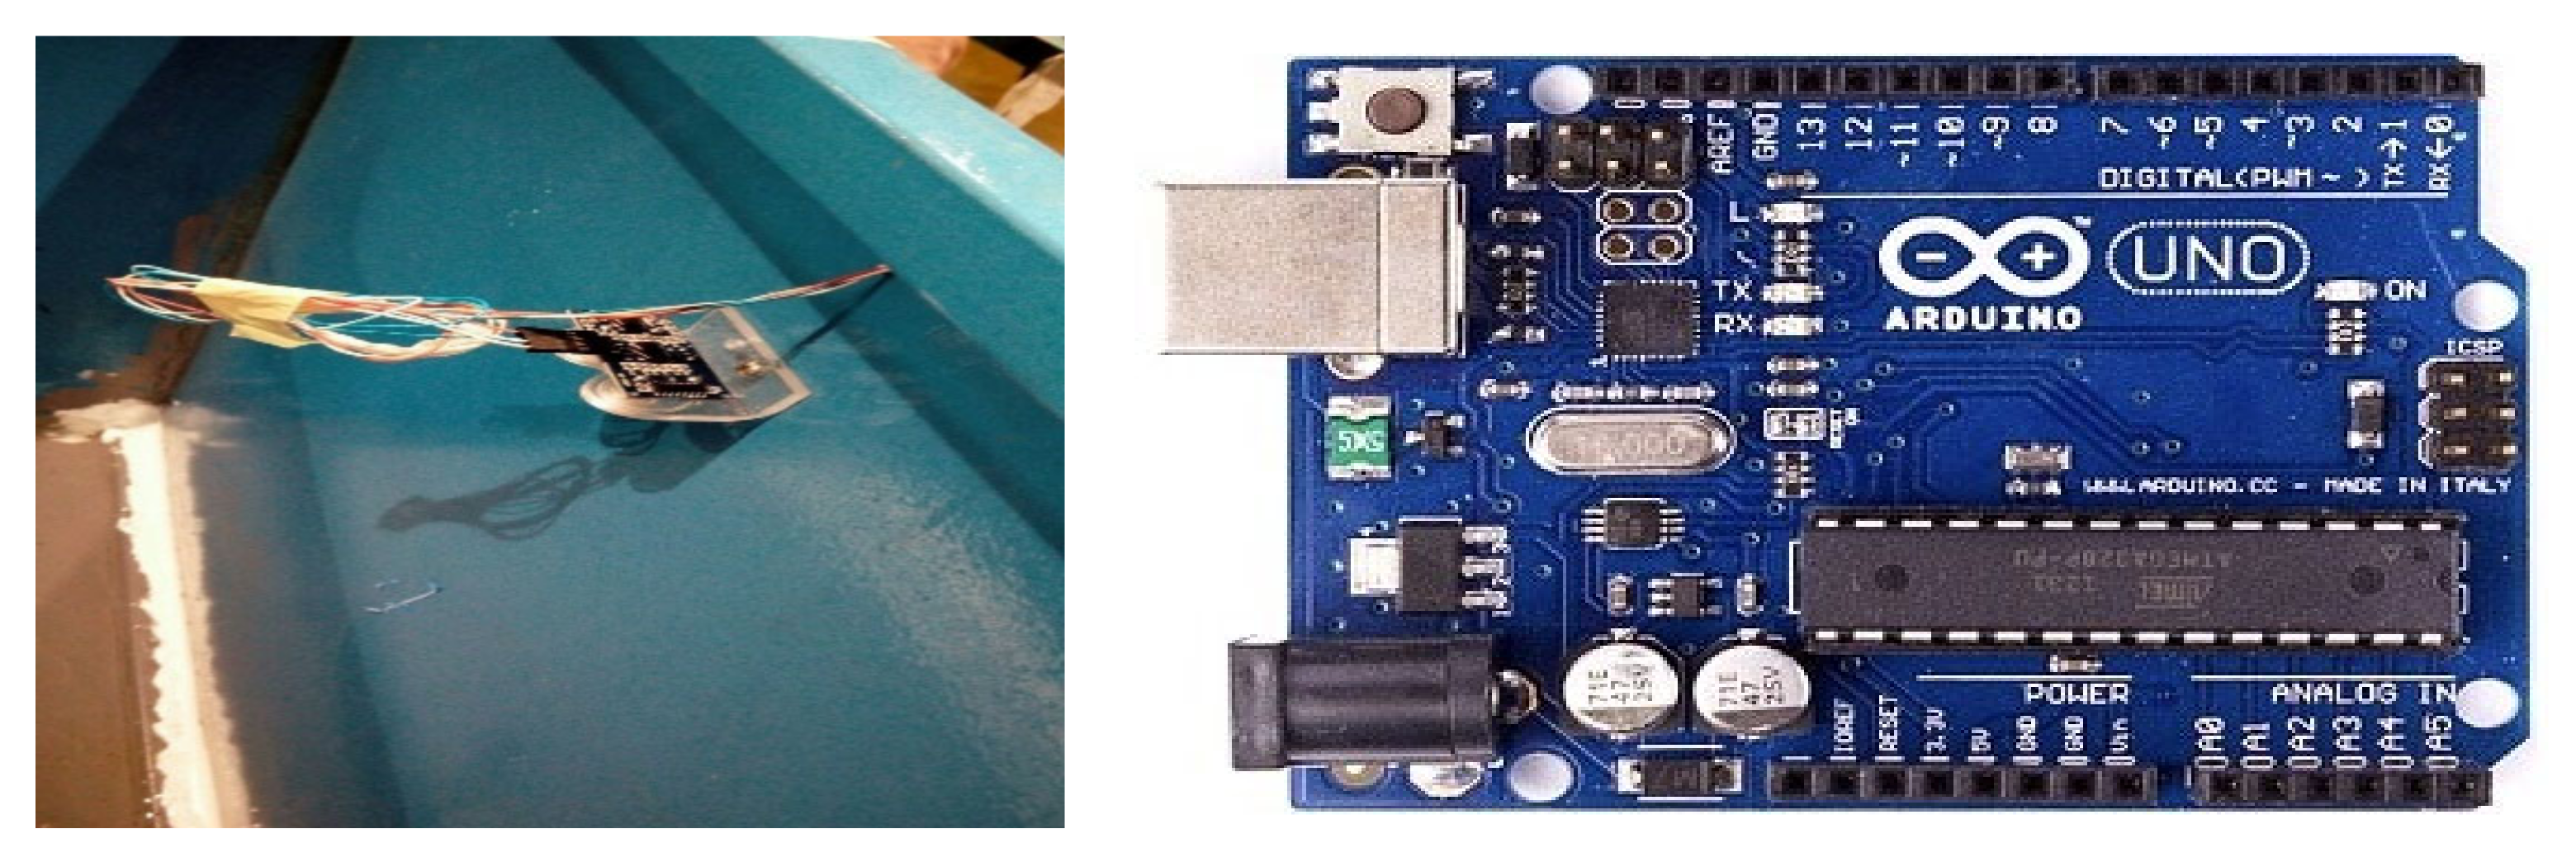
In addition, the measurements of overtopping volume in the reservoir are quantified by water discharge level (h) recorded using an Arduino ultrasonic sensor (HC-SR04) and data logger (
Figure 8). The changes of water level could be precisely detected up to 1 mm height, and the data logger was set up to record water level changes in 0.1 s.
2.2. Simulation Setup
The OBREC models were also tested and investigated through numerical Computer Fluid Dynamic (CFD) modelling method using FLOW 3D 10.1 software. The software was equipped with features to solve fluid problems using Reynolds Averaging of the Navier–Stokes (RANS) equations combined with True Volume of Fluid (TruVOF) and Fraction Area/Volume Obstacle Representation (FAVOR) for orthogonal multiblock meshes methods [
25]. Meanwhile, to discretize each component and cell in the simulation, the software used general acceptance equation from Navier–Stokes and Continuity as shown in Equations (1) to (3).
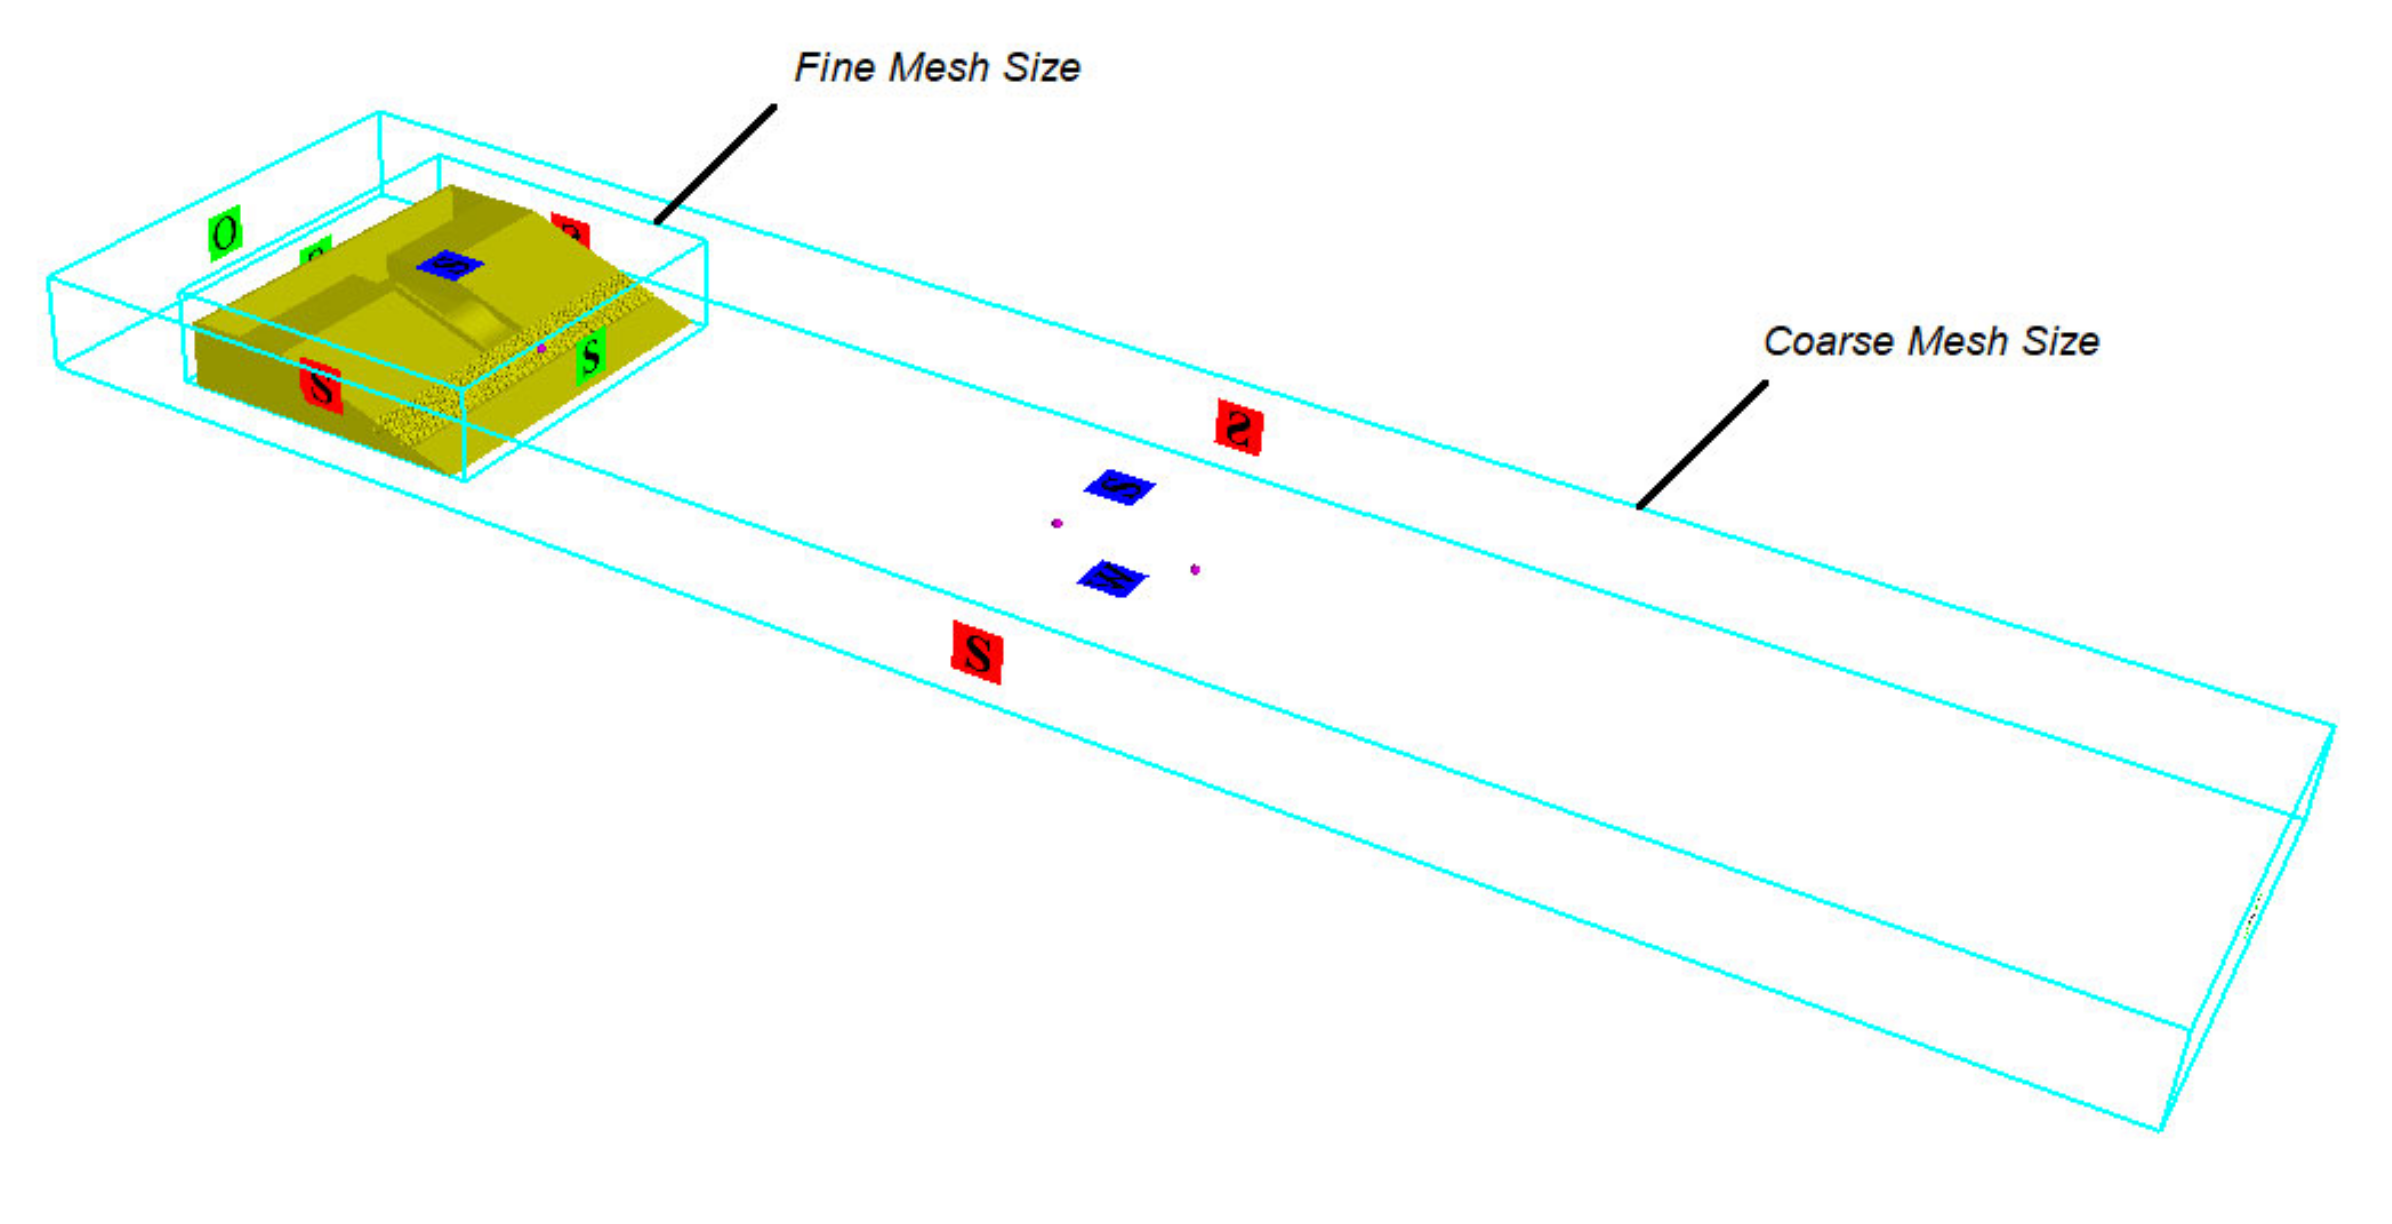
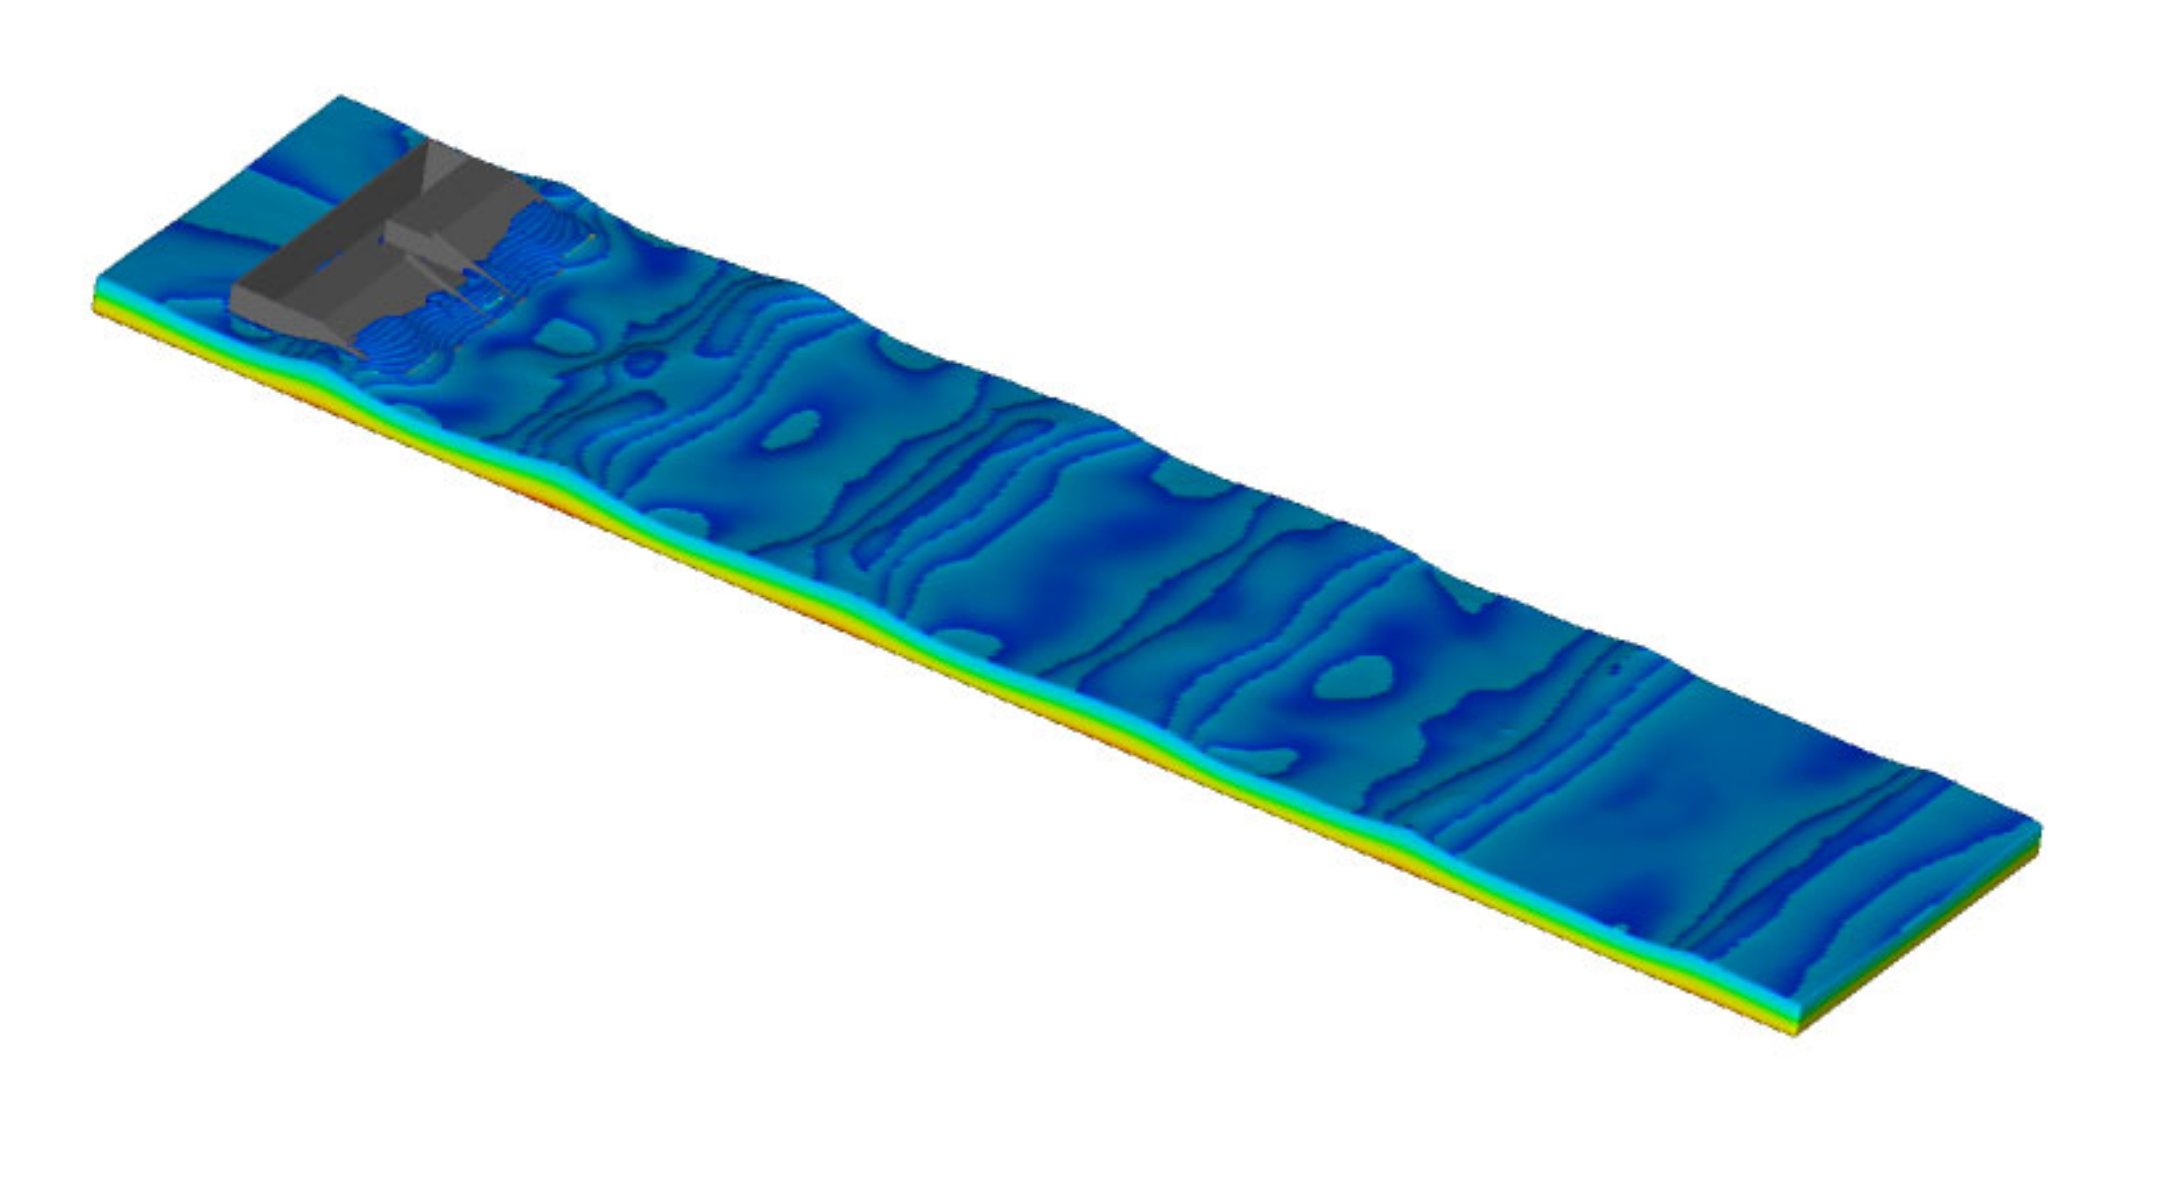
The OBREC model with identical scale as in the experiment was used in the simulation to ensure similarity to the geometrical parameter’s comparison. This model was constructed using AutoCAD software and uploaded into FLOW 3D workspace. The boundary domain was made up smaller than experiment basin size to reduce computation time and space; with 30 m in the Y direction, 5 m in the X direction, and 2 m in the Z direction (see
Figure 9 and
Figure 10). Two block mesh sizes were used to divide sensitive and local areas; fine mesh 0.02 m and coarse mesh size 0.04 m. This provided a sum of up to 4.48 million total cells. The selection of this mesh size is based on a mesh convergent study conducted in previous research [
26]. This simulation was performed for 60 s with a time increment of 0.01 s and using ReNormalization Group (RNG) turbulence closure method. The numerical simulations were carried out using several machines built with Processor Type Intel (R) Core (TM) i7 CPU, 2.67 GHz with the RAM capacity 16 Gb.
3. Results and Discussion
The result of ramp shape performance will be comprehensively explained in this section by comparing the total amount of water collected in the reservoir. The volume was estimated using multiplication between reservoir area and water discharge level (
h). Once the water discharge level inside the reservoir is known, it is possible to estimate the flow rate (
Qreservoir) by dividing to the time domain as shown in Equation (4);
where ∆
V is volume variation in the time domain ∆
t, A is the cross-sectional area of the reservoir, and ∆
h is water discharge level in the reservoir. The calculation of
Qreservoir is taken from the results between the 30th and 50th s, which is considered stable for analysis as shown in
Figure 11.
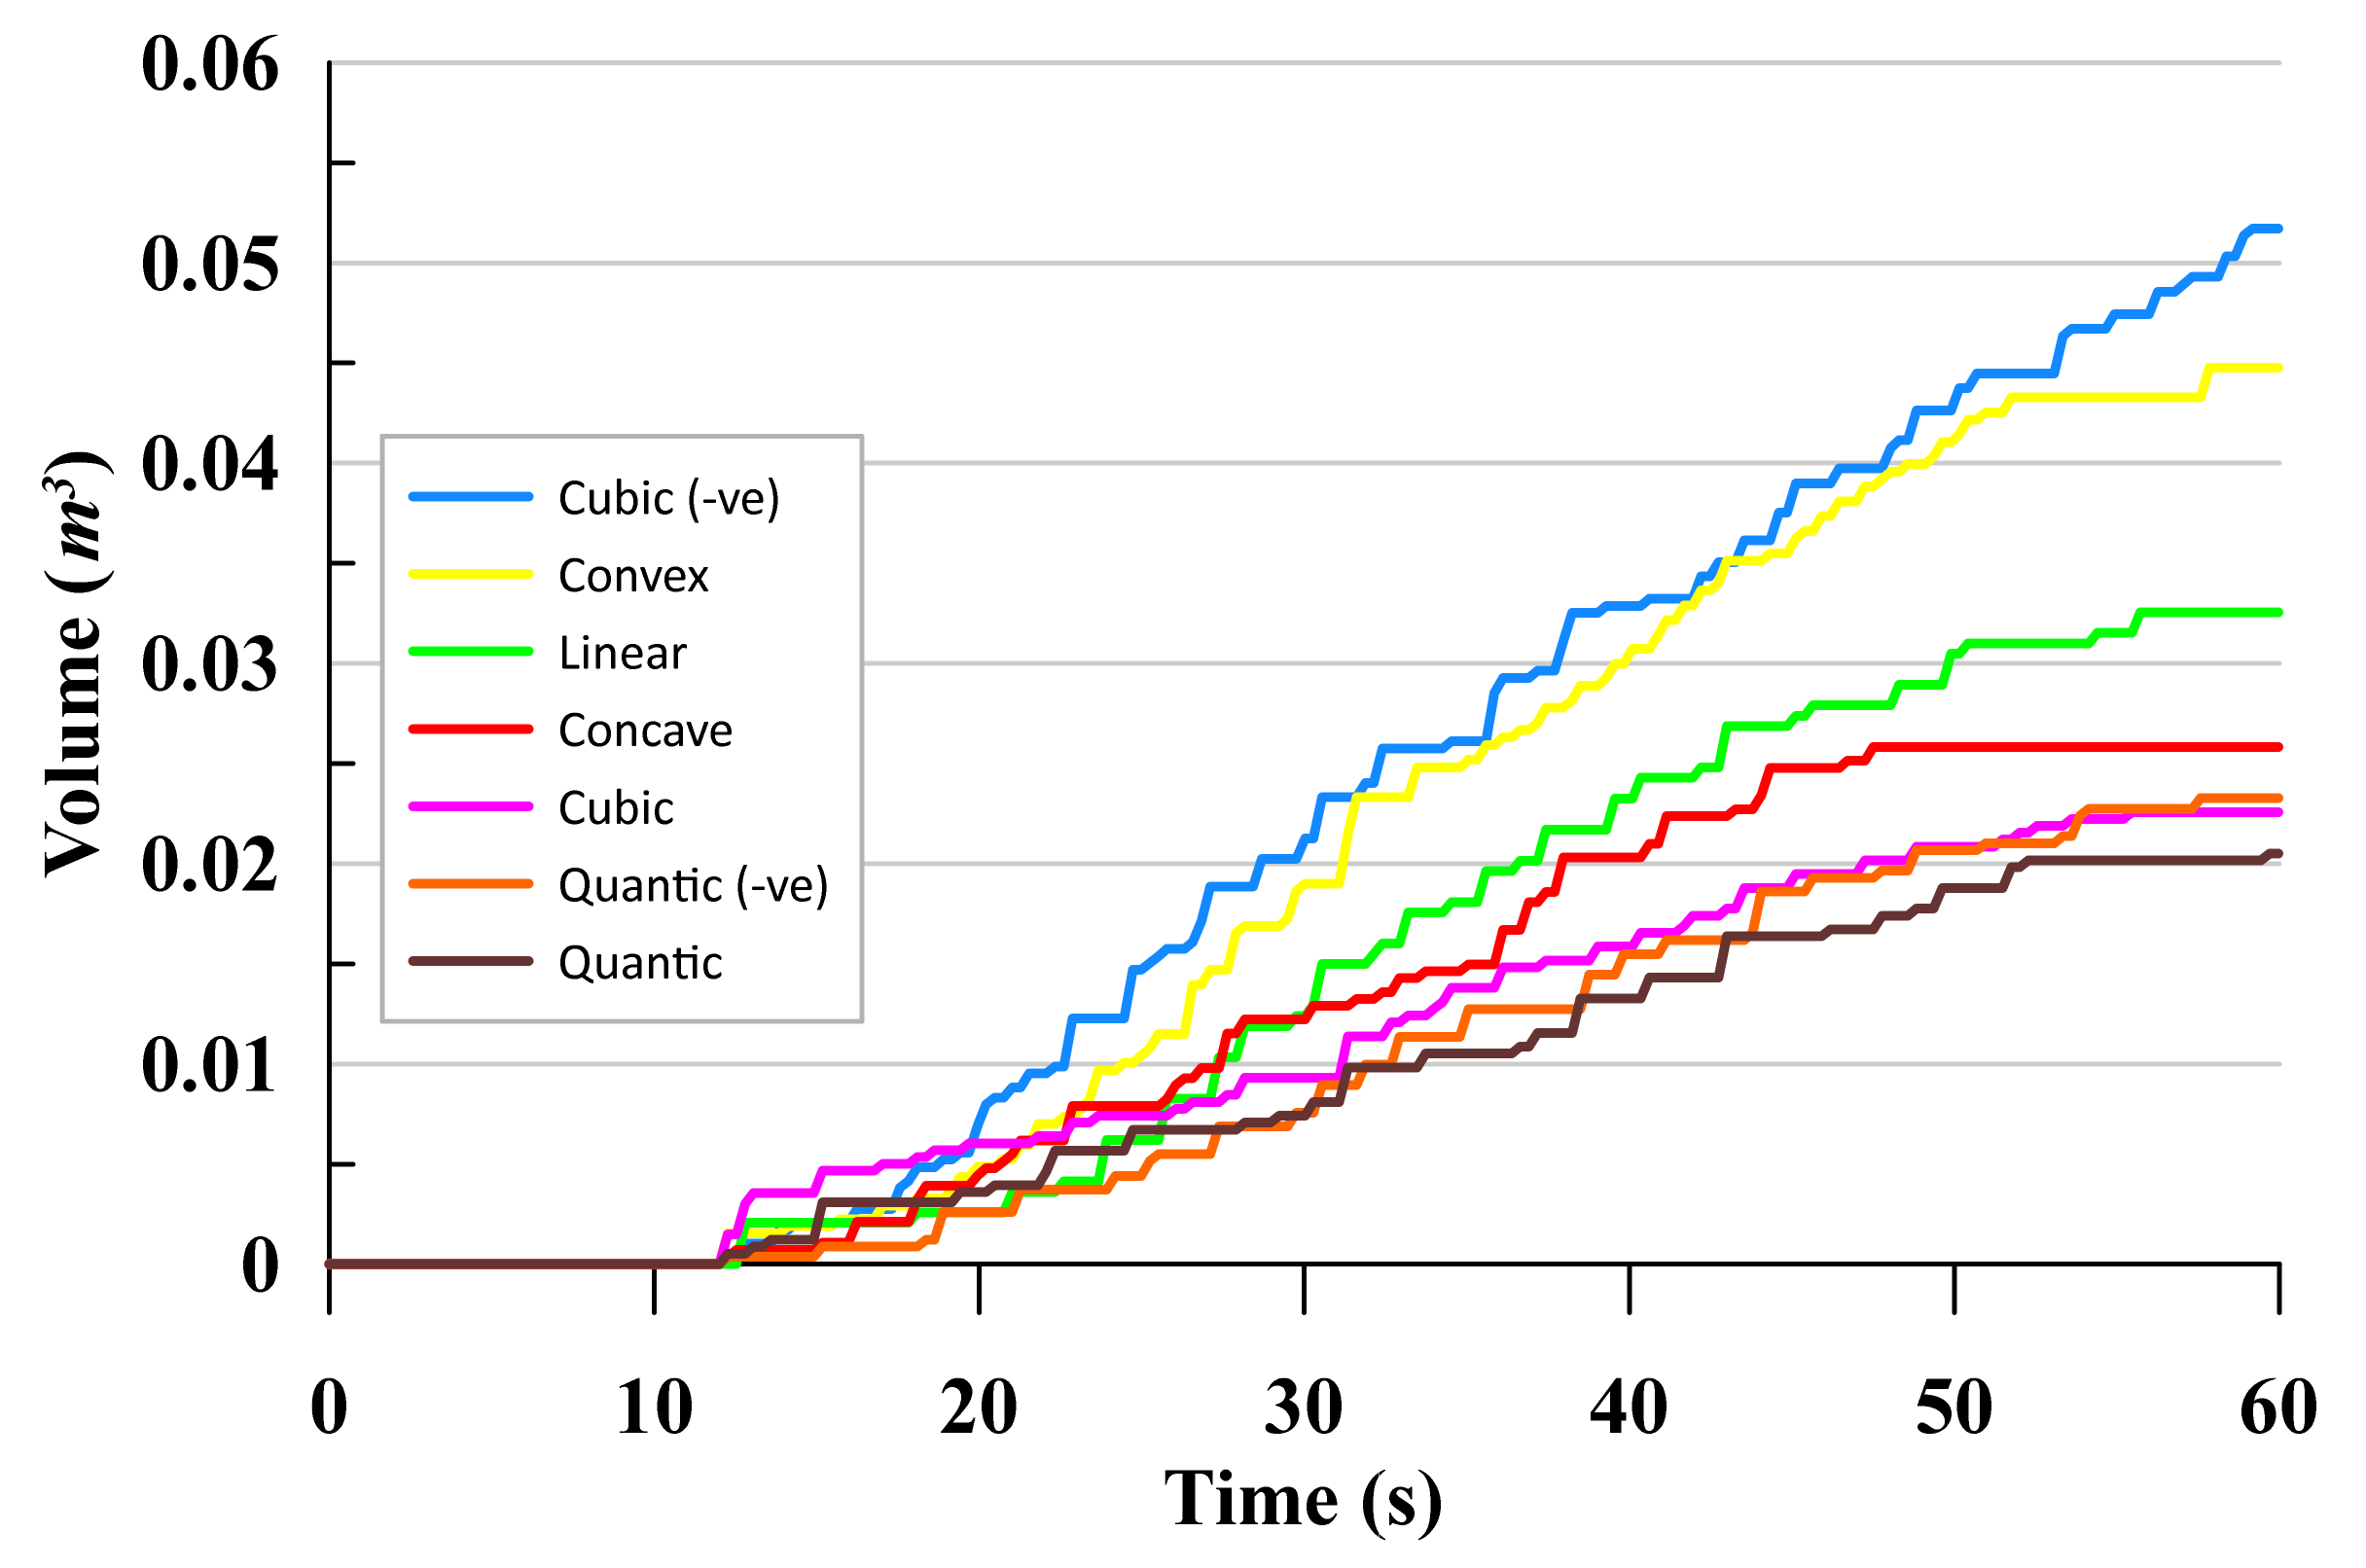
The comparison of cumulated volumes in the reservoir from the various ramp shape models against time series are shown in
Figure 12. The models were exposed to average yearly wave in Malaysia (R2—see
Table 3). In general water started to enter the reservoir at
t ≈ 12 which shows that the waves began to stabilize and interact with device structure. The water level then increased gradually in the reservoir as water overtop over the crest. There are few findings that could be highlighted from this part. First, rough step trend graphs are presented by all shapes. The increasing of volume inside the reservoir happened at the overtopping moment while no water is taken if no overtopping occurs, this will create a step trend graph as shown in
Figure 12. However, the steps are inconsistence with the same volume intake even though the input waveform is at a regular condition. This pattern is consistent with the result obtained from experimental study by Kofoed [
20], Vicinanza et al. [
8], and Meer et al. [
27] who state that the instability on the overtopping result occurred due to unsteady wave data input as a result of the presence of destructive and constructive wave, loss of energy, and reflection process.
Secondly,
Figure 12 also indicates that the cubic ramp shape has recorded the highest overtopping discharge compared to other shapes. Total overtopping discharge volume reaches up to 0.05 m
3 for 60 s running time. This discovery is believed to be due to the accumulation of wave run-up energy, which provided a large platform for gathering the volume of water and, therefore, indirectly increasing the mass momentum of the run-up wave above the ramp shape as expected by European group manual assessment [
18], who gave the same reason for the effect of curved dike ramp on wave overtopping.
In addition, the quantic shapes gave a lower overtopping rate compared to other shapes and probably due to the high resistance or reflection of wave run up. Quantic shapes are designed with four curves and this will create more resistance as run up water needs to sweep up along the ramp length. It is consistent with the latest summarization by Di Lauro et al. [
28] who state that the ramp length will increase the reflection coefficient of the OBREC device.
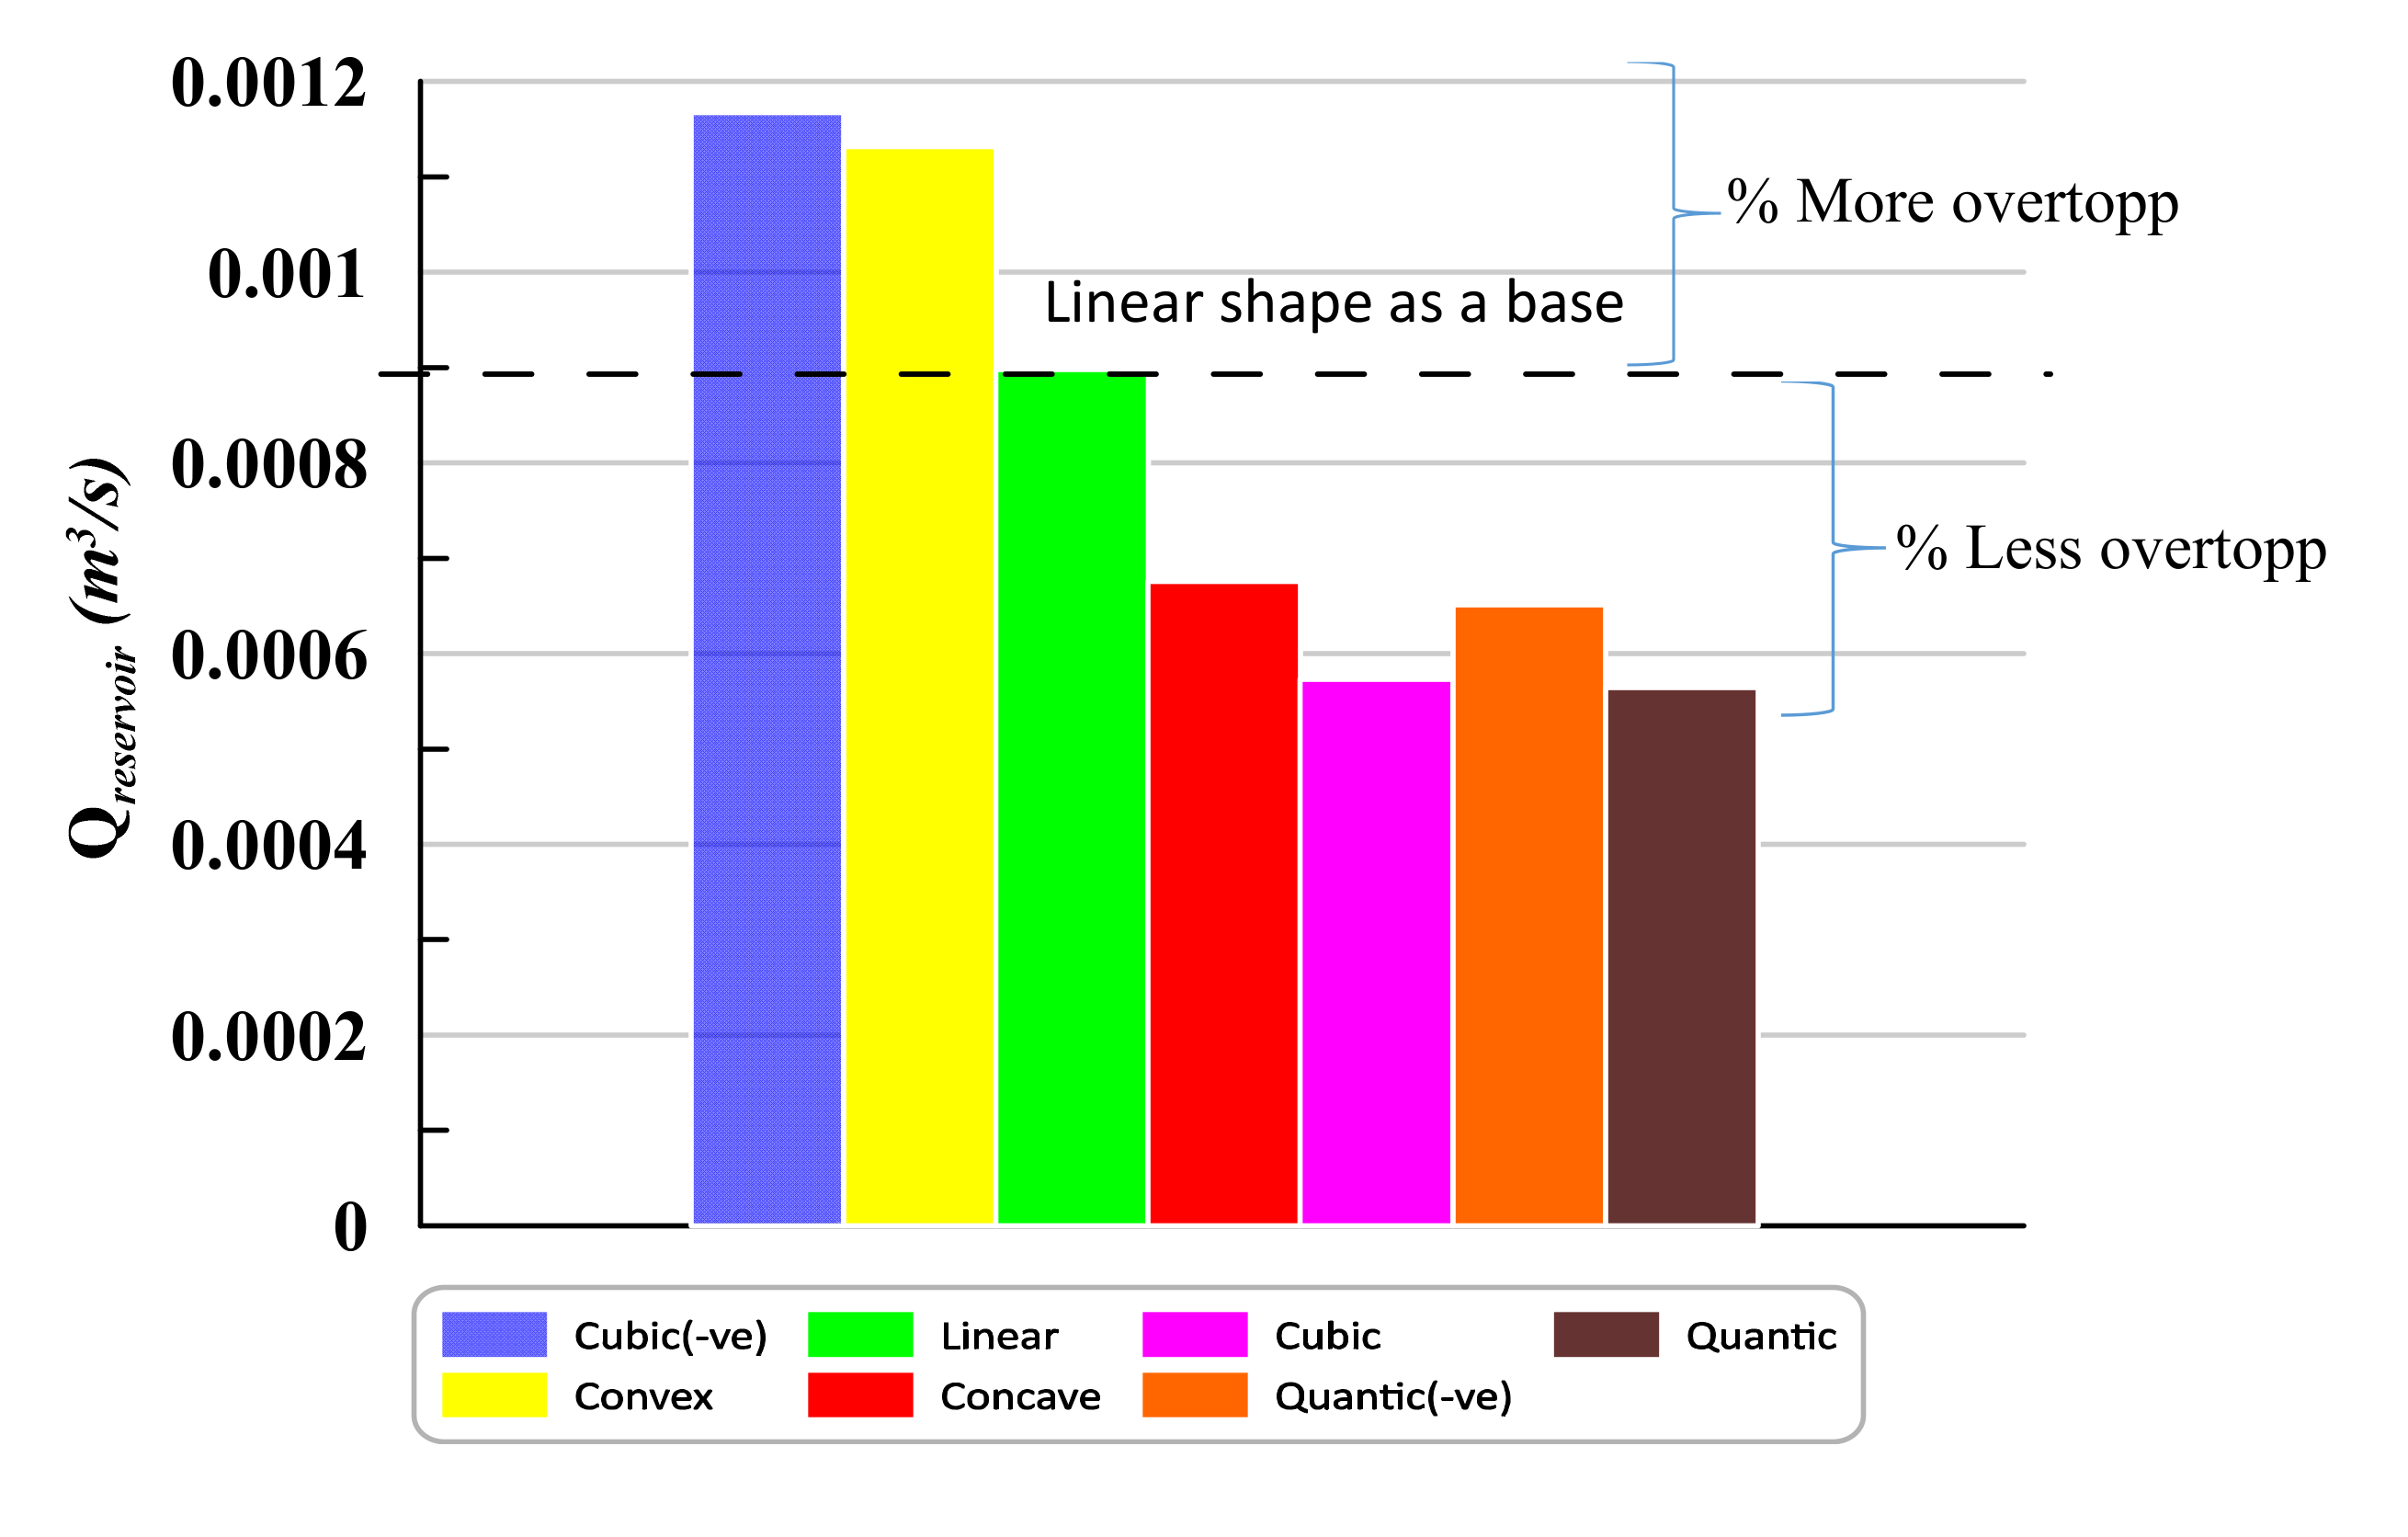
Figure 13 shows an average and percentage of overtopping discharge rate in time series for R2 condition. It shows the average overtopping rate for cubic (-ve) shape is 30% higher than linear shape. Meanwhile, the convex shape took second place with 26%, but a reduction of 25% is identified on concave shape, and about 35% on Cubic, Quantic, Quantic (-ve) shapes, respectively. However, the findings of the current study do not support the previous research by Contestable et al. in 2017 [
13] who expected a reduction around 20% in overtopping discharge for OBREC with the curved configuration compared to the flat configuration. It is believed that the differences in wave and geometry parameters are the main possible explanations for these results. Although these results differ from the founder of OBREC group studies, they are consistent with those other studies such as Kofoed et al. [
29] who have identified that the ability of curved shape is vastly superior than flat shape for WD device and CFD Openfoam study by Barbosa et al. in 2019 [
17], who also indicate that curved shape has better performance compared to the flat ramp. Thus, it is indicated that the effect of ramp shape is very important on overtopping behavior in OBREC structure, and further fundamental investigations are required.
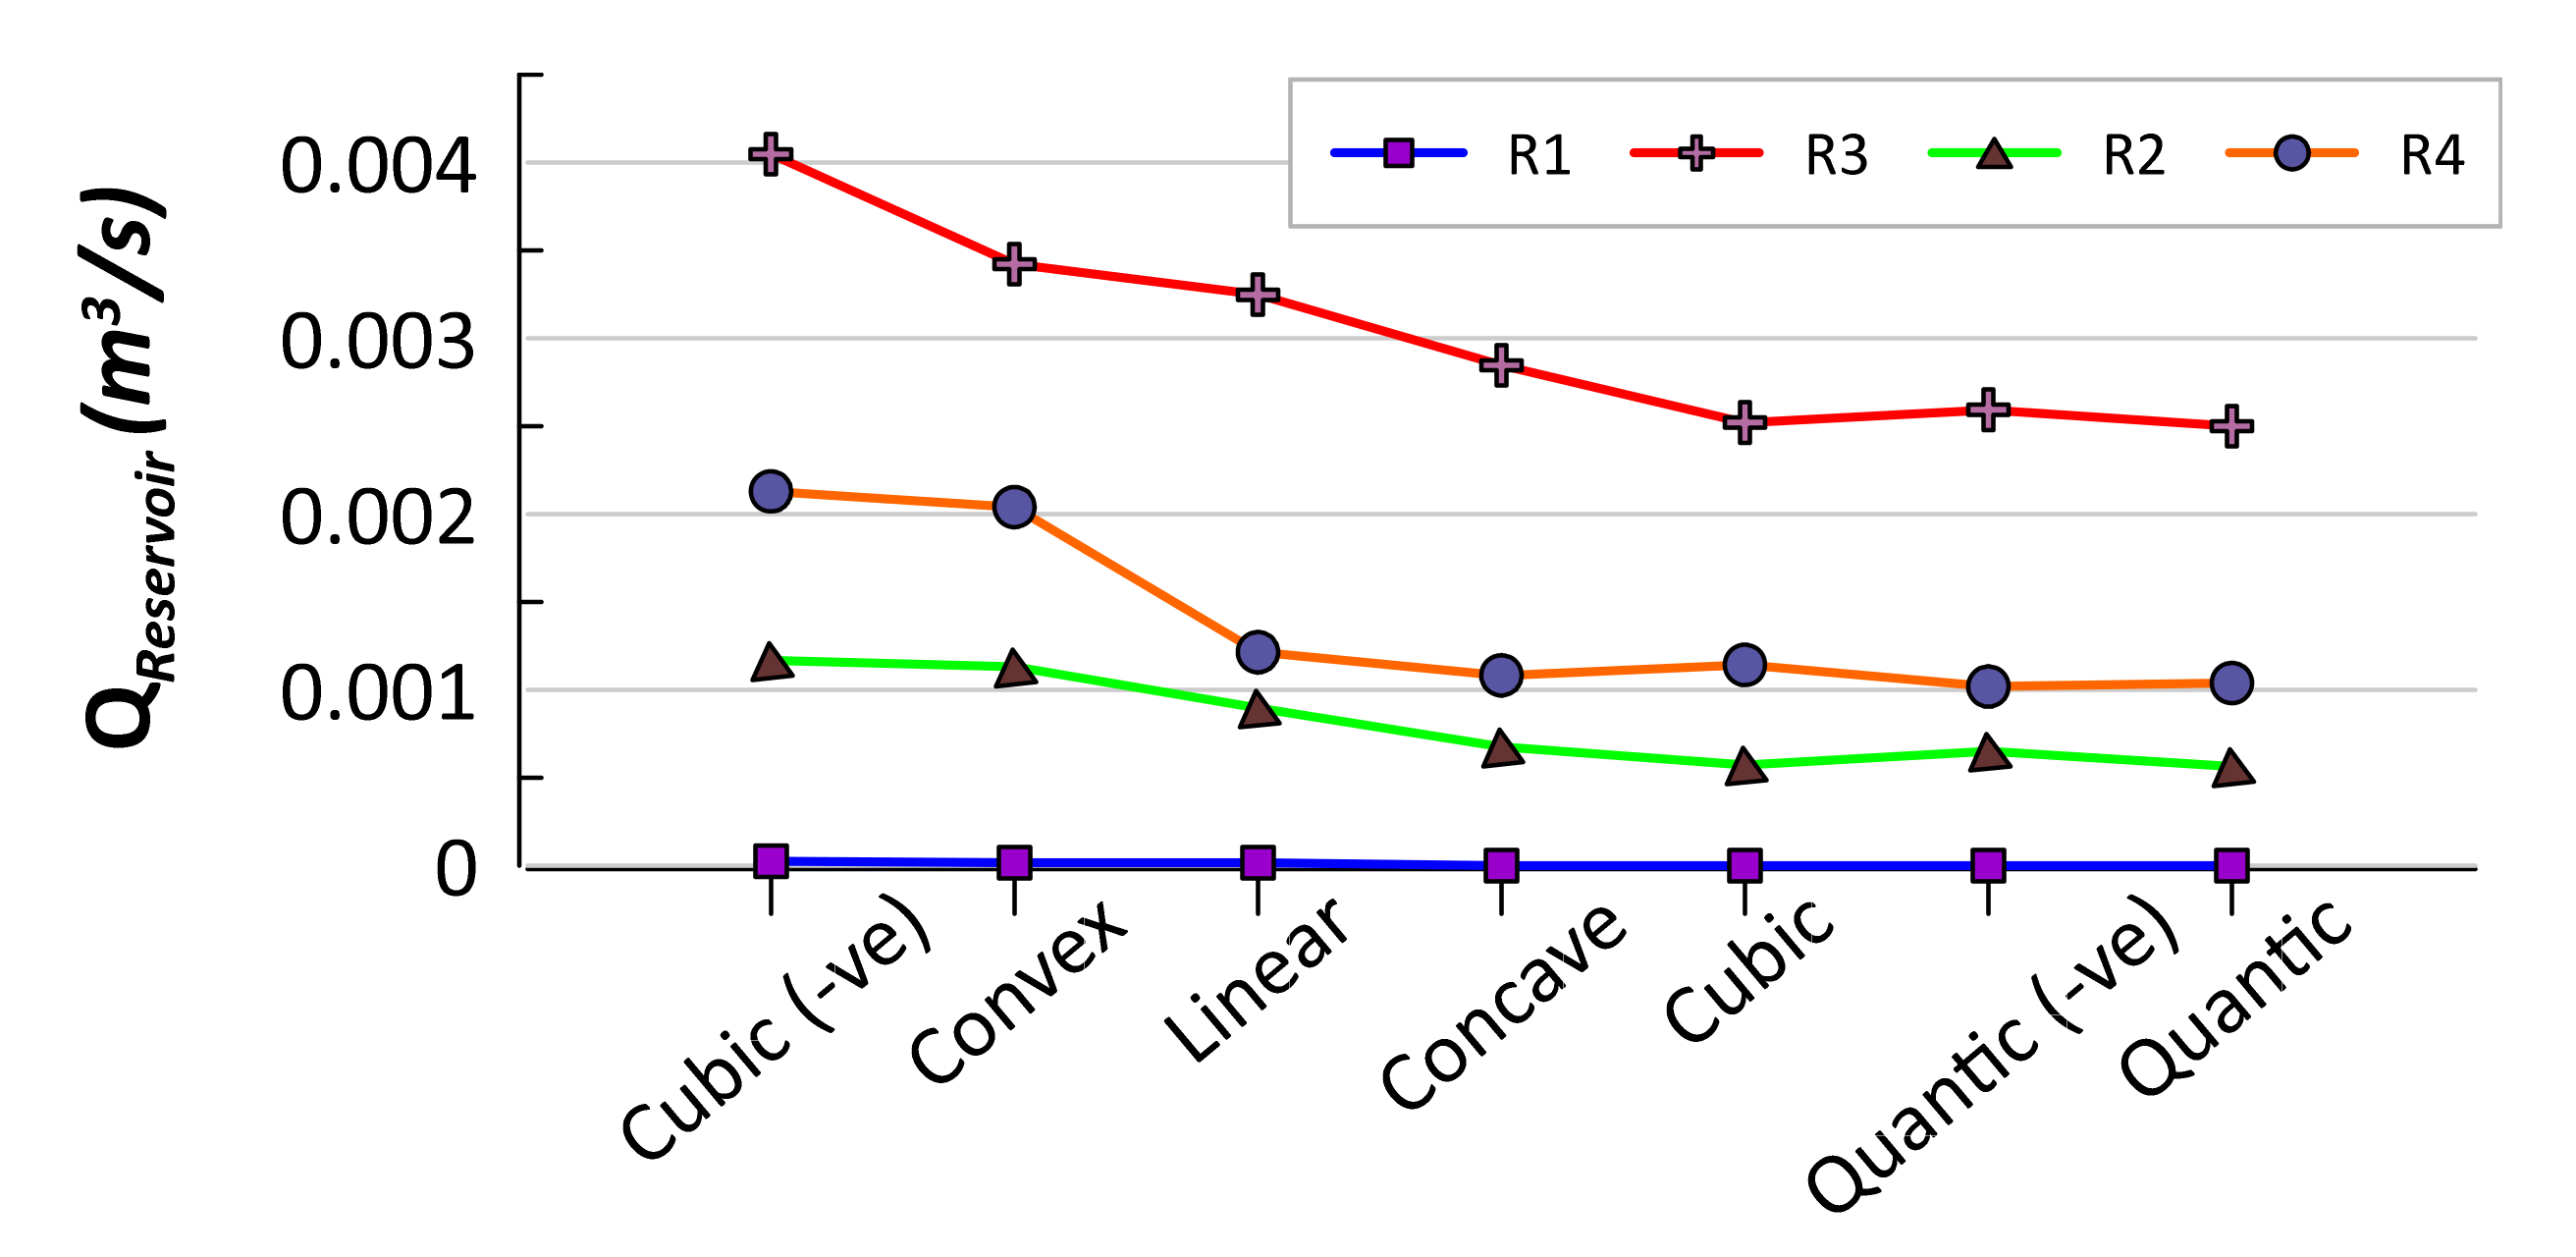
The comparison of overtopping rates at different wave conditions or local monsoon situations is presented in
Figure 14. It is shown that the R3 condition gave a higher overtopping discharge rate compared to others. The outcome also indicates that overtopping will gradually increase with increasing wave height (R1–R3). However, the overtopping declined for wave condition R4, although it has a larger wave height compared to other conditions. Theoretically, overtopping rate is relatively proportional to the wave height and period. Among the possible explanations for what happens during R4 condition is being unaware of the effect of the wave number in experiment test. Since R4 have longer wavelength compared to other waves, it produces the least number of overtopping waves within 60 s of the experiment test. This outcome clearly indicates a strong relationship between wave characteristics into overtopping waves and needs an improvement in the experiment setup.
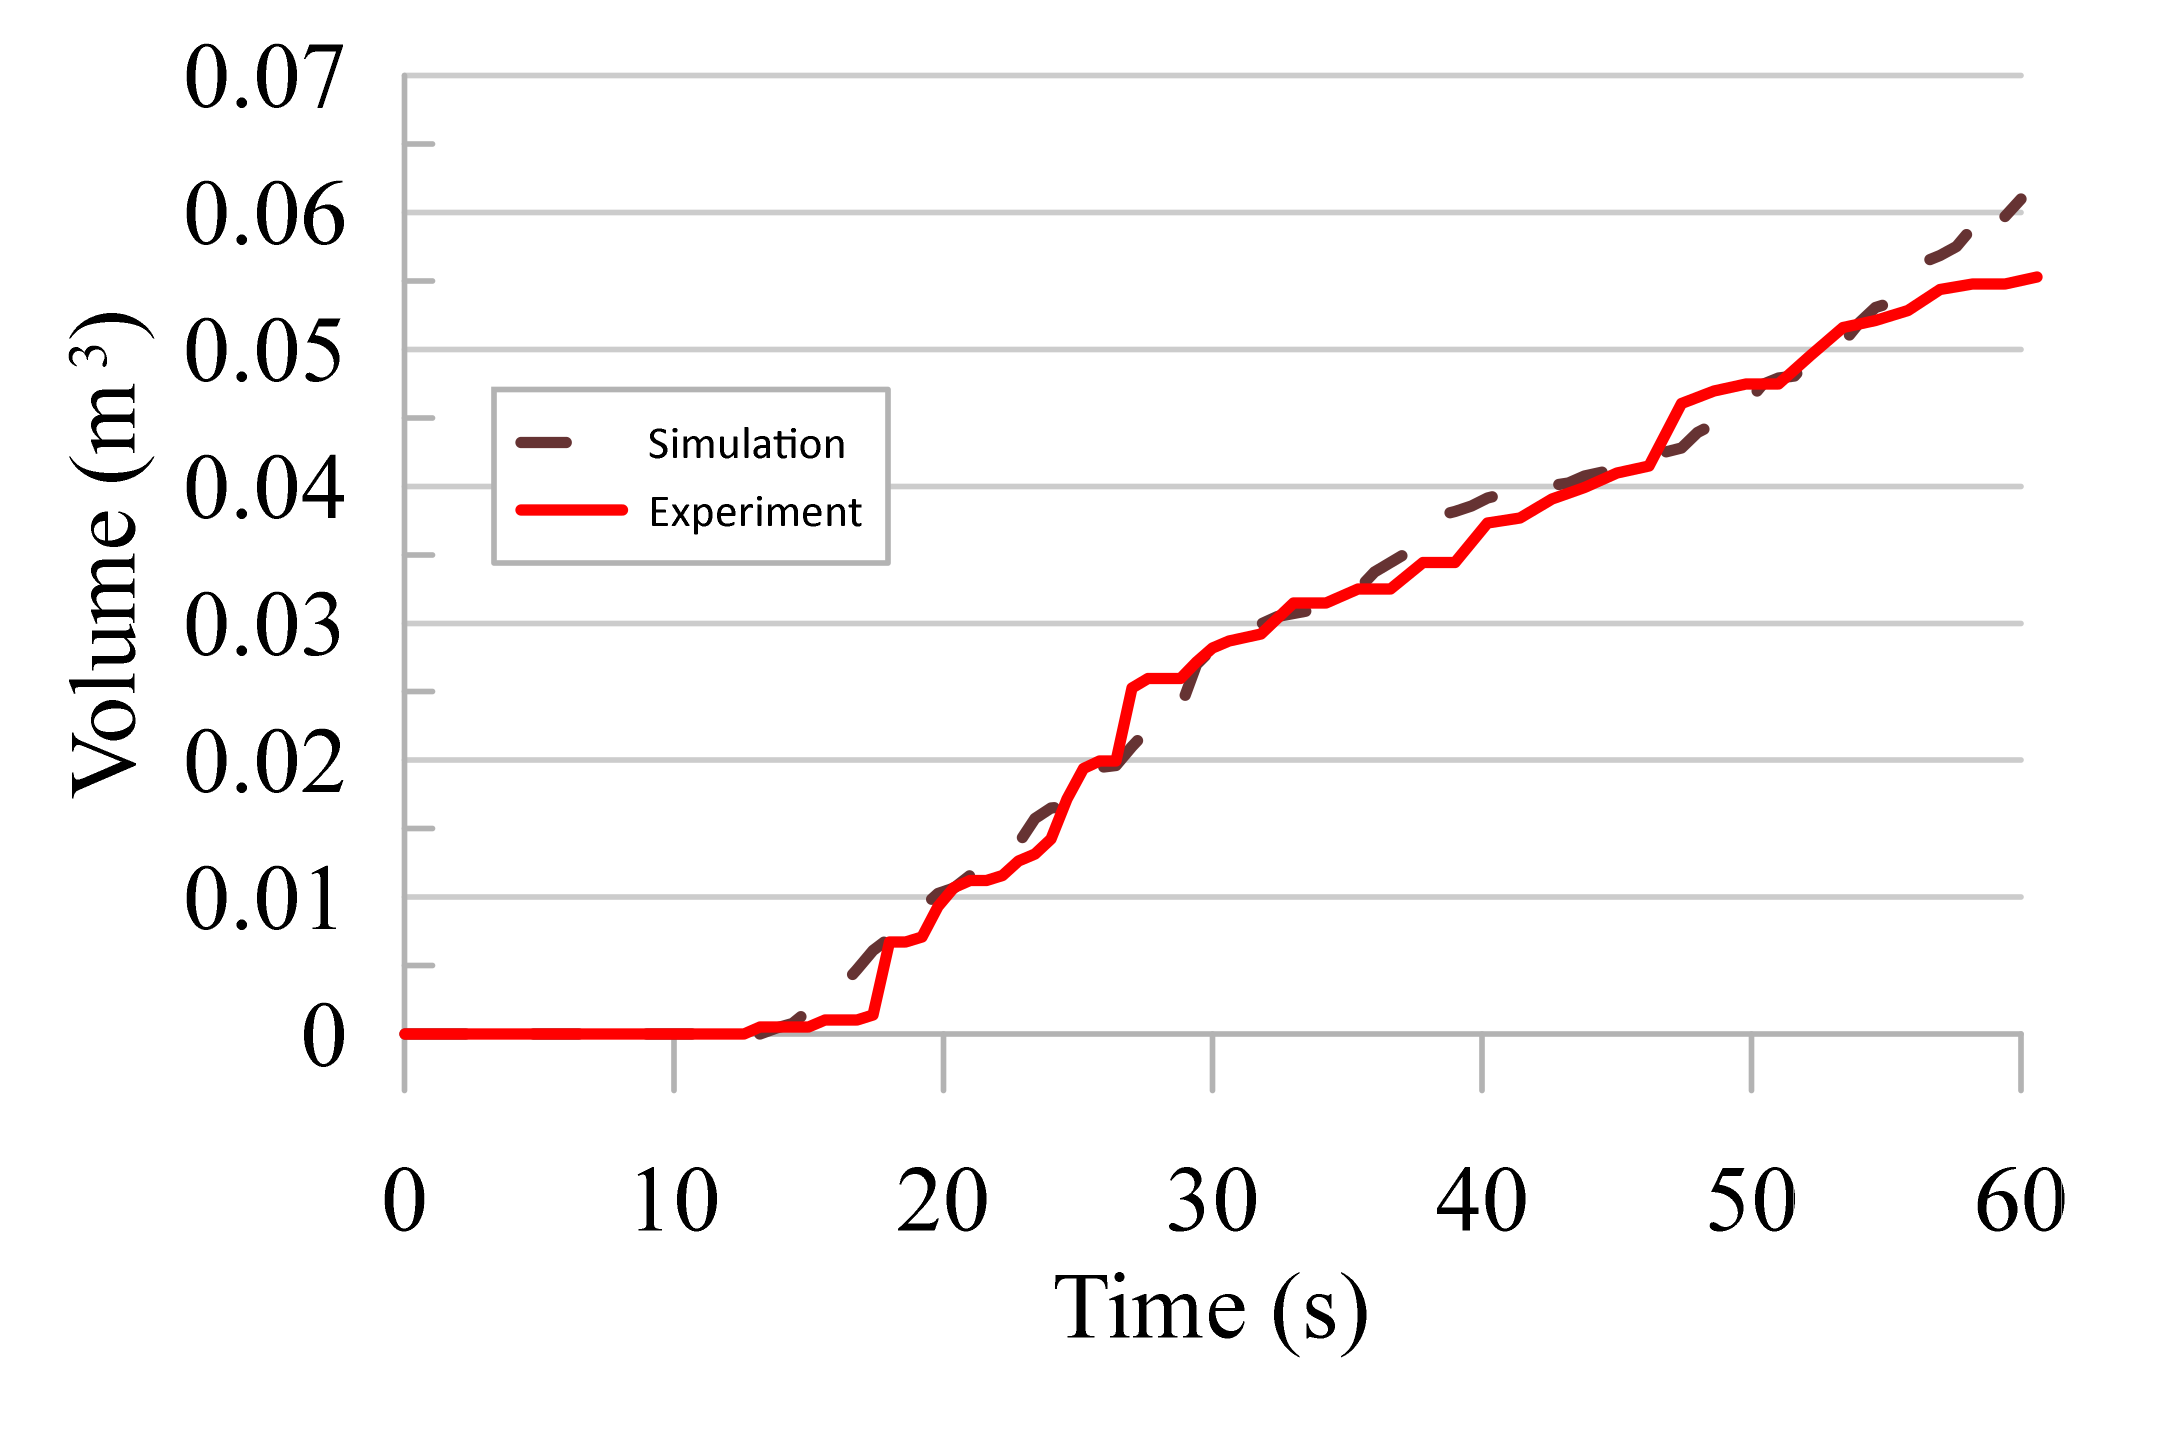
Figure 15 shows the comparison of overtopping discharge in time series between the experimental and simulation tests for the cubic ramp shapes (see
Table 3). There are no significant differences noted on the graph patterns between both methods. Both graphs show water started to enter the reservoir at
t = 12, then gradually increased in the reservoir as water overtops the crest. The experiment results are seen unstable with more fluctuations compared to simulation as it is subjected to real and unpredictable situations. Besides,
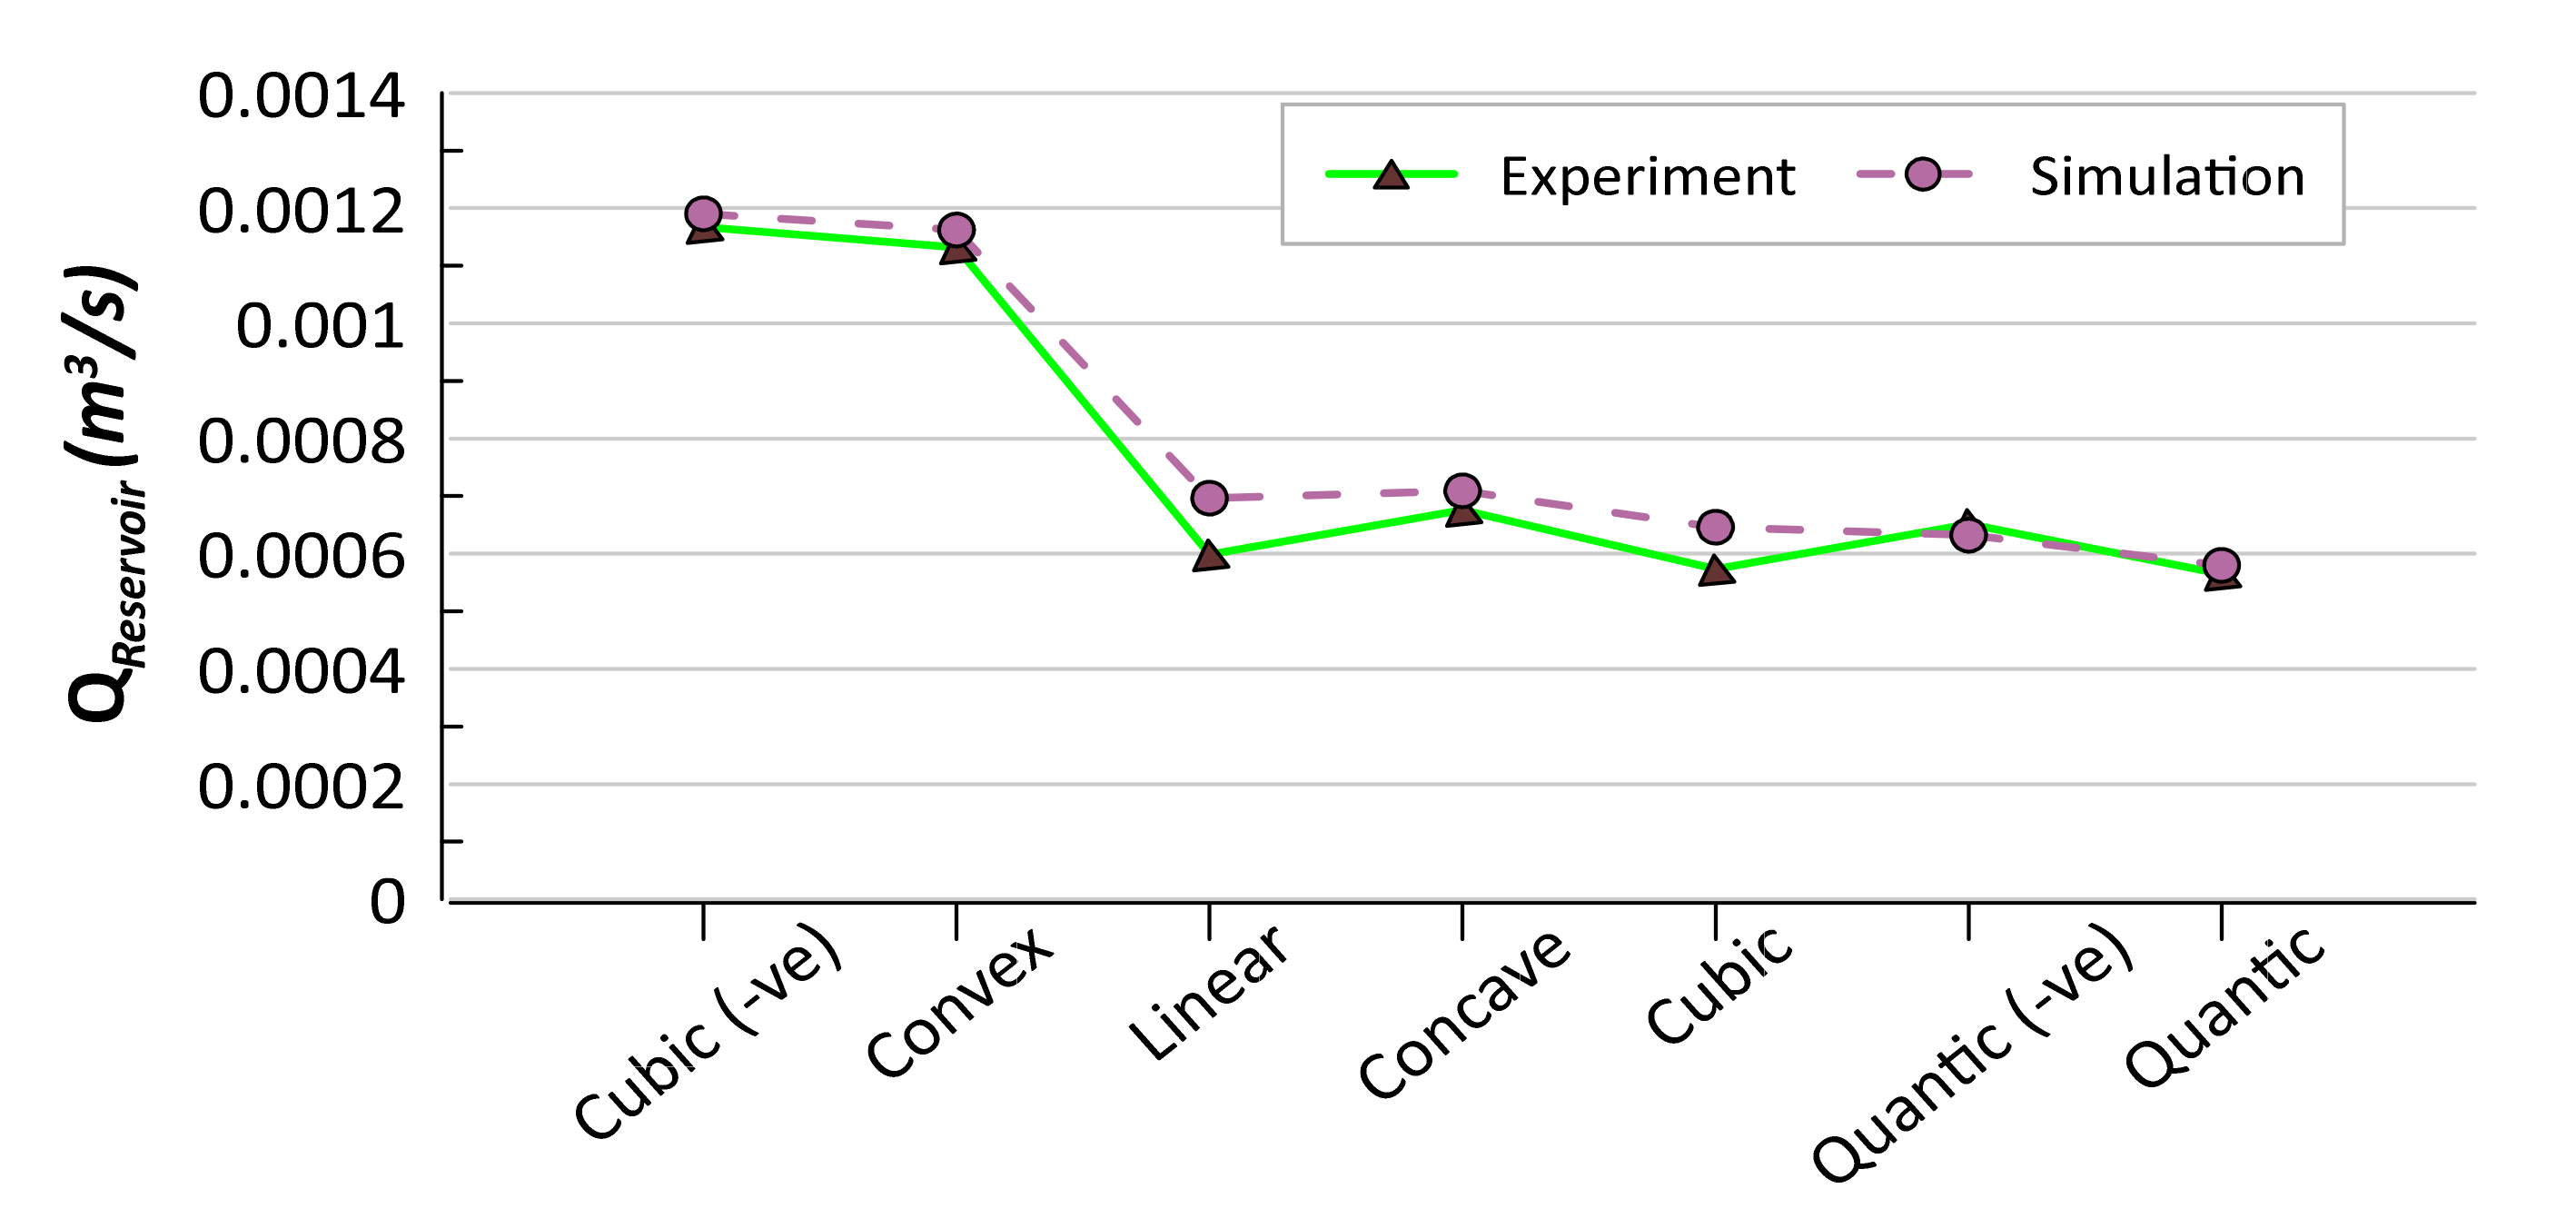
Figure 16 shows the comparison of an average overtopping discharge for all shapes (R3 condition) between experiment and simulation tests. The result demonstrated that all tests have quite similar overtopping rate values. An average difference between simulation and experiment is around 5.8%. It gave a good agreeable conclusion. Overall it indicates that the software is acceptable and appropriate for exploring wave behavior such as overtopping waves.
The comparison of the overtopping discharge between both methods was continued with the snapshot image processing as summarized in
Figure 17 and
Table 4. In the experiment, the camera was placed in front of OBREC device, while the 2D snapshot was presented in the simulation method for clear illustration of wave behavior during the overtopping incident. All the images indicate that similar wave activities occurred during the overtopping incident and indirectly showed a good agreement between both methods.
Figure 17 and
Table 4 also illustrates that there are few major factors that could affect the overtopping wave. The main finding is due to the wave run-up energy carried by each shape. This can be seen in boxes with a red line (in simulation column) snapshot that shows different water volumes run up over the ramps, depending on their shape configurations. A good ramp for overtopping will provide a large platform to gather the volume of water and indirectly increased the mass momentum of the run-up wave above the ramp shape as expected by Moghim et al. in 2015 [
30] and Hughes in 2004 [
31], who stated that massive mass momentum would increase run up or overtopping wave. This can be explained in detail as illustrated in
Figure 17.
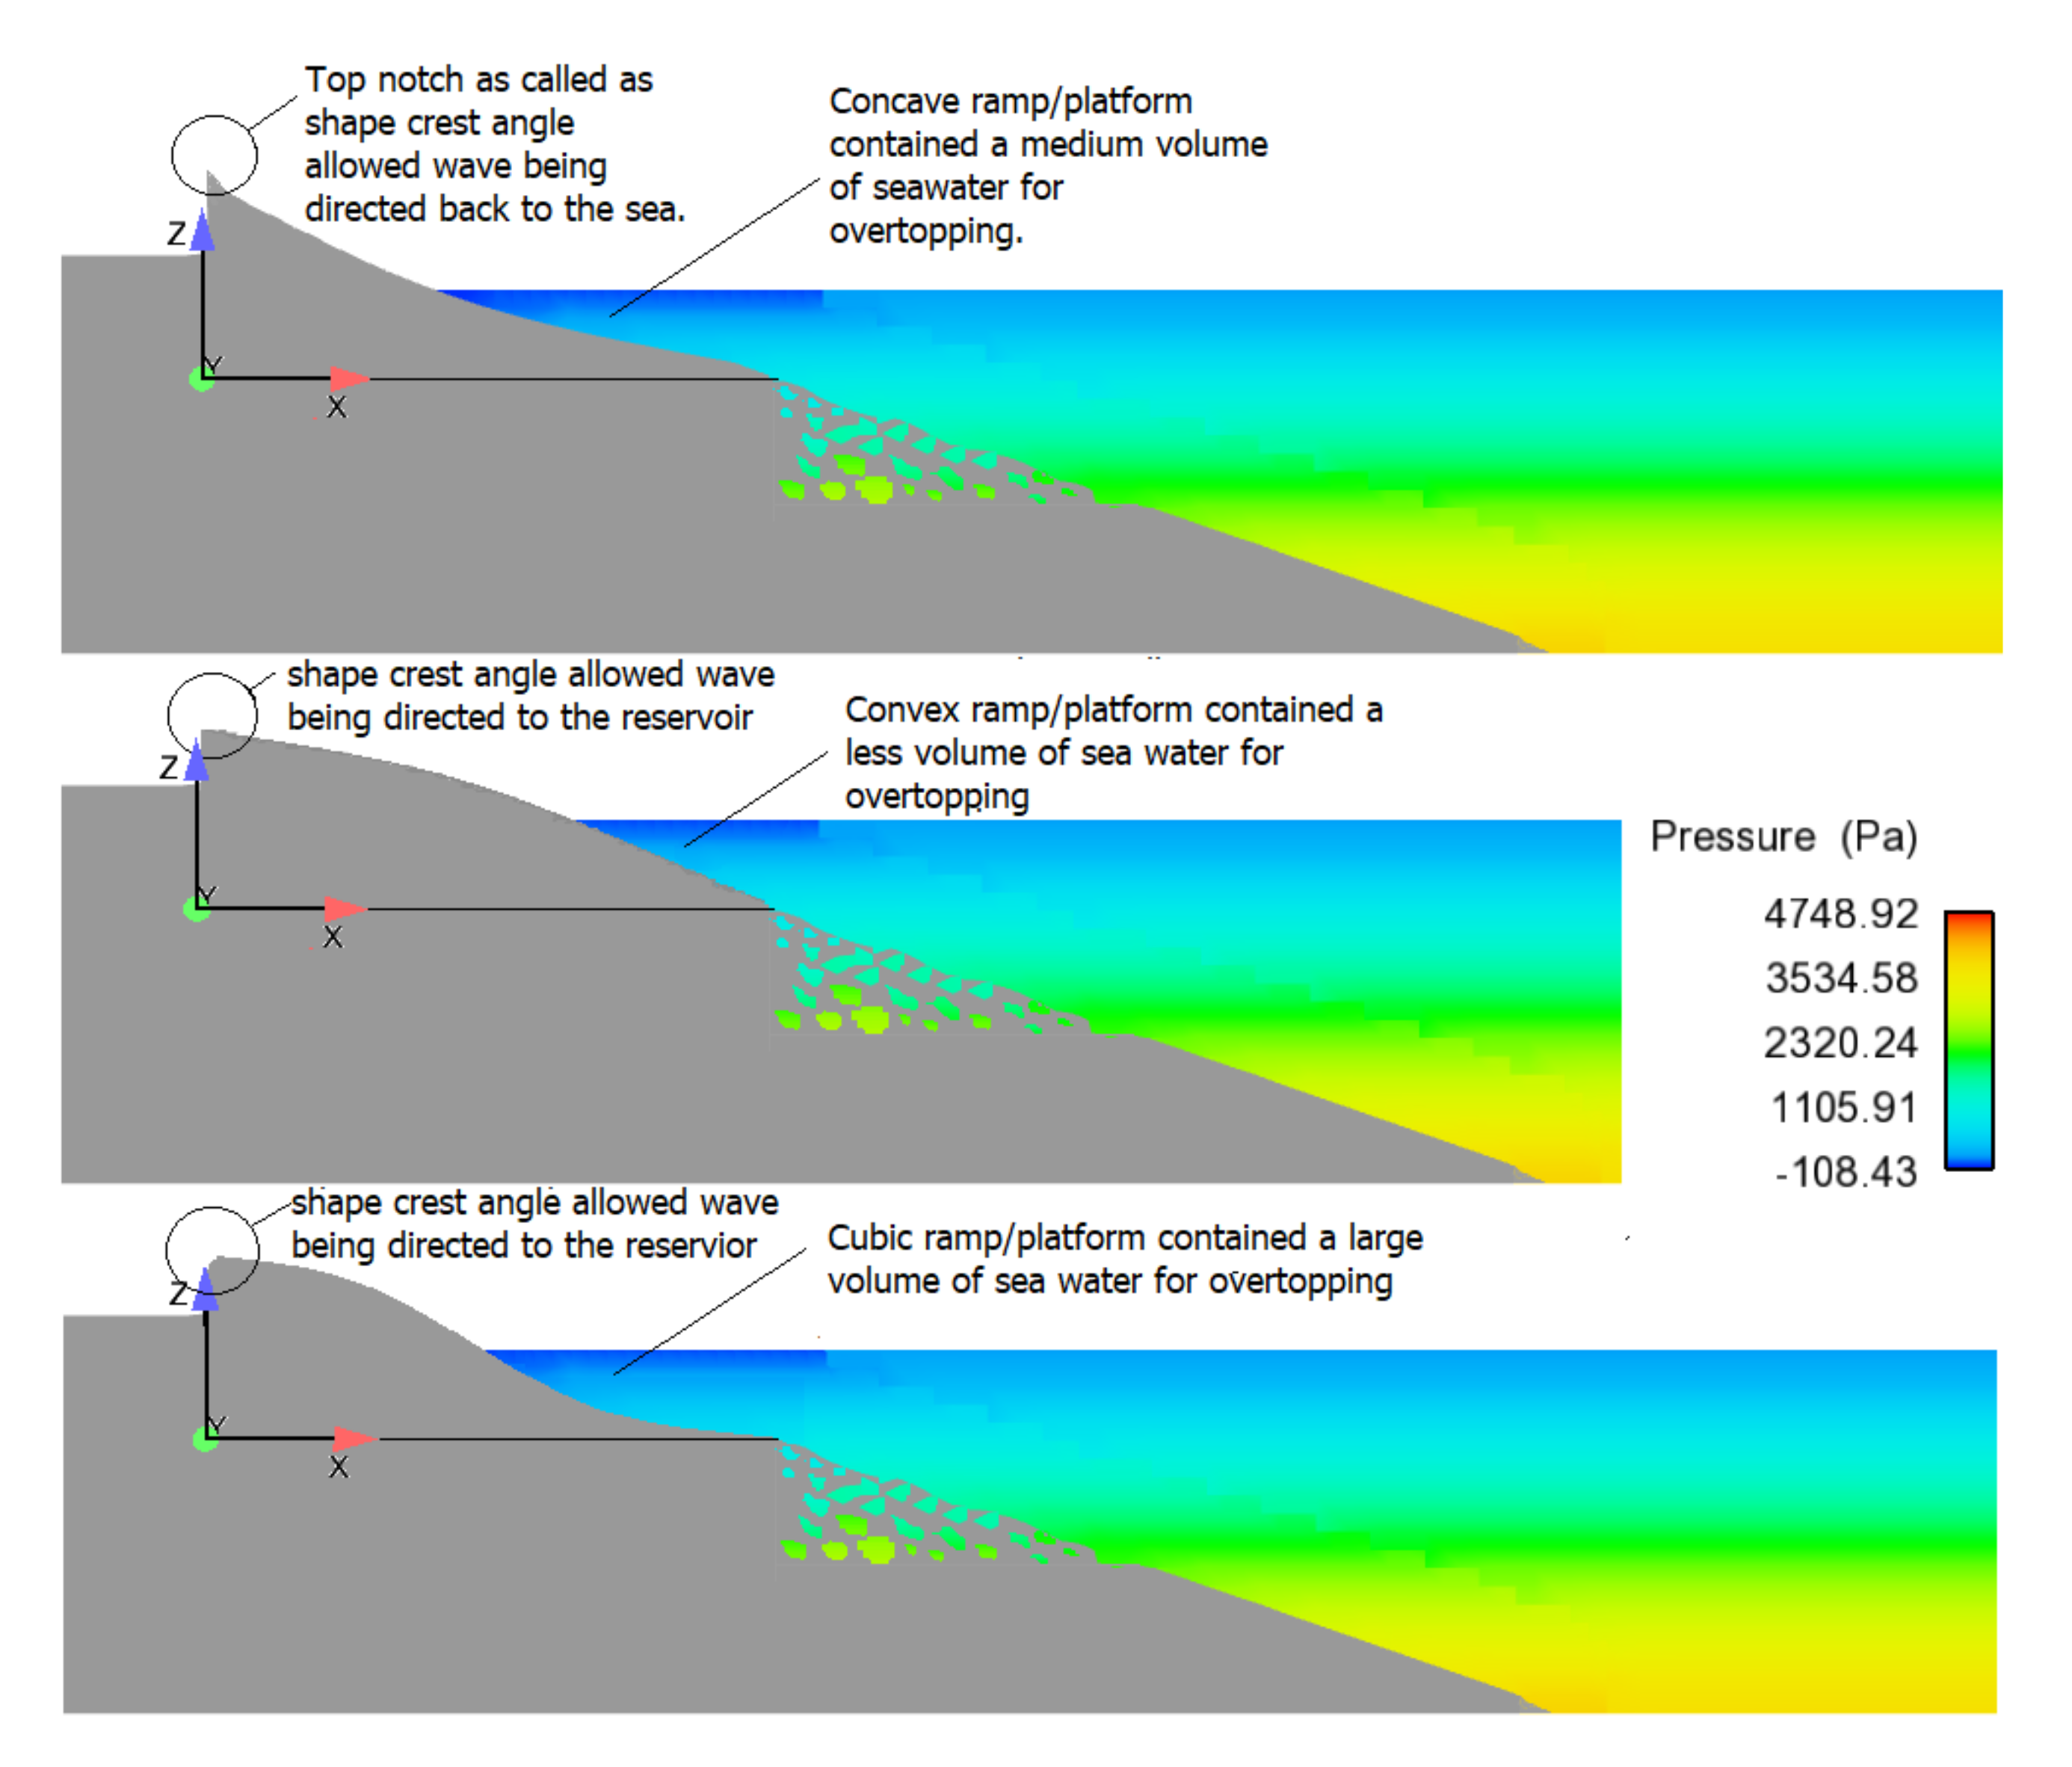
The other findings state that the amount of overtopping is dependent on the structure crest angle as illustrated by
Figure 17 and the red arrows in
Table 4 for both simulation and experiment illustrations. The run up wave is directed by the structure angle at the crest into the reservoir. It can be seen that the shape’s crest angle was directed towards the sea provided smaller overtopping wave compared to when the crest angle was directed towards the reservoir. This concept was also applied by Kofoed in 2002 [
15,
20] who extended the flat plate at the bottom of the Wave Dragon device for directed wave to run up. Vicinanza et al. in 2014 [
8] also applied the same concept by introducing the “nose parapet” to the OBREC reservoir for completely directing water into the reservoir.
The snapshot analysis can be generally concluded that cubic shape has its own advantages by providing a large platform for water run-up and has a crest angle towards to the reservoir. This allows the cubic shape to produce the largest overtopping compared to other shapes.
To give more emphasis on the cubic shape contribution, an extension of parametric studies has been done by comparing to the linear shapes and other studies. The general acceptance model of overtopping research in non-dimensional parameters plotted against the relative crest freeboard was used for this comparison. Both parameters can be calculated using Equations (5) and (6).
where
q* is a non-dimensional average overtopping discharge in the reservoir,
g is gravity,
Hs is significant wave height in (m),
R* is relative crest freeboard and
Rr is crest freeboard of front reservoir (m).
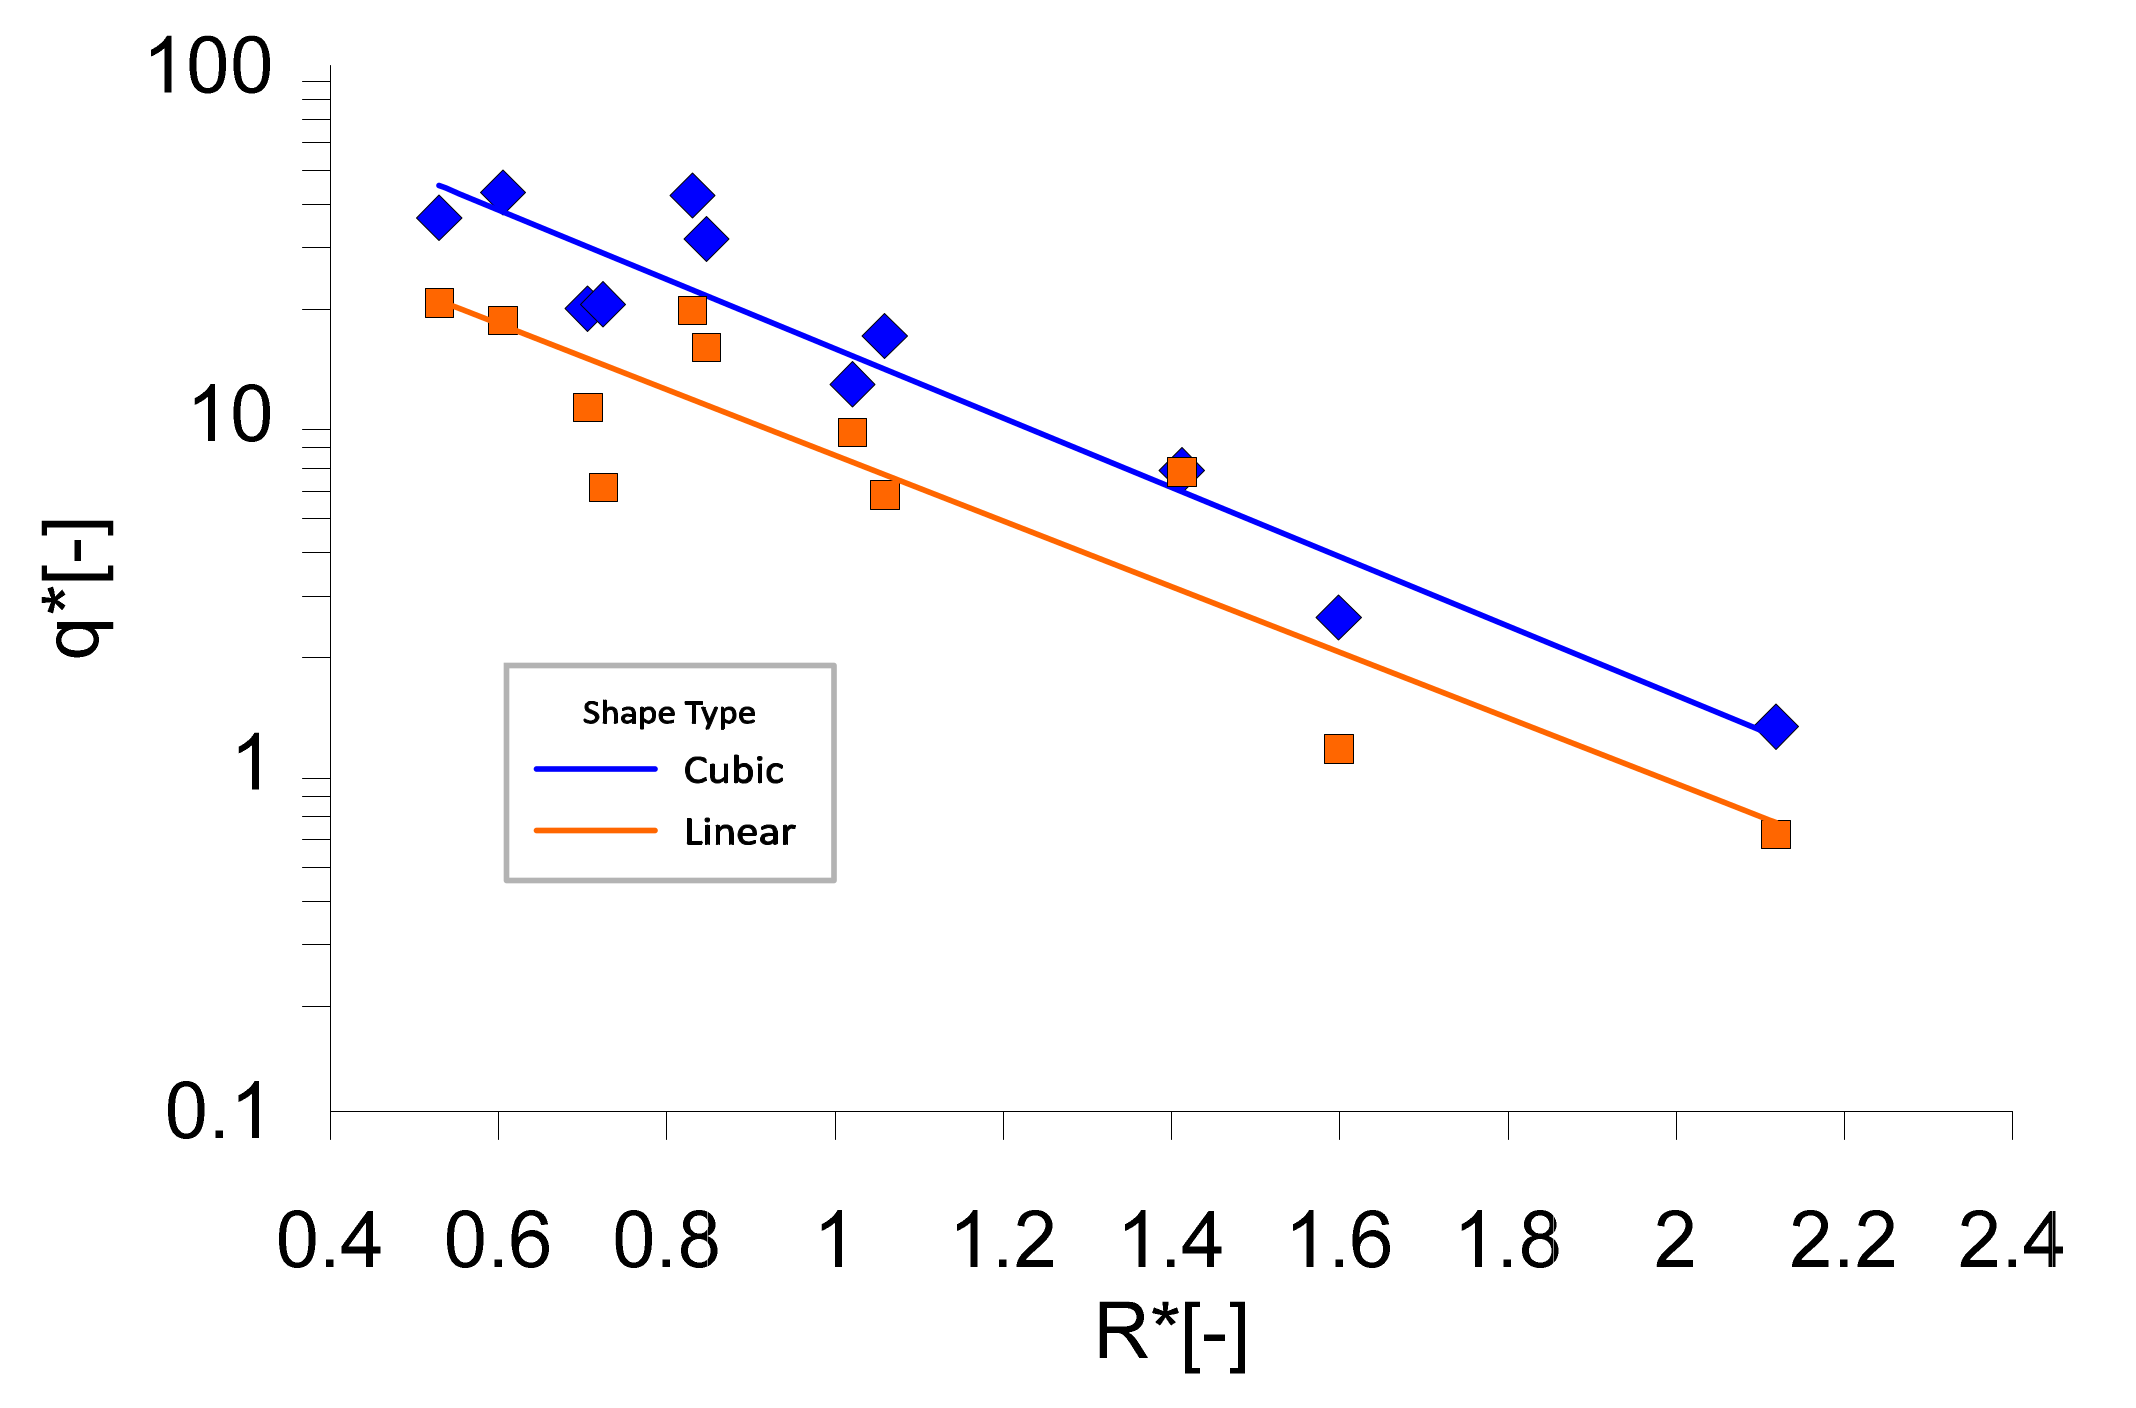
Figure 18 shows the comparison of non-dimensional overtopping discharge at different crest freeboard between cubic and linear shapes. The result demonstrates the strong negative trend of the exponential line from both shapes. Based on the correlation coefficient R, both shapes have shown about 72% correlation between non-overtopping discharge and crest freeboard. It shows a strong relationship between these parameters, and it is obvious that as the crest freeboard is increased, the overtopping rate will decrease, and vice versa. However, the coefficient determination R
2 of both shapes shows slightly lower with 52% variation with the trend line. It indicates that more experimental data are required to fit the regression lines of the exponential equation as presented by most of the previous overtopping prediction formulas [
18].
An average output of overtopping discharge for the cubic ramp interestingly is higher than linear shape up to 30%. It is believed that the cubic platform gave more space to the water to run up compared to linear shape as previously discussed. The other factor could include the geometrical angle at the crest directed to the reservoir has given an advantage compared to linear configuration.
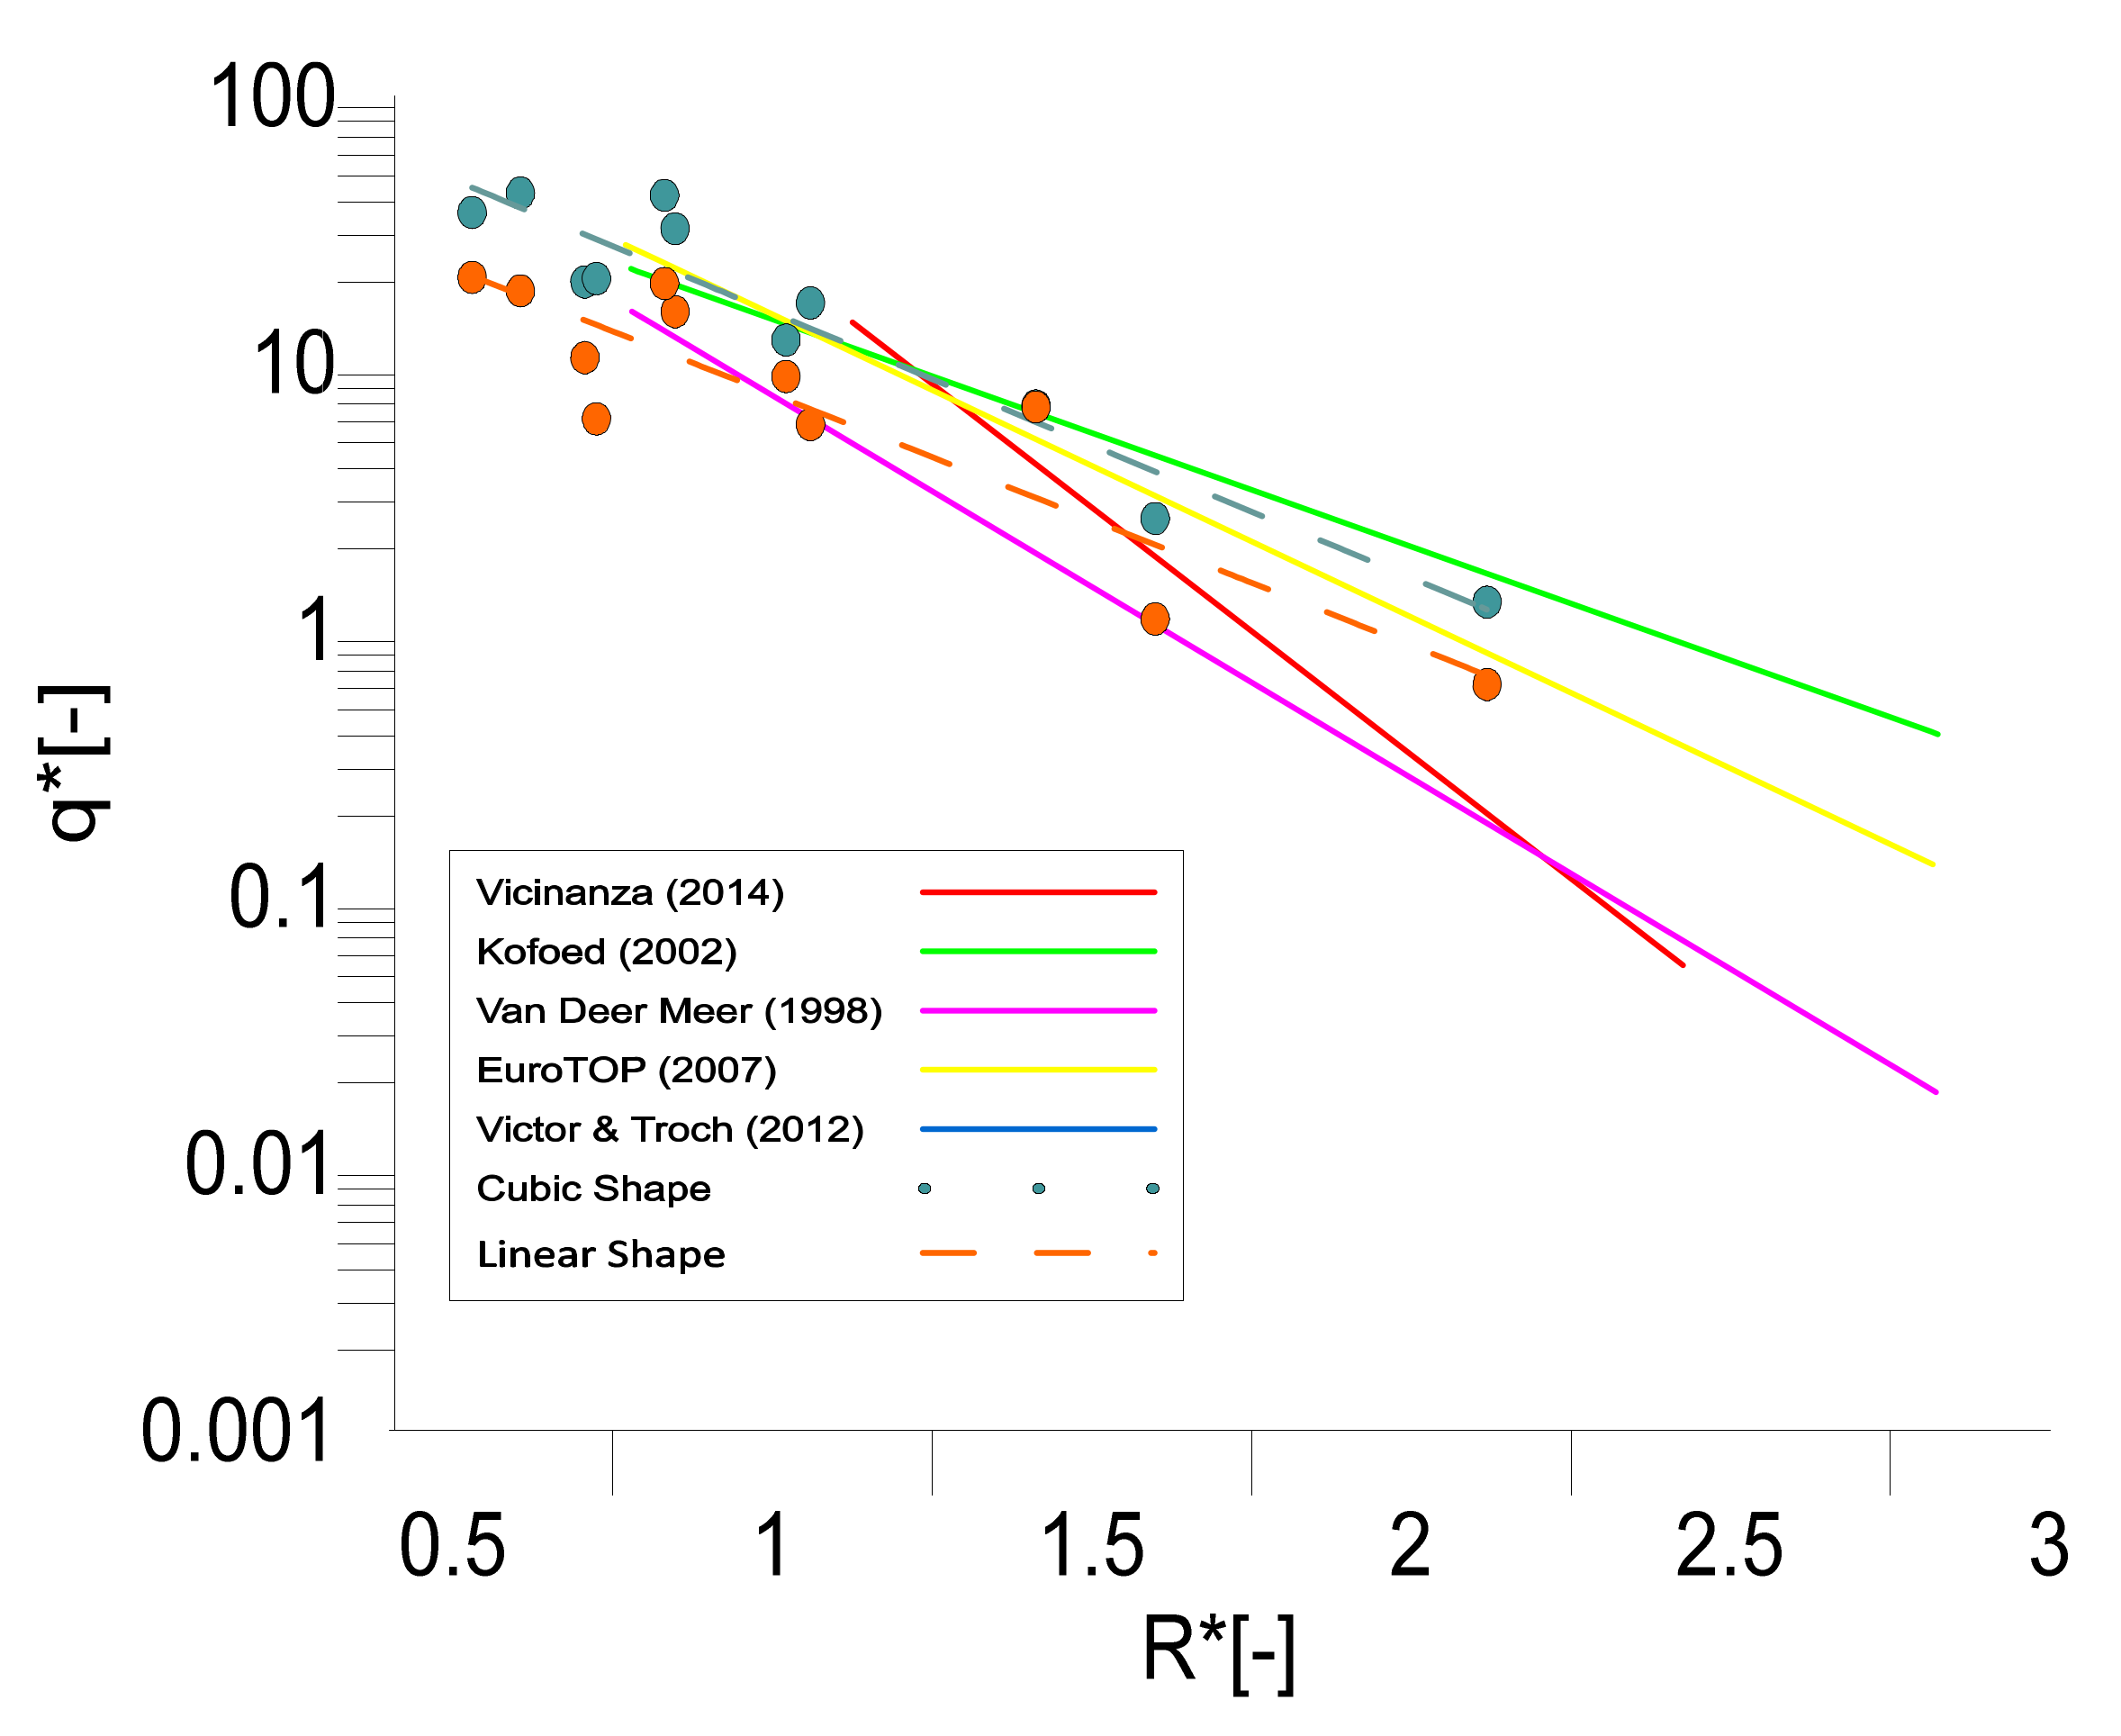
The comparison of previous prediction formulas of coastal and OTD studies is shown in
Figure 19. The purpose was to ensure the validity of an exponential patent line for the current result. The result was compared with (i) Vicinanza et al. in 2014 [
8] who presented an exponential patent line of OBREC between 1.2 and 1.5 non-dimensional crest freeboard, (ii) Kofoed in 2002 [
20], who studied a wide range of crest freeboards for Wave Dragon devices, (iii) Meer’s et al. [
28] formula in 1994, which focuses on various parameters for coastal breakwater, (iv) Pullen et al. in 2007 [
18] who develop an assessment manual of overtopping wave and (v) Victor and Troch in 2012 [
32], who studied the influence of overtopping wave on the breakwater of impermeable steep slope.
The result demonstrated that both cubic and linear shape patent lines are within the range of previous studies. The cubic shape shows a very surprising overtopping discharge performance almost surpassing all predictions from other researchers. However, this result could not be used as a benchmark due to the different conditions and applications used by previous researchers. However, overall, this result shows a good agreement between the current and previous studies with inline graphs patent.


 ,
, 


