Abstract
In the current paper we are extending our earlier work on the assessment of a ship’s tendency to capsize due to broaching-to in a stochastic seaway. Capturing, in a probabilistic context, interferences between different phenomena occurring during ship operation in extreme seas is a challenging task. Estimates of statistical correlations are deduced between high-run events, broaching-to and capsize. A phenomenological approach is adopted in this study for the classification of the targeted motions. Large scale simulations and a direct counting scheme are applied on the basis of a 4 degrees of freedom (4DOF) mathematical model for the coupled surge–sway–yaw–roll (and rudder) motions. Comparison with the results obtained from a previously used 3DOF model for the same scenarios is carried out in order to investigate the effect of roll on high-run’s correlation with broaching-to. Additionally, sensitivity studies are carried out in order to examine the effect of the commanded heading angle, the rudder control gains and the threshold values defining excessive (unsafe) motions. The concurrence level of the three processes considered here is found to be significantly affected by the examined parameters. The paper includes a short review of effective methods for identifying ship high-runs in following/quartering seas.
1. Introduction
The development of probabilistic indices reflecting the safety level of a ship in relation to the occurrence of dynamic instability in an irregular sea environment has been receiving significant attention in recent years (see for example the collection of papers in [1] and the review paper of [2]). Such assessments can be carried out at the design stage by considering the expected profile of a ship’s operation with respect to her loading, speed and heading, and for a variety of weather conditions (e.g., [3,4,5]). The recently developed by the International Maritime Organization (IMO) “Second generation intact stability criteria” embody a regulatory perspective to the development of such an assessment framework (e.g., [6,7,8]). However, dynamic stability assessments can also be used for assisting decision-making concerning route selection and operability for existing ships, for given weather forecasts (e.g., [9,10]).
In order to develop successful dynamic stability assessment methods one is required, in principle, to have a good understanding of the physics of the phenomena involved. The one type of instability that is considered as complex both in terms of modeling and exhibited dynamics, is broaching-to (see for example [11,12]). It occurs in a following/quartering sea environment and is often preceded by the occurrence of a phenomenon known as surf-riding where the ship is pushed by a wave to travel, for several seconds, with the wave celerity. Broaching-to is dangerous since the final outcome can be the vessel’s capsize [12]. The dynamics of the sequence from surf-riding to broaching-to and then to capsize has been clarified in the last 30 years; however primarily within a framework of regular, or nearly regular, seas. On the other hand, recent research has indicated that, in a steep irregular following/quartering seaway, additional possibilities of dynamic behavior can arise concerning the ship surge motion dynamics which can bear qualitatively different effects on the other ship motions, thus creating potential for new patterns of broaching-to and capsize. For this reason, the concept of ship “high-run” was introduced recently as a generalization of surf-riding for a highly irregular sea [13]. Besides the necessity to investigate these new patterns, by its stochastic nature the irregular sea calls for a probabilistic evaluation of the strength of connection between high-run phenomena, broaching-to and capsize.
Hence for the clarification of the high-runs and their connection with broaching-to and capsize, two directions of research have emerged. The first approach is more rigorous from the dynamics perspective as it employs methods of non-linear dynamics and unsupervised machine learning, for the automated identification of different motion patterns and for the calculation of respective occurrence indices [14]. The second approach targets a more phenomenological classification of the motions. Empirical thresholds are used with respect to the realized speed and heading in order to separate the different types of motion [15]. Through direct counting of time intervals this approach can yield cost effective statistical estimates of the correlations of high runs with broaching-to. The main points of these approaches are summarized in Section 2.
The current paper presents an investigation following the second approach. The phenomenological identification of high-run events utilized in [15], where strong concurrence had been observed between high-runs and significant yaw response intervals, led us to extend the previously used coupled broaching-to model in order to include the roll motion. Statistical correlations could then be sought between high runs, broaching-to and capsize. In particular, the key aim of this study is to examine if (a) the introduction of roll motion affects the high-run and broaching-to statistics, and (b) whether significant roll responses appear correlated with high-runs and large yaw deviations.
The mathematical model has remained, in principle, quite simple, since the objective was to seek these connections at a basic modeling level. As described in Section 3, it is comprised of kinematic equations for the coupled motions in surge, sway, yaw and roll while the vessel is forced to follow the wave contour in heave and pitch, maintaining vertical equilibrium. Thrust and resistance are implemented using polynomial expressions. The maneuvering hull reaction and rudder forces are provided by linear hydrodynamic derivatives and are supplemented by a proportional-differential (PD) controller for the rudder angle. The incident wave loads are calculated via the numerical integration of the associated pressure on flat triangular panels on which the hull has been discretized. The calculation accounts for the instantaneous wetted surface as it occurs from the equilibrium of the hull on the wave profile at every time step.
In Section 4, we present the calculation process for the identification of the targeted responses, specifically high-runs and excessive yaw and roll. Furthermore, we examine the effect of several parameters, such as the commanded heading angle and the magnitude of the rudder control gains, which were shown in [15] to significantly affect the derived statistical indices. A sensitivity analysis of the threshold values that characterize excessive yaw and roll response is also presented in Section 4, while the addition of the roll motion also incorporates the effect of the ship’s loading condition through the KG value. Finally, Section 5 discusses the key results of the study.
The novelty of the current work is the statistical account of the interferences between different phenomena (high-run, broaching-to and capsize) that could occur during ship operation in extreme following/quartering seas. It can be useful in a practical context of assessment towards the quantification of a ship’s tendency for capsize due to broaching-to.
2. Review of Methods of Identification of Ship High-Run Incidents in Irregular Seas
The concept of ship high-run has been proposed as a generalization of surf-riding, in order to reflect abnormal high-speed behavior of ships in irregular following/quartering seas. More specifically, whilst surf-riding is basically the capture and “push forward” of a ship by a single steep wave, a high-run represents a fluctuating high-speed motion influenced by a sequence of waves. Even though several waves are involved, in a high-run incident the mean speed is found consistently well above the nominal speed corresponding to the propeller’s setting. A simple phenomenological approach towards determining high-run incidents and deducing the time intervals of their realization, is via setting-up a suitable speed crossing problem. The main challenge is however to properly define the velocity thresholds delimiting these high-run intervals. Beyond simple phenomenology, “smarter” methods have also been proposed. An alternative approach is to continually calculate the instantaneous (time-varying) celerity of the wave corresponding to the origin of the ship system of axes [16], and then, to determine all time intervals when the speed has exceeded the corresponding instantaneous celerity value. In a third approach, the identification of high-runs is set up as a data clustering problem, searching for sets of trajectories in the system’s phase space with the characteristics of high-run [14]. This method relies on a more detailed analysis of system dynamics. These techniques are discussed further in the next section.
2.1. Method Based on the Up-Crossing of the Instantaneous Wave Celerity
Whilst this method seems to stem, in the first instance, from the phenomenological concept of the high-run definition, it couples into the calculation of the so-called instantaneous wave celerity. The role of wave celerity as a threshold for surf-riding in regular waves is well-known [17]. However, in an irregular sea environment the definition of celerity is debatable. It is possible to define celerity as the speed of propagation of a suitable local property of the wave profile [16]; then celerity can be calculated via a computational scheme accruing directly from this definition. However, it is also possible to calculate celerity by use of the concept of instantaneous frequency. This is basically the derivative of the phase of the “analytic signal”, which in our case is the wave elevation [18,19]. The dependence on instantaneous celerity entails, for the problem of surf-riding, a simultaneous treatment of the records of ship velocity and wave profile. Up-crossing of the instantaneous wave celerity should initiate a high-run. Unfortunately, the instantaneous celerity suffers from frequent jumps to infinity which, whilst usually not having true physical significance for high-run occurrences, they tend nevertheless to create ambiguities in the calculation process [16]. It has been proposed, as a means towards overcoming this, to either use a local celerity value (instead of the instantaneous one), based on the point of maximum wave slope nearest to the ship [18] or to simply employ the wave celerity that corresponds to the peak frequency of the assumed wave spectrum [13,15]. The latter is a constant value. Comparable statistical results have been derived in sensitivity studies, where detailed investigations on the choice and suitability of possible up-crossing and down-crossing thresholds were carried out [13].
2.2. Clustering Method
In this approach, a trajectory clustering technique is applied in order to qualitatively capture different types of ship motion phase space trajectories, for extreme sea scenarios. The method does not depend on the phenomenology of the problem. It involves the calculation of finite time coherent sets in the phase space, via which the phase space is divided into regions associated with qualitatively different motions (“clusters”); namely ordinary oscillatory motions and high-runs. By monitoring the time evolution of these clusters, a rigorous scheme for the calculation of the probability of high-runs is deduced with no need of setting any kind of speed threshold [14]. This method, whilst the most rigorous in terms of system dynamics, is also computationally the most heavy.
In the longer term, all these methods will be applied, in a comparative sense, towards calculating the probability of broaching-to and capsize associated with high-run incidents. In the present paper however, which presents our first step in this direction, statistics of broaching-to and capsize will be estimated using a threshold-based approach.
3. Mathematical Model
The mathematical model is an extension of the simple surge–sway–yaw model presented in [15]. In the current version however, the roll mode has been introduced in order to make it possible to also estimate capsize statistics. Moreover, in [15] the incident wave load calculations were carried out by involving large interpolation tables of RAO and phase shifts and were determined for a large combined range of wave length and heading angles. These tables were populated by performing hydrodynamic pre-calculations with a strip-wise method, i.e., utilizing several hull waterlines up to the design draft. This offered significant computational speed but in terms of a wetted hull it limited our calculations to the still calm sea waterline threshold. The calculations have now been improved by integrating the associated pressure up to the instantaneous curvy waterline and by introducing a new geometrical discretization of the hull, using flat triangular panels; calculations of the hydrostatic loads are carried out similarly. The additional computational cost due to the submergence test of each hull panel during every time instant, was overcome by applying parallel computing techniques.
Other features of the model were, however, kept intact, despite their great simplicity; namely, the rudimentary rudder model and the linear hydrodynamic reaction terms, as this better fitted our research strategy. Likewise, the PD controller for the rudder and the thrust resistance polynomial expressions were retained. In particular, the intention is to later carry out a detailed investigation of the effect of the rudder model on the statistics of broaching-to and capsize. As usual, two different coordinate systems are used (Figure 1): an earth-fixed, non-rotating system; and a body-fixed system with its origin located amidships, at the point where the centerplane and the waterplane intersect. The systems are in accordance with the right-hand rule, with the “X” axis pointing positive forward, having on its left the positive “Y” axis, while the positive “Z” axis points upwards.
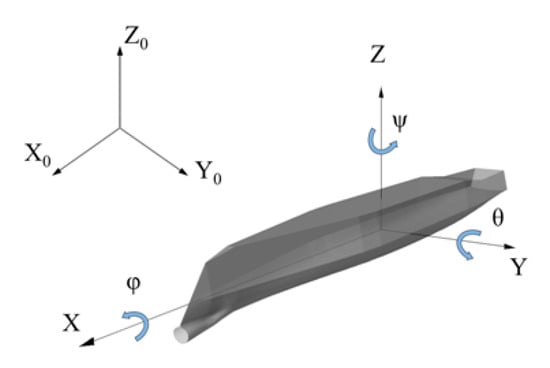
Figure 1.
Coordinate systems.
The layout of the mathematical model is the following, as presented in Equations (1) to (4) ([15,20]). Several maneuvering hull reaction terms that are calculated on a still-water basis are involved with the kinematics.
| Surge | |
| Sway | |
| Roll | |
| Yaw |
For relatively long, following/quartering sea waves the frequency of encounter remains low and equilibrium in pitch and heave (i.e., the so-called wave contouring condition) can be approximately presumed. Whilst, for a general irregular sea one could challenge this assumption, here it is a convenient one because it allows evaluating the effects of roll on the basis of comparable models. Hence, the calculation of heave and pitch motions is reduced to determining the ship’s attitude relative to the wave profile, at each time step. Also, for calculating the ship’s longitudinal and lateral distance from the fixed origin , the following two kinematic relations, Equations (5) and (6) can be applied (small effects introduced by the rotations and are considered as negligible). The equations of motion are solved using the 4th order Runge-Kutta integrator. Lastly, due to the very small values of pitch rotation, the effect of the ship’s weight projection onto the surge mode was also considered as negligible:
For the surge mode, thrust and resistance are expressed in the usual polynomial form as follows, which disregards the wave effect [19].
As already said, hull hydrodynamic reactions for sway and yaw were linearized. Thus, we should be able to capture only the tendency for deviating from the commanded course but not the accurate motion pattern. The horizontal hull maneuvering force (e.g., [21]), also inducing a rolling moment () (e.g., [22]), is then:
In the context of linearized horizontal-plane dynamics, and with the earlier comment, rudder forces are expressed as follows (e.g., [21,22]):
The longitudinal component will typically be several orders of magnitude smaller than the rest of the right-hand-side terms of the surge equation and may thus be neglected. Lastly, a simple proportional-differential (PD) model of rudder control is assumed,
At the right-hand-sides of the Equations (1) to (4) also appear the hydrostatic loads and Froude-Krylov wave excitations, which are functions of ship position, heading and attitude relative to the wave. In order to calculate these terms, the hull is discretized into flat triangular panels, each of which is characterized by its area and its centroid position as expressed in the body fixed system (see Figure 2). The local normal vector is and the moment arm is , where is the vector from the origin of the body fixed coordinate system to the panel centroid. The coordinates of the latter are transformed suitably for the relative position of the hull in the earth fixed system using Equation (14), where the standard transformation matrix is involved (e.g., [20]).
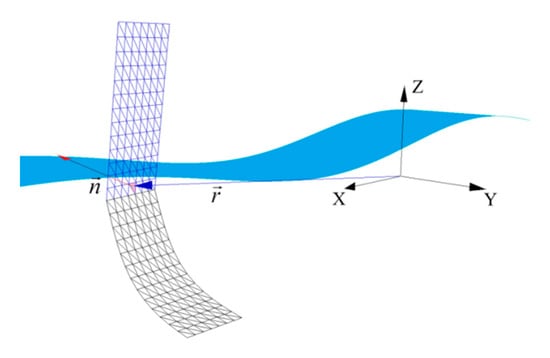
Figure 2.
Calculation of triangular panel submergence.
The local water elevation is expressed as a sum of harmonic wave components, according to the random phase model, as in Equation (15). A submergence test for each panel is then performed , taking into account its location relative to the encountered wave profile (e.g., [23]).
The instantaneous values of hydrostatic force and moment are obtained by numerical integration of Equations (16) and (17) for the static pressure acting on the submerged panels (e.g., [24]),
The calculation of the Froude-Krylov loads is carried out in a similar manner, by numerical integration of the unit potential on every immersed panel of the hull up to the instantaneous wavy free surface, applying Equation (18) for surge and sway, and Equation (19) for roll and yaw(e.g., [23]),
We have considered the tumblehome hull from the ONR topside series, with , and [25]. The hull was divided into zones, each of which was discretized using triangular panels of zone-specific panel sizing. The densest paneling was applied on a vertical zone extending equilaterally off the design waterline. The significant wave height and peak period were set at and , respectively, while 16 discrete components spanning a band of , centered at the peak frequency value , were considered (Figure 3). Selected results from simulations performed for the case of a JONSWAP spectrum can be seen in Figure 4, Figure 5 and Figure 6. The nominal speed was set at 12.0 m/s and the rudder gain values were , , while or was used. The instantaneous celerity curve is indicatively superimposed over the surge velocity curve.
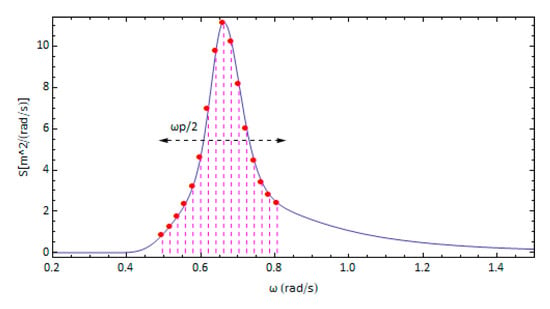
Figure 3.
The JONSWAP spectrum with the frequency range and frequencies considered.
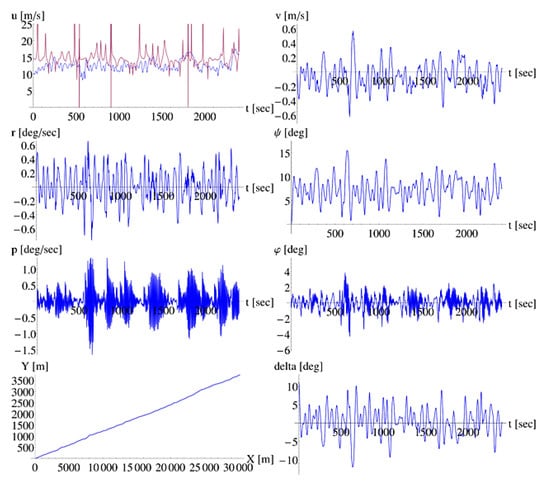
Figure 4.
Simulation results for a PD rudder control scenario. In the diagram concerning the history of surge, the blue line corresponds to the nominal speed, while the red line corresponds to the instantaneous celerity ().
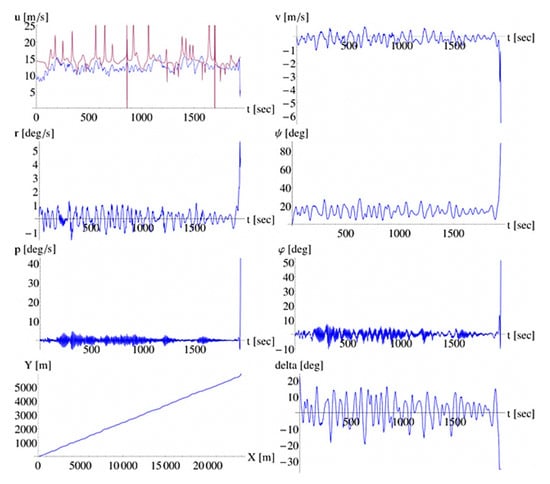
Figure 5.
Simulation of a severe broaching incident ().
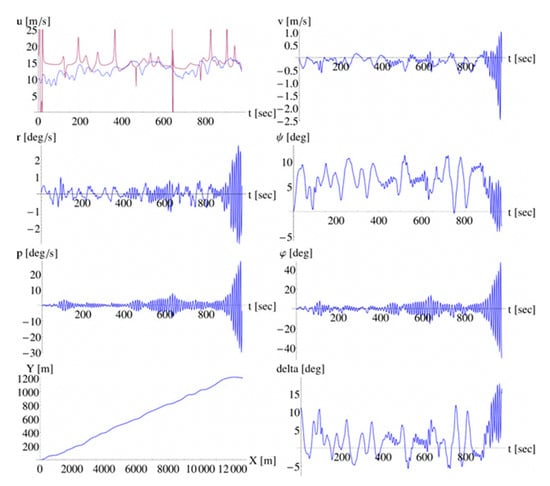
Figure 6.
A simulation for the same scenario as in Figure 4, but for a different wave realization and with GM reduced to 2.5 m. Behavior of parametric type, regarding the response in roll, has appeared ().
The presented time series in Figure 4 are derived from an “average” performed simulation, i.e., a simulation where the vessel sustained the hydrodynamic excitations and reacted with motions of smaller or larger magnitude, that were not, however, framed within a scenario of controllability loss. Such an event, in fact a broaching-to event, is presented in Figure 5, where at around 2000 s the ship suffers from a yaw and roll motion of severe magnitude. Another interesting case is presented in Figure 6, where the vessel attains parametric type responses with significant coupled sway–yaw–roll oscillations that exceed our defined thresholds of capsize criteria.
4. Statistics of Surf-Riding, Broaching-To and Capsize
4.1. Key Points of Calculation and Presentation
The mathematical model of the previous section was used for collecting statistics through a large number of systematic simulations. The main purpose was to quantify the correlation between ship “high-runs” and critical exceedances in yaw and in roll. Ship motion time-records were checked for concurrence of time segments of high-run, large yaw deviation from the commanded heading, and a large increase of the roll angle. Furthermore, sensitivity studies concerning the effect of the commanded heading and the controller’s gains and the value of the vertical position of the center of gravity (KG) are part of the investigation. We distinguish three processes as follows:
4.1.1. Process A: Surge with High-Runs
The identification of high-runs is carried out by utilizing the velocity crossing method that was described in Section 2. Specifically, we select as the up-crossing velocity the wave celerity that corresponds to the peak frequency of the wave spectrum, while ship’s nominal speed is chosen as the down-crossing velocity threshold. These velocity limits were also utilized in [15].
4.1.2. Process B: Yaw with Broaching-To
Given the commanded heading, we determined the time intervals when the yaw angle response exceeded the set limit of permissible yaw angle deviation. In addition, we identified “hard” broaching-to events, i.e. cases where unimpeded yaw turn, with up to at least 90° heading error, developed despite the steering effort, with no return of the ship close to the commanded heading. In these cases, the simulation was ended and a new one was initiated.
4.1.3. Process C: Roll with Critical Exceedances (“Capsizes”)
Exceedances of a predefined roll angle threshold were sought. As a capsize event was identified as any exceedance of the 50° roll angle. Like before, exceedance led to termination of the simulation and initiation of a new run. Figure 7 provides a schematic definition of these 3 processes.
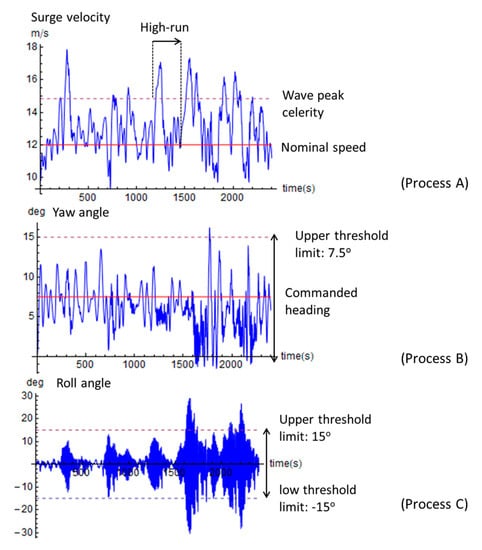
Figure 7.
Definitions of the three processes which set up the ship motion exceedance problem. The upper graph shows the surge process and the associated thresholds (Process A). Similarly, for Process B (yaw angle) in the middle graph, and for Process C (roll angle) in the lower graph.
We calculated several quantities per realization, as follows:
Process A
- Mean duration of high-run events.
- The ratio of the aggregate time of high-run to the total simulation time of each realization.
Process B
- The largest observed yaw angle during a full run.
- The number of exceedances of the yaw angle threshold.
- The mean duration of the yaw exceedance events.
- The time-ratio of yaw angle exceedance, which is derived by the summation of the times of exceedance to the total simulation time of each realization.
For the time-ratio calculation, we targeted two types of yaw angle exceedance: in the first, events are counted on the condition that they occur when a high-run is in progress. In the second all exceedances are counted irrespectively of whether they coincide with a high-run incident. We call the first a “conditional” broaching-to scenario and the second an “unconditional” one.
Process C
- The largest observed roll angle during a full run.
- The time-ratio of roll angle exceedance, similarly to the calculation scheme of yaw angle exceedance.
For the time-ratio calculation we considered:
- Unconditional occurrences, where any type of roll angle exceedance is taken into account.
- Occurrences conditioned upon a high-run incident.
- Occurrences conditioned upon a yaw angle exceedance.
In order to quantify the level of concurrence of the above processes, the next three indices are estimated:
- Index of time concurrence of yaw exceedance and high-run.
- Index of time concurrence of roll exceedance and high-run.
- Index of time concurrence of roll exceedance and yaw exceedance.
The sea state is represented by a JONSWAP spectrum, considering however only a frequency band around the spectrum’s peak period, in order to introduce a “narrow-band” condition. Table 1 presents the values of the parameters that define what will be called “the main scenario” of the present investigation. For the presentation of the key statistical information, as derived by the 500 realizations per scenario, we select the whisker-box type of diagram. This is a convenient type of graph in descriptive statistics for the graphical comparison of distributions, based mainly on their quartiles. Specifically, according to Figure 8, the lower line of the box corresponds to the 1st quartile (or the 25th percentile), while the upper line of the box corresponds to the 3rd quartile (or the 75th percentile). Furthermore, the median is also included in the graph, whereas in the following graphs we have also included the mean value.

Table 1.
Parameters of the base scenario.
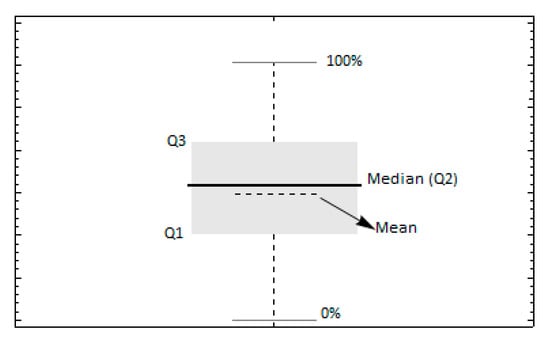
Figure 8.
Sample graph presentation targeting the key statistical information.
The distances between the different parts of the box provide indications of the dispersion and skewness of the distribution as do L-estimators such as the interquartile range . Moreover, the plot contains horizontal lines (the “fences”) surrounding the box where the upper line corresponds to the maximum value (100% percentile) and the lower line corresponds to the minimum (0% percentile).
4.2. Key Points of Calculation and Presentation
4.2.1. Effect of Commanded Heading
As in the case where a 3DOF model was used [15], it is expected that the commanded heading will significantly affect both the occurrence of high-run and yaw-exceedance events. Figure 8 presents the time-ratios of these processes for the two models for the two examined commanded headings. Concerning the high-run time-ratio, the difference between the two models is more pronounced for the 7.5° heading scenario, where the 4DOF model presents a lower tendency for high-runs. Furthermore, the expected decrease when the heading is increased is more pronounced for the 3DOF model. On the other hand, the 4DOF model presents a higher ratio of exceedance of the yaw angle threshold for the 15° heading than those of the 3DOF, while the results are comparable for the 2 models when the heading is 7.5°. In addition, Figure 9 includes the time-ratio of exceedance of the roll threshold, where a slight increase occurs for the higher heading scenario.
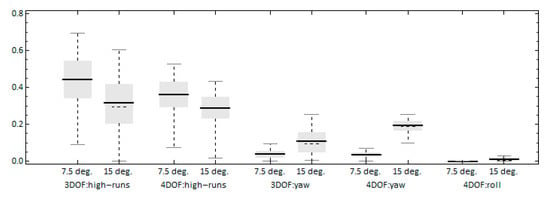
Figure 9.
Effect of the commanded heading on the time-ratio of high-runs, yaw and roll angle exceedances. For the 4DOF model, KG = 6.5 m.
We further examine the difference in the occurrence of yaw exceedance between the 2 models by calculating the frequency and duration of these events (Figure 10). For the 15° heading, the yaw exceedances of the 4DOF model occur much more frequently but with lower mean duration compared with the respective ones of the 3DOF model. One more difference between the 2 models is that for the 4DOF model the exceedance duration is larger for the 7.5° heading. The longer exceedance durations observed in the 3DOF seem to result with higher yaw angles achieved, as Figure 11 shows. The yaw and roll angles are significantly increased for the higher heading scenario (15°). However, while the mean yaw angle values between the 3DOF and 4DOF models are comparable, the 3DOF model resulted in higher values for the higher percentiles. For example, the 3rd quartile values are 77 deg. and 60 deg. for the 3DOF and 4DOF models, respectively. Therefore, the addition of the rolling motion seems to decrease the yaw exceedance duration and the amplitude of the yaw response, but increase the frequency of threshold exceedances.
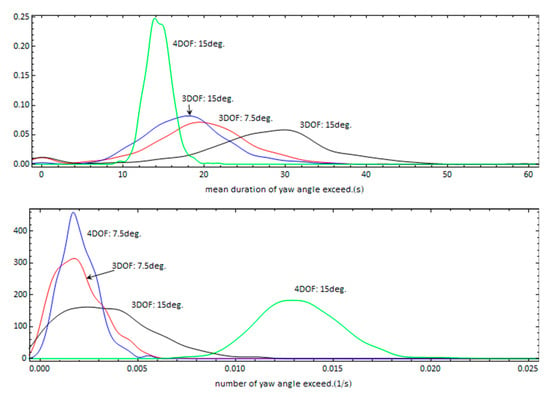
Figure 10.
Probability density functions of the mean duration of yaw exceedance (upper graph) and number of exceedances per unit time (lower graph) for different commanded headings using the 3DOF and 4DOF models.
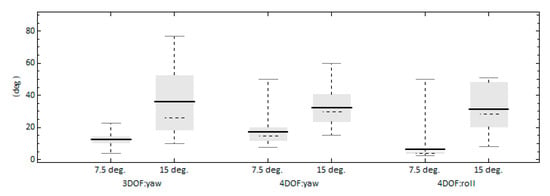
Figure 11.
Effect of the commanded heading on the maximum yaw and roll angle achieved. For the 4DOF model, KG = 6.5 m.
One of our main aims in this study is to examine whether the examined processes are correlated with each other. Specifically, by utilizing the concurrence index as defined previously, we aim at quantifying the ratio of the roll exceedances that occur during significant yaw deviations or during high-runs. Additionally, we examine whether yaw deviations from the commanded heading are related with high-runs occurrences. Such an analysis was carried out also for the 3DOF model as shown in Figure 12, where high concurrence of yaw exceedances and high-run events had been found out for both headings.
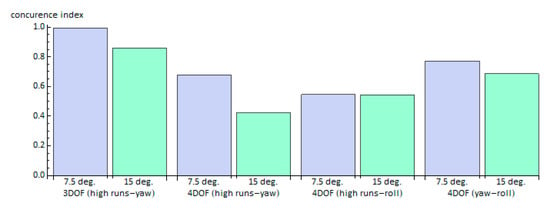
Figure 12.
Effect of the commanded heading on the concurrence index. For the 4DOF model, KG = 6.5 m.
However, a decrease of such concurrence is observed when the heading is increased in both models. The 4DOF model presents lower concurrence between high-run and yaw exceedance from that of the 3DOF model. Especially, the decrease is more pronounced (about 40%) for the higher heading than that for the 7.5° heading (30%). Therefore, it seems that the addition of the rolling motion weakens the concurrence level between high-runs and yaw. On the other hand, the large majority of the excessive rolling (above 75%) occurs while yaw angle exceeds the predefined threshold levels (7.5°). Moreover, as it is expected, the concurrence between roll and high-runs is not affected by the heading angle. Of course, this analysis depends on the threshold values whose exceedance characterizes the significant yawing and rolling and thus, the next sub-section examines this effect.
4.2.2. Effect of the Set Thresholds
We examine how the limiting thresholds affect the statistical values derived and, in particular, their effect on the concurrence of the three targeted processes. Figure 13 presents the yaw angle exceedances, including the conditional ones. The variation of threshold limits significantly affects both the exceedance time itself (being reduced as the threshold value is increased), and the strength of correlation. Therefore, the stricter the definition of the response corresponding to extreme yawing, the higher the concurrence of yaw exceedances with high runs. Similar trends are shown in Figure 14 regarding the time-ratio of roll exceedance. The level of its concurrence with yaw exceedance is greater when that roll limiting threshold is increased, while the roll concurrence with the high-runs is not affected. It shall be noted that for this analysis we select a higher KG value in order to derive significant ratios of roll exceedance within the range of threshold angles examined.
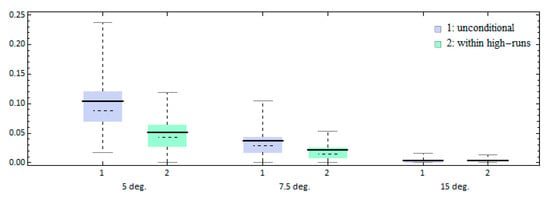
Figure 13.
Effect of selected yaw threshold limit on the time-ratio of yaw exceedance (ΚG = 7.25 m).
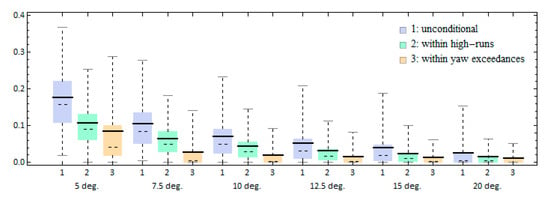
Figure 14.
Effect of roll angle threshold limit on the time-ratio of roll exceedance (KG = 7.25 m).
4.2.3. Effect of the PD Control Parameters
The next sensitivity study concerns the influence of rudder control gains and specifically the influence of the proportional one. The commanded heading angle was set at 15° in order to focus on large responses. The proportional gain was increased to while the differential gain was kept at its initial value, Figure 15 presents the results of the time-ratios for the two models. Concerning the high-runs, the effect of the increase of the proportional gain is more apparent for the 3DOF model where the time of high-runs is decreased, whereas for the 4DOF model there is no significant change. On the other hand, the time of excessive yawing is reduced for both models but again the 3DOF model presents greater sensitivity. Roll exceedance seems to not be significantly affected. Regarding the maximum angles achieved (Figure 16), the increase of the proportional gain resulted in a significant decrease of the yaw angle for the 3DOF model, a behavior that is not repeated by the 4DOF model. The maximum roll angle, as in the case of the time-ratio, does not present sensitivity in the change of the proportional gain.
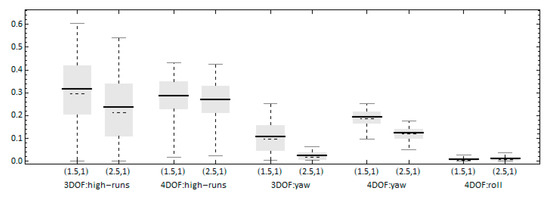
Figure 15.
Effect of the control gains on the time-ratio of high-runs, yaw and roll exceedances. For the 4DOF model, KG = 6.5 m. The commanded heading is 15 deg. Case 1: , while in Case 2: .
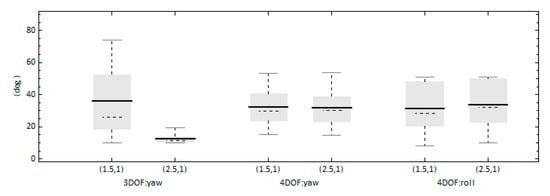
Figure 16.
Effect of the control gains’ options on the maximum yaw and roll angle achieved. For the 4DOF model, KG = 6.5 m. The commanded heading is 15 deg. In Case 1: , while in Case 2: .
For further examination of the difference between the two models concerning the effect of the control gains, Figure 17 presents the probability density functions of the mean yaw exceedance duration and the number of exceedances per unit time. From the first measure and the 3DOF model, there is an obvious decrease of the mean duration as the proportional gain increases. However, such a level of decrease in mean duration does not occur for the 4DOF model. It can also be concluded that the large yaw angles derived by the 3DOF model for the lower set of control gains was the result of the high mean duration of the yaw exceedance, thus there is available time for large deviations to develop. On the contrary, the results of the 4DOF model do not deviate significantly with a change of gain value, even though an expected decrease in both exceedance duration and its frequency of occurrence is observed.
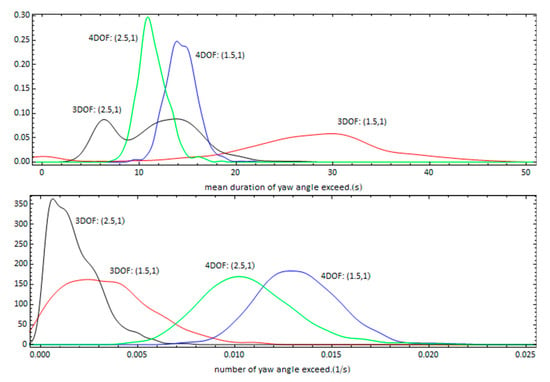
Figure 17.
Estimates of the probability density functions for the mean duration of yaw exceedance (up) and the number of yaw exceedances per unit time (down) for different control gains’ options (, and ).
4.2.4. Effect of the KG
The assumed value of the vertical position of the center of gravity, KG, is expected to affect the roll statistics. Figure 18 presents the results for the maximum yaw and roll angle achieved for a range of KG values. For the roll angles, there is a steady increasing trend as the vessel’s KG was increased while the maximum yaw angle did not show sensitivity. Notably, for KG = 7.5 m the mean value of maximum roll angles (from all realizations) was approximately 50°. It means that capsize due to the exceedance of the critical roll angle threshold occurred in almost every realization. It shall be remembered that loss events are characterized as events where, either capsize due to exceedance of the threshold limit of roll angle (50°), or “hard” broaching-to due to yaw angle exceedance of 90° from the commanded heading has occurred. For the examined scenario of 7.5° commanded heading, all loss events were owed to excessive roll.
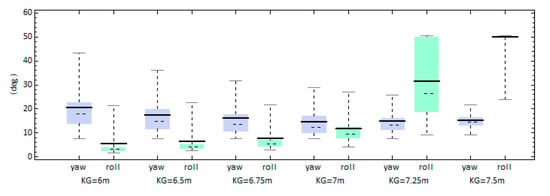
Figure 18.
Maximum relative yaw and roll angles observed.
Regarding the effect on the concurrence index, according to Figure 19, the occurrences of roll exceedance for the larger values of KG are, in their majority, not strongly correlated with significant yaw motion (less than 40%). This trend is reversed for the lower values of KG, where roll exceedance occurs in most cases within yaw exceedances (above 80%). On the other hand, the concurrence with high-run appears to not be greatly affected by KG, as indices of 55–65% were estimated in the examined KG range. Moreover, the concurrence index of yaw exceedance and high-run is slightly better for the lower KG values (about 70%) and decreases for the higher ones.
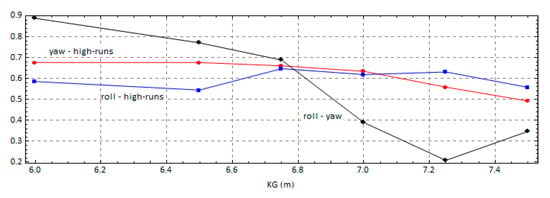
Figure 19.
Effect of the KG on the indices of concurrence.
5. Concluding Remarks
A mathematical model for studying the interaction between high-runs, broaching to and excessive rolling motion has been developed. The model accounts for the surge–sway–yaw–roll and rudder motions of a naval ship in following/quartering and it represents an expansion of our earlier surge–sway–yaw and rudder model. In addition, the hydrostatic and Froude-Krylov hydrodynamic loads are now calculated up to the instantaneous wave surface during every time step. This differs from our previous model where the incident wave loads were utilized via RAO and phase shift pre-calculated tables, and for the hull excitation corresponding to submergence up to the still water level.
This model was used for deriving statistical estimates of high-run, broaching-to and capsize, via direct counting schemes (based on 7500 runs of 40 min duration each), aimed at quantifying the level of concurrence between these three processes. Furthermore, several sensitivity studies were carried out in order to examine the effect of the commanded heading, the rudder control gains and the threshold limits that define excessive motion. It was derived that the greater the set threshold angle (both for yaw and for roll), the greater is the index of concurrence with high-run. On the other hand, by increasing the angle of the commanded heading, is the propensity for excessive roll response, within intervals of significant yawing motion is higher. It was also observed that the addition of the rolling motion in the 4DOF model decreased the yaw exceedance duration and the amplitude of yaw response, but resulted in an increase in the frequency of threshold exceedances.
The increase of the proportional gain resulted in reducing the high-runs and yaw exceedance ratio, but not with the same intensity as revealed by the respective results of the 3DOF model. The maximum yaw angle achieved according to the 4DOF model was not affected by the increase of the proportional gain. However, for the 3DOF model, a significantly lower yaw response was observed, due to the decrease of both the exceedances per unit time and their durations. Concerning loss events due to broaching-to, they occurred only for the lower KG values examined and with a much smaller frequency than capsizes due to exceedance of the critical roll angle. For the higher KG values examined, capsize events were observed more frequently, however, they were unrelated to the broaching-to occurrences.
Author Contributions
Conceptualization, N.T., K.J.S.; Data curation, N.T.; Formal Analysis, N.T., M.A., K.J.S.; Funding acquisition, K.J.S.; Investigation, N.T., M.A., K.J.S.; Methodology, N.T., M.A., K.J.S.; Project administration, K.J.S.; Resources, K.J.S.; Software, N.T., M.A.; Supervision, K.J.S., Validation, M.A., Visualisation, N.T.; Writing—original draft, N.T., M.A., K.J.S.; Writing—review & editing, N.T., K.J.S. All authors have read and agree to the published version of the manuscript.
Funding
This work has been funded through grant number N62909-15-1-2013 by the Office of Naval Research under Woei-Min Lin (currently ONR Program Officer code 33) and by the Office of Naval Research Global under Salahuddin Ahmed.
Acknowledgments
Valuable discussions with Vadim Belenky and Kenneth Weems of the David Taylor Model Basin are acknowledged.
Conflicts of Interest
The authors declare no conflict of interest. The funders had no role in the design of the study; in the collection, analyses, or interpretation of data; in the writing of the manuscript, nor in the decision to publish the results.
Nomenclature
| amplitude of wave component | ship wetted surface | ||
| Froude-Krylov loads on mode | surge velocity | ||
| hydrostatic loads on mode | sway velocity | ||
| gravity acceleration | longitudinal center of gravity | ||
| GM | metacentric height | surge added mass | |
| roll moment of inertia | acceleration coefficient for sway due to sway acceleration | ||
| yaw moment of inertia | acceleration coefficient for sway due to yaw acceleration | ||
| wave number of wave component | velocity coefficient for sway due to sway velocity | ||
| added roll moment of inertia | velocity coefficient for sway due to yaw velocity | ||
| roll damping | rudder hydrodynamic reaction in sway | ||
| rudder induced roll moment | vertical center of gravity (m) | ||
| ship mass | vertical moment arm of hull hydrodynamic force | ||
| normal vector of panel | vertical moment arm of rudder hydrodynamic force | ||
| propeller revolutions | rudder angle | ||
| acceleration coefficient for yaw due to sway acceleration | random phase shift of wave component j | ||
| acceleration coefficient for yaw due to yaw acceleration | local water elevation | ||
| velocity coefficient for yaw due to sway velocity | ordinate of ship’s position in earth fixed frame | ||
| velocity coefficient for yaw due to yaw velocity | wave direction | ||
| rudder induced yaw moment | abscissa of ship’s position in earth fixed frame | ||
| roll angular velocity | water density | ||
| yaw angular velocity | roll angle | ||
| vector pointing from origin of body fixed system to centroid of panel | yaw angle | ||
| ship resistance | commanded heading | ||
| propeller thrust | wave frequency corresponding to wave component | ||
| time |
References
- Belenky, V.L.; Spyrou, K.J.; van Walree, F.; Neves, M.A.S.; Umeda, N. (Eds.) Contemporary Ideas on Ship Stability: Risk of Capsizing; Springer: Dordrecht, The Netherlands, 2019; ISBN 978-3-030-00514-6. [Google Scholar]
- Manderbacka, T.; Themelis, N.; Bačkalov, I.; Boulougouris, E.; Eliopoulou, E.; Hashimoto, H.; Konovessis, D.; Leguen, J.-F.; González, M.M.; Rodríguez, C.A.; et al. An overview of the current research on stability of ships and ocean vehicles: The STAB2018 perspective. Ocean Eng. 2019, 186, 1–16. [Google Scholar] [CrossRef]
- de Jong, P.; Renilson, M.R.; van Walree, F. The effect of ship speed, heading angle and wave steepness on the likelihood of broaching-to in astern quartering seas. In Proceedings of the 12th International Conference on the Stability of Ships and Ocean Vehicles (STAB2015), Glasgow, UK, 14–19 June 2015; pp. 1103–1114. [Google Scholar]
- Belenky, V.; Spyrou, K.J.; Weems, K. On the probabilistic properties of surf-riding and broaching-to in irregular waves. In Proceedings of the 31st Symposium on Naval Hydrodynamics, Monterey, CA, USA, 11–16 September 2016. [Google Scholar]
- Umeda, N.; Usada, S.; Mizumoto, K.; Matsuda, A. Broaching probability for a ship in irregular stern-quartering waves: Theoretical prediction and experimental validation. J. Mar. Sci. Technol. 2016, 21, 23–37. [Google Scholar] [CrossRef]
- IMO. Finalization of Second Generation Intact Stability Criteria, Report of the Correspondence Group (Part 1), SDC7/5; International Maritime Organization (IMO): London, UK, 2019. [Google Scholar]
- Feng, P.; Fan, S.; Liu, X. Study on the second generation intact stability criteria of broaching failure mode. In Proceedings of the 12th International Conference on the Stability of Ships and Ocean Vehicles (STAB2015), Glasgow, UK, 14–19 June 2015; pp. 195–202. [Google Scholar]
- Bonci, M.; Renilson, M.; De Jong, P.; Van Walree, F.; Van’t Veer, R. On the direct assessment of broaching-to vulnerability of a high speed craft. In Proceedings of the 13th International Conference on the Stability of Ships and Ocean Vehicles (STAB2018), Kobe, Japan, 16–21 September 2018; pp. 119–129. [Google Scholar]
- Terada, D.; Amano, R.; Katayama, T. A motion estimation method of high speed craft in irregular sea by using onboard monitoring motion time series data for motion control. In Proceedings of the 16th International Ship Stability Workshop (ISSW2017), Belgrade, Serbia, 5–7 June 2017; pp. 233–238. [Google Scholar]
- Hashimoto, H.; Taniguchi, Y.; Fujii, M. A case study on operational limitations by means of navigation simulation. In Proceedings of the 16th International Ship Stability Workshop (ISSW2017), Belgrade, Serbia, 5–7 June 2017; pp. 41–48. [Google Scholar]
- Motora, S.; Fujino, M.; Koyonagi, M.; Ishida, S.; Shimada, K.; Maki, T. A consideration on the mechanism of occurrence of broaching-to phenomena. J. Soc. Nav. Archit. Jpn. 1981, 150, 211–222. [Google Scholar] [CrossRef]
- Spyrou, K.J. Dynamic instability in quartering seas: The behavior of a ship during broaching. J. Ship Res. 1996, 40, 46–59. [Google Scholar]
- Themelis, N.; Spyrou, K.J.; Belenky, V. High runs of a ship in multi-chromatic seas. Ocean Eng. 2016, 120, 230–237. [Google Scholar] [CrossRef]
- Kontolefas, I.; Spyrou, K.J. Predicting the probability of ship high-runs from phase space data. J. Ship Res. 2020, 64, 81–97. [Google Scholar] [CrossRef]
- Spyrou, K.J.; Themelis, N.; Kontolefas, I. Numerical statistical estimates of ship broaching-to. J. Ship Res. 2016, 60, 219–238. [Google Scholar] [CrossRef]
- Spyrou, K.J.; Belenky, V.; Themelis, N.; Weems, K. Detection of surf-riding behaviour of ships in irregular seas. Nonlinear Dyn. 2014, 78, 649–667. [Google Scholar] [CrossRef]
- Kan, M. Surging of large amplitude and surf-riding of ships in following seas. In Selected papers in Naval Architecture and Ocean Engineering; The Society of Naval Architects of Japan: Tokyo, Japan, 1990; pp. 152–162. [Google Scholar]
- Feldman, M. Hilbert Transform Applications in Mechanical Vibration; John Wiley & Sons, Ltd.: West Sussex, UK, 2011; ISBN 978-0-470-97827-6. [Google Scholar]
- Spyrou, K.J.; Belenky, V.; Reed, A.; Weems, K.; Themelis, N.; Kontolefas, I. Split-Time method for pure loss of stability and broaching-to. In Proceedings of the 30th Symposium on Naval Hydrodynamics, Tasmania, Australia, 2–7 November 2014. [Google Scholar]
- Lewandowski, E.M. The Dynamics of Marine Craft: Maneuvering and Seakeeping; World Scientific: Singapore, 2004; ISBN 978-9-810-24756-0. [Google Scholar]
- Lewis, E.V. (Ed.) Principles of Naval Architecture, Vol 3: Motion in Waves and Controllability; The Society of Naval Architects and Marine Engineers: Jersey City, NJ, USA, 1989; ISBN 0-939773-02-3. [Google Scholar]
- Mikelis, N.E. A procedure for the prediction of ship manoeuvring response for initial design. In Proceedings of the 5th Conference on Computer Applications in the Automation of Shipyard Operation and Ship Design, Trieste, Italy, 16–20 September 1985. [Google Scholar]
- Belenky, V.L.; Sevastianov, N.B. Stability and Safety of Ships: Risk of Capsizing; The Society of Naval Architects and Marine Engineers: Jersey City, NJ, USA, 2007; ISBN 0-939773-61-9. [Google Scholar]
- Newman, J. Marine Hydrodynamics; MIT Press: Cambridge, UK, 1977; ISBN 9-780-26228-061-7. [Google Scholar] [CrossRef]
- Bishop, B.; Belknap, W.; Turner, C.; Simon, B.; Kim, J. Parametric Investigation on the Influence of GM, Roll Damping and above Water Form, on the Roll Response of Model 5613. Report NSWCCD-50-TR-2005/027; Naval Surface Warfare Center/Carderock Division: West Bethesda, MD, USA, 2005. [Google Scholar]
Publisher’s Note: MDPI stays neutral with regard to jurisdictional claims in published maps and institutional affiliations. |
© 2020 by the authors. Licensee MDPI, Basel, Switzerland. This article is an open access article distributed under the terms and conditions of the Creative Commons Attribution (CC BY) license (http://creativecommons.org/licenses/by/4.0/).