Article

A Study on the Minimization of Mooring Load in Fish-Cage Mooring Systems with a Damping Buoy

1
Fisheries Resources and Environment Division, West Sea Fisheries Research Institute, NIFS, Incheon 22383, Korea
2
Fisheries Engineering Division, National Institute of Fisheries Science, Busan 46083, Korea
*
Author to whom correspondence should be addressed.
J. Mar. Sci. Eng. 2020, 8(10), 814; https://doi.org/10.3390/jmse8100814
Submission received: 6 September 2020 / Revised: 14 October 2020 / Accepted: 17 October 2020 / Published: 19 October 2020
(This article belongs to the Special Issue Application of Flexible Structure in Marine Engineering)

Abstract

:
This study established the conditions in which mooring load is minimized in a fish cage that includes a damping buoy in specific wave conditions. To derive these conditions, numerical simulations of various mooring contexts were conducted on a fish cage (1/15 scale) using a simplified mass-spring model and fifth-order Stokes wave theory. The simulation conditions were as follows: (1) bridle-line length of 0.8–3.2 m; (2) buoyancy of 2.894–20.513 N for the damping buoy; and (3) mooring-rope thickness of 0.002–0.004 m. The wave conditions were 0.333 m in height and 1.291–2.324 s of arrival period. Consequently, the mooring tensions tended to decrease with decreasing mooring line thickness and increasing bridle-line length and buoyancy of the buoy. Accordingly, it was assumed to be advantageous to minimize the mooring tension by designing a thin mooring line and long bridle line and for the buoyancy of the buoy to be as large as possible. This approach shows a valuable technique because it can contribute to the improvement of the mooring stability of the fish cage by establishing a method that can be used to minimize the load on the mooring line.

1. Introduction

The successful operation of a fish farming facility and its fish cages requires considering the cages’ interaction with the natural environment [1]. Among various natural environments, sea waves and currents present major threats to the structural stability of cage facilities. The stronger the waves and currents, the more the load on the cage system increases and the stability of the cage facility decreases. As the stability of the cage system decreases, the probability of breakages, deformations and losses of the cage increases, and the possibility of survival of cultured fish in the cage decreased. This indicates that the instability of the fish cage system causes economic losses. Therefore, for stable aquaculture business operation and economic profit generation, the stability of the cage facilities must be secured first.
To date, multiple studies have been conducted, which aimed at minimizing the load on cages because of waves and currents to prevent damage to the cage system. Zhao et al. [2] studied how to obtain mooring stability for a large-scale cage system by measuring the tension on the mooring line and the flow velocity of each cage when eight cages were affected by current flow. Xu et al. [3] conducted a fatigue design analysis based on time-domain analysis to establish the range of stress under the cage-mooring system. Shainee et al. [4] analyzed the motion characteristics of a cage in sea current and wave conditions during the submergence process of a self-submersible single-point mooring cage. Hou et al. [5] evaluated the stability of the cage-mooring system by analyzing the extreme tension distribution effected by the mooring system. Hou et al. [6] proposed an improved lumping-block equivalent method to estimate the fatigue limit of a cage-mooring system. Cifuentes and Kim [7] analyzed the changes in the mooring tension of a cage caused by waves and currents, particularly for long and steep waves, using Morrison’s equations. Lee et al. [8] modeled a fish cage with floating collars and a net using a mass-spring model and investigated the tension on the mooring line when the cage was affected by waves. Zhao et al. [9] investigated the mooring tension and the response characteristics of a semi-submersible offshore cage with a solid frame affected by waves. To reduce the impact on the cage affected by the marine environment, it is necessary to reduce the resistance of the net and frame of the cage to waves and currents; moreover, it is important to achieve cage-mooring stability by reducing the load on the mooring line. If the load on the mooring line exceeds the holding force of the mooring line, the entire cage system can be lost. As such, when designing cages, not only increasing the holding force of the mooring line, but also a method of minimizing the load that the mooring line receives from waves or currents must be considered. A simple approach to increase the stability of a mooring system is to increase its holding force. This can be achieved by enhancing the characteristics of the anchor by increasing its weight or by replacing the line connected to the anchor with a chain such that the line is less lifted up from the seabed. The smaller the angle between the anchor line and the seabed, the stronger the holding force of the anchor [10]. Another approach to reduce the load on the mooring line is to install a buoy on this line. The buoy can reduce the mooring load by absorbing some tension on the mooring lines [10,11]. Cha and Lee [12] demonstrated that a buoy on the mooring line was able to reduce the load from waves by ~50% depending on the mooring conditions. Various examples of the use of buoys in cage design are available, and related studies have often observed buoys attached to mooring lines [2,3,5,6,11,13,14]. Although buoys are used in various cage systems, research on the ways to minimize the load on mooring lines as per a mooring method related to buoy arrangement remains scarce. In this study, to identify mooring conditions in which the mooring load can be minimized, the mooring tensions of a fish-cage system were calculated by numerical modeling techniques as per the buoy installation position, the buoyancy of the buoy, and the mooring-line thickness when the cage was affected by waves.

2. Materials and Methods

The cage to be subjected to numerical modeling was a cylindrical cage scaled down by 1/15 of the actual cage, which has been used in the south coast of Korea. Collars (rims) were attached to the upper and lower parts of the net to maintain the cage shape, and 12 weights were attached to the lower rim and the net was a chain-linked copper alloy (copper: 65%, zinc: 35%) net. This cage was the same one used in Cha and Lee [12]’ study. The cage was connected to one mooring line, and a buoy was attached to the mooring line. In this study, the line between the buoy and the cage was called the bridle-line. The schematic diagram and detailed specifications of the cage were shown in Figure 1 and Table 1, respectively.

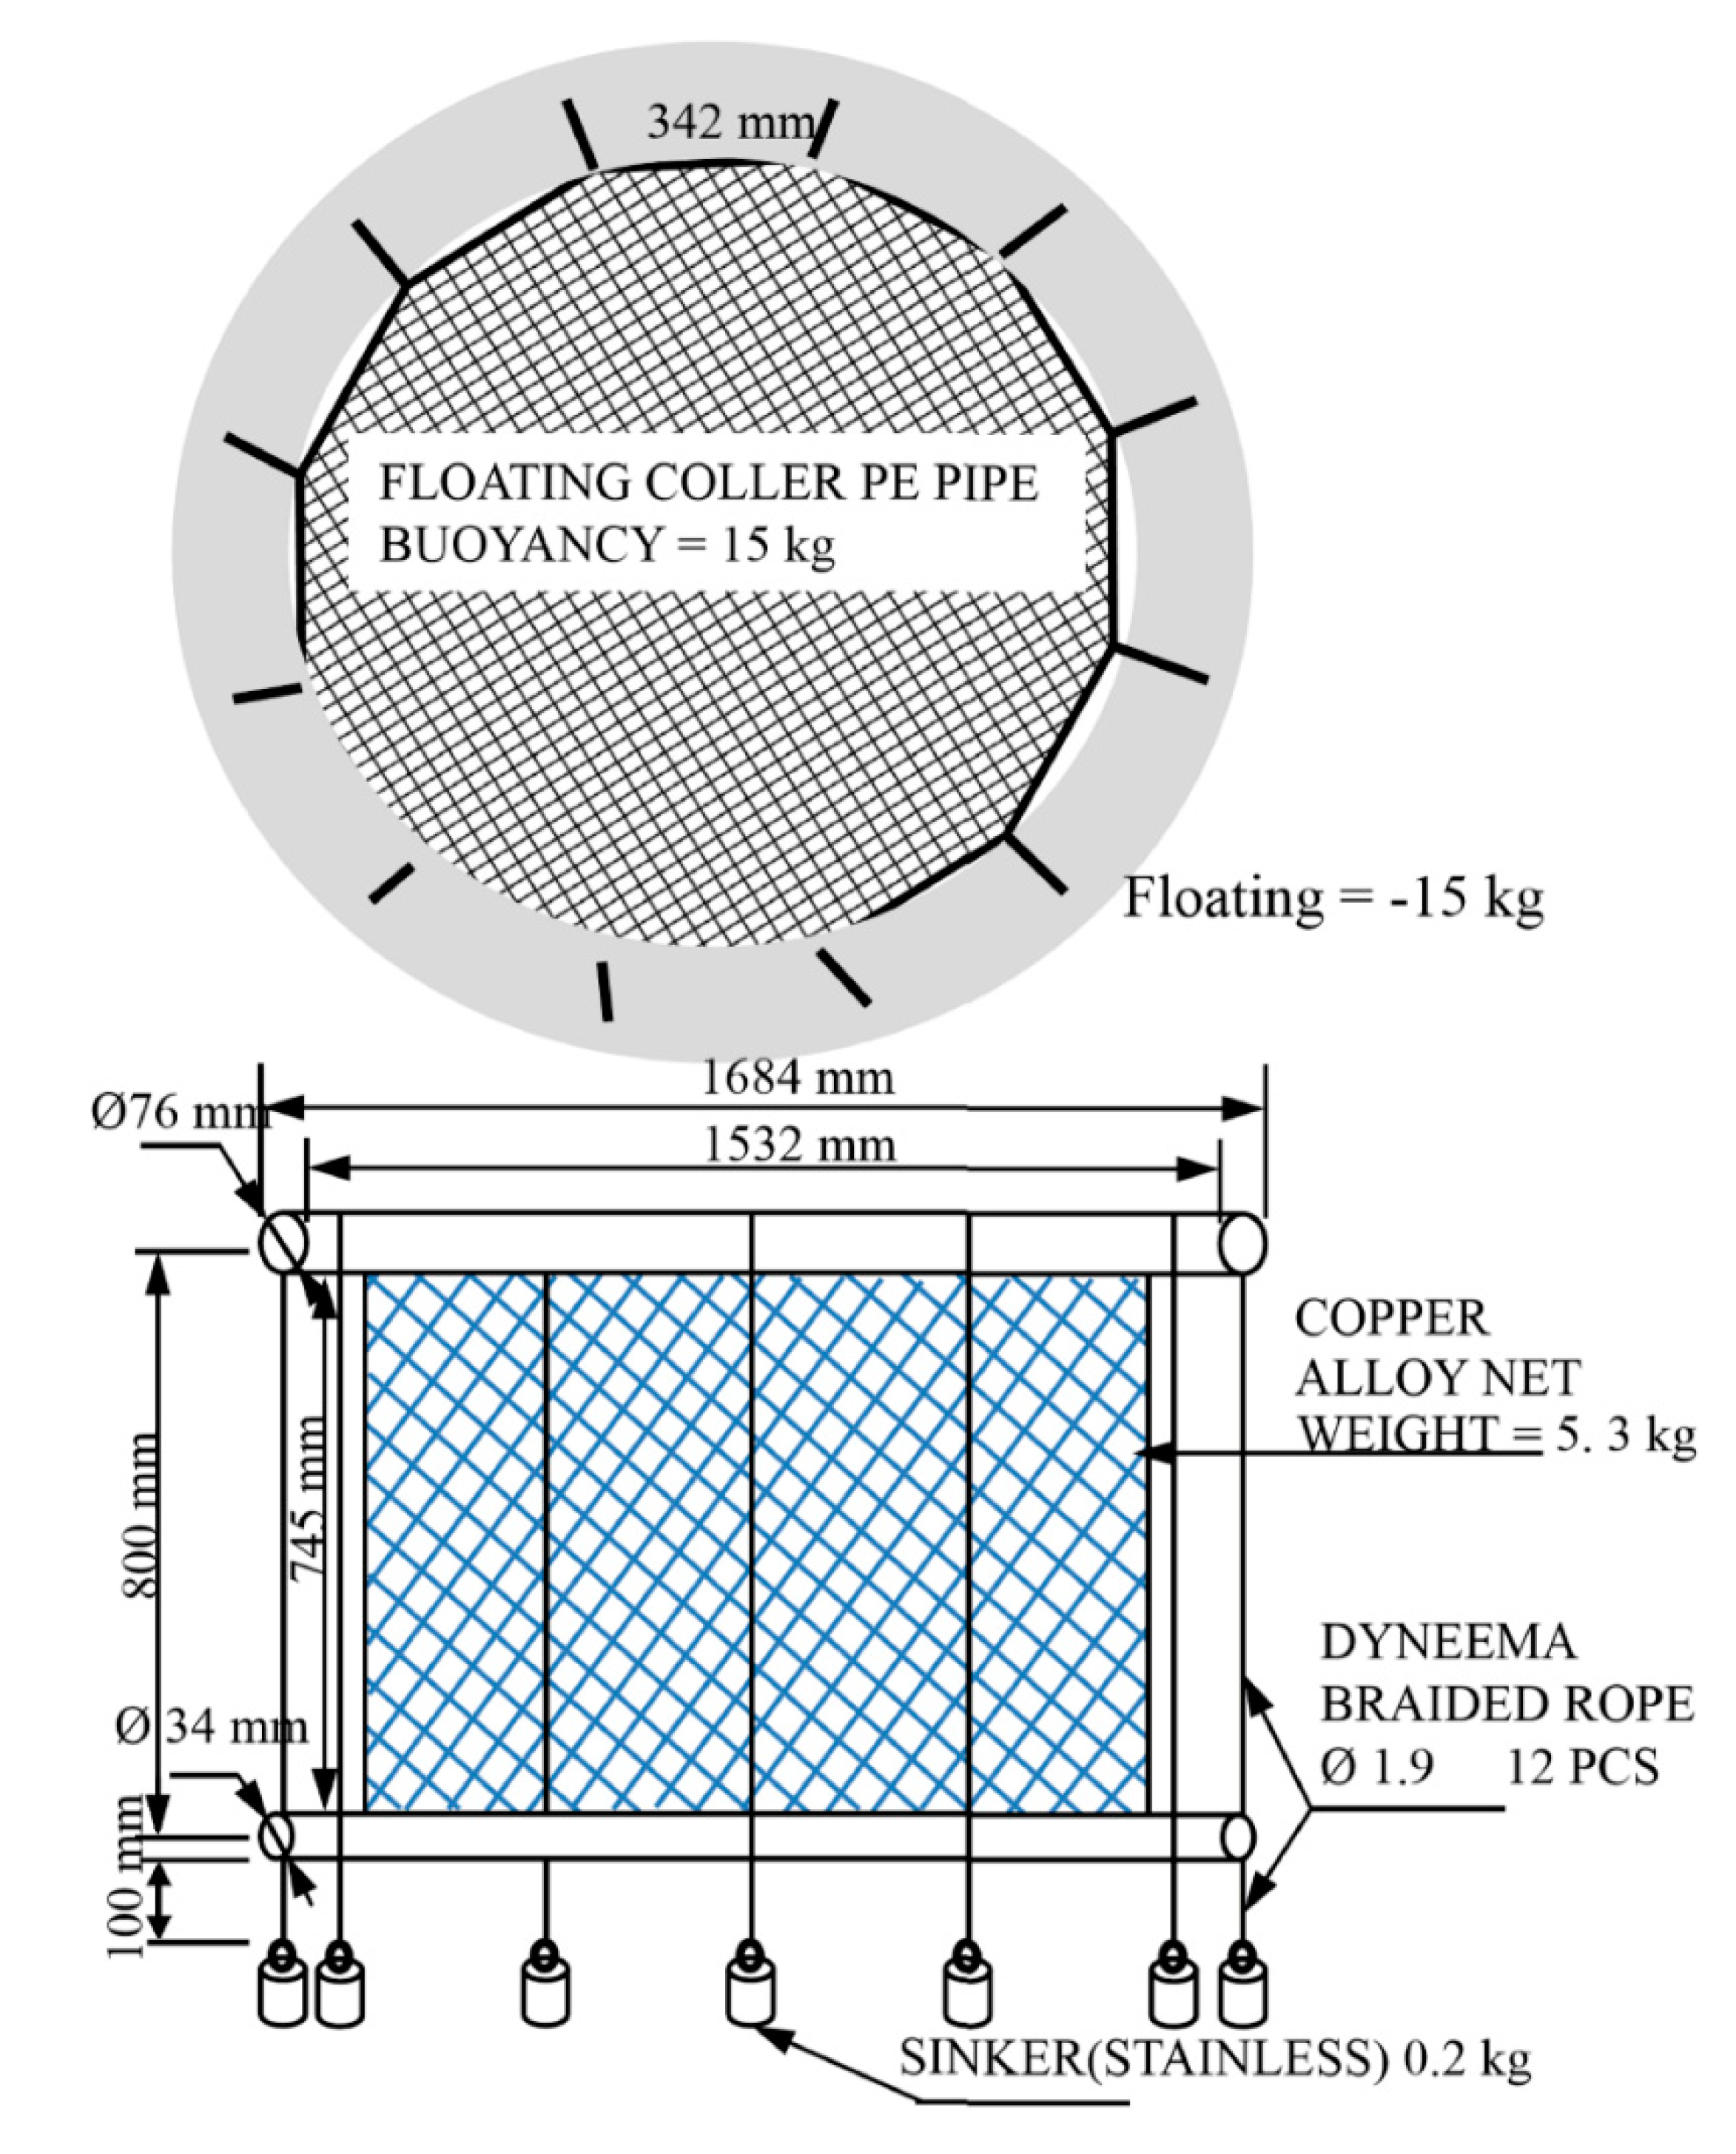
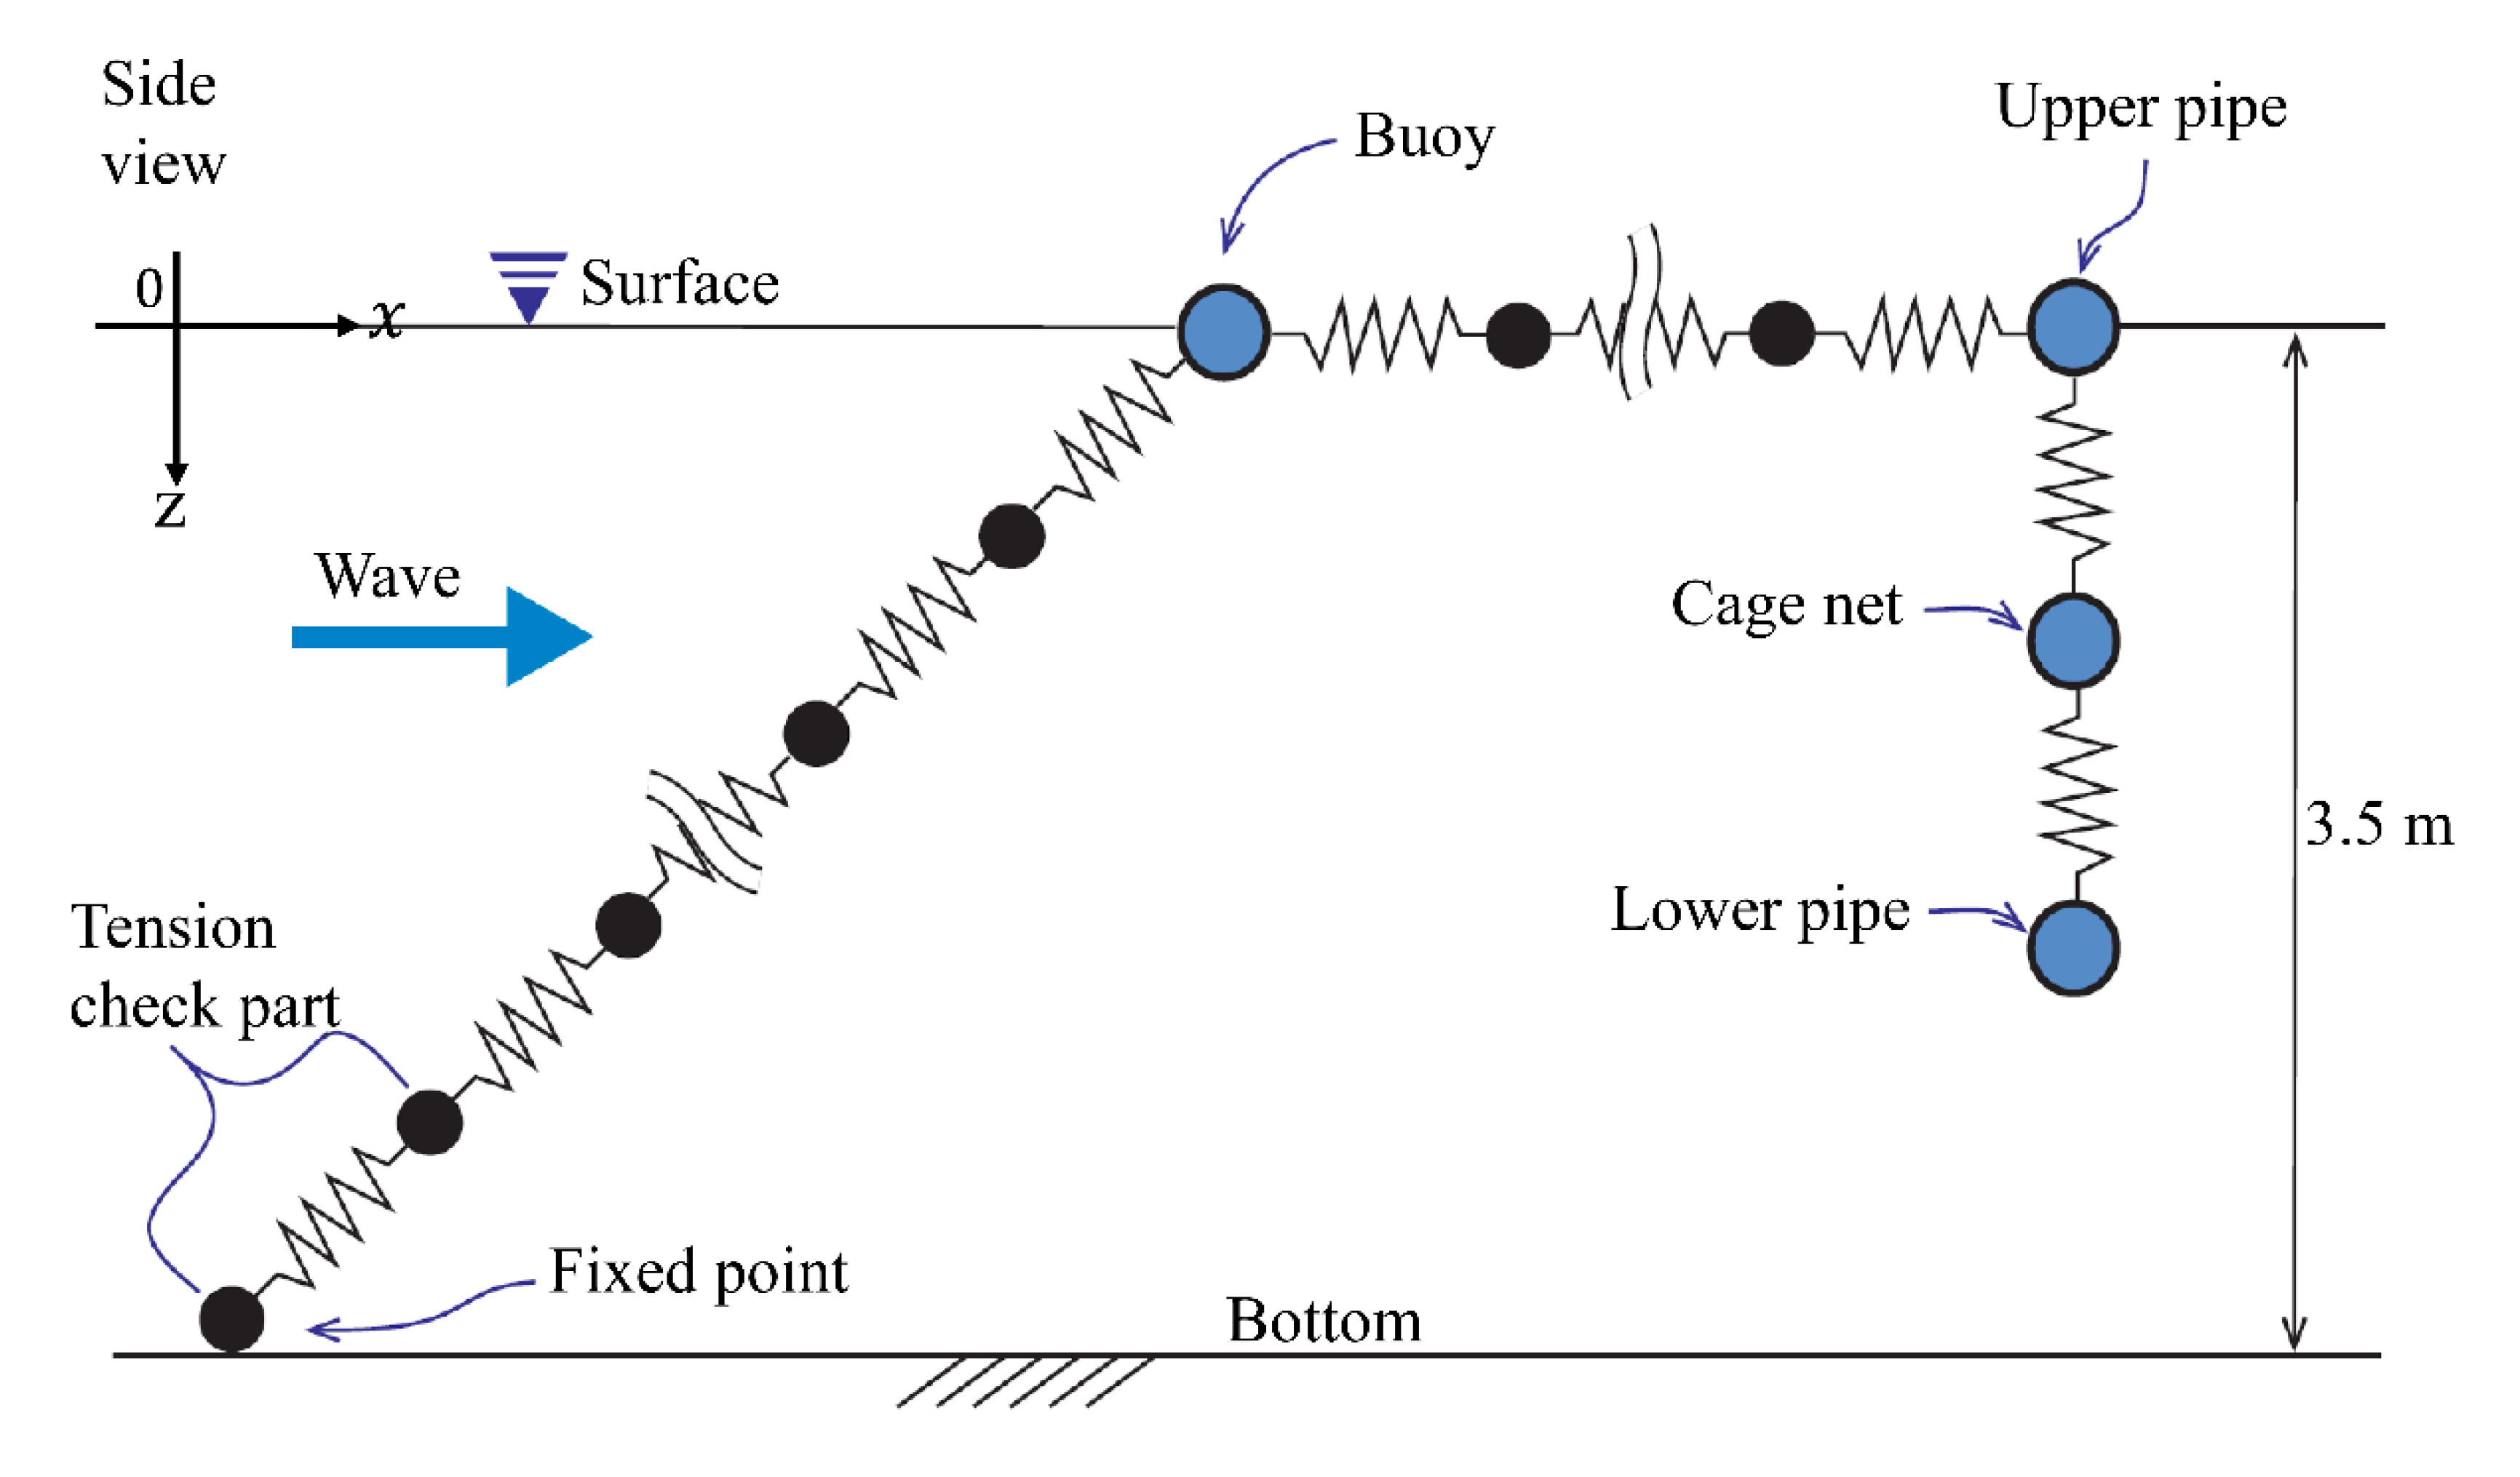
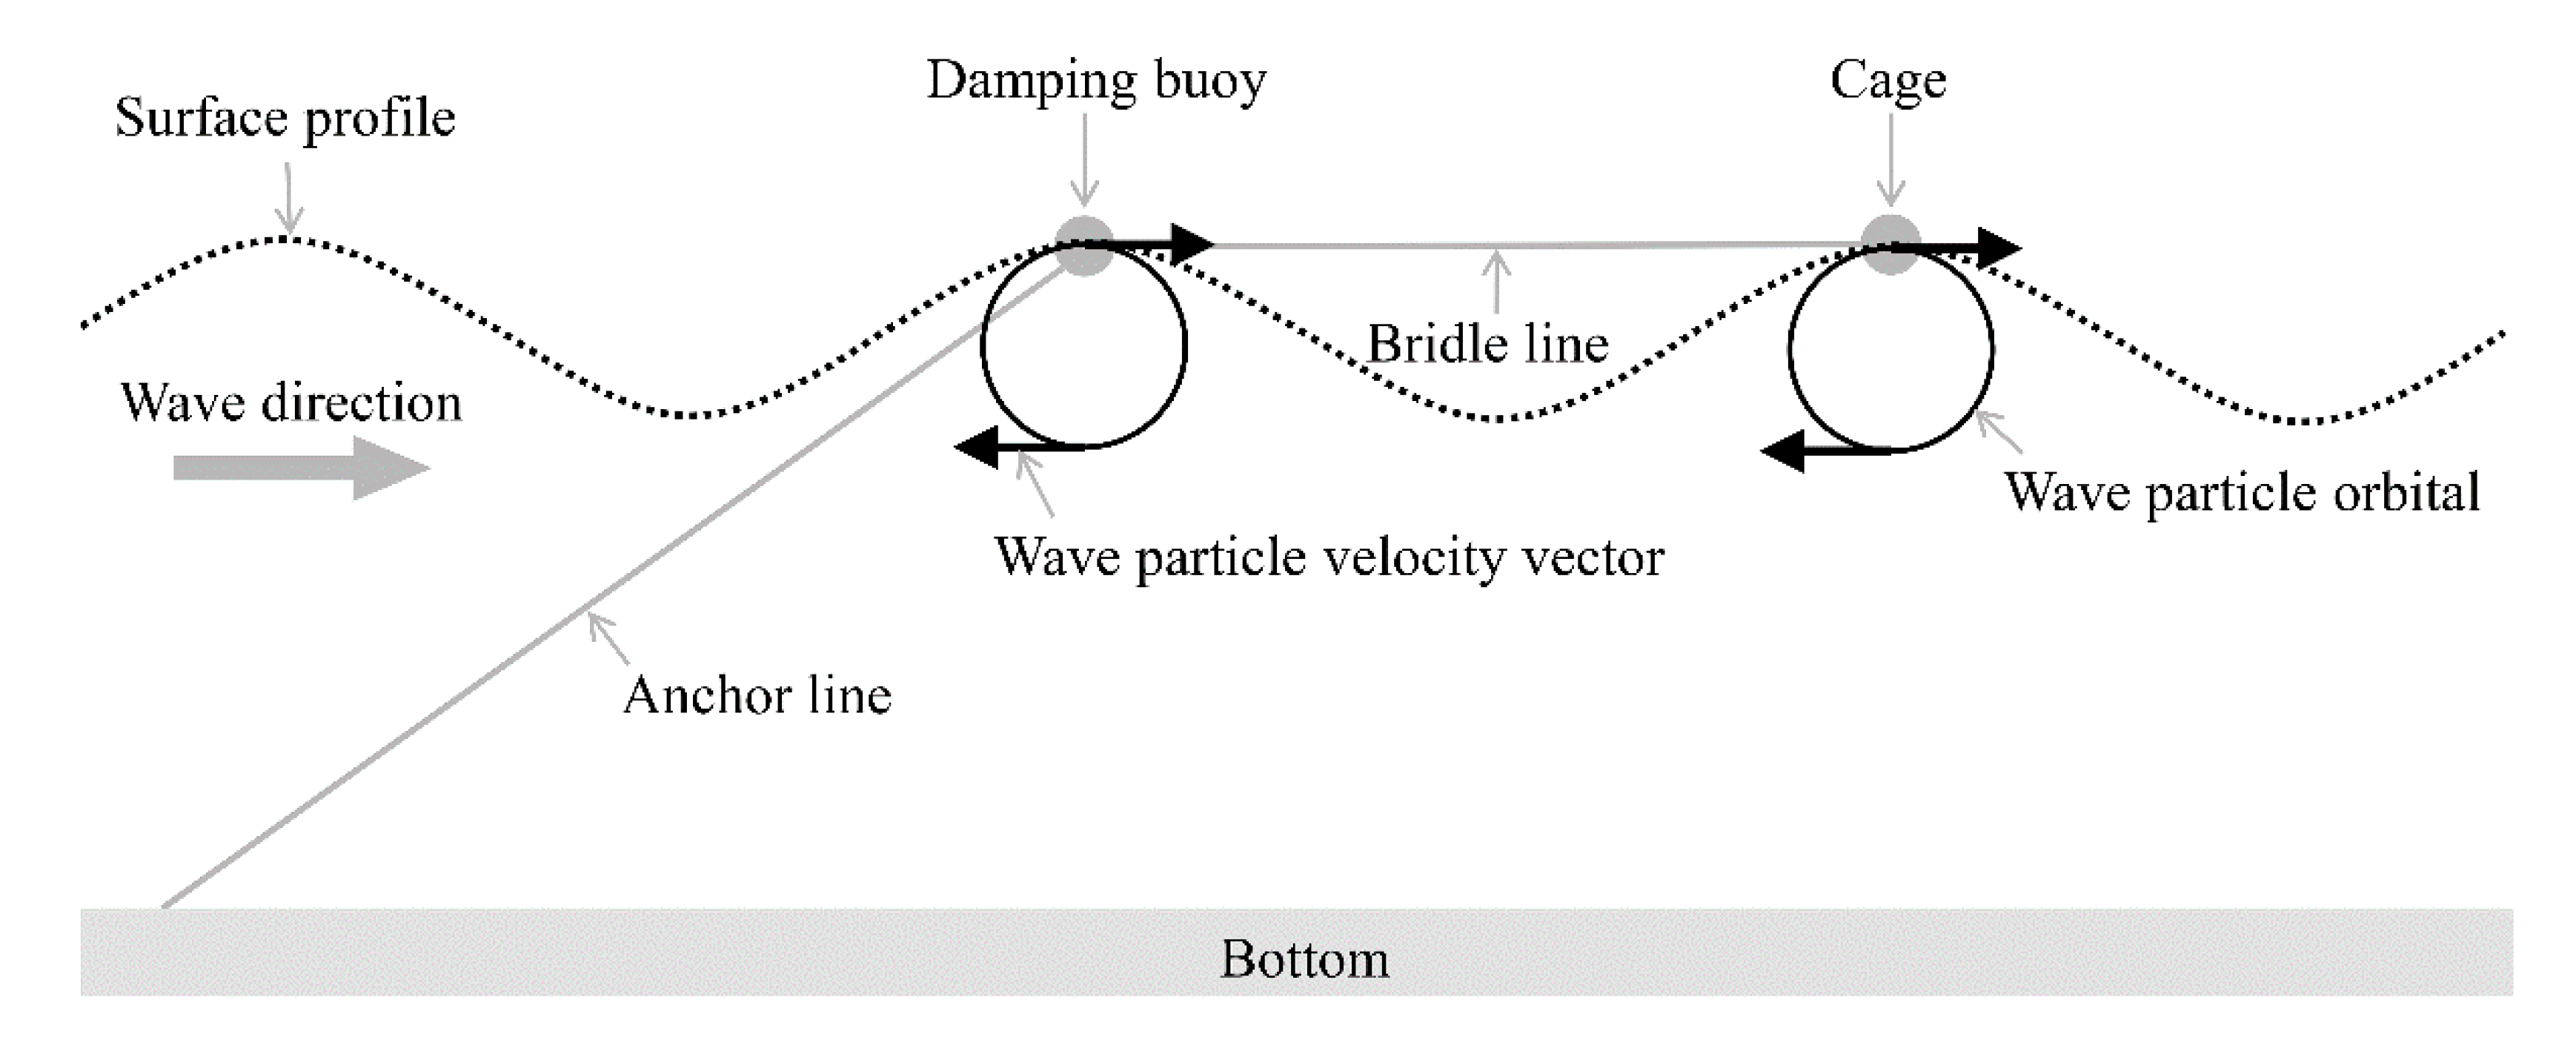
2.1. Fish Cage System Modeling
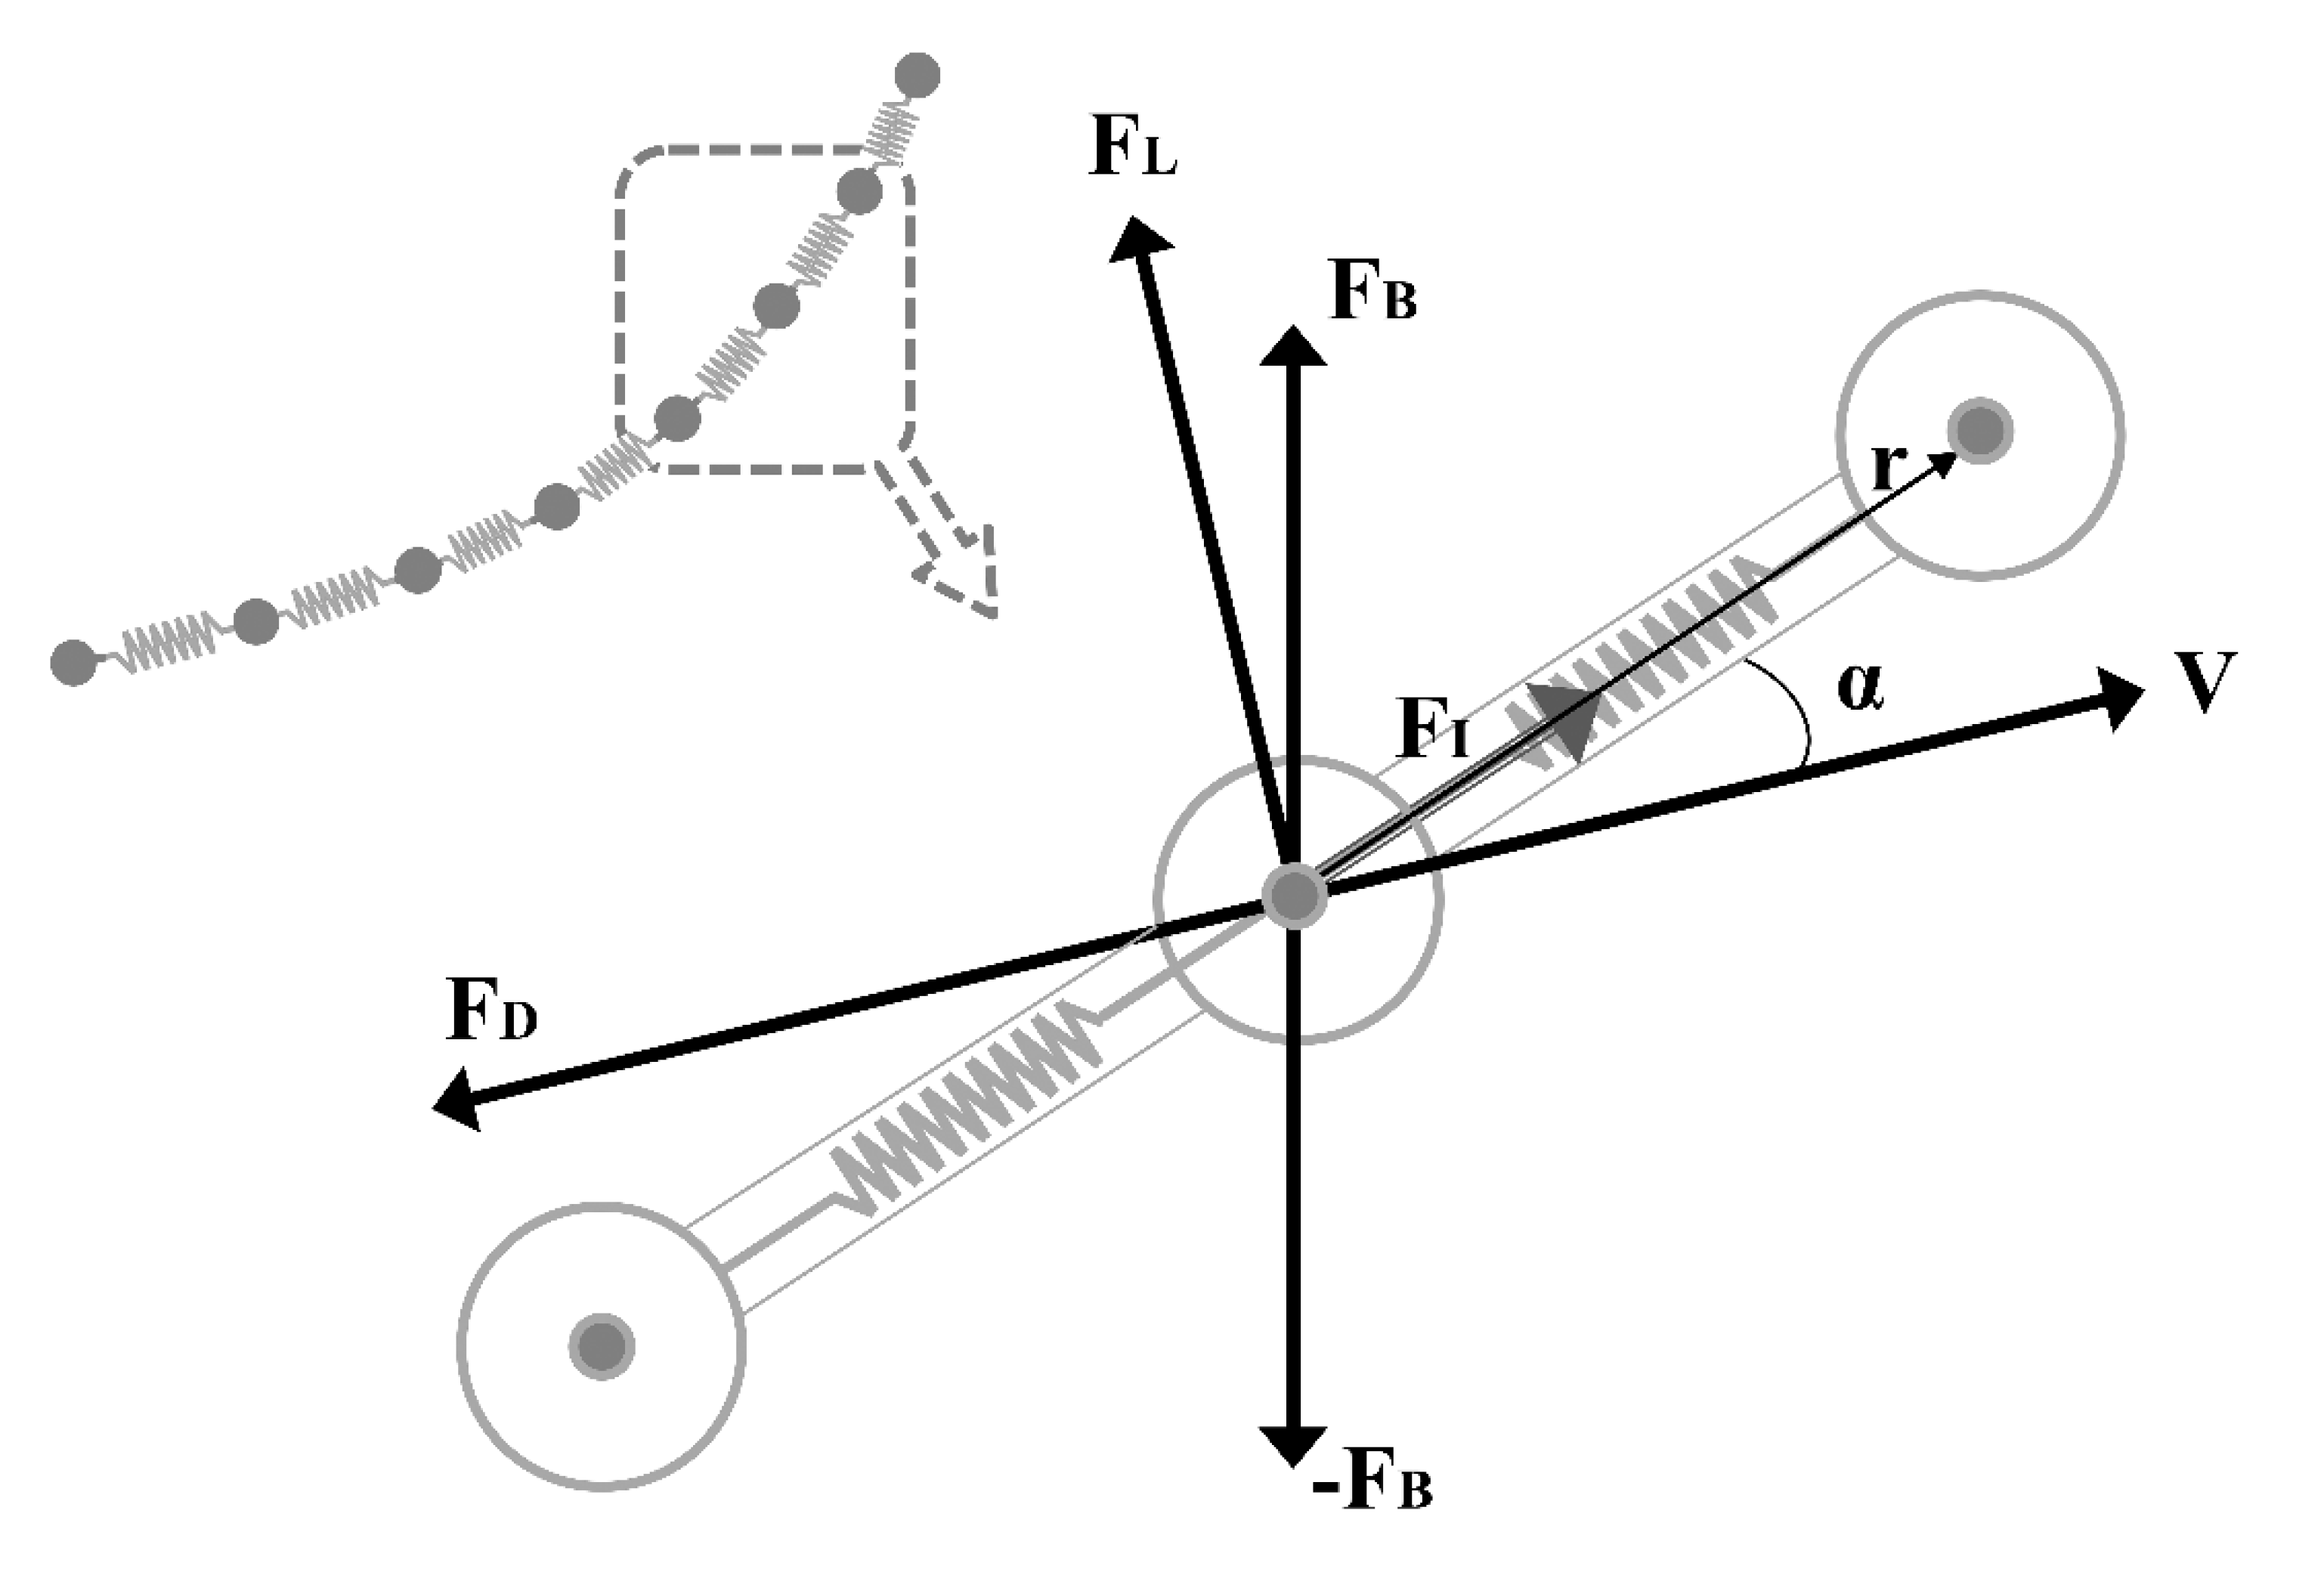
The cage system was modeled using the mass-spring model, which was used by Lee et al. [8] to analyze the mooring tension of a fish cage under the influence of currents and waves. In this model, the cage comprised finite points that were connected by springs. It was assumed that mass, weight in water and the projected area of each element constituting the cage had been imposed only on the mass point. The spring has an inherent elastic modulus such that when the points connected to the spring are forced to change position, the elastic force is generated in proportion to the spring’s displacement. The force acting on each point is the fluid force generated by the movement of the point itself or the flow of fluid around the point, and the force to resist the stretching of the spring connected to the point, i.e., the spring’s elastic force. The former was expressed as an external force and the latter as an internal force [14]. To express the motion of the modeled points, the motion equation as per Newton’s second law was used. This is expressed in Equation (1) in which the external and internal forces acting on the points are included [8]:
( m + m a ) q ¨ = F I + F E ,
where m is the mass of the mass point; ma is the added mass; q ¨ is the acceleration of the mass point; FI is the internal force; and FE is the external force acting on the mass point. The internal force was calculated using Equation (2). Here, Ei is Young’s modulus of the material; Ai is the cross-sectional area of the rope; r i is the position vector from mass point i to a linked mass point, and li is an initial rope length. The external force is the sum of the underwater weight ( F W ), drag ( F D ), and lift ( F L ) of the mass point and can be expressed using Equation (3), whereas drag and lift are expressed by Equations (4) and (5), where C D and C L denote the drag and lift coefficients, respectively, and V is the resultant vector of the mass point. Moreover, V comprises the velocity vector Vm of the mass point and the wave particle’s velocity vector Vw acting on the mass point, as shown in Equation (6) [8]. The added mass coefficient, and the drag and lift coefficients were determined by referring to the study by Lee et al. [15]. Figure 2 shows a detailed diagram of the mass-spring model, including the elements acting on a mass point [8].
F I = i = 1 n E i A i r i | r i | ( | r i | l i l i ) ,  
F E = F W + F D + F L   ,
F D = 1 2 C D ρ S | V | V ,
F L = 1 2 C L ρ S | V | V ,
V = V m + V w   ,

2.2. Wave Theory

In this study, the wave model used was the fifth-order Stokes wave model. This was suitable for finite-amplitude waves with significant steepness [16]. According to this theory, the horizontal and vertical velocities of wave particles are presented in the following equations [17]:
u ( x ,   z ,   t ) = n = 1 5 a n cosh ( n 2 π L ( D z ) ) cos ( n 2 π L ( x c t ) ) ,
w ( x ,   z ,   t ) = n = 1 5 a n sinh ( n 2 π L ( D z ) ) sin ( n 2 π L ( x c t ) ) ,
The wave profile is presented in Equation (9).
p ( x ,   t ) = n = 1 5 b n cos ( n 2 π L ( x c t ) )   ,
In Equations (7)–(9), u and w are the horizontal and vertical velocities of the wave particle, respectively, whereas p is the wave profile. Furthermore, L is the wavelength; D is the water depth; x and z are the horizontal and vertical positions of the wave particle, respectively; t is the time; and c is the wave celerity. Moreover, an and bn are coefficients for the wave height, wavelength, wave period, and water depth, which are derived using the method suggested in the studies by Skjelbreia and Hendrickson [16], and Marshall [18]. The horizontal and vertical velocities of the wave particles derived from the Stokes theory equation were substituted into the wave vector Vw term in Equation (6) to describe the fluid force effected by the wave.

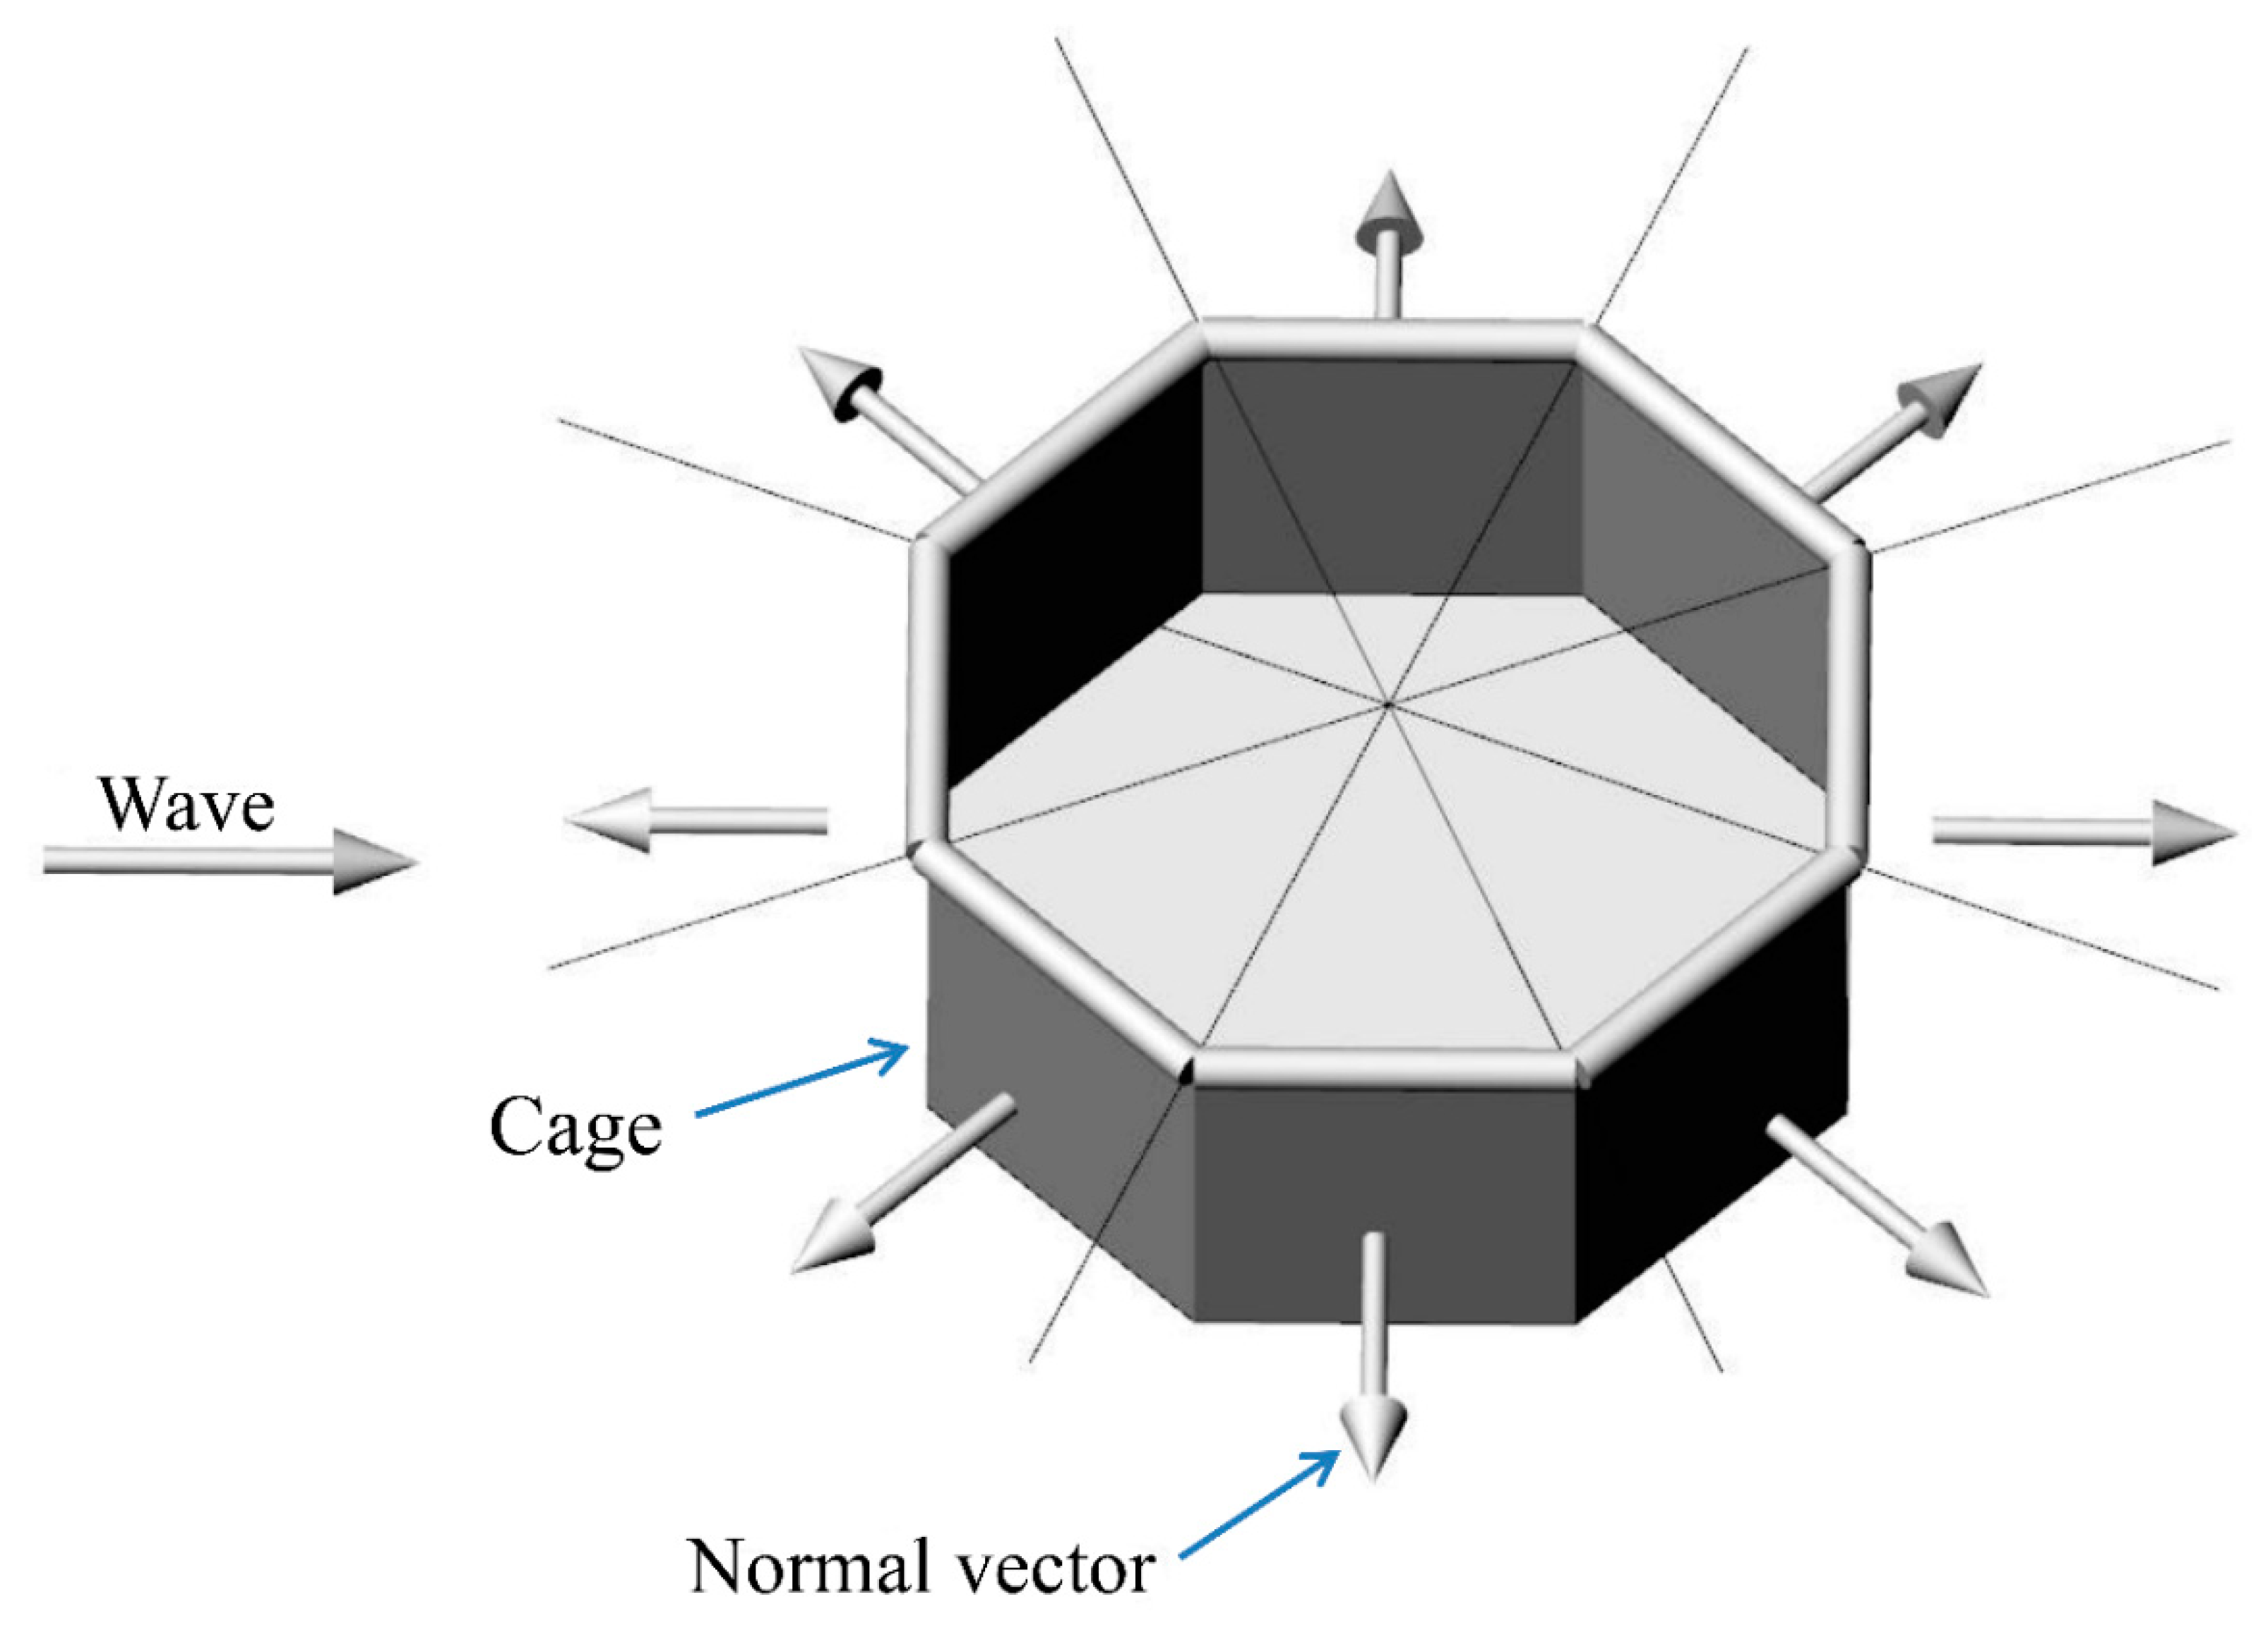
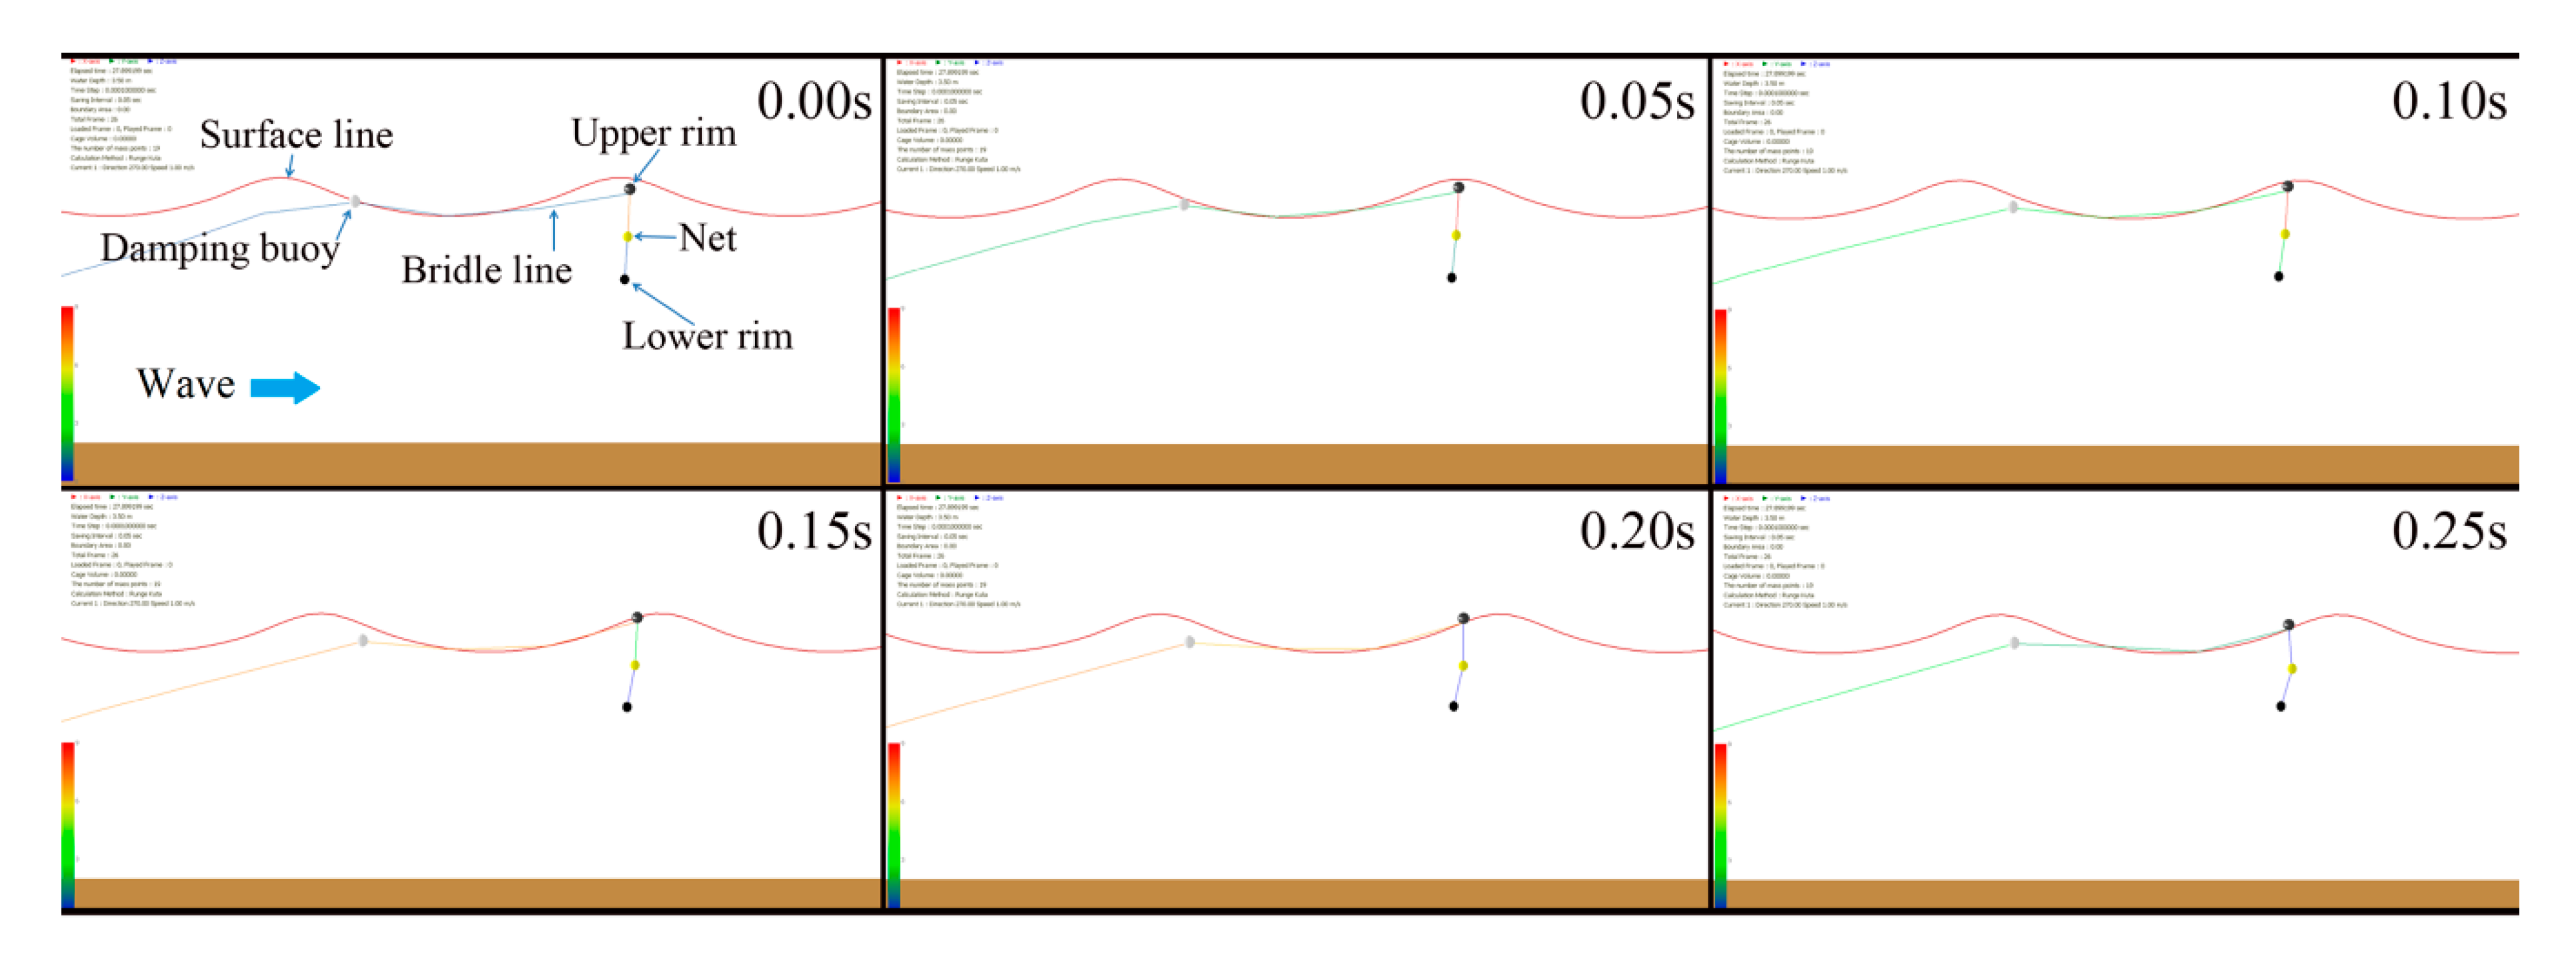
2.3. Simplification of Model for Cage System

In this study, each element forming the cage was simplified using the method suggested by Cha and Lee [12]. The rims (pipes) and net that form the cage were simplified and represented as a mass point each, and the mooring rope was described as a system in which multiple points and springs are connected in a series. The net and the lower rim, and weights attached to the lower rim were always submerged in water; as such, it was assumed that the added mass, weight in the water, and projected area represented by these elements were constant. However, because the upper rim was affected by waves at the surface, it was assumed that the weight in the water and the projected area of the rim depended on the degree of submersion. Furthermore, because the upper rim had been simplified to a mass point, the behavior of the submerged rim could not be expressed. Thus, it was assumed that an imaginary rim existed on the mass point [12]. Therefore, the depth of the point indicated the degree of the sinking of the rim. Moreover, the imaginary rim was simplified to a cylindrical shape rather than a donut shape [19,20]. The buoy attached to the mooring line was represented as a mass point, and an imaginary sphere on the point was assumed to represent the degree of submersion [12]. For a cylindrically shaped cage, meshes on the side parts of the net were radially positioned around the center of the cage net. In this study, the side net was divided into eight sections, assuming an octagonal pillar, as shown in Figure 3. The resistances on each side were separately calculated and subsequently added. The net resistance of each side was calculated by considering the angle of attack between the normal vector on each side and the velocity vector of the wave particle [21].

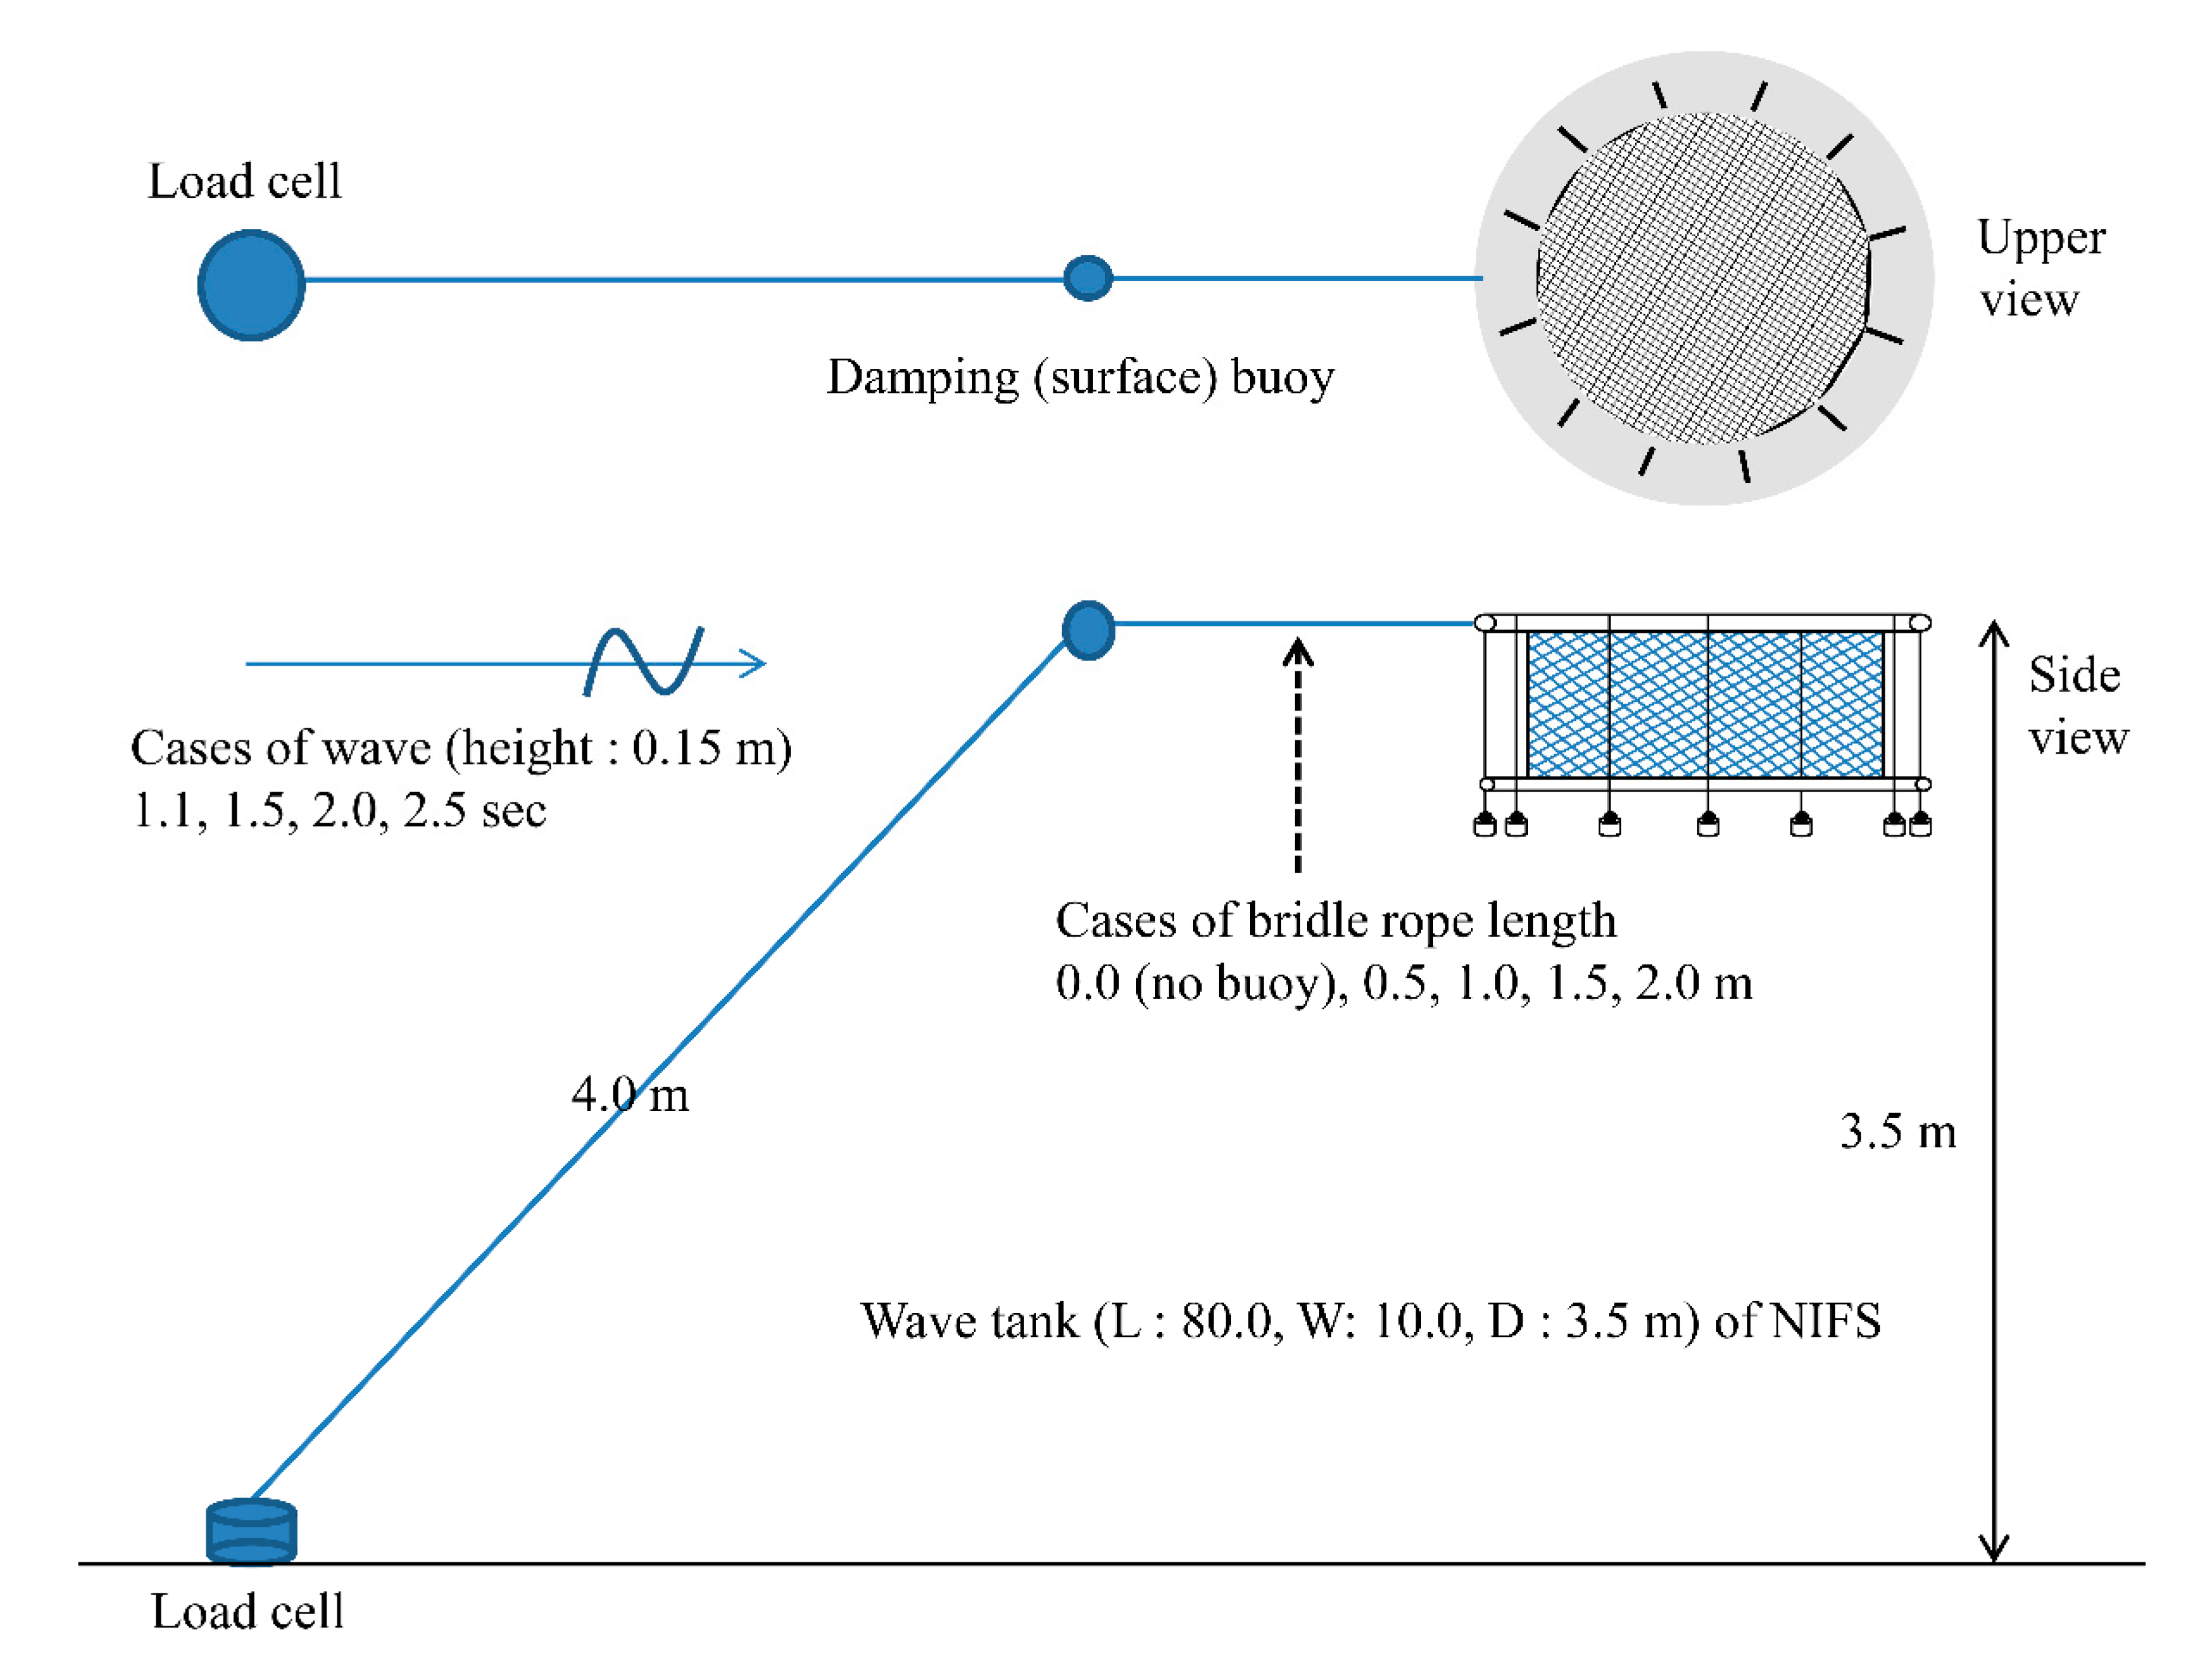
2.4. Simulation for Confirmation of Our Model

To confirm the accuracy of our model, numerical simulations of the model were compared with a wave tank experiment for the cage designed by Cha and Lee [12]. As shown in Figure 4, the experiment was conducted by mooring a model cage in a wave tank (L 80 m × W 10 m × D 3.5 m) using an attached line with a damping buoy ( 240 mm) and measuring the tension on the mooring line while applying waves of various conditions to the cage. The mooring-line tensions measured in the experiment of Cha and Lee [12] and the mooring-line tensions calculated in the simulation of our study were compared as per the wave conditions and damping buoy position. For reference, the term “experiment” mentioned in this study always refers to the tank experiment conducted in Cha and Lee [12]’s study.
The wave conditions applied to the experiment were as follows: wave height of 0.15 m and wave periods of 1.1, 1.5, 2.0, and 2.5 s. The position of the damping buoy was determined by the bridle-line length between the buoy and cage. The length of the bridle-line in the experiment was set to 0.0 (no buoy), 0.5, 1.0, 1.5, and 2.0 m, and the distance between the point where the mooring line was fixed to the tank bottom and the damping buoy was constant at 4 m. The experiment was conducted for 20 conditions because there were four wave conditions and five bridle-line length conditions. The cage used in the experiment had a cylindrical shape and was developed from a copper alloy net. The cage was a model at a scaled-down size of 1/15 based on the Froude similarity law.
To confirm our numerical model, the cage used in the experiment was modeled using the simplified mass-spring model, as shown in Figure 5. The numerical simulation conditions for verification in this instance were the same as those used in the experiment.
Numerical simulation is a process of identifying a position of mass points that have changed over time by numerically integrating the motion equation describing the motion of the mass point (refer to Equation (1)). Equation (1), a second-order differential equation, was divided into two first-order differential equations for numerical integration as follows [14]:
q ˙ ( t ) = v ( t )   ,
v ˙ ( t ) = ( m + m a ) 1 ( F I + F E )   ,
The numerical solution used for integrating the equations is the fourth-order Runge–Kutta method; the numerical integration interval is 0.0001 s; q ˙ ( t ) is the velocity, and v ˙ ( t ) is the acceleration by time t in Equations (10) and (11). Equations for the simulation were programmed in the C++ programing language using the Microsoft Visual Studio 6.0TM environment. The positional data of each mass point (a simulation result) was expressed as a point in virtual space using a computer running the OpenGL graphic library, and all springs are represented as lines. The tension of the mooring line was calculated using Equation (12) for a part fixed to the virtual bottom of tank (Figure 5) where k denotes the stiffness of a line; Lo is the initial length; and L is an extended length of the line.
T = k L L o L o   ,

2.5. Simulation for Deriving the Minimum Mooring Tension Conditions

After completing the simulation for model verification, another simulation was performed using various mooring conditions to establish the circumstances under which the mooring load was minimized. The cage model used in this simulation was used to confirm the accuracy of the numerical model above. The mooring conditions depended on the bridle-line length, mooring-rope thickness, and buoyancy of the buoy, as presented in Table 2. The mooring-line and bridle-line material was polyester, and its Young’s modulus was 4.3 GPa. The wave conditions were constant at a wave height of 0.333 m, a wave period of 1.291–2.324 s, and a wavelength of 2.937–8.471 m. The mooring conditions were as follows. The bridle-line length was 0.8–3.2 m, the mooring-line thickness was 0.002–0.004 m, and the buoyancy of the damping buoy was 2.894–20.513 N. For all simulations, the water depth was 3.5 m, and the line length between the anchoring point and buoy was 10.4 m, which is roughly three times the water depth. Numerical analysis for the simulation was conducted using the fourth-order Runge–Kutta method using a time step of 0.0001 s. Table 2 shows the detailed conditions for waves and mooring.

3. Results and Discussion

3.1. Verification of the Numerical Model’s Accuracy

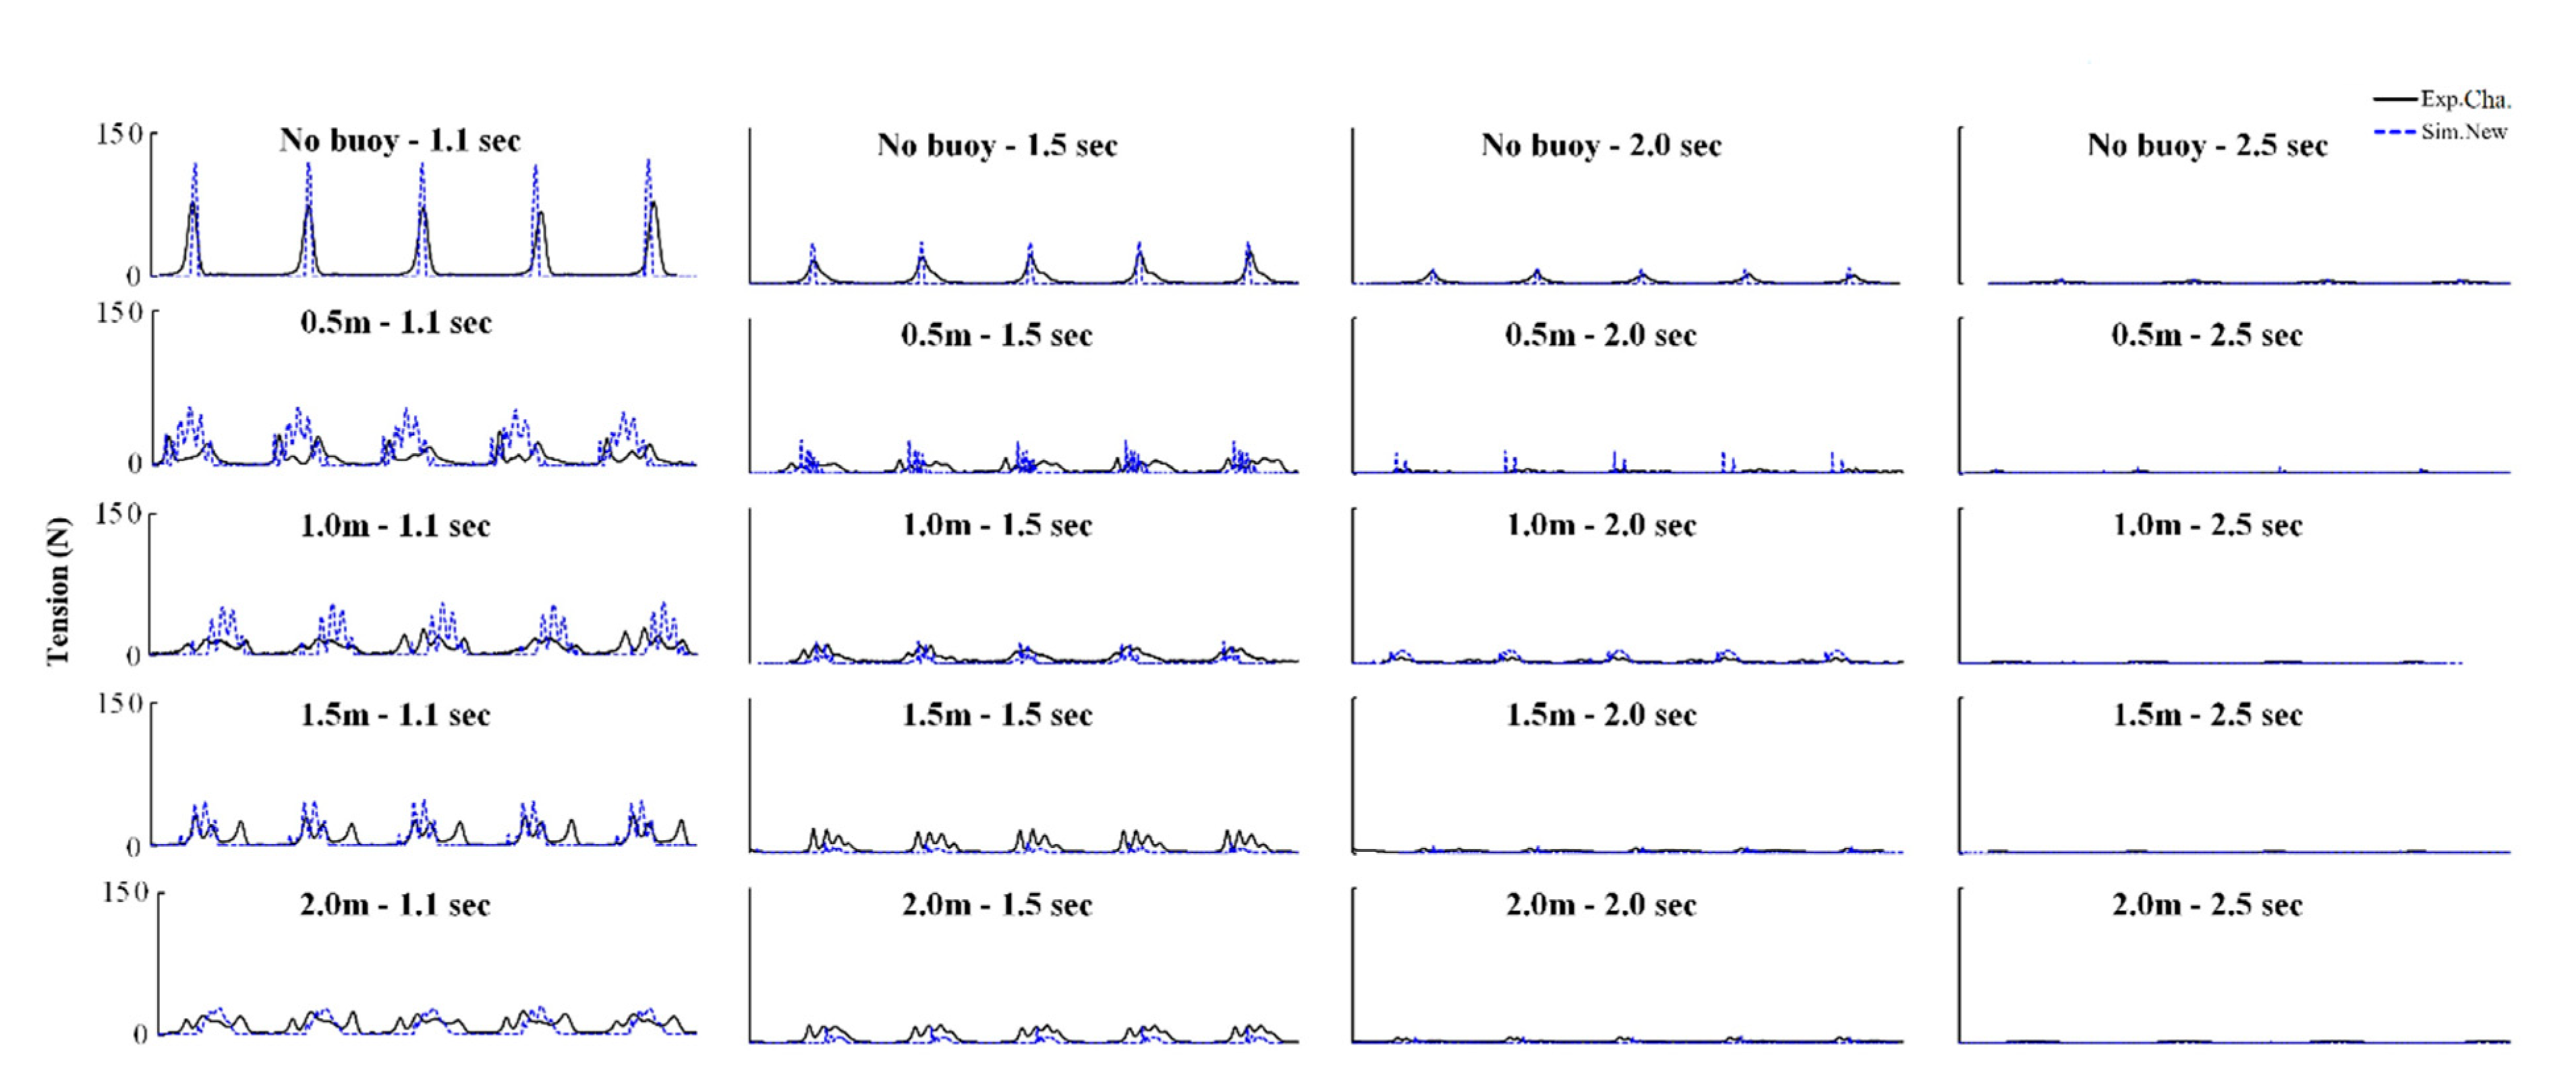
3.1.1. Comparison of Time Series Data of Mooring Tension

Figure 6 shows the time series data of mooring-line tensions in the experiments conducted by Cha and Lee [12] with data simulated in this study. On the tension graph lines in Figure 6, the gap between the points where the mooring tension of our simulation rises and falls is narrower than that of the experiment of Cha and Lee [12]. More specifically, for the experiment with no buoy and a wave period of 1.1 s (Figure 6), the line slope of the mooring tension graph gradually increased and decreased with time, whereas the results of the simulation conducted in this study increased almost vertically before rapidly descending. This phenomenon is assumed to have been caused by errors caused by the simplification of the cage model. In the experiment, it appears that the wave force had been distributed throughout the floating collar over time such that the tension appeared to have gradually increased and decreased [22]. However, for the model in this study because the force of the waves had been transmitted to only one simplified mass point, the time at which the wave force was propagated was relatively less, and the wave force was concentrated on this mass point. Therefore, our simulation had a narrower peak wave profile for the mooring tension and a slightly larger tension value than that of the experiment.
In Figure 6, both experimental and simulation results reveal that the mooring tensions are lower when the buoy is attached than when it is not attached. Moreover, visually supporting these results, both experimental and simulation results indicated one peak of the wave profile of mooring tension in conditions without the buoy, whereas several small peaks were indicated in conditions including the buoy. Because the phenomenon was evident based on the presence or absence of damping buoy, depending on the adopted perspective, it can be considered that the waveform had been distributed because of the attachment of the buoy to the mooring line [12]. However, in several studies related to the mooring system of a fish cage, even if a buoy was attached to the mooring line, one peak waveform of the mooring tension frequently formed without breaking the waveform [8,11,23]. Therefore, it was assumed that attachment of the buoy to the mooring line would not cause the splitting of waveform tension. Rather, this was believed to have been the result of oscillation arising from the inherent characteristics of the buoy when it was affected by waves [1,24]. Based on these results, it was assumed that the modeling technique of this study reflected both the tendency of the mooring tension presented in the experiment and the effect of the damping buoy on the mooring line.

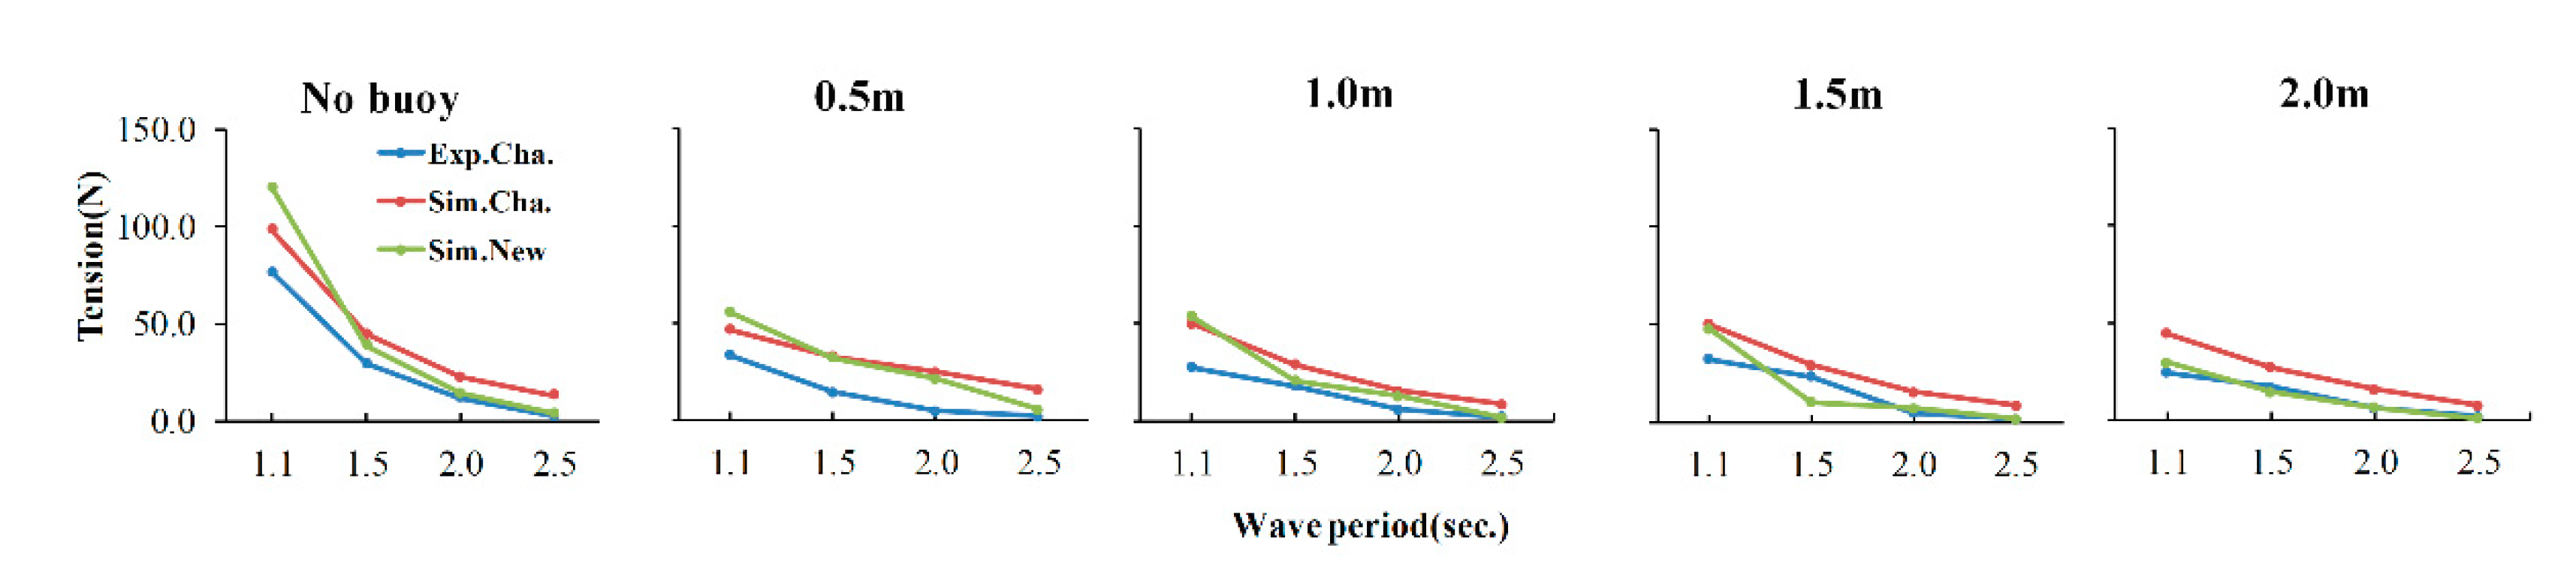
3.1.2. Comparison of Maximum Mooring Tension

The force affected on the cage by the waves was proportional to mooring tension [25]. As such, the maximum mooring tension is important because it represents the maximum load on the fish-cage system. Figure 7 shows the comparison of our simulation with Cha and Lee [11]’s study results (experiment and simulation) according to the wave and bridle-length conditions for maximum tension, derived from the time series data in Figure 6. As shown in the graph, our simulation yielded results closer to those of the experiment compared with those of the simulation in the study of Cha and Lee [12]. This was attributed to differences between the cage and wave-modeling methods. In the study of Cha and Lee [12], the entire cage was modeled as only a single mass point. If floating pipes and nets with different physical properties are modeled as a single mass point, the potential for errors occurring will be more significant. In this study, the pipes and the net were modeled with different mass points considering this problem. Moreover, there was a difference in the method for calculating the resistance of the net of the cage. In the study of Cha and Lee [12], the resistance coefficient of the cage net was constant, although the cage was in an environment in which the motion of fluid continuously changed like waves. However, because the wave-particle vector changed with time when the cage was affected by a wave, the resistance coefficient depended on the angle between the cage net and the wave-particle vector. In our study, the accuracy of the model was improved by varying the resistance coefficient as per the angle of attack between the net and the wave-particle vector [21].
The fifth-order Stokes wave theory was applied to the wave modeling in this study, whereas the linear wave theory was applied to the study of Cha and Lee [12]. The linear wave theory is suitable for application to a wave with very small amplitudes [16,26]. A known theoretical study [27] that determines the applying range of wave models shows that the wave conditions used in the previous study exceed the range of linear wave. To model the wave under these conditions, at a minimum, the third-order Stokes wave theory must be applied. It was assumed that the differences in the wave model gave rise to the differences in the simulation results.

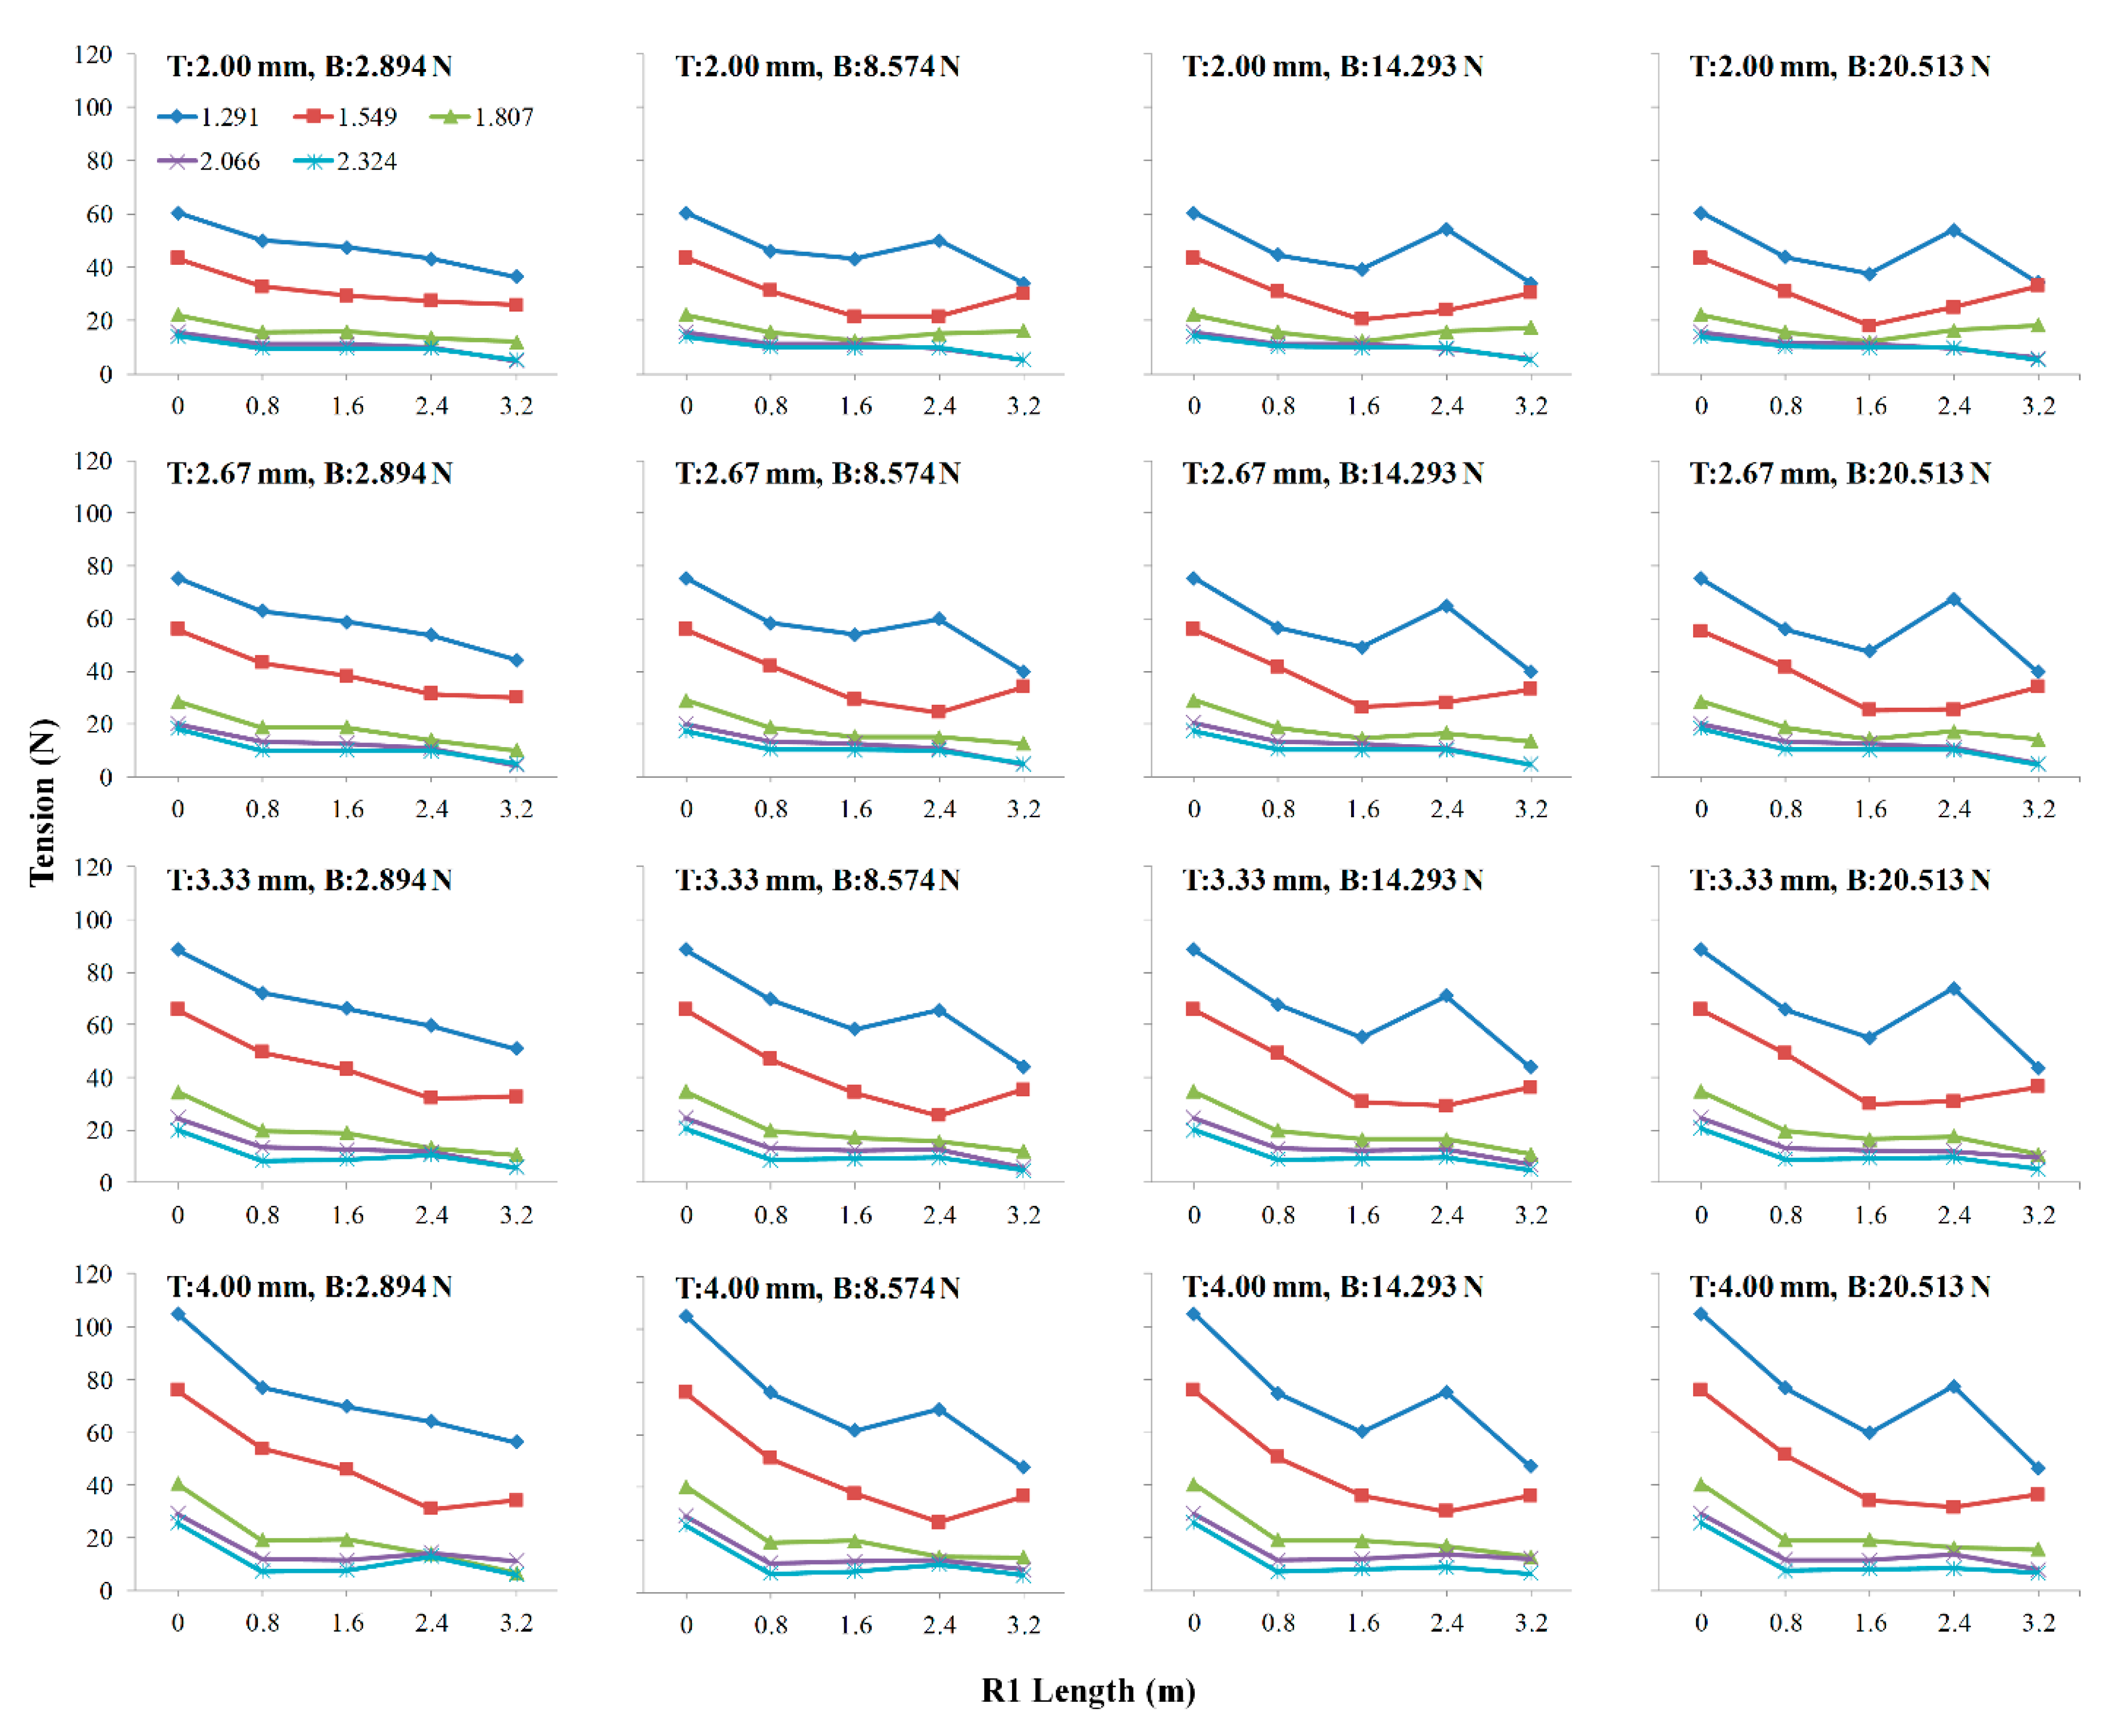
3.2. The Simulation for Deriving Conditions with Minimal Mooring Load

3.2.1. Mooring Tension Based on Mooring-Line Thickness.

The maximum tension of the mooring rope (hereafter simply referred to as tension) according to the wave and mooring conditions is shown in Figure 8. Overall, the tension decreased with increased wave periods and increased with increased rope thickness. Generally, the thicker the rope, the higher its breaking strength; however, stiffness increased for a thicker rope, which reduced the elasticity of the rope. However, a thinner rope reduced the breaking strength of the rope but increased its elasticity because of a decrease in stiffness [28,29]. The easier it was to extend the length of the rope, the longer the time the force acts on the rope, whereas the force on the rope decreases [30]. In other words, when a momentary fluid force, such as a wave, acted on the rope, the thicker the rope, the more load on the rope increased. To summarize, it is not advisable for the mooring rope to be unconditionally thickened to increase its breaking strength because if the load on the rope will increase the anchor loses its holding force. A rope of a suitable material and thickness should thus be selected by considering the anchoring force and the load on the cage system.

3.2.2. Mooring Tension Based on Bridle-Line Length

Regarding the bridle-line length, as shown in Figure 8, the tension tended to decrease overall as the length of the rope increased. However, this tendency deviated under some conditions. In particular, at a 1.291 s wave period and a 2.4 m bridle-line length, the tension that decreased with an increased bridle-length suddenly significantly increased. This increase in tension was presumed to have been the result of the magnitude and direction of the wave-particle vectors acting on the cage and the buoy concurrently maximizing the tension of the rope under this condition. More specifically, when a moored object reaches close to the crest of a wave, not only does the wave-particle vector typically act in opposition to the tension vector acting on the mooring rope (which is connected to the object) but the mooring tension also reaches its maximum [31]. Accordingly, the mooring tension is significantly increased. As presented in Table 2, when the wave period was 1.291 s, the wavelength was 2.937 m. Accordingly, if the bridle-line length between the cage and buoy was 2.4 m, both the cage and buoy would be situated near the crest of the wave at a specific point in time (Figure 9). At this time, when the wave particle exerts the maximum force on the cage, the buoy in a similar phase will experience a similar force, and a synergistic effect between these two forces will simultaneously occur. Therefore, the load applied to the mooring rope was at a maximum when the bridle line length was close to the wavelength. Figure 10 shows an example of the dynamic response of the numerically modeled cage at an interval of 0.05 s under the conditions of the wave period of 1.291 s, the wave height of 0.333 m, the bridle-line length of 2.4 m, the damping buoy's buoyancy of 20.513 N, and the mooring line thickness of 0.004 m.
However, the relationship between the wavelength and bridle line length alone cannot sufficiently explain this phenomenon because the 3.2 m bridle-line length is closer to the 2.937 m wavelength than the 2.4 m bridle-line length. Accordingly, irregular and abrupt changes in the mooring tension at a specific bridle-line length are considered an inherent characteristic of the cage-mooring system related to the wave period. Note that analytical studies on the effect of the relationship between bridle-length and wavelength on mooring system load should be conducted in future. Furthermore, the graphs in the leftmost column of Figure 8 show that this particular phenomenon occurred only when the buoyancy of the buoy was greater than a specific value (8.574 N); this was believed to have been the result of the buoy not rising to the surface because its buoyancy was lower than the tension of the mooring rope. The further away from the surface, the smaller the magnitude of the wave-particle vector, and accordingly the smaller the load the object receives [26,31]. The mooring tension was the least under most conditions when the bridle-line length was 3.2 m, which was considered the best condition for minimizing the mooring tension. However, if the installation space of the cage is small and the bridle-line length is short, designing at a length of 2.4 m will be acceptable, except for conditions with a wave period of 1.291 s.

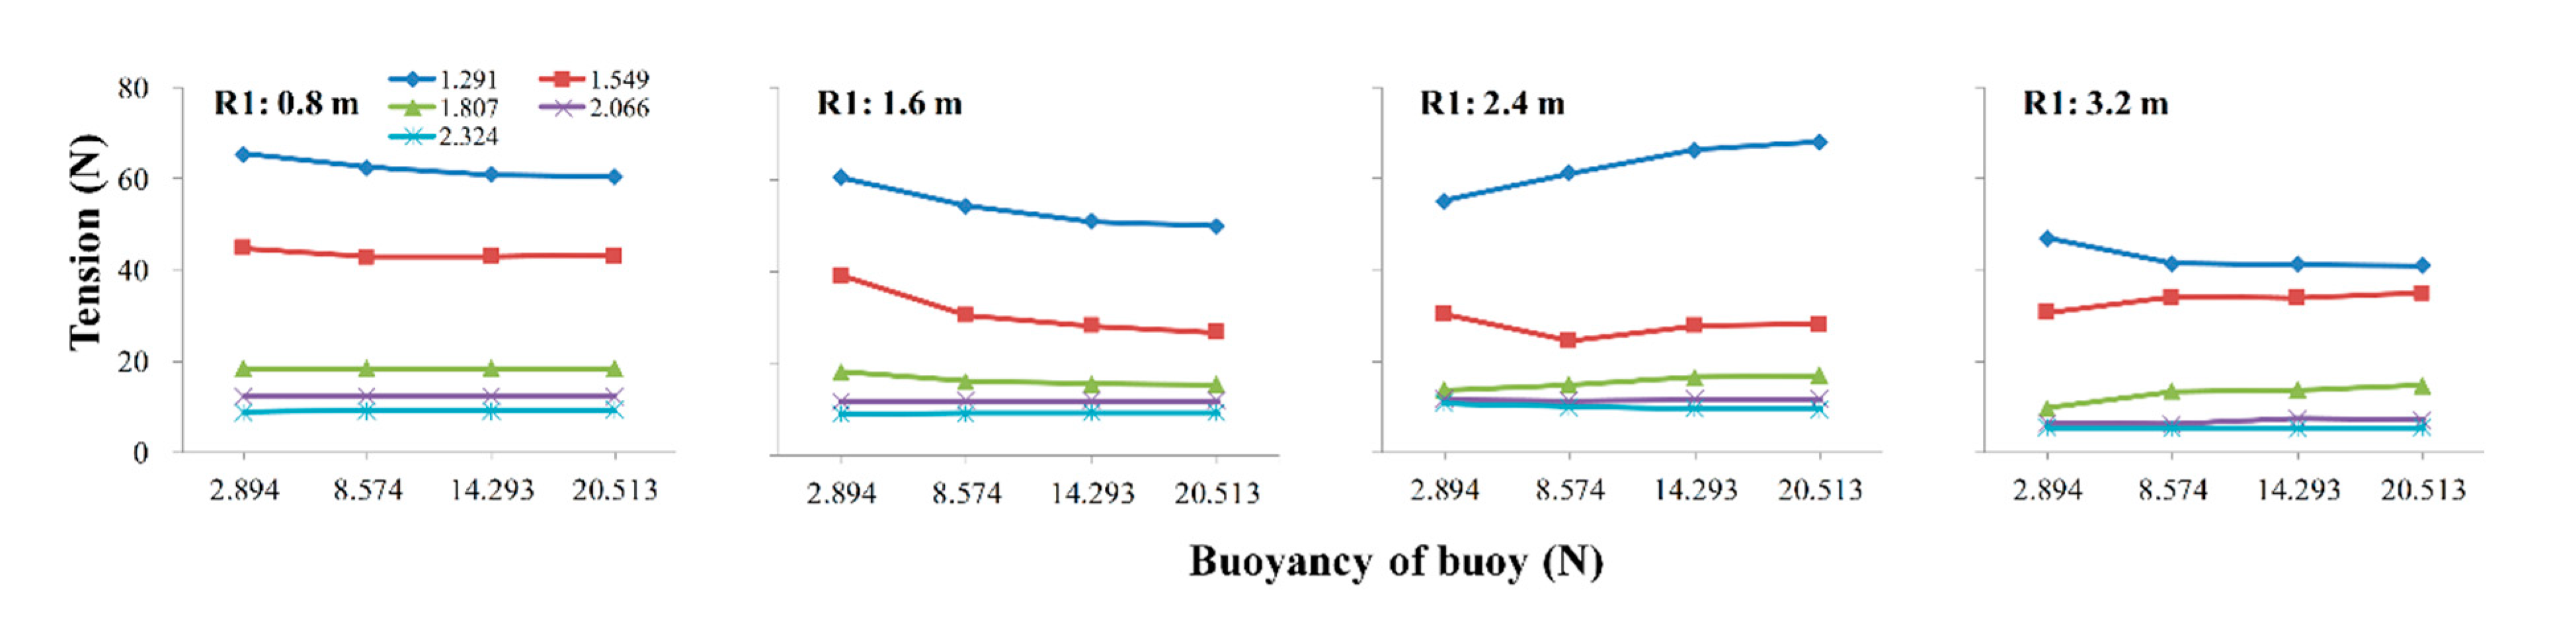
3.2.3. Mooring Tension Based on Buoyancy of Buoy

The relationship between the buoyancy of the buoy and tension is as follows. Figure 11 shows the maximum tension according to the bridle-line length, wave period, and buoyancy of the buoy. To simplify the graph, the tension for rope thickness was averaged. As shown in Figure 11, under most conditions, the tension decreased as buoyancy increased. There was a tendency for tension to slightly increase in certain conditions; however, the degree of change was negligible. Unlike this trend, a relatively large increase in tension was observed with the buoyancy of the buoy increasing at a wavelength of 1.291 s and a bridle-line length of 2.4 m. As such, even in the relationship between the buoyancy of the buoy and mooring tension, this particular condition yielded an unusual result that counteracted the typical tendency in most test conditions. This result was interpreted as the same that was assumed in the section dealing with the relationship between bridle-line length and mooring tension, i.e., the load applied to the mooring rope was maximum when the bridle-line length was close to the wavelength. Therefore, an increase in the buoyancy of the buoy contributed to the reduction of mooring load but increased the mooring load under specific wave and mooring conditions.

3.2.4. Mooring Tension Based on Wave Period

The simulation results in Figure 8 shows that the variable breadth of the mooring tension resulting from the wave period was larger than that in three different conditions (mooring-rope thickness, bridle-line length, and buoyancy of the buoy). This confirmed that the effect of the wave period (a natural condition) on the cage-mooring system was more important than the artificial design conditions. Moreover, the shorter the wave period, the greater the change in tension according to the bridle-line length, the mooring-rope thickness, and buoyancy of the buoy. In particular, the degree of change was significantly greater at 1.291 and 1.807 s and insignificant in the remaining conditions. These results were similar to those of the studies by Sundaravadivelu et al. [32] and Zhao et al. [9], which tested the change in tension of the mooring line connected to buoys under the impact of waves. In these studies, the mooring tension was measured as per wave height and period. In these instances, the variance of the mooring tension as per wave height rapidly decreased with increase in wave period. As such, the characteristics of the wave had a more significant influence on the stability of the mooring structure. Therefore, wave period is a factor that must be carefully considered when installing the cage; however, it is not an artificially controllable factor. Therefore, once the cage installation area has been determined, the stability of the cage should be maximized by optimizing artificial factors such as the length of the bridle, buoyancy of the buoys, and thickness of the mooring line.

3.2.5. Conditions to be the Minimum Mooring Tension

As shown in Figure 8, the mooring-line load was reduced by ~50% along the length of the bridle line. Moreover, this can be further reduced, depending on the mooring-rope thickness and buoyancy of the buoy. If the buoy is installed on the mooring line, the mooring load can thus be reduced; however, to maximize the mooring stability, the proper bridle-line length, buoyancy of the buoy, and thickness of the mooring rope must be selected. The conditions under which the mooring tension was minimized by the wave period were as follows. For a period of 1.291 s, the simulation conditions for minimizing the mooring line load were 2.00 mm for the rope thickness, 14.293 N for the buoyancy of the buoy, and 3.2 m for the bridle-line length. For a period of 1.549 s, the simulation conditions were 2.00 mm for the rope thickness, 20.513 N for the buoyancy of the buoy, and 1.6 m for the bridle-line length. For a period of 1.807 s, the simulation conditions were 4.00 mm for the rope thickness, 2.894 N for the buoyancy of the buoy, and 3.2 m for the bridle-line length. For a period of 2.066 s, the simulation conditions for minimizing the mooring load were 2.67 mm for the rope thickness, 2.894 N for the buoyancy of the buoy, and 3.2 m for the bridle-line length. Finally, for a period of 2.324 s, these were 3.33 mm for the rope thickness, 8.574 N for the buoyancy of the buoy, and 3.2 m for the bridle-line length. These results could be used to theoretically determine the proper mooring conditions as per the wave period. In practice, however, when installing cages, it is necessary to consider the installation costs. If the mooring tension is not considerably different among certain conditions, an appropriate mooring condition should be selected using a trade-off between these conditions as a cost-saving measure. In summary, based on the results to date, if the numerical modeling technique of this study is properly applied to fish-cage design by the wave characteristics of the cage installation area, it is assumed that doing so will contribute to the improvement of the mooring stability of the cage by reducing the load on its mooring lines. Improvement of the stability of the cage mooring system leads to a reduction in the damage or loss of the cage facility, and thus the cost of maintenance, repair, and purchase of the cage can be reduced. Moreover, the stabilization of the cage system will reduce the mortality of farmed fish in the cage, resulting in stable production; therefore, we believe that it will contribute to the improvement of economic benefits from cage operation. Table 3 shows the mooring conditions for which the mooring tension is at a minimum, based on the wave period.
To date, several studies have been conducted to improve the mooring stability of fish cages. Xu et al. [3] and Hou et al. [6] derived mooring system fatigue using various analytical techniques, whereas Hou et al. [4] evaluated the cage-mooring stability by analyzing the extreme tension distribution of the cage system. Cifuentes and Kim [7] studied the changes in the characteristics of mooring forces caused by long and steep waves. Zhao et al. [2] analyzed the effect of a mooring system when a cage composed of a multigrid mooring system was situated within the current flow. However, it was difficult to identify a study among these that analyzed the conditions in which the mooring load was minimized as per the mooring conditions. In particular, very few studies focused on the specifications and arrangement of damping buoys. This study is thus important because it reports that the load on the mooring line could be dramatically reduced based on whether or not a damping buoy is installed and, if so, how it is installed. Accordingly, to improve the mooring stability of the fish cage, additional research should be conducted on how to optimally configure the damping buoy as per the cage conditions. In several studies, to model the cage system, the cage and mooring lines were divided into finite elements, and then a numerical solution was used to obtain an approximate solution of the differential equation describing the motion of each element [3,5,14,33]. In this modeling method, because the system is large and complex, the number of calculations increases, requiring significant time for deriving results. To address these limitations, improving the performance of computer hardware can be useful; however, there are limitations to computational power and cost. The improvement of the modeling method, however, can reduce cost and is relatively effective. In this study, computational time was dramatically reduced using a modeling method that simplified a complex and large cage system by a small number of mass points. Errors caused by the simplification of the model cannot be neglected; however, it is believed that such defects can be compensated for by comparing with a range of experiments, as indicated in this study. Therefore, this modeling technique appears to enable the analysis of large-scale fish cages with a multigrid system to be conducted in a relatively short time. In this research, a basic study was conducted to determine the conditions for minimizing the mooring tension of a fish cage by focusing on the arrangement and buoyancy of damping buoy and mooring line thickness. Various construction methods of a cage-mooring system are available, including the method applied in this study. For example, one method attaches a buoy to a line connected to a section of the mooring grid of the cage where the bridle and anchor lines meet rather than directly attaching the buoy to the section [5]. Another method adds a chain or weight to a mooring line of the cage where the anchor is connected [11]. Other systems are composed of multiple grids [2,13]. Therefore, in future, it is necessary to study the conditions in which the mooring force is minimized for these different mooring systems. In this study, only the conditions in which the mooring tension was minimized were studied. The stability or fatigue analysis of the mooring system as per the mooring conditions was not conducted, in addition to mooring tension analysis involving irregular waves. Accordingly, it is suggested that this area be supplemented in future.

4. Conclusions

In this study, a minimum mooring load condition for a fish-cage (1/15 scale) mooring system with a damping buoy was investigated using a numerical model, a simplified mass-spring model, and a fifth-order Stokes wave theory. The mooring conditions applied to the numerical modeling included a bridle-line length of 0.8–3.2 m, a damping buoy buoyancy of 2.894–20.513 N, and a mooring-line thickness of 0.002–0.004 m. The wave conditions were a wave height of 0.333 m and a wave period of 1.291–2.324 s. Prior to the simulation aimed at discovering the minimum load condition, a comparison of the current study’s findings with those of an existing study (Cha and Lee [12]) was conducted in terms of the results of a tank experiment to confirm the accuracy of the numerical model. The results of this comparison indicated a minor error at a specific wave period (1.1 s); however, the changing tendencies for the magnitude and wave profile of mooring tensions before and after buoy attachment to the mooring line were in relatively good agreement with experimental results. Moreover, the maximum mooring tensions were reported to be closer to the experimental results of Cha and Lee [12] than the simulation results of the Cha and Lee [12]. In the simulation, to determine the condition in which the mooring tension was at a minimum, the shorter the wave period, the greater the change observed in the mooring tension as per the bridle length, thickness of the mooring line, and buoyancy of the buoy. In particular, the degree of change was significantly higher at 1.291 and 1.807 s; it was insignificant in the remaining conditions. The mooring tension tended to decrease as the thickness of the mooring line decreased, the bridle length increased, and the buoyancy of the buoy increased. Accordingly, for the model used in this study, minimizing the mooring tension was seemed advantageous by designing thin mooring line, long bridle-line, and maximum possible large buoyancy of the buoy. However, when the bridle length was 2.4 m at a wave period of 1.291 s, opposing tendencies were observed. For example, in most conditions, the mooring tension based on bridle-line length decreased as the length of the rope was increased, but only rapidly increased at this condition. Furthermore, the tension based on the buoyancy of the buoy decreased as its buoyancy increased in most conditions but increased only in this condition. Therefore, when designing a mooring system in this study, it is assumed that the bridle-line length of 2.4 m at the wave period of 1.291 s should be avoided. The conditions for the mooring tension to be at a minimum were different for each wave period; however, in most wave periods, the tension was minimal when the bridle-line line was the longest (3.2 m). In summary, based on the results to date, it was assumed that among the bridle-line length, the thickness of the mooring line, and the buoyancy of the damping buoy, the bridle-line length has the most significant effect on mooring tension of the cage. Therefore, if the modeling and analysis approach applied in this study is correctly applied as per the wave characteristics of the location where the fish cage is installed, it will contribute to the improvement of mooring stability by reducing the mooring-line load in the cage design.

Author Contributions

Writing—original draft preparation, review and editing, data managing, software, visualization, G.-H.L.; conceptualization and methodology, B.-J.C.; project administration and supervision, H.-y.K. All authors have read and agreed to the published version of the manuscript.

Funding

This work was supported by the National Institute of Fisheries Science (NIFS, R2020036).

Acknowledgments

We are grateful to technicians Kim Nam-Gi, Oh Young-Dal, and research assistant Jeong Jong-Eon for his time and effort to help us complete this difficult study.

Conflicts of Interest

The authors declare no conflict of interest.

References

  1. Gunn, D.F.; Rudman, M.; Cohen, R.C.Z. Wave interaction with a tethered buoy: SPH simulation and experimental validation. Ocean Eng. 2018, 156, 306–317. [Google Scholar] [CrossRef]
  2. Zhao, Y.P.; Bi, C.W.; Chen, C.P.; Li, Y.C.; Dong, G.H. Experimental study on flow velocity and mooring loads for multiple net cages in steady current. Aquacult. Eng. 2015, 67, 24–31. [Google Scholar] [CrossRef]
  3. Xu, T.J.; Zhao, Y.P.; Dong, G.H.; Bi, C.W. Fatigue analysis of mooring system for net cage under random loads. Aquacult. Eng. 2014, 58, 59–68. [Google Scholar] [CrossRef]
  4. Shainee, M.; Leira, B.J.; Ellingsen, H.; Fredheim, A. Investigation of a self-submersible SPM cage system in random waves. Aquacult. Eng. 2014, 58, 35–44. [Google Scholar] [CrossRef]
  5. Hou, H.M.; Dong, G.H.; Xu, T.J.; Zhao, Y.P. System reliability evaluation of mooring system for fish cage under ultimate limit state. Ocean Eng. 2019, 172, 422–433. [Google Scholar] [CrossRef]
  6. Hou, H.M.; Dong, G.H.; Xu, T.J. An improved lumping block equivalent method for predicting fatigue damage of mooring system for fish cage. Ocean Eng. 2019, 193, 106567. [Google Scholar] [CrossRef]
  7. Cifuentes, C.; Kim, M.H. Hydrodynamic response of a cage system under waves and currents using a Morison-force model. Ocean Eng. 2017, 141, 283–294. [Google Scholar] [CrossRef]
  8. Lee, C.W.; Kim, Y.B.; Lee, G.H.; Choe, M.Y.; Lee, M.W.; Koo, K.Y. Dynamic simulation of a fish cage system subjected to currents and waves. Ocean Eng. 2008, 35, 1521–1532. [Google Scholar] [CrossRef]
  9. Zhao, Y.P.; Guan, C.T.; Bi, C.W.; Liu, H.F.; Cui, Y. Experimental Investigations on Hydrodynamic responses of a Semi-Submersible Offshore Fish Farm in Waves. J. Mar. Sci. Eng. 2019, 7, 238. [Google Scholar] [CrossRef] [Green Version]
  10. Lekang, O.-I. Aquaculture Engineering; Blackwell Publishing: Oxford, UK, 2007. [Google Scholar] [CrossRef]
  11. Huang, X.H.; Liu, H.Y.; Hu, Y.; Yuan, T.P.; Tao, Q.Y.; Wang, S.M.; Liu, Z.X. Hydrodynamic performance of a semi-submersible offshore fish farm with a single point mooring system in pure waves and current. Aquacult. Eng. 2020, 90. [Google Scholar] [CrossRef]
  12. Cha, B.J.; Lee, G.H. Performance of a model fish cage with copper-alloy net in a circulating water channel and wave tank. Ocean Eng. 2018, 151, 290–297. [Google Scholar] [CrossRef]
  13. Hou, H.M.; Xu, T.J.; Dong, G.H.; Zhao, Y.P.; Bi, C.W. Time-dependent reliability analysis of mooring lines for fish cage under corrosion effect. Aquacult. Eng. 2017, 77, 42–52. [Google Scholar] [CrossRef]
  14. Lee, C.W.; Lee, J.; Kim, D.H.; Park, S.; Kebede, G. Deformation analysis of fish cage rigged with synthetic fiber and copper net using numerical methods. In Proceedings of the 25th International Ocean and Polar Engineering Conference K.O.N.A., Big Island, HI, USA, 21–26 June 2015. [Google Scholar]
  15. Lee, C.W.; Lee, J.H.; Choe, M.Y.; Lee, G.H. Design and simulation tools for moored underwater flexible structures. Korean J. Fish. Aquat. Sci. 2010, 43, 159–168. [Google Scholar] [CrossRef]
  16. Skjelbreia, L.; Hendrickson, J.H. Fifth-order gravity wave theory, Int. Conf. Coastal. Eng. In Proceedings of the 7th Conference on Coastal Engineering, Hague, The Netherlands, 29 January 1960; pp. 184–196. [Google Scholar] [CrossRef]
  17. Karreman, J.; Leggoe, J.; Cheng, L. Co-operative Education for Enterprise Development Home Page. Available online: https://ceed.wa.edu.au/wp-content/uploads/2017/02/Hydrodynamic-Forces-on-Subsea-Pipelines-Karreman.pdf (accessed on 20 May 2020).
  18. Marshall, A.L. On implementing fifth order gravity wave theory. J. Soc. Underwater Technol. 1987, 13, 2–4. [Google Scholar] [CrossRef]
  19. Johnson, R.E.; Wu, T.Y. Hydromechanics of low-Reynolds-number flow: Motion of a slender torus. J. Fluid Mech. 1979, 95, 263–277. [Google Scholar] [CrossRef] [Green Version]
  20. Sheard, G.J.; Hourigan, K.; Thompson, M.C. Computations of the drag coefficients. J. Fluid Mech. 2005, 526, 257–275. [Google Scholar] [CrossRef] [Green Version]
  21. Lee, C.W.; Lee, J.H.; Cha, B.J.; Kim, H.Y.; Lee, J.H. Physical modeling for underwater flexible systems dynamic simulation. Ocean Eng. 2005, 32, 331–347. [Google Scholar] [CrossRef]
  22. Huang, X.H.; Guo, G.X.; Tao, Q.Y.; Hu, Y.; Liu, H.; Wang, S.; Hao, S. Numerical simulation of deformations and forces of a floating fish cage collar in waves. Aquacult. Eng. 2016, 74, 111–119. [Google Scholar] [CrossRef]
  23. Chen, Y.Y.; Yang, B.D.; Chen, Y.T. Applying a 3-D image measurement technique exploring the deformation of net cage under wave–current interaction. Ocean Eng. 2019, 173, 823–834. [Google Scholar] [CrossRef]
  24. Radhakrishnan, S.; Datla, R.; Hires, R.I. Theoretical and experimental analysis of tethered buoy instability in gravity waves. Ocean Eng. 2007, 34, 261–274. [Google Scholar] [CrossRef]
  25. Qin, H.; Xu, Z.; Li, P.; Yu, S. A physical model approach to nonlinear vertical accelerations and mooring loads of an offshore aquaculture cage induced by wave-structure interactions. Ocean Eng. 2020, 197. [Google Scholar] [CrossRef]
  26. Jeon, I.K.; Nam, I.K.; Park, S.C.; Lee, U.L.; Jeong, I.H. Hydrography; Donghwa: Paju-si, Gyeonggi-do, Korea, 2012; pp. 404–405. [Google Scholar]
  27. Maatoug, M.A.; Ayadi, M. Numerical simulation of the second-order Stokes theory using finite difference method. Alex. Eng. J. 2016, 55, 3009. [Google Scholar] [CrossRef] [Green Version]
  28. FAO. Fishermans Workbook; Fishing News Books: Oxford, UK, 1990. [Google Scholar]
  29. Gere, J.M.; Goodno, B. Mechanics of Materials, 7th ed.; Cengage Learning: Seoul, Korea, 2011. [Google Scholar]
  30. Haliday, D.; Resnick, R.; Walker, J. Principles of Physics: Extended, 9th ed.; Bumhan Books: Seoul, Korea, 2011. [Google Scholar]
  31. Ahmed, M.R.; Faizal, M.; Prasad, K.; Cho, Y.J.; Kim, C.G.; Lee, Y.H. Exploiting the orbital motion of water particles for energy extraction from waves. J. Mech. Sci. Technol. 2010, 24, 943–949. [Google Scholar] [CrossRef]
  32. Sundaravadivelu, R.; Babu, M.H.; Murugaganesh, R. Experimental investigation on a single point buoy mooring system. Ocean Eng. 1991, 18, 405–417. [Google Scholar] [CrossRef]
  33. Huang, X.H.; Guo, G.X.; Tao, Q.Y.; Hu, Y.; Liu, H.Y.; Wang, S.M.; Hao, S.H. Dynamic deformation of the floating collar of a net cage under the combined effect of waves and current. Aquacult. Eng. 2018, 83, 47–56. [Google Scholar] [CrossRef]
Figure 1. Schematic diagram of a fish cage (1/15 scale) for numerical modeling (Cha and Lee [12]).
Jmse 08 00814 g001
Figure 2. Details of the mass-spring model and factors acting on one mass-spring.
Jmse 08 00814 g002
Figure 3. The cage net modeled in the form of an octagonal column for the calculation of net resistance to wave.
Jmse 08 00814 g003
Figure 4. Experimental apparatus for the measurement of the mooring tension in the wave tank (Cha and Lee [12]).
Jmse 08 00814 g004
Figure 5. The cage system modeled by a simplified mass-spring model.
Jmse 08 00814 g005
Figure 6. A time series of mooring tensions effected by the bridle-line length in a wave period of 1.1–2.5 s and a height of 0.15 m (Exp.Cha.: experiment by Cha and Lee [12], Sim.New: simulation of the current study).
Jmse 08 00814 g006
Figure 7. Comparison of maximum mooring tension according to the bridle-line length and wave period (Exp.Cha., Sim.Cha: experiment and simulation conducted by Cha and Lee [12], Sim.New: the simulation conducted in the current study).
Jmse 08 00814 g007
Figure 8. Maximum mooring tension according to the wave period and mooring conditions (rope thickness (T), bridle-line length (R1), and buoyancy of the damping buoy (B)) at a wave height of 0.333 m.
Jmse 08 00814 g008
Figure 9. An illustration of a situation in which the mooring tension is maximized when the wavelength is the same as the bridle-line length.
Jmse 08 00814 g009
Figure 10. A dynamic response of the cage under the wave period of 1.291 s and the bridle-line length of 2.4 m.
Jmse 08 00814 g010
Figure 11. Maximum mooring tension according to wave period, bridle-line length (R1), and buoyancy of the damping buoy (B) at a wave height of 0.333 m.
Jmse 08 00814 g011
Table 1. Specifications of the model cage for numerical modeling (cage model used in Cha and Lee [12]’s experiment).
ParameterSizeMaterial Properties
(mm or N)
Floating collar PE one-layer water
Diameter (outer)1684pipe
Diameter (Inner)1535
Floating force 152
Buoy Injection molding
Diameter240
Mooring line Dyneema braided rope
Diameter1.9
Length from bottom4000
Gaps between cage and buoy 0, 500, 1000,
1500, 2000
Net Copper alloy, Chain linked
Diameter0.9
Mesh size16 × 11.5
Mesh number252 × 55
Net depth745
Total weight52
Under water collar PE one-layer water pipe
Circumference5051
Tube diameter34
Floating force 0
Sinker SUS 304
Weight1.9
Number12
Table 2. Conditions for waves and mooring included in the simulation.
Wave
Height
(m)
Wave
Period
(s)
Bridle-Line
Length
(m)
Rope
Thickness
(mm)
Buoy
Buoyancy
(N)
0.3331.291(2.937) *0.84.002.894
1.549(4.007) *1.63.338.574
1.807(5.298) *2.42.6714.293
2.066(6.804) *3.22.0020.513
2.324(8.471) *
* The wavelength (unit: m) in parentheses corresponds to the wave period.
Table 3. Conditions with minimum mooring tension according to the wave period.
Wave Period
(sec.)
Rope Thickness
(mm)
Buoyancy of Buoy
(N)
Bridle-line Length
(m)
Rope Tension
(N)
1.2912.0014.2933.234.041
1.5492.0020.5131.618.050
1.8074.002.8943.26.769
2.0662.672.8943.24.316
2.3243.338.5743.24.611
Publisher’s Note: MDPI stays neutral with regard to jurisdictional claims in published maps and institutional affiliations.

