Abstract
Port state control (PSC) inspection is a critical measure in maritime safety, preventing substandard ships from entering ports. However, the current inspection system lacks an effective tool to monitor ship inspections and to identify which factors cause abnormal instances. Although statistical process control (SPC) has been proven an effective tool in process control in various other industries, this study is a pioneer in exploring the application of SPC on maritime inspections. In this paper, the inspection records collected in Taiwan’s ports are utilized to construct control charts of inspection deficiencies so as to identify time-independent abnormal instances in inspections. Following that, a cause-and-effect diagram is conducted to trace the cause of those abnormal instances occurring at a specific time period. The results demonstrate that SPC is effective to monitor maritime inspections and is capable of identifying time-dependent abnormal instances. From a managerial and practical perspective, port administrations can use SPC to identify time-dependent abnormal instances and take proactive actions to mitigate the non-random phenomena in PSC inspections. To keep deficiency occurring in a stable and low profile, port administrations need persistent and consistent inspection requirements and avoid non-routine inspections. Meanwhile, inspectors with various specialties and backgrounds require consistent training.
1. Introduction
Shipping is an important and traditional international industry, especially since it is the main transportation mode in international trade. International shipping transports more than 80 percent of global trade [1]. Tens of thousands of ships travel between ports each year, sustaining the flow of international freight. However, this is not done without various forms of risks. For example, in 1979, a Greek oil tanker, Atlantic Empress, collided with the oil tanker Aegean Captain off the coast of Tobago, spilling 287,000 tons of crude oil into the Caribbean Sea. This had a tremendous environmental impact on marine ecology [2].
Port State Control (PSC) is an important defense line to ensure maritime safety. Through the inspection of foreign ships in national ports, port administrations of port states can verify whether the condition of those ships complies with the requirements of international maritime conventions. Since the frequent maritime accidents in 1970s, the PSC system has been continuously used and developed. Presently, most ports in the world have implemented the PSC system for maritime safety. Once a port administration selects a ship for PSC inspection, port state control officers (PSCO) carefully examine the documentation and equipment of the ship and record the issues found during the inspection. Many studies in prior literature have statistically analyzed historical PSC inspection records, revealing the distribution of identified deficiencies in historical PSC inspections and the relationship between ship characteristics (e.g., ship types, ship flags, ship ages, etc.) and detention or deficiencies [3,4,5,6,7]. Though such analysis provides rich information about PSC inspections, port administrations cannot take proactive, but passive actions to fix problems in PSC inspections. To render inspections in maritime safety effective, port administrations need a tool to monitor time-series PSC inspections and to provide a quick improvement on inspection tasks. Statistical process control (SPC) is a method of quality control that applies statistical techniques to monitor and control a process. SPC has been widely used in the quality management of manufacturing or business processes. This paper outlines how SPC techniques could be used in PSC inspection to monitor whether the occurrence of deficiencies found in inspections is normal over time. Meanwhile, the paper examines whether SPC techniques are applicable in maritime inspections. Based on the facts discovered in SPC, the causes of inspection abnormalities are investigated and discussed. Furthermore, from a managerial perspective, the results can help port administrations take proactive measures to improve inspections and keep the occurrence of deficiencies in stable control in the future. This study can contribute to the existing literature on the topic providing one interesting and unique investigation in the maritime industry.
The remainder of this paper is comprised of five sections. Section 2 reviews the relevant literature on PSC inspection analysis and SPC related applications. Section 3 defines the research problem. Section 4 provides the detailed steps of the proposed method, and Section 5 discusses the analysis results using the proposed method. Finally, Section 6 presents the conclusions and potential opportunities for future research.
2. Literature Review
This work involves two major fields, PSC inspection analysis and SPC applications. The relevant literature is summarized and discussed below.
2.1. PSC Inspection Analysis
Figure 1 illustrates the general workflow of PSC inspections implemented in international ports. In the first step, PSC inspectors select a high-risk ship for inspection among a mass of inbound ships based on the inspection protocol and personal judgment based on previous inspection records. Next, the inspectors check the ship’s condition, including certificates, documents, devices, facilities, etc. If minor deficiencies are found, the ship is required to correct these and cannot leave until it passes the recheck from the inspectors. If major issues are identified, the ship will be detained for a detailed inspection.
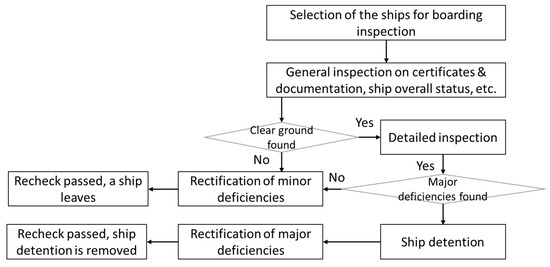
Figure 1.
Port state control (PSC) inspection workflow.
After the inspection, deficiencies could be found or the ship could be detained. Therefore, it is important for the stakeholders involved in PSC to know what factors lead these results. Of primary concern are the type, age, or tonnage of a ship, as well at its flags, among other things. Several studies have investigated the correlation between the characteristics of ships and PSC inspection findings. For instance, Yilmazel and Asyali analyzed PSC inspection related to the ISPS code among different regional PSC regimes. They revealed the relationships between ships’ flag, type, tonnage, and the nature of deficiencies [4]. Knapp and Van de Velden adopted correspondence analysis to visualize differences in the treatment of ships across different PSC regimes and provided better insight into the areas of possible harmonization [5]. Cariou, Mejia and Wolff used inspection observations from the Swedish Maritime Administration to investigate how ship characteristics affect the length of time between two separate inspections [6]. Their study showed that after a ship had been inspected a significant reduction in the number of deficiencies was found during the next inspection. In another study by the same authors, the inspection data within the Indian Ocean MOU (memorandum of understanding) region was analyzed to identify the determinants of the number of deficiencies and of the probability of ship detention [7]. The results revealed that major contributors to detention were the age of the ship, the recognized organization, and the inspection place.
Regression analysis is a tool used to estimate the relationship between an outcome variable and one or more predictors. It has also been applied to identify the relationship between ship characteristics and the number of deficiencies or detentions. Knapp and Franses studied different PSC regimes and casualties utilizing a binary logistic regression to examine the influence of inspections on the probability of casualty [8]. Fan, Luo, and Yin analyzed actual ship registration data from the Lloyd’s ship register and the corresponding PSC inspection records from various regional PSC regimes. They also applied binary logistic regression model for flagging out decisions and used a linear model for explaining the PSC inspection rate in a three-stage least square framework [9]. Cariou and Wolff applied quantile regressions to estimate the likelihood of finding a number of specific types of deficiencies and to identify those factors which are influencing the likelihood. Their new methodology can effectively improve the PSC selection process [10].
Fan et al. took another approach, using Bayesian networks to research the impact of various factors on ship accidents and analyzed the connections between detected deficiencies [11]. Yang, Yang, and Teixeira also utilized Bayesian networks, but for exploring the influence of the implementation of new inspection regime (NIR) on the PSC inspections and ship quality. Meanwhile, they conducted a comparative analysis between the “Pre-NIR” (time before the implementation of NIR) and “Post-NIR” (time after the implementation of NIR) periods [12]. Over the past few years, other complicated techniques of data mining and big data analysis have been adopted to investigate the relationships between PSC inspection deficiency items [13,14,15].
2.2. SPC Applications
As aforementioned, statistical process control (SPC) is a method of quality control. The early concept of SPC was developed by Walter A. Shewhart in the early 1920s. SPC adopts statistical methods to monitor and control a process to ensure that the process manufactures specification-conforming products and reduces reworks and scraps. The tools commonly used in SPC include run charts and control charts. The advantage of SPC over other methods lies in early detection and problem prevention, rather than the correction of problems after they have occurred. From the aspect of maritime safety, this helps port administrations conducting PSC inspections to detect problems earlier on.
Traditionally, SPC has mostly been applied in manufacturing industries. For example, Cook et al. used SPC to control the quality of the welding process [16]. Godina et al. used a manufacturing case in the automobile industry to demonstrate the application of SPC on quality improvement and waste elimination in an automobile manufacturing process [17]. Tian et al. proposed a threshold-Poisson model to define the particles with excess zero counts and incorporated it into an SPC control chart, called a threshold-c control chart, for process control in semiconductor manufacturing [18].
In addition to manufacturing, the application of SPC has also been expanded to many other fields, like healthcare, energy management, financial markets, service practices, etc. In the field of healthcare, Morton et al. successfully employed the control charts of cumulative sum (CUSUM) and exponentially weighted moving average to monitor and detect hospital-acquired infections. These tools allow medical practitioners continuous real-time assessment on infection occurrence [19]. Finnerty et al. studied the infant mortality rate in United States and used data on live births and infant deaths to construct SPC control charts. Using the information provided by the charts, they examined rare events and successfully identified the causes of those events and potential drivers of improvements [20]. Eissa and Abid applied SPC on the improvement of a pharmaceutical inspection process, ensuring that pharmaceutical products comply with release specifications [21].
In the application of energy management, Shamsuzzaman et al. applied a moving-range XmR control chart on monitor the power losses of an electric transmission and distribution system and effectively identified the unusual power losses in the system [22]. Berlemann et al. utilized SPC techniques in the analysis of financial markets. Their work intended to detect when the bubble on the US housing market began and dated the occurrence of the bubble to between 1996 and 1997. In addition to these applications, SPC can also be applied in service operations [23]. Khorshidi et al. proposed a method combining SERVQUAL (service quality) questionnaires, quality function deployment (QFD), and control charts for the service quality evaluation and process control in trains’ services [24]. As for maritime transport, the relevant applications of SPC are little. Ung and Chen used the methodology of Six Sigma to measure and evaluate the quality level of container handling in the port of Keelung in Taiwan [25]. Identically, Ridwan and Noche (2014) also applied Six Sigma to evaluate port operations, but focused on supply chain flow of cargo handling [26].
The relevant PSC analysis papers are summarized in Table 1. Statistical techniques are the main approaches for PSC inspection analysis, such as descriptive statistics, correlation analysis, and regression. They are used to identify the cause-and-effect relationships between PSC inspection variables, such as ship characteristics (e.g., ships’ flag, type, tonnage, etc.) and the nature of deficiencies. As for Bayesian networks, it can also identify such cause-and-effect relationships. Meanwhile, its probabilistic graphical model allows users to analyze more complicate possible cases. In recent years, many techniques of data mining and big data have been adopted for the analysis of PSC inspections. They provide more functions for investigating inspections, such as association rule learning, clustering, classification, and summarization. However, few of these approaches can reveal time-series behavior patterns and analyze an abnormal event at a specific time.

Table 1.
Summary of relevant PSC analysis papers.
Even though there exists a rich corpus of prior research on PSC inspections as summarized in Table 1, obvious insufficiencies still exist. SPC has been proved a useful management method for quality improvement and process control in various other industries. Compared with other available tools, such as regression models, Bayesian networks etc., a control chart of SPC is easy for users to follow dynamic changes of deficiencies in PSC inspections. It can visualize the time-series behavior of historical PSC inspections and spotlight abnormal behavior patterns, such as outliers, trends, cycles, and other non-random patterns. Besides, a cause-and-effect diagram used in SPC has the apparent advantage of comprehensively exploring potential causes of abnormal behavior patterns at a specific time over the other available tools. Unfortunately, only few studies applied SPC to maritime transport [25,26]. They pay attention only to the efficiency of port operations, ignoring the potential applications of SPC on maritime inspections. This paper marks the first attempt to implement SPC in ship inspection tasks for maritime safety improvement. The control charts used in this paper can easily identify non-random instances occurring in PSC inspections in a time horizon and provide port administrations more valuable information for further proactive actions, other than other available tools do.
3. Problem Description
Similar to quality control in a general manufacturing process, this paper assumes PSC inspections as sampling in a process over time. The ships selected for inspections are seen as a series of sampling products. The deficiencies found during inspections resemble the defects detected in a manufacturing process as depicted in Figure 2. According to the Tokyo MOU (memorandum of understanding) [23], there are seventeen primary deficiency items in PSC inspection. The deficiencies include “Certificates & Documentation,” “Structural Conditions,” “Water/Weathertight Conditions,” etc. as shown in Table 2.
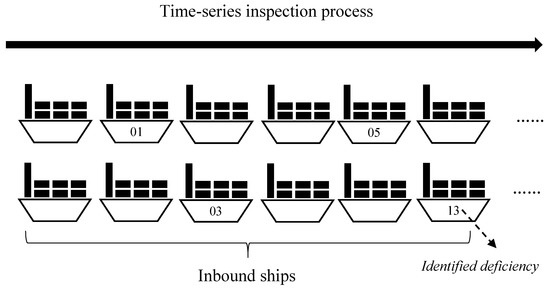
Figure 2.
Illustration of time-series inspection process.
Table 2.
Main items of deficiency codes in the 2017 Tokyo memorandum of understanding (MOU) [27].
With the knowledge above, a series of PSC inspections over time can be depicted in a control chart, which is a common tool used in SPC. The deficiencies in the control chart are measured by the occurrence probability of deficiencies per month, as calculated in Equation (1). Based on the information revealed in the control charts, the potential problems in PSC inspections can be identified and analyzed.
where
P(i, j): the occurrence probability of deficiency j in month i (i = 1~12; j = 1~17)
Nij: the number of deficiency j found in month i
Npi: the total number of ships inspected month i
4. Materials and Methods
The analysis framework of this study is illustrated in Figure 3. First, the PSC inspection records from 2015 to 2018 are collected and segmented into 68 data groups (4 × 17) in terms of years and deficiency types (01–18). The control charts based on these data groups are constructed and analyzed. Next, the charts are compared with each other. In the last stage, the source of the variances found in the charts is investigated through cause-and-effect diagrams.
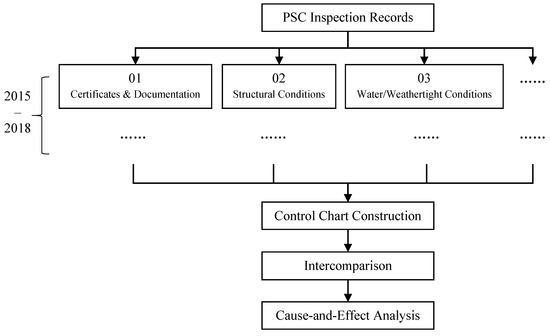
Figure 3.
Statistical process control (SPC) analysis framework.
4.1. PSC Inspection Records
The original data of PSC inspection records in this paper comes from the database of the Maritime Transport Network Portal (MTNet) of the Ministry of Transportation and Communications (MoTC) in Taiwan and includes 3195 PSC records. Because different types of ships have different structures and facilities, such difference may produce a significant variance in our analysis. Thus, this study only focuses on container ships, one of mainstream ship types in global ports. The inspection records occurred in Taiwan’s ports, mainly in Keelung, Taichung, Kaohsiung, and Hualien, between 2015 and 2018.
4.2. Control Chart Construction
Control charts, also called Shewhart charts, are a visual tool used in SPC to determine if a process is in a stable state of control. The control chart adopted in this study is the and s chart, also known as the and σ chart. This type of control chart is suitable for the situation that the sample size is relatively large and variable. Such situation conforms to the practice of PSC inspections.
4.2.1. Assumptions
This study assumes that the data points in the control charts are normally and independently distributed. The normality of the data points is verified by the Shapiro–Wilk test.
4.2.2. Sampling Interval and Sample Size
Generally, the frequency of PSC inspections varies significantly in different ports, depending on how busy a port is. The busier a port is, the higher the inspection frequency is. However, the rate of inbound ships entering a port is normally much less than the output rate of a general production line. The time span of ship inspections, which is the sample interval in this study, is measured by months, much longer than the time units used in a general production line of minutes or hours. This is one of major differences of between SPC application in traditional industries and in inspections of maritime safety. In addition, a general production line is usually expected to have a stable output rate, but the rate of inbound ships is uncertain. This fact indicates that the sampling size of ship inspections is not fixed, but rather varies with time. The average number of ships inspected from 2015 to 2018 is about 67 per month. The number of ships inspected per month in 2015 to 2018 ranges from 44 to 98.
4.2.3. Control Limits
Based on the assumptions and sampling patterns mentioned above, the mean and standard deviation s are calculated as Equations (2)–(4).
where
xij: the occurrence probability of deficiency j in month i (i = 1~n, n = 12; j = 1~17)
: the mean of the occurrence probability of deficiency j
sj: the standard deviation of the occurrence probability of deficiency j
The control charts in this study are constructed in the manner of separate years and deficiency types. Figure 4 is the control chart of deficiency 01 “Certificates and Documentation” in 2015. As previously mentioned, the ordinate of the control chart is the occurrence probability of deficiency 01 as calculated in Equation (1) while the abscissa is the months in a year. The upper control limit (UCL) and lower control limit (LCL) in this study are set as a mean plus and minus two standard deviations, as indicated in Equations (5) and (6). Because this study intends to compare the charts between different years and deficiencies, all the charts are normalized. The calculation of normalization is indicated in Equation (7). After normalization, the mean, the central line becomes zero, and the UCL and LCL change accordingly as shown in Figure 5. The details of the control charts are discussed in the next section.
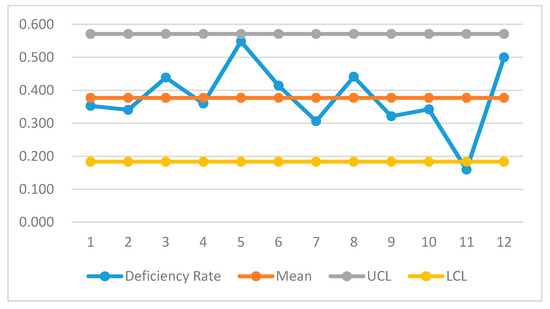
Figure 4.
Control chart of deficiency 01 in 2015.
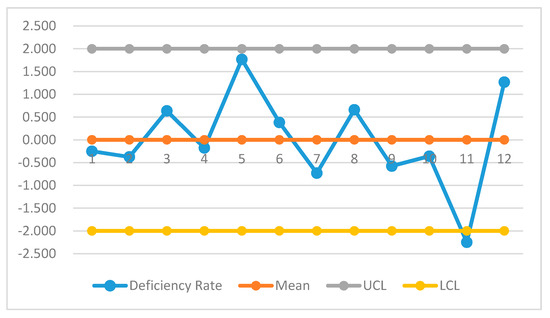
Figure 5.
Normalized control chart of deficiency 01 in 2015.
4.3. Cause-and-Effect Analysis
With the help of control charts, abnormalities in PSC inspections can be easily observed and detected. For instance, as shown in Figure 5, the occurrence probability of deficiency 01 in November 2015 is quite low. This data point obviously is an outlier, worth further investigation into its cause. Therefore, this study introduces a cause-and-effect diagram for inspection practitioners to investigate the cause of the abnormality detected in control charts. This approach, also known as fishbone diagrams, was created by Japanese professor Kaoru Ishikawa. It has been widely used in product design and quality management to find potential factors causing an overall effect. A traditional cause-and-effect diagram generally includes five major causes, called 4M1E, “Men/People,” “Machines,” “Materials,” “Methods,” and “Environment” as illustrated in Figure 6. Each major cause can be divided into more detailed root causes. Nevertheless, the traditional cause-and-effect diagram is not fully applicable to the practices of PSC inspections. Thus, in this paper, the cause-and-effect diagram is modified to make it effective for PSC inspections. In Figure 7, the cause “Machines” is removed because an inspector does not require any machines or equipment while conducting PSC inspections. Therefore, only the four remaining major causes, “Men/People,” “Materials,” “Methods,” and “Environment,” affect inspection results, as shown in Figure 7. In an interview with senior PSC inspection practitioners, the four major causes can be subdivided into several minor causes. For instance, under “Men/People,” deficiencies identified in inspections could be affected by an inspector’s expertise (e.g., navigation, power machines, etc.), past work experience, and personal preferences. “Materials” means the characteristics of the ships inspected, like ship ages, ship flags, and ship societies. Because all the ships analyzed in this study are in the same type—container ships, their structure and facilities are similar and have only minimal influence on inspection practices. Thus, the factor, “ship type,” is excluded from our analysis. “Methods” refers to an inspection procedure that involves which deficiency items to inspect. The inspection list of deficiency items changes sometimes because new inspection requirements are introduced from local port administrations; sometimes the existing items are emphasized due to local policies. Here “Environment” means the influence of international situations rather than the change of local policies. Some international specific events, such as oil leaks and shipwrecks, may trigger new inspection requirements. A few countries have special requirements and need inspection assistance from port states. For example, the US cares more about security and counter-terrorism issues and requests other port states to do more relevant inspections. Besides, new inspection requirements implemented in other PSC MOUs may be learned from other port states. Compared with other available quantitative statistical tools (e.g., regression models, Bayesian networks etc.), a cause-and-effect diagram allows users to broadly explore other potential causes of time-dependent abnormalities in PSC inspections, especially those non-quantitative factors, such as inspector’s expertise, new inspection items, etc., as shown in Figure 7.
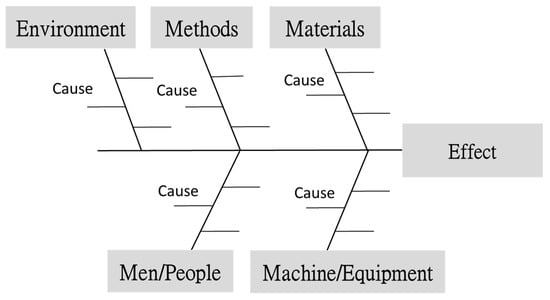
Figure 6.
Illustration of a general cause-and-effect diagram.
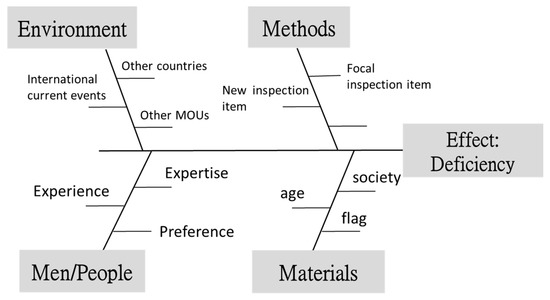
Figure 7.
Illustration of a modified cause-and-effect diagram for PSC.
5. Results and Discussions
This paper summarizes several significant non-random characteristics identified in control charts, as illustrated in Figure 8, Figure 9, Figure 10, Figure 11, Figure 12, Figure 13, Figure 14 and Figure 15. The notation of lines in Figure 8, Figure 9, Figure 10, Figure 11, Figure 12, Figure 13, Figure 14 and Figure 15 is the same as the one in Figure 4 and Figure 5.
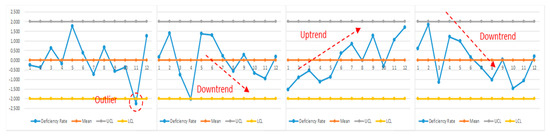
Figure 8.
The control chart for deficiency 01 (2015–2018).
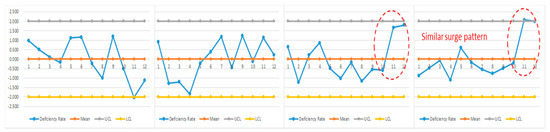
Figure 9.
The control chart for deficiency 02 (2015–2018).
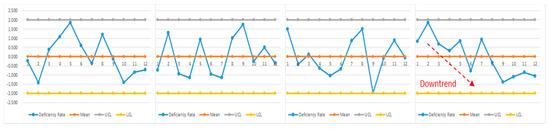
Figure 10.
The control chart for deficiency 04 (2015–2018).
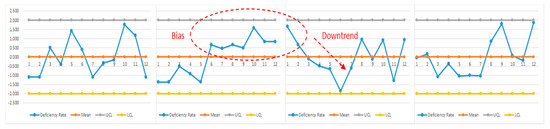
Figure 11.
The control chart for deficiency 06 (2015–2018).
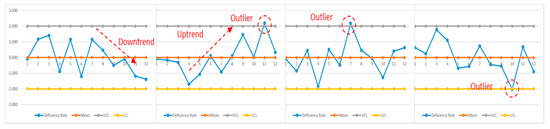
Figure 12.
The control chart for deficiency 08 (2015–2018).
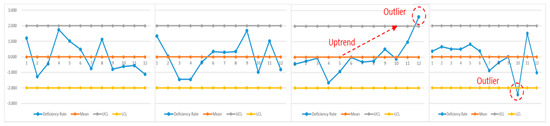
Figure 13.
The control chart for deficiency 10 (2015–2018).
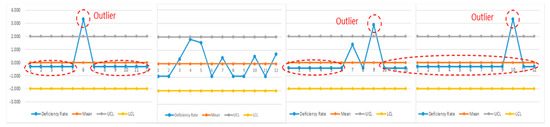
Figure 14.
The control chart for deficiency 12 (2015–2018).
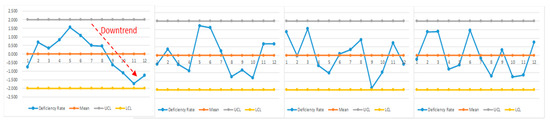
Figure 15.
The control chart for deficiency 13 (2015–2018).
5.1. Uptrends and Downtrends
Significant uptrends and downtrends can be observed in the control charts of deficiency 01, 04, 06, 08, 10, and 13 in specific years as shown in Figure 8, Figure 10, Figure 11, Figure 12, Figure 13 and Figure 15. Through interviews with PSC experts and the help of a cause-and-effect diagram, the cause of the trends is identified. For instance, deficiency 01 is the inspection of the certificates and documentation of ships and crews. In Figure 8, a significant ascending trend in 2017 and a significant descending trend in 2018 are observed. They may derive from the introduction of new inspection requirement for the crew training certification of ECDIS (electronic chart of display and information system) and STCW (standard training certification for watching keeping). Therefore, the inspectors checked those training certificates more frequently in 2017, and many of the ships inspected had not prepared well for that. After such inspections continued for a while, most ship owners began to pay attention to this issue and to acquire the relevant training. The probability of this deficiency gradually declined in 2018.
5.2. Sudden Peaks
In addition to uptrends and downtrends, the patterns of several sudden peaks can be found in the control charts as illustrated in Figure 9 and Figure 14. Again, through interviews with PSC experts and the use of a cause-and-effect diagram, we can find the potential cause of this phenomenon. For example, deficiency 02 is concerned with the structural conditions of ships. Figure 10 shows two similar patterns of sudden surges at the end of 2017 and 2018. Further analysis of cause-and-effect indicates that the two surges come from a special inspection of concentrated inspection campaigns (CICs). Many subitems in deficiency 02 which were inspected infrequently were discovered. Deficiency 12, the processing of dangerous goods on ships, is another case. The data points in Figure 14 mostly stay at a low level, lower than the central mean, especially in 2015, 2017, and 2018, except several outliers above the ULC. Based on the analysis of cause-and-effect, such a non-random pattern derives from the shortage of inspection specialists for dangerous goods. Therefore, most often the inspectors could only conduct limited inspections on dangerous goods. The visit of foreign specialists in 2015, 2017, and 2018 resulted in a detailed inspection of deficiency 12, so more subitems in this type of deficiency were identified. This led to the sudden peaks in Figure 14.
5.3. Bias on One Side of a Central Line
A bias on one side of control limits is primarily concerned deficiency 06 as depicted in the control charts in Figure 11. Deficiency 02 is the inspection of cargo operations, including equipment. The focus of this inspection is on whether containers are fastened firmly on a ship to avoid the damages and loss of goods. The analysis of cause-and-effect show that the bias occurred in 2016 and 2017 is related to some particular inspectors. Because of their past background, they had specific preference for the deficiency subitems of cargo operations.
5.4. Normality Validation and Outliers Out of Control Limits
The data points of the control charts for each deficiency are validated for a normal distribution. The result of this normality validation shows that the data points of deficiency 01~05, 09~11, 13, 14, and 16 are normally distributed, and the ones of the rest of deficiencies are not. Therefore, only the control limits of the control charts for deficiency 01~05, 09~11, 13, 14, and 16 are applicable (Figure 8 and Figure 13). Because the outliers out of control limits in Figure 8 and Figure 13 do not appear continuously, and there is no rule for their appearance, this study sees them as occasional incidents. In addition, the control charts for deficiency 08 and 12 are not normally distributed. Thus, the outliers and the control limits in Figure 12 and Figure 14 are not applicable.
Figure 16 and Figure 17 are two of the normal probability plots for normality validation. Figure 16 is the normal probability plot of the data points in the control chart for deficiency 01. It can be observed that all the data points are very close to the central straight line and lie within the 95% confidence interval, indicating that the data points are normally distributed. The p-value is 0.6961, greater than 0.05. In light of the bizarre distribution pattern shown in Figure 14, the data points in the control chart for deficiency 12 are obviously not normally distributed. In Figure 17, the normal probability plot of data points in the control chart for deficiency 12, shows this fact. The p-value is much less than 0.05. This can remind port administrations that the inspection of this deficiency item behaves very differently from those of the other deficiency items, and is worth more detailed investigations.
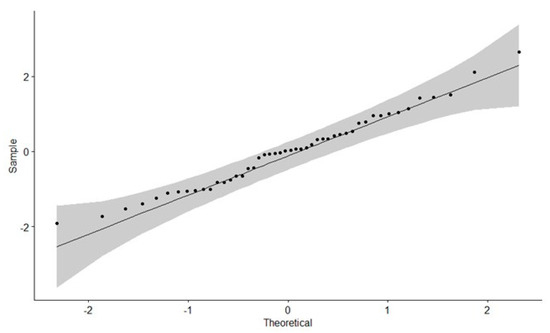
Figure 16.
The normal probability plot of the control chart for deficiency 01.
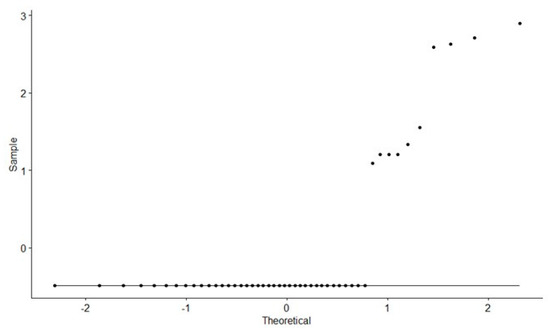
Figure 17.
Normal probability plot of the control chart of deficiency 12.
Summarizing the results above, the control charts and the cause-and-effect diagram show many types of non-random characteristics and can help us identify their potential causes. Furthermore, the results indicate that most of time PSC inspections are not a process in control. The majority of the causes come from the implement of the new requirements of PSC inspections or the conduct of non-routine inspections for particular deficiencies. In addition, the specialty and background of PSC inspectors are also a critical determinant. Therefore, to keep PSC inspection in control and to have a consistent inspection quality, port administrations should reduce non-routine inspections and conduct persistent and consistent inspection requirement. In addition, port administrations should also provide consistent training for inspectors with various specialties and backgrounds.
6. Conclusions and Future Work
The purpose of this paper is to use SPC techniques to investigate whether PSC inspections for maritime safety are a stable process and if they are affected by other factors. Using time-series control charts of past PSC inspections, we realize that PSC inspections may not be a steady process in control in terms of types of deficiencies over time. The behavioral change of specific deficiencies is time-dependent. With the help of experienced practitioners and a cause-and-effect diagram, the cause of abnormal instances can be more easily identified. Three types of patterns are identified to demonstrate the feasibility and effectiveness of the application of SPC on PSC inspections for maritime safety. The major contribution of this paper is that this study is a pioneer in exploring the application of SPC on PSC inspections. In addition, the control charts of SPC can effectively display the time-dependent behavior of historical inspection deficiencies and spotlight abnormal behavior patterns at a specific time period. The cause-and-effect diagrams of SPC can comprehensively search the causes of abnormal behavior patterns at a specific time period, other than other available tools aforementioned can do. The managerial and practical implications of this study are that port administrations can use the SPC tools to easily identify time-dependent abnormal instances occurring in inspections and take proactive actions to mitigate the non-random phenomena in PSC inspections. Based on the results, port administrations should provide persistent and consistent inspection requirements and avoid non-routine inspections in order to maintain deficiency occurring at a steady and low level. Besides, consistent training for inspectors with various specialties and backgrounds is also critical for achieving such a goal. This study provides port administrations with innovative measures for ship inspection improvement but also broadening the application of SPC from traditional industries to maritime safety.
Because this is the first time SPC has been applied to ship inspection tasks for maritime safety improvement, several insufficiencies remain in this paper. For instance, the analysis results are only limited to Taiwan’s ports, may not be applicable to the ports in other countries. The comparison between different ports or between different regions will be an interesting topic. Moreover, inspectors’ specialty background is a key factor in inspection results. Further analysis incorporating the differences of inspectors’ specialties is needed. In addition, more other useful SPC tools can be considered in monitoring, evaluating, and controlling maritime safety activities.
Author Contributions
C.-C.Y. made contributions to the conception of the work, to the acquisition of data, and the interpretation of results. W.-H.C. designed, drafted and revised the work. C.C. made contributions to the conception and design of the work. S.-T.S. analyzed the data and created graphs. All authors read and approved the final manuscript.
Funding
This research received no external funding.
Conflicts of Interest
The authors declare no conflict of interest.
References
- IMO (International Maritime Organization), Introduction to IMO. Available online: http://www.imo.org/en/About/Pages/Default.aspx (accessed on 30 October 2019).
- Fortune, 6 Big Oil Spills, and What They Cost. Available online: https://archive.fortune.com/galleries/2010/fortune/1005/gallery.expensive_oil_spills.fortune/6.html (accessed on 4 November 2019).
- Tokyo MOU. Annual Report (2018): Tokyo MOU. Available online: http://www.tokyo-mou.org/doc/ANN18-web.pdf (accessed on 25 September 2020).
- Yilmazel, M.; Asyali, E. An analysis of port state control inspections related to the ISPS Code. In Proceedings of the IAMU, 6th AGA Conference, Malmö, Swedish, 16–18 October 2005. [Google Scholar]
- Knapp, S.; Van de Velden, M. Visualization of differences in treatment of safety inspections across port state control regimes: A case for increased harmonization efforts. Transp. Rev. 2009, 29, 499–514. [Google Scholar] [CrossRef]
- Cariou, P.; Mejia, M.Q.; Wolff, F.-C. On the effectiveness of port state control inspections. Logist. Transp. Rev. 2008, 44, 491–503. [Google Scholar] [CrossRef]
- Cariou, P.; Mejia, M.Q.; Wolff, F.-C. Evidence on target factors used for port state control inspections. Mar. Policy 2009, 33, 847–859. [Google Scholar] [CrossRef]
- Knapp, S.; Franses, P.H. A global view on port state control: Econometric analysis of the differences across port state control regimes. Marit. Policy Manag. 2007, 34, 453–482. [Google Scholar] [CrossRef]
- Fan, L.; Luo, M.; Yin, J. Flag choice and Port State Control inspections—Empirical evidence using a simultaneous model. Transp. Policy 2014, 35, 350–357. [Google Scholar] [CrossRef]
- Cariou, P.; Wolff, F.-C. Identifying substandard vessels through port state control inspections: A new methodology for concentrated inspection campaigns. Mar. Policy 2015, 60, 27–39. [Google Scholar] [CrossRef]
- Fan, L.; Zhang, Z.; Yin, J.; Wang, X. The efficiency improvement of port state control based on ship accident Bayesian networks. J. Risk Reliab. 2019, 233, 71–83. [Google Scholar] [CrossRef]
- Yang, Z.; Yang, Z.; Teixeira, A.P. Comparative analysis of the impact of new inspection regime on port state control inspection. Transp. Policy 2020, 92, 65–80. [Google Scholar] [CrossRef]
- Gu, X.; Hu, S.; Wu, J.; Chen, X. Correlation analysis of ship detention reasons based on FP-tree algorithm. J. Shanghai Marit. Univ. 2015, 36, 60–64. [Google Scholar]
- Zhang, X.N.; Li, N.; Zhu, F.E. Research and analysis of ship defect data using Apriori algorithm. Ship Sci. Technol. 2016, 38, 139–141. [Google Scholar]
- Tsou, M.C. Big data analysis of port state control ship detention database. J. Mar. Eng. Technol. 2019, 18, 113–121. [Google Scholar] [CrossRef]
- Cook, G.E.; Maxwell, J.E.; Barnett, R.J.; Strauss, A.M. Statistical process control application to weld process. IEEE Trans. Ind. Appl. 1997, 33, 454–463. [Google Scholar] [CrossRef]
- Godina, R.; Matias, J.C.; Azevedo, S.G. Quality improvement with statistical process control in the automotive industry. Int. J. Ind. Eng. Manag. (IJIEM) 2016, 7, 1–8. [Google Scholar]
- Tian, W.; You, H.; Zhang, C.; Kang, S.; Jia, X.; Chien, W.T.K. Statistical process control for monitoring the particles with excess zero counts in semiconductor manufacturing. IEEE Trans. Semicond. Manuf. 2018, 32, 93–103. [Google Scholar] [CrossRef]
- Morton, A.P.; Whitby, M.; McLaws, M.L.; Dobson, A.; McElwain, S.; Looke, D.; Stackelroth, J.; Sartor, A. The application of statistical process control charts to the detection and monitoring of hospital-acquired infections. J. Qual. Clin. Pract. 2001, 21, 112–117. [Google Scholar] [CrossRef] [PubMed]
- Finnerty, P.; Provost, L.; O’Donnell, E.; Selk, S.; Stephens, K.; Kim, J.; Berns, S. Using infant mortality data to improve maternal and child health programs: An application of statistical process control techniques for rare events. Matern. Child Health J. 2019, 23, 739–745. [Google Scholar] [CrossRef] [PubMed]
- Eissa, M.E.; Abid, A.M. Application of statistical process control for spotting compliance to good pharmaceutical practice. Braz. J. Pharm. Sci. 2018, 54. [Google Scholar] [CrossRef]
- Shamsuzzaman, M.; Jasim, E.; Alsyouf, I. Application of statistical process control chart for monitoring electric power losses through transmission and distribution system: A case study. In Proceedings of the International Conference on Industrial Engineering and Operations Management, Kuala Lumpur, Malaysia, 8–10 March 2016. [Google Scholar]
- Berlemann, M.; Freese, J.; Knoth, S. Dating the start of the US house price bubble: An application of statistical process control. Empir. Econ. 2020, 58, 2287–2307. [Google Scholar] [CrossRef]
- Khorshidi, H.A.; Nikfalazar, S.; Gunawan, I. Statistical process control application on service quality using SERVQUAL and QFD with a case study in trains’ services. TQM J. 2016, 28, 195–215. [Google Scholar] [CrossRef]
- Ung, S.T.; Chen, Y.T. A practical application of ‘Six Sigma’ to port operations. J. Mar. Eng. Technol. 2010, 9, 13–21. [Google Scholar] [CrossRef]
- Ridwan, A.; Noche, B. Improving performance of supply chain in port by six sigma methodology approach. In Proceedings of the 6th International Conference on Operations and Supply Chain Management, Bali, Indonesia, 10–13 December 2014. [Google Scholar]
- Tokyo MOU, List of Tokyo MOU Deficiency Codes. Available online: http://www.tokyo-mou.org/doc/Tokyo%20MOU%20deficiency%20codes%20(December%202017).pdf (accessed on 25 November 2019).
© 2020 by the authors. Licensee MDPI, Basel, Switzerland. This article is an open access article distributed under the terms and conditions of the Creative Commons Attribution (CC BY) license (http://creativecommons.org/licenses/by/4.0/).