Article

Experimental Study on the Distribution of Wave-Induced Excess Pore Pressure in a Sandy Seabed around a Mat Foundation

State Key Laboratory of Ocean Engineering, Department of Civil Engineering, Shanghai Jiao Tong University Shanghai 200240, China
*
Author to whom correspondence should be addressed.
J. Mar. Sci. Eng. 2019, 7(9), 304; https://doi.org/10.3390/jmse7090304
Submission received: 17 July 2019 / Revised: 26 August 2019 / Accepted: 30 August 2019 / Published: 3 September 2019
(This article belongs to the Section Ocean Engineering)

Abstract

:
Mat foundations are widely used in jack-up offshore platforms to support and transfer loads. Regarding mat foundations working on the seabed, the excess wave-induced pore pressure is critical to seabed stability, which may finally cause structural failure. Therefore, it is important to investigate the distribution of the excess pore pressure in the seabed around the mat foundation. In this study, experiments were performed to study the excess pore pressure distribution around a mat foundation in scale considering the true load state by recording wave profiles and pore pressures inside a sandy seabed. To guarantee the reliability of experiments, a numerical study was conducted and compared with the experimental results. Experimental results indicate that with the existence of the mat foundation, the excess pore pressure is higher at the region, the range of which is the width of the model mat ( W m ) before the structure. The maximum pore pressure appears at 0.55   W m in front of the center of the mat foundation. In addition, the current significantly increases the range of high pore pressure area and the amplitude of the excess pore pressure. As the mat orientation changes, the position of the maximum pore pressure changes from the front to the edge of the mat.

1. Introduction

Jack-up platforms are widely used in offshore oil exploitation and pile installation because of their relatively less distribution on the seabed and relatively better stability [1,2,3]. Mat foundations, which act as temporary supports to transfer upper loads to the seabed, are commonly used for its commendable terrain adaptability, better consolidation control, and convenient construction [4]. In marine environments, especially in shallow sea areas, ocean waves are the significant loads acting on structures and seabed, so the wave-induced seabed response cannot be ignored [1]. The wave-induced pore pressure in the seabed, which is significantly affected by the wave-structure-seabed interaction (WSSI), is dominating in the evaluation of liquefaction potential in the vicinity of the foundation and may even lead to structural collapse. Thus, the distribution of seabed pore pressure under wave action around the mat foundation needs to be investigated, which will provide a better understanding of the appliance security of an offshore structure.
In recent years, to study the influence on seabed caused by mat foundation, several numerical and experimental investigations have been carried out. Semenov et al. [5] conducted laboratory experiments to parametrically study the impact of waves on the soil near the gravity-type platform foundation, which had the square form with cut corners. However, the pore pressure of the seabed under the wave-structure-seabed interaction is not mentioned in this paper, as they only concentrate on the behavior of the seabed profile near the structure. Bearing capacity of sand overlying soft clay is numerical analyzed by Lu and Maclaren [4] to research the stability of the skirted mud mat foundation, which is different from the mat foundation with the flat ground on a sandy seabed in this study. Three-dimensional numerical simulations have been performed to study the wave-induced poro-elastic seabed response around a hexagonal gravity-based offshore foundation by an integrated multi-physics model-based framework on OpenFOAM [6]. The existing literature on this issue is minimal. Most of the previous studies have focused on seabed response around other gravity-based offshore structures, such as submerged breakwaters, which can provide references for this study.
Numerous investigations have been carried out to thoroughly understand the mechanism of the wave transformation and the dynamic interaction between waves, sandy seabed, and submerged breakwater [2,7,8,9,10]. Based on Biot’s poro-elastic theory [11], Mizutani et al. [12] investigated the interaction between the nonlinear wave and the submerged breakwater by developing a combined boundary element method-finite element method (BEM-FEM) model. Jeng et al. [13] developed an integrated model (PORO-WSSI 2D) to study the interactions of the flow in the seabed and marine structures. Zhang et al. [2] expanded the integrated model (PORO-WSSI 2D) to investigate the wave-permeable structure-porous seabed interactions and applied it to study the wave-induced pore pressure under various wave, soil, and structure parameters. Besides, several experimental investigations have been carried out. Liu et al. [14] carried out parametric research on the vertical distribution of the wave-induced pore pressure by a vertical cylinder. The experiments were conducted to study the differences of wave surface, velocity field, and pore water pressure between submerged breakwater with non-breaking harmonic waves [15,16]. However, these two experiments focused on the evolution of monochromatic waves without the observation of the seabed response. Mizutani et al. [17] conducted two-dimensional (2D) wave tank experiments to parametrically study the effect of breakwater and seabed on free surface elevation, dynamic soil pore pressure, and shear stress. The influence on the excess pore-pressure due to the combination of wave and current is studied and compared with theoretical models proposed by Qi et al. [18].
Mat foundations are different from other offshore marine structures in terms of geometry, underwater height, and stress state. The deficiency of experimental result considering the actual working conditions of mat foundation builds up obstacles for future scientific research. Thus, the paper aims to present a series of test results of the seabed excess pore pressure around and under the mat foundation, rather than just vertical distribution in a cross-section. The experimental exploration of the pore pressure distribution can provide a reference for determining the most likely liquefaction area of the sandy seabed with a mat foundation. In the experimental design, the influence of the proportional scale, the location of the mat foundation at work, the combination of wave and current as well as the load state are all considered to simulate its real working state more comprehensively. Based on the experimental results, the influences on the wave motion and the excess pore pressure amplitude caused by the mat foundation are discussed. Then, the plane and the vertical distribution of the pore pressure are presented and compared by changing wave height, wave period, the mat foundation orientation, and the addition of current on the wave. Besides, some numerical simulations are carried out to verify the experimental data and complement the spatial distribution of excess pore pressure, since pore pressure can only be measured at finite discontinuities in the test.

2. Experimental Formulation

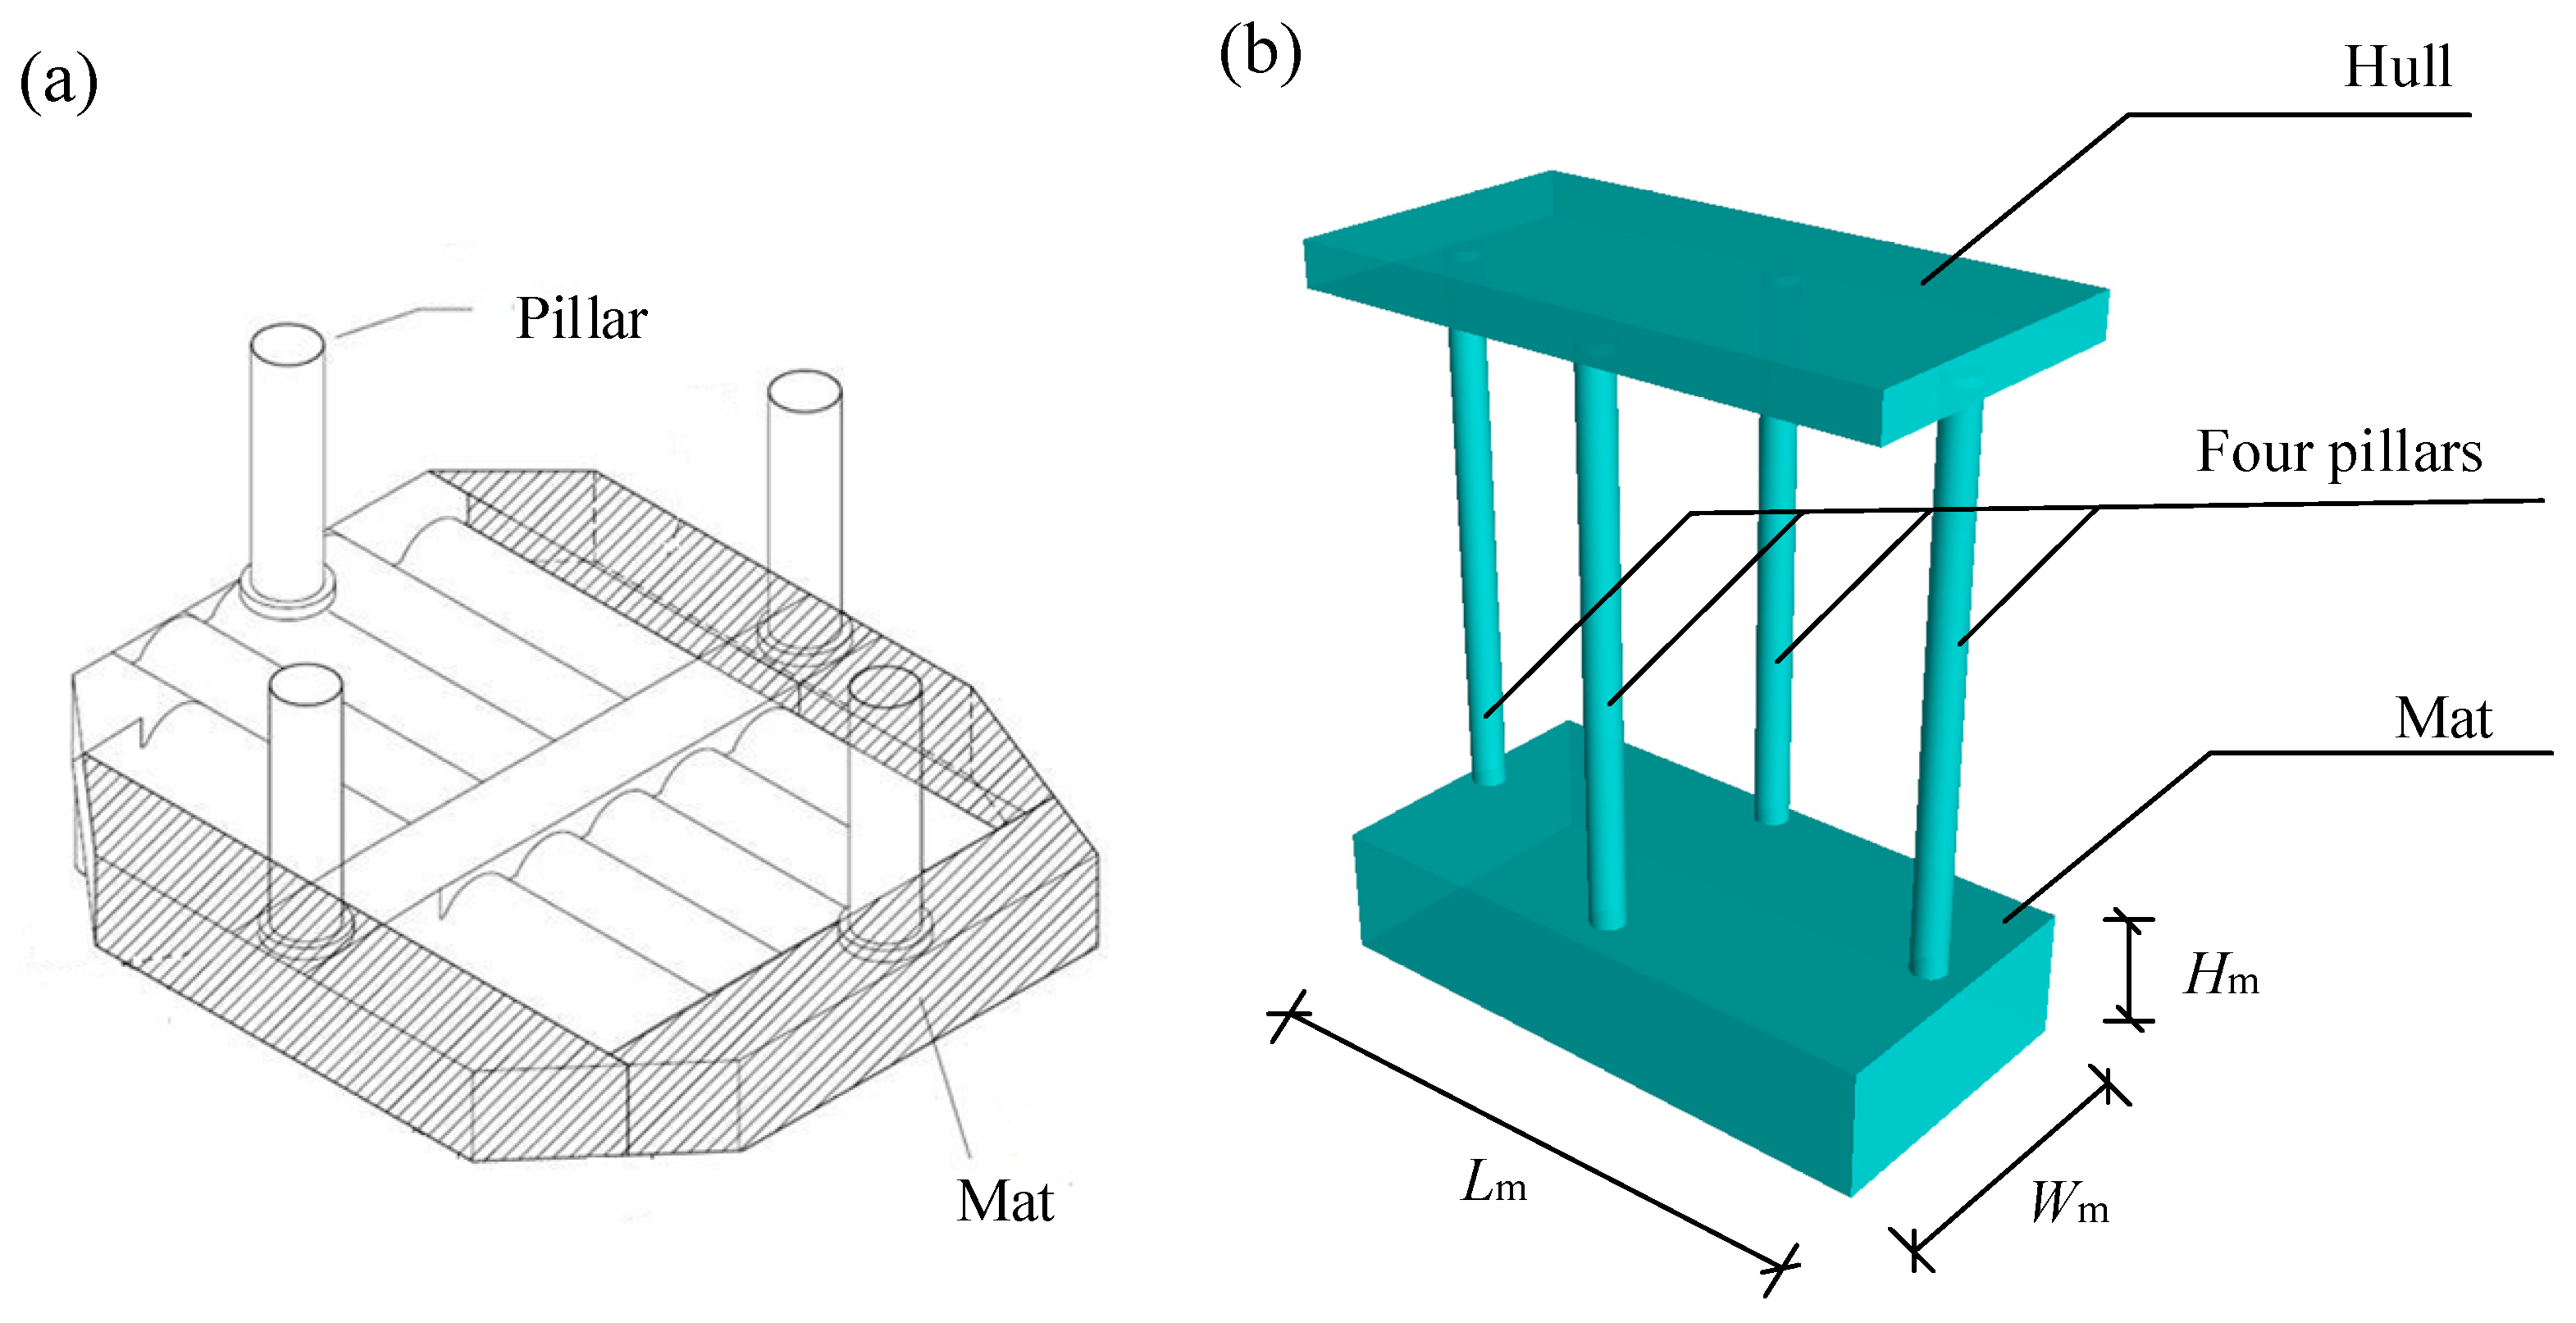
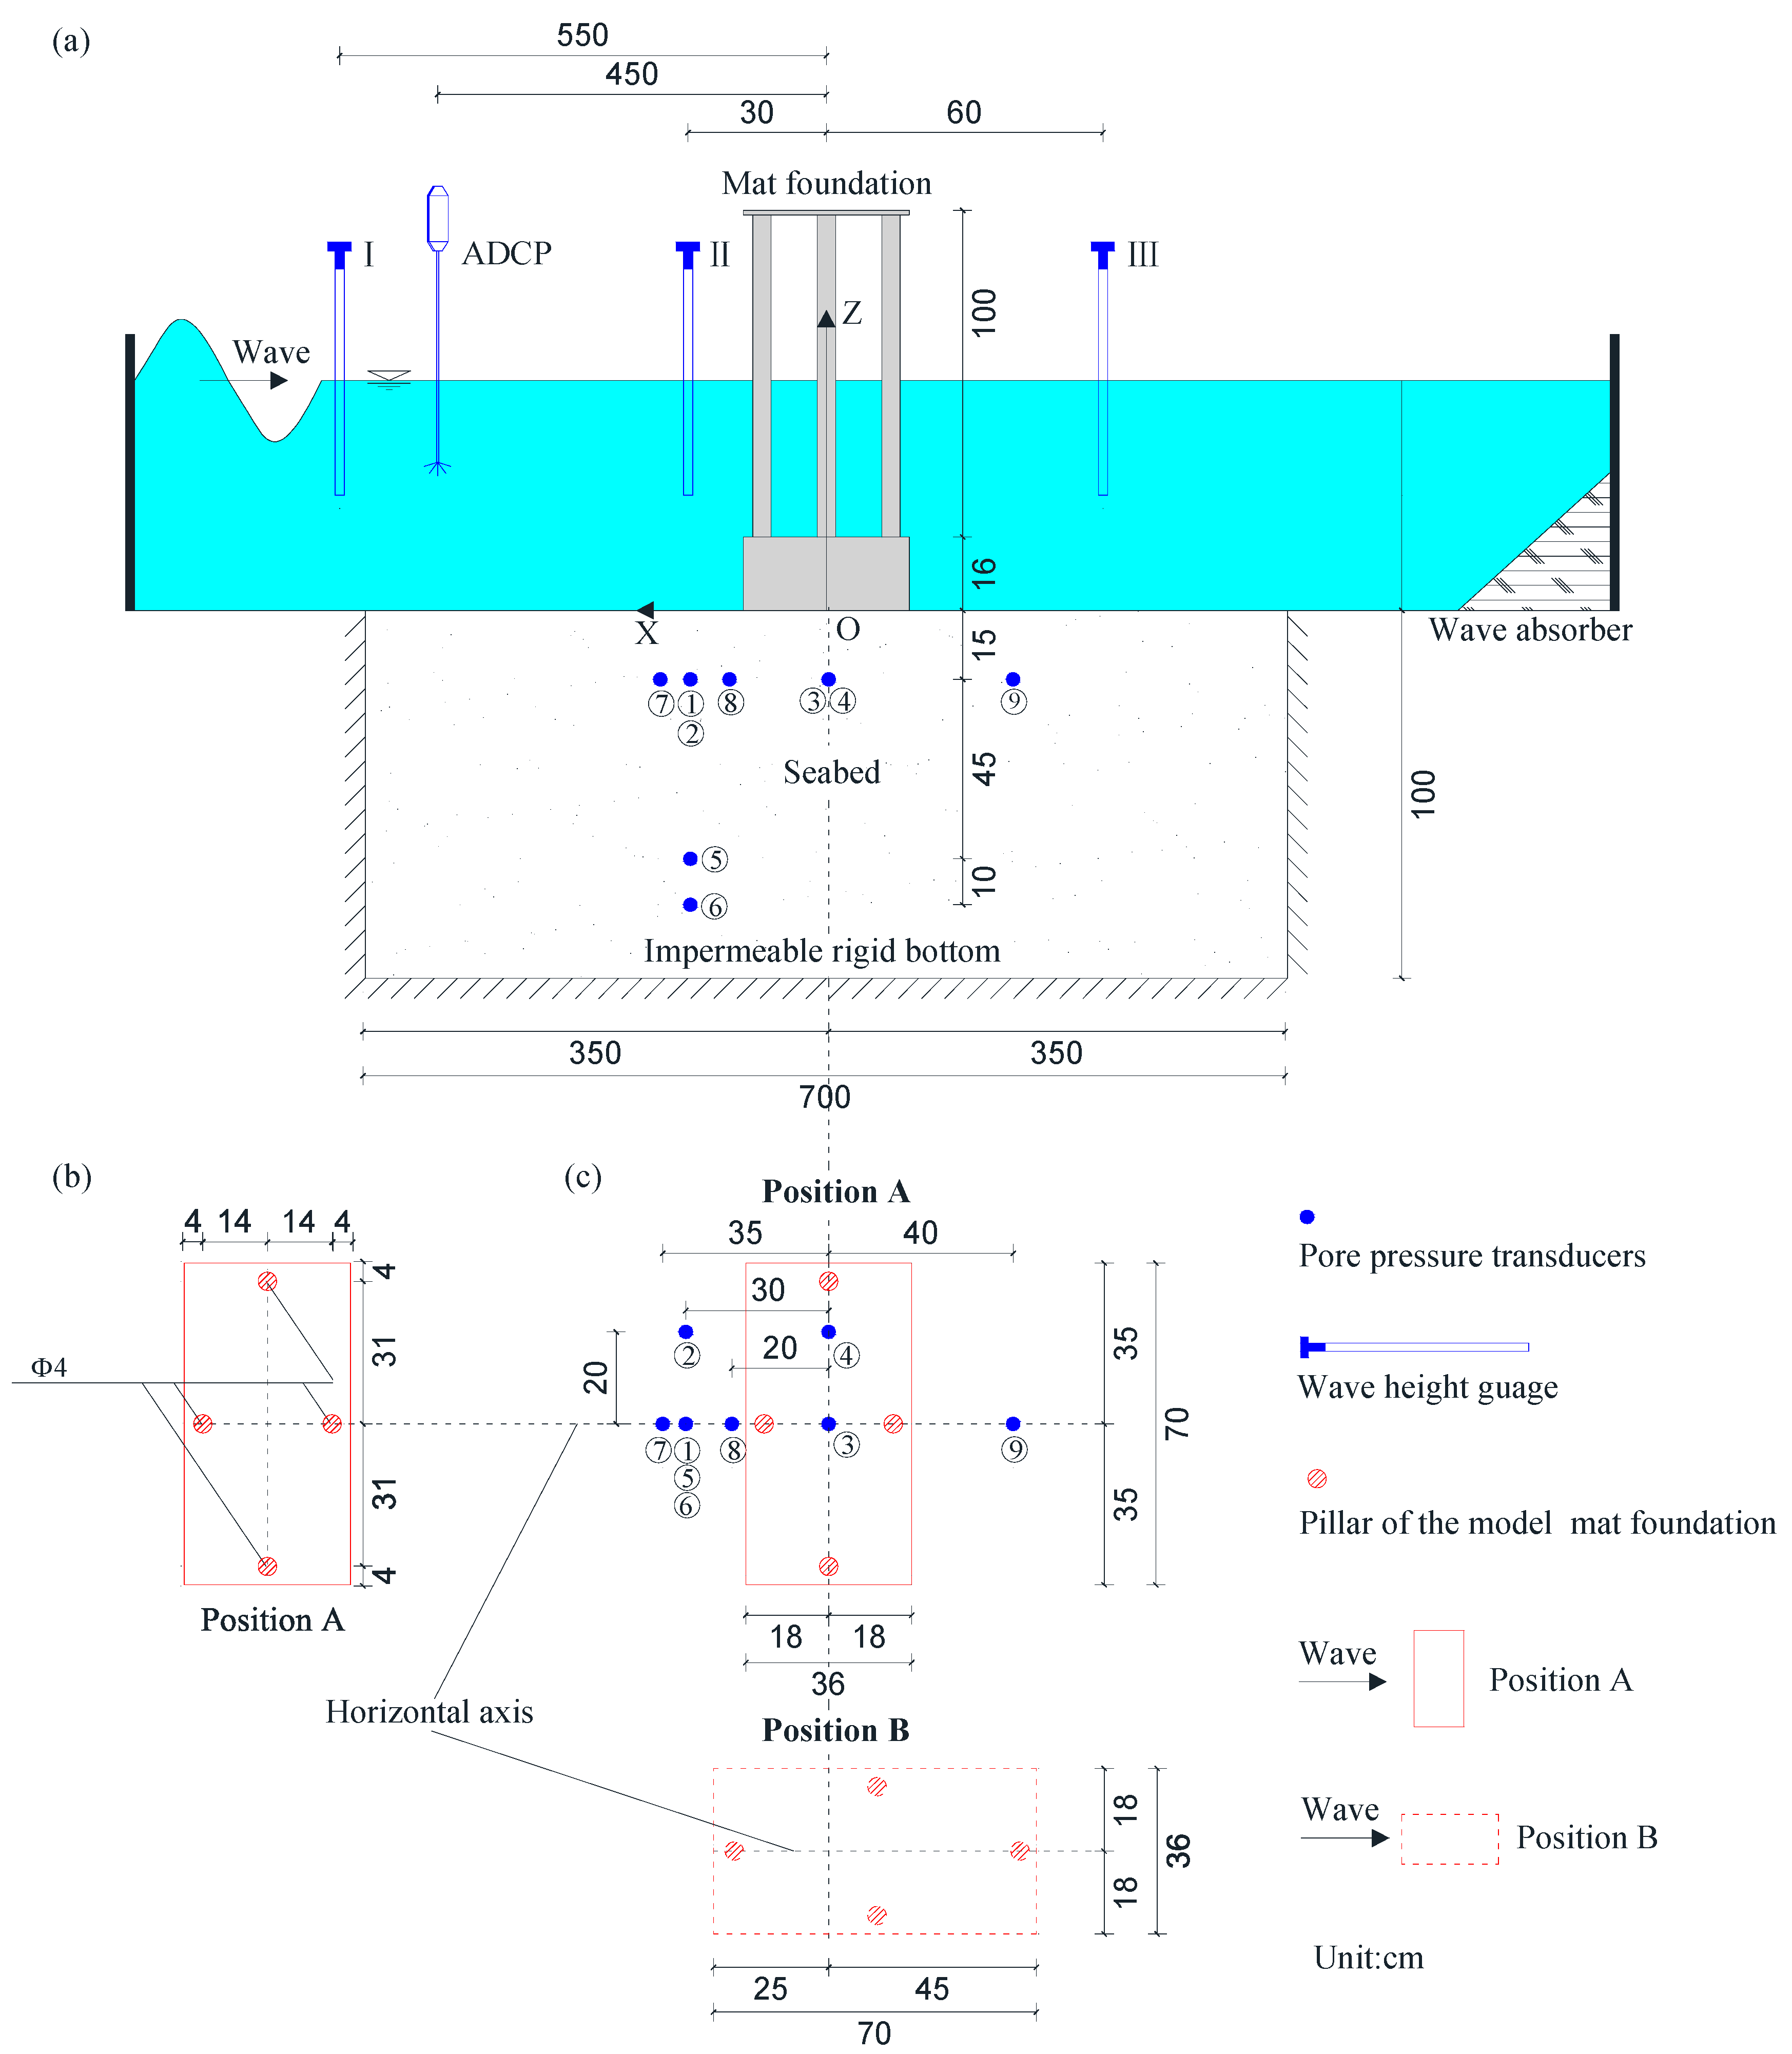
2.1. Experimental Set-Up

To investigate the wave-induced excess pore pressure around the mat foundation, a series of flume experiments were carried out in a wave flume (60.0 m in length, 2.0 m in width and 1.5 m in depth). A soil-box of 7.0 m (length) × 2.0 m (width) × 1.0 m (depth) is set at the middle of the flume and details of the soil properties are listed in Table 1. A jack-up platform is installed on the surface of the soil-box. As shown in Figure 1 the real jack-up platform was simplified to a model with three parts: a mat foundation, four pillars, and a hull above the water. Figure 2 shows the dimensions and relative positions of the mat model and soil box. All the marks in Figure 2 are in centimeters.
Three wave height gauges (model number: YWS200; measurement range: 0.60 m; accuracy: ±0.5%; sampling frequency: 100 Hz) manufactured by Yufan Co. Ltd. (Chengdu, China) were established to measure the wave profile, one of which was located far field for calibration. An acoustic Doppler current profiler (ADCP; model number: Vectrino; measurement range: ±0.01 to ±1.4 m/s; accuracy: ±0.5%; sampling frequency: 200 Hz; manufacturer: Nortek AS) was utilized to determine the velocity of the flow field. Total nine CY306 type pore pressure transducers (PPTS; measurement range: 30 kPa; accuracy: ±0.1%; manufacturer: Shengying Cekong) were mounted to measure the pore pressure within the seabed with the sampling frequency 100 Hz. In this experiment, to ensure the accuracy of the impact on pore pressure caused by mat foundation, four PPTs (PPT 1–PPT 4) were installed in the regions with a risk of liquefaction to investigate the variation of the pore pressure distribution. Five PPTs (PPT1, PPT3, and PPT7–PPT9) were set along the flume length to monitor the plane distribution of the pore pressure. In the vertical direction, there were another three PPTs (PPT1, PPT5, and PPT6). The locations of all the mentioned measuring instruments are presented in Figure 2.
As mentioned in the previous investigations of flume experiments [19,20,21], the proportional scale is considered for better reliability when designing the parameters of the experimental test. The corresponding parameters between actual condition and experiment of the mat foundation, wave parameters, current and water depth are tabulated in Table 2. The actual value of the mat is determined by a typical jacking pile driver of Shanghai Zhenhua Port Machinery Company Limited. Moreover, actual parameters of wave, current, and water depth result from the ambient dynamic loads of the driver in use [22]. In order to ensure adequate distance from the model to the edge of the flume, the plane scale is set as 50 to reduce the boundary effect on the flow field. Besides, the vertical proportional scale is reduced to 25 to make sure the wave height is high enough to generate significant variation in pore pressure. The value used in this experiment is calculated by scaling the actual value. The vertical load on the foundation is considered, and the required load is provided by the self-weight of the model together with the weight of water in the cavity of the model. Table 2. lists all homologous parameters, and the abbreviations in Table 2. represent experimental values in the following.

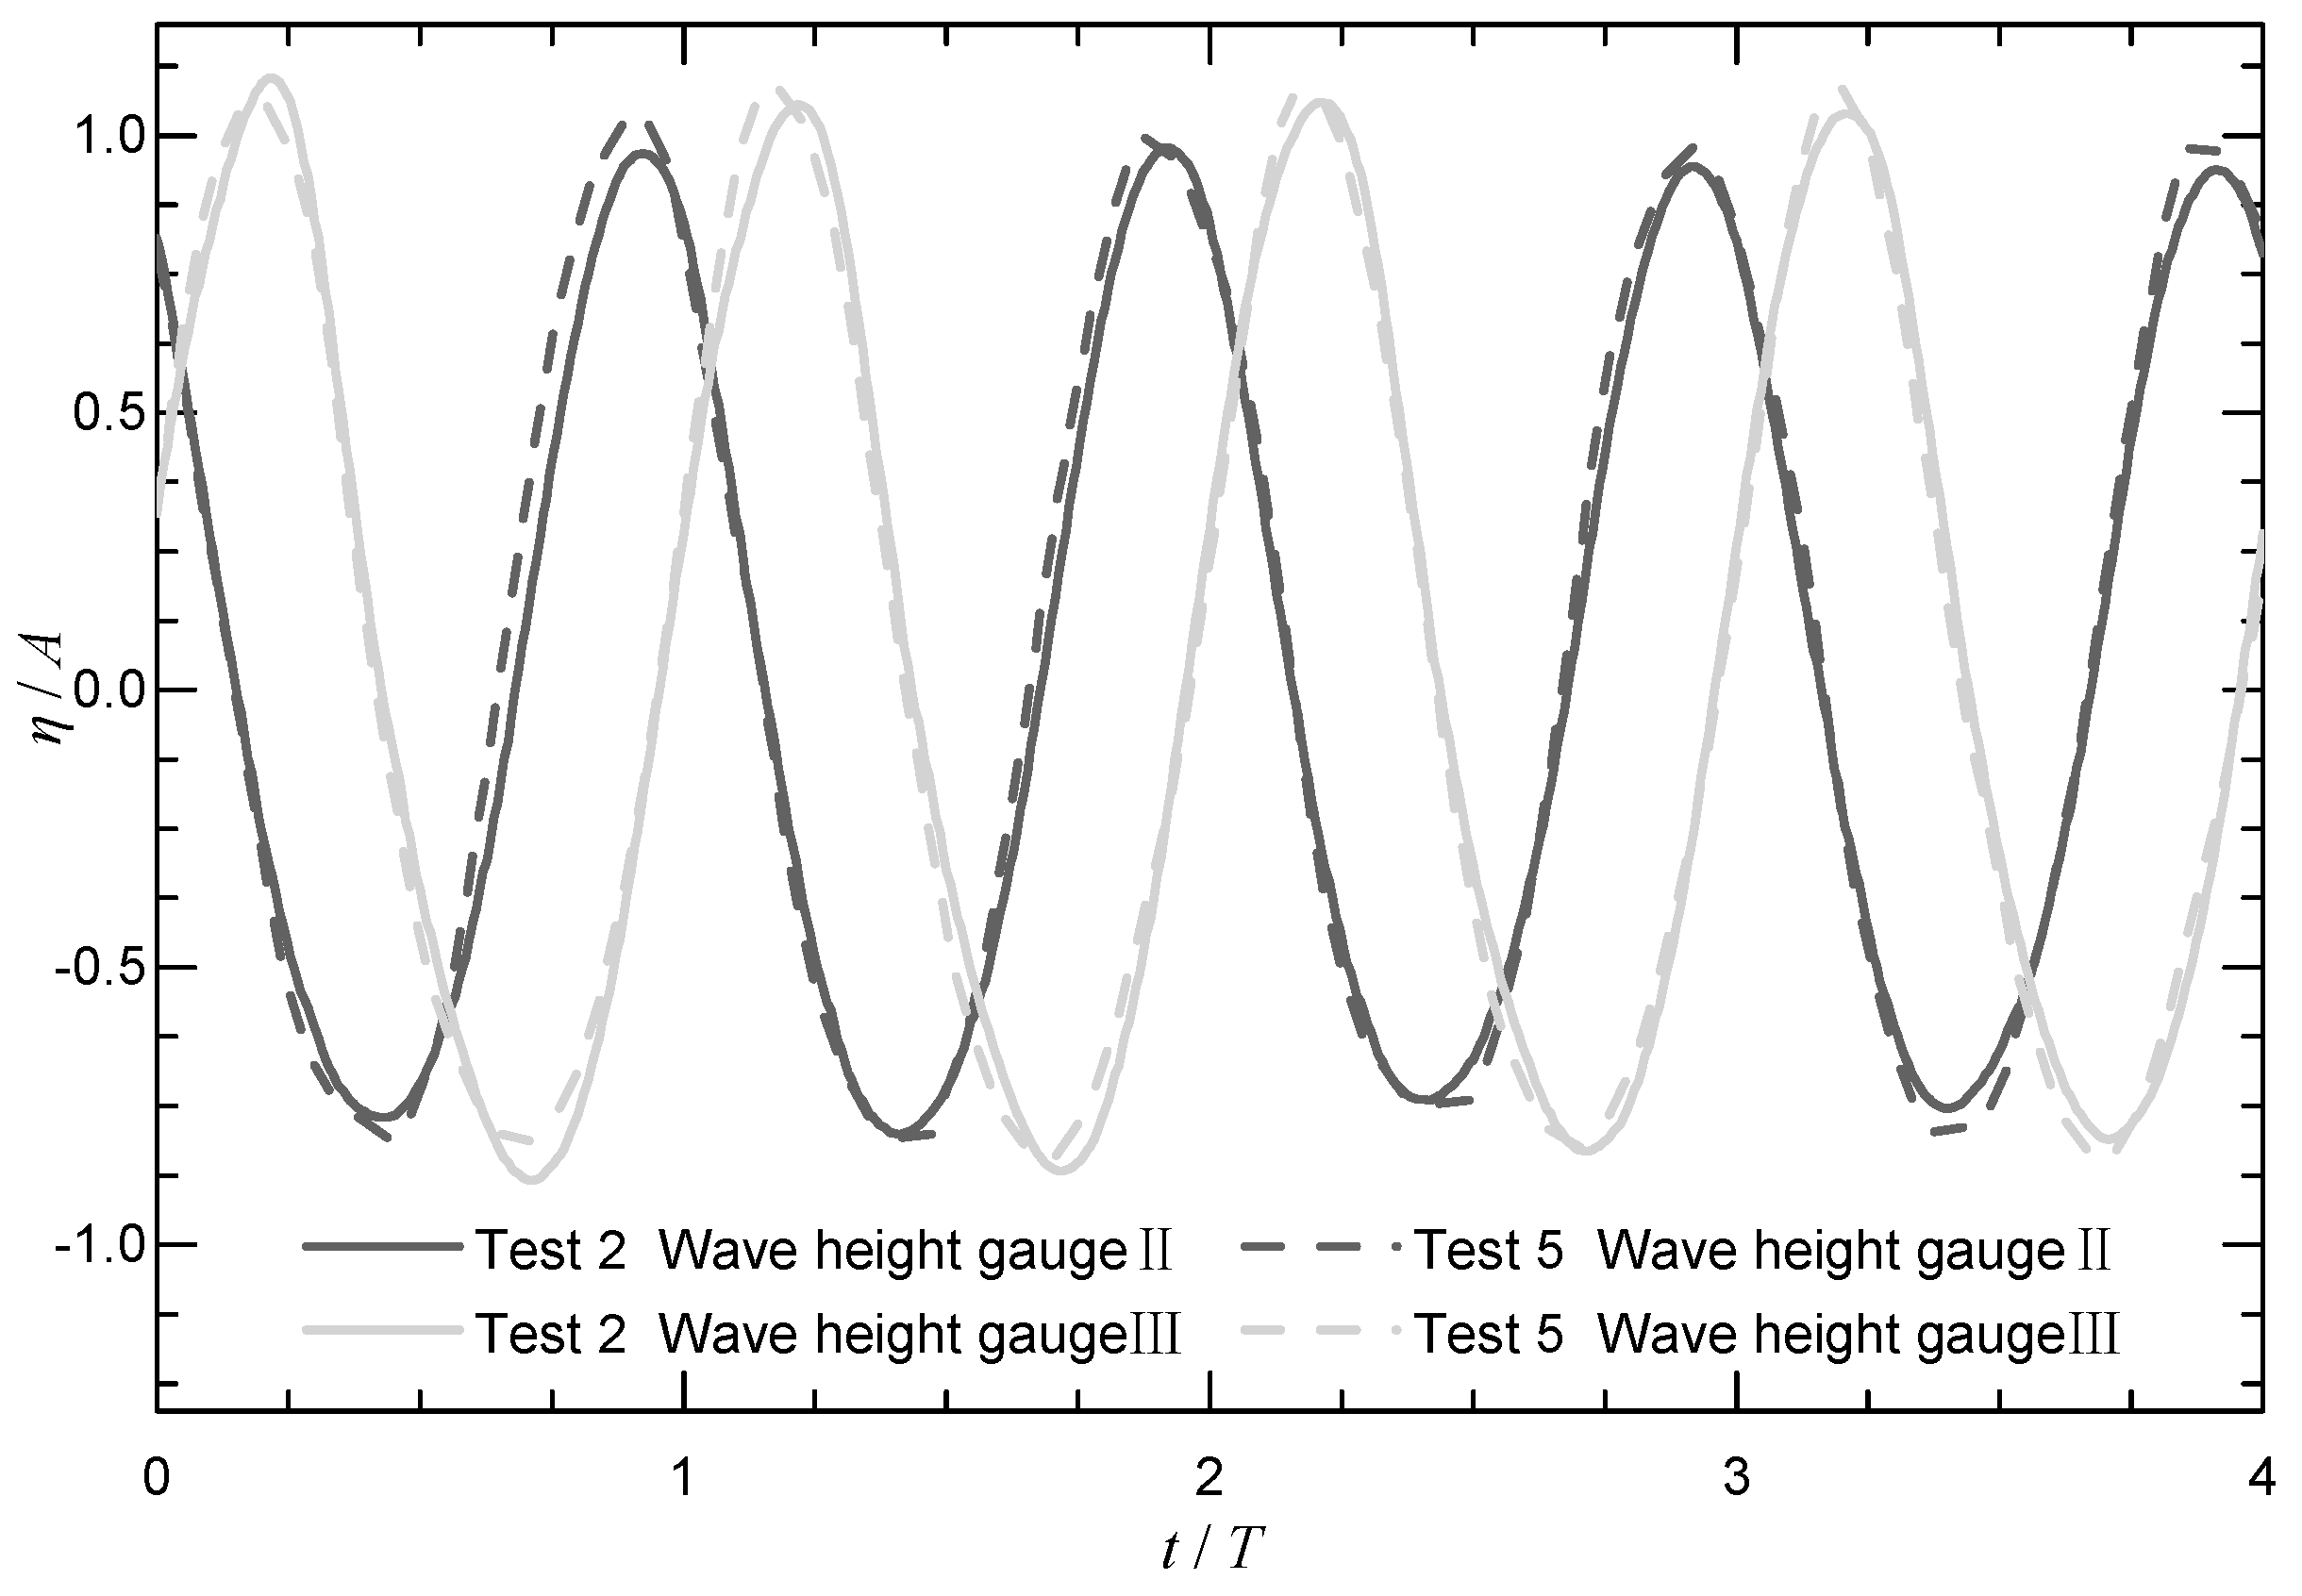
2.2. Test Procedure and Experimental Conditions

The experimental procedure was adopted as follows:
(1)
Empty and clean the wave flume and the soil-box before the experiment;
(2)
Fix the measuring instruments at the predesigned site, including three wave height gauges, an ADCP, and nine PPTs;
(3)
The soil box was filled slowly with clean water to the required depth to reduce air entrainment. Then the sandy seabed was left over a period (12 h) to ensure being fully saturated;
(4)
Place the mat foundation on the specific position of the sandy seabed. Use a gradient to ensure that the instrument is placed horizontally;
(5)
Slowly pump water into the flume until the designed water depth (0.6 m) is reached;
(6)
Calibrate the parameters of the wave generator by comparing the input data of wave height with the observed value of the far-field wave gauge;
(7)
The experiment starts collecting the data record by switching on the wave generator;
(8)
Repeat steps 6–7 for the next test, and steps 4–7 if the model position needs to be changed.
In all the tests, the data was collected until the wave reached a steady state for at least 240 s. In addition, each test was done at least twice to ensure the reliability of the collected data.
Several experimental conditions for investigating the distribution of the pore pressure around the mat foundation are summarized in Table 3. In all the cases, the water depth ( h w ) remains unchanged at 60 cm, and the wavelength ( L w ) is iteratively calculated as Equation (1) shown. The two positions of mat foundation are presented in Figure 2c.
L w = g T 2 2 π t a n h 2 π L w h w .

3. Result and Discussions

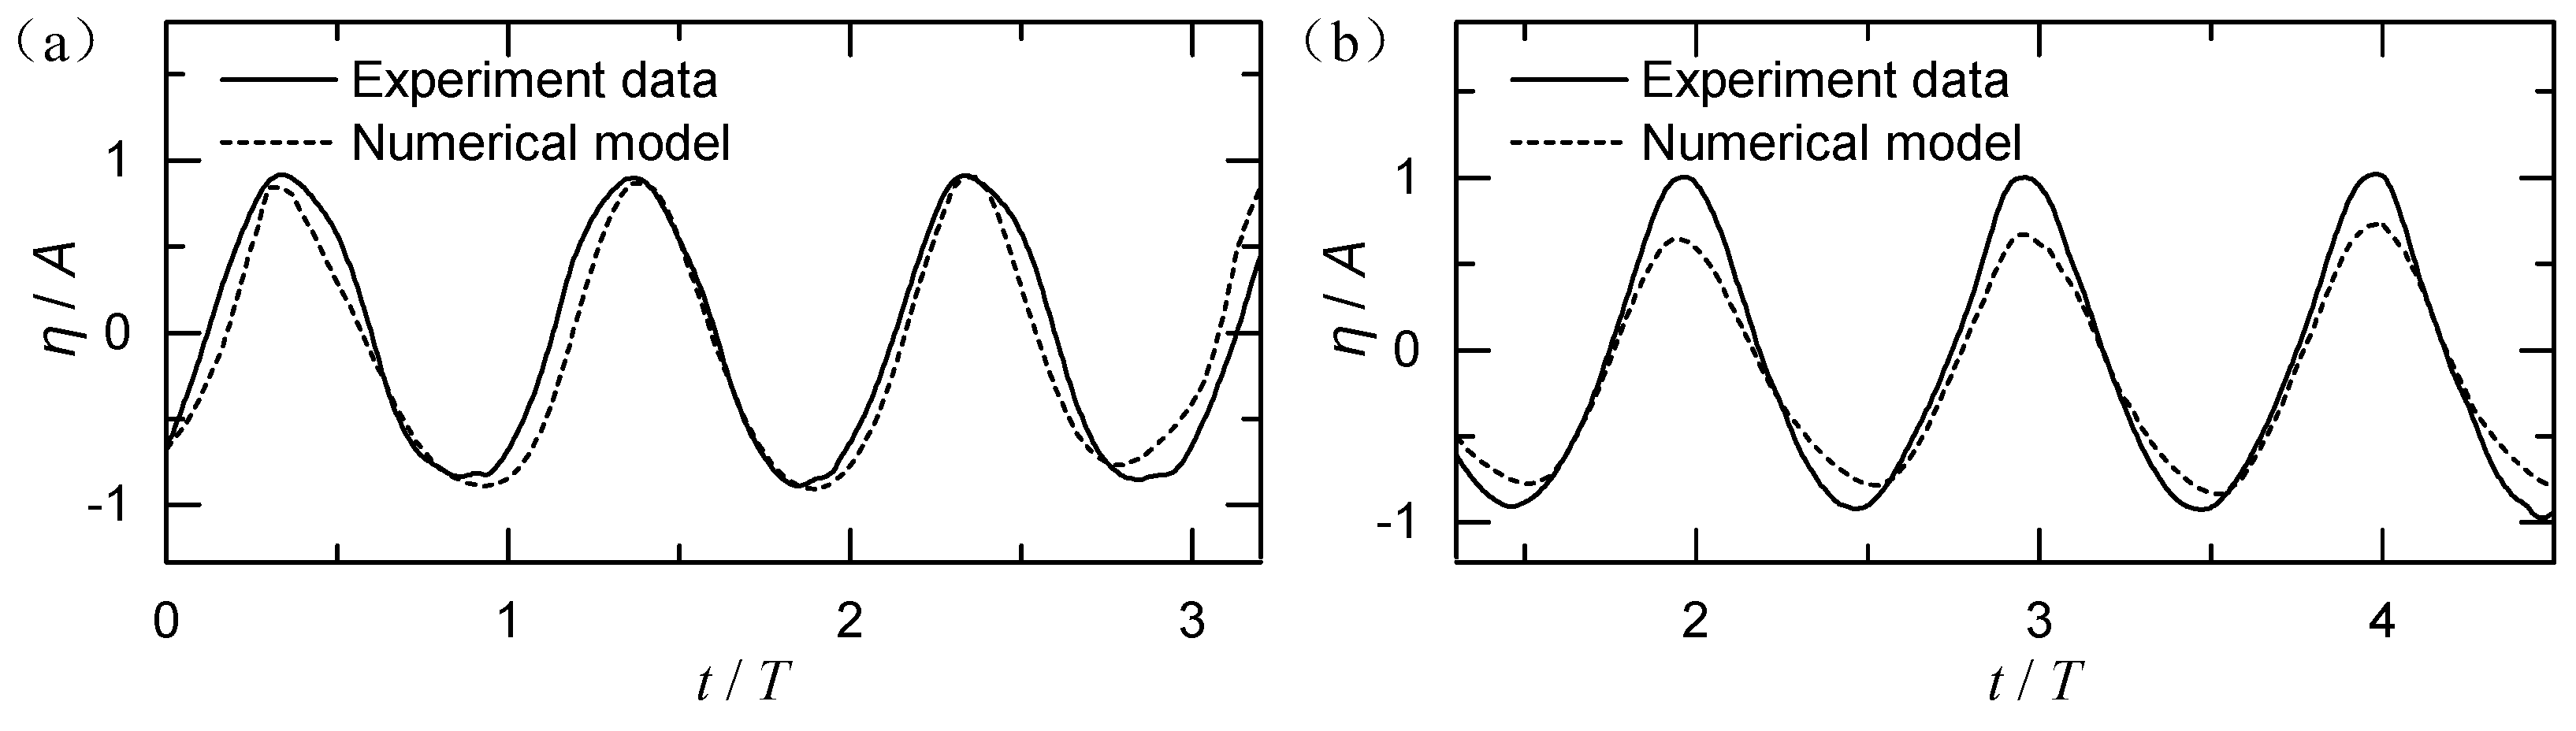
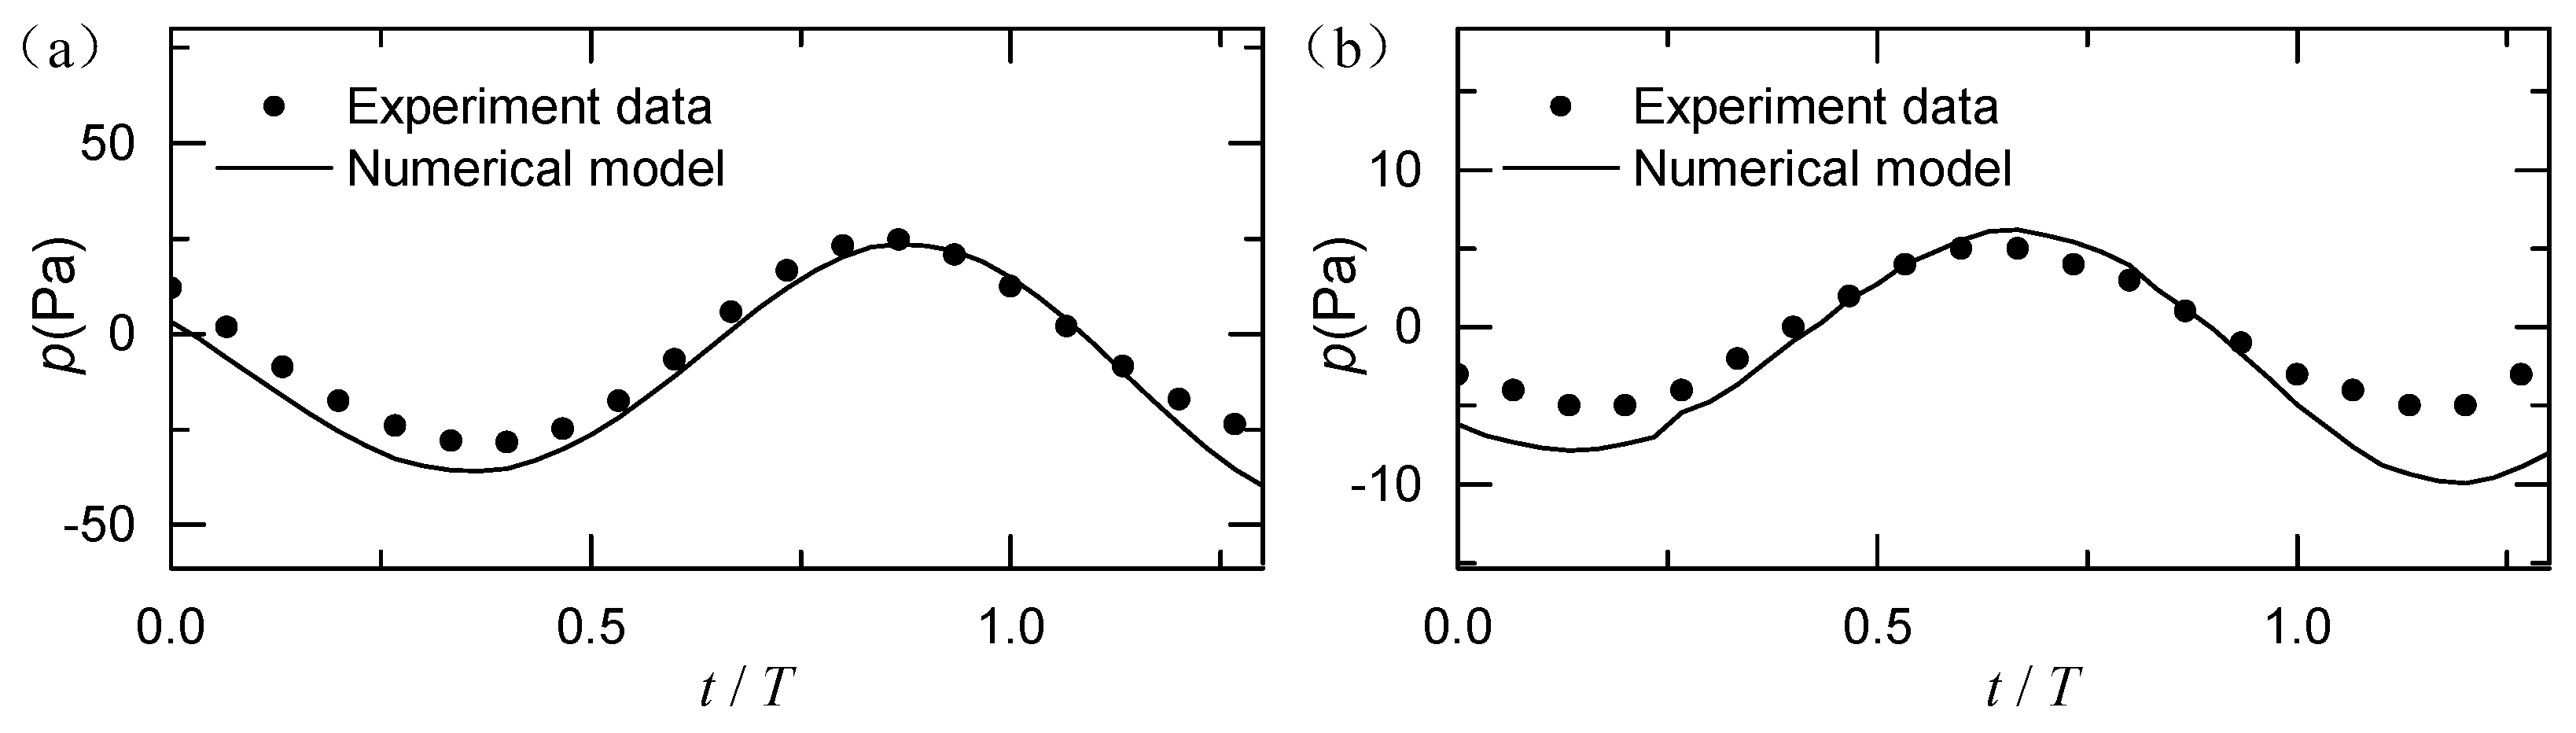
3.1. Numerical Verification

In this section, the verification of the experimental results is presented. An integrated numerical model proposed by Liao [23] is set up to calculate the wave-induced seabed response around a mat foundation numerically. This numerical model has been employed and verified repeatedly in previous researches [3,23,24,25], and it consists of two sub-models: The flow sub-model and the seabed sub-model. For the flow sub-model, the finite volume method (FVM) is employed to solve the Reynolds-averaged Navier-Stokes (RANS) equation in FLOW3D®. In the seabed sub-model, the seabed response is solved by the finite element method (FEM) depending on Biot’s QS theory with COMSOL Multiphysics. The governing equations, boundary conditions of both sub-models, and the needed initial conditions are described below.

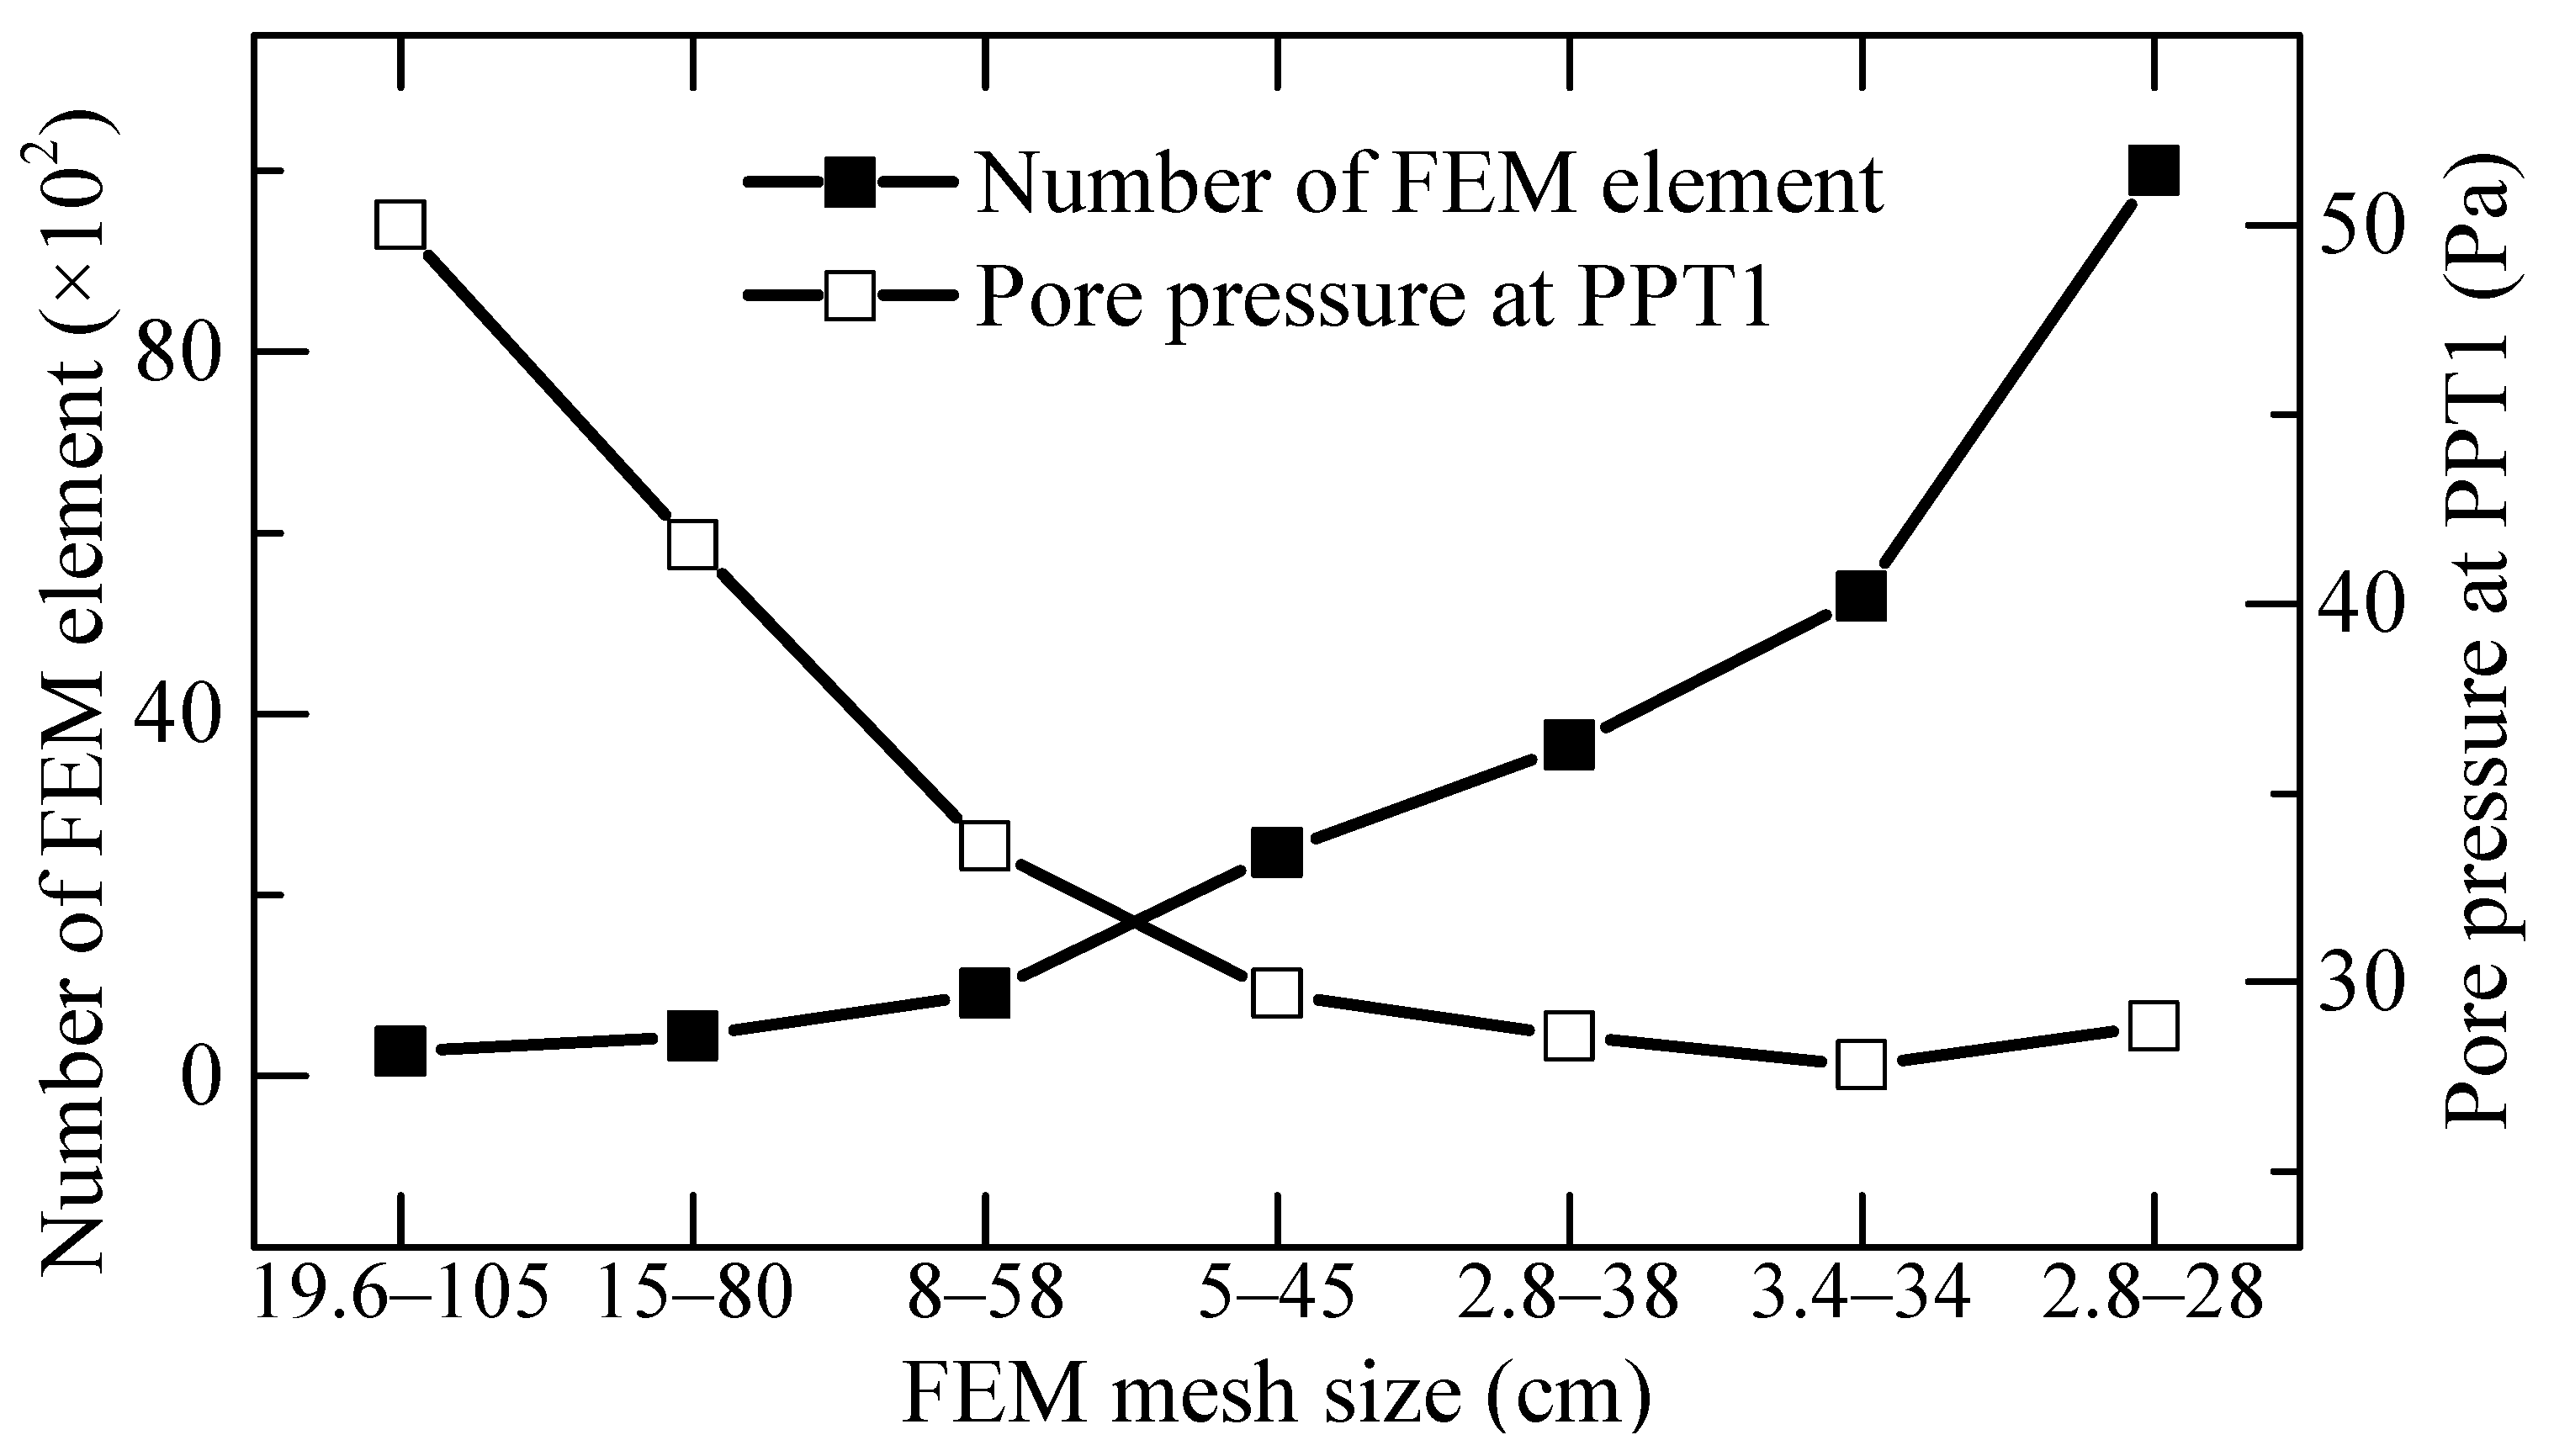
3.1.1. Set Up of the Numerical Model

(1) Governing equations
In the flow sub-model, the incompressible Newtonian fluid motion can be described by the RANS equations with a k-ε model, which is based on the mass and momentum conservations, can be express as follows:
u f i x i = 0 ,
ρ f u f i t + ρ f u f i u f j x j = x i [ ρ f + 2 3 ρ f k ] + x j [ μ e f f ( u f i x j + u f j x i ) ] + ρ f g i ,
where x i is the Cartesian coordinate; u f i is the ensemble mean velocity (m/s); p f is the pressure of fluid (Pa); ρ f is the fluid density (kg/m3); t is the time(s); g i is the gravitational acceleration (m/s2); μ is the molecular viscosity (Pa·s), and   k is the turbulent kinetic energy (m2/s2)
In the seabed sub-model, Biot’s QS theory [11] for a poro-elastic medium is adopted to govern the seabed response. For an isotropic homogeneous sandy seabed, the conservation of mass could be expressed as:
k s 2 p s γ w n s β s p s t + γ w ε s t = 0 ,
where 2 = ( 2 x 2 , 2 z 2 ) is the Laplace operator, p s is the pore pressure in the seabed, γ w is the unit weight of water, n s is the soil porosity, k is the soil permeability. For a plane strain problem, the volume strain ( ε s ) and the compressibility of pore fluid ( β s ) are respectively defined as follows:
ε s = u s x + w s z ,
β s = 1 K w + 1 S r P w o ,
where ( u s , w s ) are soil displacements in x- and z-direction respectively, K w is the true elasticity modulus of pore water (taken as 2 × 10⁹ Pa), P w o is the absolute water pressure and S r is the seabed degree of saturation.
Leaving out the body forces and inertia terms, the equilibrium equations could be expressed as:
G 2 u s + G ( 1 2 ν ) ε s x = p s x ,
G 2 u s + G ( 1 2 ν ) ε s y = p s y ,
G 2 w s + G ( 1 2 ν ) ε s z = p s z ,
where G is the shear modulus and ν is the Poisson’s ratio.
(2) Boundary conditions
To solve the RANS equations in flow sub-model, appropriate boundary conditions are required. A linear water wave train is generated at the wave inlet boundary (position of x = 0 ). The outflow boundary is applied with a sponge layer with at least two-wavelength long to diminish the wave reflection. At the bottom of the wave model, the no-slip boundary is applied to make the fluid velocity in the normal direction is zero. At the air-water interface, the volume-of-fluid (VOF) method [26] is used to capture the free surface behavior.
In the seabed sub-model, appropriate boundary conditions are required to solve the governing Equations (4) and (7) to (9) of the porous seabed. At the seabed surface, the wave-induced pore water pressure p s is set to be equal to dynamic wave pressure p wv obtained from the flow sub-model, and the vertical effective normal stresses and shear stresses are considered to be 0. The two lateral boundaries and the seabed bottom are set as fixed impermeable boundaries.
(3) Numerical Scheme
The integrated numerical model is considered by inducing the pressure on the surface of the seabed of flow sub-model into the seabed sub-model. The input parameters of the soil and wave parameters of this numerical model are listed in Table 2 and Table 3.
In the flow sub-model, a numerical wave tank is established with dimensions of 20 m long, 2 m wide and 0.6 m high, where the wave tank is 12 m and the sponge layer is 8 m to diminish the influence of fixed boundary as Ye and Jeng suggested [27]. The middle of the mat foundation, where the origin of the Cartesian coordinate is located, is positioned 10m away from the linear wave inlet boundary. A fine mesh block with total 400,000 quadrate cells is set to ensure the computational accuracy of the model, where the mesh size in the wave height direction is 0.006 (approximate 1/17 of the wave height).
In the seabed sub-model, the seabed area measures 7   m × 2   m × 1   m , which is the same as the soil box shown in Figure 2. The mat foundation is placed in the middle of the seabed surface. The 7-m-long seabed model is about 2.3 times the wavelength, so it is accurate enough to analyze the seabed response according to the conclusion proposed by Ye and Jeng [27].
Mesh sensitivity tests are performed for the model meshes of the seabed. As shown in Figure 3, the pore pressure at PPT1 is adopted as a probe with seven sets of the meshes. It can be seen that the element amount grows rapidly as the FEM mesh subdivides, while the calculated value keeps a constant when the refinement reaches the mesh size 5–45 cm. Considering both an acceptable computational accuracy and the computer capacity, the seabed sub-model is discretized into 529900 Lagrange elements with the mesh size of 3.4–34 cm.

3.1.2. Comparison Between Numerical and Experimental Results

The numerical and experimental results are compared, including the wave height with two locations and the pore pressure with two depths. Figure 4 shows the time series of free surface elevation from the measured data and the simulated model, recorded 30 cm before and 40 cm behind the center of the mat by wave gauges II and III. The comparison result shows an overall agreement with an acceptable difference. Figure 5 shows the comparison of the simulated and the measured excess pore pressure with respect to time by two transducers with diverse depth. As in the experiment, it is hard to measure the degree of saturation, which has a significant influence on the vertical distribution of pore pressure. The two different depths are considered to confirm the degree of saturation, which is set as 0.95 in this model. A good agreement can be seen in these two comparisons in Figure 4, which means the setting of the degree of saturation is reliable simultaneously.

3.2. Effect of Mat Foundation

3.2.1. Wave Motion

The existence of the mat foundation may impose an influence on the transmission of water waves. Figure 6. shows two comparisons of the wave profiles between the tests with and without a mat. From Figure 6, the wave profile is observed as linear in both two tests. The existence of the structure makes the wave profile a little lower. The height of the mat foundation is too low to reduce the wave profile when the water depth is much higher. Thus, the elimination effect of waves by the mat foundation can be ignored.

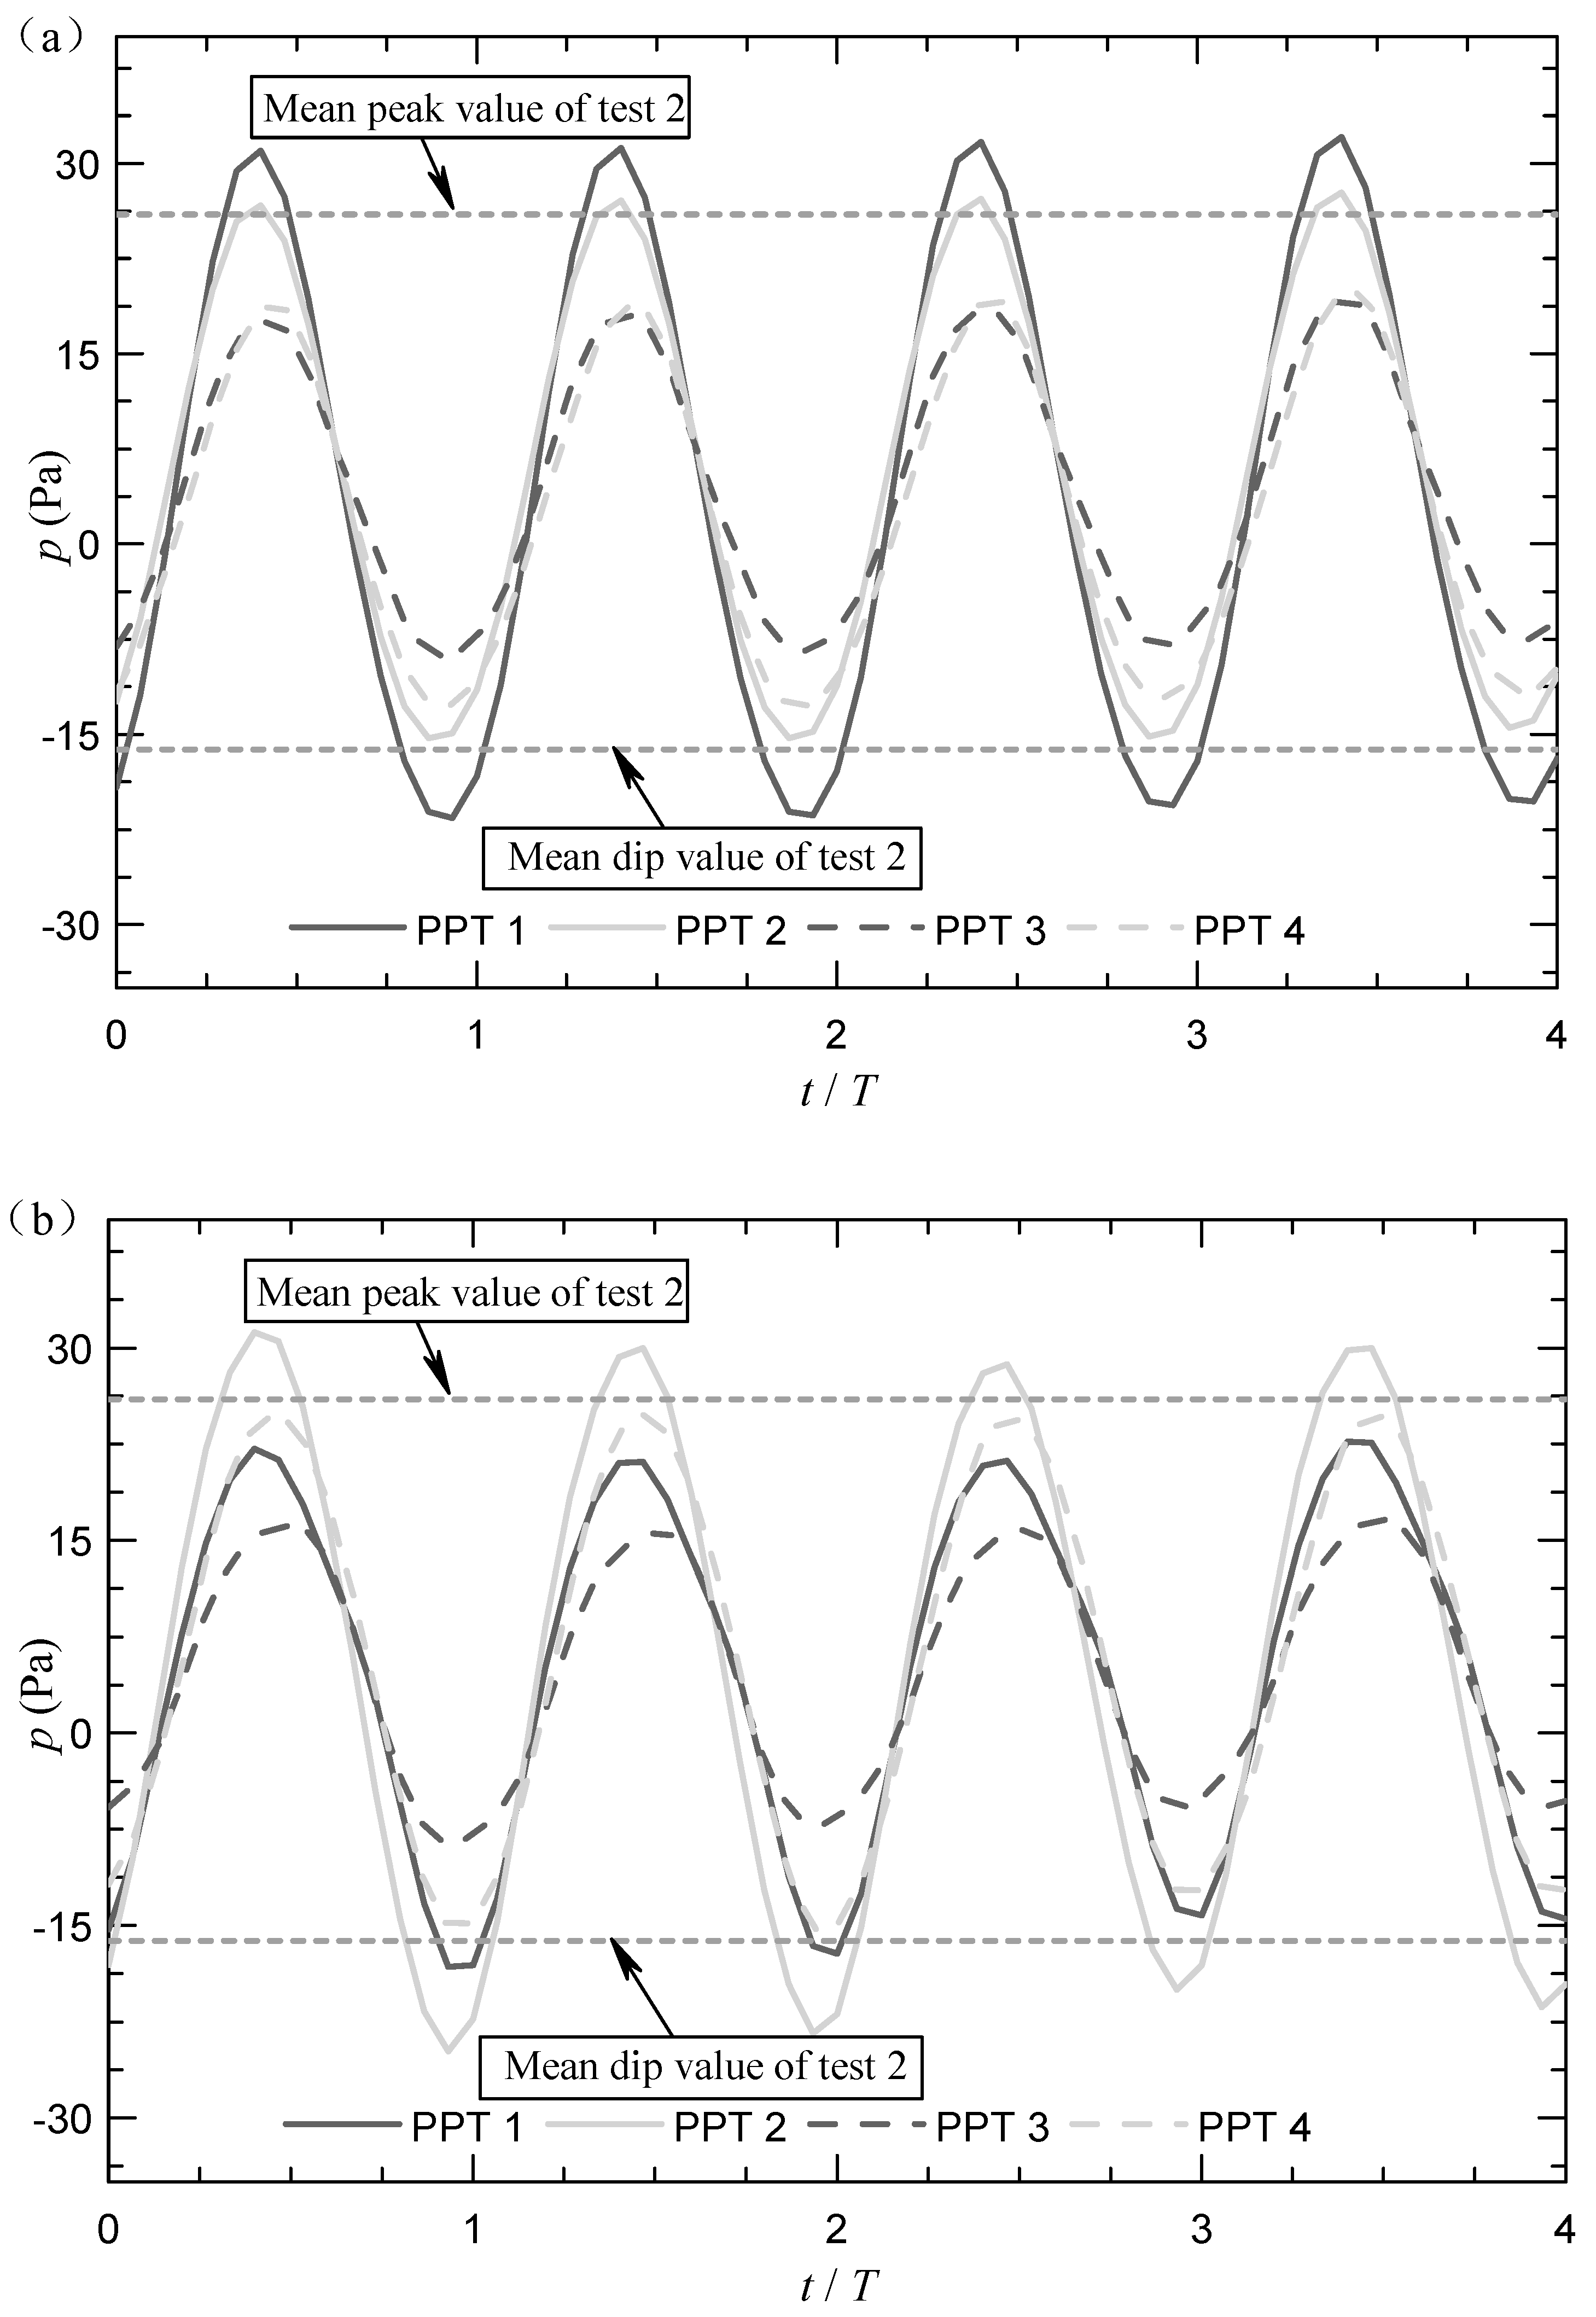
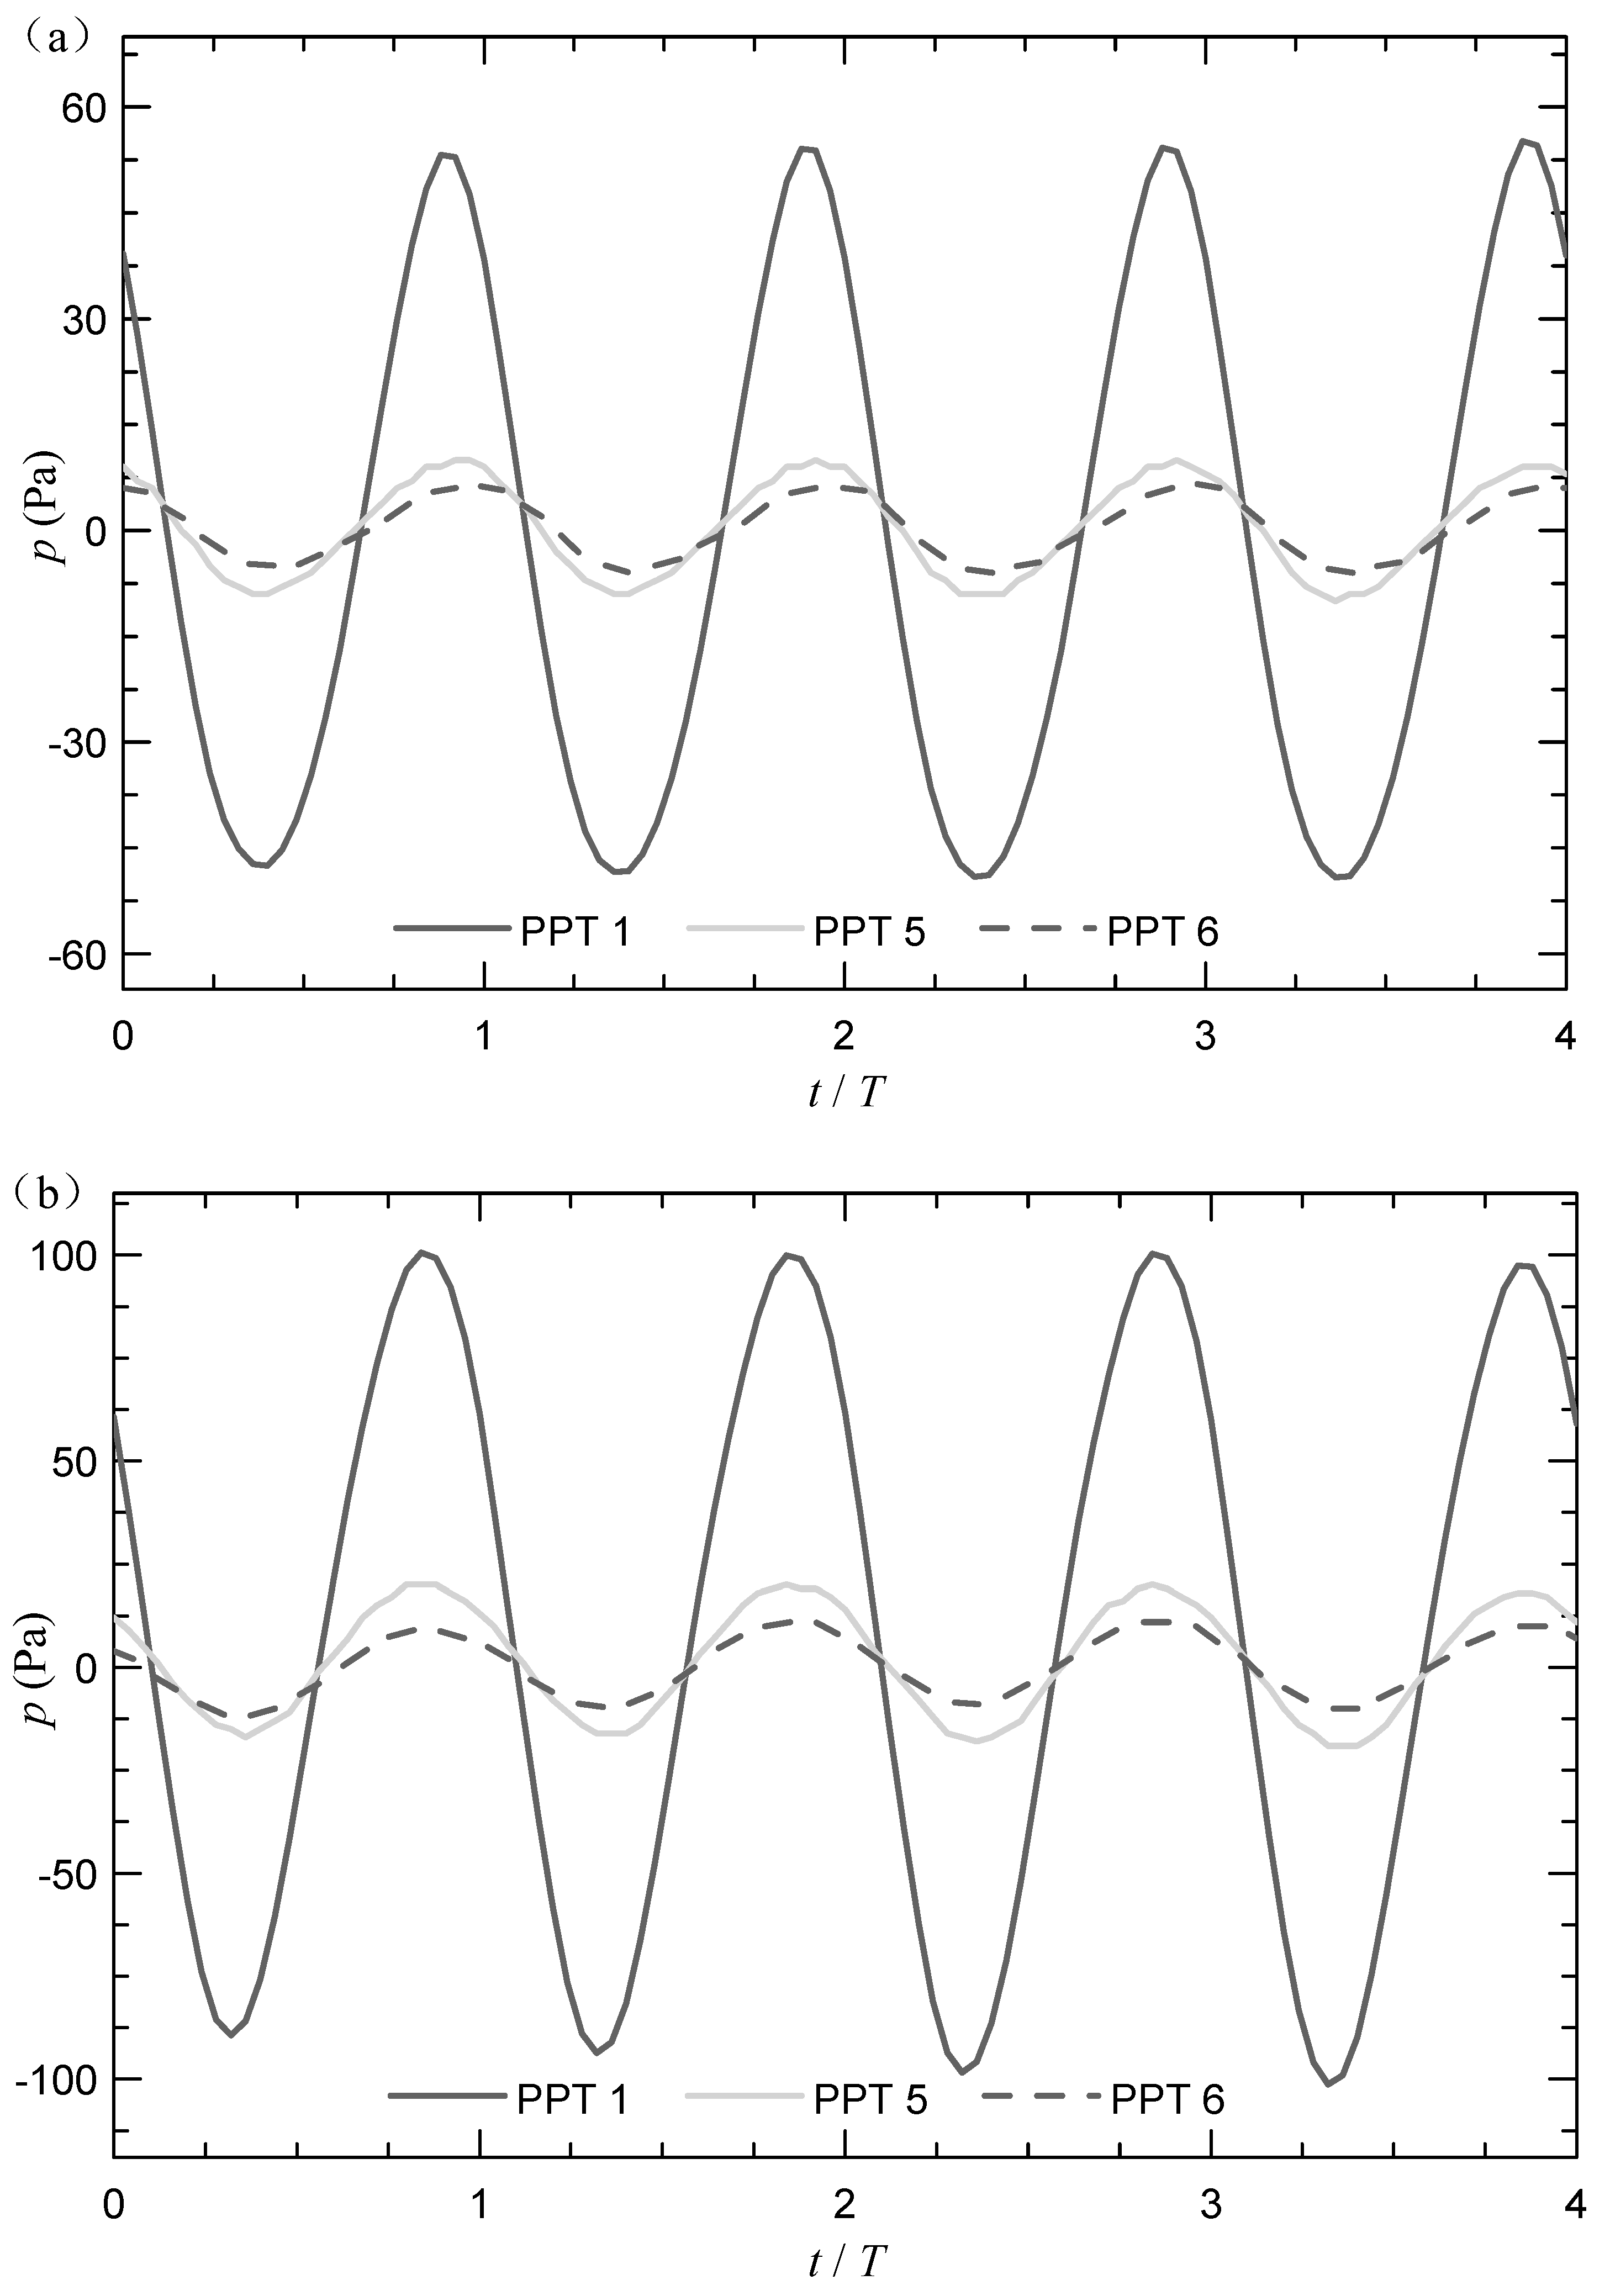
3.2.2. Wave-Induced Pore Pressure

The effect on pore pressure caused by the foundation with respect to time is illustrated in Figure 7, which consist of two kinds of structure position (test 5 and test 8). It can be seen that the value of pore pressure is oscillating around a constant value, which means there is no distinct build-up of the residual pore pressure in this kind of sandy seabed. Similar response trends of the sandy seabed with d 50 = 0.287   mm (close to the sand in this experiment) can be observed from previous flume studies by Zhou et al. [28].
In Figure 7 two horizontal dotted lines of the pore pressure are derived from test 2 (without mat foundation) to provide a reference value of the mean maximum and minimum values, which is simplified from four similar curves of pore pressure in test 2. The specific location of PPT1–PPT4 can be observed from Figure 2. From these two figures, it can be noticed that the pore pressure of four PPTs is greatly changed by the existence of mat foundation. In Figure 7a, the value of the center point in front of the structure becomes larger, which is followed closely by the point next to the front of the structure. Conversely, there is a considerable decline in the two locations under the mat, i.e., PPT3 and PPT4, because the presence of mat reduces the wave actions on the seabed. A similar phenomenon can be observed from the previous laboratory results of Jeng et al. [29]. Moreover, in Figure 7b, it can be found that the amplitude of the pore pressure in the region on the side of the mat becomes higher when the long side of the mat is parallel to the wave direction. There is a decrease of the pore pressure amplitude in the areas under the mat, including PPT1 and PPT3. In general, when the mat foundation exists, the pore pressure amplitude increases in the area around the mat, especially the front of the mat, but decreases in the area under the mat.

3.3. Plane Distribution of the Pore Pressure

Figure 8 presents the excess pore pressure of five PPTs (PPT1, PPT3, and PPT7–PPT9) with various distances to the central point O under the mat foundation in all ten tests. Three black horizontal lines represent the values of the excess pore pressure in the tests without structure, which represents the soil response under only waves. These three lines can be served as a reference for other test conditions. The horizontal axis in this figure adopts the dimensionless parameter ( x / W m ), where x is the distance from the measured points to the center of the mat (point O in Figure 2), and W m is the width of the model mat foundation.
From Figure 7, it can be concluded that the locations before the structure (PPT1 and PPT2) are more likely to have a higher pore pressure amplitude regardless of the orientation of the mat foundation. A similar conclusion can be drawn from Figure 8, that the value of excess pore pressure amplitude of the locations before structure ( 0 x W m   ) is significantly larger than the areas under the structure. In most of tests 4–9, the value of pressure reaches its peak at x = 0.56   W m and drops to the valley value below the center of the mat foundation. The maximum of the excess pore pressure is near twice the minimum value in all the tests. Therefore, it is significant to monitor the pore pressure in the area where the maximum pore pressure appears. Additionally, when the wave period becomes larger, the pore pressure in front of the mat foundation decreased, and the pore pressure behind the foundation increased.
Test 10 is run by adding 0.22 m/s current based on test 9. Comparing test 9 and test 10, the amplitude of the excess pore pressure before the center point (point O) of the mat foundation becomes large, nearly twice the value in the corresponding case (test 9), while it has almost no effect on the value behind the structure. However, because of the existence of the current, the excess pore pressure behind the structure is significantly reduced compared to the pressure under the structure. This is because the current is blocked by mat foundation. Moreover, the mat foundation has almost no influence on the excess pore pressure when reaching a distance of 35 cm in front of the mat without current, while the influence region is much more abundant in the test with the current (test 10). These results indicate that the liquefaction or partial liquefaction is more likely to occur in front of the mat under combined waves and following-current loading.

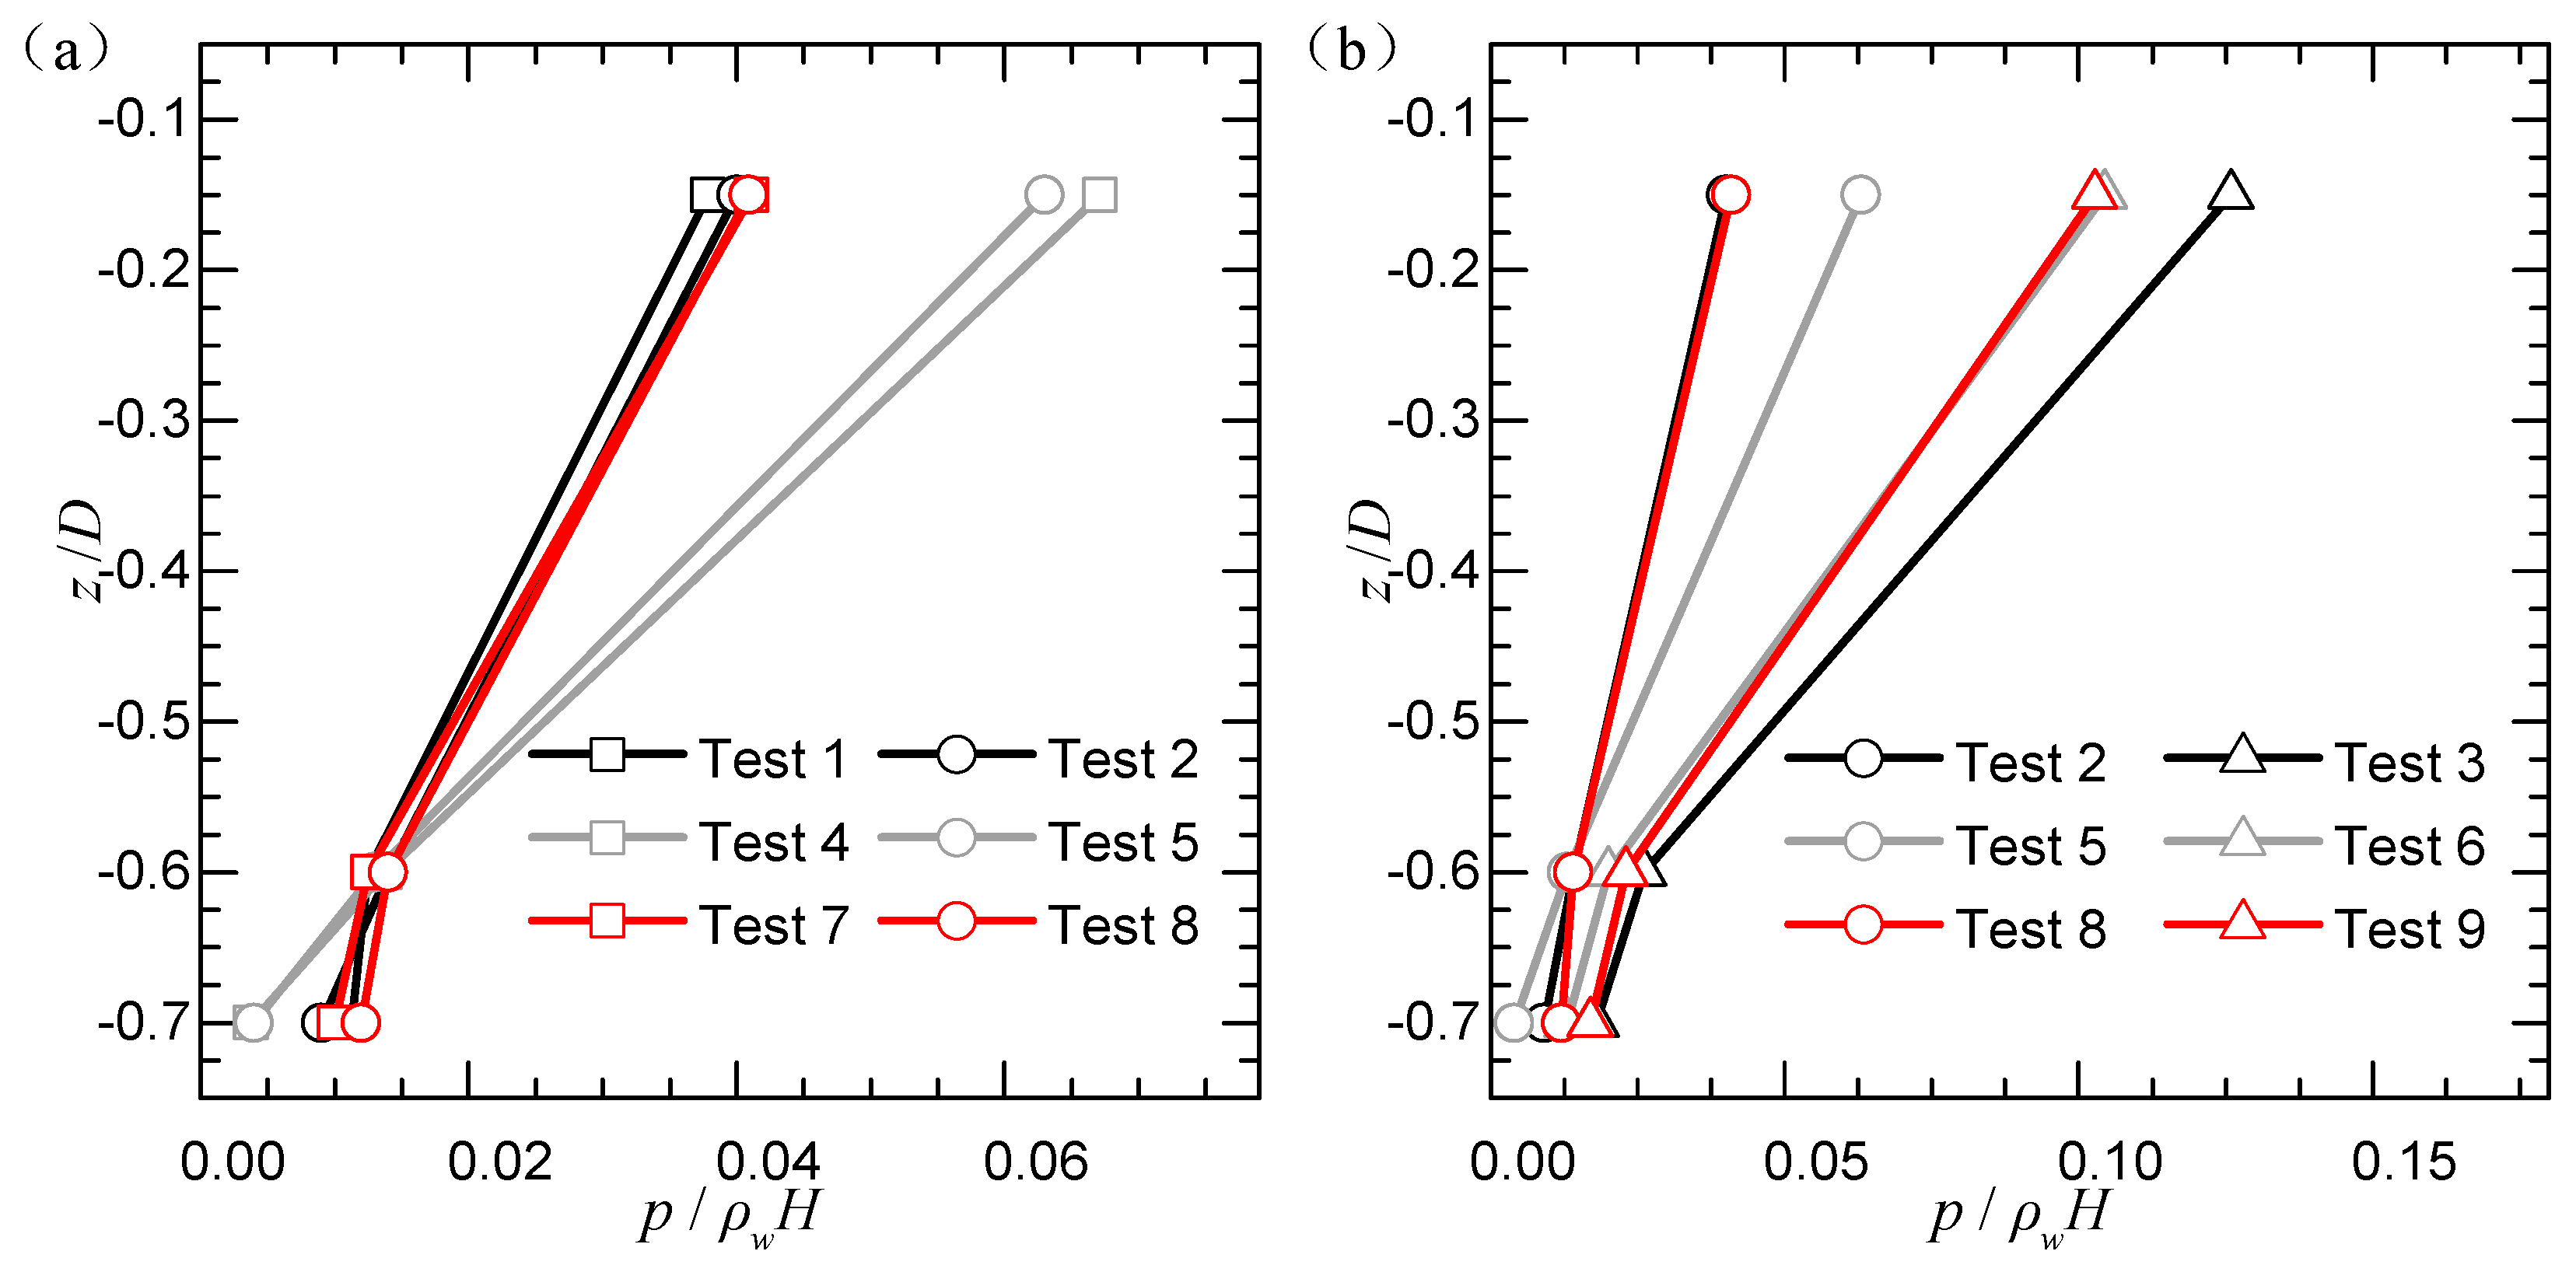
3.4. Vertical Distribution of the Pore Pressure

Figure 9, which includes tests 1–9 under the wave only, gives the vertical distribution of the excess pore pressure amplitude at the same measuring section II with the depth of −15 cm, −60 cm, −70 cm measured by PPT1, PPT3, and PPT6. The dimensionless coordinate is adopted in this figure. The aggregate value ( z / D ) of the depth of the measured points ( z ) and the thickness of the seabed ( D ) are employed on the dimensionless horizontal axis. On the vertical axis, there are values of complex ( p / ρ w H ), where ρ w H is the water pressure due to wave height. In Figure 9, three factors are explored, including (1) wave height (2) wave period and (3) placement of the mat foundation.
The influence of the wave height on the excess pore pressure amplitude can be discovered from Figure 9a. At shallow depth, the variation pore pressure is consistent with constant wave height and decreases with the increase of depth. Besides, the pore pressure amplitude is significantly higher when the mat foundation is located at position A. In Figure 9b, it can be concluded that the pore pressure amplitude increases obviously as the wave period increases. When the wave period becomes higher, the position of the mat foundation becomes irrelevant to the wave-induced pore pressure amplitude. Besides, the maximum pore pressure amplitude was found in the test without the mat foundation.
Figure 10a,b give time series of the excess pore pressure under two different wave conditions, i.e., wave only and a combination of wave and current respectively. It shows that there is no residual pore pressure inside the seabed. The wave-induced pore pressure at three depths presents a sinusoidal variation with the same phase, while there is a numerical attenuation phenomenon of the pore pressure as the depth increases. An evident phase lag can be observed among the pore pressure measured at three different soil depths. A similar phenomenon was observed in the experimental results by Liu et al. [14].
From the comparison between the two figures in Figure 10, it can be discovered that the presence of current makes the phase lag of pore pressure smaller on the fine sand seabed and increases the pore pressure amplitude by nearly 80%, but has little effect on the extent to which the pore pressure amplitude decreased with depth.

3.5. Numerical Results of the Spatial Distribution of Pore Pressure

To intuitively understand the distribution of the excess pore pressure in the vicinity of the mat foundation, the contour, as shown in Figure 11 is obtained from the numerical model mentioned in Section 3.1. The saturation of soil is set as 0.95, and other input parameters are described above. Figure 11 depicts the spatial distribution of wave-induced pore pressure of four moments including: (a)   t / T = 0.13 (b)   t / T = 0.38 , (c)   t / T = 0.63 (d)   t / T = 0.98 . The first figure shows the time that the position of 0.56   W m in front of the mat foundation (PPT1) reaches the maximum negative value, and the next three timing points are all a quarter period apart.
From Figure 11, it can be found that wave action has a minimal effect on soil depth due to the influence of soil saturation. After the depth exceeds 0.56   W m , the variation of excess pore pressure becomes much smaller. Due to the weakening effect of the mat foundation on the wave, the variation range and amplitude of excess pore pressure under the mat are smaller than before, which is consistent with the pore pressure distribution observed in the experiment result.

4. Conclusions

Mat foundations are applied more frequently in the field of ocean engineering, especially in shallow waters. This study presents several sets of experimental results on the wave-induced excess pore pressure of porous seabed in the vicinity of a mat foundation. The experimental results were employed to explore the plane and vertical distribution of the excess pore pressure in the sandy seabed around a mat foundation, where liquefaction is likely to occur under wave action. Based on the experimental results, the following conclusions are drawn:
(1)
The good agreement between the experimental and the numerical results shows that the strong reliability of the experimental test. Moreover, the degree of saturation of soil is considered as 0.95 with the numerical simulation;
(2)
The comparison between the test with and without the mat foundation indicates that the wave motion was seldom affected by the mat foundation since the height of the mat is much lower than the water depth. The variation of the pore pressure in both tests suggests that the amplitude of excess pore pressure is affected by the existence of the mat foundation;
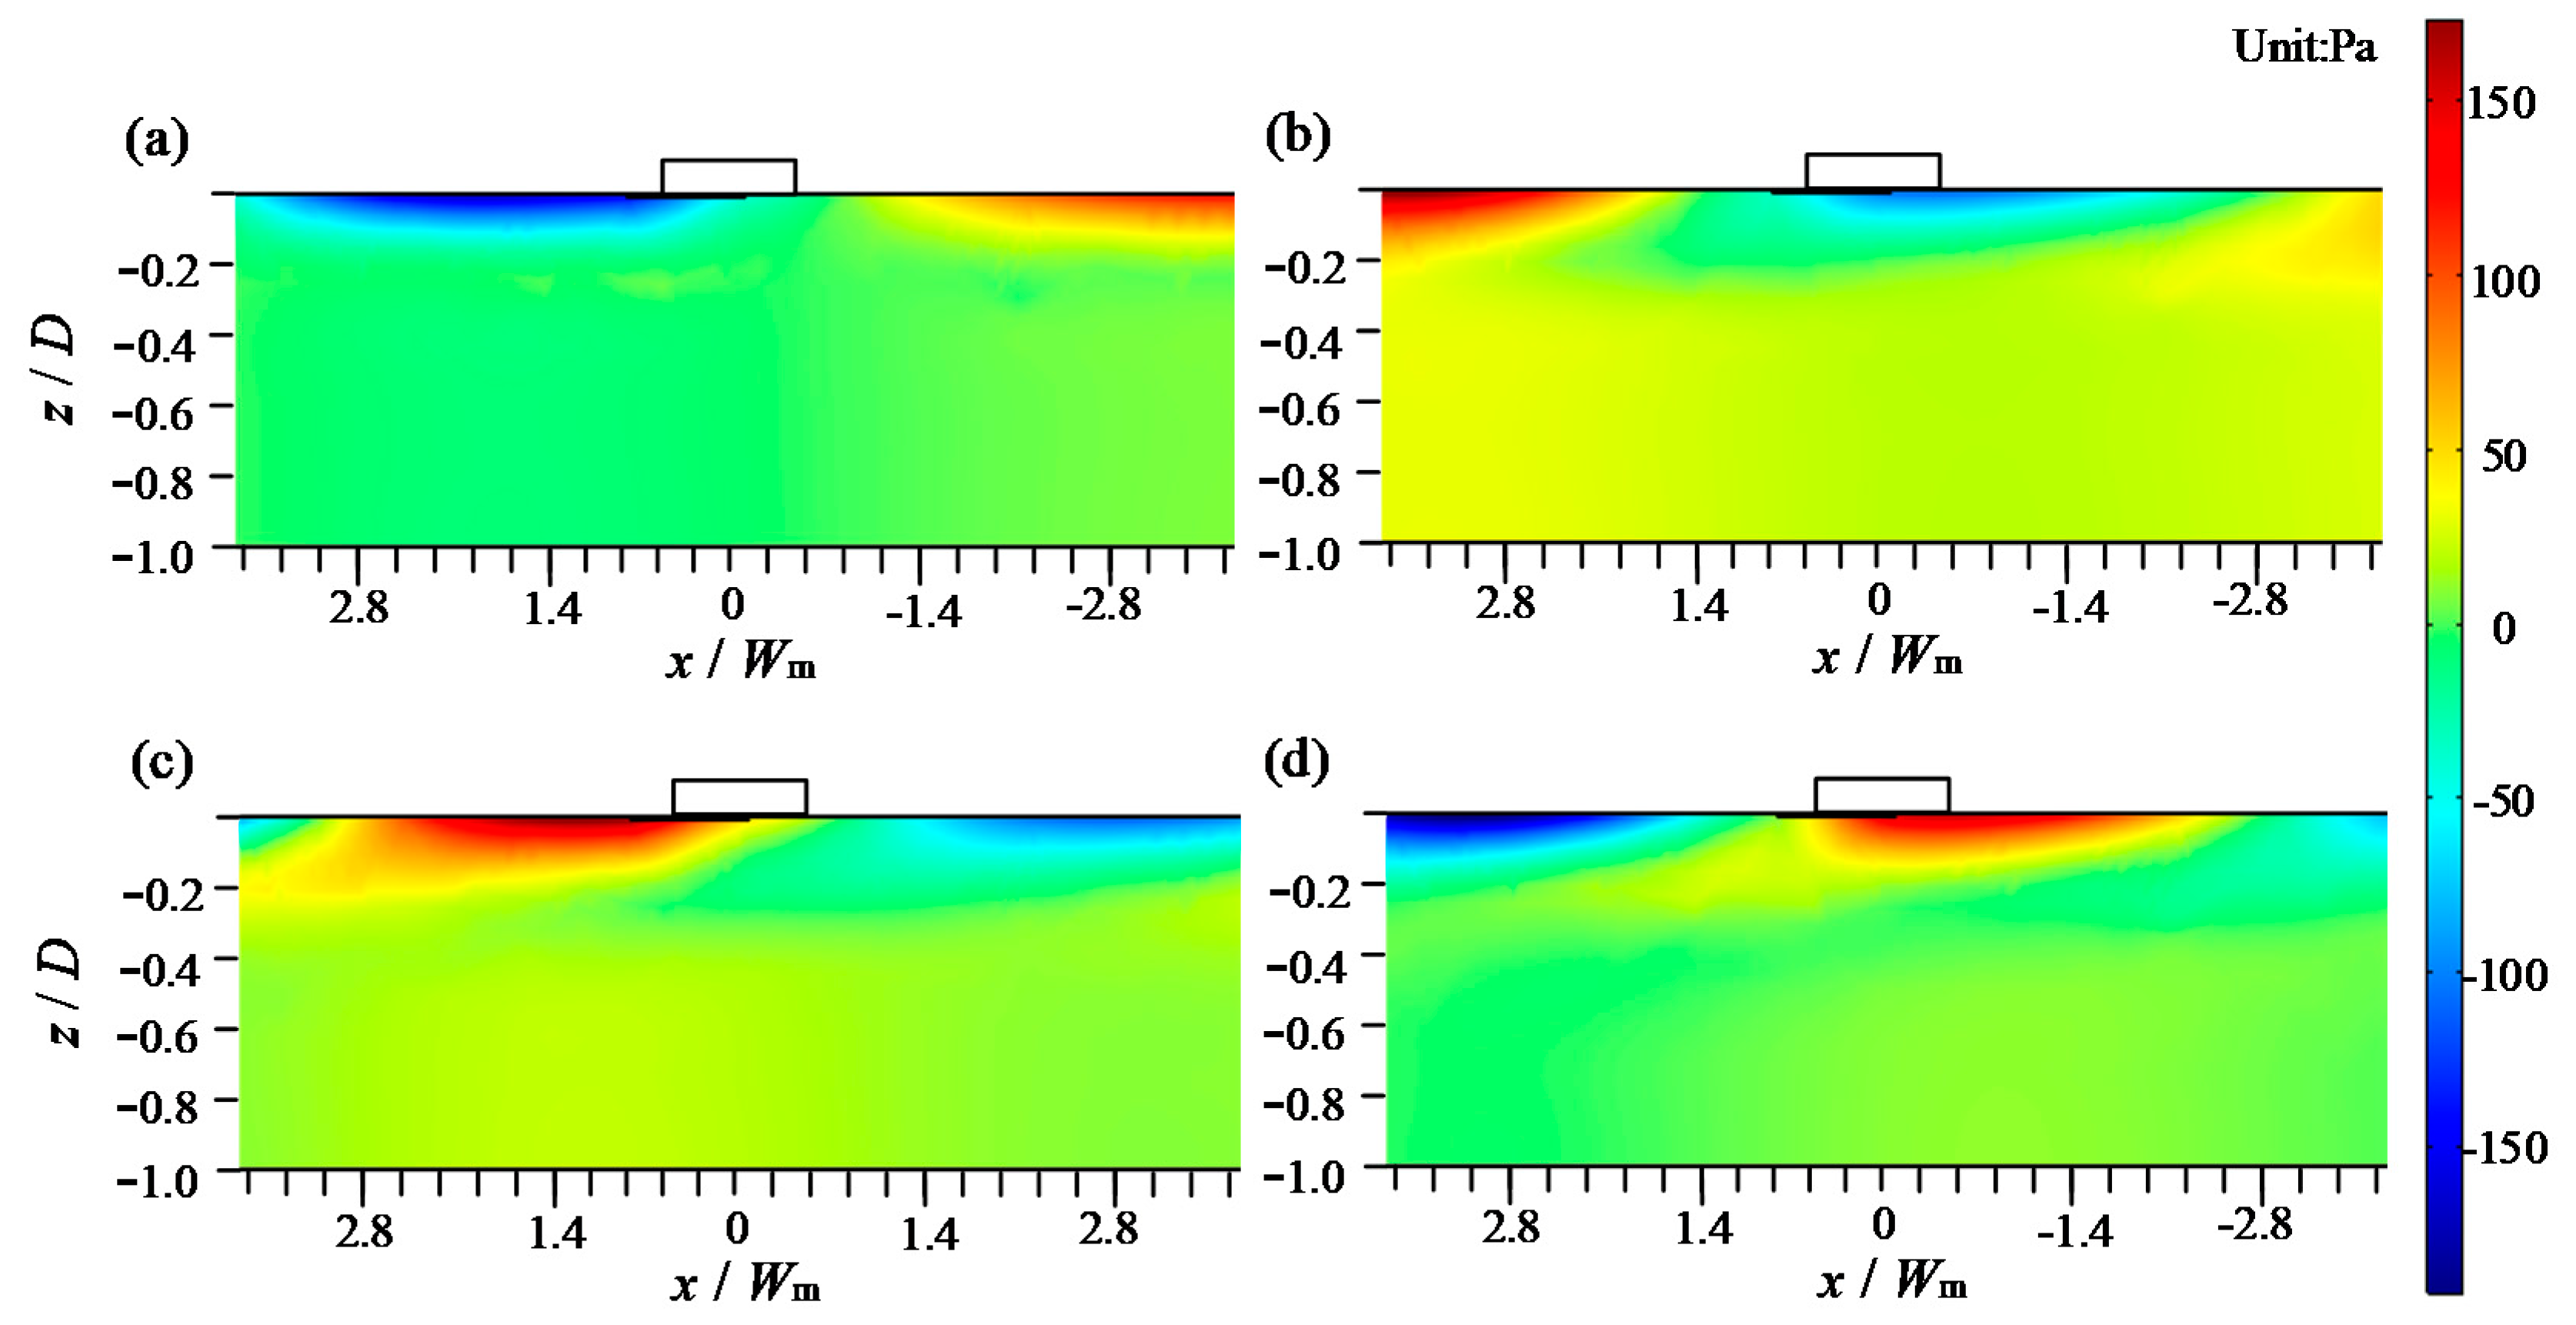
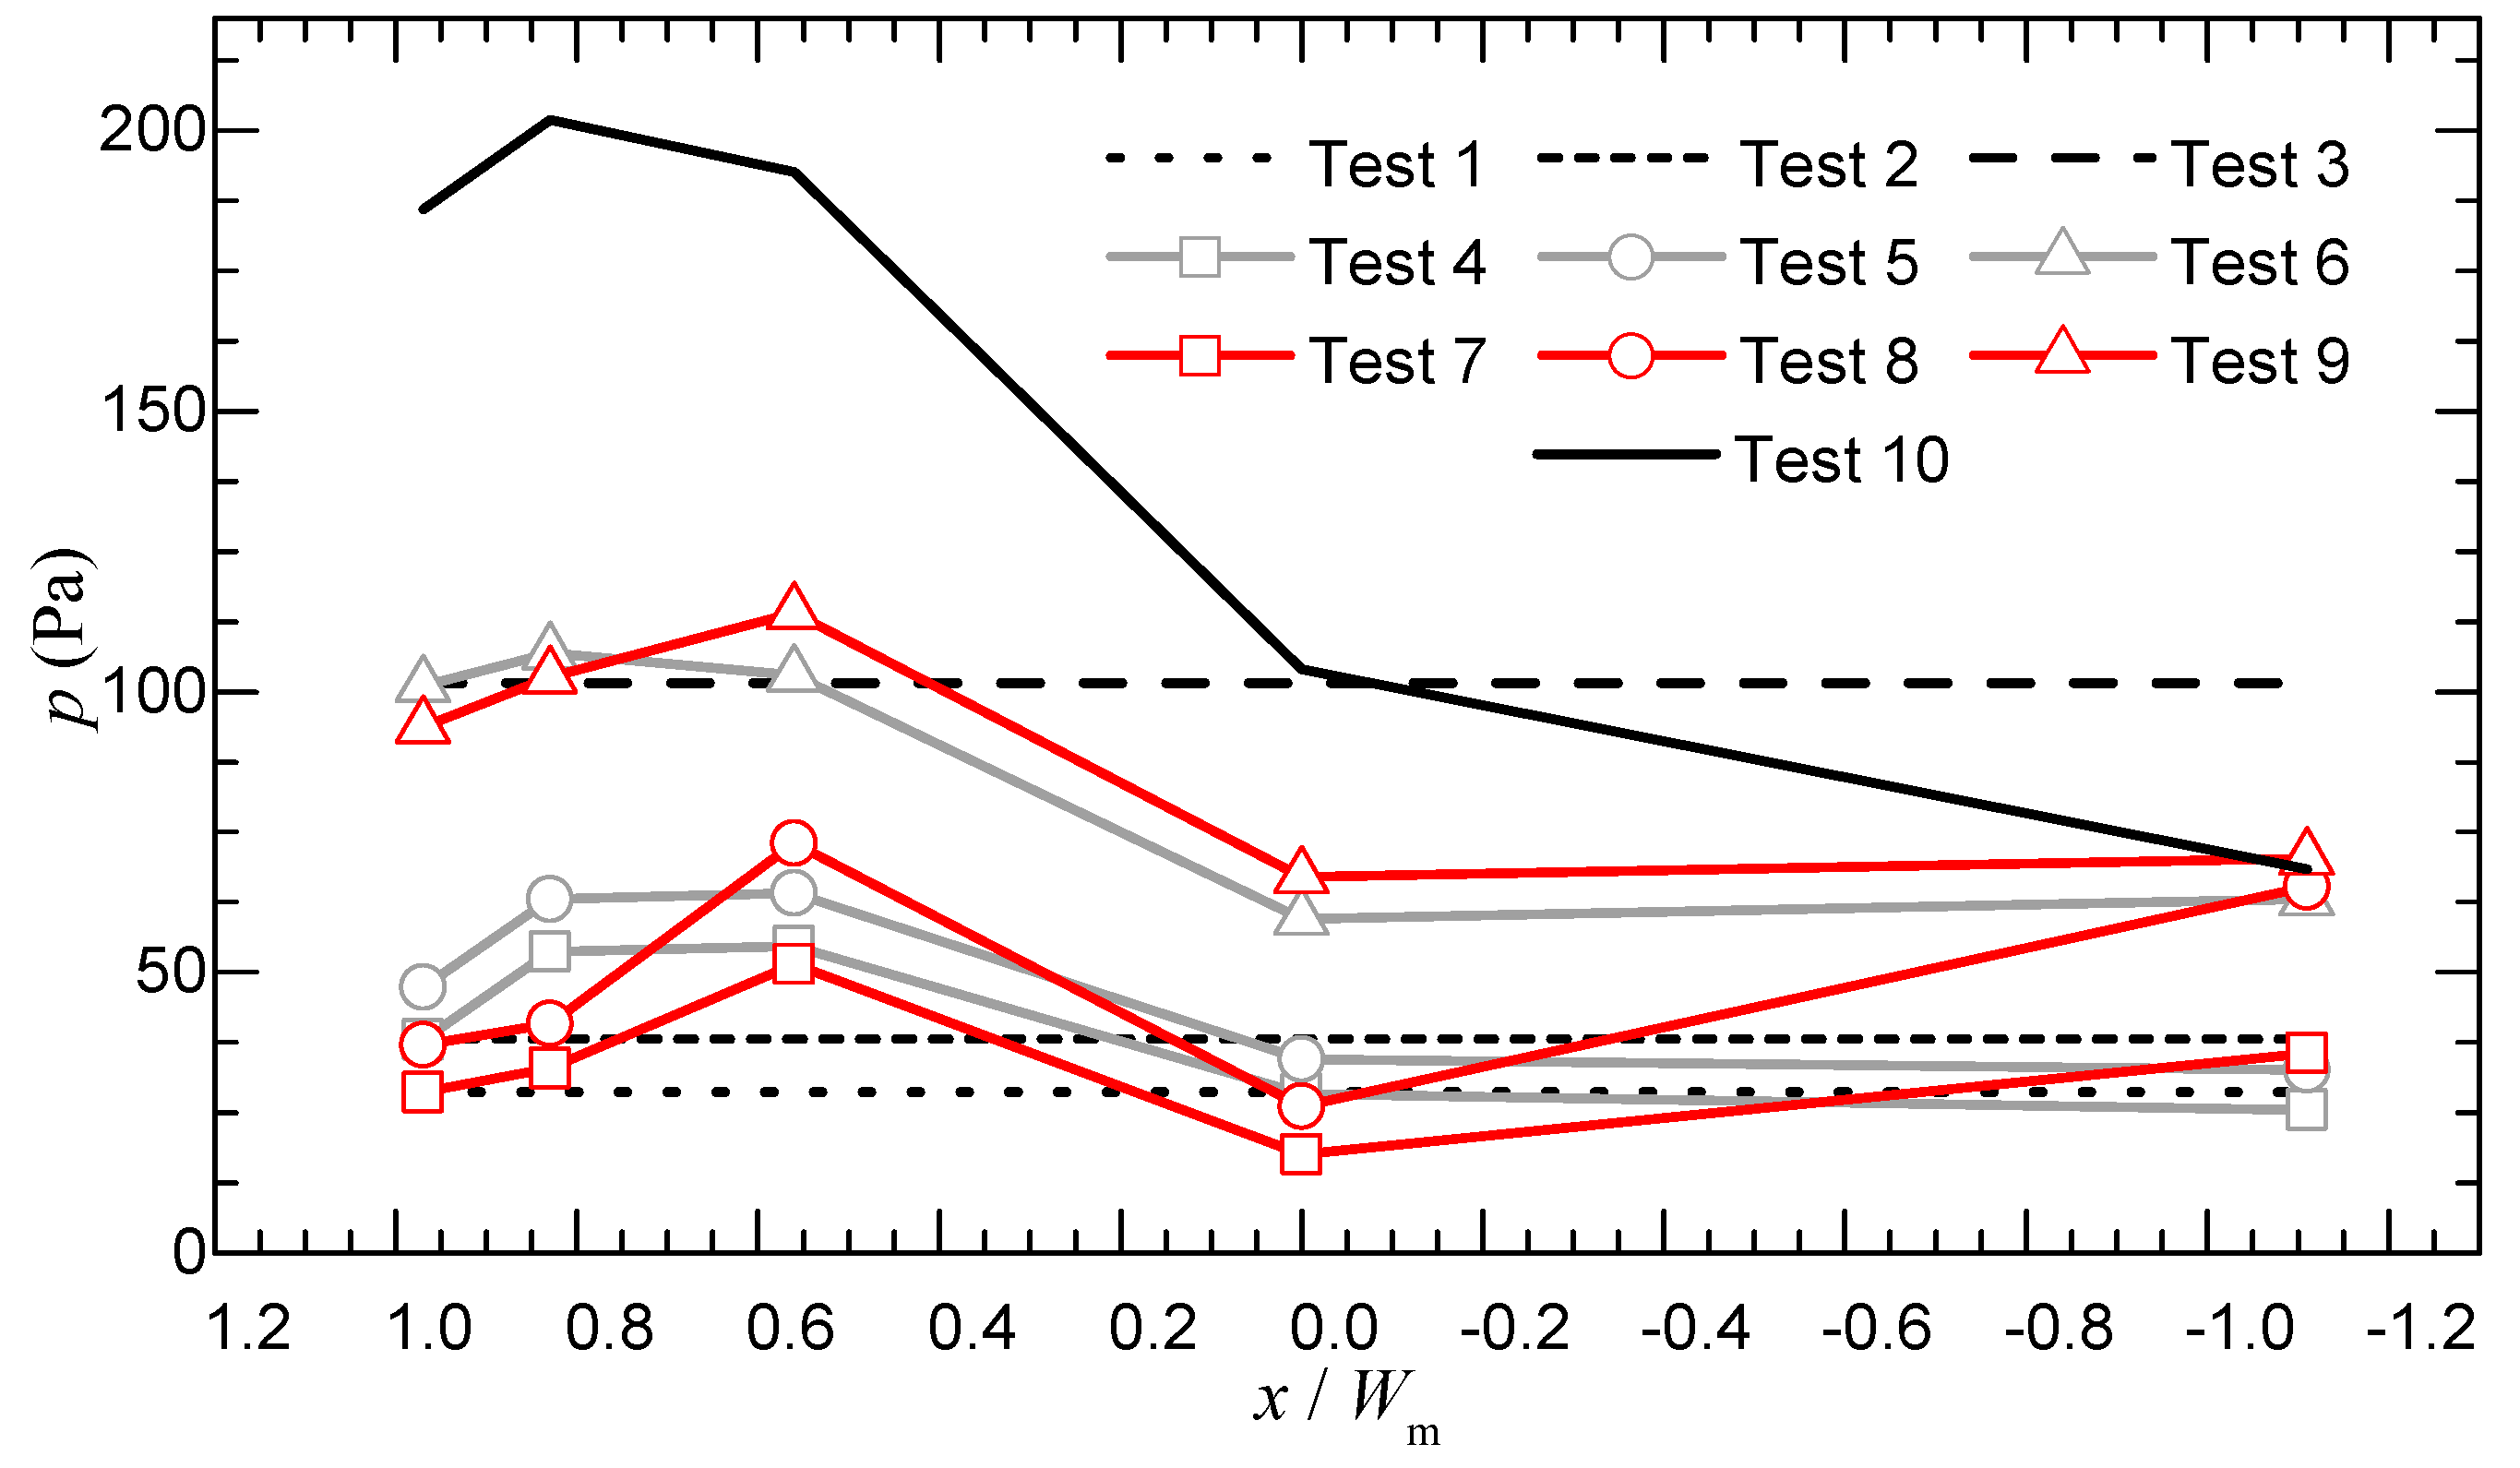
(3)
The affected region with increased pore pressure reaches a length of W m before the mat. The largest pore pressure occurs at x = 0.56   W m before the mat, which is near twice the minimum value (at the center under the mat) in most tests;
(4)
Along with the seabed depth, there is a decreasing trend of excess pore pressure and a phase lag without residual pore pressure. The experimental and numerical results show that a significantly affected seabed region due to waves is within 0.56   W m depth under the mat foundation;
(5)
The distribution of the pore pressure around the mat foundation varies with wave heights and wave periods, and the wave period has a stronger influence. The change of mat foundation orientation will alter the pore pressure amplitude under and around the mat; The existence of current expands the range of the affected region with higher pore pressure, and increases the maximum value by about 80%.

Author Contributions

Methodology, C.L.; validation, Q.Y.; formal analysis, Q.Y.; writing-original draft preparation, Q.Y.; supervision, X.Z.

Funding

This research was funded by National Natural Science Foundation of China, grant number 41602282.

Acknowledgments

The authors are grateful for the financial support from the National Natural Science Foundation of China (Grant No. 41602282).

Conflicts of Interest

The authors declare no conflict of interest.

References

  1. Zhao, H.; Jeng, D. 2D Model for Wave-Induced Pore Pressure Accumulation Around a Rubble Mound Breakwater over Sloping Seabed. In The Eleventh ISOPE Pacific/Asia Offshore Mechanics Symposium; ISOPE: Mountain View, CA, USA, 2014. [Google Scholar]
  2. Zhang, J.S.; Jeng, D.S.; Liu, P.L.F. Numerical study for waves propagating over a porous seabed around a submerged permeable breakwater: PORO-WSSI II model. Ocean Eng. 2011, 38, 954–966. [Google Scholar] [CrossRef]
  3. Liao, C.; Tong, D.; Chen, L. Pore Pressure Distribution and Momentary Liquefaction in Vicinity of Impermeable Slope-Type Breakwater Head. Appl. Ocean Res. 2019, 78, 290–306. [Google Scholar] [CrossRef]
  4. Lu, P.; Maclaren, D. Geotechnical challenge of offshore mudmat foundation stability: Combining analytical and finite element investigation of bearing capacity of sand overlying soft clay. Geomech. Energy Environ. 2016, 6, 58–69. [Google Scholar] [CrossRef]
  5. Semenov, K.K.; Lebedev, V.V.; Nudner, I.S.; Geidarov, N.A.; Ivanov, K.S. Impact of waves and currents on the soil near gravity-Type offshore platform foundation: Numerical and experimental studies. In Proceedings of the Twenty-Fifth International Ocean and Polar Engineering Conference, Kona, HI, USA, 21–26 June 2015. [Google Scholar]
  6. Li, Y.; Ong, M.C.; Tang, T. Numerical analysis of wave-Induced poro-Elastic seabed response around a hexagonal gravity-Based offshore foundation. Coast. Eng. 2018, 136, 81–95. [Google Scholar] [CrossRef]
  7. Tsai, C.P. Wave-Induced liquefaction potential in a porous seabed in front of a breakwater. Ocean Eng. 1995, 22, 1–18. [Google Scholar] [CrossRef]
  8. Higuera, P.; Lara, J.L.; Losada, I.J. Three-Dimensional interaction of waves and porous coastal structures using OpenFOAM®. Part I: Formulation and validation. Coast. Eng. 2014, 83, 243–258. [Google Scholar] [CrossRef]
  9. Jeng, D.S. Wave-Induced sea floor dynamics. Appl. Mech. Rev. 2003, 56, 407. [Google Scholar] [CrossRef]
  10. Zhang, J.S.; Zhang, Y.; Jeng, D.S.; Liu, P.L.F.; Zhang, C. Numerical simulation of wave–Current interaction using a RANS solver. Ocean Eng. 2014, 75, 157–164. [Google Scholar] [CrossRef]
  11. Biot, M.A. General Theory of Three-Dimensional Consolidation. J. Appl. Phys. 1941, 2, 155–164. [Google Scholar] [CrossRef]
  12. Mizutani, N.; Mostafa, A.M.; Iwata, K. Nonlinear regular wave, submerged breakwater and seabed dynamic interaction. Coast. Eng. 1998, 33, 177–202. [Google Scholar] [CrossRef]
  13. Jeng, D.S.; Ye, J.H.; Zhang, J.S.; Liu, P.L.F. An integrated model for the wave-induced seabed response around marine structures: Model verifications and applications. Coast. Eng. 2013, 72, 1–19. [Google Scholar] [CrossRef]
  14. Liu, B.; Jeng, D.S.; Ye, G.L.; Yang, B. Laboratory study for pore pressures in sandy deposit under wave loading. Ocean Eng. 2015, 106, 207–219. [Google Scholar] [CrossRef]
  15. Losada, M.A.; Losada, I.J.; Patterson, M.D. Harmonic generation past a submerged porous step. Coast. Eng. 1997, 31, 281–304. [Google Scholar] [CrossRef]
  16. Bierawski, L.G.; Maeno, S. An experimental study on the interaction between the reef breakwater the sandy bed and the wave field. In Proceedings of the 30TH IAHR Congress, Thessaloniki, Greece, 24–29 August 2003; pp. 377–384. [Google Scholar]
  17. Mizutani, N.; Mostafa, A.M. Nonlinear wave-induced seabed instability around coastal structures. Coast. Eng. J. 1998, 40, 131–160. [Google Scholar] [CrossRef]
  18. Qi, W.; Li, C.; Jeng, D.; Gao, F.; Liang, Z. Combined wave-Current induced excess pore-Pressure in a sandy seabed: Flume observations and comparisons with theoretical models. Coast. Eng. 2019, 147, 89–98. [Google Scholar] [CrossRef]
  19. Arena, F.; Filianoti, P. Small-Scale Field Experiment on a Submerged Breakwater for Absorbing Wave Energy. J. Waterw. Port Coast. Ocean Eng. 2007, 133, 161–167. [Google Scholar] [CrossRef]
  20. Czitrom, S.P.R.; Godoy, R.; Prado, E.; Olvera, A.; Stern, C. Hydrodynamics of an oscillating water column seawater pump. Part II: Tuning to monochromatic waves. Ocean Eng. 2000, 27, 1199–1219. [Google Scholar] [CrossRef]
  21. Ryu, D.; Lee, C.; Choi, K.; Koo, B.; Song, J.; Kim, M.; Lee, J. Lab-Scale impact test to investigate the pipe-Soil interaction and comparative study to evaluate structural responses. Int. J. Nav. Arch. Ocean 2015, 7, 720–738. [Google Scholar] [CrossRef]
  22. Boccotti, P.; Barbaro, G.; Mannino, L. A field experiment on the mechanics of irregular gravity waves. J. Fluid Mech. 1993, 252, 173–186. [Google Scholar] [CrossRef]
  23. Liao, C.; Tong, D.; Jeng, D.; Zhao, H. Numerical study for wave-Induced oscillatory pore pressures and liquefaction around impermeable slope breakwater heads. Ocean Eng. 2018, 157, 364–375. [Google Scholar] [CrossRef]
  24. Liao, C.; Chen, J.; Zhang, Y. Accumulation of pore water pressure in a homogeneous sandy seabed around a rocking mono-Pile subjected to wave loads. Ocean Eng. 2019, 173, 810–822. [Google Scholar] [CrossRef]
  25. Tong, D.; Liao, C.; Chen, J.; Zhang, Q. Numerical Simulation of a Sandy Seabed Response to Water Surface Waves Propagating on Current. J. Mar. Sci. Eng. 2018, 6, 88. [Google Scholar] [CrossRef]
  26. Hirt, C.W.; Nichols, B.D. Volume of fluid (VOF) method for the dynamics of free boundaries. J. Comput. Phys. 1981, 39, 201–225. [Google Scholar] [CrossRef]
  27. Ye, J.H.; Jeng, D.S. Response of Porous Seabed to Nature Loadings: Waves and Currents. J. Eng. Mech. 2012, 138, 601–613. [Google Scholar] [CrossRef]
  28. Zhou, C.; Li, G.; Dong, P.; Shi, J.; Xu, J. An experimental study of seabed responses around a marine pipeline under wave and current conditions. Ocean Eng. 2011, 38, 226–234. [Google Scholar] [CrossRef]
  29. Jeng, D.S.; Schacht, C.; Lemckert, C. Experimental study on ocean waves propagating over a submerged breakwater in front of a vertical seawall. Ocean Eng. 2005, 32, 2231–2240. [Google Scholar] [CrossRef]
Figure 1. The configuration of the mat foundation, (a) real mat foundation and (b) model mat foundation.
Jmse 07 00304 g001
Figure 2. Sketch of experimental set-up: (a) An overview, (b) dimension of the pillars and (c) set-up of the transducers around mat foundation (unit: cm).
Jmse 07 00304 g002
Figure 3. FEM mesh convergence test.
Jmse 07 00304 g003
Figure 4. Comparison of the simulated and measured surface elevation recorded in test 5, (a) Wave gauge II and (b) Wave gauge III.
Jmse 07 00304 g004
Figure 5. Comparison of the simulated and measured excess pore pressure recorded in test 5, (a) PPT1 and (b) PPT5.
Jmse 07 00304 g005
Figure 6. Comparations of wave profiles in section II and section III in test 2 (Waves: H = 10   cm ,   T = 1.5   s ; no mat foundation; no current) and test 5 (Waves: H = 10   cm ,   T = 1.5   s ; mat foundation: position A; no current).
Jmse 07 00304 g006
Figure 7. Effect on the distribution of excess pore pressure caused by mat foundation in (a) test 5 (Waves: H = 10   cm , T = 1.5   s ; Mat foundation: position A; No current) and (b) test 8 (Waves: H = 10   cm ,   T = 1.5   s ; Mat foundation: position B; No current).
Jmse 07 00304 g007
Figure 8. Plane distribution of the oscillatory amplitude of the excess pore pressure amplitude along the flume length.
Jmse 07 00304 g008
Figure 9. Effect of (a) wave height and (b) wave period on the vertical distributions of the excess pore pressure amplitude along with the soil depth.
Jmse 07 00304 g009
Figure 10. Time series of excess pore pressure measured with PPT1, PPT5 and PPT6 in (a) test 9 (Waves: H = 10   cm , T = 2.5   s ; Mat foundation: position B; No current) and (b) test 10 (Waves: H = 10   cm , T = 2.5   s ; Mat foundation: position B; Current: v c = 0.22   m / s ).
Jmse 07 00304 g010
Figure 11. Contours of pore pressure in the vicinity of mat foundation from the numerical model of test 5 at different times: (a)   t / T = 0.13 , (b)   t / T = 0.38 , (c)   t / T = 0.63 , (d)   t / T = 0.98 .
Jmse 07 00304 g011
Table 1. Soil properties for experiments and numerical models.
Soil parameterNotationMagnitudeUnit
Permeabilityks2.382 × 10−5m/s
Mean size of sand grainsd500.215mm
Soil porosityns0.448-
Poisson’s Ratioν0.333-
Relative densityDr0.321-
Unit weight of soilρ26.79kN/m3
Shear ModulusG8.92 × 106N/m2
Table 2. The corresponding parameters of actual condition and experiment.
ModuleParametersReal ValueProportional ScaleExperimental Value
Mat foundationLength
L m (m)
35 λ plane = 50 0.7
Width
W m (m)
18 λ plane = 50 0.36
Height
H m (m)
4 λ verticl = 25 0.16
Diameter of pillars
D p   (m)
2 λ plane = 50 0.04
Vertical load
P v (N)
600,0000 λ plane 2 × λ verticl = 62500 96
WaveWave height
H (m)
1.875 λ verticl = 25 0.075
2.50.1
Wave period
T (s)
7.5 λ verticl 1 / 2 = 5 1.5
12.52.5
CurrentVelocity
v c (m/s)
1.4 λ plane 1 / 2 = 7.1 0.22
Water depthWater depth
h w (m)
15 λ verticl = 25 0.6
Table 3. Summary of experimental tests for wave, current, and mat foundation conditions.
Test NumberWater Depth
h w   (m)
Wave Height
H (cm)
Wave Period
T (s)
Wave Length
L w   (m)
Mat FoundationCurrent
v c   (m/s)
10.67.51.53.0-0
20.6101.53.0-0
30.6102.55.7-0
40.67.51.53.0Position A0
50.6101.53.0Position A0
60.6102.55.7Position A0
70.67.51.53.0Position B0
80.6101.53.0Position B0
90.6102.55.7Position B0
100.6102.55.7Position B0.22

