Article

Harmful Fouling Communities on Fish Farms in the SW Mediterranean Sea: Composition, Growth and Reproductive Periods

by
Mar Bosch-Belmar
1,*,
Agnés Escurriola
2,
Giacomo Milisenda
3,
Verónica L. Fuentes
2,† and
Stefano Piraino
1,4,*,†
1
Consorzio Nazionale Interuniversitario per le Scienze del Mare (CoNISMa), Piazzale Flaminio 9, 00196 Roma, Italy
2
Institut de Ciències del Mar, ICM-CSIC, E-08003 Barcelona, Spain
3
Stazione Zoologica Anton Dohrn, 90142 Palermo, Italy
4
Dipartimento di Scienze e Tecnologie Biologiche ed Ambientali, Università del Salento, 73100 Lecce, Italy
*
Authors to whom correspondence should be addressed.
S.P. and V.L.F. are joint senior authors.
J. Mar. Sci. Eng. 2019, 7(9), 288; https://doi.org/10.3390/jmse7090288
Submission received: 31 July 2019 / Revised: 18 August 2019 / Accepted: 22 August 2019 / Published: 24 August 2019
(This article belongs to the Special Issue Marine Environment-Aquaculture Interactions)

Abstract

:
Biological fouling organisms on fish cages represent a major issue and costly factor in marine finfish aquaculture. Cnidarians have been identified as one of the most problematical groups, contributing significantly to the occlusion and structural stress of the cage nets, but also dramatically affecting farmed species health in aquaculture facilities worldwide. Recently, significant relationships were established in different Spanish aquaculture facilities between hydrozoans and juvenile fish affected by gill injuries and mortality episodes. Community composition, growth rate and reproductive potential of biofouling were monitored on fish cages over two seasonal periods of fry cages farming, located in southern Spain (SW Alboran Sea), with a special focus on cnidarians. Biomass and community composition of biofouling changed with time and between studied periods, with a marked seasonality in colonization periods and taxonomic composition, particularly for the colonial hydrozoans. The hydroids Ectopleura larynx and Pennaria disticha were found at the highest densities. P. disticha was responsible for major biomass contribution to total hydroid biomass with the fastest growth rates. In addition, actinulae larvae of E. larynx were identified in zooplankton samples at high densities especially during periods of fry introduction in sea cages (when fish are highly vulnerable). These results corroborate evidence of the detrimental influence of fouling cnidarians in Mediterranean finfish aquaculture due to a direct harmful impact on fish health. Investigations on population dynamics, reproductive biology and envenomation potential of fouling hydrozoans should be regarded as key component of best monitoring practices to ensure good farmed fish welfare, maximization of aquaculture production and overall marine spatial planning.

1. Introduction

Biofouling is a major problem and costly factor in marine finfish aquaculture worldwide. The accumulation of epibiotic organisms can increase the hydrodynamic load on fish nets [1], reducing water flow and oxygen supply, therefore affecting the susceptibility of farmed fish to diseases [2,3]. The occlusion and increased weight of the net can also cause structural stress as well as a reduction in cage buoyancy and increased net deformation [4].
The succession patterns and qualitative/quantitative composition of biofouling on floating cages may differ from those described for hard substrates or seabed communities because net cage material differs from natural substrates [5]. The most common macrofouling taxa found on aquaculture structures originate from planktonic propagules of macroalgae and larvae of benthic invertebrates such as sponges, hydrozoans, bryozoans, barnacles, bivalves, polychaetes and ascidians [6,7,8]. In most cases, biofouling is deleterious to shellfish stocks and farmed fish cultures by acting as reservoirs of pathogens or by clogging net mesh, thus reducing water exchange in the cages. However, several epibiotic taxa may exert direct impacts on farmed species. Some polychaete worms excavate the shells of shellfish, affecting their development and increasing their vulnerability to predators and parasites [6]; some tunicates compete with farmed mussels for food [9]; and several hydroids are known to regularly feed on mussel larvae and foul the shells of cultivated mussels, causing significant reduction in bivalve length and weight [7]. Hydroids are also reported as a key pioneering component of fouling assemblages facilitating settlement and growth of late succession, epibiotic organisms [10]. Hydroids are also known as a threat for finfish mariculture due to the contact envenomation and secondary bacterial infections induced on farmed species health [6]. In situ net cleaning processes traditionally used in aquaculture cage farms causes hydrozoan fragments containing functional stinging cells to be freely released in the water column. When inhaled by experimental fish, these fragments caused serious gill injuries followed by secondary bacterial infections, severely affecting fish welfare [3]. Over the last decade, the hydroid Ectopleura larynx has become one of the most common fouling species in northern Europe aquaculture, causing increasing problems for fish farmers [11]. Together with Pennaria disticha, E. larynx has been identified as a highly problematic taxon for marine fish farms also in the Mediterranean Sea [12]. Nonetheless, although fouling represents a costly and labour-intensive issue for marine fish farmers, a remarkable lack of knowledge still occurs about the structure and seasonal dynamics of the hydroid fouling community.
Severe gill injures to those caused by E. larynx in the experimental trial performed by Baxter et al. [3] were also observed in Irish fish farms where salmon mortalities were correlated with high densities of cnidarian zooplankton inside the facility [13]. Recent studies have demonstrated a significant relationship between E. larynx actinulae density in the water column and farmed sea bass gill pathology and mortality, identifying this hydroid species as potentially harmful for marine aquaculture also in the Mediterranean Sea [14]. Due to their hydranth big sizes and the occurrence of a powerful nematocyst arsenal including large sized stenoteles [15,16] in their capitate tentacles, polyps of P. disticha and E. larynx revealed to be able to inflict harmful stings on human bathers as well as serious damage on skin and gills of caged fish [3,17]. In addition, the hydranth self-detachment (autotomy) is a well-known asexual reproduction process for several tubulariid hydroids, including Ectopleura spp. [18], leading to the release of the tentacled polyp heads in the water column. When liberated, polyp heads may act as drifting “armed weapons” able to cause harmful injuries on farmed fish skin and gills.
Furthermore, P. disticha is a warm-water affinity species widely distributed in tropical and subtropical shallow waters across major world oceans. Therefore, it is possible to hypothesize the rise of ocean temperature will eventually lead to an increase in its occurrence and abundance over time at temperate latitudes, as an additional example of the progressive “tropicalization” of temperate marine ecosystems [19].
This work stems from scant available information on the effects of jellyfish in aquaculture and on the potential impact of hydroids on fish farms and farmed species health. It aimed to uncover the qualitative and quantitative composition and succession pattern of the biofouling assemblage on finfish aquaculture cages in the southwestern Mediterranean Sea, with a focus on the hydroid assemblage and on species previously reported as potentially harmful for caged fish. In addition, this study clarified the seasonal occurrence and sexual reproductive periods of dominant cnidarian species, identifying temporal windows characterized by high densities of stinging cnidarians (as polyp colonies and swimming propagules) so providing key information for setting optimal farming protocols and schedules of aquaculture cage management (i.e., net cleaning periods and methodologies, juveniles stocks sea-cage introduction, etc.). As a corollary, the introduction of cnidarian fouling monitoring investigations in marine spatial planning programmes across different spatial scales is highly recommended.

2. Materials and Methods

2.1. Study Site

Fouling was monitored in an offshore fish farm facility located in Águilas, Spain (eastern Alboran Sea), using floating cages to grow the European sea bass (Dicentrarchus labrax) and gilthead sea bream (Sparus aurata). Cultivated fish stocks ranging between 15 and 70 g were introduced in fry fish cages (mesh size of 1 cm, cage diameter of 25 m and depth of 6 m) twice a year, usually April–May and September–October, depending on fry production rhythms on shore. When optimal weights were reached, fish were moved to adult pen nets (mesh size of 2 cm and depth of 10 m).

2.2. Field and Laboratory Methods

To cover a production year, two monitoring periods were established, from May to November 2013 (I) and from November 2013 to June 2014 (II), simulating the immersion periods of juveniles’ cages. At each period, four metallic racks (120 cm × 80 cm), holding six panels each (24 panels in total), were positioned in the northwest part of the facility, close to the juveniles’ rearing cages. Each experimental panel was constructed with a single 40 cm × 40 cm piece of cage net. The mesh dimensions and the antifouling treatment were the same as used in the juveniles’ cage (100 mm and NI5-Netchem antifouling, New Brunswick, NJ, USA). The large frame was attached vertically to the side of one of the fry cages at 5 m depth. Eight different sampling times were established within each experimental period, with three panels collected at each time (8 × 3 = 24 panels/period). The first set of panels was collected one month after the panels’ immersion, and the subsequent sets every second to third week interval, depending on weather conditions. Each panel was used once during the experiment in order to avoid problems related to the non-independence and temporal autocorrelation of the response variables.
Panels were carefully collected by scuba divers and immediately fixed in 10% neutral buffered formalin solution (4% formaldehyde seawater solution) (Sigma-Aldrich, Sant Louis, MO, USA). In addition, at each sampling time, three replicate zooplankton samples were collected by vertical hauls from 8–10 m depth to surface using a 200 µm mesh net (HYDRO-BIOS, Kiel, Germany) with a filtering cod end and a digital flow meter to calculate the volume of filtered water (HYDRO-BIOS model 438 110, Kiel, Germany,). Samples were preserved in 10% neutral buffered formalin solution.
In the laboratory, all fouling groups were separated and identified to the lowest possible taxonomic level: Suborder for crustaceans, species for hydroids and genus level for the remaining taxa, including macroalgae. Vagile groups, such as platyhelminthes or polychaetes, living on the net but theoretically able to move short distances between nets, were included in the analysis because they are essential parts of the net fauna. A 1 cm wide margin along the border of the panels was excluded to avoid potential edge effects. Experimental panels were inspected with a stereomicroscope (LEICA MZ12, Wetzlar, Germany) at 10× and 20× magnification power, and all epibiotic organisms manually removed by forceps, sorted by taxon and preserved in 10% formalin. Then the panels were gently brushed to collect all algae attached to the nylon and stored in the formalin.
Richness was calculated for every panel as the total number of recorded taxa. For biomass (g m−2) analysis, most organisms were grouped into fouling units by phylum- or subphylum-level Crustacea, Annelida, Nemertea, Mollusca, Echinodermata, Bryozoa, Platyhelminthes, Nematoda or by class level (Hydrozoa and Anthozoa). Further, all macroalgae were weighed as a single group. All fouling units were separately desiccated to a constant dry weight (~48 h) at 60 °C (FINEPCR, Korea). Density (individuals m−2) was calculated for each group except for colonial cnidarians, bryozoans and macroalgae, in which individual zooids or thalli could not be counted.
Growth rates colonies were determined for Ectopleura larynx, Pennaria disticha and Obelia dichotoma, the most abundant hydroid colonies. The maturation of gonophores (i.e., structure for sexual reproduction) was also assessed for E. larynx and P. disticha. Changes in colony stem height was used as a potential indicator of the in situ hydroid growth rate. At each sampling time, the length of 30 randomly selected hydrocauli (i.e., the main stems of hydroid colonies) from the three samples panels was measured for each of the above species, and their average stem lengths calculated. The reproductive structures (gonophores) of hydroids colonies were classified according to the descriptions of Schuchert for P. disticha, and Allman and Schuchert for E. larynx [20,21,22] (Table 1).

2.3. Data Analysis

A one-way variance analysis (ANOVA) was performed to detect significant differences in the richness values between the first (I) and second (II) monitoring periods. Beforehand, data normality and homogeneity of variance were tested. Experimental design included factor “periods” (fixed, 2 levels: Period I and II).
Differences of biofouling community composition between the two periods were analysed by a one-way permutational multivariate ANOVA performed on a triangular matrix based on Bray–Curtis similarity. To establish which were the main species that contributed to the average Bray–Curtis dissimilarity between two groups of samples, the SIMPER (similarity percentage analysis) routine was used [23].
The presence of significant differences in the hydroid sexual maturation score was tested on P. disticha (period I) and E. larynx (period II) using one-way Kruskal–Wallis rank sum test, since the dependent variable (“maturation score”) was an ordinal variable. For both species the independent variable was represented by the factor “time of sampling”. Post hoc test were performed using a Dunn test for multiple groups comparisons.
A Multiple Regression Linear Model was used to test for differences in hydroid growth (expressed as hydrocaulus length) by time (expressed as day of the experiments, as a continuous explanatory variable) and species (categorical explanatory variable: O. dichotoma vs. P. disticha during Period I, and O. dichotoma vs. E. larynx during Period II). For each period, we tested two different models, one testing interactions between species and time factors (M1: hydrocaulus length = species x time) and another without interaction (M2: hydrocaulus length = species + time). All models were fitted and compared with each other using the corrected Akaike’s Information Criterion (AIC) and the explained variance. Of particular concern was the assumption of homogeneity of regression slopes (HOS). When the HOS assumption is violated, looking for an alternative approach to the ANCOVA (Analysis of covariance) is needed. The Johnson–Neyman procedure (J–N) is presented as such an alternative. The Johnson–Neyman technique (or Wilxon modification thereof) procedure indicates the ranges of the covariate over which the individual regression lines of pairs of treatment groups overlap or cross. The Wilcox (J–N) procedure has the advantage of revealing the important range (ranges for which the groups are different and not different) of the covariate rather than being constrained by specific levels selected. All analyses were carried out using the statistical software R (R Core Team 2019) [24].

3. Results

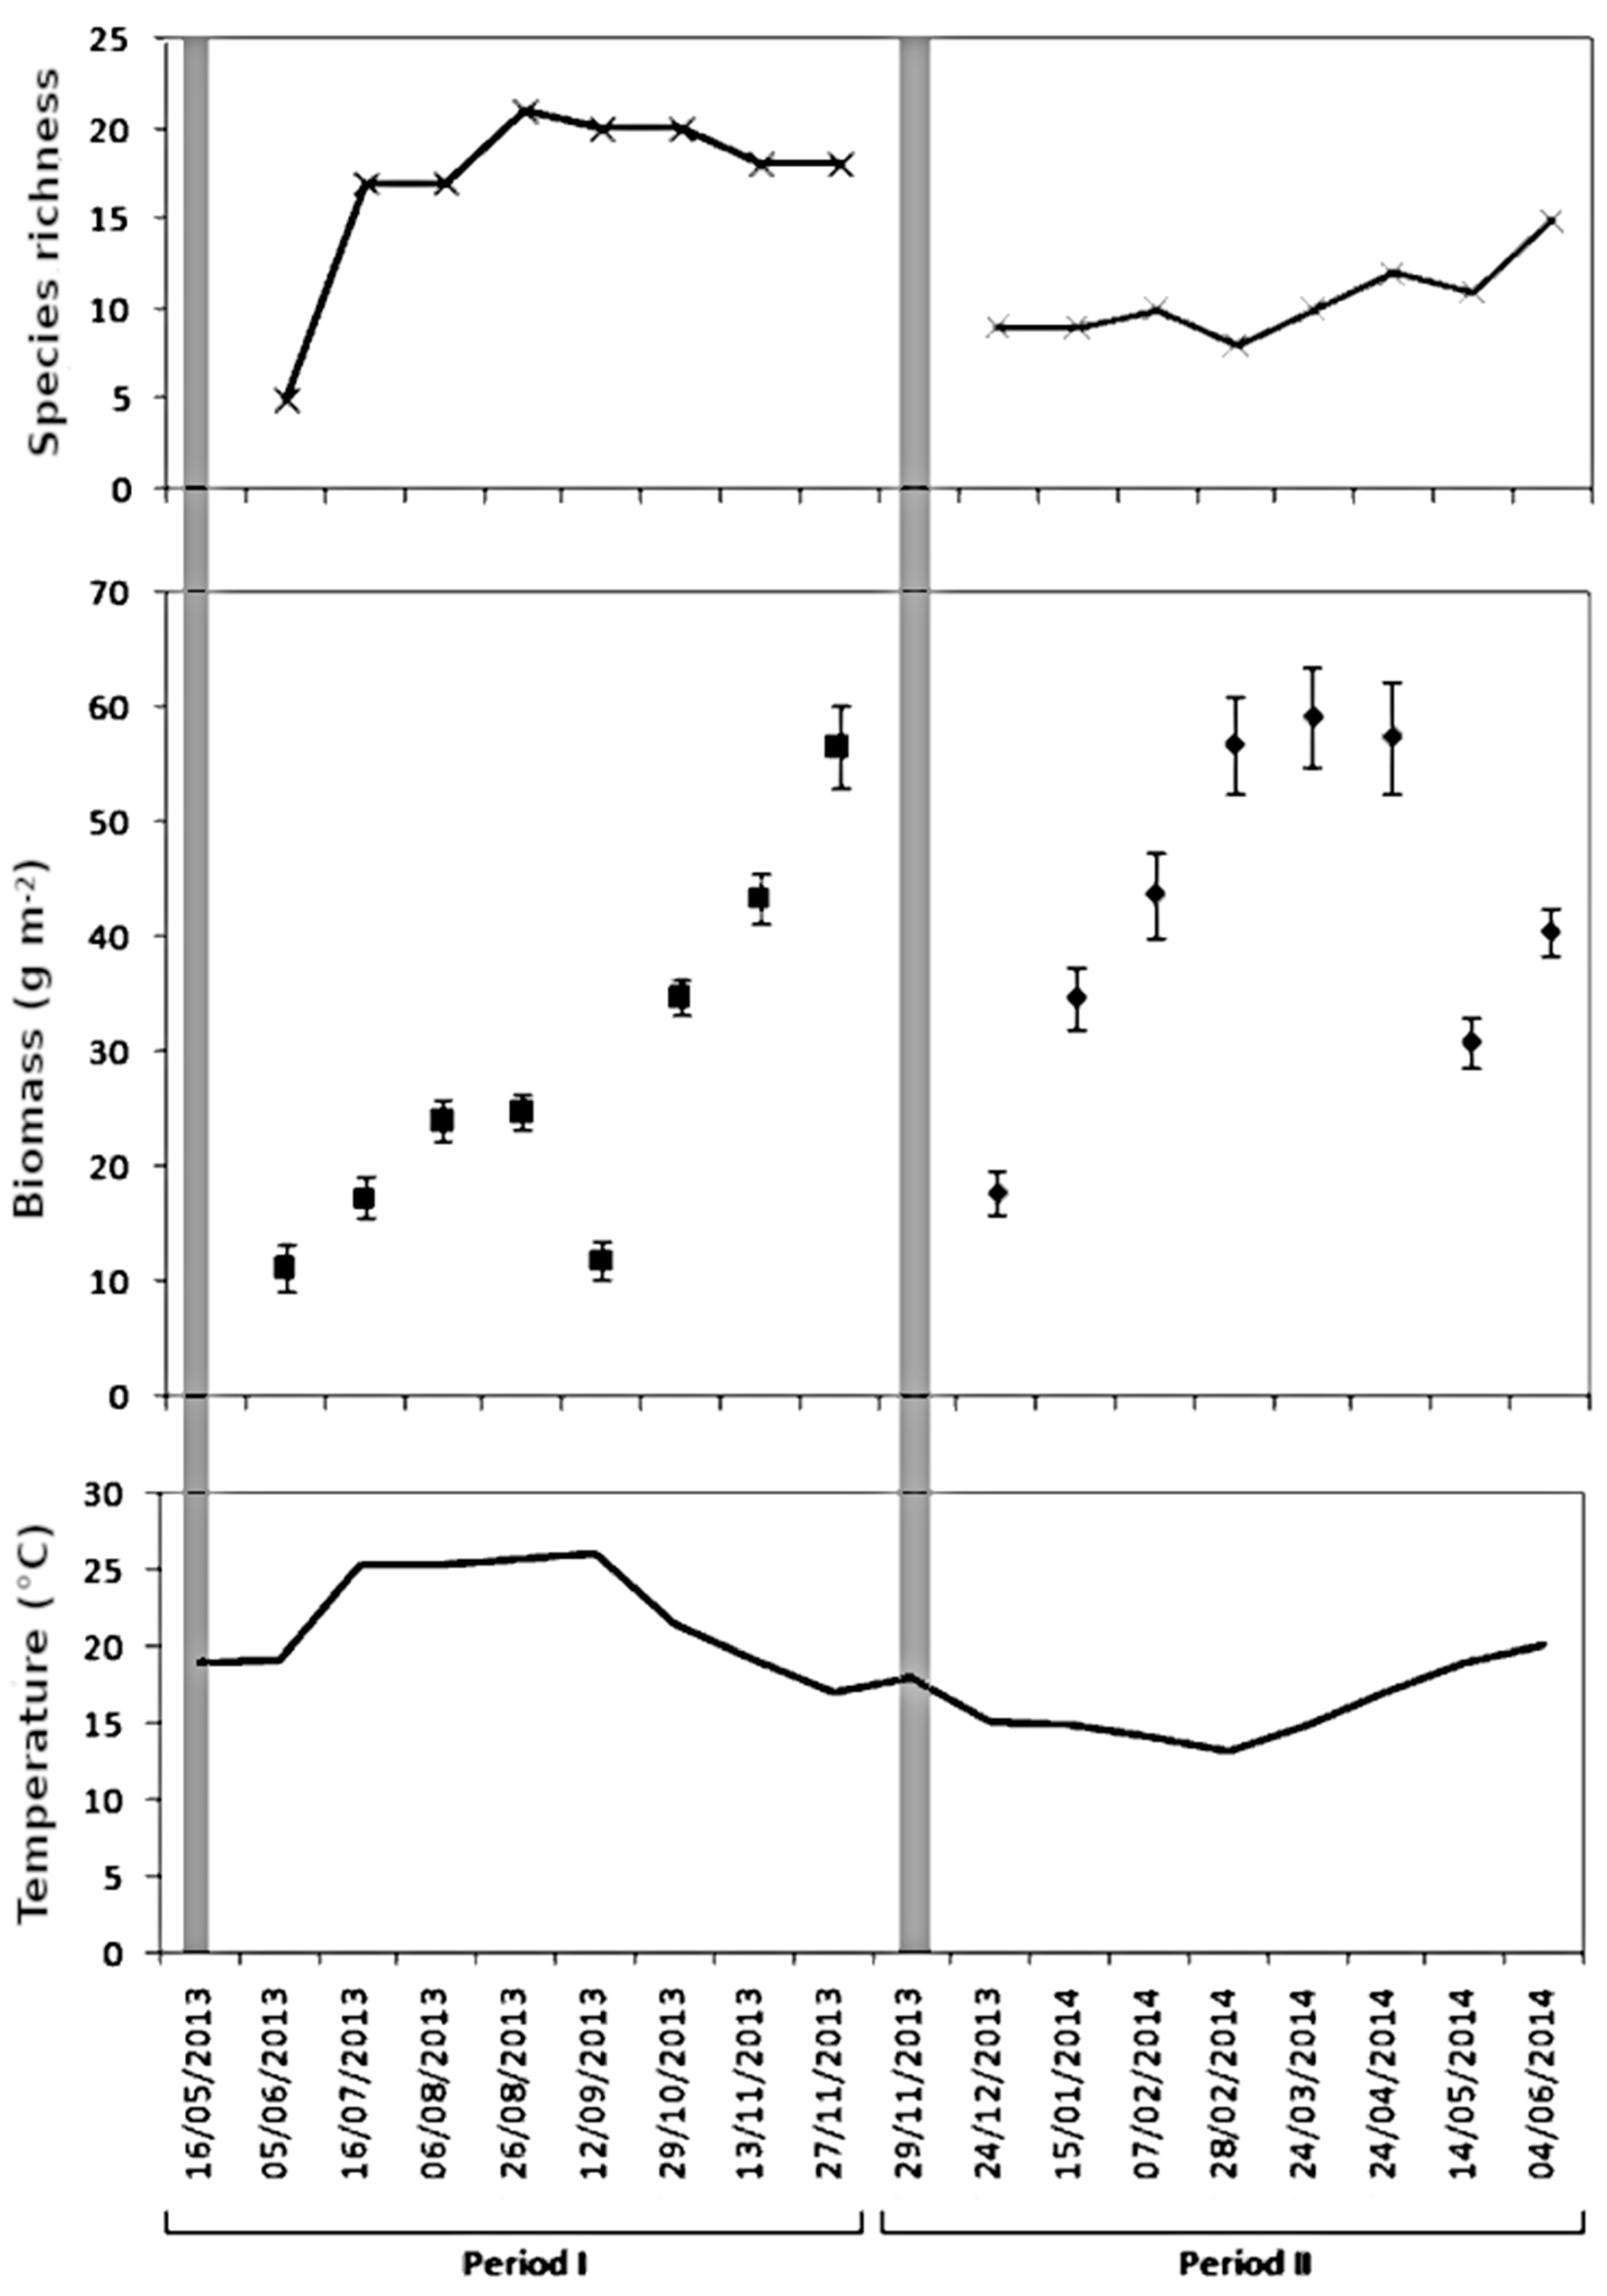
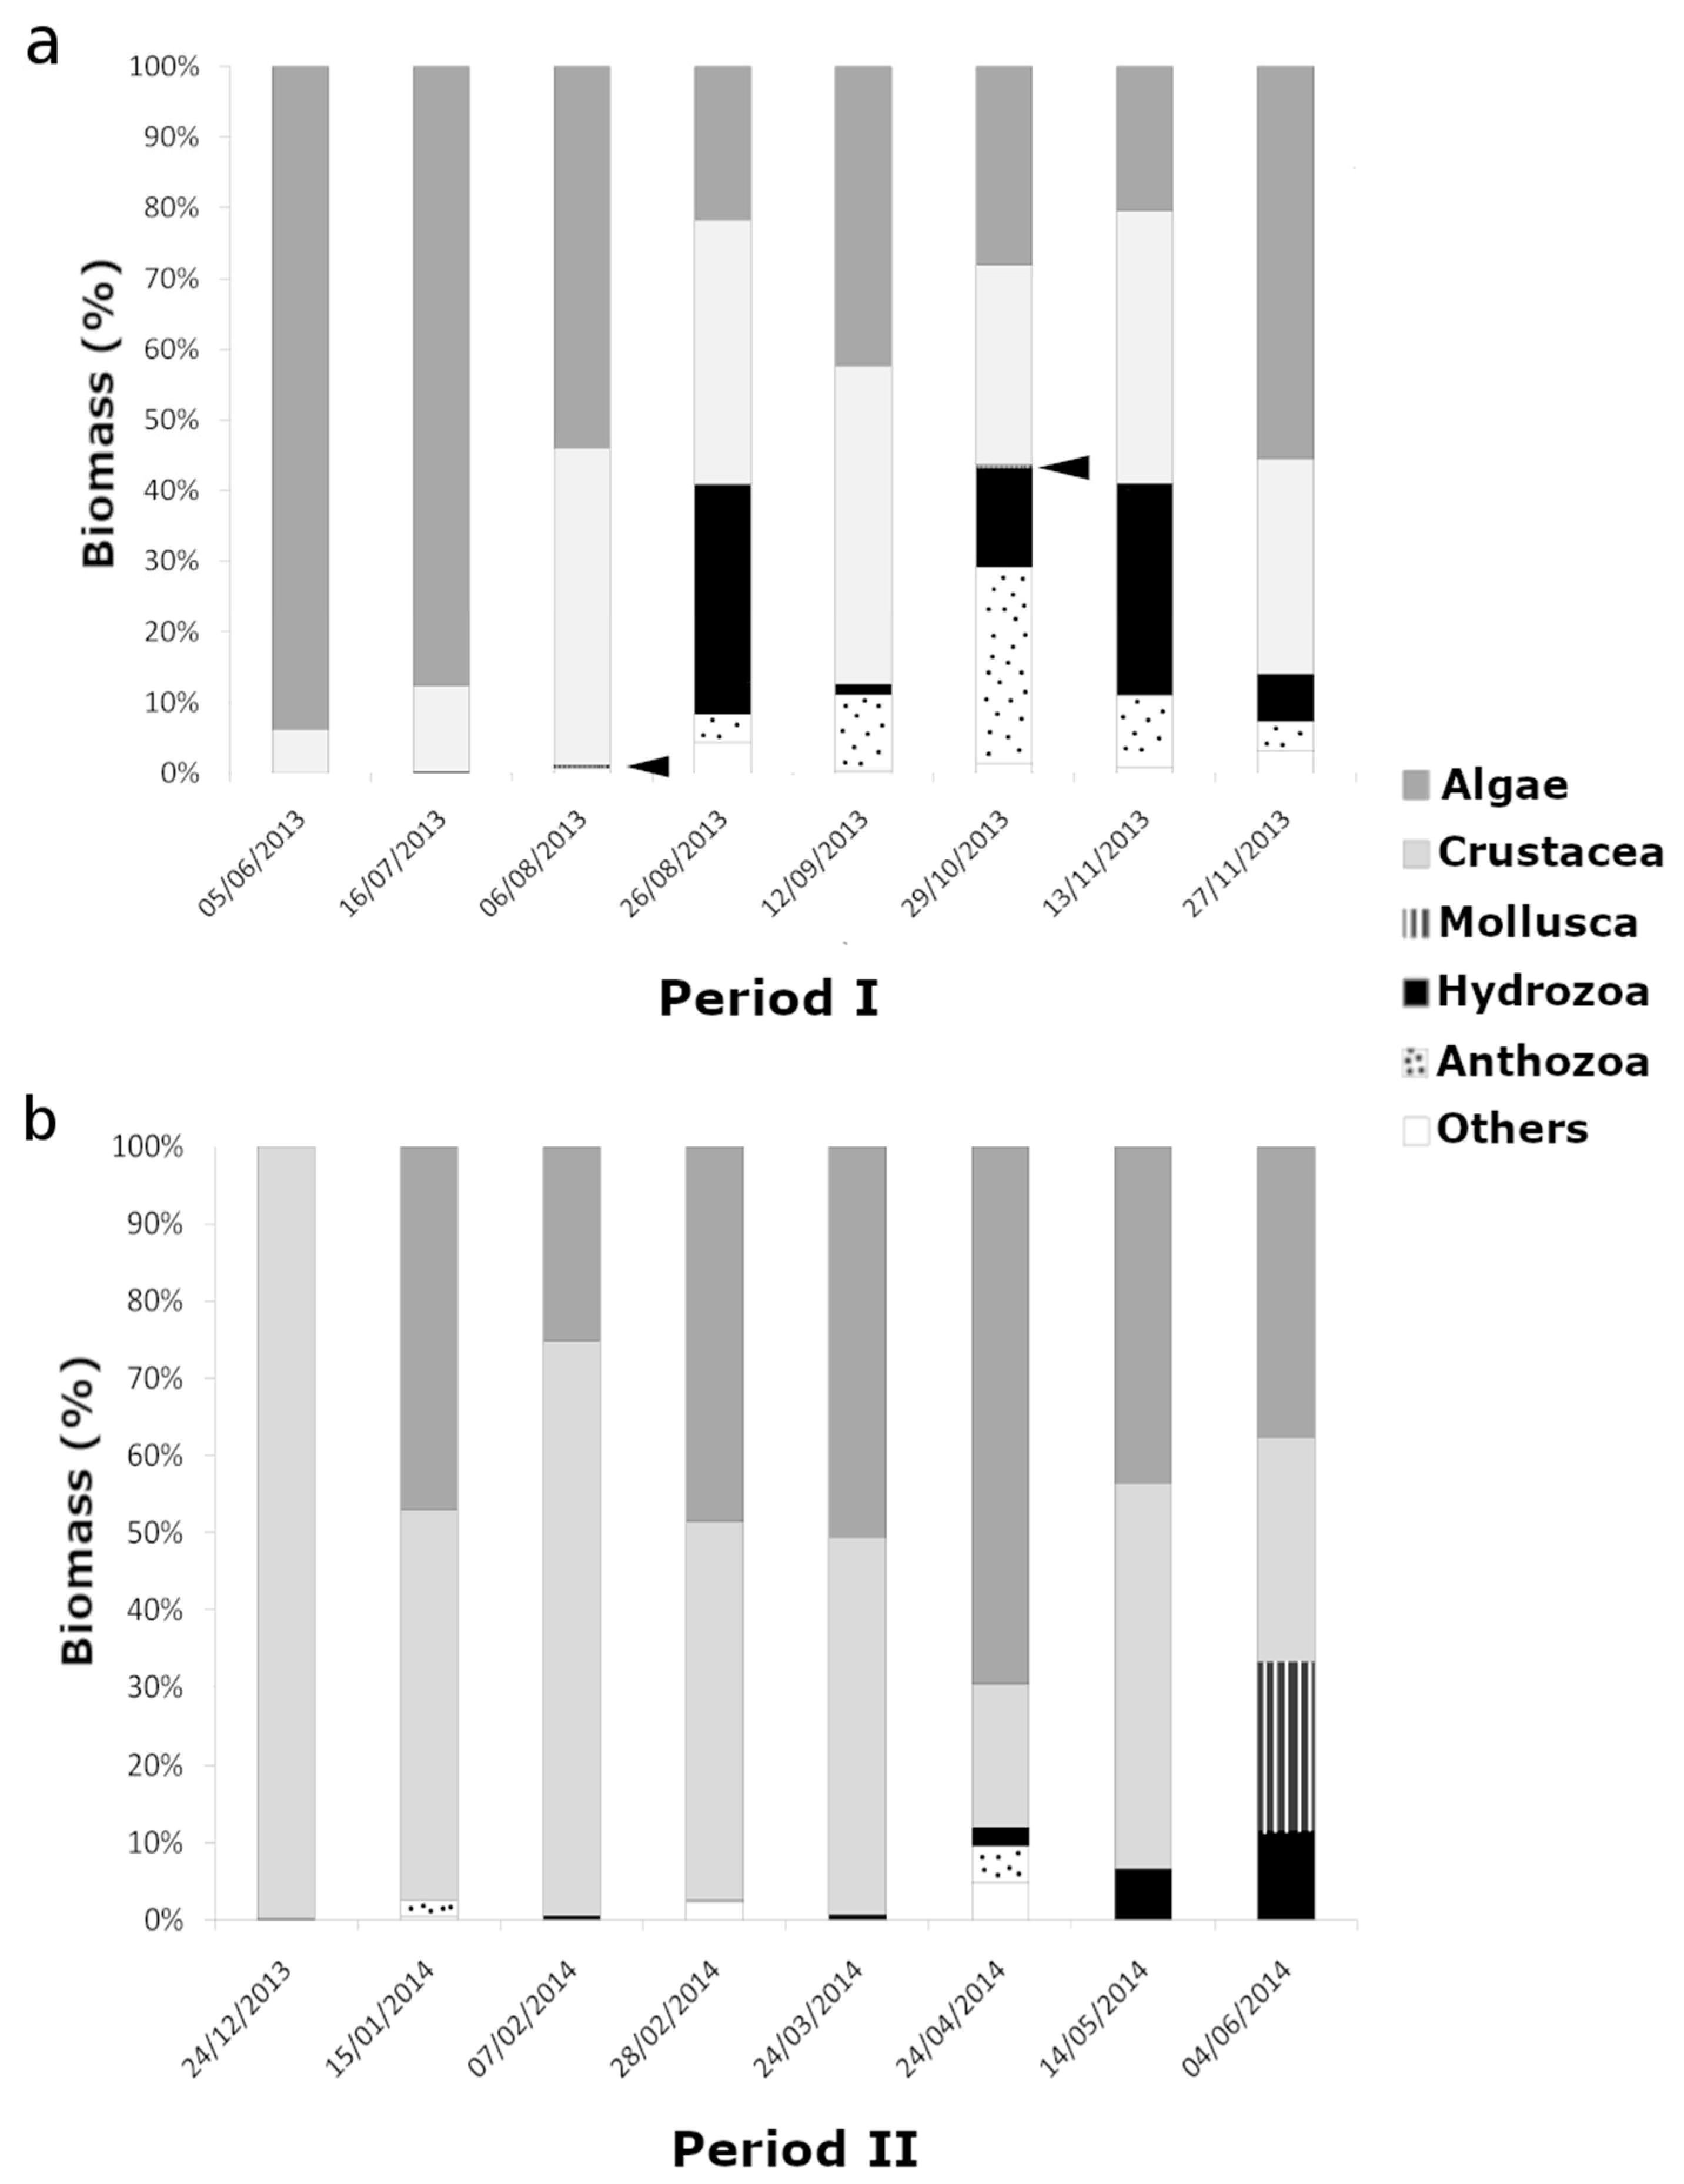
3.1. Species Richness, Biomass and Community Composition

A total of 29 and 25 taxa from 12 different phyla were found across monitoring periods I (May to November 2013) and II (November 2013 to June 2014), respectively, on a total of 48 experimental panels. Richness differed significantly between monitoring periods (F (1,46) = 7.392, p = 0.001) (Figure 1), with the highest peaks in August 2013 (period I, 21 taxa) and June 2014 (Period II, 15 taxa).
Total biofouling biomass (g m−2) was significantly higher during Period II than Period I (305.79 ± 0.83 g m−2 and 224.10 ± 0.94 g m−2, respectively) (F (1,35) = 8.418, p = 0.001) (Figure 1). The most frequent and most abundant macrofouling organisms were macroalgae and crustaceans (orders Amphipoda and Tanaidacea) during both monitoring periods, followed by anthozoans (>1000 individuals m−2 just from June to November—Period I) and bivalves (Mytilus galloprovincialis, up to 100 individuals m−2). Crustaceans and algae contributed most to biomass values in both periods, followed by cnidarians (hydroids and anthozoans) for the first period and cnidarians and molluscs for the second (Figure 2).
Moreover, the composition of the biofouling community was significantly different between the two periods (F (1,33) = 24.981, p = 0.001) (Table 2), with anthozoans, nemertines and polychaetes almost absent during Period II. During both periods, microalgae and crustaceans acted as early colonizers of net panels (Table 3). Throughout Period I, polychaetes, nematodes and nemertines accounted for a small biomass; a marked colonization of macroalgae started in July, together with molluscs and anthozoans. Hydroids appeared on the panels only in late August, and since then, they were among the dominant fouling organisms until November. Different hydroid species (E. larynx and O. dichotoma) settled early and remained throughout the whole of Period II, covering up to 50% of the fouled panel area, but approximately 3% of total biomass. The Period II was characterised by a reduced occurrence of taxa usually abundant in period I (polychaetes, nemertines and anthozoans) (Table 3). Total biomass of bivalve molluscs, which were more abundant and one of the most frequent groups during the first period, also remained low due to their small individual size (mean length: 1 ± 0.4 cm). In contrast, throughout the second period bivalves were fewer but larger (mean length: 2.3 ± 0.8 cm), with a higher biomass than in the first period.

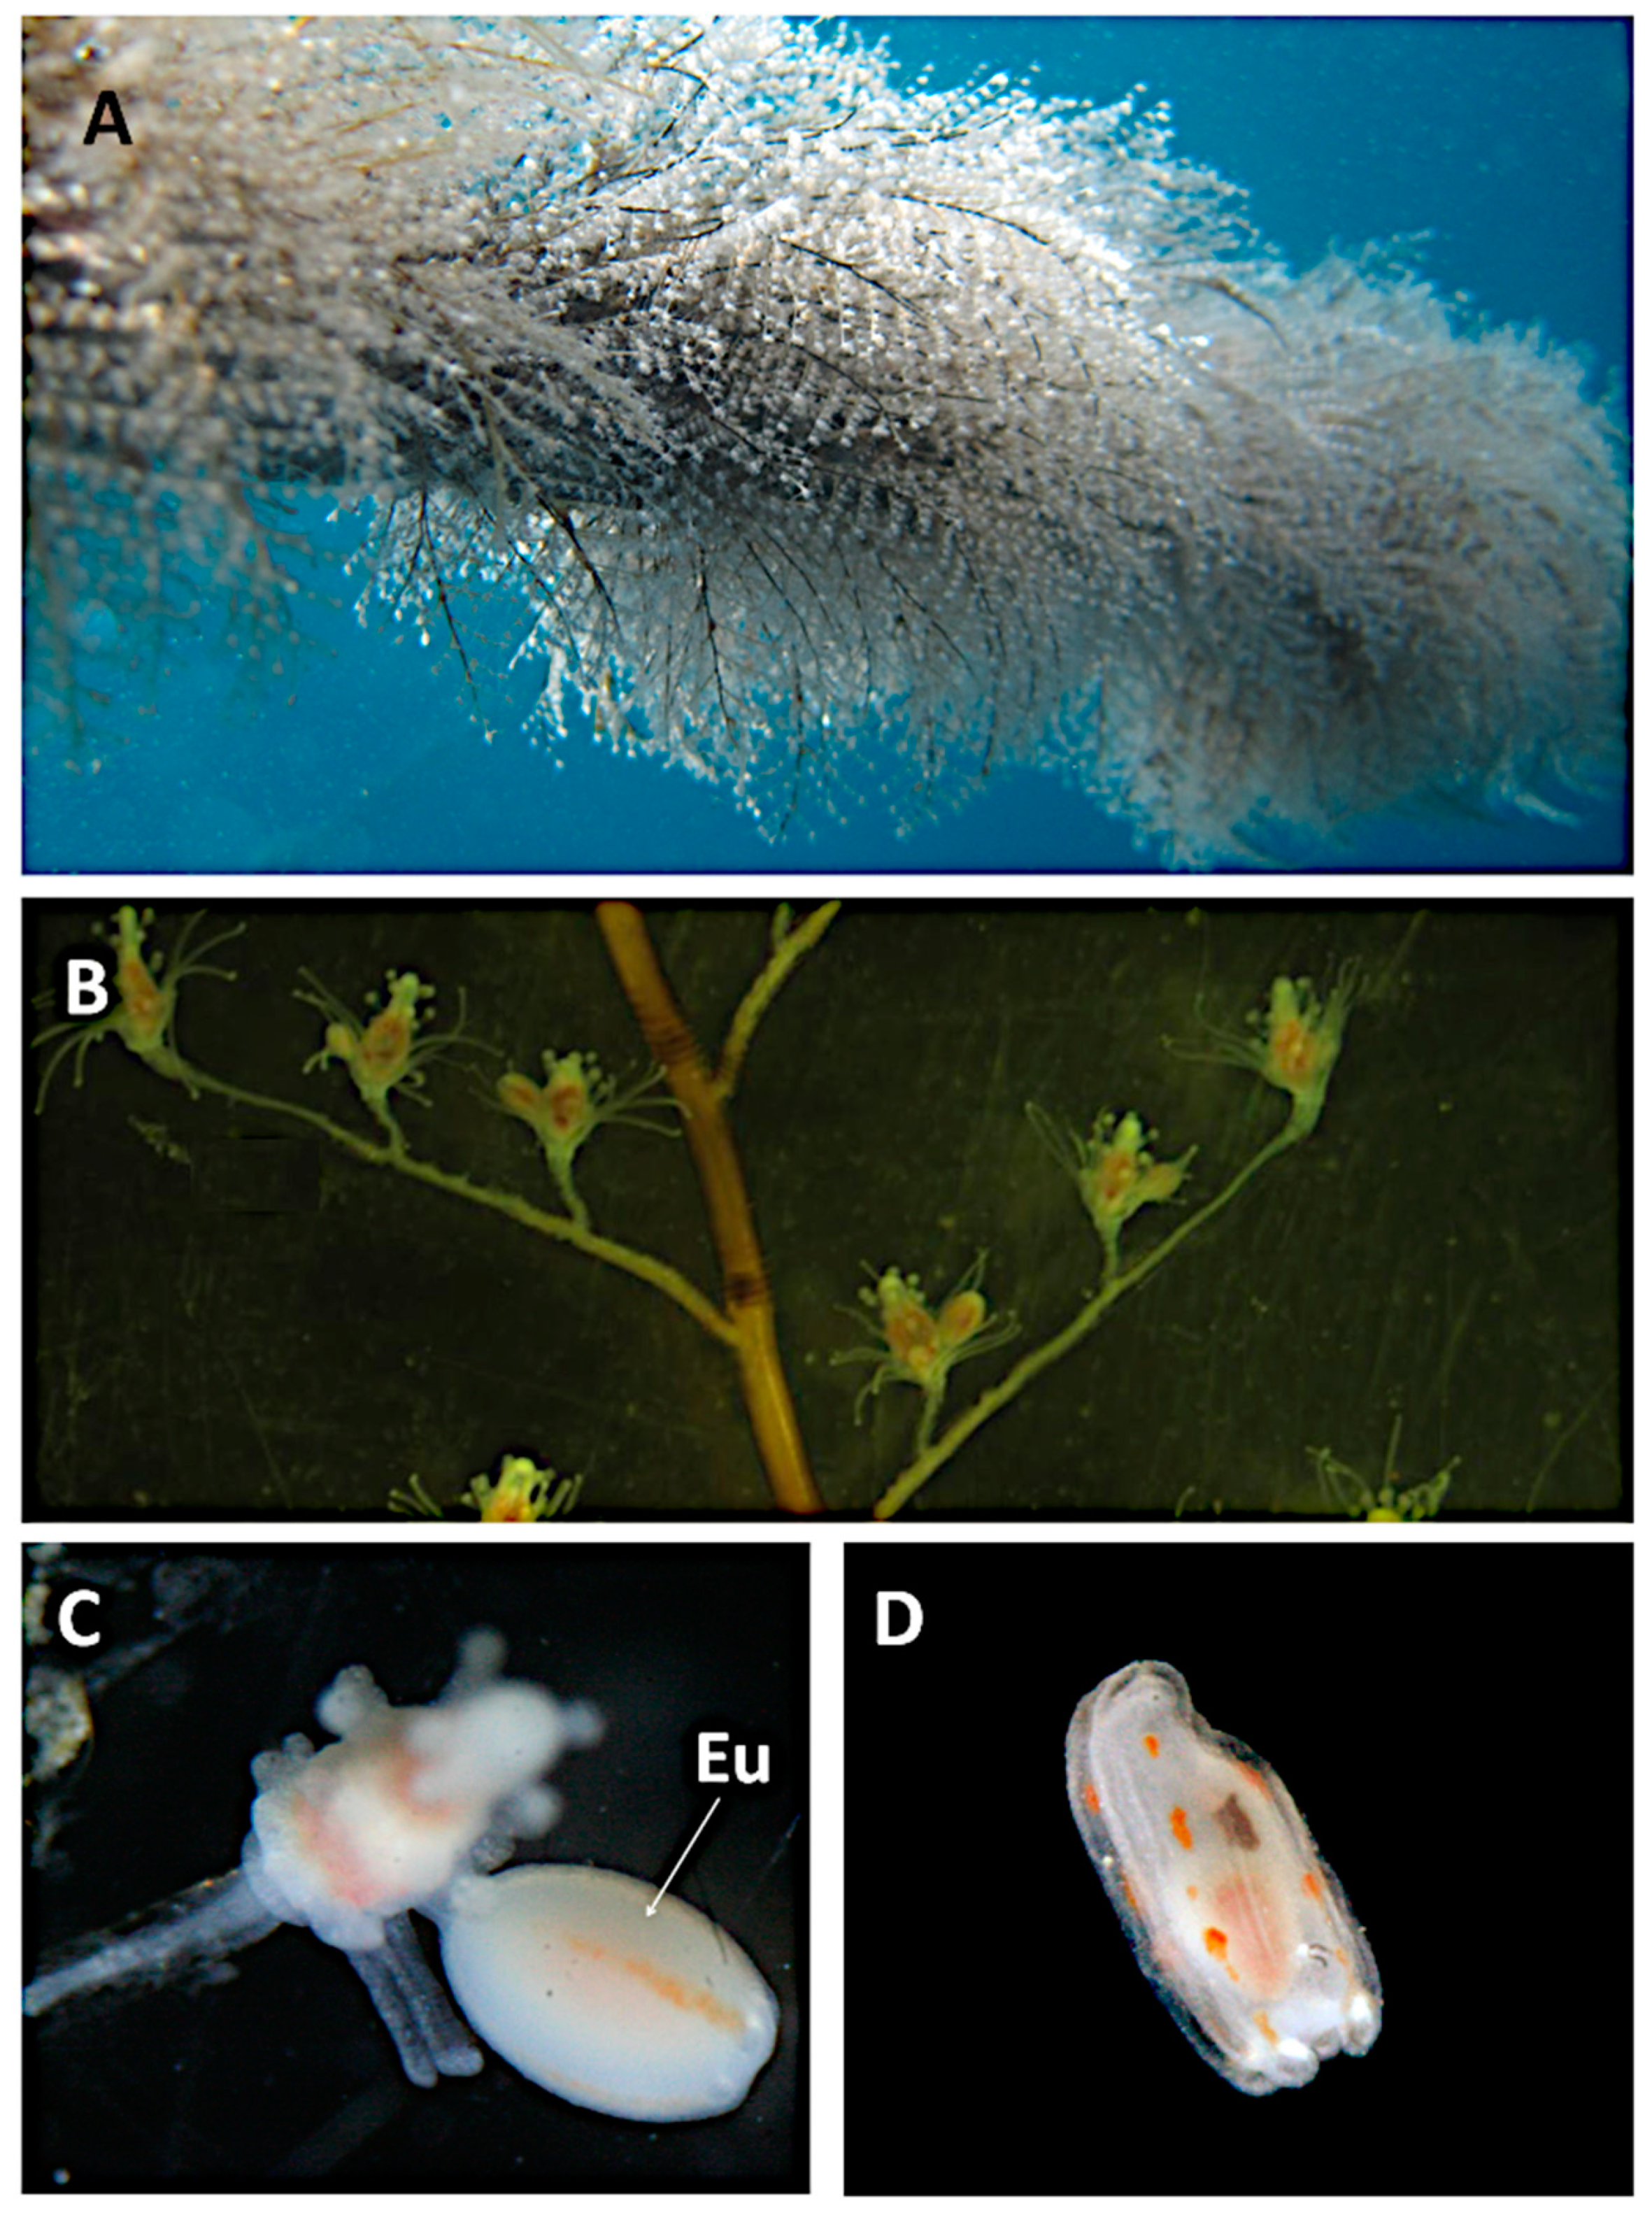
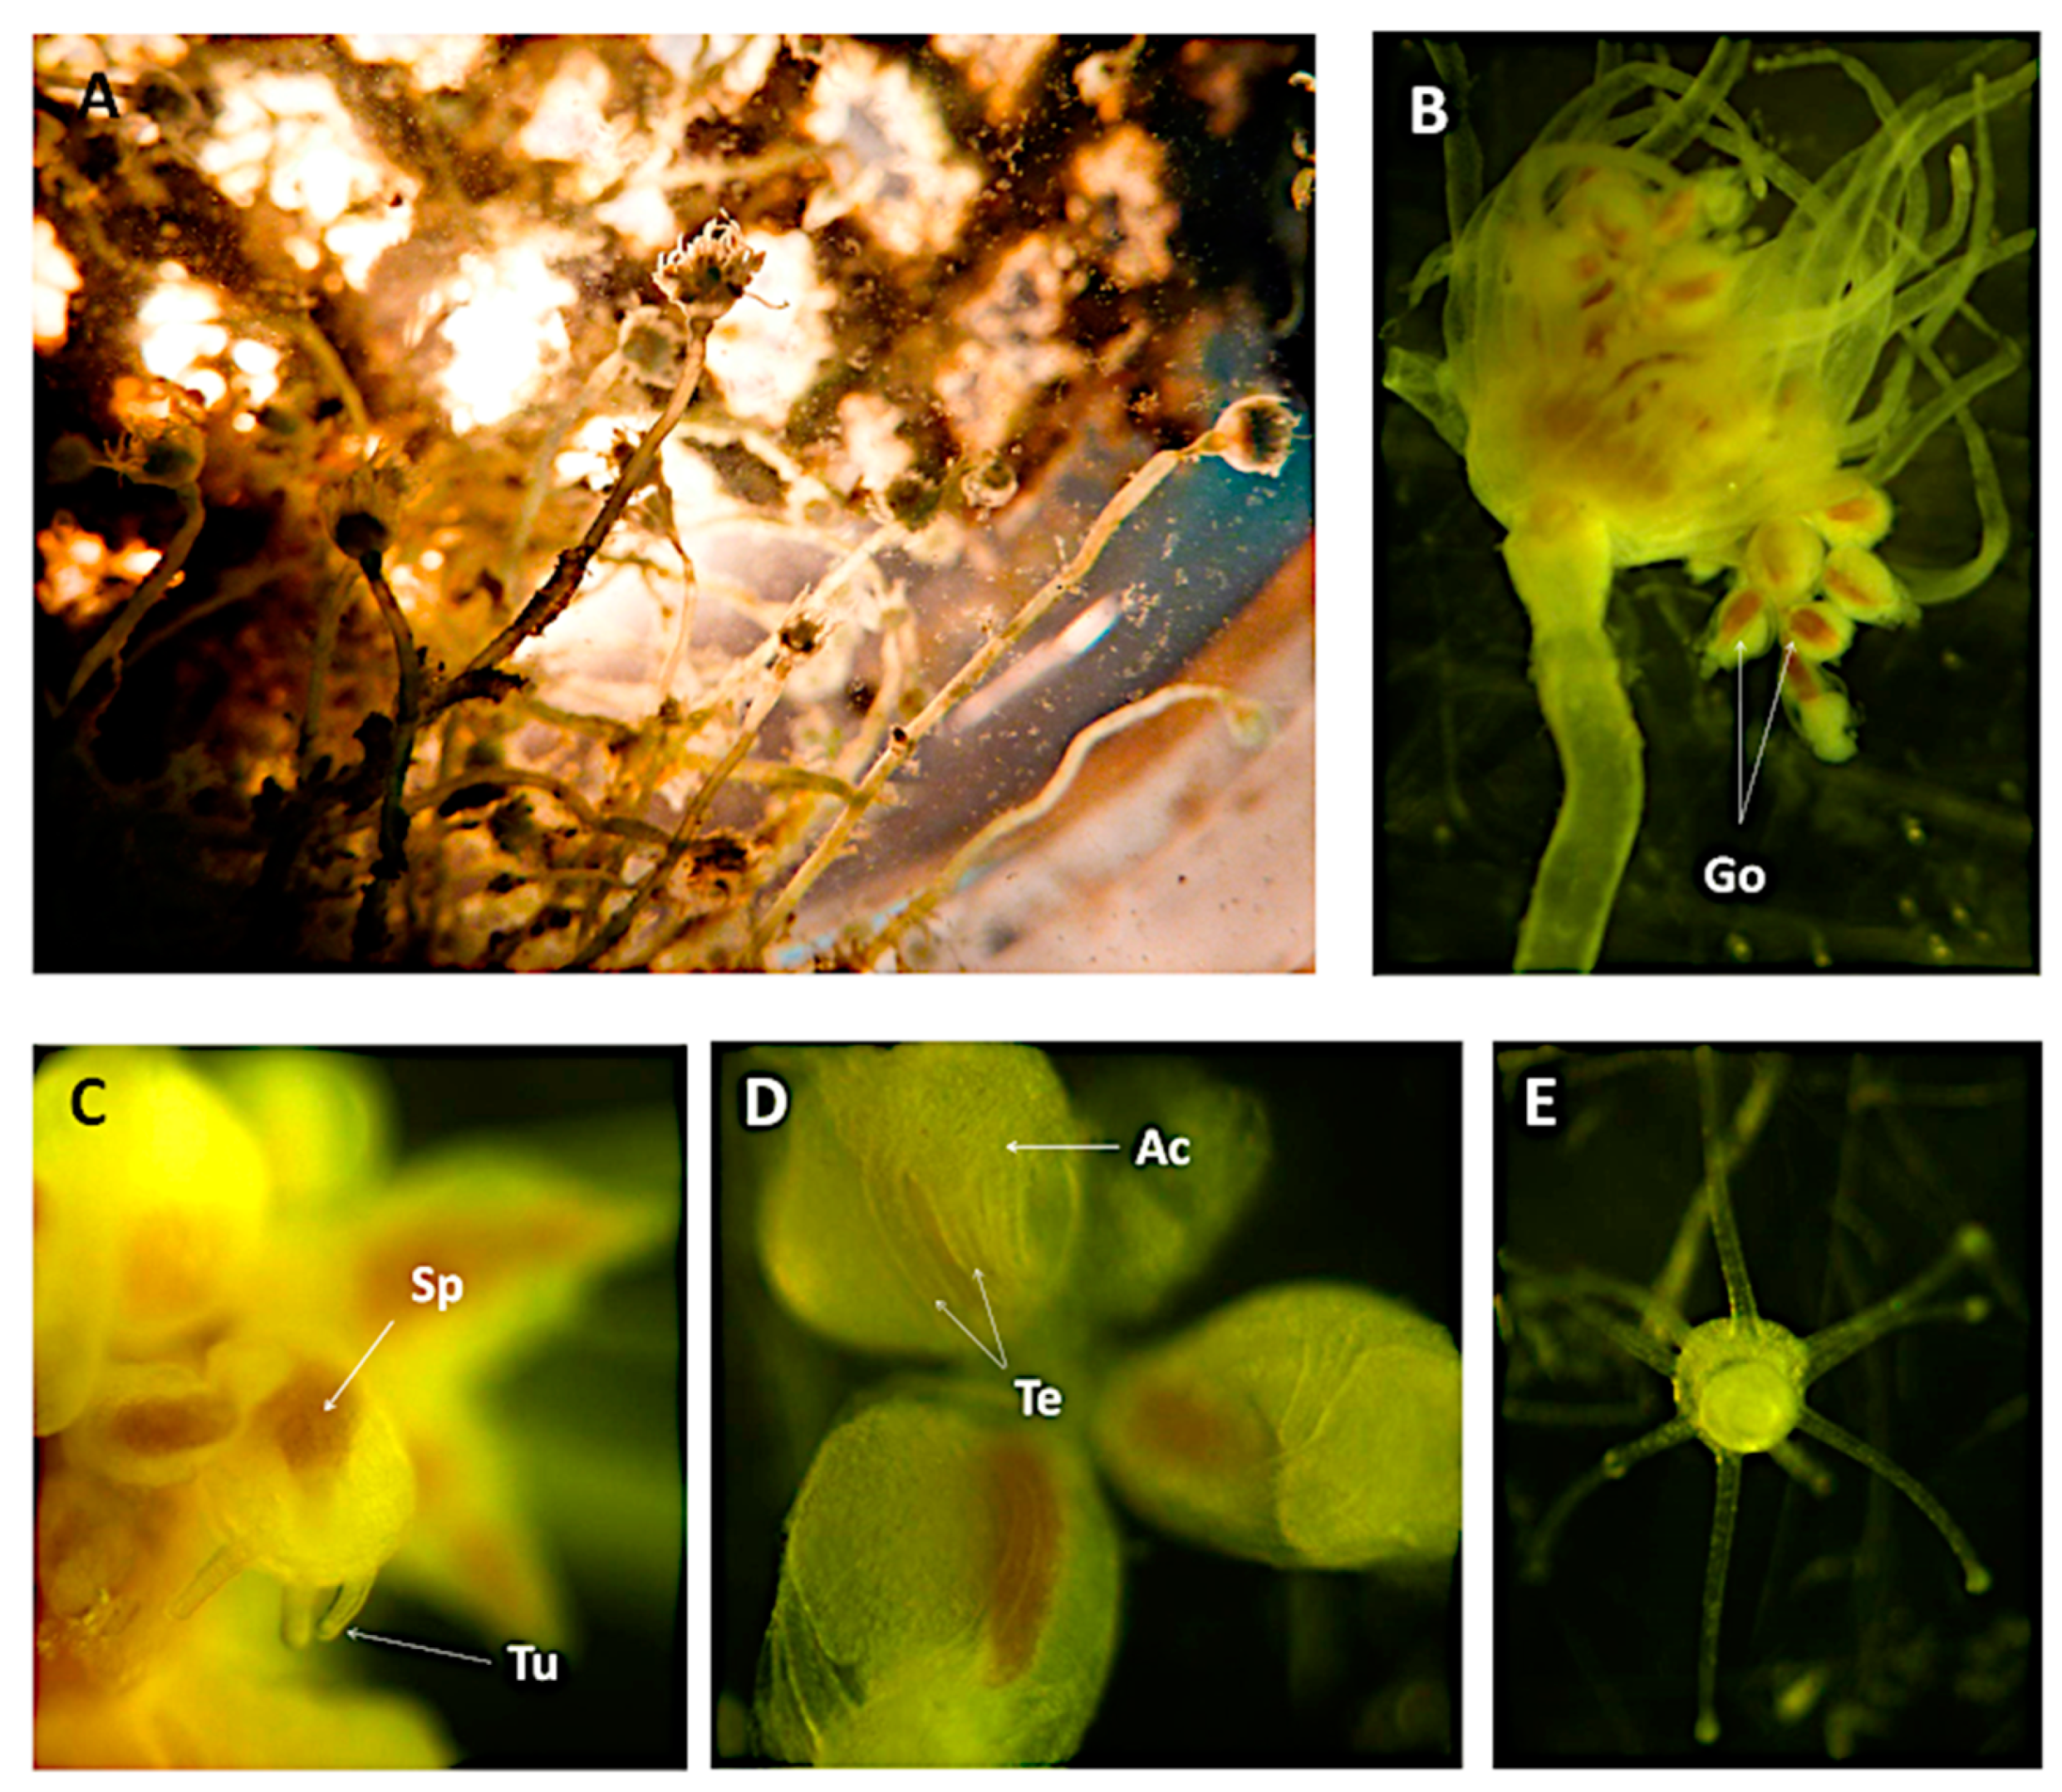
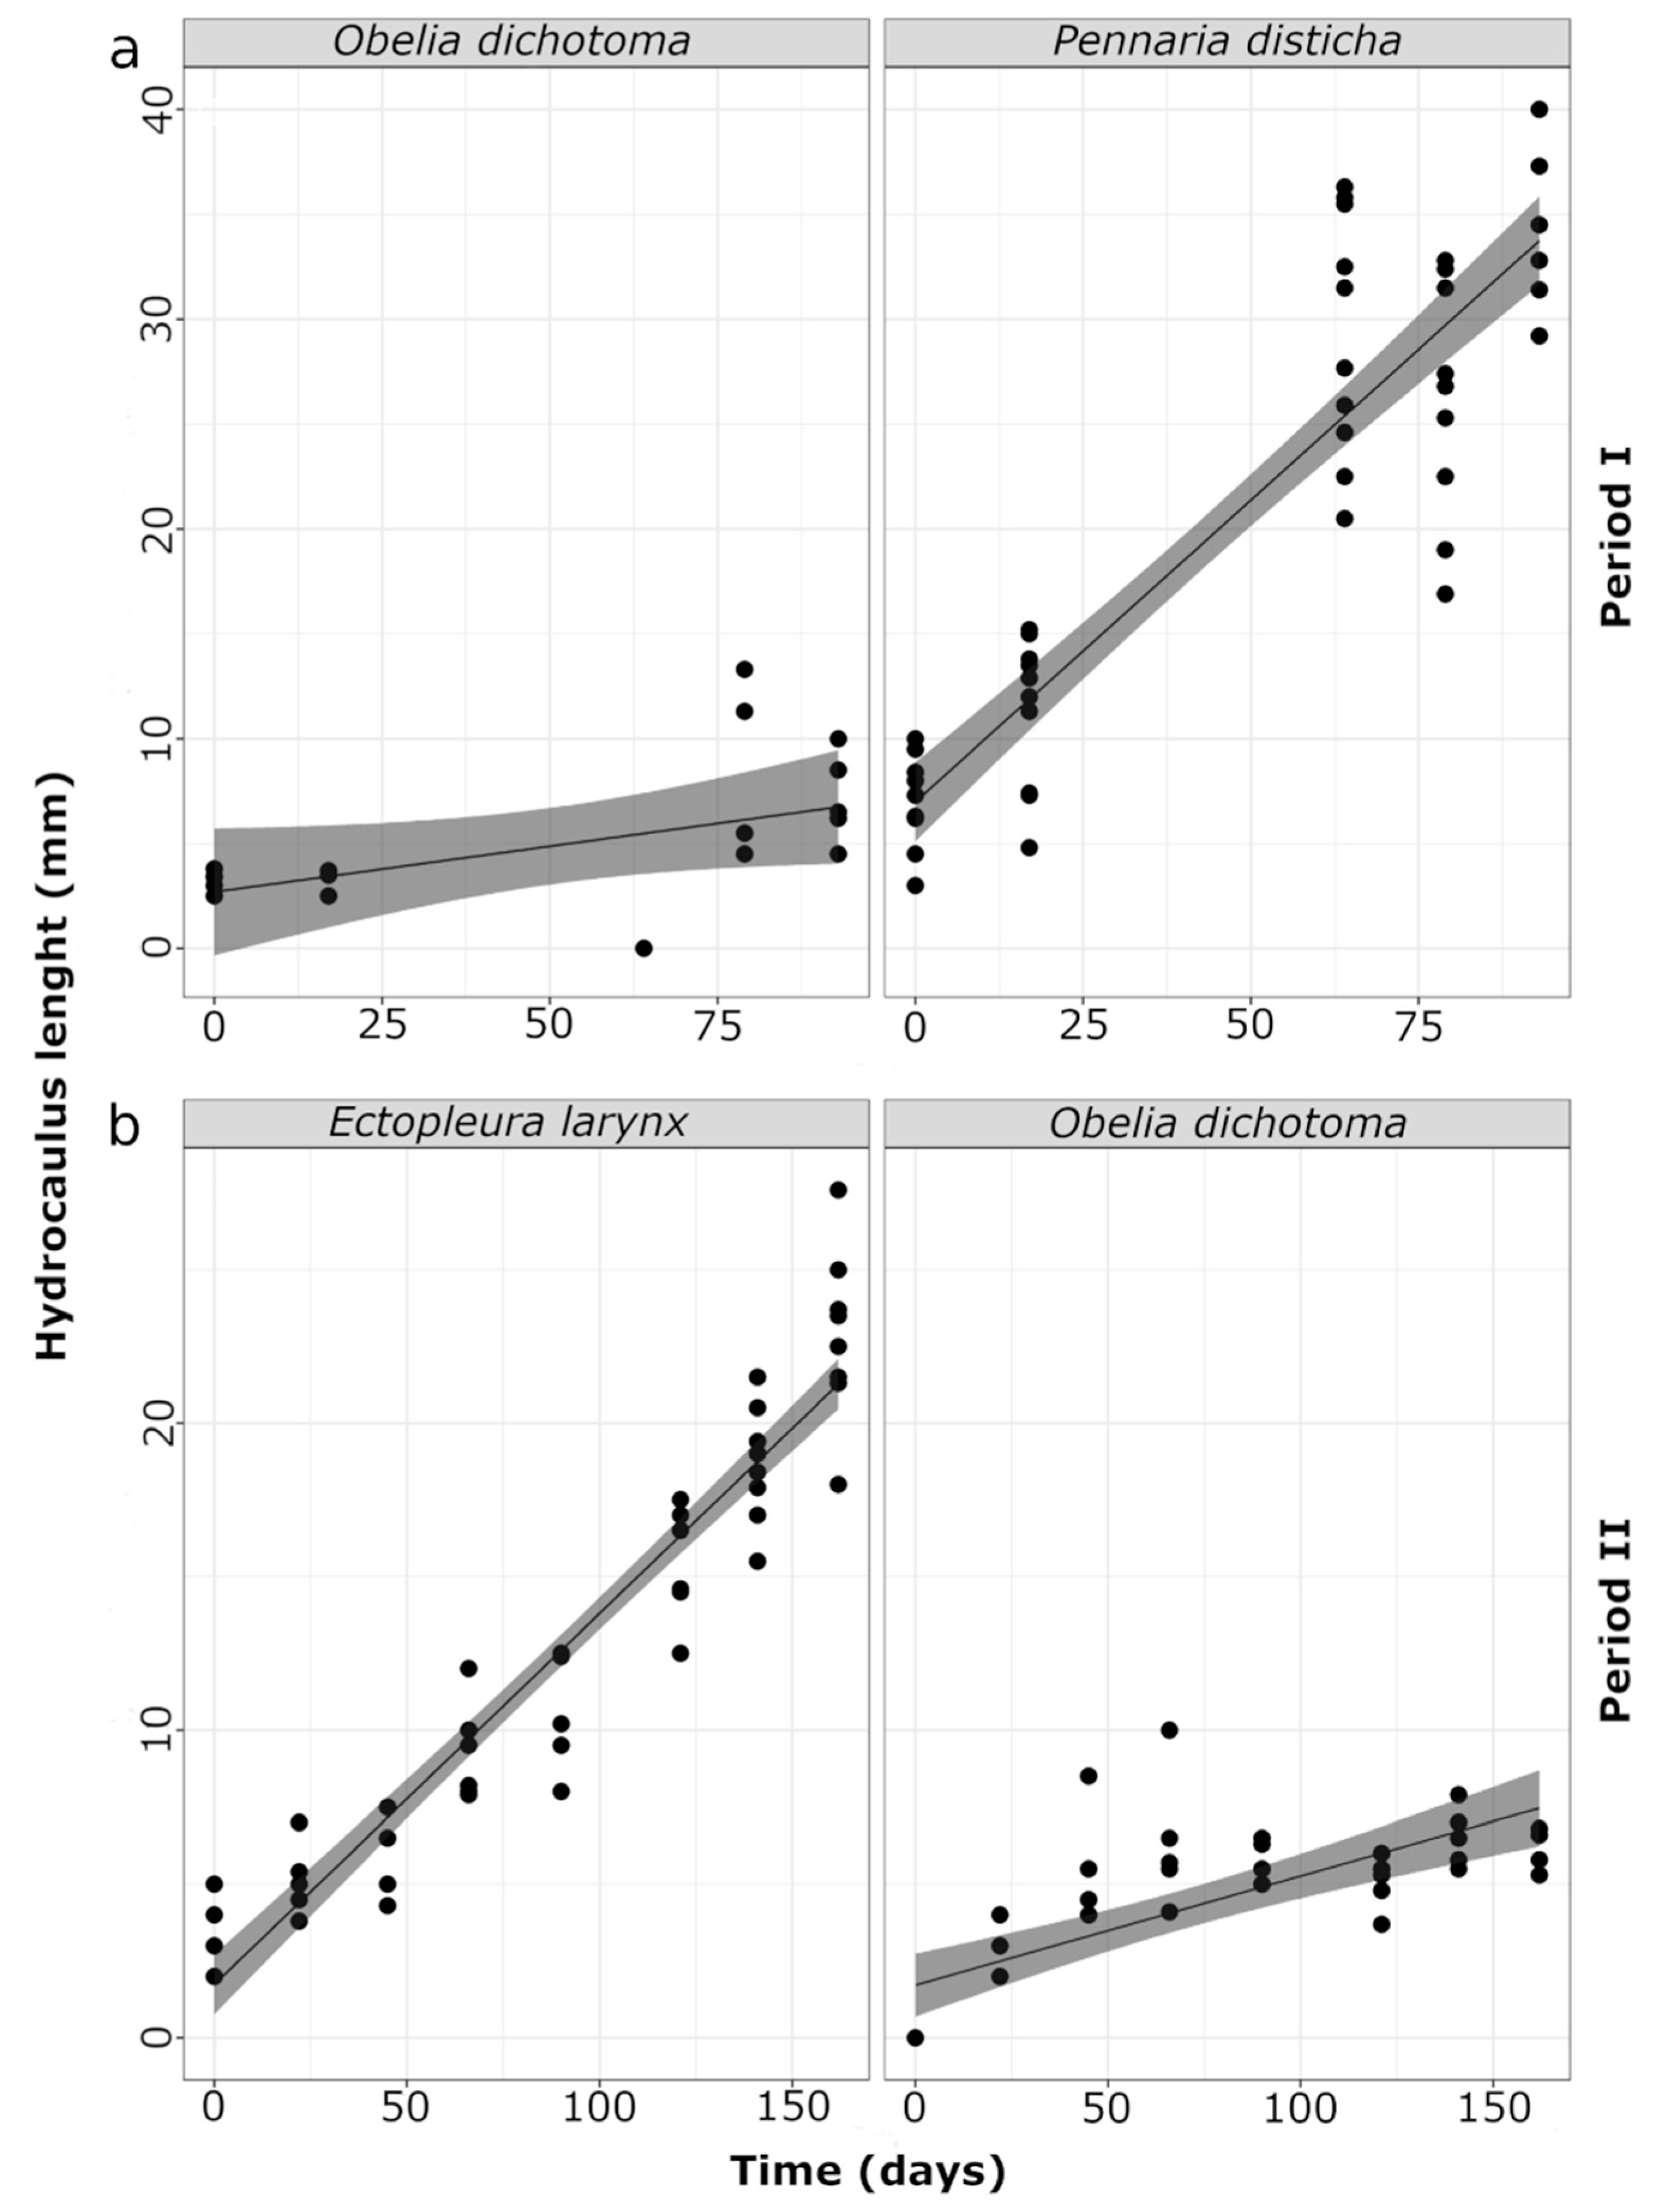
3.2. Hydroids and Colony Growth Rates

Seven species of colonial hydroids were identified on the experimental panels throughout the two monitoring periods, four Anthothecata and three Leptothecata species already described for the Mediterranean fauna [25] (Table 3). Recorded species were P. disticha, O. dichotoma and Halecium pusillum (Period I) and E. larynx, O. dichotoma, Coryne prolifera, Sertularella ellisii and Eudendrium racemosum (Period II). Colonial hydroid biomass differed significantly between periods (F(1,35) = 28.818, p = 0.001). Due to the occurrence of large P. disticha colonies, hydroid biomass was higher in the first period, while species richness was higher during the second one. Overall, E. larynx and P. disticha were the most abundant hydroids.
Differences in hydroid growth rates, expressed as hydrocaulus length, were evaluated by two different Multiple Regression Linear models (M1, M2—see materials and methods section) in each period (Table 4) to clarify if the regression describing the daily hydroid-specific growth rate (hydrocaulus length day−1) was significant and whether it was different between species.
According to the protocol proposed by Burnham and Anderson [26], M1 was selected as the best model since it showed the lower value of Akaike’s Information Criterion (AIC) and higher R-squared value, in both experimental periods. Afterwards, model validation was performed by checking the homogeneity, normality and no trend in residuals for each variable.
Growth equations for the first period were:
O. dichotoma hydrocaulus length = 2.7 + 0.04 day
P. disticha hydrocaulus length = 7 + 0.29 day
ANCOVA test was used since the selected model consisted of a continuous (time) and a categorical (species) variables. As shown in Table 5, the interaction between factors species and time was significant (F (1,68) = 69.834, p = 4.932−12), then the assumption of HOS was violated, and a Johnson–Neyman procedure (J–N) was used to check the range of the continuous variable “time” (axis X of Figure 3a) in which the growth rate was equal for both species. The analysis showed that the lower range value was −39.13 and the upper one was −3.32. Since this time interval is not part of the time span considered in the study we can conclude that the two species had significant and different growth rate for all the duration of Period I, specifically, P. disticha growth was 0.29 mm d−1, while O. dichotoma was 0.04 mm d−1 (Figure 3a).
Growth equations for the second period were:
O. dichotoma hydrocaulus length = 1.7 + 0.04 day
E. larynx hydrocaulus length = 1.7 + 0.12 day
As for the first period, in the second period the interaction between factors was significant (F (1,104) = 135.55, p = 2.2−16) (Table 5), then the assumption of HOS was violated, and a Johnson–Neyman procedure (J–N) was used to check the range of continuous variable in which the growth rate was equal for the two species. The lower value was −109.89 and the upper value was −17.64, so we concluded that the two species had a significant different growth rate for all the duration of Period II, specifically, E. larynx growth was 0.12 mm d−1, while O. dichotoma growth rate was 0.04 mm d−1, which was the same rate as in Period I (Figure 3b).
Reproductive stages of P. disticha were observed from September to November (Figure 4). Significant differences among maturation stages over time were observed (X3 = 10.807, p = 0.0128). A post-hoc Dunn test showed significant differences between Pennaria maturation stages values found in November and September–October (Z = −3.1, p = 0.001 and Z = −2.2, p = 0.027, respectively; Figure 5a). Even if mature eumedusoids were observed attached to hydranths, their density in zooplankton samples was low (1.6 ± 0.4 individuals m−3 in October 2013) (Figure 5a).
Mature gonophores of E. larynx were recorded from March to May 2014. Significant differences in maturation were observed over time (X2 = 6.699, p = 0.0351), although maturation stages from 0 to 4 were observed at all sampling times (Figure 6). A post-hoc Dunn test showed significant differences between E. larynx maturation values found in March and May (Z = −2.5, p = 0.009; Figure 5b). Zooplankton samples from March to June contained several free actinulae larva of E. larynx (Figure 5b). Likewise, hydromedusae of O. dichotoma were recorded during the entire monitoring period at low densities, but no gonothecae were observed over the sampled periods.

4. Discussion

Biomass and community composition of biofouling on aquaculture cages changed with time and between study periods, showing intense seasonality in fouling colonization. The biofouling community was mainly dominated by algae and benthic crustaceans. Fry cages did not have serious problems with M. galloprovincialis settlement, even at high densities due to small individual mussel size (low biomass).
Hydroids were present over the complete monitoring period. O. dichotoma (both stages, polyp and medusa) was the only hydroid species recorded throughout the two periods of investigation, while the other six species showed marked seasonality. The lack of hydroid colonizers at the beginning of the first period could be attributed to a “summer impoverishment”, which is a typical seasonal pattern in the Mediterranean coasts during the summer period, when hydrozoans disappear, leaving only the dormant basal stolon [27,28].
Until recently, cnidarians were not considered as possible harmful agent for aquaculture, and low levels of mortality and unspecific gill pathology of unknown aetiology were generally attributed to waterborne irritant damage [29]. The misinformation of aquaculture facilities together with the inconspicuous character of these organisms, lead to underrate the potential damage that jellyfish and polyps could inflict on aquaculture facilities.
Indeed, negative consequences of interactions between gelatinous zooplankton and caged fish have been documented several times in the North Sea where blooms of various species caused farmed fish mortality events in the last ten years [30,31]. These events are usually attributed to large scyphozoans, such as Pelagia noctiluca, but also pelagic hydrozoans (Phialella quadrata, Apolemia uvaria and Muggiaea atlantica) have been responsible of mass fish mortalities in different mariculture facilities [13,14,31,32,33]. In addition, several hydroids, including E. larynx and P. disticha have been identified as potentially harmful fouling species to farmed fish [3,14]. Both hydroid species were the most abundant hydroids in sampled panels, with P. disticha providing a significant biomass contribution (13%) to total fouling biomass, with a colony growth rate up to 0.29 mm day−1, i.e., higher than the pernicious Asian green mussel Perna viridis, one of the most detrimental fouling organism in aquaculture (0.23 mm day−1) [34]. Also E. larynx showed fast growth, increasing colony length by 0.12 mm day−1. Conversely, the small campanulariid hydroid O. dichotoma showed constant growth rates during both periods (0.04 mm day−1).
High colony growth rate is usually a common feature of hydroids characterized by seasonal, high invasiveness (or bioinvasion potential), such as the euryhaline hydroid Cordylophora spp. [35] occurring in both freshwater and brackish water habitats, with significant negative impact as seasonal habitat formers or key species of biofouling assemblages on artificial substrates, including water pipelines and tunnels of power and desalination plants [36,37,38]. These large-sized species are also characterized by robust, stolonial hydrorhizal systems acting as seasonal resting stages, reservoirs of undifferentiated stem cells and energy storage to boost, even in absence of settlement of new propagules, rapid regeneration and fast growth of large colonies under optimal environmental conditions [39]. In the Mediterranean Sea, the occurrence of E. larynx and P. disticha, two opportunistic species with opposite thermal affinity—with E. larynx proliferating across the cold season and P. disticha blooming throughout the warmer months—together produce a consistent impact on marine aquaculture facilities over the year, hindering effective management of biofouling on fish cages. Moreover, actinulae larvae of E. larynx—armed with cnidocytes, too—were identified in zooplankton samples at high densities in Period II. According to Carl et al. [40], species from the genus Ectopleura have high reproduction rates and under stress conditions can release high number of actinulae.
The effects of P. disticha colonies on farmed fish health so far have not been studied in detail. Seasonally its polyp colonies reach large sizes on mariculture cages, and comparably to Ectopleura spp., P. disticha may cause damage to cultured fish by nematocyte discharge following direct contact with the large, feather-like polyp colonies. Also, sexual reproduction occurs by the release of free-living gonophores (eumedusoids), i.e., modified polyps bearing large defensive cnidocytes that will swarm in the water column, and drift amidst caged fish, during late summer and early autumn months.
To our knowledge, this is the first study focusing on the hydroid community composition and reproduction within seasonal fouling assemblages growing on Mediterranean aquaculture cages. We are aware of the temporal and spatial limits of the present study, referring to the fouling community on a single aquaculture farm in the western Mediterranean Sea, which has been investigated for a single annual cycle. However, the hydrozoan fauna of the Mediterranean Sea is one of the best investigated in the world [25] (and references therein). Overall, the most Mediterranean marine life exhibits a sharp functional seasonality in terms of life strategy (absence vs. presence) or life cycle (asexual vs. sexual reproduction) [41,42,43,44]. The existing knowledge on the structure and composition of the rocky bottom hydroid community across the Mediterranean Sea [25] therefore corroborates the successional pattern observed by this study, so suggesting a wider applicability of its results.
The information collected by this work may support implementation of targeted mitigation measures or adjustment of standard cleaning practices of farm cages and submerged infrastructures, to minimize/prevent settlement and fast proliferation of potentially harmful biofoulers and reduce risks to fish health. For instance, in the Águilas fish farm fingerlings of 15–20 g are transferred in open water sea cages in spring and autumn months (April–May; October–November). These two periods coincide with seasonal plankton blooms as well as with stinging hydroid reproductive periods leading to their outburst in the fouling community. In order to predict future trends and anticipate possible effects of climate change, fish farms might plan the implementation of pilot-scale experimental rearing starting in slightly different periods, e.g., with an anticipation or retardation of 2–4 weeks in the introduction of fish fry, to identify successional patterns with reduced fouling development or to prevent threats to fish health.
However, optimal cleaning time and procedures might be carefully designed at each fish farm according to local environmental and hydrological features and based on the knowledge of the specific composition, life history and threatening potential of the components of the fouling community. For instance, careful definition of the temporal schedule of net deployment into the water or of cleaning procedures should be carried out when venomous organisms or other threatening species are unlikely to be present or active. This may result into an effective impact on the seasonal fouling biodiversity and successional states, eventually leading to a higher sustainability of fish cage aquaculture.

Author Contributions

M.B.-B., V.L.F. and S.P. conceived and designed the experiments; M.B.-B. and A.E. performed the experiments and analyzed the samples; M.B.-B., G.M. and S.P. analyzed the data; V.L.F. and S.P. contributed reagents/materials/analysis tools; M.B.-B., G.M. and S.P. wrote the paper; all authors reviewed and edited the manuscript.

Funding

This work has received funding from the European Union’s projects MED-JELLYRISK (grant n. I-A/1.3/098 - ENPI CBCMED programme), VECTORS (Vectors of Change in Oceans and Seas Marine Life, Impact on Economic Sectors, grant n. 266445, FP7th programme), and CERES (Climate Change and European Aquatic Resources, grant n. 678193, Horizon 2020 programme).

Acknowledgments

We wish to thank Mariló López, M. Carmen Marín and all fish farm staff for their availability and excellent assistance during samplings. Furthermore, we are especially grateful to Jennifer E. Purcell for critical revision on the manuscript. Finally, we would like to thank two anonymous reviewers, whose comments greatly improved this manuscript.

Conflicts of Interest

The authors declare no conflict of interest.

Ethical Statement

The collected species were all fouling invertebrates settled on the monitoring panels. Animals were sampled under aquaculture facility consent and supervision. All international, national, and/or institutional guidelines for the care and use of animals were followed.

References

  1. Bi, C.-W.; Zhao, Y.-P.; Dong, G.-H.; Wu, Z.-M.; Zhang, Y.; Xu, T.-J. Drag on and flow through the hydroid-fouled nets in currents. Ocean Eng. 2018, 161, 195–204. [Google Scholar] [CrossRef]
  2. Braithwaite, R.A.; McEvoy, L.A. Marine biofouling on fish farms and its remediation. Adv. Mar. Biol. 2005, 47, 215–252. [Google Scholar] [PubMed]
  3. Baxter, E.J.; Sturt, M.M.; Ruane, N.M.; Doyle, K.; Mcallen, R.; Rodger, H.D. Biofouling of the hydroid Ectopleura larynx on aquaculture nets in Ireland: Implications for finfish health. Fish Vet. J. 2012, 13, 17–29. [Google Scholar]
  4. Bloecher, N.; Olsen, Y.; Guenther, J. Variability of biofouling communities on fish cage nets: A 1-year field study at a Norwegian salmon farm. Aquaculture 2013, 416–417, 302–309. [Google Scholar] [CrossRef]
  5. Greene, J.K.; Grizzle, R.E. Successional development of fouling communities on open ocean aquaculture fish cages in the western Gulf of Maine, USA. Aquaculture 2007, 262, 289–301. [Google Scholar] [CrossRef]
  6. Fitridge, I.; Dempster, T.; Guenther, J.; de Nys, R. The impact and control of biofouling in marine aquaculture: A review. Biofouling 2012, 28, 649–669. [Google Scholar] [CrossRef] [PubMed]
  7. Fitridge, I.; Keough, M.J. Ruinous resident: The hydroid Ectopleura crocea negatively affects suspended culture of the mussel Mytilus galloprovincialis. Biofouling 2013, 29, 119–131. [Google Scholar] [CrossRef] [PubMed]
  8. Fernandez-Gonzalez, V.; Sanchez-Jerez, P. Fouling assemblages associated with off-coast aquaculture facilities: An overall assessment of the Mediterranean Sea. Mediterr. Mar. Sci. 2017, 18, 87–96. [Google Scholar] [CrossRef]
  9. Leblanc, A.; Landry, T.; Miron, G. Fouling organisms of the blue mussel Mytilus edulis: Their effect on nutrient uptake and release. J. Shellfish Res. 2003, 22, 633–638. [Google Scholar]
  10. Martell, L.; Bracale, R.; Carrion, S.A.; Purcell, J.E.; Lezzi, M.; Gravili, C.; Piraino, S.; Boero, F. Successional dynamics of marine fouling hydroids (Cnidaria: Hydrozoa) at a finfish aquaculture facility in the Mediterranean Sea. PLoS ONE 2018, 13, e0195352. [Google Scholar]
  11. Guenther, J.; Misimi, E.; Sunde, L.M. The development of biofouling, particularly the hydroid Ectopleura larynx, on commercial salmon cage nets in Mid-Norway. Aquaculture 2010, 300, 120–127. [Google Scholar] [CrossRef]
  12. Bosch-Belmar, M.; Azzurro, E.; Pulis, K.; Milisenda, G.; Fuentes, V.; Kéfi-Daly Yahia, O.; Micallef, A.; Deidun, A.; Piraino, S. Jellyfish blooms perception in Mediterranean finfish aquaculture. Mar. Policy 2017, 76, 1–7. [Google Scholar] [CrossRef]
  13. Baxter, E.J.; Rodger, H.D.; McAllen, R.; Doyle, T.K. Gill disorders in marine-farmed salmon: Investigating the role of hydrozoan jellyfish. Aquac. Environ. Interact. 2011, 1, 245–257. [Google Scholar] [CrossRef]
  14. Bosch-Belmar, M.; Milisenda, G.; Girons, A.; Taurisano, V.; Accoroni, S.; Totti, C.; Piraino, S.; Fuentes, V. Consequences of Stinging Plankton Blooms on Finfish Mariculture in the Mediterranean Sea. Front. Mar. Sci. 2017, 4, 240. [Google Scholar] [CrossRef]
  15. Östman, C.; Piraino, S.; Kem, W. Nematocysts of the Mediterranean hydroid Halocordyle disticha. Hydrobiologia 1991, 216–217, 607–613. [Google Scholar] [CrossRef]
  16. Östman, C.; Myrdal, M.; Nyvall, P.; Lindström, J.; Segura, A.A. Nematocysts in Tubularia larynx (Cnidaria, Hydrozoa) from Scandinavia and the northern coast of Spain. Sci. Mar. 1995, 59, 165–179. [Google Scholar]
  17. Tezcan, Ö.D.; Sarp, S. An unusual marine envenomation following a rope contact: A report on nine cases of dermatitis caused by Pennaria disticha. Toxicon 2013, 61, 125–128. [Google Scholar] [CrossRef]
  18. Di Camillo, C.G.; Giordano, G.; Bo, M.; Betti, F.; Mori, M.; Puce, S.; Bavestrello, G. Seasonal patterns in the abundance of Ectopleura crocea (Cnidaria: Hydrozoa) on a shipwreck in the Northern Adriatic. Mar. Ecol. 2013, 34, 25–32. [Google Scholar] [CrossRef]
  19. Boero, F.; Brotz, L.; Gibbons, M.; Piraino, S.; Zampardi, S. Ocean Warming 3.10 Impacts and Effects of Ocean Warming on Jellyfish. In Explaining Ocean Warming: Causes, Scale, Effects and Consequences; Laffoley, D., Baxter, J.M., Eds.; IUCN: Gland, Switzerland, 2016; p. 460. [Google Scholar]
  20. Schuchert, P. The European athecate hydroids and their medusae (Hydrozoa, Cnidaria): Capitata Part 1. Rev. Suisse Zool. 2006, 113, 337–555. [Google Scholar] [CrossRef]
  21. Allman, G.J. A monograph of the gymnoblastic or tubularian hydroids. In Conclusion of Part I, and Part II, Containing Descriptions of the Genera and Species of Gymnoblastea; Ray Society: London, UK, 1872; pp. 155–450. [Google Scholar]
  22. Schuchert, P. The European athecate hydroids and their medusae (Hydrozoa, Cnidaria): Capitata Part 2. Rev. Suisse Zool. 2010, 117, 337–555. [Google Scholar] [CrossRef]
  23. Clarke, K.R. Non-parametric multivariate analyses of changes in community structure. Aust. J. Ecol. 1993, 18, 117–143. [Google Scholar] [CrossRef]
  24. R Core Team. R: A Language and Environment for Statistical Computing; R Foundation for Statistical Computing: Vienna, Austria, 2019. [Google Scholar]
  25. Bouillon, J.; Medel, M.D.; Pagès, F.; Gili, J.-M.; Boero, F.; Gravili, C. Fauna of the Mediterranean Hydrozoa. Sci. Mar. 2004, 68, 5–438. [Google Scholar] [CrossRef]
  26. Burnham, K.P.; Anderson, D.R. Model Selection and Multimodel Inference: A Practical Information—Theoretic Approach, 2nd ed.; Springer: New York, NY, USA, 2002. [Google Scholar]
  27. Bavestrello, G.; Puce, S.; Cerrano, C.; Zocchi, E.; Boero, N. The problem of seasonality of benthic hydroids in temperate waters. Chem. Ecol. 2006, 22, S197–S205. [Google Scholar] [CrossRef]
  28. González-Duarte, M.M.; Megina, C.; Piraino, S.; Cervera, J.L. Hydroid assemblages across the Atlantic-Mediterranean boundary: Is the Strait of Gibraltar a marine ecotone? Mar. Ecol. 2013, 34, 33–40. [Google Scholar] [CrossRef]
  29. Marcos-López, M.; Mitchell, S.O.; Rodger, H.D. Pathology and mortality associated with the mauve stinger jellyfish Pelagia noctiluca in farmed Atlantic salmon Salmo salar L. J. Fish Dis. 2016, 39, 111–115. [Google Scholar] [CrossRef]
  30. Doyle, T.K.; De Haas, H.; Cotton, D.; Dorschel, B.; Cummins, V.; Houghton, J.D.R.; Davenport, J.; Hays, G.C. Widespread occurrence of the jellyfish Pelagia noctiluca in Irish coastal and shelf waters. J. Plankton Res. 2008, 30, 963–968. [Google Scholar] [CrossRef]
  31. Purcell, J.E.; Baxter, E.J.; Fuentes, V.L. Jellyfish as Products and Problems of Aquaculture. In Advances in Aquaculture Hatchery Technology; Allan, G., Burnell, G., Eds.; Woodhead Publishing: Oxford, UK, 2013; pp. 404–430. ISBN 9780857097460. [Google Scholar]
  32. Båmstedt, U.; Fosså, J.H.; Martinussen, M.B.; Fosshagen, A. Mass occcurrence of the physonect siphophore Apolemia Uvaria (Lesueur) in Norwegian waters. Sarsia 1998, 83, 79–85. [Google Scholar] [CrossRef]
  33. Mitchell, S.O.; Rodger, H.D. A review of infectious gill disease in marine salmonid fish. J. Fish Dis. 2011, 34, 411–432. [Google Scholar] [CrossRef]
  34. Rajagopal, S.; Venugopalan, V.P.; Nair, K.V.K.; van der Velde, G.; Jenner, H.A.; den Hartog, C. Reproduction, growth rate and culture potential of the green mussel, Perna viridis (L.) in Edaiyur backwaters, east coast of India. Aquaculture 1998, 162, 187–202. [Google Scholar] [CrossRef]
  35. Folino-Rorem, N.C.; Renken, C.J. Effects of salinity on the growth and morphology of the invasive, euryhaline hydroid Cordylophora (Phylum Cnidaria, Class Hydrozoa). Invertebr. Biol. 2018, 137, 78–90. [Google Scholar] [CrossRef]
  36. Piraino, S.; Fanelli, G. Keystone Species: What Are We Talking About? Conserv. Ecol. 1999, 3, 10–12. [Google Scholar] [CrossRef]
  37. Piraino, S.; Fanelli, G.; Boero, F. Variability of species’ roles in marine communities: Change of paradigms for conservation priorities. Mar. Biol. 2002, 140, 1067–1074. [Google Scholar]
  38. Folino-Rorem, N.C. Phylum Cnidaria. In Ecology and General Biology: Thorp & Covich’s Freshwater Invertebrates; Thorp, J., Rogers, D.C., Eds.; Academic Press: San Diego, CA, USA, 2015; pp. 159–179. [Google Scholar]
  39. Boero, F.; Bouillon, J.; Piraino, S.; Schmid, V. Asexual Reproduction in the Hydrozoa (Cnidaria). In Reproductive Biology of Invertebrates—Progress in Asexual Reproduction; Hughes, R.N., Ed.; Oxford & IBH Publishing: New Delhi, India, 2002; pp. 141–158. ISBN 0471489689. [Google Scholar]
  40. Carl, C.; Guenther, J.; Sunde, L.M. Larval release and attachment modes of the hydroid Ectopleura larynx on aquaculture nets in Norway. Aquac. Res. 2011, 42, 1056–1060. [Google Scholar] [CrossRef]
  41. Boero, F. Fluctuations and variations in coastal marine environments. Mar. Ecol. 1994, 15, 3–25. [Google Scholar] [CrossRef]
  42. Boero, F.; Belmonte, G.; Fanelli, G.; Piraino, S.; Rubino, F. The continuity of living matter and the discontinuities of its constituents: Do plankton and benthos really exist? Trends Ecol. Evol. 1996, 11, 177–180. [Google Scholar] [CrossRef]
  43. Boero, F.; Bouillon, J.; Gravili, C.; Piraino, S. Who cares about the Hydrozoa of the Mediterranean Sea? An essay on the zoogeography of inconspicuous groups. Biogeographia 2003, 24, 101–113. [Google Scholar] [CrossRef]
  44. Boero, F.; Bouillon, J.; Gravili, C.; Miglietta, M.P.; Parsons, T.; Piraino, S. Gelatinous plankton: Irregularities rule the world (sometimes). Mar. Ecol. Prog. Ser. 2008, 356, 299–310. [Google Scholar] [CrossRef]
Figure 1. Richness, total fouling biomass and temperature for both monitoring periods at the Águilas facility. Period I: May to November 2013; Period II: November 2013 to June 2014. Grey vertical bars on the figure indicate the start of monitoring for both periods.
Jmse 07 00288 g001
Figure 2. Biomass percentage by groups at the monitored aquaculture facility. Period I: May to November 2013 (a); Period II: November 2013 to June 2014. Arrows indicate Mollusca biomass (<1%) (b).
Jmse 07 00288 g002
Figure 3. Variance of hydroid growth (as hydrocaulus length) over time (monitoring days) for Obelia dichotoma and Pennaria disticha during the first period (a) and O. dichotoma and Ectopleura larynx during the second period (b) at the monitored facility (Period I: May to November 2013; Period II: November 2013 to June 2014).
Jmse 07 00288 g003
Figure 4. Growth and development of Pennaria disticha hydroid at the monitored facility: (A) P. disticha colonies on a cage rope; (B) developing polyps of sampled panels; (C) a hydranth with a growing eumedusoid (Eu); and (D) a free eumedusoid after release.
Jmse 07 00288 g004
Figure 5. Maturation stage of hydroid colonies sexual reproductive structures and density of released Pennaria disticha eumedusoids (a) and Ectopleura larynx actinulae larvae (b). Left Y axis correspond with the maturation score (MS in the legend); right Y axis refer to eumedusoids and actinulae larvae densities (individuals m−3) recorded in the zooplankton samples. Note the different scale in the Y axis.
Jmse 07 00288 g005
Figure 6. Growth and development of an Ectopleura larynx hydroid: (A) polyp colonies settled in monitoring panels; (B) E. larynx mature polyp with gonophores (Go); (C) developing gonophore with visible spadix (Sp) and tubercules (Tu); (D) actinulae larvae (Ac) inside gonophore with developed tentacles (Te); and (E) actinulae larvae after release from the gonophore.
Jmse 07 00288 g006
Table 1. Stages of gonophores development of the hydroids Ectopleura larynx and Pennaria disticha. Based on Schuchert (2006, 2010) and Allman (1872) [20,21,22].
Stage of Development Ectopleura larynxPennaria disticha
0No reproductive structuresNo reproductive structures
1Small gonophores with no distinct structures fixed as sporosacs above hydranth tentaclesSmall gonophores oblong medusoids arising on short pedicels just above whorl of long filiform tentacles
2Gonophores oval to spherical.
Female gonophores with red spadix that can protrude out of sporosac opening (opening is terminal)
Developed eumedusoid with four radial canals and four marginal bulbs, with small velum, without ocelli, tentacles normally absent
3Mature female gonophores with four tentacle-like tubercles around opening at distal end.
Female sporosacs filled with numerous small cells forming an egg-like mass
Not applicable
4Form of processes very variable, occasionally reduced or absent, but usually increase in size with the enlarging gonophores.
Visible developed actinula inside the sporosac
Not applicable
Table 2. SIMPER analysis on biofouling community composition at the Águilas fish farm.
SpeciesAverage Period IAverage Period IIContribution %Cumulative %
Anthozoa0.32021.8221.82
Nemertea0.07018.5440.36
Polychaeta0.005017.3157.68
Mollusca0.0060.1716.6674.34
Hydrozoa0.810.1815.0889.42
Table 3. Fouling organisms on experimental net panels recorded at 8 sampling times (t) during each monitoring period. Period I: May to November 2013, t1–t8; Period II: November 2013 to June 2014, t9–t16.
Period IPeriod II
t1t2t3t4t5t6t7t8t9t10t11t12t13t14t15t16
Crustacea
S.O. CaprellidaXXX XXXXXXXXXXX
S.O. Gammaridea XXXXXXXXXXXXXXXX
S.O. Tanaidomorpha XXXXXXX
Polychaeta
Fam. NereidaeXXXXXXXX
Fam. Syllidae X X
Nematoda
Unidentified XXXXXXXXXX XX
Nemertea
Unidentified XXXXXXX X
Planaria
Unidentified XXX
Mollusca
Mytilus galloprovincialis XXXXX X XX
Musculus sp. XXX X
Arca sp. X
Irus sp. X
Doto sp. XXXX
Fam. Hiatellidae X
Chlamys sp. X
Briozoa
Or. Cyclostomatida XX
Anthozoa
Or. Actiniaria XXXXXX XXX
Hydrozoa
Pennaria disticha XXXXXX
Halecium pusillum XXXX
Obelia dichotoma X X XX XXXXXXX
Ectopleura larynx XXXXXXXX
Coryne eximia XXXX
Sertularella ellisii X
Eudendrium racemosum X
Echinodermata
Arbacea sp. X
Algae
Ceramium sp. XXXXXX
Antithamnionella sp. XXXXXXX
Polysiphonia sp. XXXXX XXXXXX
Giraudia sp. X
Hincksia sp. XXXXXX
Jania sp. XXXXX
Laurencia sp. X
Trichleocarpa sp. XX XX
Bryopsis sp. (2) XX XXXX
Chaetomorpha sp. XXXX
Cladophora sp. XX
Table 4. Hydroids growth rate models. M1: With factors interaction (species × time); M2: Without interaction (species + time), at two experimental periods (Period I: May to November 2013; Period II: November 2013 to June 2014) at an aquaculture facility on the southern coast of Spain.
PeriodModelAICcpR2
IM14202.2 × 10−160.86
IM24692.2 × 10−160.72
IIM14732.2 × 10−160.92
IIM25612.2 × 10−160.81
Table 5. Multiple Regression Linear Model to test differences in hydroid growth over time and by species at the monitored aquaculture facility: Obelia dichotoma vs. Pennaria disticha during Period I, and O. dichotoma vs. Ectopleura larynx during Period II. (Period I: May to November 2013; Period II: November 2013 to June 2014).
Period IDfSum SqMean SqF ValuePr (>F)
Species13099.93099.9167.787<2.2−16
Time14001.74001.7216.600<2.2−16
Species × time11290.21290.269.8344.932−12
Residuals681256.318.5
Period II
Species11894.251894.25427.25<2.2−16
Time12706.732706.73610.51<2.2−16
Species × time1600.98600.98135.55<2.2−16
Residuals104461.094.43

