Article

Risk Causal Analysis of Traffic-Intensive Waters Based on Infectious Disease Dynamics

1
School of Transportation, Wuhan University of Technology, Wuhan 430063, China
2
National Engineering Research Center for Water Transport Safety, Wuhan University of Technology, Wuhan 430063, China
3
Intelligent Transportation Systems Research Center, Wuhan University of Technology, Wuhan 430063, China
*
Author to whom correspondence should be addressed.
J. Mar. Sci. Eng. 2019, 7(8), 277; https://doi.org/10.3390/jmse7080277
Submission received: 25 June 2019 / Revised: 5 August 2019 / Accepted: 12 August 2019 / Published: 16 August 2019

Abstract

:
Accidents occur frequently in traffic-intensive waters, which restrict the safe and rapid development of the shipping industry. Due to the suddenness, randomness, and uncertainty of accidents in traffic-intensive waters, the probability of the risk factors causing traffic accidents is usually high. Thus, properly analyzing those key risk factors is of great significance to improve the safety of shipping. Based on the analysis of influencing factors of ship navigational risks in traffic-intensive waters, this paper proposes a cloud model to excavate the factors affecting navigational risk, which could accurately screen out the key risk factors. Furthermore, the risk causal model of ship navigation in traffic-intensive waters is constructed by using the infectious disease dynamics method in order to model the key risk causal transmission process. Moreover, an empirical study of the Yangtze River estuary is conducted to illustrate the feasibility of the proposed models. The research results show that the cloud model is useful in screening the key risk factors, and the constructed causal model of ship navigational risks in traffic-intensive waters is able to provide accurate analysis of the transmission process of key risk factors, which can be used to reduce the navigational risk of ships in traffic-intensive waters. This research provides both theoretical basis and practical reference for regulators in the risk management and control of ships in traffic-intensive waters.

1. Introduction

With the rapid development of the shipping industry, the navigation safety of ships has drawn much attention from both academia and industry. The research of navigation safety in the Yangtze River Basin has increased year by year [1]. At the same time, due to the fact that water transportation safety, as part of public safety, is closely related to social stability, groups of experts at home and abroad have conducted certain research in water transportation safety management, education, and technology [2]. At present, with the application and development of new technologies, such as artificial intelligence, ship modernization has been continuously improved, especially in the domains of ship design, ship stability, communication, and navigation equipment [3]. However, the issue of water traffic safety is still a hot topic. Major traffic accidents occur occasionally, which have become the main contributor restricting the long-term development of shipping industries. Therefore, studying the risks of ship navigation in traffic-intensive waters could be helpful to reduce the occurrence of water traffic accidents, improve the level of water traffic supervision, and provide intellectual support for emergency response.
The likelihood of accidents in traffic-intensive waters is relatively high, which deserves more attention. Thus, numerous studies have been conducted in this field. Zhang et al. [4] combined the formal safety assessment (FSA) and Bayesian network (BN) to evaluate the risks of ship navigation in the Yangtze River area. Wu et al. [5] used data envelopment analysis (DEA) to evaluate the safety of water traffic in the state of a dynamic navigation environment. Through the example verification, the conclusion that the safety level and the traffic flow have an inevitable relationship is obtained. In view of the safety hazard caused by the increase of the number of navigable ships, Wen et al. [6] constructed a traffic unit complexity model to evaluate the water traffic conditions, quantified the complexity of the ship traffic flow by simulating the traffic flow risk characteristics, described the congestion degree of navigable ships, and identified potential collision risk factors. In traffic-intensive waters, the risk of congestion is more frequent, which will lead to secondary disasters. In order to control such risks, Zhang et al. [7] identified the key factors affecting the saturation of traffic flow based on the historical data, and used the Bayesian network to predict the probability of congestion in the Yangtze River. In their study, the multi-factor coupling relationships are considered [8,9].
With respect to the analysis of ship navigational risks, Merrick et al. [10] constructed a risk assessment model of ship navigation based on the Bayesian theory, and studied the degree of ship congestion. Mavrakis et al. [11] constructed a ship queuing model based on the characteristics of the Bosphorus and verified the simulation results of traffic flow based on multiple sets of historical data. Pak et al. [12] used the analytic hierarchy process to quantify the shipping risk based on the safety characteristics of ship behaviors in port waters. Faghih-Roohi et al. [13] applied Markov chain Monte Carlo methods to simulate and describe the dynamic risk of ship navigation systems.
With the application of new artificial intelligence algorithms, it has become a trend to study risk mechanisms by using a combination of quantitative data and multidisciplinary approaches. At present, one of the mostly used methods in the mutual conversion between quantitative data and qualitative concepts is cloud models, which can better solve the problem of randomness and fuzzy recognition [14]. Sugumaran et al. [15] used a clustering algorithm to evaluate risk [16], which had the advantages of fast processing speed and high intelligence. Other methods such as fuzzy set theory [17,18,19,20,21], comprehensive safety assessment (CSA) methods [22], accident tree analysis methods [23,24,25], neural networks [26,27], and Gray theory [28,29,30] are also applied to the field of water traffic safety.
In many applications, the infectious disease dynamics model has been a great success in depicting causal relationships. Gu and Xia proposed a new rumor-spreadin susceptible exposed infected recovered (SEIR) model to simulate the evolution process of rumor spreading before and after immunization, and found that the important acquaintance immunization strategy is an optimal scheme to solve the inhibition of rumor spreading in online social networks [31]. Liu et al. extended the SEIR model to analyze the dynamic behaviors of rumor spreading, which also investigated the homepage effect [32]. Kumari and Sharma proposed a new susceptible infected susceptible-type epidemic model to study the impact of environmental pollution on the spread of infectious diseases [33]. The application of the infectious disease dynamics model in causal dynamic analysis provides a new thought-way and probability of risk causal analysis of traffic-intensive waters.
In summary, the research on the risk assessment of ship navigation is mostly conducted independently, which lacks a comprehensive analysis with regard to the quantitative and qualitative aspects of the risk of navigation vessels. However, there are some complex risk factors influencing the ship navigation safety in traffic-intensive waters, which need to be further investigated. To solve the problems, this paper applies the cloud model to screen the key factors affecting the risk of ship navigation, and uses the improved infectious disease dynamics model to analyze the transmission process of key risk factors of ship navigation, in order to provide reference for managers and researchers.

2. Methodology

2.1. Research Framework

Considering that the identification of risk factors of ship navigation is subjective and the research on the transmission of risk factors is still scarce in the current research, this paper proposes a new method to quantitatively analyze the risk factors of ship navigation in traffic-intensive waters and the transmission process of key risk factors by combining the cloud model, entropy weight method, and infectious disease dynamics.
Figure 1 shows the technical route of causal analysis of risks in ship navigation systems in traffic-intensive waters, which consisted of two major steps. In the first step, the cloud model and entropy weight method were used to identify the key factors affecting the risk of navigation systems. The cloud model [34] is especially suitable for complex systems with uncertainty, complexity, and randomness, while the entropy weight method [35] is able to order the parameters in a ship navigation system. The construction of the model is as follows: Firstly, based on the analysis of the characteristics in traffic-intensive waters, risk index systems of ship navigation in traffic-intensive waters was proposed, and then the risk factor data were collected. Moreover, the cloud model was used to mine the risk characteristic parameters of the ship navigation system, and the key factors affecting the risk of ship navigation were selected. Through analyzing the key data by using the entropy method, the correlation data of the risk of ship navigation was obtained. After that, the corresponding correlation values were obtained by sorting the associated data. Finally, the key factors affecting the safety of ship navigation can be determined.
In the second step, the transmission of key risk factors of the ship navigation system was described by using the infectious disease dynamics method. The construction of the model is as follows: Firstly, the membership sequence of risk index was substituted. Based on that, susceptible node, exposed node, infective node, and removal node were introduced into the analysis process of risk causes transmission according to the dynamic mechanism of infectious diseases. Finally, the risk causes transmission analysis model was constructed.

2.2. Screening of Risk Factors in Traffic-Intensive Waters

2.2.1. Traffic-Intensive Waters

Waterborne traffic accidents are characterized by suddenness, randomness, and uncertainty [36]. Ship navigation accidents occur frequently, which is affected by the coupling effect of multiple factors. Therefore, analyzing the characteristics of traffic flow in traffic-intensive waters and identifying the key vulnerability factors affecting the navigation system are conducive to deep-level mining of the causes of navigation system accidents. At present, there is no clear definition of the concept of traffic-intensive waters. It usually refers to the water areas with a large ratio of ship traffic flow to the navigation capacity (saturation) of the channel, including fishing areas, inland river dam areas, intersecting waters, narrow sections, canal sections, and so on. The navigation system in traffic-intensive waters mainly includes the following characteristics:
(1)
High traffic flow and density. This will increase the uncertainties of collision avoidance action of ships in crossing situation, and thus lead to a relatively higher collision risk [37,38].
(2)
When affected by external factors such as meteorological parameters and hydrological parameters, the possibility of accidents is relatively high [39].
(3)
When vessels are sailing in traffic-intensive waters, officer of the watch’s duties and skills are demanded higher [39,40].
(4)
The ship’s front and rear spacing is small, and the shipping line is intricate. Hence, the ship management requirements are higher [39,41].

2.2.2. Risk Factors Affecting Navigation System Safety in Traffic-Intensive Waters

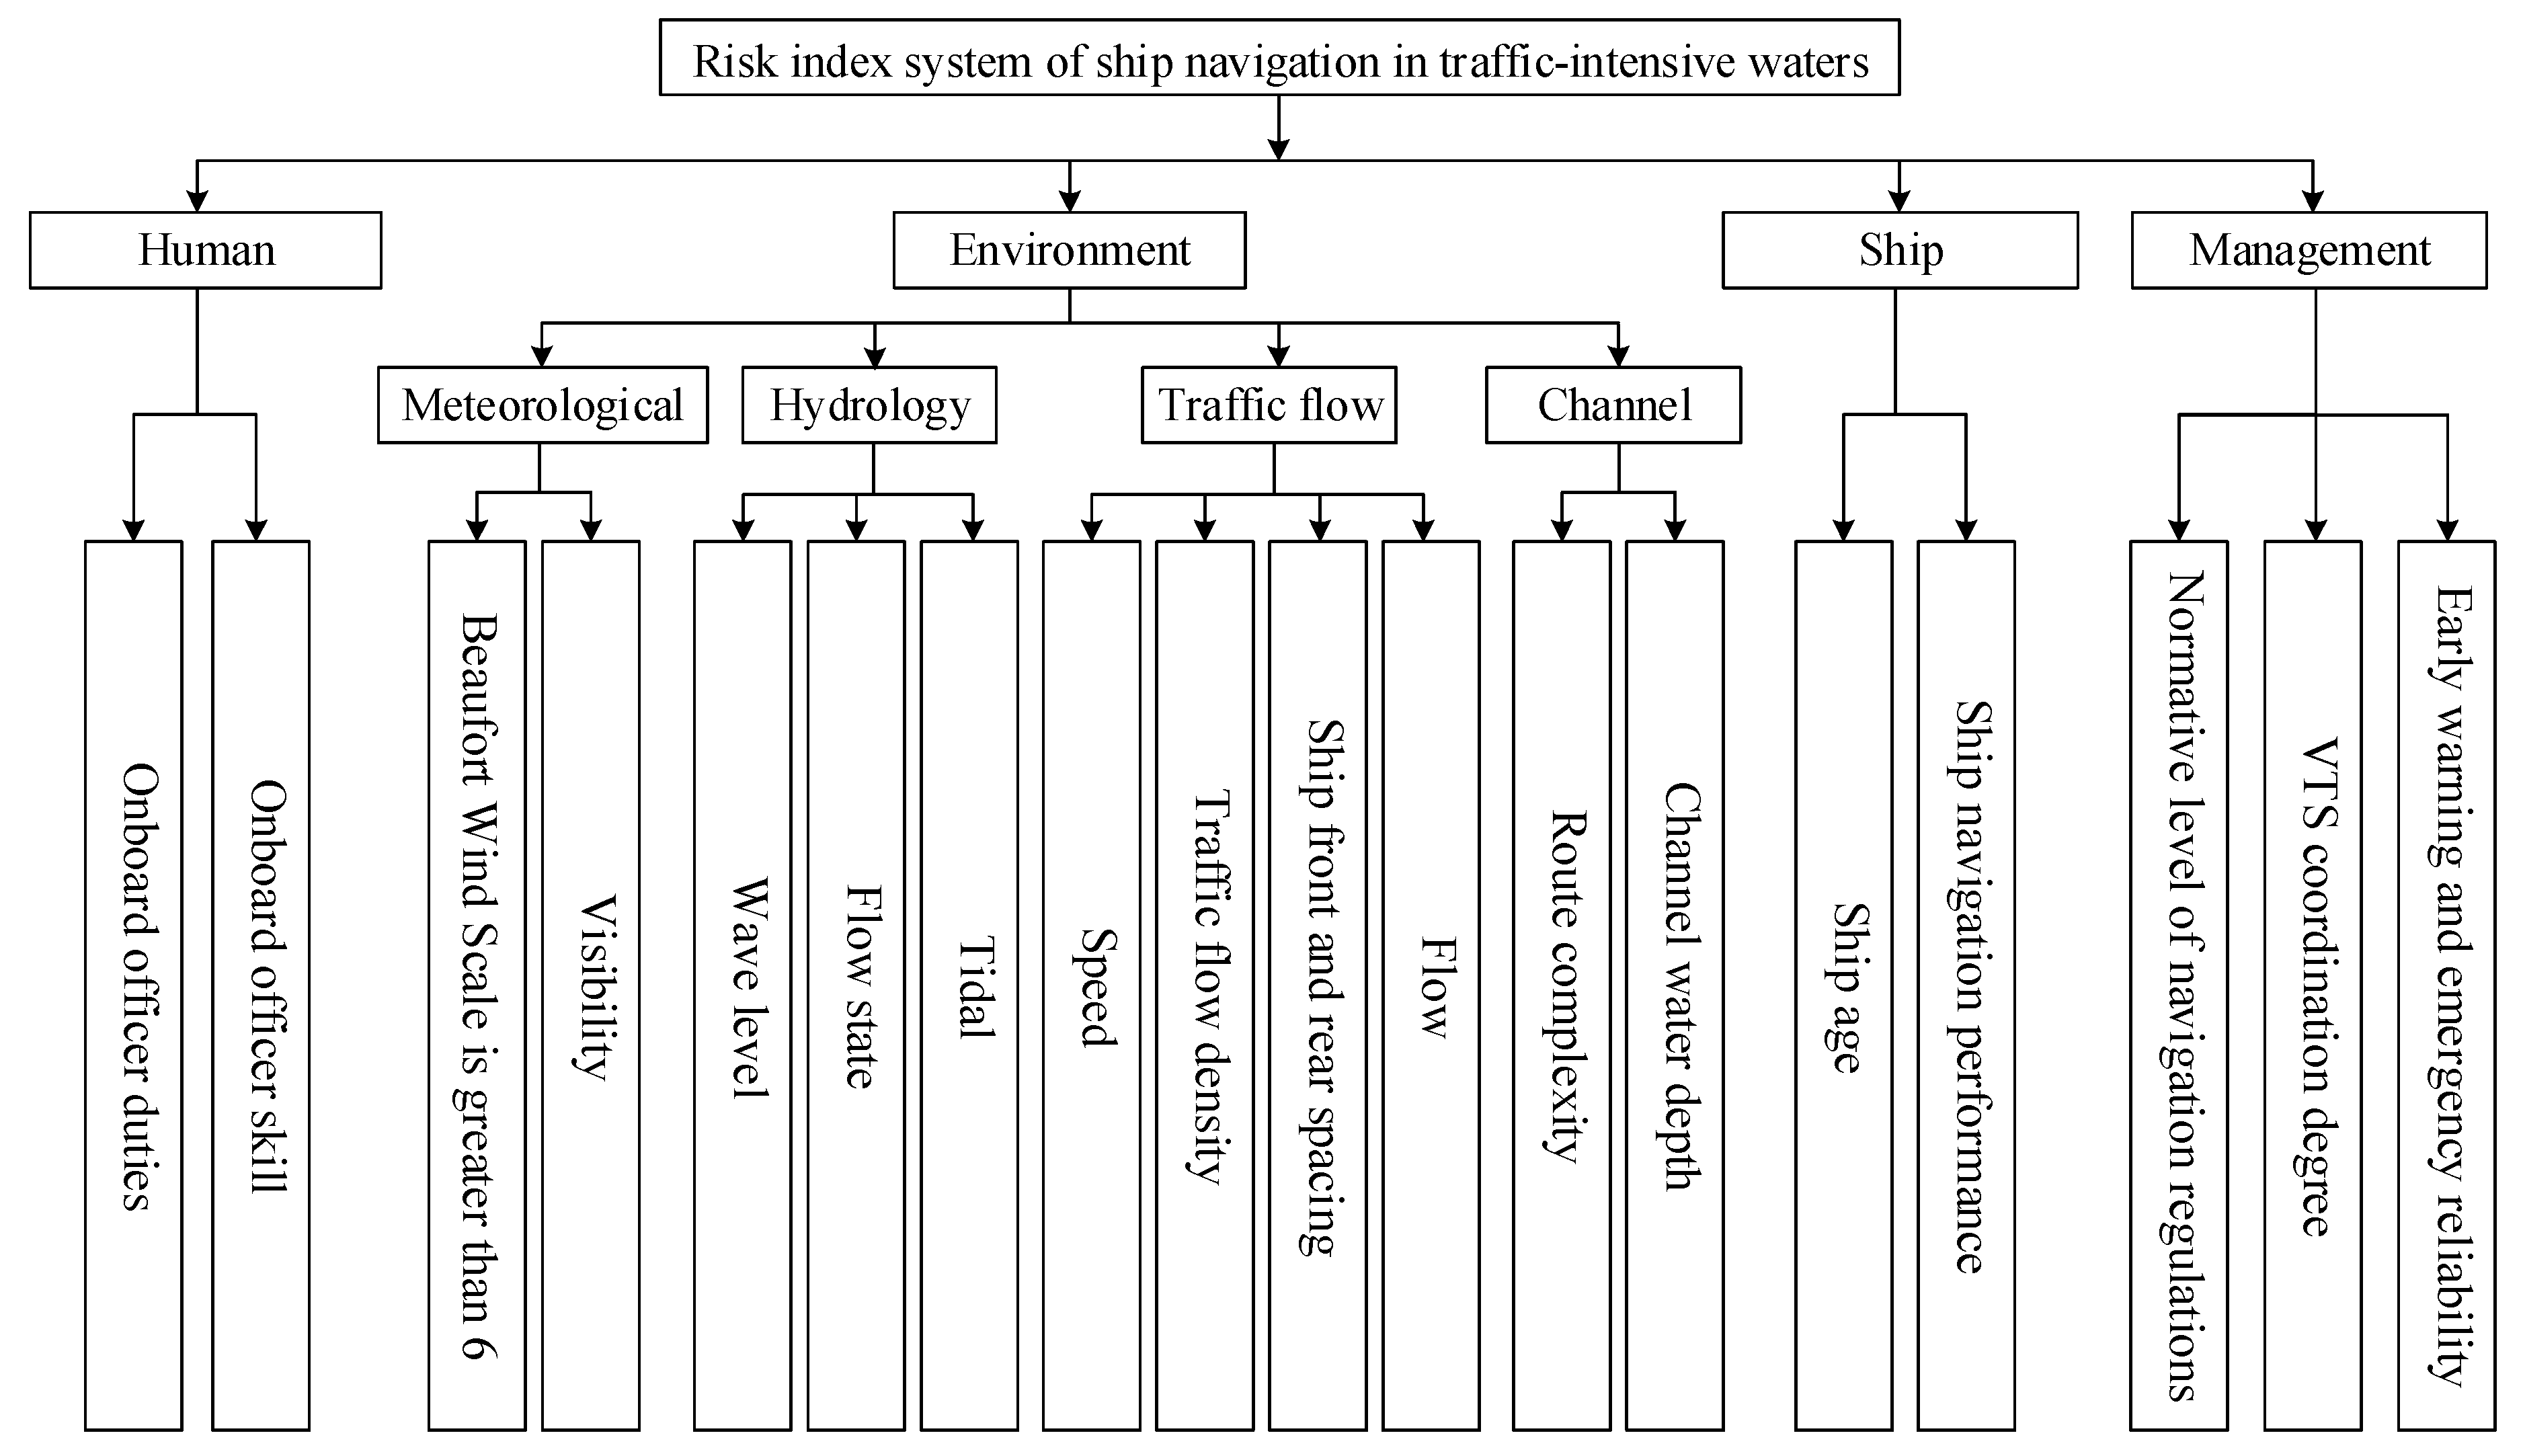
The establishment of the risk indicator system of ship navigation is helpful in better analyzing the relationship between various risk factors. It is also important to support screening of the key risk factors. The “4M” theory of the accident causation theory indicates that the causes of water traffic accidents can be grouped into four categories: man, machine, media, and management [42]. Based on that, the risks of ship navigation in this research are also divided into four categories considering the characteristics in traffic-intensive waters, which are human, environment, ship, and management. The four categories are composed of the following factors with reference to related literature, as shown in Table 1.
According to Table 1, the human factors include onboard officer duties and officer skills. The environmental factors include meteorology, hydrology, navigation channel, and traffic flow. Among them, meteorological factors include Beaufort wind scale of greater than or equal to 6 and visibility; traffic flow factors include speed, traffic flow density, ship front and back spacing, and flow rate; hydrological factors include wave class, fluid state, and tide; the channel factors include route complexity and channel water depth. The ship factors include ship age and ship navigation performance. The management factors include normative level of navigation regulations, VTS (vessel traffic service) coordination degree, early warning, and emergency reliability. Finally, the risk index system of ship navigation in traffic-intensive waters is established, as shown in Figure 2.

2.2.3. Screening of Key Risk Factors

In this paper, the reverse cloud generator cloud model is used to investigate the indexes that affect the navigation safety under different scenarios. According to the characteristics of ship navigation systems in traffic-intensive waters, the cloud model and entropy weight method are used to screen and rank the identified risk factors.
Based on the cloud model, the formula used to measure the risk factor indicators of a ship navigation system is introduced as follows:
Ex = (Bmax + Bmin)/2, En = (Bmax + Bmin)/6, He = kE,
where Bmax and Bmin are the maximum and minimum values of risk factor variables; K is the normalization coefficient.
Let M be the domain [60], and the risk factors of the ship navigation system sets as a quantitative factor, C sets as quantitative on the upper M. Assume that there is a certain amount of factors y, yM, y is a random variable, and the degree of membership of y to C is expressed as m(y) ∈ [0, 1]. Then, the stable random number is:
m : M [ 0 , 1 ] : y M , y m ( y )
In the above formula, y is a distribution cloud on M, and each y corresponds to a cloud drop. The cloud model is divided into a forward cloud and a reverse cloud. Each risk factor is imported into the forward cloud model in ship navigation system. The steps used to perform a cloud model are presented as follows:
(1) Generating a random number, where En is the expected value and He is the standard deviation En’,
f E n ( y ) = 1 2 π H e exp [ ( y E n ) 2 2 H e 2 ] .
(2) Generating a random number y where En’ is the standard deviation and Ex is the expected.
f y ( y ) = 1 2 π [ 0 , 1 ] | E n | exp [ ( y E y ) 2 2 E n 2 ] .
The function of Y is characterized as:
f y ( y ) = f E n ( y ) × f y ( y | E n ) = 1 2 π H e | y | exp [ ( y E y ) 2 2 x 2 ( x E n ) 2 2 H e 2 ] d x .
The expected value of cloud drop Y is E(Y) = Ey, and the variance is expressed as D ( Y ) = E n 2 + H e 2 .
(3) Inferring:
x = exp [ ( y E y ) 2 2 ( E n ) 2 ] .
(4) In the algorithm, y is the cloud droplet in the quantitative domain, and x is the membership degree of y;
(5) Repeat steps (1)–(4) as described above until a sufficient amount of cloud droplets are computed.
Based on the steps, the MATLAB software is used in this research to generate the normal cloud membership function. The measured data of ship navigation is substituted into the membership function. Finally, the membership degree dmn of the mth index parameter in the risk level of ship navigation n is obtained. The entropy weight method is used to predict the risk of ship navigation systems in traffic-intensive waters. Suppose there are i evaluation objects in terms of navigation system risk factors, then the entropy value (Hm) of the mth risk indicator can be calculated as:
H m = k m = 1 i p m ln p m ,   k = ln i ,
where, k is the standard coefficient, and pm is the standard value of the mth risk indicator.
W m = 1 H m n m = 1 i H m .
In order to realize the conversion of the entropy weight w to the risk factor of uncertainty in the membership degree dmn, the membership degree of risk level of ship navigation can be obtained:
C n = m = 1 y w m d m n ,
where Cn is the membership degree of the nth of risk level of ship navigation; dmn is the relevant membership degree of the mth risk indicator at the evaluation level n.

2.3. Construction of Risk Causal Transmission Analysis Model Based on the Infectious Disease Dynamics Method

In order to further analyze the transmission process of key risk factors of ship navigation, the risk cause transmission analysis model is constructed based on infectious disease dynamics. Firstly, the key risk factors of ship navigation are selected as inputs for the model. Secondly, the nodes in the model are constructed by using the mechanism of infectious disease propagation. Finally, the dynamic propagation process of risk causal factors of ship navigation is analyzed.

2.3.1. Type of Nodes in the Propagation Process of Risk Causing

Based on the infectious disease dynamics model, the risk causal nodes of ship navigation were divided into four categories: susceptible node (S), exposed node (E), infective node (I), and removal node (R) [61]. Four types of nodes were determined according to the degree of influence of risk factors in the process of risk dynamics propagation of ship navigation. As a property of the risk state, the risk causal node can map the risk factor into the node in the risk cause analysis process. The nodes are classified according to the nature of the identified key risk factors, and analyzed by using the infectious disease dynamics theory. General risk factors in traffic-intensive waters have the characteristics of easy infection, which can transmit the risk of infection to adjacent exposed nodes; if the risk continue developing, the risk of a navigation system will change from the state of the exposed nodes to infective nodes; however, if the risk is prevented from spreading, the navigation risk will be directly changed from the exposed state to the immune state. In the propagation process of navigation risks, if a removal node is encountered, the risk becomes immune with a probability.
The susceptible node S refers to a state in which risk propagation has not occurred, and the node that does not receive the propagation state of risk at time t. The node in the S state is easy to be a risk stimulus and be transferred to the E state. The exposed node E is characterized as a potential vulnerable node in a navigation system at time t, which is affected by the risk factors of ship navigation at any time. If the risk spreads quickly, the state of the exposed node will be transformed into the infective node I, which shows a spreading tendency. While, if the risk spreads in a low speed, the exposed node will be converted into the removal node R, and the risk will no longer be transmitted. The removal node R is characterized by a stable immune state at time t, which is not unilaterally affected by the infective node. At this state, the navigational safety condition of a ship tends to be stable.

2.3.2. Conversion Rules of Risk Factor Nodes

In the risk causal analysis model of ship navigation, risk of nodes will transfer between E and I state. The conversion rules of risk factor nodes are presented as follow:
(1)
The initial nodes of ship navigation in traffic-intensive waters are S: S(k,t), E(k,t), I(k,t), R(k,t).
(2)
S(k,t), E(k,t), I(k,t), R(k,t) are characterized as the susceptible node, exposed node, infective node, and removal node of the node degree k in risk causal network of ship navigation at time t, respectively, which satisfy S(k,t) + E(k,t) + I(k,t) + R(k,t) = 1.
(3)
The susceptible node spreads to the exposed node E, and the probability that bad weather may occur is Pse in a large traffic flow.
(4)
The infective node I receives the stimulus of the exposed node E, and the probability that the tidal node occurs at the infective node is Pei.
(5)
The removal node R receives the stimulus from the susceptible node S, the exposed node E, and the infective node I, and the probability that the risk cause occurs is Psr, Per, and Pir, respectively. The risk indicator parameters of ship navigation will stop transmitting at the removal node, which plays an immune role.

2.3.3. Construction of Risk Causal Transmission Model

The risk cause of ship navigation traffic in traffic-intensive waters is a dynamic process, that is to say, the risk indicator parameters are affected by single or multiple factors. The nodes are related to the closeness of the adjacent nodes in the process of risk causal propagation. The process of risk factor node state transition propagation is shown in Figure 3.
According to the propagation process diagram and the conversion rule of risk factor nodes, the risk factor node state propagation process should meet the following requirements:
Pse + Psr = 1,
Per + Psr + Pir = 1,
Pse = Pei + Per,
Pei = Pir.
Combining the propagation process of the node transition state as depicted in Figure 3, the infectious disease model, and the stability theory of the dynamic system, a risk causal model of ship navigation in traffic-intensive waters can be established as Equation (11):
dS ( k , t ) d t = P s e K S ( k , t ) θ ( t ) P s r K S ( k , t ) , dE ( k , t ) d t = P s e K S ( k , t ) θ ( t ) P e i K S ( k , t ) θ ( t ) P e r K S ( k , t ) , dI ( k , t ) d t = P e i K S ( k , t ) θ ( t ) P i r K S ( k , t ) , dR ( k , t ) d t = P s r K S ( k , t ) + P i r K S ( k , t ) + P e r K S ( k , t ) , θ ( t ) = k K P ( k ) E ( k , t ) k .
where θ(t) is the probability of propagation between time t and its adjacent node; P(k) is the degree distribution function of risk of ship navigation; <k> is the average degree of nodes of risk.

3. Empirical Case Analysis

To test the logicality and feasibility of the proposed model, an empirical study was conducted on the navigation risk factors of the Yangtze River estuary.

3.1. Screening of Key Risk Factors of Ship Navigation

3.1.1. Data Collection of Navigation System Risk Factor

The data of risk factors of ship navigation at the Yangtze River estuary were collected for case study. Some of the factors need to be statistically analyzed by questionnaires. Visibility and tide can be characterized by the number of days of poor visibility in the month and the number of tidal waves in the month. The number of days when the Beaufort wind scale is greater than 6, the number of days of poor visibility, and the number of large tides can be obtained by the meteorological data form China Meteorological Administration at the Yangtze River estuary and the actual observation data from Shanghai Pilot Station. The data of the tide data can be obtained from the tidal station of the Shanghai Pilot Station. The large tidal range is defined as the tidal range greater than or equal to 275 cm. The number of days that the Beaufort wind scale is greater than 6, the number of days of poor visibility, and the number of the large tidal range in 2017 are shown in Table 2.
As can be seen in Table 1, the number of days of poor visibility per month, days that the Beaufort wind scale is greater than 6, and large tidal range is 15 days, 137 days, and 363 times, respectively. The corresponding risk occurrence probability P can be calculated as 0.041, 0.3753, and 0.5893, respectively.
According to the accident statistics of the Shanghai Maritime Safety Administration (obtained from https://www.sh.msa.gov.cn/), the number of waterborne traffic accidents in level of general and above was 32, 32, 20, 14, 14, and 14 times from 2012 to 2017, respectively. After analyzing the specific causes of traffic accident above grade 1 (obtained from the accident report of the maritime administration department), the risk occurrence probability of each risk factor was obtained, as shown in Table 3.

3.1.2. Membership Degree of Key Risk Factors of Navigation

The initial input value of the risk of ship navigation was obtained by using a cloud model. The Beaufort wind scale of greater than or equal to 6, the visibility, and tide were obtained by quantitative analysis, and the possibility of other risk factors P can be obtained through Shanghai Maritime Bureau statistics.
The degree of influence on the risk factors I can be obtained through expert survey. In this study, questionnaires were distributed to experts from different sectors including the maritime safety administrations, port authorities, shipping companies, and universities. A total of 1024 questionnaires were sent out, and 982 valid questionnaires were collected. The effective rate was 95.9%. As shown in Table 4, all the experts were professional staff, teachers, and students; 15.79% were shipping company managers, and 16.30% were sea pilots. The experts’ education level was high, and all of them have an education background of undergraduate or above.
A reliability analysis and validity analysis of the questionnaire results were also conducted in this research. The results show that the Cronbach’s coefficient was greater than 0.9, which indicates a high reliability. Besides, the construct validity of the questionnaire was good by factor analysis. Both of the reliability and validity met the needs of psychometric standards.
The degree of influence of risk factors I was calculated. The initial input values of risk factors of ship navigation are shown in Table 5.
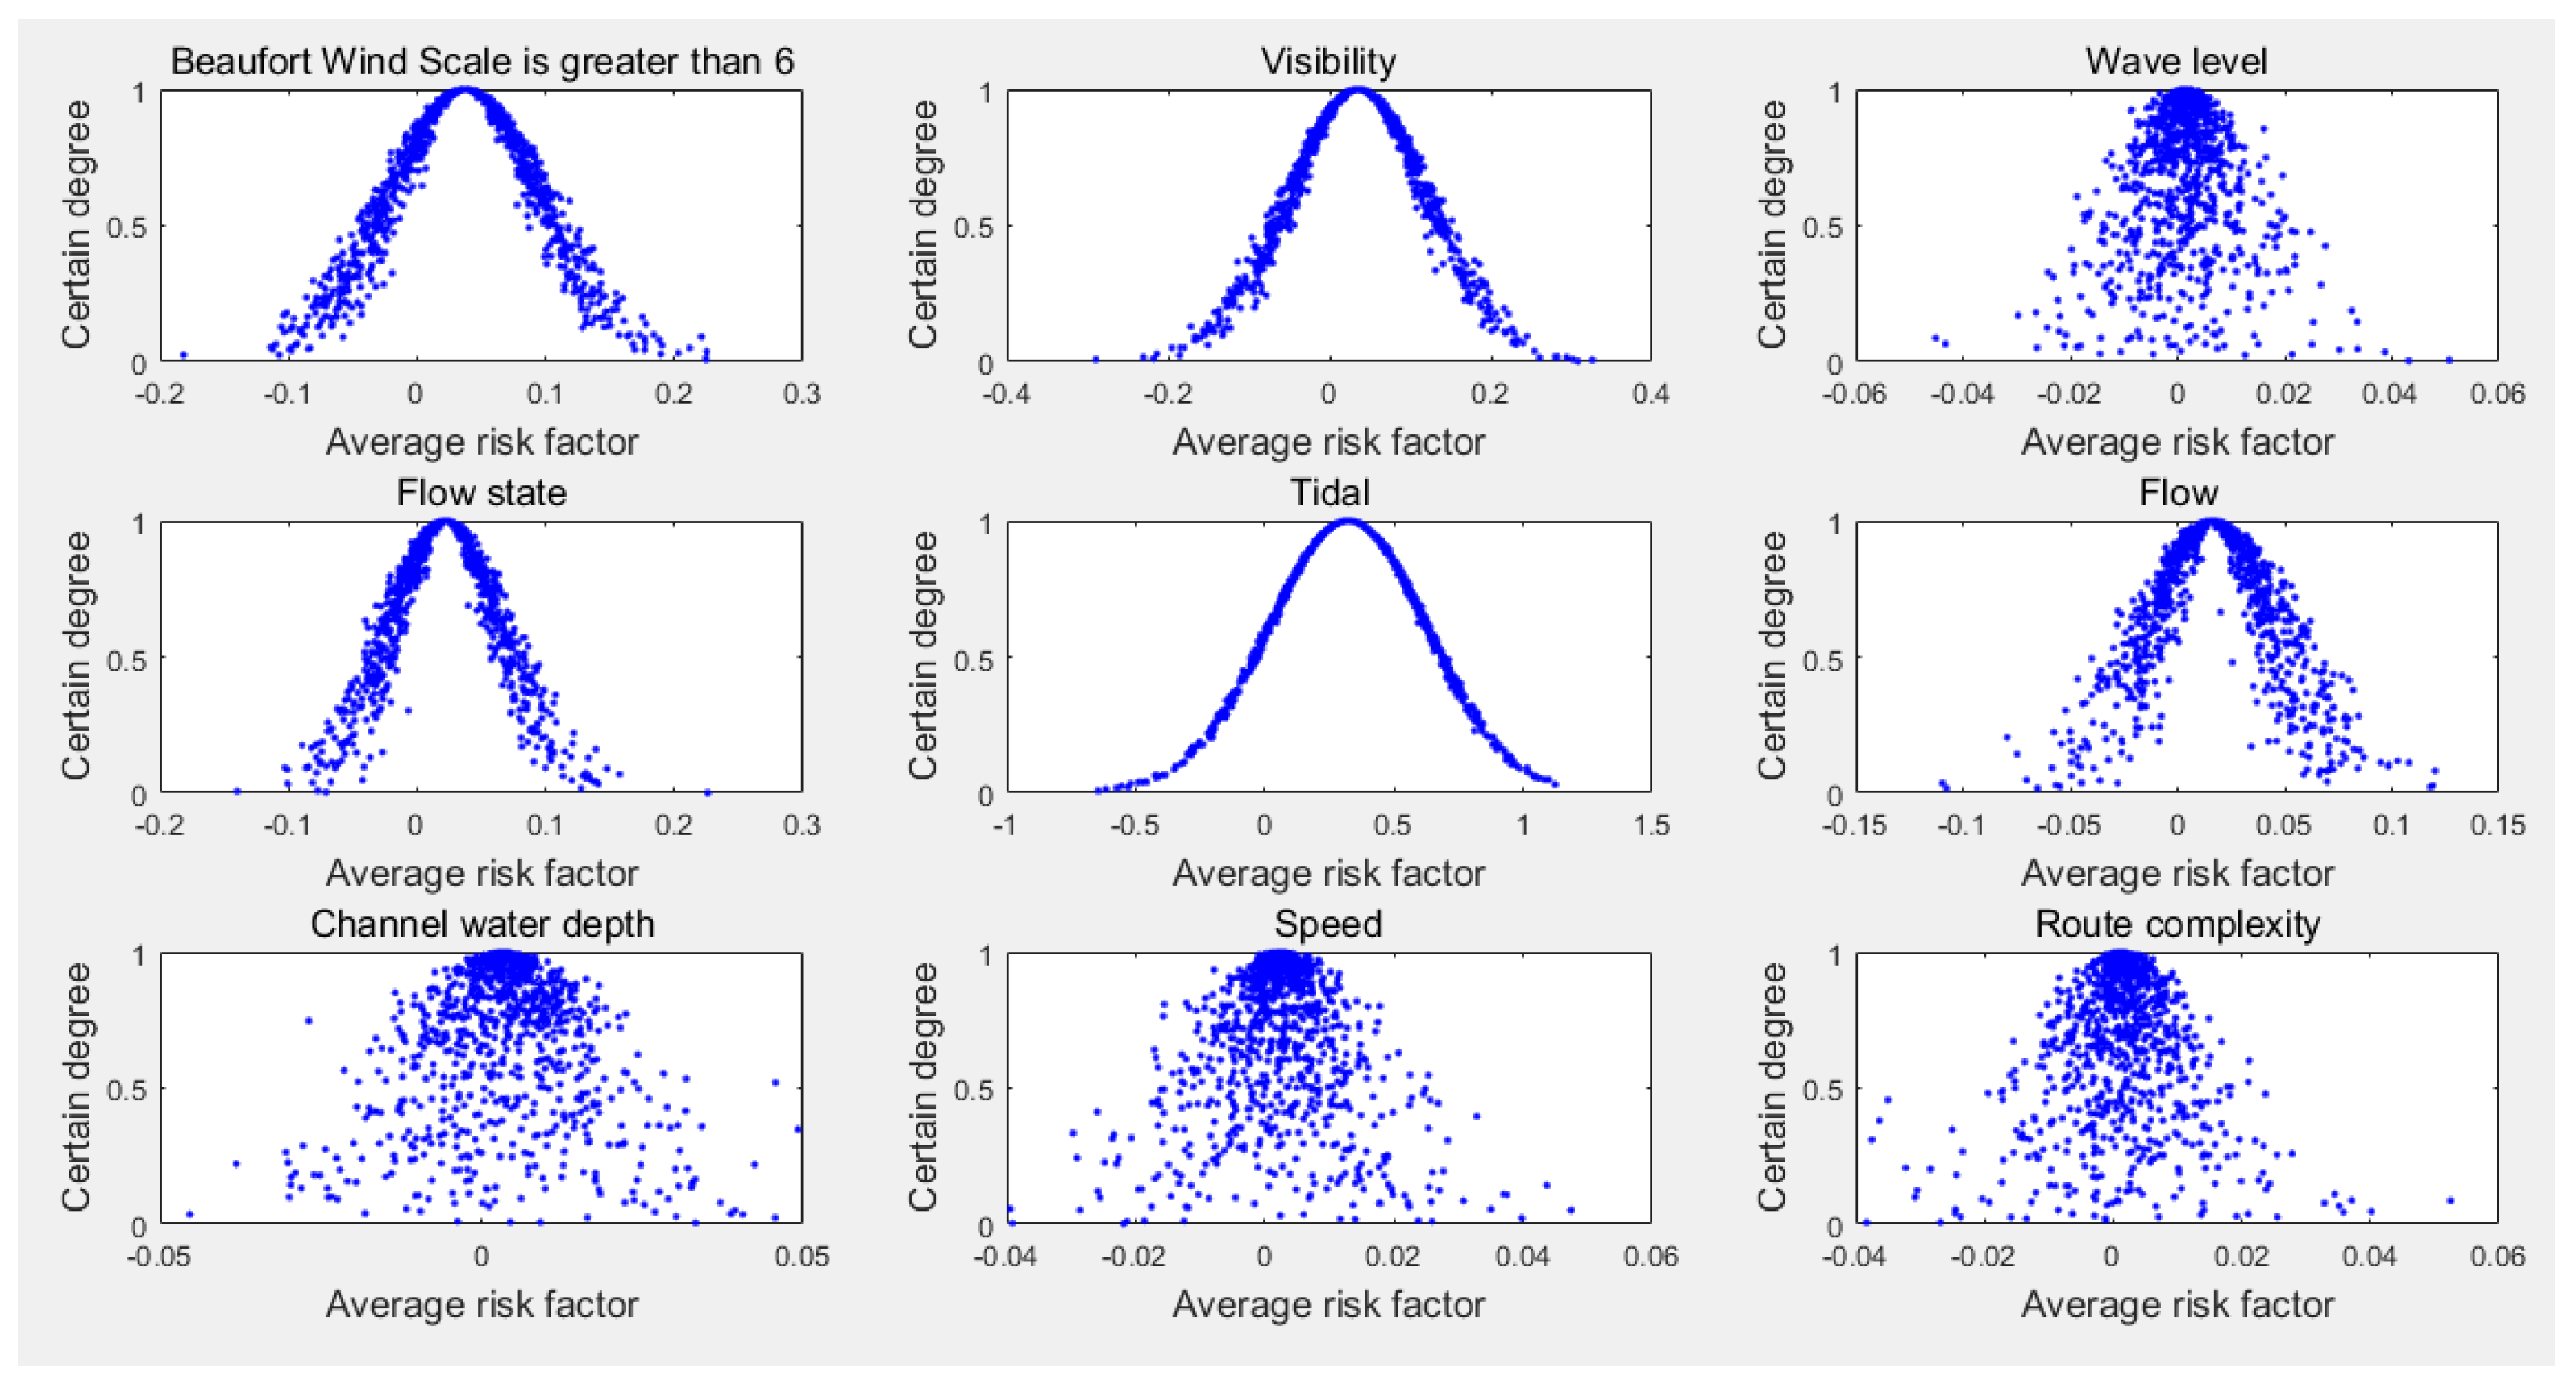
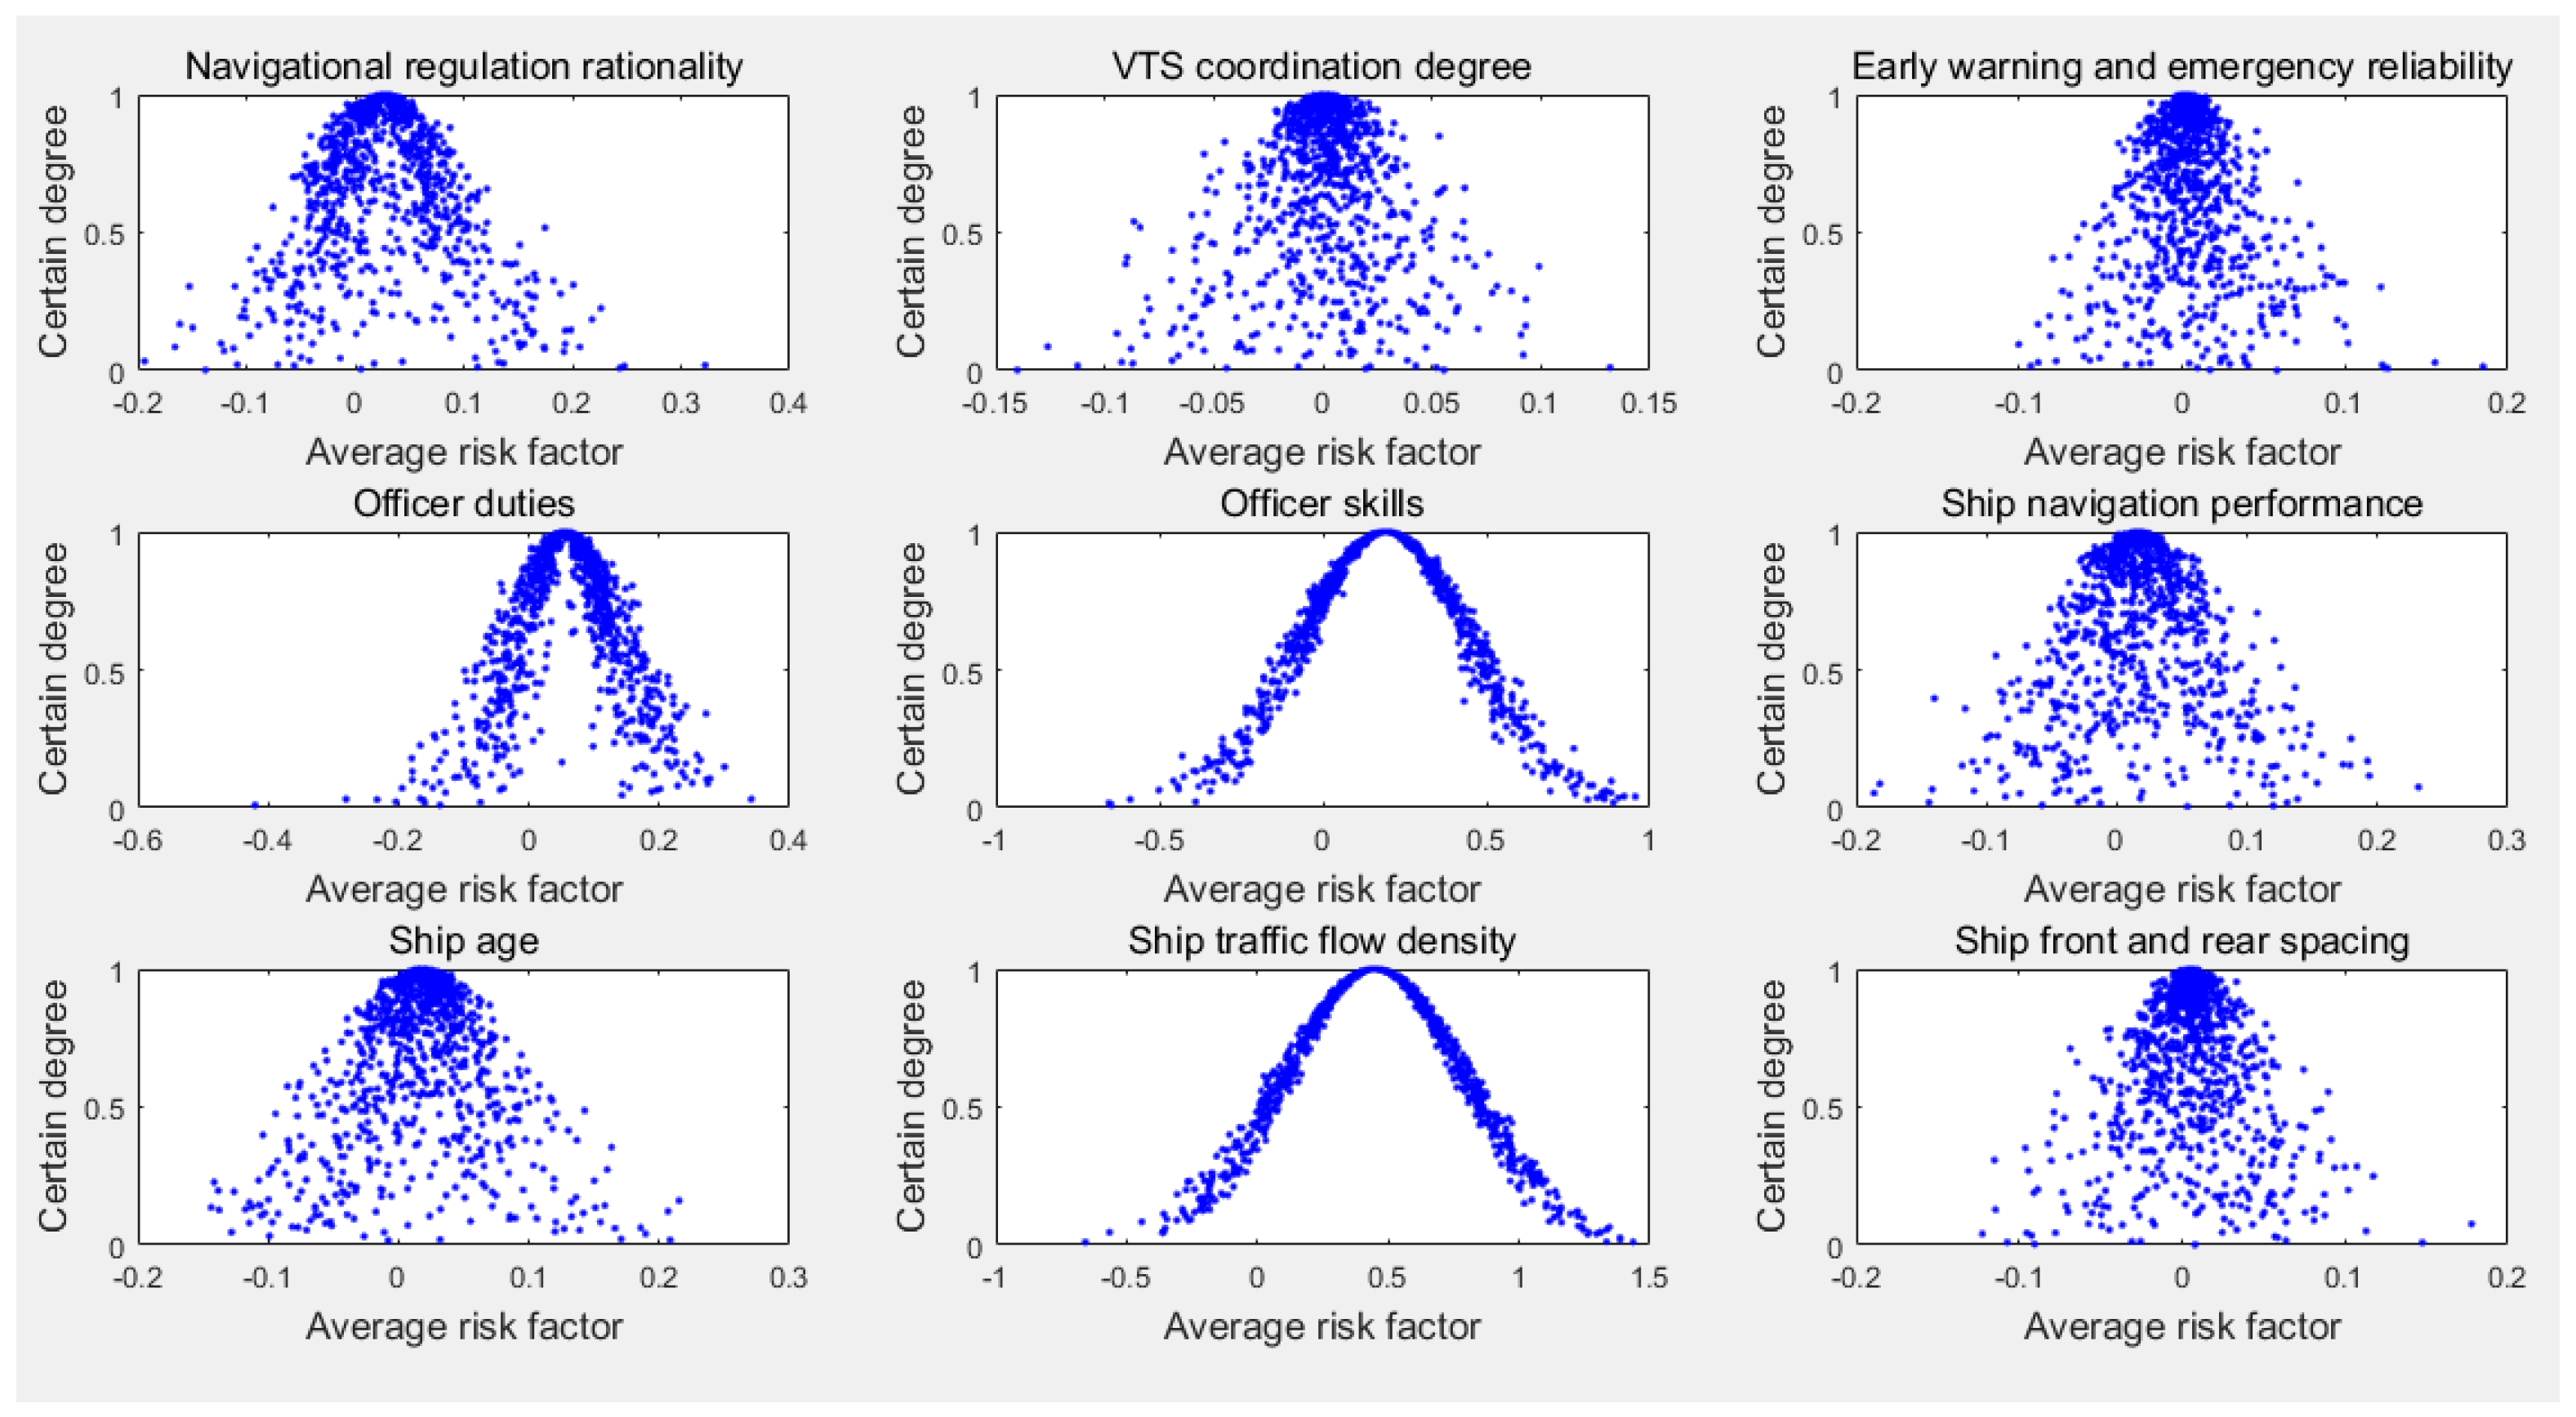
The average degree of influence under different factors in traffic-intensive waters can be obtained by simulation of the above model. For example, the probability of risk occurrence and the degree of risk factor ( x p , x i ) = (0.3753, 0.101) of the number of days that the Beaufort wind scale was greater than 6 in a month are imported to the cloud model. After substituting into the cloud rule generator, the cloud droplets can be generated by using MATLAB software. Finally, the risk cloud parameters with respect to the risk factor when the Beaufort wind scale is greater than 6 days are obtained. The value of E x , E n , and H e is 0.0384, 0.0596, and 0.0339, respectively (see Figure 4).
It can be seen from Table 6 that the values of H e of the ship traffic flow density, tide, onboard officer skill, onboard officer duties, Beaufort wind scale of 6 or greater, and poor visibility are high. It is noted that the higher the H e , the greater the degree of risk. When a ship is sailing in this area, the degree of risk caused by the traffic density of the ships is the highest, the tide factor is the second, the onboard officer skill is the third, the onboard officer duties is the fourth, the Beaufort wind scale of 6 or greater, and the poor visibility are fifth.
The probability of risk occurrence xp and the degree of influence of the risk factors xi were sequentially involved into the above calculation process. Then, the cloud parameter values of the risk factors of ship navigation in traffic-intensive waters were obtained, as shown in Table 6.

3.2. Evolution of Risk Factor Nodes over Time

According to the above-mentioned ranking of risk factors of ship navigation, the risk causal propagation process of the infectious disease dynamics model was simulated to verify the influence of key nodes. Through the screening of key risk factors, onboard officer duties and officer skill were summarized as human error; Beaufort wind scale of greater than or equal to 6 and visibility were summarized as bad weather. In the case where the model parameter coefficient α is set as 10, the above risk causal analysis model was used to describe the risk propagation of nodes, such as ship traffic flow density, tide, human error, and bad weather. According to the characteristics of the selected key influencing factors, combined with the principle of SEIR, the susceptible node (S) was expressed as the most vulnerable factor to receive the risk mutation, which can be mapped to the ship traffic flow density in this paper. The exposed node (E) was expressed as a risk factor which can receive a sudden change in risk but not transmit the risk. Due to the fact that the traffic control will be made by the maritime department under the large tidal range in the Yangtze River estuary, the exposed node can be mapped to the tide. The infective node (I) was expressed as a risk factor that transmits the risk, which can be mapped to the bad weather in this paper. The removal node (R) was expressed as the risk factor, which can receive risk and stop transmitting risk. Due to the fact that the removal node has a large subjective initiative, it can be mapped as human errors.
The traffic flow in the south and north waterways of the Yangtze River Estuary was 161, 459 ships in 2015 and 181, 812 ships in 2016, respectively. Thus, the growth rate of traffic flow was 0.1261. The traffic flow in the south and north waterways of the Yangtze River Estuary in 2016 is set as N, so N = 1.8 (million). Assume that at the initial time, the ratio of key influencing factors is So = 0.5219, Eo = 0.4163, Io = 0.0502, Ro = 0.0116. Besides, assume Pse = 0.6, the value of Psr, Per, Pei, and Pir is obtained in turn according to Formula (10), meaning Psr = 0.4, Per = Pei = 0.3, Pir = 0.3. Based on the above data, the risk factor nodes are simulated, and then the key nodes of risk factors are analyzed.
During the propagation of risk factor nodes over time, the corresponding propagation law was simulated by the propagation step size. The impact of key node density, traffic flow, bad weather, tides, and human error on the risk propagation process was described, respectively.

3.2.1. Impact of Key Node Density on the Risk Propagation Process

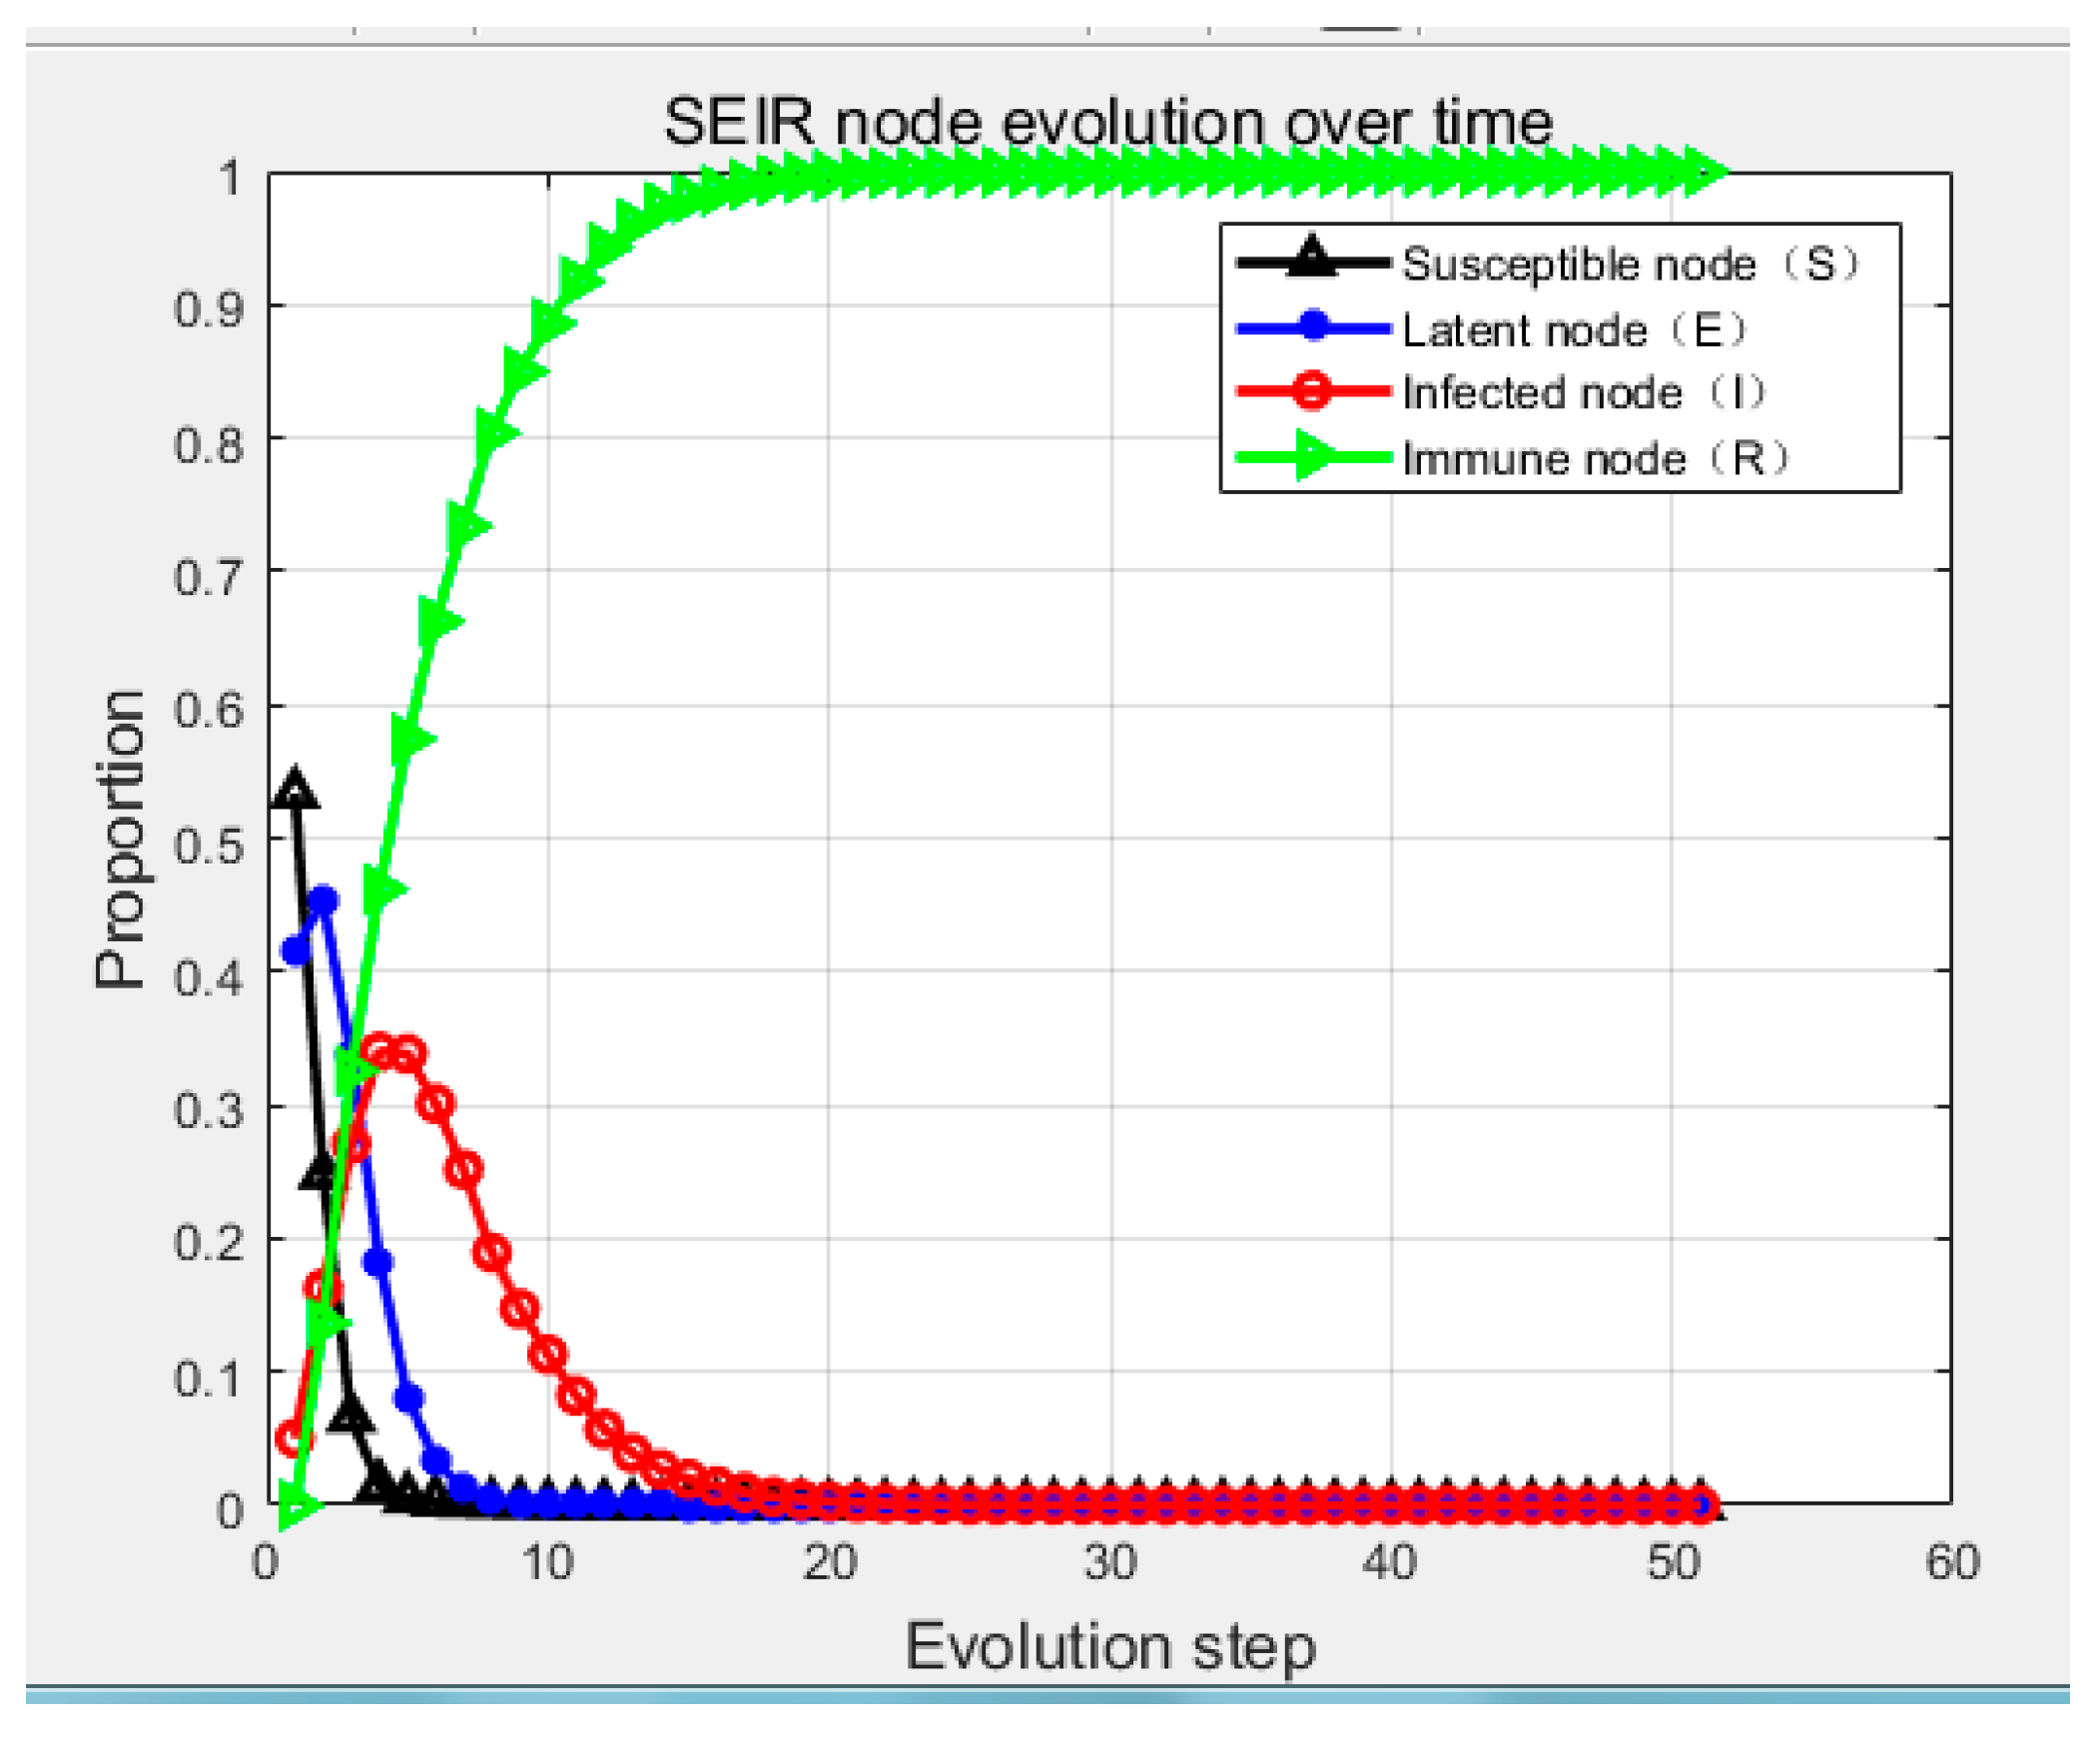
The impact of key node density on risk propagation process can be seen in Figure 5. In the initial stage, the propagation step number of the susceptible node density reached a peak of five steps. Then, the node density rapidly dropped to zero, indicating that the risk rapidly spreads in the process of propagation. While the exposed node density gradually rose to a certain height, and then rapidly dropped to zero. In the initial stage, the influence degree of tides on risk propagation increased rapidly. Under this circumstance, ships need to evade sailing in the case of large tides. With the increase of propagation step number, the impact of tides on risk propagation rapidly dropped to zero. Under this circumstance, ships should utilize the tidal cycle to avoid the possibility of accident. The density of infective node gradually rose to a certain height in the initial stage, and then slowly dropped to zero. The density of removal node increases exponentially in the initial stage, and the propagation step number reached a peak at about 20 steps, and then gradually stabilized at a certain value.

3.2.2. Impact of Ship Traffic Flow on the Risk Propagation Process

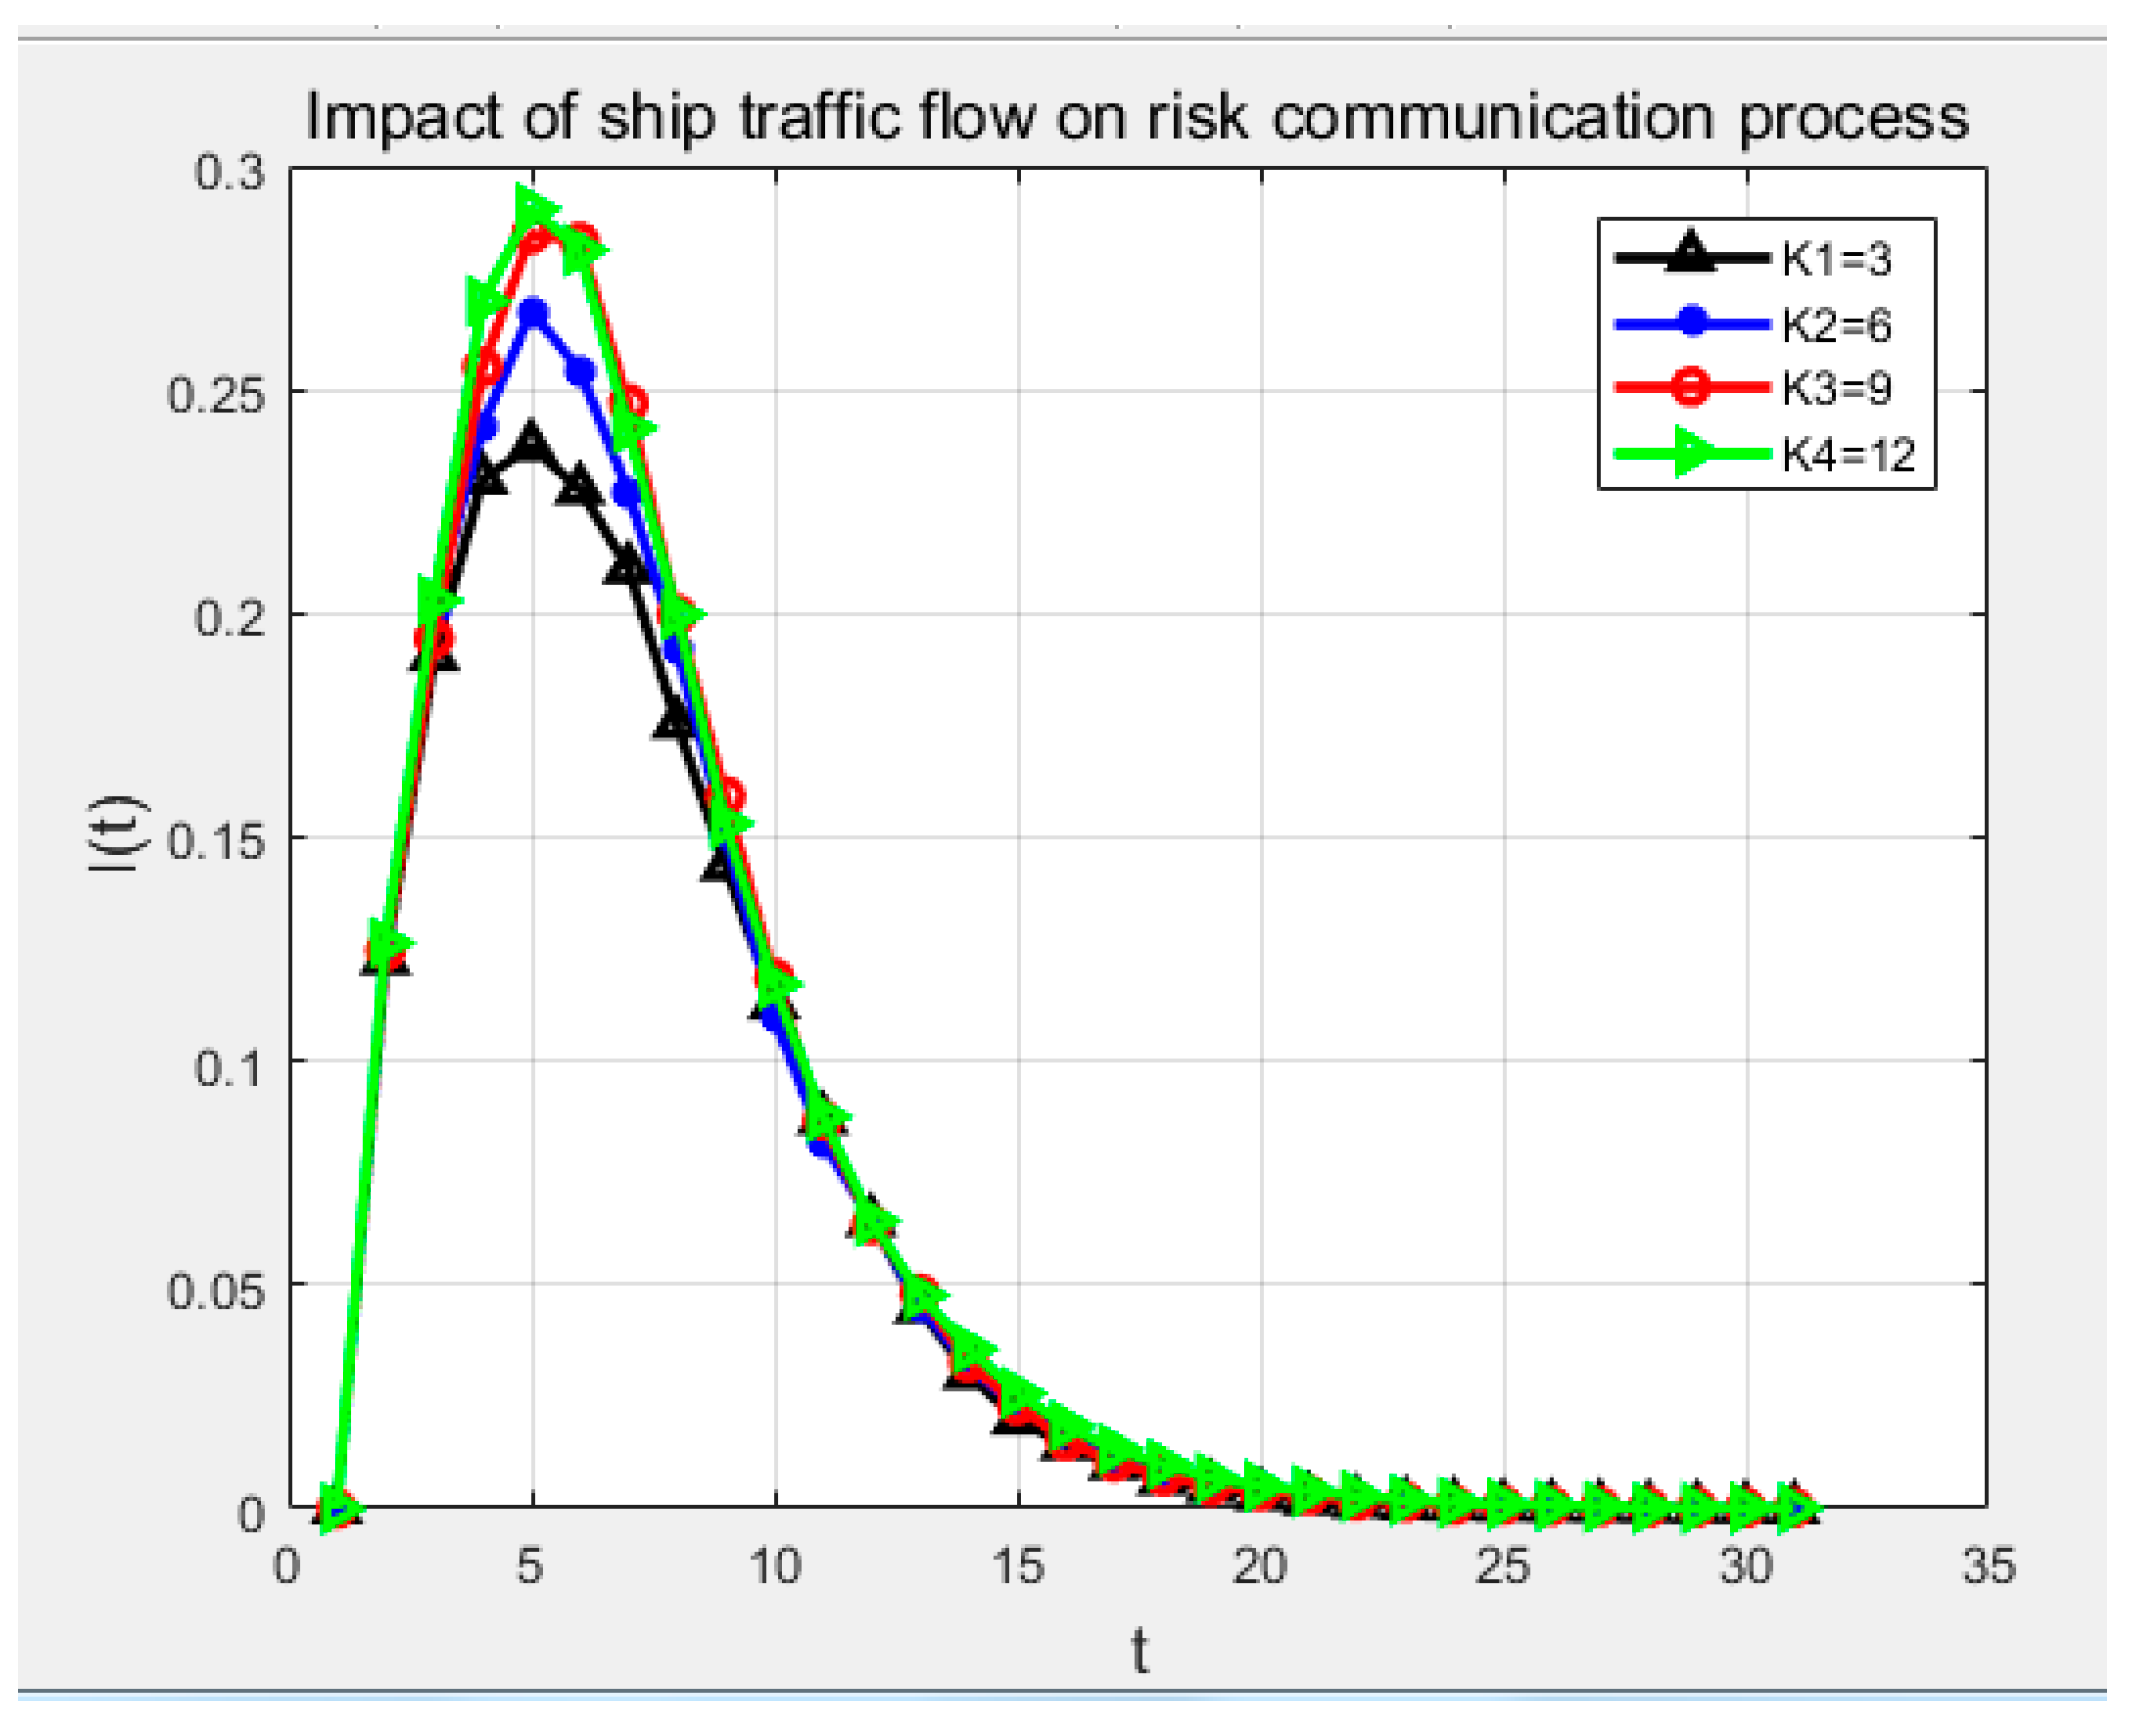
Assume that the degree of ship traffic flow nodes K was 3, 6, 9, 12. The impact of ship traffic flow on the risk propagation process under different traffic flow densities was studied, and the results are shown in Figure 6. The traffic flow density distribution of the ship had an obvious influence on the speed of risk propagation. The larger the distribution of traffic flow density, the faster the risk spread and the wider the range of risk spread. Conversely, the slower the risk spread, the smaller the range of risk spread.

3.2.3. Impact of Bad Weather on the Risk Propagation Process

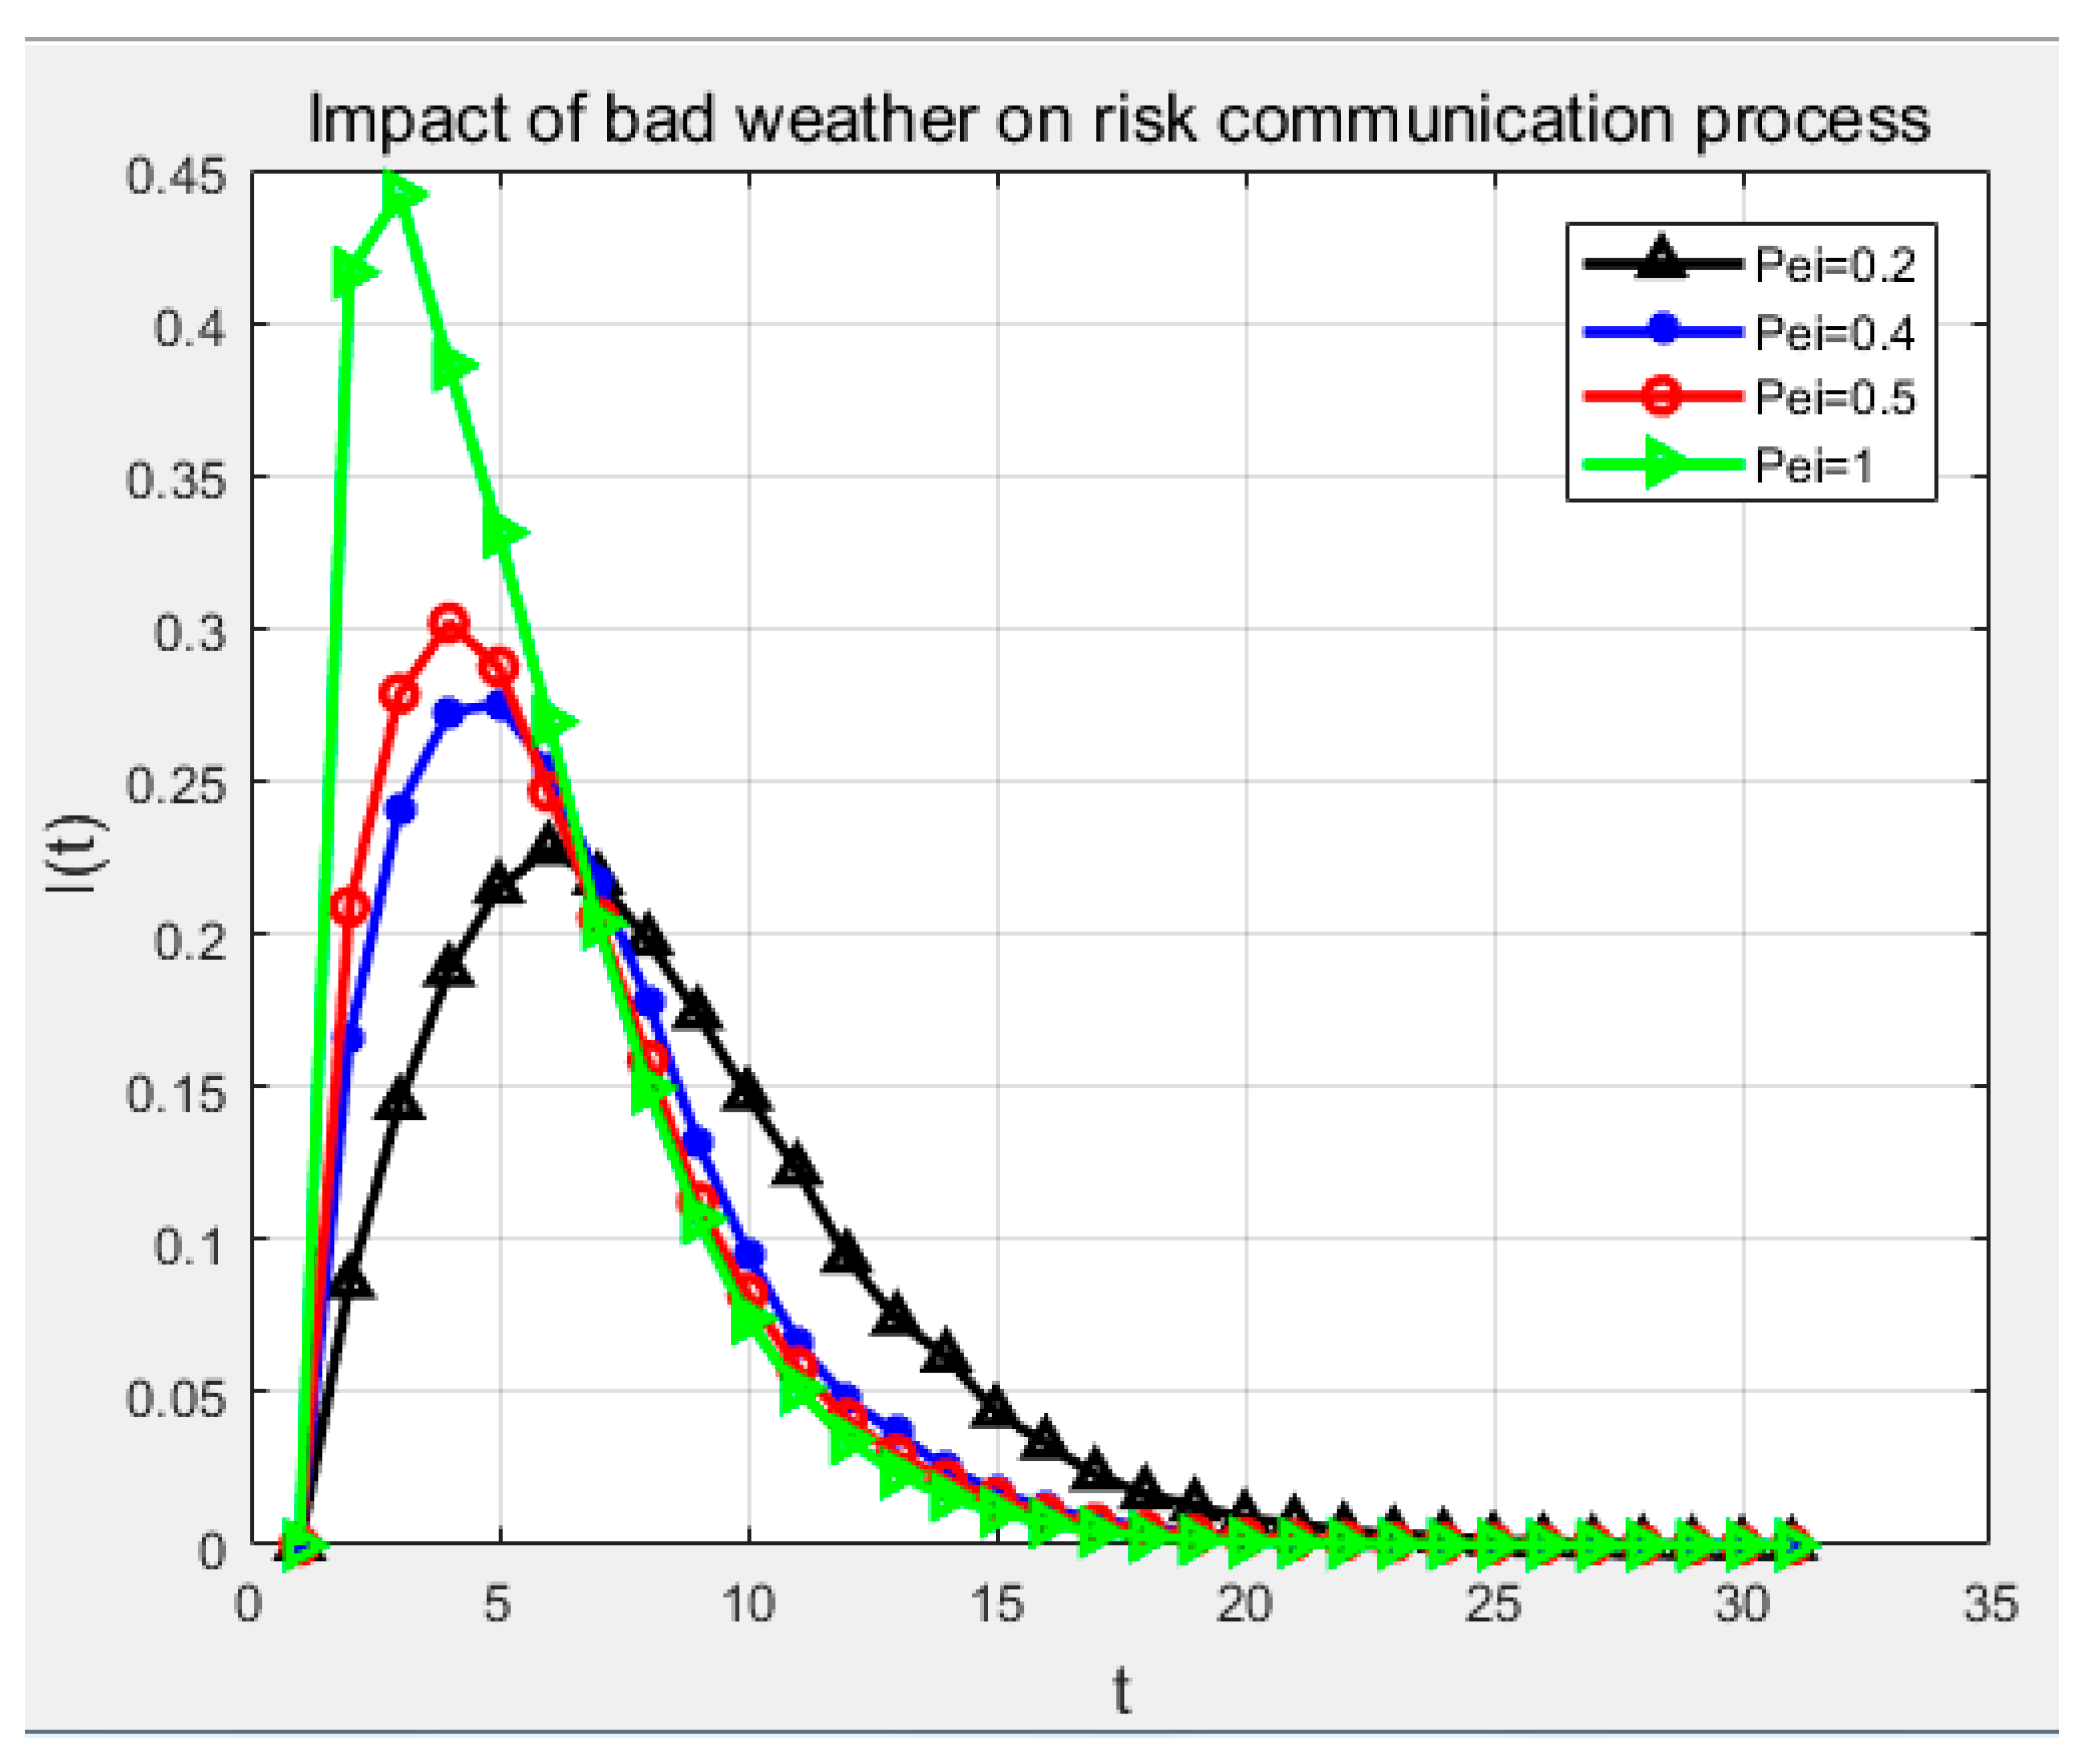
Assume that the degree of bad weather nodes Pei was 0.2, 0.4, 0.5, 1. The changes of the risk propagation process at different probabilities of bad weather were studied, and the results were shown in Figure 7. As the probability of the bad weather increased gradually, the density of the risk propagation node increased rapidly. When the probability value is 1, the propagation node shows an exponential growth curve, meaning the probability of waterborne traffic accidents caused by bad weather reach the peaks. When the propagation node curve reached its peak, there was no longer any new factor propagating the risk. In addition, the factors that previously propagated the risk, also gradually stopped to propagate the risk. That is the reason why the curve shows a downward trend.

3.2.4. Impact of Tides on the Risk Propagation Process

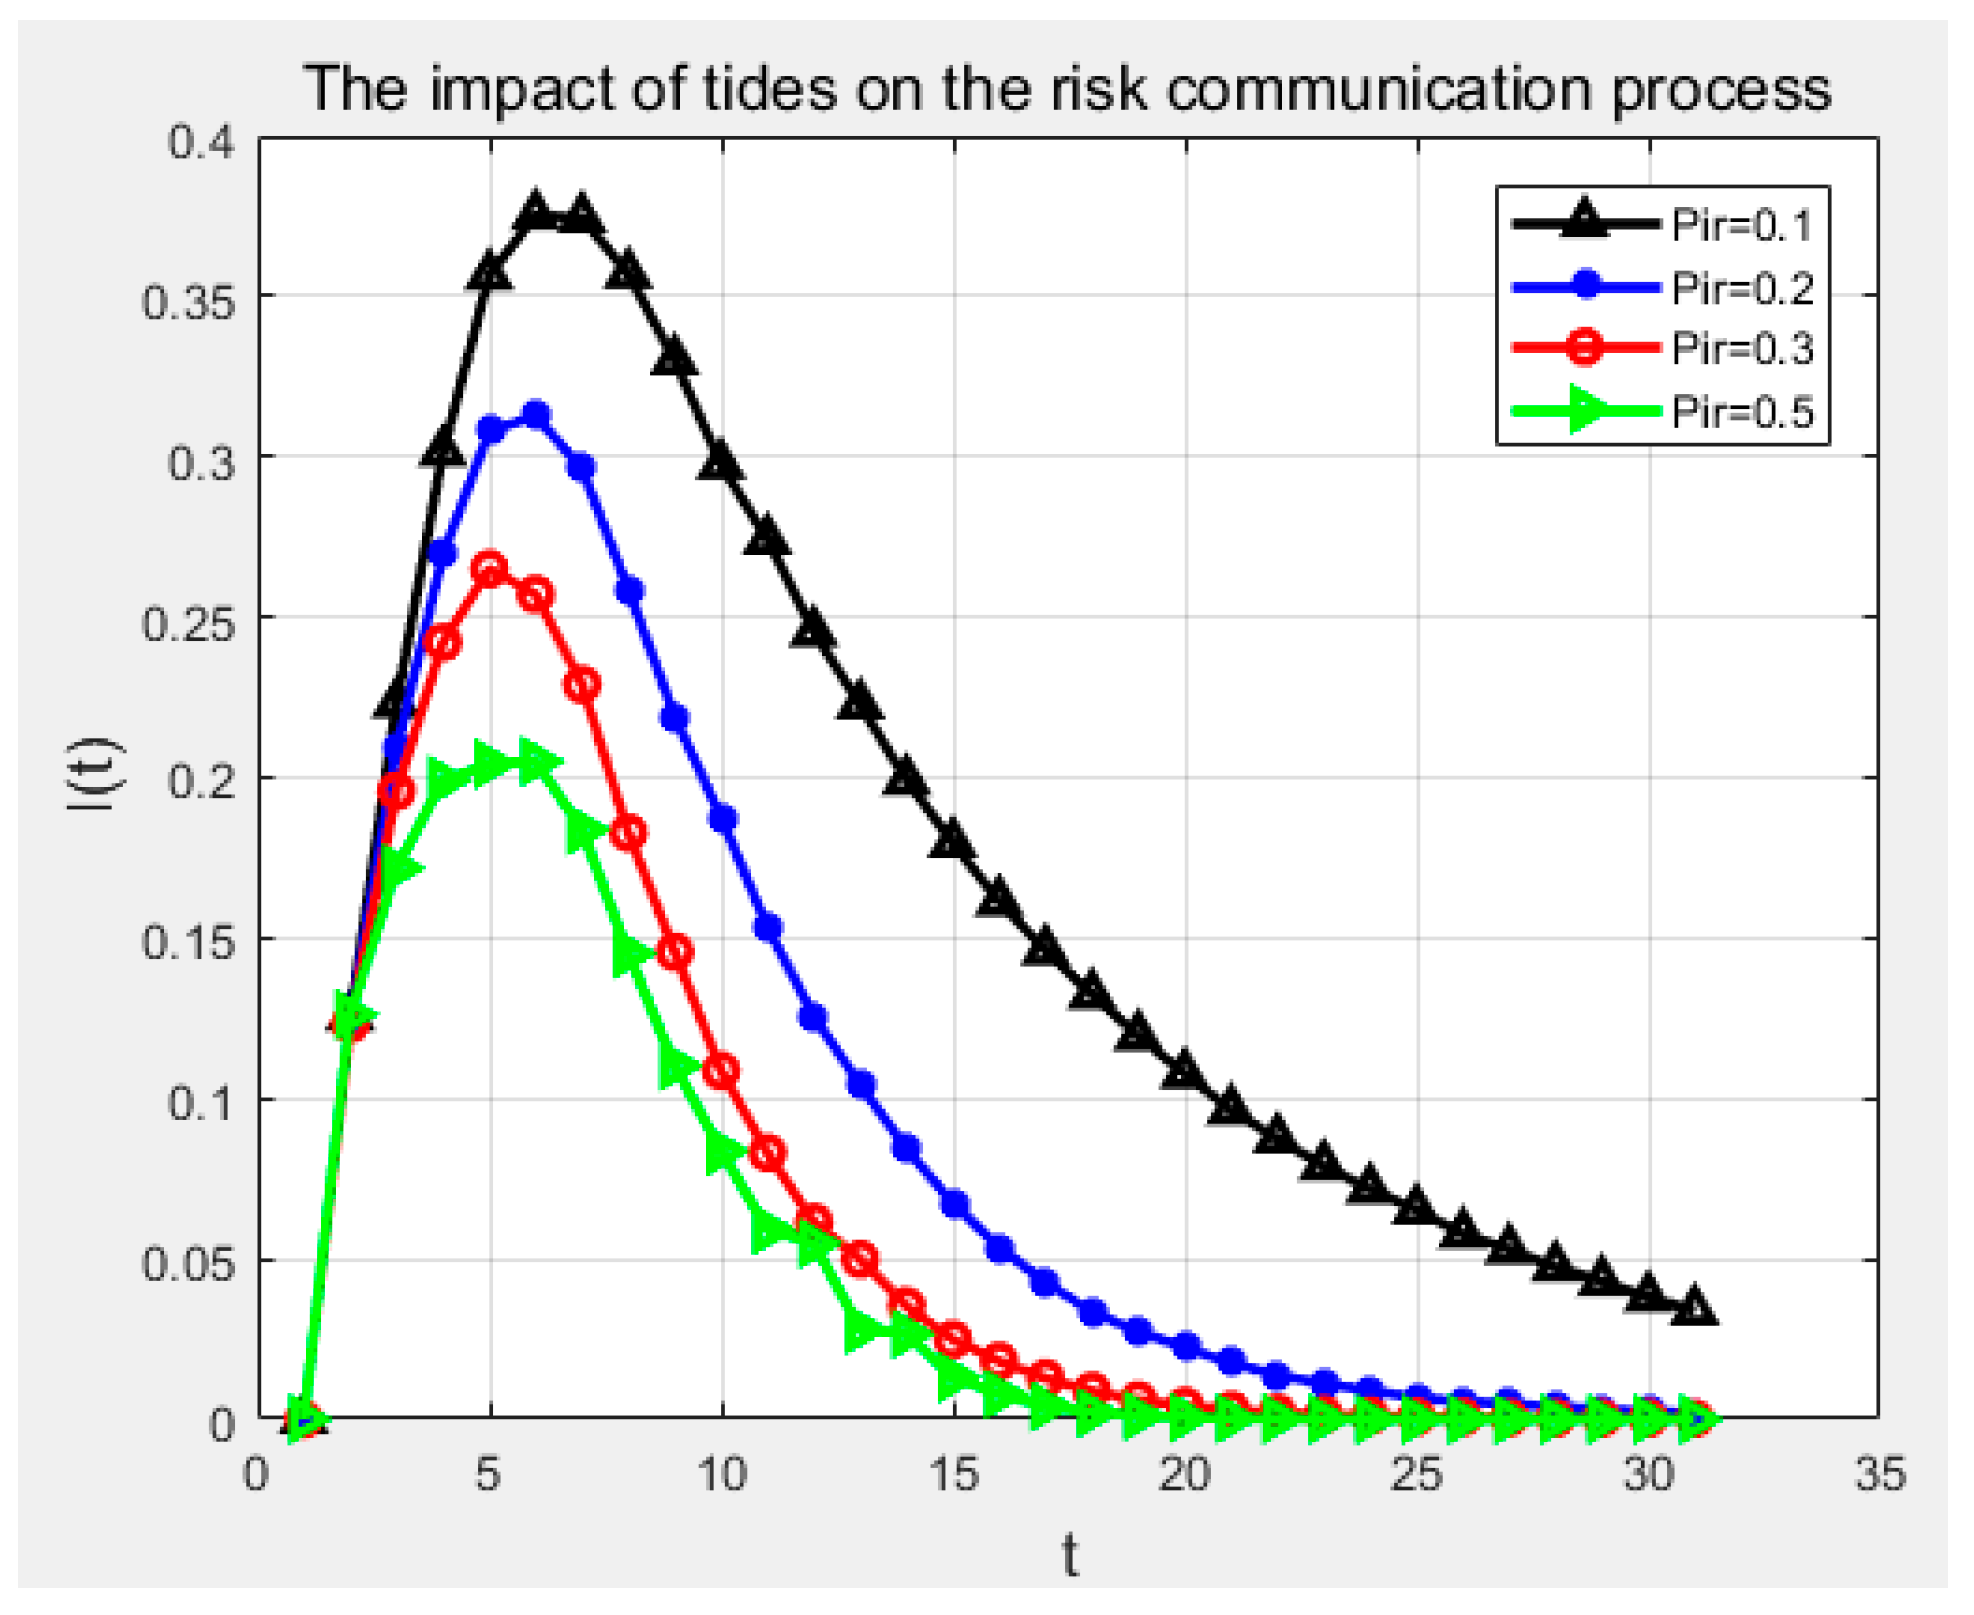
Assume that the degree of the tidal node Pir was 0.1, 0.2, 0.3, 0.5. The change of the risk propagation process under different tidal conditions was studied, as shown in Figure 8. As the probability of the tides increased, the density of the degree of the propagation node gradually decreased, eventually reaching zero. This is mainly due to the fact that after the occurrence of the tide, the vulnerable nodes of the ship navigation do not enter the risk propagation state. Instead, it directly converted to the removal node state.

3.2.5. Impact of Human Errors on the Risk Propagation Process

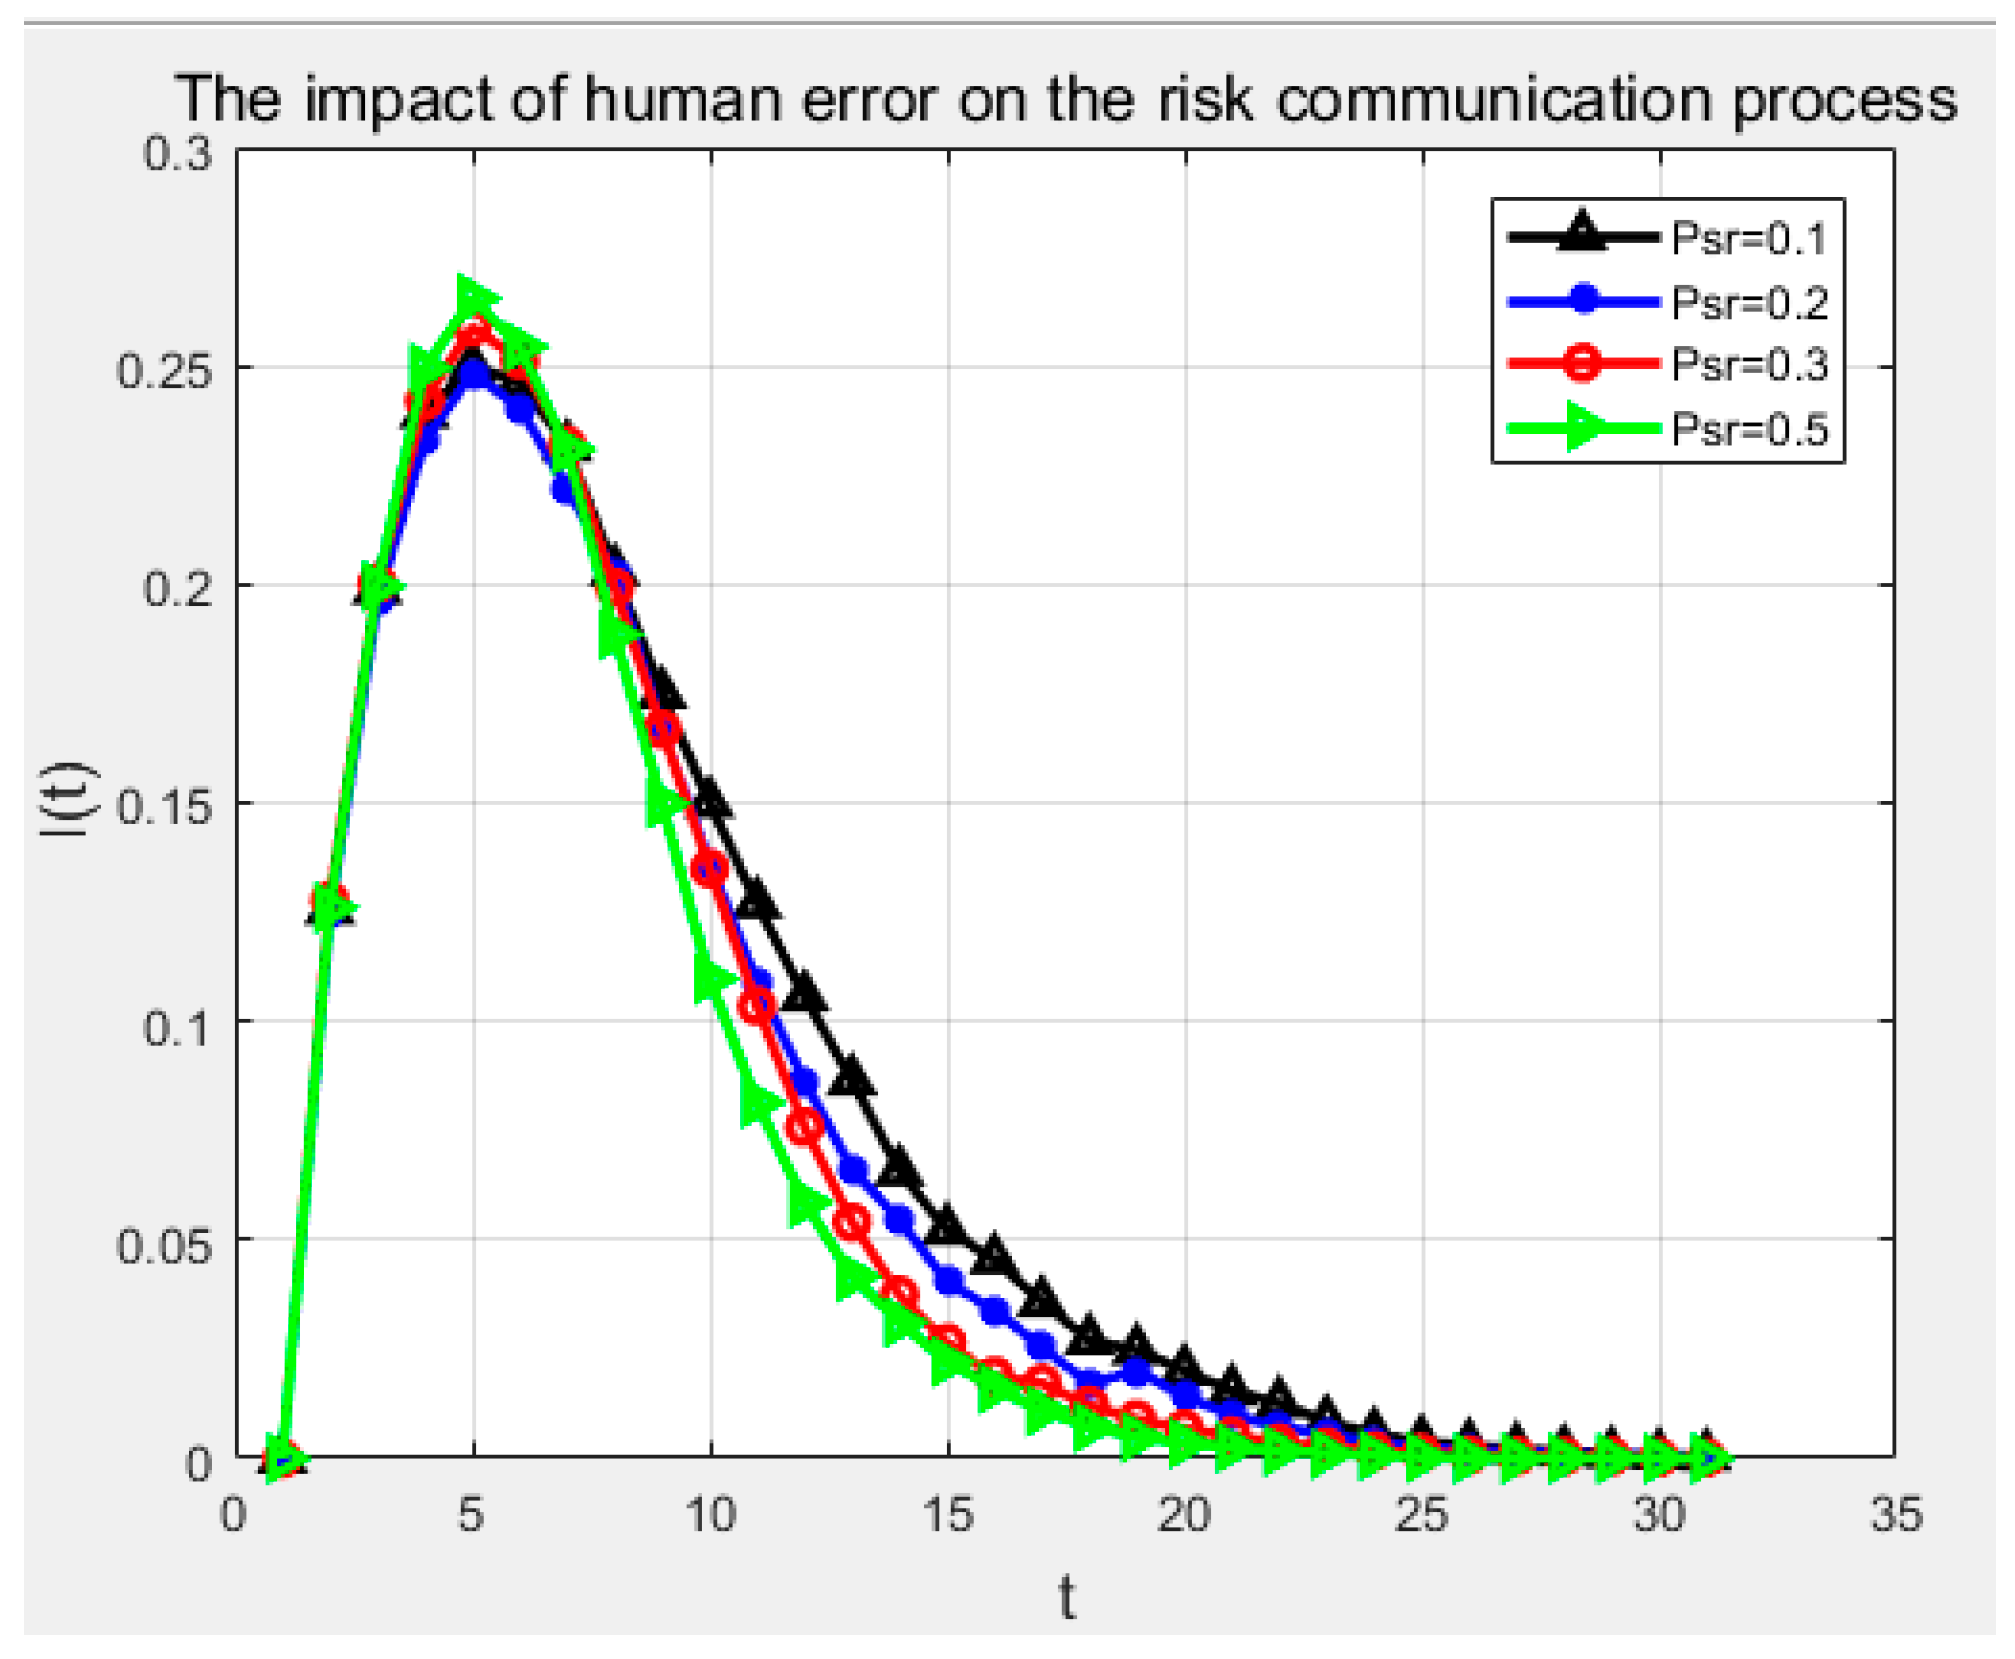
Assume that the degree of human error Psr was 0.1, 0.2, 0.3, 0.5. The change of risk propagation process under different probability of human error was studied, as shown in Figure 9. When the probability of human error increased, the peak value of the removal node increased slowly. Due to the increasing density of removal nodes, the navigational risk related to human errors did not continue spreading, resulting in an increased probability of conversion to immune status.

4. Conclusions

Risk causal analysis is an important part of risk management in traffic-intensive waters. Aiming at identifying the key navigational risks in traffic-intensive waters, a new method combining the cloud model, entropy weight method, and infectious disease dynamics was proposed in this study. Moreover, the proposed method was verified through the case study of the navigation of the Yangtze River estuary. The main conclusions are drawn as follows:
(1) After applying the proposed model to the navigation system of the Yangtze River estuary, the study found that when the ship sails in the Yangtze River estuary, the risk caused by the traffic density is the highest, and the tidal factors are ranked second, followed by the onboard officer’s skill, and the onboard officer’s duties. The Beaufort wind scale of 6 and greater and the poor visibility ranked fifth.
(2) The speed of risk causal transmission has a high correlation with the degree of susceptible nodes in the initial stage. The larger the value of the traffic flow density in the initial stage, the faster the propagation speed of the risk factor in the process of re-propagation. This is mainly because the higher the probability of risk in the initial stage, the faster the risk spread.
The proposed model fully considers the characteristics of traffic-intensive waters when identifying key risk factors. Moreover, the proposed model is able to describe the risk propagation process of key risk factors in ship navigation systems, which is consistent with the real-life situation. The research results provide significant reference for waterborne risk management and control. The sensitivity of the model parameters is not considered in this study, which needs to be further studied in the future. Furthermore, the detail of strategies for reducing navigational risk in traffic-intensive areas can be studied.

Author Contributions

Conceptualization, Y.-j.C. and Q.L.; methodology, Y.-j.C.; software, Y.-j.C. and C.-p.W.; validation, Y.-j.C. and C.-p.W.; formal analysis, Y.-j.C.; investigation, Y.-j.C. and C.-p.W.; resources, Q.L.; data curation, Y.-j.C. and Q.L.; writing—original draft preparation, Y.-j.C.; writing—review and editing, Y.-j.C. and C.-p.W.; visualization, Y.-j.C.; supervision, Q.L.; project administration, Y.-j.C; funding acquisition, Q.L. All of the authors above approved the final manuscript for submission.

Funding

This study was financially supported by the National Natural Science Foundation of China (Grant number: 51379171) and the Technical Innovation Project of Hubei Province (Grant number: 2018AHB003). This project is also partially supported by the European Union’s Horizon 2020 Research and Innovation Programme RISE under grant agreement no. 823759 (REMESH)

Acknowledgments

The authors would like to express their special appreciation to all the participants of the expert survey. We also want to thank the anonymous reviewers for their constructive comments that improved the quality of this manuscript a lot.

Conflicts of Interest

The authors declare no conflict of interest.

References

  1. Xu, K.J.; Liu, Q.; Xu, L. Research on Continuous Traffic Safety Evaluation of Yangtze River Shipping. Appl. Mech. Mater. 2014, 442, 617–622. [Google Scholar] [CrossRef]
  2. Hu, S.; Fang, Q.; Xia, H.; Xi, Y. Formal safety assessment based on relative risks model in ship navigation. Reliab. Eng. Syst. Saf. 2007, 92, 369–377. [Google Scholar] [CrossRef]
  3. Chen, J.; Zhang, C.; Zhang, X.; Zi, Y.; He, S. Planetary gearbox condition monitoring of ship-based satellite communication antennas using ensemble multiwavelet analysis method. Mech. Syst. Signal Process. 2015, 54, 277–292. [Google Scholar] [CrossRef]
  4. Zhang, D.; Yan, X.P.; Yang, Z.L.; Wall, A.; Wang, J. Incorporation of formal safety assessment and Bayesian network in navigational risk estimation of the Yangtze River. Reliab. Eng. Syst. Saf. 2013, 118, 93–105. [Google Scholar] [CrossRef]
  5. Wu, B.; Wang, Y.; Zhang, J.; Savan, E.E.; Yan, X. Effectiveness of maritime safety control in different navigation zones using a spatial sequential DEA model: Yangtze River case. Accid. Anal. Prev. 2015, 81, 232–242. [Google Scholar] [CrossRef] [PubMed]
  6. Wen, Y.; Huang, Y.; Zhou, C.; Yang, J.; Xiao, C.; Wu, X. Modelling of marine traffic flow complexity. Ocean Eng. 2015, 104, 500–510. [Google Scholar] [CrossRef]
  7. Zhang, D.; Yan, X.; Yang, Z.; Wang, J. An accident data–based approach for congestion risk assessment of inland waterways: A Yangtze River case. Proc. Inst. Mech. Eng. Part O J. Risk Reliab. 2014, 228, 176–188. [Google Scholar] [CrossRef]
  8. Kappes, M.S.; Keiler, M.; von Elverfeldt, K.; Glade, T. Challenges of analyzing multi-hazard risk: A review. Nat. Hazards 2012, 64, 1925–1958. [Google Scholar] [CrossRef]
  9. Selva, J. Long-term multi-risk assessment: Statistical treatment of interaction among risks. Nat. Hazards 2013, 67, 701–722. [Google Scholar] [CrossRef]
  10. Merrick, J.R.W.; van Dorp, J.R.; Blackford, J.P.; Shaw, G.L.; Harrald, J.; Mazzuchi, T.A. A traffic density analysis of proposed ferry service expansion in San Francisco Bay using a maritime simulation model. Reliab. Eng. Syst. Saf. 2003, 81, 119–132. [Google Scholar] [CrossRef]
  11. Mavrakis, D.; Kontinakis, N. A queueing model of maritime traffic in Bosporus Straits. Simul. Model. Pract. Theory 2008, 16, 315–328. [Google Scholar] [CrossRef]
  12. Pak, J.; Yeo, G.; Oh, S.; Yang, Z. Port safety evaluation from a captain’s perspective: The Korean experience. Saf. Sci. 2015, 72, 172–181. [Google Scholar] [CrossRef]
  13. Faghih-Roohi, S.; Xie, M.; Ng, K.M. Accident risk assessment in marine transportation via Markov modelling and Markov Chain Monte Carlo simulation. Ocean Eng. 2014, 91, 363–370. [Google Scholar] [CrossRef]
  14. Li, D.; Liu, C.; Gan, W. A new cognitive model: Cloud model. Int. J. Intell. Syst. 2009, 24, 357–375. [Google Scholar] [CrossRef]
  15. Sugumaran, V.; Geetha, T.V.; Manjula, D.; Gopal, H. Guest editorial: Computational intelligence and applications. Inf. Syst. Front. 2017, 19, 969–974. [Google Scholar] [CrossRef]
  16. Kapetanovic, I.M.; Rosenfeld, S.; Izmirlian, G. Overview of commonly used bioinformatics methods and their applications. Ann. N. Y. Acad. Sci. 2004, 1020, 10–21. [Google Scholar] [CrossRef]
  17. Ma, J.; Zou, C.; Pan, X. Structured probabilistic rough set approximations. Int. J. Approx. Reason. 2017, 90, 319–332. [Google Scholar] [CrossRef]
  18. Yan, X.P.; Wan, C.P.; Zhang, D.; Yan, Z.L. Safety management of waterway congestions under dynamic risk conditions—A case study of the Yangtze River. Appl. Soft Comput. 2017, 59, 115–128. [Google Scholar] [CrossRef]
  19. Yu, J.; Wang, L.; Gong, X. Study on the Status Evaluation of Urban Road Intersections Traffic Congestion Base on AHP-TOPSIS Modal. Procedia-Soc. Behav. Sci. 2013, 96, 609–616. [Google Scholar] [CrossRef] [Green Version]
  20. Liao, H.; Xu, Z.; Zeng, X.J. Hesitant fuzzy linguistic VIKOR method and its application in qualitative multiple criteria decision making. IEEE Trans. Fuzzy Syst. 2014, 23, 1343–1355. [Google Scholar] [CrossRef]
  21. Liao, H.; Xu, Z. Multi-criteria decision making with intuitionistic fuzzy PROMETHEE. J. Intell. Fuzzy Syst. Appl. Eng. Technol. 2014, 27, 1703–1717. [Google Scholar]
  22. Montewka, J.; Goerlandt, F.; Kujala, P. On a systematic perspective on risk for formal safety assessment (FSA). Reliab. Eng. Syst. Saf. 2014, 127, 77–85. [Google Scholar] [CrossRef]
  23. Erol, S.; Başar, E. The analysis of ship accident occurred in Turkish search and rescue area by using decision tree. Marit. Policy Manag. 2015, 42, 377–388. [Google Scholar] [CrossRef]
  24. Kum, S.; Sahin, B. A root cause analysis for Arctic Marine accidents from 1993 to 2011. Saf. Sci. 2015, 74, 206–220. [Google Scholar] [CrossRef]
  25. Zhang, M.; Zhang, D.; Goerlandt, F.; Yan, X.; Kujala, P. Use of HFACS and fault tree model for collision risk factors analysis of icebreaker assistance in ice-covered waters. Saf. Sci. 2019, 111, 128–143. [Google Scholar] [CrossRef]
  26. Hänninen, M. Bayesian networks for maritime traffic accident prevention: Benefits and challenges. Accid. Anal. Prev. 2014, 73, 305–312. [Google Scholar] [CrossRef]
  27. Chen, K.; Lu, W. Bridging BIM and building (BBB) for information management in construction: The underlying mechanism and implementation. Eng. Constr. Archit. Manag. 2019, 26, 1518–1532. [Google Scholar] [CrossRef]
  28. Bukhari, A.C.; Tusseyeva, I.; Kim, Y.G. An intelligent real-time multi-vessel collision risk assessment system from VTS view point based on fuzzy inference system. Expert Syst. Appl. 2013, 40, 1220–1230. [Google Scholar] [CrossRef]
  29. Kao, S.L.; Lee, K.T.; Chang, K.Y.; Ko, M.D. A fuzzy logic method for collision avoidance in vessel traffic service. J. Navig. 2007, 60, 17–31. [Google Scholar] [CrossRef]
  30. Grinyak, V.M.; Devyatisil’nyi, A.S. Fuzzy collision avoidance system for ships. J. Comput. Syst. Sci. Int. 2016, 55, 249–259. [Google Scholar] [CrossRef]
  31. Gu, Y.R.; Xia, L.L. The propagation and inhibition of rumors in online social network. Acta Phys. Sin. 2012, 23, 238701. [Google Scholar]
  32. Liu, Q.M.; Li, T.; Sun, M.C. The analysis of an SEIR rumor propagation model on heterogeneous network. Phys. A Stat. Mech. Appl. 2017, 469, 372–380. [Google Scholar] [CrossRef]
  33. Kumari, N.; Sharma, S. Modeling the dynamics of infectious disease under the influence of environmental pollution. Int. J. Appl. Comput. Math. 2018, 4, 84. [Google Scholar] [CrossRef]
  34. Kavousifard, A.; Niknam, T.; Fotuhifiruzabad, M. A novel stochastic framework based on cloud theory and, -modified bat algorithm to solve the distribution feeder reconfiguration. IEEE Trans. Smart Grid. 2016, 7, 740–750. [Google Scholar]
  35. Lu, J.; Wang, W.; Zhang, Y.; Cheng, S. Multi-objective optimal design of stand-alone hybrid energy system using entropy weight method based on HOMER. Energies 2017, 10, 1664. [Google Scholar] [CrossRef]
  36. Jiang, D.; Hao, G.; Huang, L.; Zhang, D. Use of cusp catastrophe for risk analysis of navigational environment: A case study of three gorges reservoir area. PLoS ONE 2016, 11, e0158482. [Google Scholar] [CrossRef] [PubMed]
  37. Zhang, J.; Yan, X.; Zhang, D.; Haugen, S.; Yang, X. Safety management performance assessment for Maritime Safety Administration (MSA) by using generalized belief rule base methodology. Saf. Sci. 2014, 63, 157–167. [Google Scholar] [CrossRef]
  38. Mou, J.M.; Chen, P.F.; He, Y.X.; Yip, T.L.; Li, W.H.; Tang, J.; Zhang, H.Z. Vessel traffic safety in busy waterways: A case study of accidents in western shenzhen port. Accid. Anal. Prev. 2019, 123, 461–468. [Google Scholar] [CrossRef]
  39. Kujala, P.; Hänninen, M.; Arola, T.; Ylitalo, J. Analysis of the marine traffic safety in the Gulf of Finland. Reliab. Eng. Syst. Saf. 2009, 94, 1349–1357. [Google Scholar] [CrossRef]
  40. Yip, T.L. Port traffic risks—A study of accidents in Hong Kong waters. Transp. Res. Part E Logist. Transp. Rev. 2008, 44, 921–931. [Google Scholar]
  41. Zhang, L.; Meng, Q.; Fwa, T.F. Big AIS data based spatial-temporal analyses of ship traffic in Singapore port waters. Transp. Res. Part E Logist. Transp. Rev. 2017, in press. [Google Scholar] [CrossRef]
  42. Hidetoshi, M. Safety Management; Japan Industrial Safety and Health Association: Tokyo, Japan, 1966; pp. 98–101.
  43. Wan, C.; Yang, Z.; Zhang, D.; Yan, X.; Fan, S. Resilience in transportation systems: A systematic review and future directions. Transp. Rev. 2018, 38, 479–498. [Google Scholar] [CrossRef]
  44. Burmeister, H.C.; Bruhn, W.; Rødseth, Ø.J.; Porathe, T. Autonomous unmanned merchant vessel and its contribution towards the e-Navigation implementation: The MUNIN perspective. Int. J. E-Navig. Marit. Econ. 2014, 1, 1–13. [Google Scholar] [CrossRef]
  45. Wan, C.; Yan, X.; Zhang, D.; Qu, Z.; Yang, Z. An advanced fuzzy Bayesian-based FMEA approach for assessing maritime supply chain risks. Transp. Res. Part E Logist. Transp. Rev. 2019, 125, 222–240. [Google Scholar] [CrossRef]
  46. Wahlström, M.; Hakulinen, J.; Karvonen, H.; Lindborg, I. Human factors challenges in unmanned ship operations-insights from other domains. Procedia Manuf. 2015, 3, 1038–1045. [Google Scholar] [CrossRef]
  47. Rødseth, Ø.J.; Tjora, Å. A risk based approach to the design of unmanned ship control systems. In Maritime-Port Technology and Development; CRC Press: Oxfordshire, UK, 2015; Volume 1, pp. 153–162. [Google Scholar]
  48. Man, Y.; Lundh, M.; Porathe, T.; MacKinnon, S. From desk to field-human factor issues in remote monitoring and controlling of autonomous unmanned vessels. Procedia Manuf. 2015, 3, 2674–2681. [Google Scholar] [CrossRef]
  49. Rødseth, Ø.J.; Burmeister, H.C. Risk assessment for an unmanned merchant ship. Int. J. Mar. Navig. Saf. Sea Transp. 2015, 9, 357–364. [Google Scholar] [CrossRef]
  50. Hogg, T.; Ghosh, S. Autonomous merchant vessels: Examination of factors that impact the effective implementation of unmanned ships. Aust. J. Marit. Ocean Aff. 2016, 8, 206–222. [Google Scholar] [CrossRef]
  51. Thieme, C.A.; Utne, I.B. Safety performance monitoring of autonomous marine systems. Reliab. Eng. Syst. Saf. 2017, 159, 264–275. [Google Scholar] [CrossRef]
  52. Zhang, R.L.; Furusho, M. Conversion timing of seafarer’s decision-making for unmanned ship navigation. Int. J. Mar. Navig. Saf. Sea Transp. 2017, 11, 463–468. [Google Scholar] [CrossRef]
  53. Dan, J.G.; Arnaldos, J.; Darbra, R.M. Introduction of the human factor in the estimation of accident frequencies through fuzzy logic. Saf. Sci. 2017, 97, 134–143. [Google Scholar]
  54. Wróbel, K.; Montewka, J.; Kujala, P. System-theoretic approach to safety of remotely-controlled merchant vessel. Ocean Eng. 2018, 152, 334–345. [Google Scholar] [CrossRef]
  55. Wan, C.; Yang, X.; Zhang, D.; Yang, Z. A novel model for quantitative of green port development-a case study of major ports in China. Transp. Res. Part D Transp. Environ. 2018, 61, 431–443. [Google Scholar] [CrossRef]
  56. Hontvedt, M. Professional vision in simulated environments-examining professional maritime pilots’ performance of work tasks in a full-mission ship simulator. Learn. Cult. Social Interact. 2015, 7, 71–84. [Google Scholar] [CrossRef]
  57. Lazakis, I.; Dikis, K.; Michala, A.L.; Theotokatos, G. Advancedship systems condition monitoring for enhanced inspection maintenance and decision making in ship operations. Transp. Res. Procedia 2016, 14, 1679–1688. [Google Scholar] [CrossRef]
  58. Wróbel, K.; Montewka, J.; Kujala, P. Towards the assessment of potential impact of unmanned vessels on maritime transportation safety. Reliab. Eng. Syst. Saf. 2017, 165, 155–169. [Google Scholar] [CrossRef]
  59. Ahvenjärvi, S. The Human Element and Autonomous Ships. Int. J. Mar. Navig. Saf. Sea Transp. 2016, 10, 517–521. [Google Scholar] [CrossRef] [Green Version]
  60. Zadeh, L.A. Fuzzy sets. Inf. Control. 1965, 8, 338–353. [Google Scholar] [CrossRef] [Green Version]
  61. Feng, Z.; Thieme, H.R. Endemic models with arbitrarily distributed periods of infection I: Fundamental properties of the model. SIAM J. Appl. Math. 2000, 61, 803–833. [Google Scholar] [CrossRef]
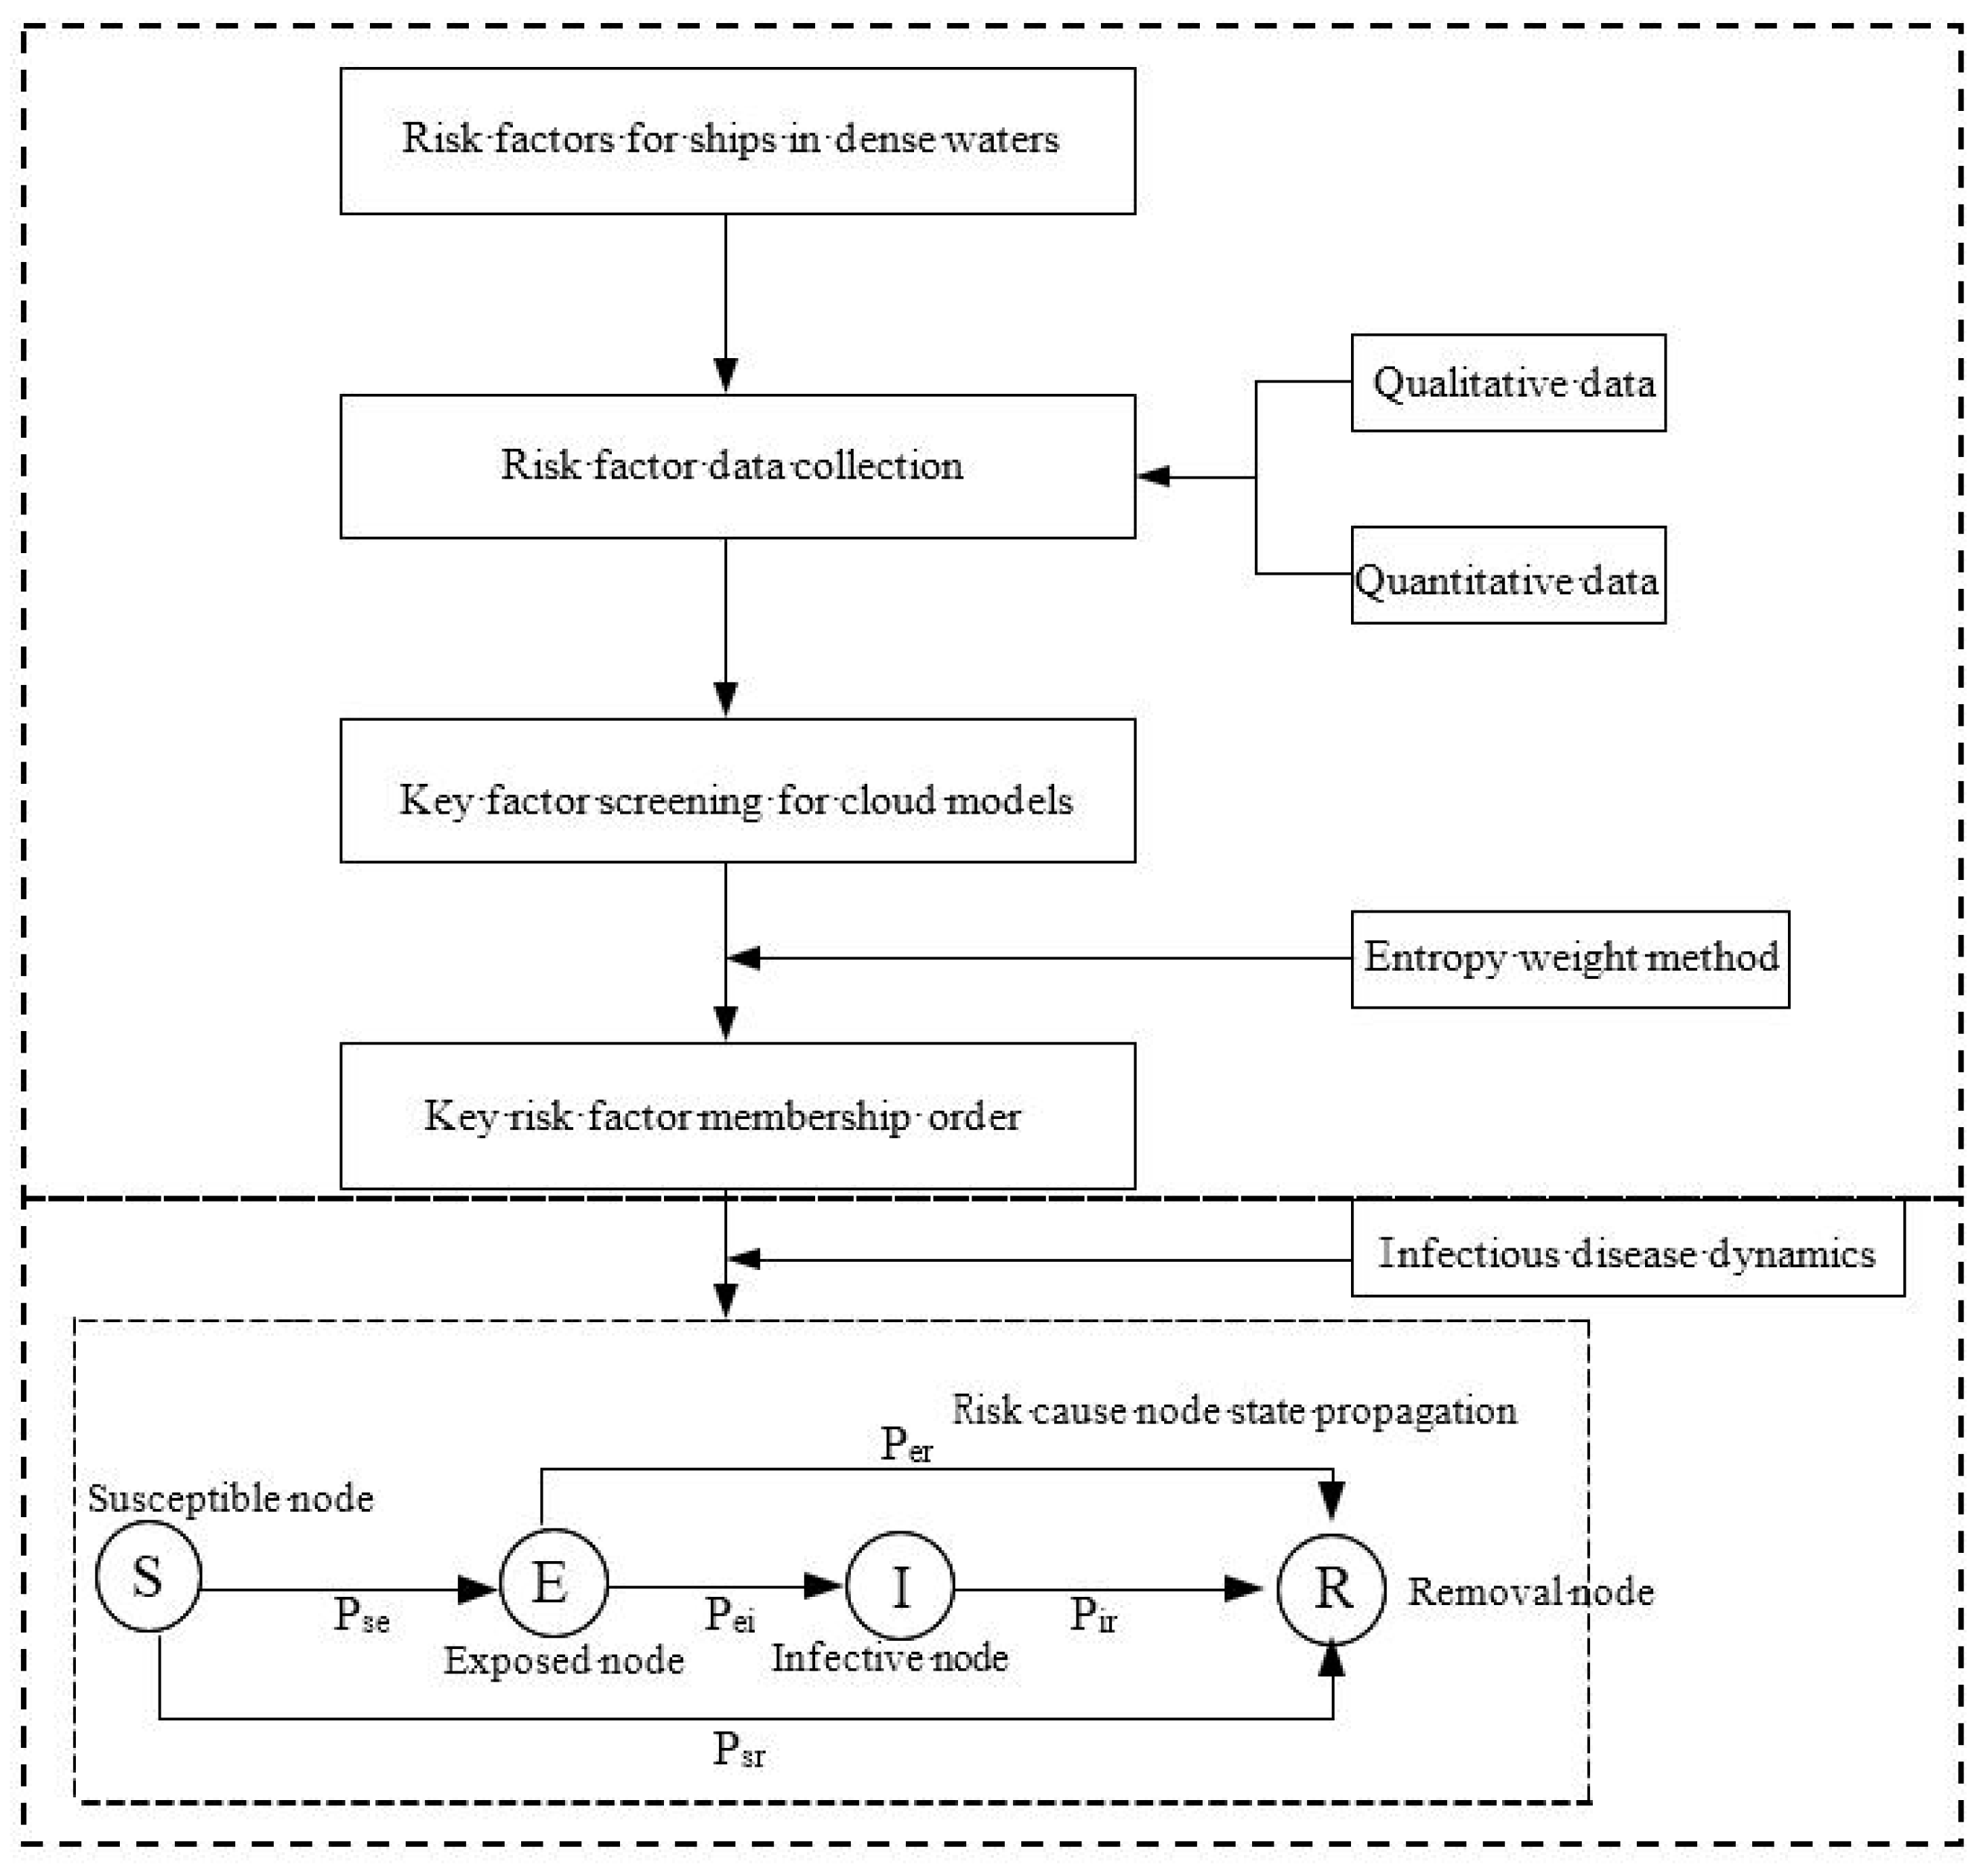
Figure 1. Flowchart of causal analysis of risks of ship navigation systems in traffic-intensive waters.
Jmse 07 00277 g001
Figure 2. The risk index system of ship navigation in traffic-intensive waters.
Jmse 07 00277 g002
Figure 3. Propagation of risk factor node state (abbreviations definitions please refer to Section 2.3.2).
Jmse 07 00277 g003
Figure 4. Evaluation of risk factors based on the cloud model.
Jmse 07 00277 g004aJmse 07 00277 g004b
Figure 5. Changes of four types of nodes along with time.
Jmse 07 00277 g005
Figure 6. Impact of ship traffic flow on the risk propagation process.
Jmse 07 00277 g006
Figure 7. Impact of bad weather on the risk propagation process.
Jmse 07 00277 g007
Figure 8. Impact of tides on the risk propagation process.
Jmse 07 00277 g008
Figure 9. Impact of human error on the risk propagation process.
Jmse 07 00277 g009
Table 1. The risk factors of ship navigation in traffic-intensive waters.
CategoriesFactorsReference
HumanOffice duties, office skillsWan et al. [43],
Burmeister et al. [44],
Wan et al. [45],
Wahlström et al. [46],
Rødseth and Tjora [47],
Man et al. [48],
Rødseth and Burmeister [49],
Hogg and Ghosh [50],
Thieme and Utne [51],
Zhang and Furusho [52],
Dan et al. [53],
Wróbel et al. [54],
Wan et al. [55].
EnvironmentMeteorology, hydrology, navigation channel, and traffic flowWan et al. [43],
Wan et al. [45],
Rødseth and Tjora [47],
Wan et al. [55],
Hontvedt [56].
ShipShip age, ship navigation performanceWan et al. [43],
Wan et al. [45],
Rødseth and Tjora [47],
Rødseth and Burmeister [49],
Zhang and Furusho [52],
Dan et al. [53],
Hogg and Ghosh [50],
Lazakis et al. [57],
Wróbel et al. [58].
ManagementNavigation rationality regulations, VTS (vessel traffic service) coordination degree, early warning and emergency reliabilityWan et al. [43],
Burmeister et al. [44],
Rødseth and Tjora [47],
Man et al. [48],
Rødseth and Burmeister [49],
Wan et al. [55],
Ghosh [55],
Ahvenjärvi [59].
Table 2. The number of days of poor visibility, that when the Beaufort wind scale is greater than 6, and that of the large tidal range in each month of 2017.
Month123456789101112
Poor visibility days200530111140
Beaufort wind scale is greater than 61413111211610201011118
Number of large tidal range312830303130313030313031
Table 3. Statistics of risk factors at the Yangtze River estuary from 2012 to 2017.
Type of Risk FactorsRisk FactorsQuantityFrequency
EnvironmentWave level300.2678
Flow state250.2232
Traffic flow density750.6696
Flow330.2946
Channel water depth30.0268
Speed30.0268
Route complexity30.0268
Ship front and rear spacing50.0446
ManagementNavigation regulation rationality350.3125
VTS (vessel traffic service)
coordination degree
20.0179
Early warning and emergency reliability100.0893
HumanOnboard officer duties500.4464
Onboard officer skill510.4554
ShipShip age150.1340
Ship navigation performance210.1875
Table 4. Statistics of experts being interviewed.
VariableDescriptionFrequencyPercentage (n = 982): %
OccupationProfessor202.03
Research assistant454.58
Associate professor555.60
Captain909.16
Chief officer909.16
Second officer13013.24
Third officer12012.22
Sea pilot16016.30
Shipping company manager15515.79
Maritime organizations11711.92
Education levelDoctor606.11
Master14014.26
Bachelor78279.63
Table 5. Initial inputs of risk factors.
Risk SourceThe Probability of Risk Occurrence PRisk Factor Influence Degree I
Beaufort wind scale is greater than 60.37530.101
Visibility0.04110.851
Wave level0.26780.005
Flow state0.22320.102
Tidal0.58930.521
Flow0.29460.057
Channel water depth0.02680.098
Speed0.02680.075
Route complexity0.02680.054
Navigational regulation rationality0.31250.094
VTS coordination degree0.01790.065
Early warning and emergency reliability0.08930.032
Onboard officer duties0.44640.125
Onboard officer skill0.45540.421
Ship navigation performance0.18750.098
Ship age0.13400.125
Ship traffic flow density0.66960.651
Ship front and rear spacing0.04460.158
Table 6. Cloud parameters of risk factors of ship navigation in traffic-intensive waters.
Cloud Parameter E x 1 E n 2 H e 3
Beaufort wind scale is greater than 60.03650.05840.0325
Visibility0.04000.09550.1528
Wave level0.00130.00240.0009
Flow state0.02240.04390.0117
Tidal0.30790.31570.1843
Flow0.01680.02970.0144
Channel water depth0.00260.00650.0145
Speed0.00160.00390.0100
Route complexity0.00120.00300.0075
Navigational regulation rationality0.03040.05150.0268
VTS coordination degree0.00100.00260.0077
Early warning and emergency reliability0.00280.00630.0064
Onboard officer duties0.05590.07750.0462
Onboard officer skill0.18310.25940.1538
Ship navigation performance0.01850.03770.0075
Ship age0.01690.03660.0221
Ship traffic flow density0.43750.35970.1894
Ship front and rear spacing0.00900.02130.0298
1Ex is parameter to measure the risk factor indicators of a ship navigation system. 2 En is the expected value. 3 He is the standard deviation.