Article

Study on the Optimal Wave Energy Absorption Power of a Float in Waves

1
School of Naval Architecture and Ocean Engineering, Harbin Institute of Technology, Weihai 264209, China
2
Institute of Ship and Ocean Engineering Hydrodynamics, Shandong Institute of Shipbuilding Technology, Weihai 264209, China
3
Tianjin Research Institute for Water Transport Engineering, M.O.T., Tianjin 300456, China
4
College of Engineering, Ocean University of China, Qingdao 266100, China
*
Author to whom correspondence should be addressed.
J. Mar. Sci. Eng. 2019, 7(8), 269; https://doi.org/10.3390/jmse7080269
Submission received: 6 July 2019 / Revised: 10 August 2019 / Accepted: 10 August 2019 / Published: 13 August 2019

Abstract

:
The utilization of ocean renewable energy, especially wave energy, is of great significance in ocean engineering. In this study, a three-dimensional numerical wave tank was established to simulate the wave-float interaction based on the Reynolds-averaged Navier–Stokes equations and the Realizable K-Epsilon Two-Layer turbulence model was applied. Firstly, convergence studies with respect to the mesh and time step were carried out and confirmed by the published analytical and numerical data. Then, the resonance condition of a particular float was solved by both numerical and analytical methods. The numerical and the analytical results are mutually verified in good agreements, which verify the reliability of the analytical process. Furthermore, a wave energy converter (WEC) consisting of a single float without damping constant was adopted, and its hydrodynamic performance in different wave conditions was investigated. It was found that the damping factor can affect the motion response of the float and the wave force it receives. Under a certain wavelength condition, the WEC resonates with the wave, at which the wave force on the float, displacement of the float and other parameters reach a maximum value. Finally, the influence of linear damping constant on the power take-off (PTO) was studied. The results show that the damping factor does not affect the wave number turning point of the optimal damping constant.

1. Introduction

Energy and environment are key issues for humans and their development. Due to the problems of environmental pollution and energy deficit, the development and utilization of renewable energy have received strong attention by more and more countries [1,2]. Benefiting from the advantages of wide distribution, large reserves, renewable and no pollution, wave energy has received extensive attention. Barstow et al. [3] reported that wave energy can provide more than 2 TW, which is the same order of the world’s electricity consumption.
Wave energy is usually captured by motions of a wave energy converter (WEC) [4]. While development of modern wave energy converter dates back to 1799 [5], the technology did not receive worldwide attention until the 1970s, when an oil crisis occurred and Stephen Salter published a notable paper about the technology in Nature in 1974 [6]. Early research mainly focused on the oscillating water column WECs, but the device is (1) expensive to build, (2) has low conversion efficiency (10–30%) and (3) high cost of power generation [7,8,9]. At present, the main focus is on the oscillating float-type (point absorption) WECs [10,11,12]. The float-absorber-type WEC reflects a simple but robust technology, which consists of buoys or floating bodies to capture the wave’s motion. A point absorber with a direct drive power take-off (PTO) system is the most efficient and beneficial in converting the low-speed oscillating motion of ocean waves [13]. Bhatta et al. [14] carried out numerical study on the cylindrical shape point absorption WEC, and analyzed the hydrodynamic performance under different degrees of freedom such as surge, heave and pitch by using the mathematical technique method. Zheng et al. [15,16] studied the diffraction and radiation of a square floating structure under the condition of three-dimensional wave incidence, and analyzed the influence of different incident wave directions on the force and hydrodynamic performance of the WEC by using the eigenfunction expansion matching method. Shen et al. [17] used a semi-analytical method to solve the parameters of the wave excitation force and additional mass of the cylindrical WEC. Vantorre et al. [18] employed a software named AQUA+ to study floating structures with cylindrical, conical and hemispherical shapes at the bottom. The numerical results show that the WEC energy capture efficiency of the tapered bottom structure is higher. However, Backer et al. [19] carried out their research by boundary element method and shows that the difference in WEC energy capture efficiency between different shapes of float structures is small.
Consequently, the analysis of motion response of WEC in waves and its hydrodynamic performance is especially important. For hydrodynamic studies, analytical and semi-analytical methods have been used for wave-structure interaction, especially for simple geometries [20,21]. Potential flow theory is another widely used numerical approach. Since potential flow solvers are not easy to take the viscous effect into account, which may affect the accuracy of numerical results [22,23,24]. Recently, CFD (Computational Fluid Dynamics) method has been widely used to simulate the complicated interaction between strong nonlinear waves and floating bodies. Yu et al. [25] studied a two-body floating-point absorber (FPA) WEC system, and analyzed the hydrodynamic response and the power absorption performance of the system in regular waves. The study showed that the nonlinear effects could significantly decrease the power output and the motion of the FPA system, particularly in larger waves. However, this study does not show the relationship between WEC power absorption and resonance condition. Gallizio et al. [26] studied the dynamics of an inertial wave energy converter by coupled a CFD method with a dynamic model of the power generation system. Coe et al. [27] predicted extreme loading in a two-body WEC using a combination of a time-domain model based on linearized potential theory and CFD method based on unsteady Reynolds-averaged Navier–Stokes equation. CFD is considered to be a good choice to analyze the hydrodynamic performance of WEC especially for real sea situation [28,29]. Recently, a commercial CFD solver, STAR-CCM+ becomes popular and powerful in ocean engineering [30,31,32]. In the present paper, the STAR-CCM+ was employed to analyze a WEC’s motion in waves.
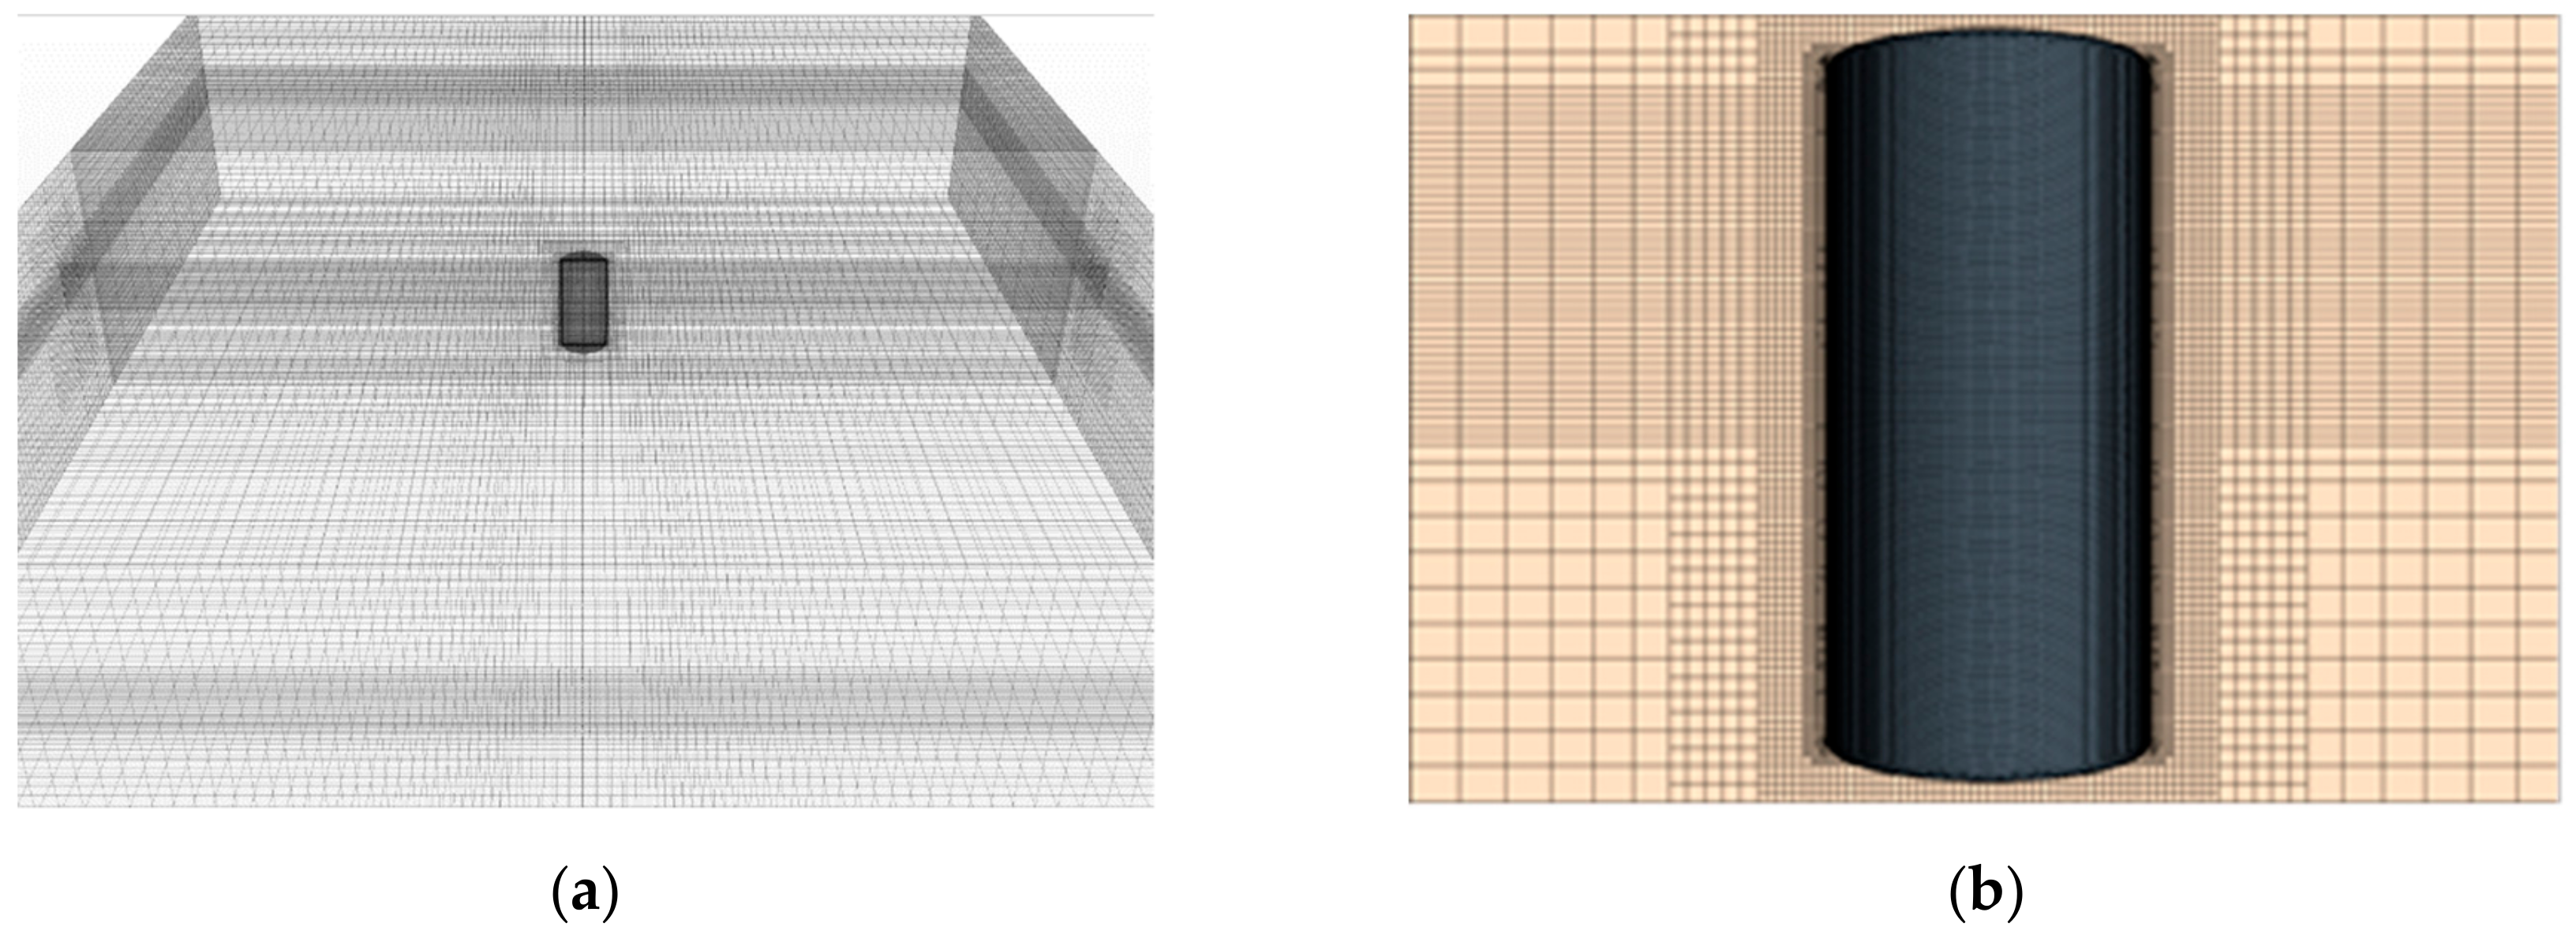
Firstly, a three-dimensional numerical wave tank was established by STAR-CCM+, then convergence studies with respect to mesh and time step were verified. The problem of a truncated column in regular waves was simulated and compared with a potential flow solver DIFFRACT and a CFD tool OpenFOAM [33] and available experimental data from MOERI [
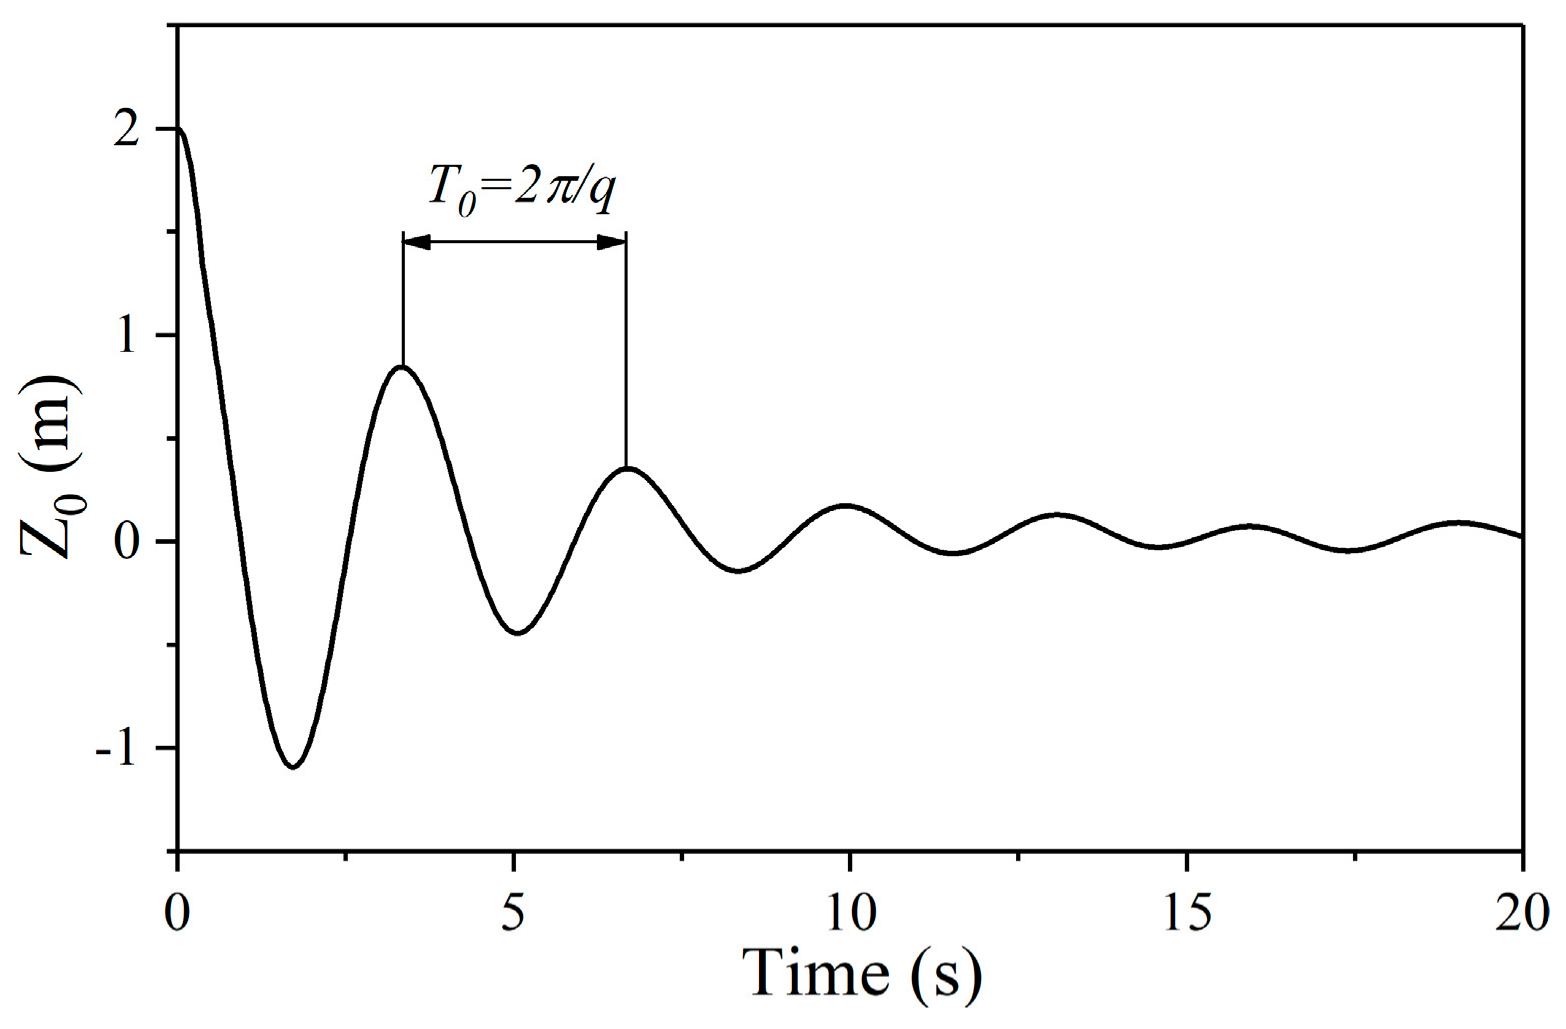
34]. Secondly, the resonance condition of a particular float was solved not only by numerical method but also by analytical method. The numerical results and the analytical results were mutually verified. The velocity and displacement of a float without damping constant were investigated against various wave numbers. Finally, the relationship between the optimal damping constants and wave number was studied. Some conclusions and future research directions were then considered.

2. Numerical Schemes and Validation

2.1. Free-Surface Capturing

The STAR-CCM+ can solve the Reynolds-averaged Navier–Stokes equations with/without fluid compressibility based on finite volume mesh method. The prism layer mesher, surface remesher and trimmed model are applied in the mesh continuum model. An implicit unsteady time-marching model is used in the physics continuum model, where the governing equations are discretized over a computational domain. The Realizable K-Epsilon Two-Layer turbulence model is applied with a two-layer all-y+ wall treatment model.
The volume of fluid method is applied to capture the water free surface. This modeling approach assumes that the mesh resolution is sufficient to resolve the position and the shape of the interface between multiple phases [35]. The distribution of phases and the position of the interface are described by the fields of phase volume fraction αi. The volume fraction of phase i is defined as:
α i = V i V
where V is the volume of a cell, and Vi is the volume of phase i in the cell. The volume factions of all phases in this cell are satisfied the following relationship:
i = 1 N α i = 1
where N is the total number of phases, N = 2 in the present study.

2.2. Numerical Wave Tank

Convergence studies of meshes and time steps for the multi-phase-flow numerical wave tank were first carried out to confirm the accuracy and efficiency of the present numerical model. The wave forcing method was implemented in the numerical wave tank, as shown in Figure 1. The 3D Navier–Stokes equations were solved in one domain, within the blue zones. No forcing was applied within the inner zone (3D Navier–Stokes), but within the outer zone (Forcing zone) the forcing source term was activated along boundaries of the computational domain. This method forces the solution of the discretized Navier–Stokes equations towards the theoretical solution over a specified distance, and it reduces the computational load by using a reduced-size solution domain. This forcing also eliminates problems that are associated with reflections of surface waves at boundaries, owing to the damping feature of the gradual forcing [35].
The lengths of upstream, downstream and forcing zone in the numerical wave tank were set as 3 L, 3 L, 2 L (L is the incident wavelength), respectively, while the width of the tank is 2.5 L, and forcing zone was set as 1 L. The water depth is 1.5 L. An extruder mesh was used to reduce the computational time and to provide additional numerical dissipation for energy consumption. The conditions of upstream and top boundaries are the velocity inlet, while the downstream is the pressure outlet, and the side and bottom is the slip wall.

2.2.1. Mesh Convergence

The systematic verification of the grid spacing in x-direction, ∆x, and in z-direction, ∆z, at the water free surface was carried out. The parameters of incident wave were set the same as that in Sun et al. [33], which are shown in Table 1. In Table 1, H is wave height, L is wave length, k is wave number, A is wave amplitude.
Three types of mesh, named Mesh A, Mesh B, and Mesh C, were studied. Mesh size of the free surface was 25% of the base size in x-direction (wavelength direction), while it was 12.5% of the base size in z-direction (wave height direction). The specific size and quantity of the meshes are shown in Table 2. The wave probes were located at distances of 1 L, 3 L from the entrance of the wave. The origin of the coordinate was at the center of mass of the truncated cylinder.
Figure 2 and Figure 3 show the wave elevations at different locations with three type of meshes. It can be seen from Figure 2b that when the waves reach the location of 3 L from the left entrance boundary, the amplitude of the waves is reduced by about 5% compared to the incident one, which is caused by physical and numerical dissipations. The difference of the wave elevation between the incident wave height and the measured wave height at 3 L location calculated by these three types of meshes is 2.96%, 2.44% and 1.85%, respectively. For balancing the numerical accuracy and computational cost, Mesh B is mainly used in the following studies otherwise specified.

2.2.2. Time-Step Convergence

The time-step convergence is verified in this section. The same wave conditions as Sun et al. [33] were studied. Mesh B with L (85) and H (17) was used, and then the time steps were set to ∆t = T/175, T/350 and T/700. The free-surface elevation at 3 L is shown in Figure 3. From Figure 3, it can be seen that the wave curves simulated by the time steps of T/350 and T/700 are basically the same, considering that the time required by the case of T/700 is significantly higher than that of the T/350. The time step of T/350 is employed in the subsequent calculations. Figure 4 shows the wave elevation in the calculation domain at t = 10 T (T is wave period). It can be seen that the wave propagates stably from the upstream to the downstream.

3. Free-Surface Elevation around a Truncated Column

3.1. Setting of Numerical Model

Based on the above validated numerical wave tank, the free-surface elevation around a column in strongly-nonlinear waves were studied and compared with the corresponding experimental data from MOERI [34]. The settings of numerical model are shown in Figure 5a. We used half of the computational domain in the following simulations to reduce the computational load benefit from the symmetry of body on the x-z plane. The radius of the column is r = 8 m, while the draft is 24 m. The positions of wave probes are shown in Table 3. The layout of the wave probes is shown in Figure 5b. The conditions of incident waves are shown in Table 1.
The meshes of the numerical wave tank and column are shown in Figure 6. The STAR-CCM+ extruder meshing model [35] was used in the width direction and the downstream, which not only increases the numerical dissipation of waves, but also saves the calculation time.

3.2. Comparison of Free-Surface Elevations

The RAOs (Response Amplitude Operator) of the wave-surface elevation around the truncated column under an incident wave of k0r = 0.657 (k0r is the dimensionless wave number, where k0 = 2π/L and L is wave length, r is the radius of column) was studied and compared with Sun et al. [33]. An average value of free-surface elevations at wave probes in 10 stable wave periods were obtained and plotted in Figure 7. The RAOs (1st harmonics) of the free-surface elevations were calculated by Fast Fourier Transform (FFT) and compared with the experimental data from MOERI [34]. The comparison results are shown in Table 4 and Table 5, in which the data of the potential flow solver DIFFRACT, and CFD tool OpenFOAM are from Sun et al. [33].
The RAOs (1st harmonics) was calculated as follows:
R A O 1 s t = ζ 1 A
where, ζ(1) is the 1st harmonics of the free-surface elevations, A is the amplitude of the incident waves.
From Table 4 and Table 5, it can be seen that the wave elevations at the probes are in good agreement with the experimental data—excepting wpo1 probe, which has a slight discrepancy—which verifies the accuracy of numerical model.
Figure 8 shows snapshots of wave elevations around the column in one wave period. From Figure 8, two different types of scattered waves are obviously seen. One is a concentric circular wave field, called Type-1 scattered-wave field, and the other is related to the motion of water surrounding the column surface, called Type-2 scattered-wave field. Type-1 scattered-wave field is primarily in the upstream direction, while Type-2 wave by passing the surface of the column and propagating to downstream and merging to form a water mound behind the column. These two types of scattered-wave fields were also reported by Swan and Sheikh [36] in their experimental measurements.

4. A Single Float in Different Waves

4.1. Resonance Frequency of a Single-Float WEC

Wave conditions for the following simulations were selected based on actual wave conditions in the South China Sea [37]. The selected wave parameters are shown in Table 6, where r and D are the radius and diameter of a float, respectively. The dimension parameters of the float are shown in Table 7.
According to Michael and Cormick [38], the heaving displacement of a single-float WEC system can be represented by:
z ( t ) = ( F 0 / ρ g A w p ) cos ( ω t + γ σ z ) ( 1 ω 2 / ω z 2 ) 2 + ( 2 Δ z ω / ω z ) 2 = Z 0 cos ( ω t + γ σ z )
where F0 is the amplitude of wave force, ρ is the density of fluid, Awp is the water plane area of the float, Z0 is the motion amplitude, ω is the circular wave frequency, t is time in seconds, γ is a phase angle that depends on the wave force components, and σz is a phase angle that depends primarily on the dimensionless system damping factor Δz, ωz is the natural heaving frequency. In this study, the float is symmetry about the x-z and y-z planes, so the phase angle γ is always equal to zero.
The natural heaving frequency can be represented by:
ω z = 1 m + m w ρ g A w p
where m is mass of the float, mw is added mass of the float. According to the data in Table 7, ωz is equal to 2.059, therefore, the dimensionless wave number (k0r) corresponding to natural heaving frequency is equal to k0r = 1.02.
The partial derivative of Z0 to ω equal to zero in Equation (4) can be obtained:
Z 0 ω = 0 ω = ω 0 1 2 Δ z 2
where ω’ is the circular frequency of resonance state considering the damping factor.
The damping factor Δz can be represented by:
Δ z = 1 q 2 ω z 2
where q is the natural heaving frequency of the float under radiation damping.
The q can be represented by:
q = 2 π / T 0
where T0 is the free vibration period of the float under radiation damping.
Figure 9 plots the free vibration curve of the WEC under radiation damping. The T0 is equal to 3.32 s in this research, therefore the q is equal to 1.945 rad/s, the Δz is equal to 0.329, the ω’ is equal to 1.823 rad/s. Therefore, the dimensionless wave number (k0r) corresponding to resonance condition considering damping factor (Δz) is equal to 0.85. In the following section, we utilize the numerical method to analyze the resonance state of float and to verify the reliability of the above process.

4.2. Hydrodynamic Performance and Motion Response of the Float

Figure 10a shows the motion response of the float. From Figure 10a, it can be seen that when the wavelength is greater than the resonance one, the magnitude of heave motion of the float is equal to the amplitude of the incident wave. (A is constant, A = 0.6m) The velocity of the float increases with the decrease of the incident wavelength. The maximum velocity of the float reaches 1.48 m/s when the resonance occurs. However, when the wavelength is smaller than the one at resonance condition, the magnitudes of displacement and velocity of the float begin to decrease, e.g., the maximum displacement of the float is only one third of the amplitude of the incident wave at k0r = 1.4–1.6.
Figure 10b plots wave forces acting on the float in different sea conditions; where Fx and Fz are the horizontal and vertical wave forces, respectively. From Figure 10b, it can be seen that when the wavelength is greater than the resonance one, the horizontal and vertical wave forces increase as the wavelength decreases. The resonance (k0r = 0.85) is turning point, when the incident wavelength is smaller than the resonance wavelength, the horizontal and vertical wave forces decrease as the wavelength decreases.
From the above analysis, we can see that the turning point from the numerical results is near k0r = 0.85, while the corresponding analytical results at the resonance condition considering damping factor is also at k0r = 0.85, which has already mentioned in section of ‘Resonance Frequency of a Single-Float WEC’. A good agreement between the numerical and analytical solutions is obtained, which verifies the reliability of the analytical process. Furthermore, we can find that the turning point of motion response and wave force is near k0r = 0.85 rather than 1.02, which means that the damping factor can affect the motion response of the float and the wave force it receives.

4.3. Influence of Linear Damping Constant on the PTO

In this section the power generation of the float-type WEC, which considers the equivalent damping, is calculated. In the WEC system, the equivalent damping of the generator is the resistance generated by the electrical generator. The work done by this resistance is the electric energy generated by the generator. We simplify the equivalent damping of the generator as a damping force fd acting on the float. The damping force, fd, is defined as:
f d = C d , f v
where Cd,f is the linear damping constant, v is the vertical velocity of the float.
The average power of a purely heaving symmetric float in waves is represented by:
P z = 1 T 0 T f d v d t
where fd is the damping force, T is the wave period.
Generally, under certain sea conditions, the WEC system has an optimal linear damping constant, which maximizes the overall power generation of the system. Figure 11 plots the variation of power generated by the float via the linear damping constant for different wavenumbers.
From Figure 11, it can be seen that (1) the power generated by the float increases first and then decreases with the increase of the linear damping constant. (2) when the wavelength is larger than the resonance condition (k0r = 0.85) as shown in Figure 11a, the value of the optimal linear damping constant increases with the increase of the wavelength; and the maximum of the power generated by the float slightly varies in long waves, which is basically concentrated at 5.0–5.5 kw; and the corresponding range of the optimal linear damping constants is from 35 kN-s/m to 80 kN-s/m. (3) However, when the wavelength is smaller than resonance condition, as shown in Figure 11b, the value of the optimal damping constant decreases as the wavelength increases; and the generation power is lower than the long wavelength, the maximum power is about 0.47–2.6 kw, and the corresponding range of the optimal linear damping constants is from 10 kN-s/m to 35 kN-s/m.
Figure 12 shows the optimal linear damping constant of WEC and the maximum power generated by the float with consideration of equivalent damping. The power generated by the float under the optimal linear damping constant decreases as the wavelength decreases. The optimal linear damping constants decrease first and then increase with the increases of wave number; the turning point is near k0r = 1.02, which is coincident with the analytical natural heaving frequency without consideration of damping. This means that the damping factor does not affect the wave number turning point of the optimal damping constant.

5. Discussion

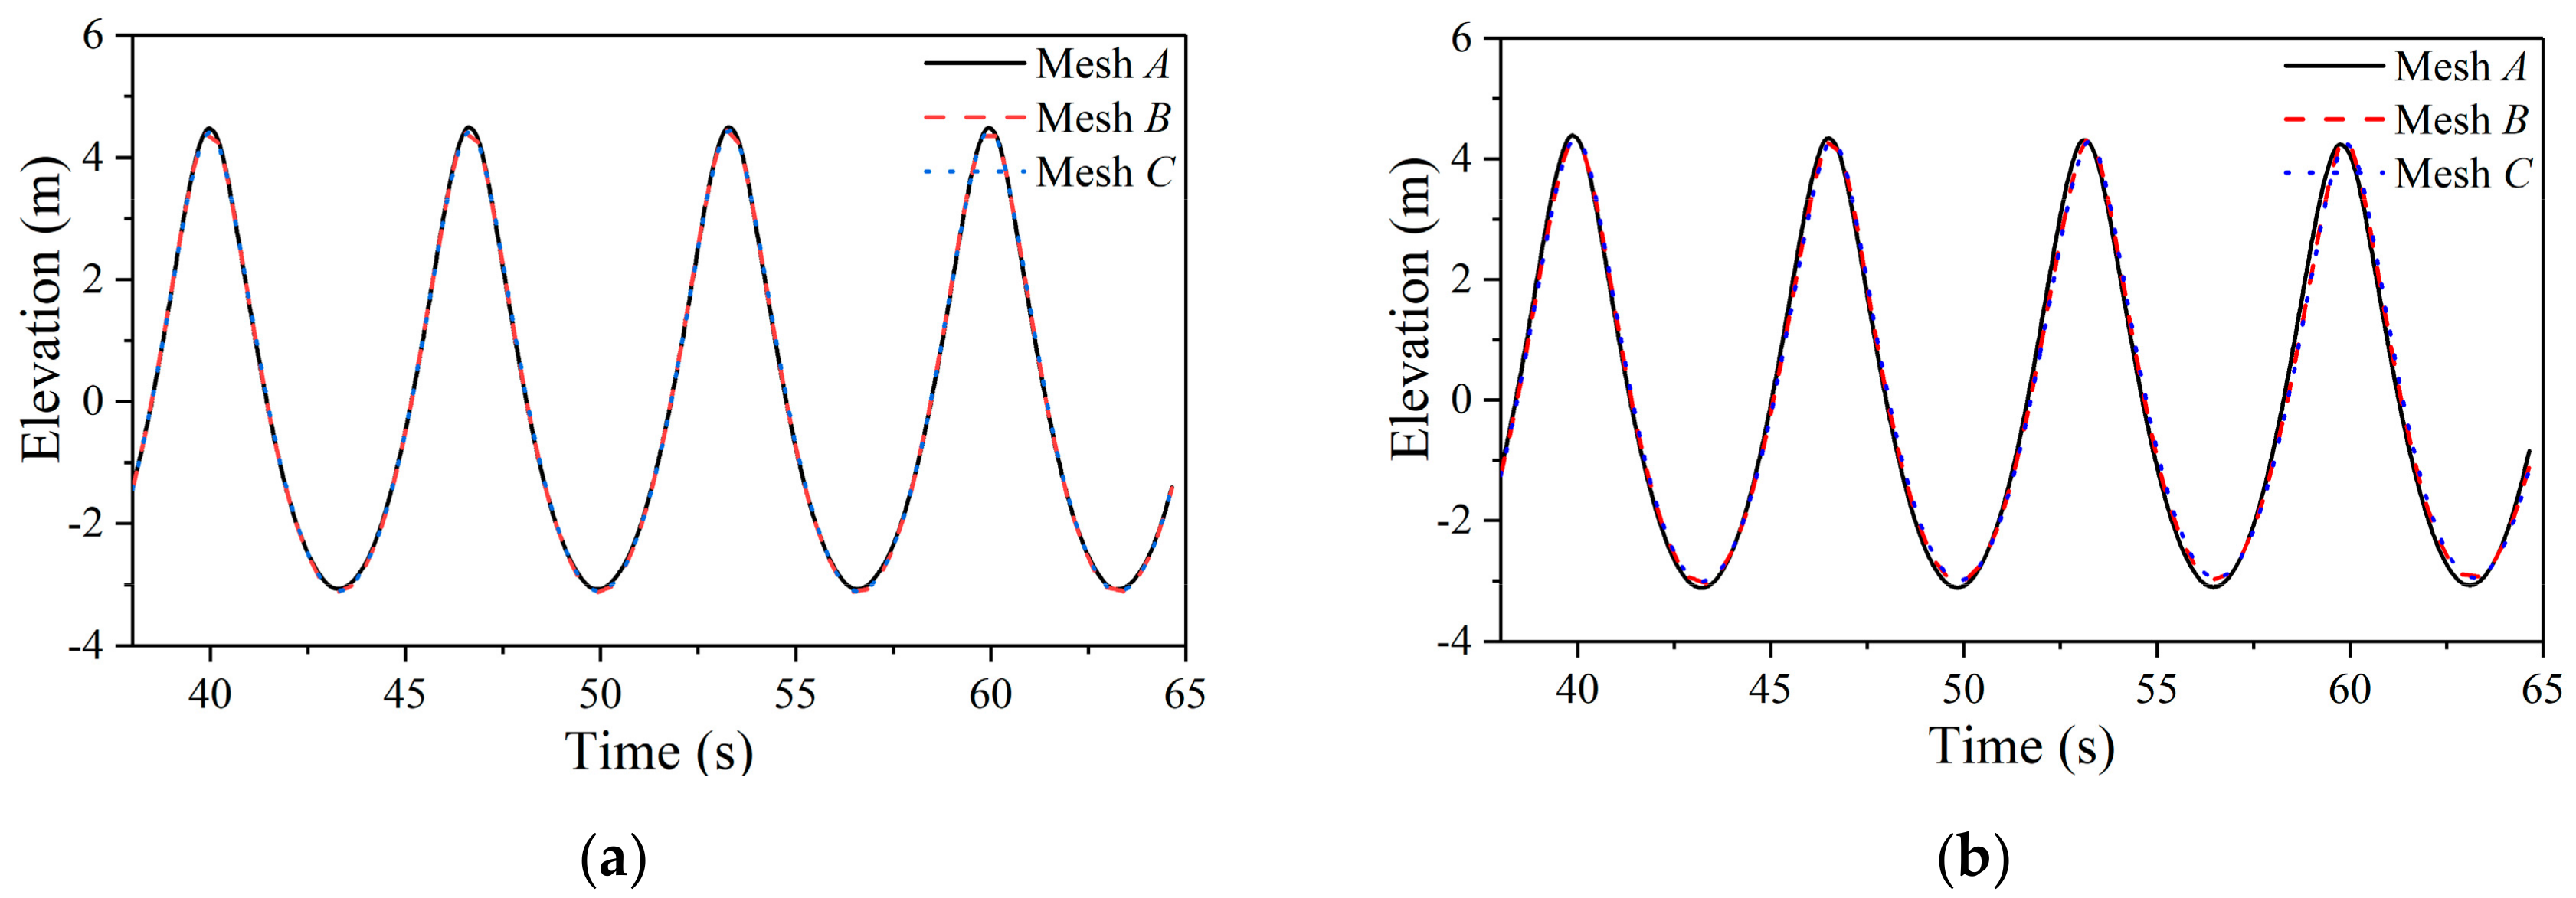
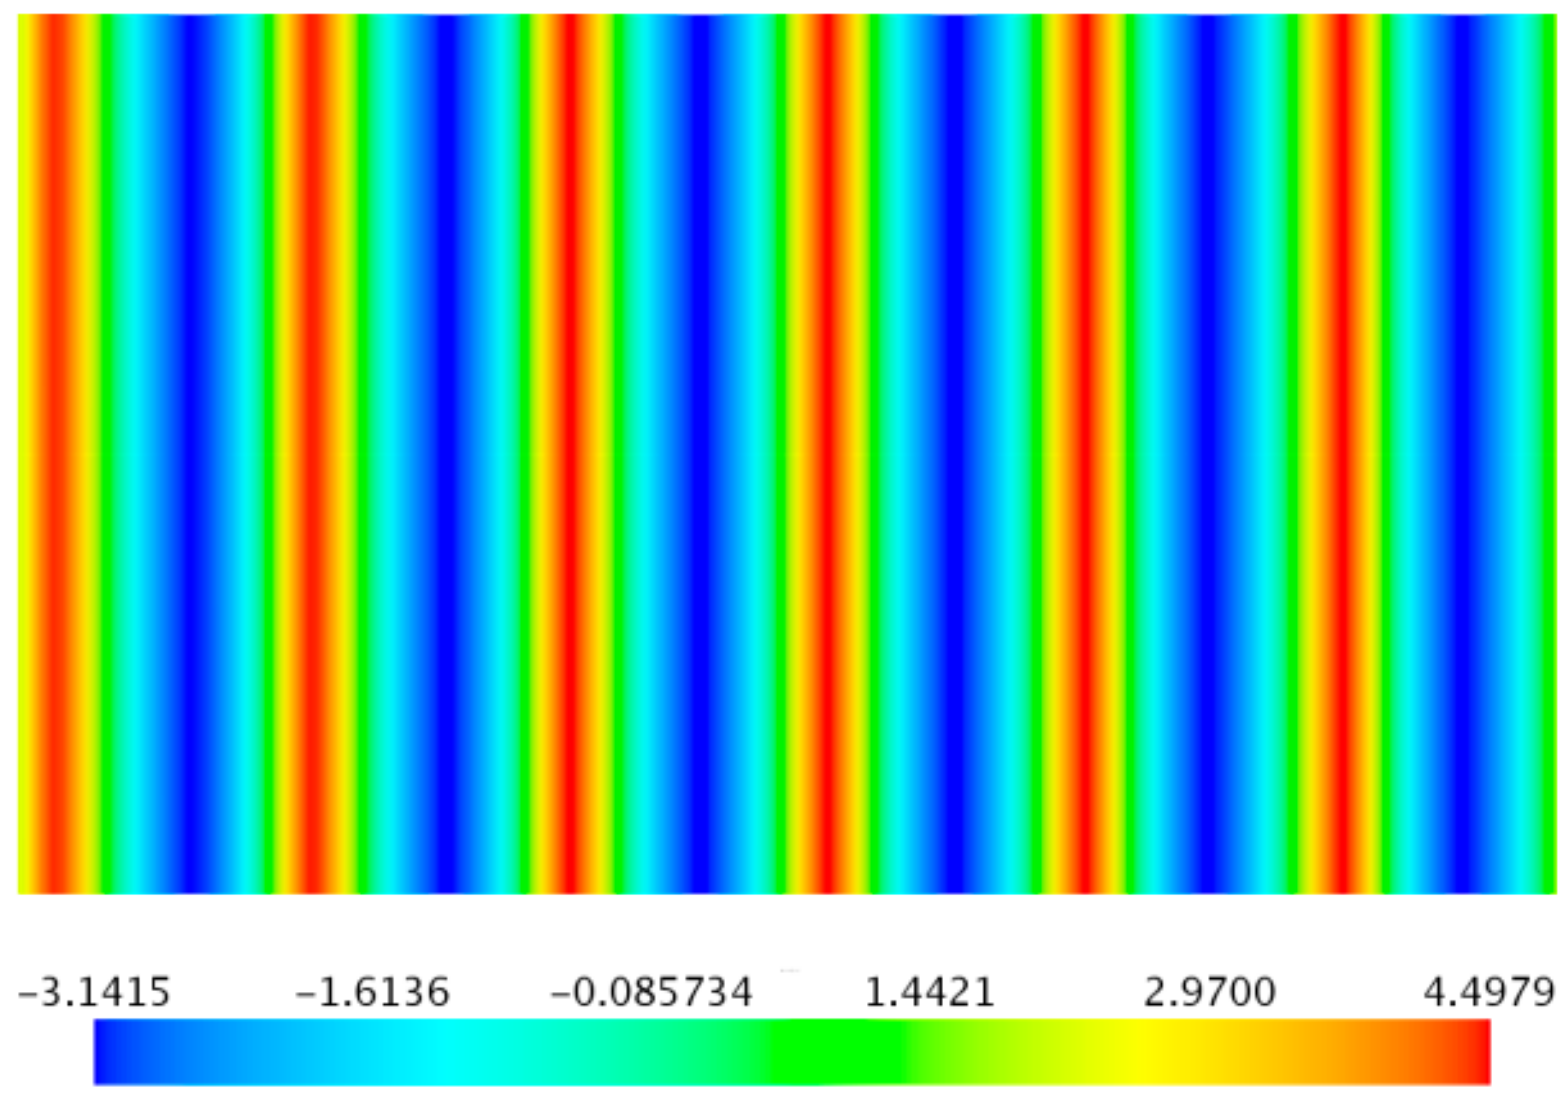
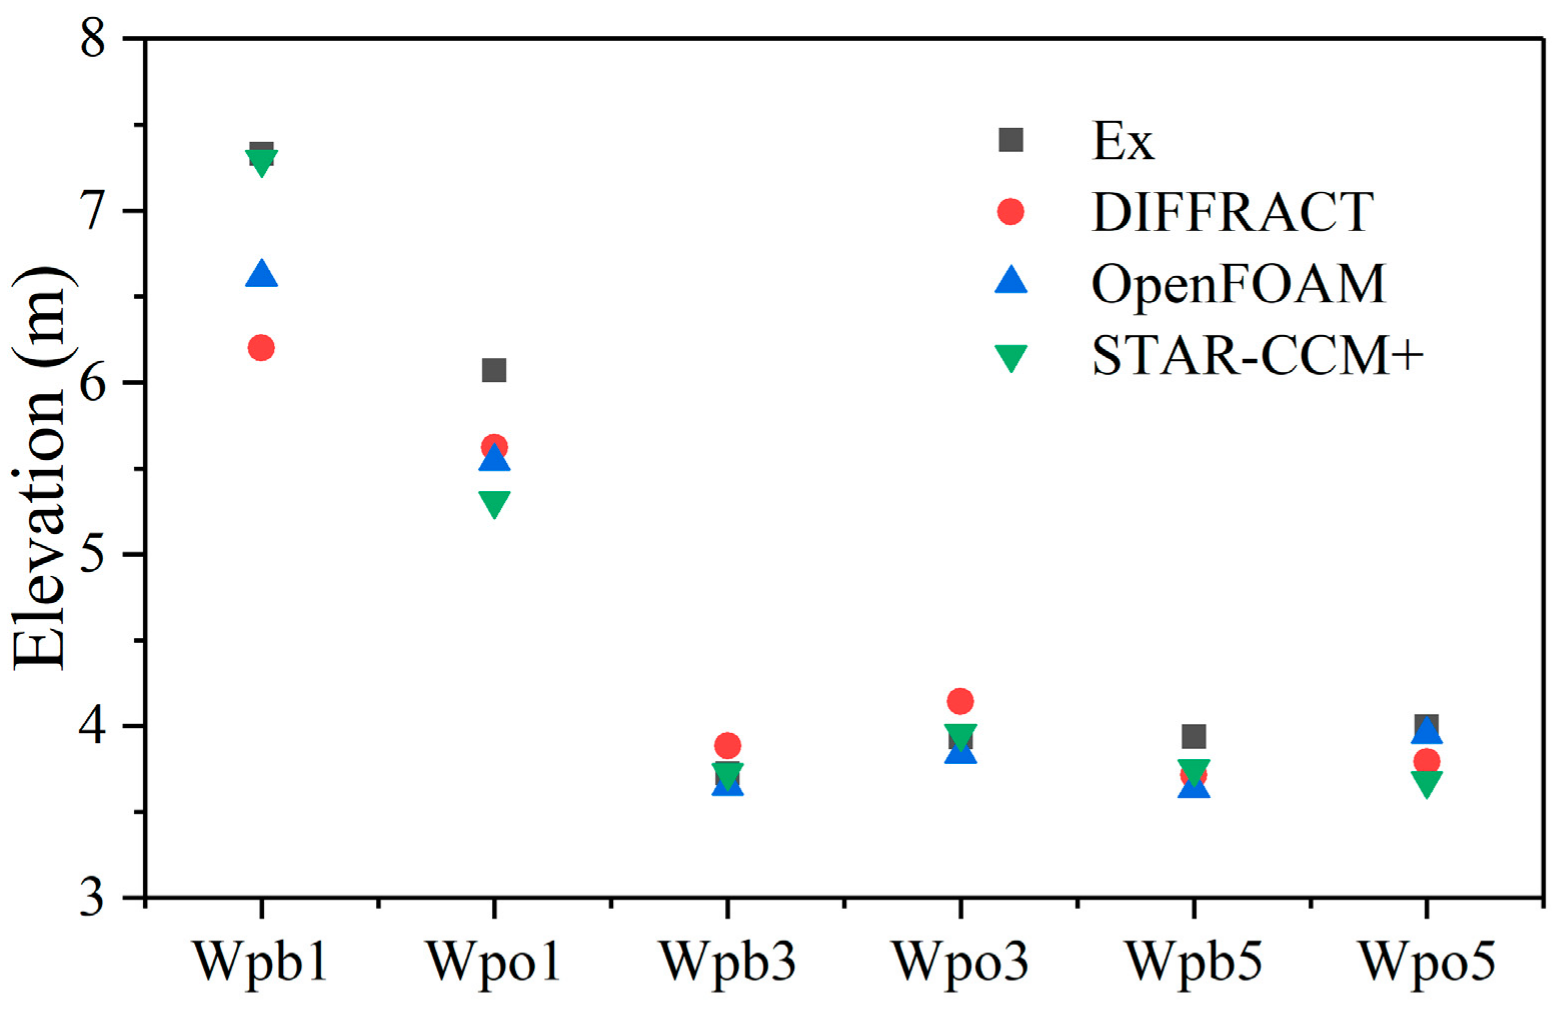
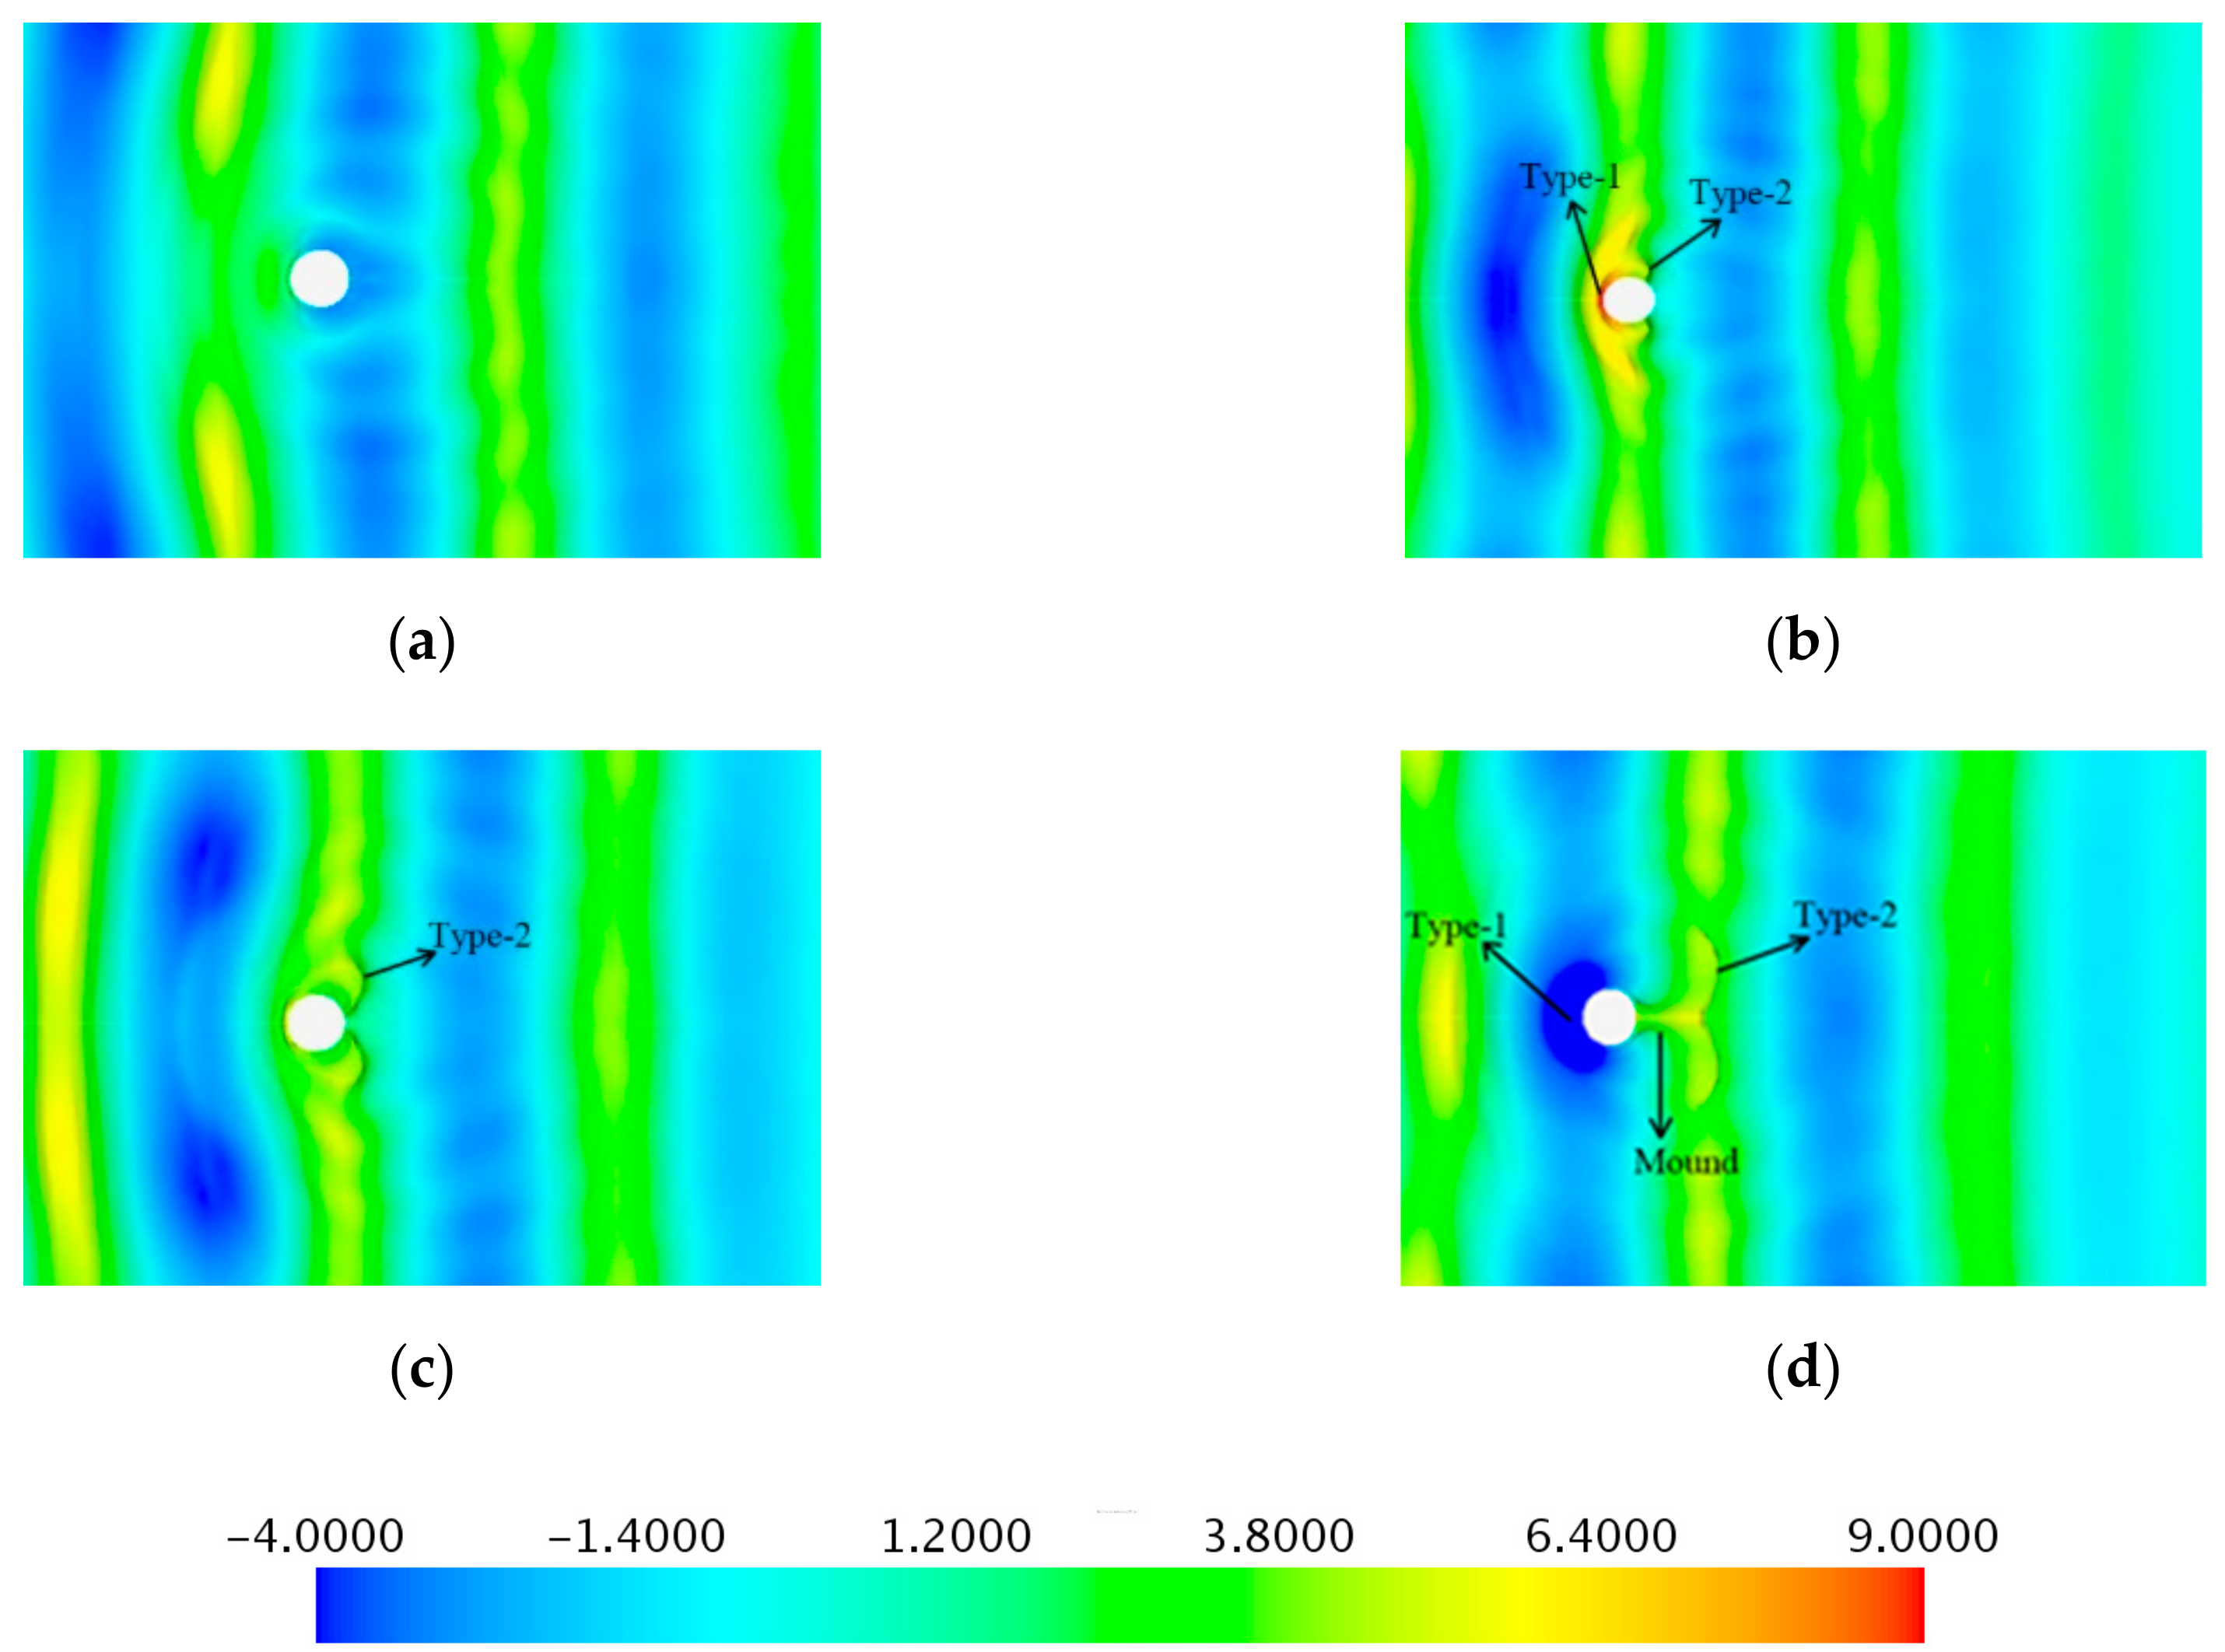
In this paper, a numerical model for calculating the hydrodynamic performance of a float was established. First, the numerical accuracy and reliability of the established multiphase flow numerical wave tank were verified by the convergence studies. Then the wave-surface elevations surrounding a truncated column in waves were simulated and compared with the corresponding experimental data from MOERI [34]. After, the resonance condition of a particular float was solved not only by numerical method but also by analytical method. The results are in good agreement, which verify the reliability of the analytical process. Then, the hydrodynamic forces and motion response of the float without the damping constants in different waves were evaluated, and the power absorption performance of the float considering the damping constants in different waves were studied.
The velocity amplitude and the displacement amplitude of a float without damping constant were investigated against various wave numbers. It was found that velocity amplitude and the displacement amplitude increase first and then decrease with the increases of wave number, with the turning point being near k0r = 0.85 rather than 1.02. This means that the damping factor can affect the motion response of the float and the wave force it receives.
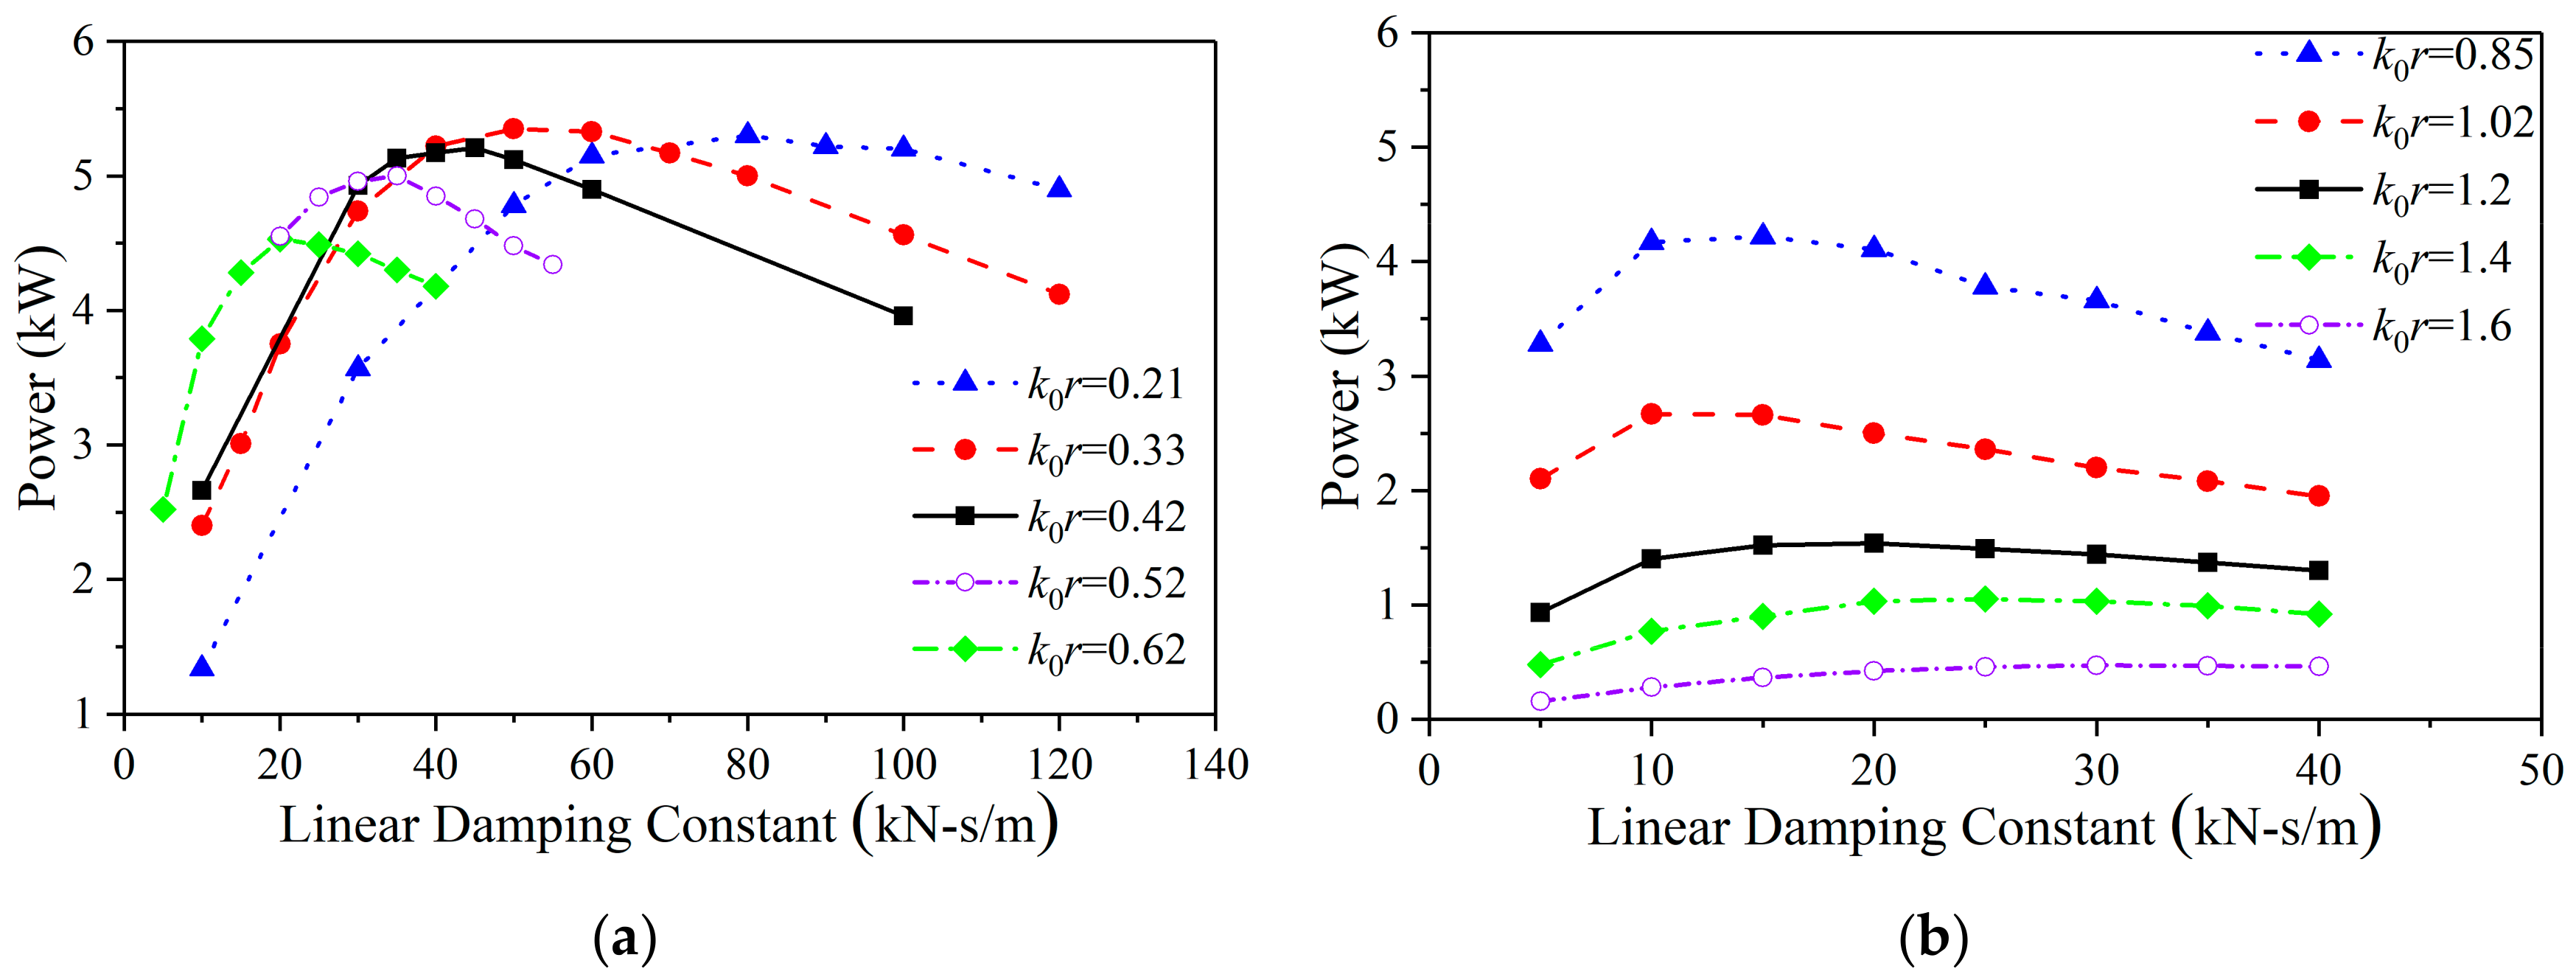
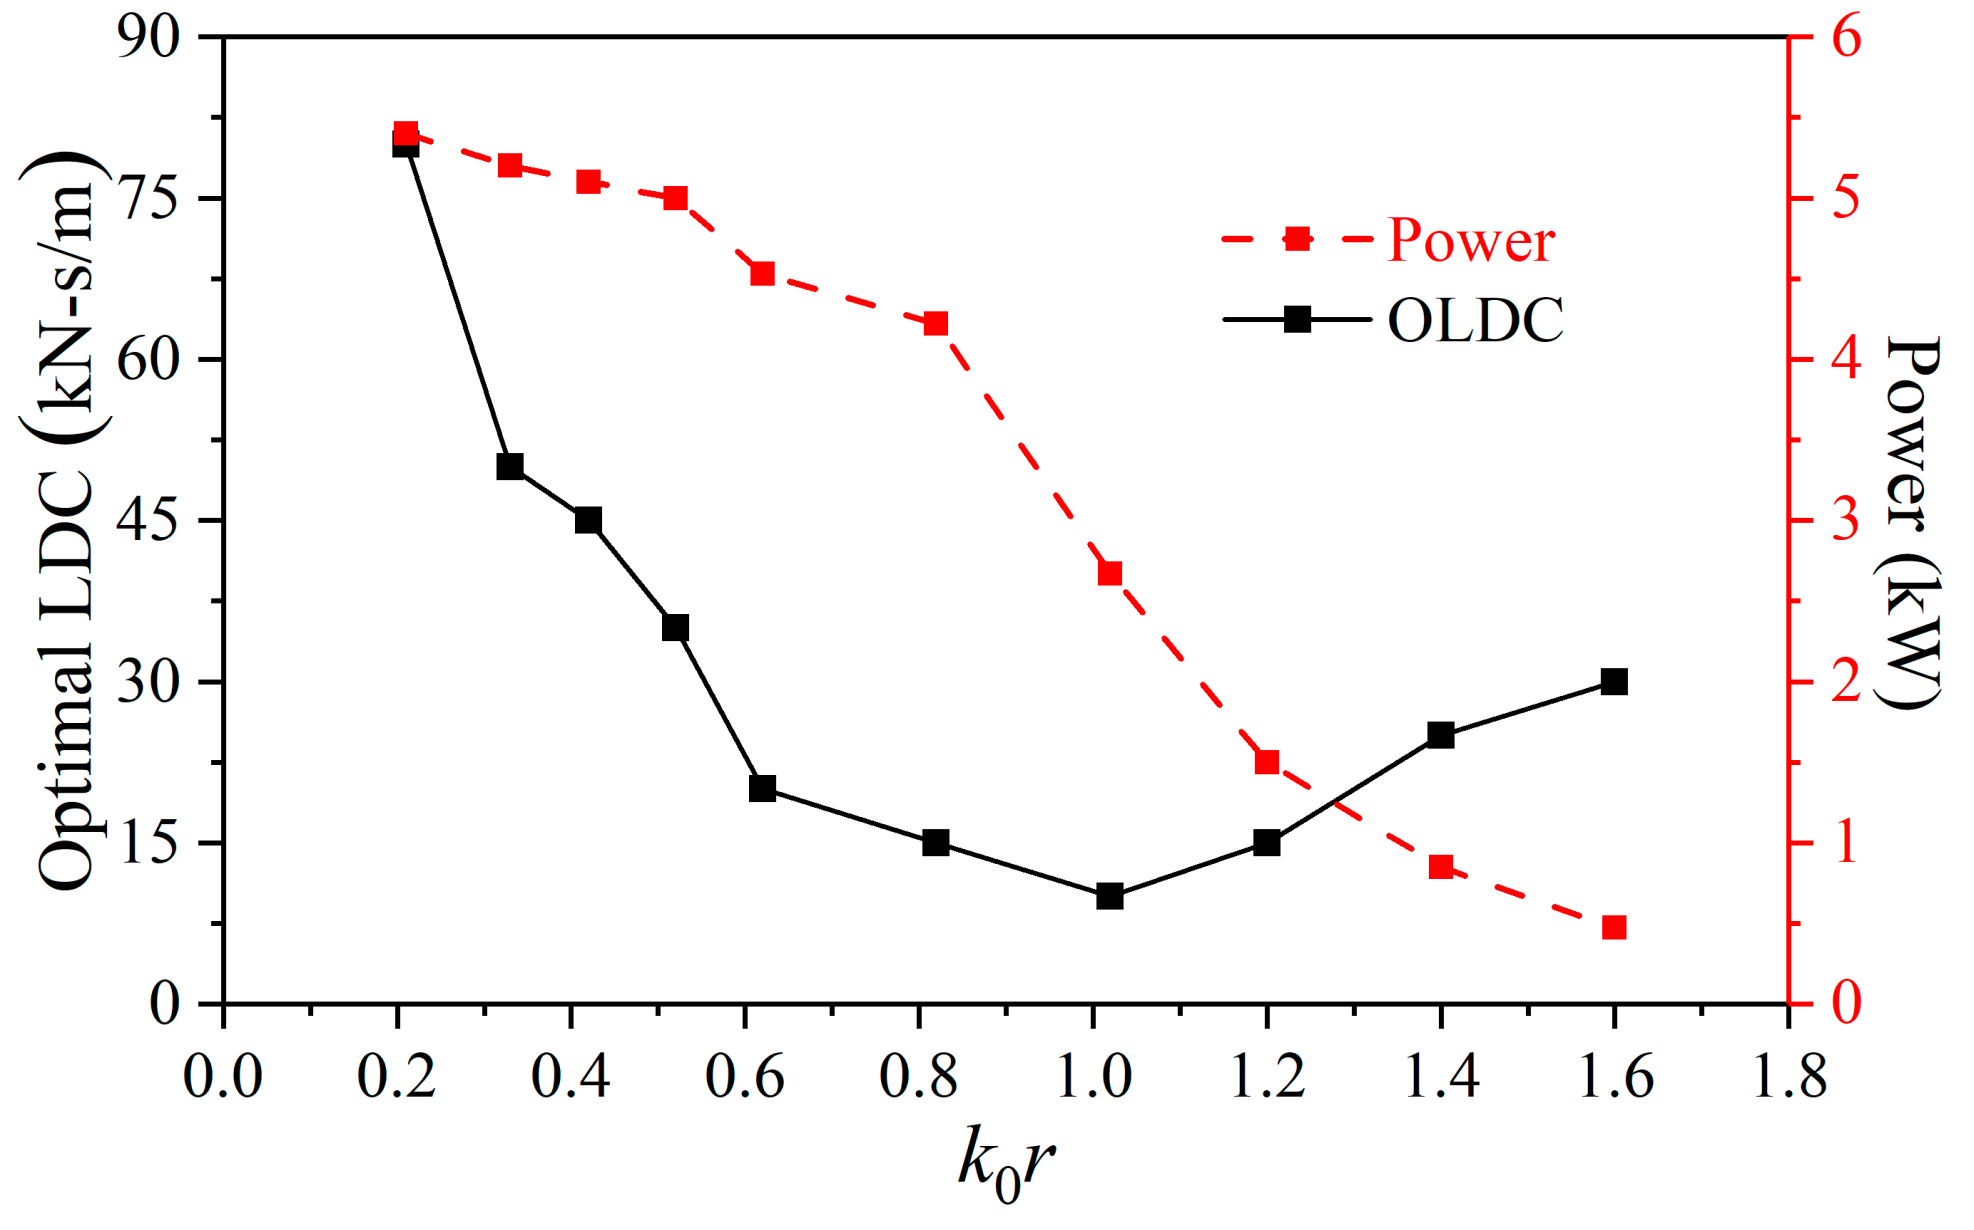
The relationship between the optimal damping constant and the wave number was obtained. When k0r > 1.02, the optimal damping constant increases as the wave number increases. When k0r < 1.02, the optimal damping constant decreases as the wave number increases. In other words, the turning point of optimal linear damping constants is near k0r = 1.02; this value is the analytical natural heaving frequency without consideration of damping. This means that the damping factor does not affect the wave number turning point of the optimal damping constant.
The power of the float generator under the optimal damping constant decreases as the wave number increases. When k0r < 0.42, the absorption power of the float at the optimal damping constant is basically the same (5.5 kW).
The study provided an analytical approach to solving the resonance condition of a specific float, and provided an insight into the hydrodynamic performance of a WEC system and its power generation with optimal linear damping constant in different waves.

Author Contributions

Conceptualization, G.H.; Data curation, C.L.; Formal analysis, Z.L.; Funding acquisition, G.H.; Investigation, R.J. and B.G.; Methodology, G.H.; Project administration, G.H.; Resources, G.H.; Software, Z.L.; Supervision, G.H.; Validation, Z.L., Z.Z. and P.J.; Writing—original draft, Z.L.; Writing—review & editing, G.H. and Z.Z.

Funding

This research was funded by National Natural Science Foundation of China (51579058), Marine Renewable Energy Fund Project in 2018, Application Demonstration of High Reliability Marine Energy Supply Equipment (GHME2018SF02).

Conflicts of Interest

The authors declare no conflicts of interest.

References

  1. Najam, A.; Cleveland, C.J. Energy and Sustainable Development at Global Environmental Summits: An Evolving Agenda. Environ. Dev. Sustain. 2003, 5, 117–138. [Google Scholar] [CrossRef]
  2. Dincer, I.; Rosen, M.A. A worldwide perspective on energy, environment and sustainable development. Int. J. Energy Res. 1998, 22, 1305–1321. [Google Scholar] [CrossRef]
  3. Barstow, S.; Mørk, G.; Mollison, D.; Cruz, J. The Wave Energy Resource. In Ocean Wave Energy, 2nd ed.; Springer: Berlin/Heidelberg, Germany, 2008; Volume 4, pp. 93–130. Available online: https://link.springer.com/chapter/10.1007%2F978-3-540-74895-3_4 (accessed on 17 March 2019).
  4. Muetze, A.; Vining, J.G. Ocean Wave Energy Conversion-A Survey. In Proceedings of the Conference Record of the 2006 IEEE Industry Applications Conference Forty-First IAS Annual Meeting, Tampa, FL, USA, 8–12 October 2006; Volume 3, pp. 1410–1417. [Google Scholar] [CrossRef]
  5. Ross, D. Power from Sea Waves, 1st ed.; Oxford University Press: Oxford, UK, 1995; Available online: https://www.mendeley.com/catalogue/power-waves-2/ (accessed on 24 July 2019).
  6. Salter, S.H. Wave power. Nature 1974, 249, 720–724. [Google Scholar] [CrossRef]
  7. Oreun, A. Hydrodynamic characteristics of an oscillating water column device. Appl. Ocean Res. 1996, 17, 155–164. [Google Scholar] [CrossRef]
  8. Curran, R.; Gato, L.M.C. The energy conversion performance of several types of Wells turbine designs. Proc. Inst. Mech. Eng. Part A J. Power Energy 1997, 211, 133–145. [Google Scholar] [CrossRef]
  9. Toyota, K.; Nagata, S.; Imai, Y.; Setoguchi, T. Effects of Hull Shape on Primary Conversion Characteristics of a Floating OWC “Backward Bent Duct Buoy”. J. Fluid Sci. Technol. 2008, 3, 458–465. [Google Scholar] [CrossRef]
  10. Alves, M.; Traylor, H.; Sarmento, A. Hydrodynamic optimization of a wave energy converter using a heave motion buoy. In Proceedings of the 7th European wave and Tidal Energy Conference, Porto, Portugal, 11–13 September 2007; pp. 11–14. Available online: https://www.mendeley.com/catalogue/hydrodynamic-optimization-wave-energy-converter-using-heave-motion-buoy/ (accessed on 24 July 2019).
  11. Eriksson, M.; Waters, R.; Svensson, O.; Leijon, M. Wave power absorption: Experiments in open sea and simulation. J. Appl. Phys. 2007, 102, 034105. [Google Scholar] [CrossRef]
  12. Falcão, A.F. Modelling and control of oscillating-body wave energy converters with hydraulic power take-off and gas accumulator. Ocean Eng. 2007, 34, 2021–2032. [Google Scholar] [CrossRef]
  13. Pastor, J.; Liu, Y. Hydrokinetic Energy Overview and it’s Renewable Energy Potential for the Gulf of Mexico. In Proceedings of the 2012 IEEE Green Technologies Conference, Tulsa, OK, USA, 19–20 April 2012. [Google Scholar] [CrossRef]
  14. Bhatta, D.D.; Rahman, M. On scattering and radiation problem for a cylinder in water of finite depth. Int. J. Eng. Sci. 2003, 41, 931–967. [Google Scholar] [CrossRef]
  15. Zheng, Y.H.; Shen, Y.M.; You, Y.G.; Wu, B.J.; Jie, D.S. Wave radiation by a floating rectangular structure in oblique seas. Ocean Eng. 2006, 33, 59–81. [Google Scholar] [CrossRef]
  16. Zheng, Y.H.; You, Y.G.; Shen, Y.M. On the radiation and diffraction of water waves by a rectangular buoy. Ocean Eng. 2004, 31, 1063–1082. [Google Scholar] [CrossRef]
  17. Shen, Y.M.; Zheng, Y.H.; You, Y.G. On the radiation and diffraction of linear water waves by a rectangular structure over a sill. Part I. Infinite domain of finite water depth. Ocean Eng. 2005, 32, 1073–1097. [Google Scholar] [CrossRef]
  18. Vantorre, M.; Banasiak, R.; Verhoeven, R. Modelling of hydraulic performance and wave energy extraction by a point absorber in heave. Appl. Ocean Res. 2004, 26, 61–72. [Google Scholar] [CrossRef]
  19. Backer, G.D.; Vantorre, M.; Banasiak, R.; Beels, C.; Rouck, J.D. Numerical modelling of wave energy absorption by a floating point absorber system. In Proceedings of the 17th International Offshore (Ocean) and Polar Engineering Conference, ISOPE, Lisbon, Portugal, 1–6 July 2007; Available online: https://www.onepetro.org/conference-paper/ISOPE-I-07-186 (accessed on 24 July 2019).
  20. MacCamy, R.C.; Fuchs, R.A. Wave forces on piles: A diffraction theory. In Beach Erosion Board Office of the Chief Engineers; Technical Memorandum; Department of the Army: Arlington County, VA, USA, 1954; Volume 69, pp. 1–17. Available online: https://www.researchgate.net/publication/235139845_Wave_forces_on_piles_A_diffraction _theory (accessed on 17 March 2019).
  21. Taylor, E.R.; Hung, S.M. Second order diffraction forces on a vertical cylinder in regular waves. Appl. Ocean Res. 1987, 9, 19–30. [Google Scholar] [CrossRef]
  22. Lu, L.; Chen, X.B. Dissipation in the gap resonance between two bodies. In Proceedings of the 27th International Workshop on Water Waves and Floating Bodies, Copenhagen, Denmark, 22–25 April 2012; Available online: https://www.mendeley.com/catalogue/dissipation-gap-resonance-between-two-bodies (accessed on 17 March 2019).
  23. Song, R.; Zhang, M.; Qian, X.; Wang, X.; Dai, M.; Chen, J. A Floating Ocean Energy Conversion Device and Numerical Study on Buoy Shape and Performance. J. Mar. Sci. Eng. 2016, 4, 35. [Google Scholar] [CrossRef]
  24. Hardisty, J. Experiments with point absorbers for wave energy conversion. J. Mar. Eng. Techno. 2012, 11, 51–62. [Google Scholar] [CrossRef]
  25. Yu, Y.H.; Li, Y. Reynolds-Averaged Navier–Stokes simulation of the heave performance of a two-body floating-point absorber wave energy system. Comput. Fluids 2013, 73, 104–114. [Google Scholar] [CrossRef]
  26. Gallizio, F.; Bergmann, M.; Bracco, G.; Giorcelli, E.; Iollo, A.; Mattiazzo, G.; Ponzetta, M. A two-way coupling CFD method to simulate the dynamics of a wave energy converter. In Proceedings of the OCEANS 2015-Genova, Genoa, Italy, 18–21 May 2015. [Google Scholar] [CrossRef]
  27. Coe, R.G.; Rosenberg, B.J.; Quon, E.W.; Chartrand, C.C.; Yu, Y.; van Rij, J.; Mundon, T.R. CFD design-load analysis of a two-body wave energy converter. J. Ocean Eng. Mar. Energy 2019, 5, 99–117. [Google Scholar] [CrossRef]
  28. Agamloh, E.B.; Wallace, A.K.; Jouanne, A.V. Application of fluid-structure interaction simulation of an ocean wave energy extraction device. Renew. Energy 2008, 33, 748–757. [Google Scholar] [CrossRef]
  29. Westphalen, J.; Greaves, D.M.; Hunt-Raby, A.; Williams, C.J.K.; Taylor, P.H.; Hu, Z.; Omidvar, P.; Causon, D.M.; Mingham, C.G.; Stansby, P.K.; et al. Numerical simulation of wave energy converters using Eulerian and Lagrangian CFD methods. In Proceedings of the 20th International Offshore (Ocean) and Polar Engineering Conference, ISOPE, Beijing, China, 20–25 June 2010; Available online: https://www.researchgate.net/publication/286723909_Numerical_simulation_of_wave_energy_converters_using_Eulerian_and_Lagrangian_CFD_methods?ev=prf_high (accessed on 17 March 2019).
  30. Maggi, A.; Moreno, E.C.; Stansby, P.; Taylor, R.E.; Maggi, A. Wave energy conversion with high capture width by the three-float line absorber M4. In Proceedings of the 1st International Conference on Renewable Energies Offshore, RENEW 2014, Lisbon, Portugal, 24 November 2014; Available online: https://www.mysciencework.com/publication/show/wave-energy-conversion-high-capture-width-three-float-line-absorber-m4-c1d4a01f (accessed on 17 March 2019).
  31. Hann, M.R.; Greaves, D.M.; Raby, A. EGU General Assembly Conference Abstract, Physical measurements of breaking wave impact on a floating wave energy converter. In Proceedings of the EGU General Assembly Conference, Vienna, Austria, 7–12 April 2013; Available online: https://www.researchgate.net/publication/258784114_Physical_measurements_of_breaking_wave_impact_on_a_floating_wave_energy_converter (accessed on 17 March 2019).
  32. Yan, S.; Qiu, H.; Wang, G.Y.; Li, C.; Lv, N.; Wang, D.H. Research and design of the scale parameter of a wave energy gathering device. J. Dalian Marit. Univ. 2017, 43, 38–42. [Google Scholar] [CrossRef]
  33. Sun, L.; Zang, J.; Chen, L.; Chen, L.; Taylor, R.E.; Taylor, P.H. Regular waves onto a truncated circular column: A comparison of experiments and simulations. Appl. Ocean Res. 2016, 59, 650–662. [Google Scholar] [CrossRef] [Green Version]
  34. Ocean Engineering Committee. Final Report and Recommendations to the 27th ITTC; Ocean Engineering Committee: Copenhagen, Denmark, 2014. [Google Scholar]
  35. CD-adapco. User Guide STAR-CCM+; Version 14.02.010-R8; CD-adapco: Melville, NY, USA, 2019. [Google Scholar]
  36. Swan, C.; Sheikh, R. The interaction between steep waves and a surface-piercing column. Philos. Trans A Math. Phys. Eng. Sci. 2015, 373, 41251–41257. [Google Scholar] [CrossRef] [PubMed]
  37. Yi, F.; Feng, W.B.; Cao, H.J. Wave analysis based on era-interim reanalysis data in the south china sea. Mar. Forecast. 2018, 35, 44–51. [Google Scholar] [CrossRef]
  38. McCormick, M.E. Wave energy conversion. In Ocean Wave Energy Conversion, 2nd ed.; Courier Corporation: New York, NY, USA, 2007; Volume 4, pp. 45–59. [Google Scholar]
Figure 1. Numerical wave tank (top view).
Jmse 07 00269 g001
Figure 2. Wave elevation at different positions from the left entrance boundary: (a) 1 L from the left entrance boundary; (b) 3 L from the left entrance boundary.
Jmse 07 00269 g002
Figure 3. Wave elevations at a distance of 3 L from the left entrance boundary by using different time steps.
Jmse 07 00269 g003
Figure 4. Top view of wave-surface elevation in the computational domain at the time instant of 10 T.
Jmse 07 00269 g004
Figure 5. Numerical model: (a) numerical wave tank; (b) layout of wave probes.
Jmse 07 00269 g005
Figure 6. Meshes for the numerical wave tank and column: (a) numerical wave tank; (b) column.
Jmse 07 00269 g006
Figure 7. Free-surface elevations at different wave probes.
Jmse 07 00269 g007
Figure 8. Contours of the free-surface elevations (m): (a) t = 1/4 T; (b) t = 2/4 T; (c) t = 3/4 T; (d) t = T.
Jmse 07 00269 g008
Figure 9. The free vibration curve of the wave energy converter under radiation damping.
Jmse 07 00269 g009
Figure 10. Wave forces and motion responses of the float: (a) motion response; (b) wave force.
Jmse 07 00269 g010
Figure 11. Power absorption performance of the WEC system: (a) k0r = 0.21–0.62; (b) k0r = 0.85–1.6.
Jmse 07 00269 g011
Figure 12. Optimal linear damping constants and maximum power.
Jmse 07 00269 g012
Table 1. Wave parameters.
H/LkL (m)H (m)A (m)
1/100.08276.447.6443.822
Table 2. Meshes size and quantity.
MeshBase Size (m)Number of Cells per Wave LengthNumber of Cells for Wave Height HTotal Number
A4.76513768,385
B3.685171,258,783
C3.1105201,569,229
Table 3. Locations of wave probes.
Wave Probesx (m)y (m)
Wpb1−8.20.0
Wpb30.0−8.20
Wpb58.20.0
Wpo1−16.00.0
Wpo30.016.0
Wpo516.00.0
Table 4. RAOs of free-surface elevations at wpb1, 3 and 5.
Wpb1DifferenceWpb3DifferenceWpb5Difference
Experiment1.918-0.975-1.031-
DIFFRACT1.622−15.4%1.0174.3%0.972−5.7%
OpenFOAM1.731−9.7%0.955−2.1%0.951−7.8%
STAR-CCM+1.902−0.834%0.9760.103%0.9814−4.7%
Table 5. RAOs of surface elevations at wpo1, 3 and 5.
Wpo1DifferenceWpo3DifferenceWpo5Difference
Experiment1.588-1.030-1.046-
DIFFRACT1.471−7.4%1.0845.2%0.993−5.1%
OpenFOAM1.450−8.7%1.005−2.4%1.034−1.1%
STAR-CCM+1.389−12.5%1.0350.485%0.9633−7.9%
Table 6. Wave parameters (H = 1.2 m).
k0rL (m)T (s)H/LL/D
0.2176.570.01615.3
0.3347.55.50.0259.5
0.4237.54.880.0327.5
0.5230.214.360.046.04
0.6225.53.990.0475.1
0.8518.483.370.0653.7
1.0215.43.050.0783.1
1.213.092.780.0922.6
1.411.222.530.1072.2
1.69.822.330.1221.964
Table 7. Basic parameters of the float.
Draft (m)Radius (m)Density (kg/m3)Mass (kg)Added Mass (kg)
1.2172.5512.525,157.2821,354.17

