Article

Experimental Study for Wave-Induced Pore-Water Pressures in a Porous Seabed around a Mono-Pile

1
Department of Bridge Engineering, School of Civil Engineering, Southwest Jiaotong University, Chengdu 610031, China
2
College of River and Ocean Engineering, Chongqing Jiaotong University, Chongqing 400074, China
3
School of Engineering & Built Environments, Griffith University Gold Coast Campus, Gold Coast, QLD 4222, Australia
*
Author to whom correspondence should be addressed.
These authors contributed equally to this work.
J. Mar. Sci. Eng. 2019, 7(7), 237; https://doi.org/10.3390/jmse7070237
Submission received: 20 May 2019 / Revised: 12 July 2019 / Accepted: 18 July 2019 / Published: 21 July 2019

Abstract

:
In this paper, the results of a series of experiments on wave-induced pore-water pressures around a mono-pile are presented. Unlike the previous study, in which the mono-pile was fully buried, the mono-pile in this study was installed at 0.6 m below the seabed surface. In this study, we focus on the pore-water pressures around the mono-pile and beneath the pile. The experimental results lead to the following conclusions: (1) the seabed response is more pronounced near the surface (in the region above 30 cm deep), and the rate of pore pressure attenuation gradually slows down. For the region below 0.3 m, the response is much smaller; (2) in general, along the surface of the pile, pore pressures increase as the wave height and wave period increase; (3) the spatial distribution of pore pressure near the pile will vary with different wave periods, while the wave height only has a significant effect on the amplitude; and (4) At z = −0.15 m, the pore pressure in front of the pile is the largest, while at the point 0.1 m below the bottom of the pile, the largest pore pressure occurs behind the pile.

1. Introduction

Recently, the phenomenon of wave–seabed interactions around marine infrastructures has attracted considerable attention from coastal engineers in light of the growing activities in marine environments. Pile foundations are commonly used as a part of supporting structures, such as fixed-type platforms, offshore wind turbine foundations, etc. These pile foundations have been used to transfer the forces from the superstructure to the seabed.
It has been reported in the literature that the fluctuations in dynamic wave pressures on an ocean floor will further induce variations in pore-water pressures and effective stresses in the seabed. When the pore pressures become excessive and the effective stresses vanish, the seabed can become liquefied [1,2]. Once liquefaction occurs, the soil particle behaves as a heavy fluid and can be carried away by environmental loading. Furthermore, any structure on the liquefied seabed becomes unstable and loses its designed function. Therefore, an accurate prediction of pore-water pressures within the seabed is particularly important for the design of marine infrastructures. According to previous experimental and field studies, the mechanisms of pore-water pressure response of seabed under wave action can be divided into oscillatory and residual mechanisms [3,4,5]. Tzang and Ou [6], Wang et al. [7] and Kirca et al.’s [8] experimental results show that accumulation of pore pressure is distinct in a silty and clay seabed while not obvious in a sandy seabed. Furthermore, very fine-grain constituents have a great effect on wave-induced liquefaction. Nevertheless, in their experiment, there was no structure in the seabed, and the effect of a pile on the response of the seabed could not be considered. In this study, we focus on the oscillatory pore pressure in the seabed around a pile.
Numerous theoretical investigations of wave-induced pore-water pressures have been carried out so far. Based on Biot’s poro-elastic theory [9], Yamamoto et al. [10] presented analytical solutions for an infinite porous seabed. Madsen [11] derived an analytical solution for anisotropy porous seabed with infinite thickness. Then, Hsu and Jeng [12] derived an analytical solution for finite thickness seabed, which can converge to the previous solutions [10,11], on condition that the seabed thickness approaches infinity.
In addition to analytical approaches, numerous numerical simulations for wave-induced pore-water pressures around a pile have been performed. For example, Li et al. [13] examined the pore pressure around a pile using FEM (finite element method) model with linear and second-order Stokes wave loading. In their study, wave-pile interaction was ignored. Chang and Jeng [14] investigated the hydrodynamic loading and soil response around a high-rise platform structure for Donghai offshore wind turbine foundation, which consists of eight piles. Based on OpenFOAM open source code, Lin et al. [15] developed an integrated model to examine the soil response and seabed momentary liquefaction around a single pile. However, the initial stress used in their study was incorrect because the self-weight of the pile foundation was not included. Sui et al. [16] adopted the fully dynamic formulations to simulate the wave-induced seabed response around a mono-pile, and found that the presence of the pile and wave reflection and diffraction have significant effect on the pore pressure response. Later, Sui et al. [17] further extended their model to consider the residual soil response. In their models [16,17], the self-weight of the pile foundation was included. Zhang et al. [18] proposed a 3D integrated model for wave-induced seabed-pile interaction considering the pile rocking effect. It shows clearly that cyclic motion of pile has great effect on pore pressure distribution. Taking pile-soil interaction into account, Zhu et al. [19] introduced a kinematic hardening constitutive model of soil to simulate the wave-induced liquefaction of the seabed around a rocking pile.
Apart from numerical studies, three different experimental approaches have been used to study wave–seabed interactions: one-dimensional compression tests [3,20,21], geo-centrifuge tests [22], and wave flume tests [6,23,24,25,26,27].
In the one-dimensional compression tests, oscillatory pressures were applied to the top of the soil samples to generate oscillatory pore-water pressures within the soil column, so it cannot consider the shearing actions. The advantage of this approach is that more measurements can be obtained from the soil samples. However, because of the size of the facility, it is difficult to install a mono-pile in the model. Geo-centrifuge tests provide the same stress level in the model as that in the field. However, the simulation of wave generation has been questioned by coastal engineers, and no structure can be installed because the scale of the facility is small.
Wave flume tests have been a commonly used experimental approach to the exploration of wave–seabed interactions in the presence of a structure, although these tests have limitations that arise from the scale and the stress level within the seabed. Sumer’s research group conducted a series of wave flume experiments for both progressive waves and standing waves [24,25]. In their experiments, they focused on residual pore-water pressures and liquefaction. Recently, Qi and Gao [26,27] conducted a series of wave flume tests for wave-induced pore-water pressures around a mono-pile and discussed the relationship between pore-water pressure and local scour around a mono-pile. To the authors’ best knowledge, this might be the only experimental data available in the literature on pore pressures around a pile. In their experiments, they focused on the changes in pore pressure and scour that result from the combined action of the wave and current, and they only measured the pore-water pressure along the central line of the cylinder. Furthermore, a pile with a 20 cm diameter was fixed at the bottom of a tank with a sandy bed.
In this study, we re-examine wave-induced pore-water pressures in the vicinity of a mono-pile in a wave flume by taking more intensive measurements. Unlike Qi and Gao’s study [26,27], in our experiments, we focus on the pore-water pressure in the seabed around and under the mono-pile, rather than just the vertical distribution in a cross-section. The results of a series of comprehensive experiments are presented for readers to use for future model validation. On the basis of the experimental results, the effects of wave characteristics on wave-induced pore-water pressures are discussed. The measurement of pore pressures can be used to determine if the liquefaction occurs or not and predict the potential of liquefaction. The results can be applied to other offshore structures such as anchoring points of the mooring lines, pipelines, the immersed tube tunnel, the breakwater, pile group foundations, etc.

2. Physical Modeling

A series of wave flume tests were carried out to investigate the process of wave-driven pore-water pressure around a mono-pile foundation. In the present study, a larger pile with a 30 cm diameter was installed in the seabed (0.6 m below the seabed surface, with a seabed thickness of 1 m), and the wave profile, dynamic wave pressure, and pore-water pressure around the pile and the point below the pile were measured. These conditions result in more comprehensive measurements.

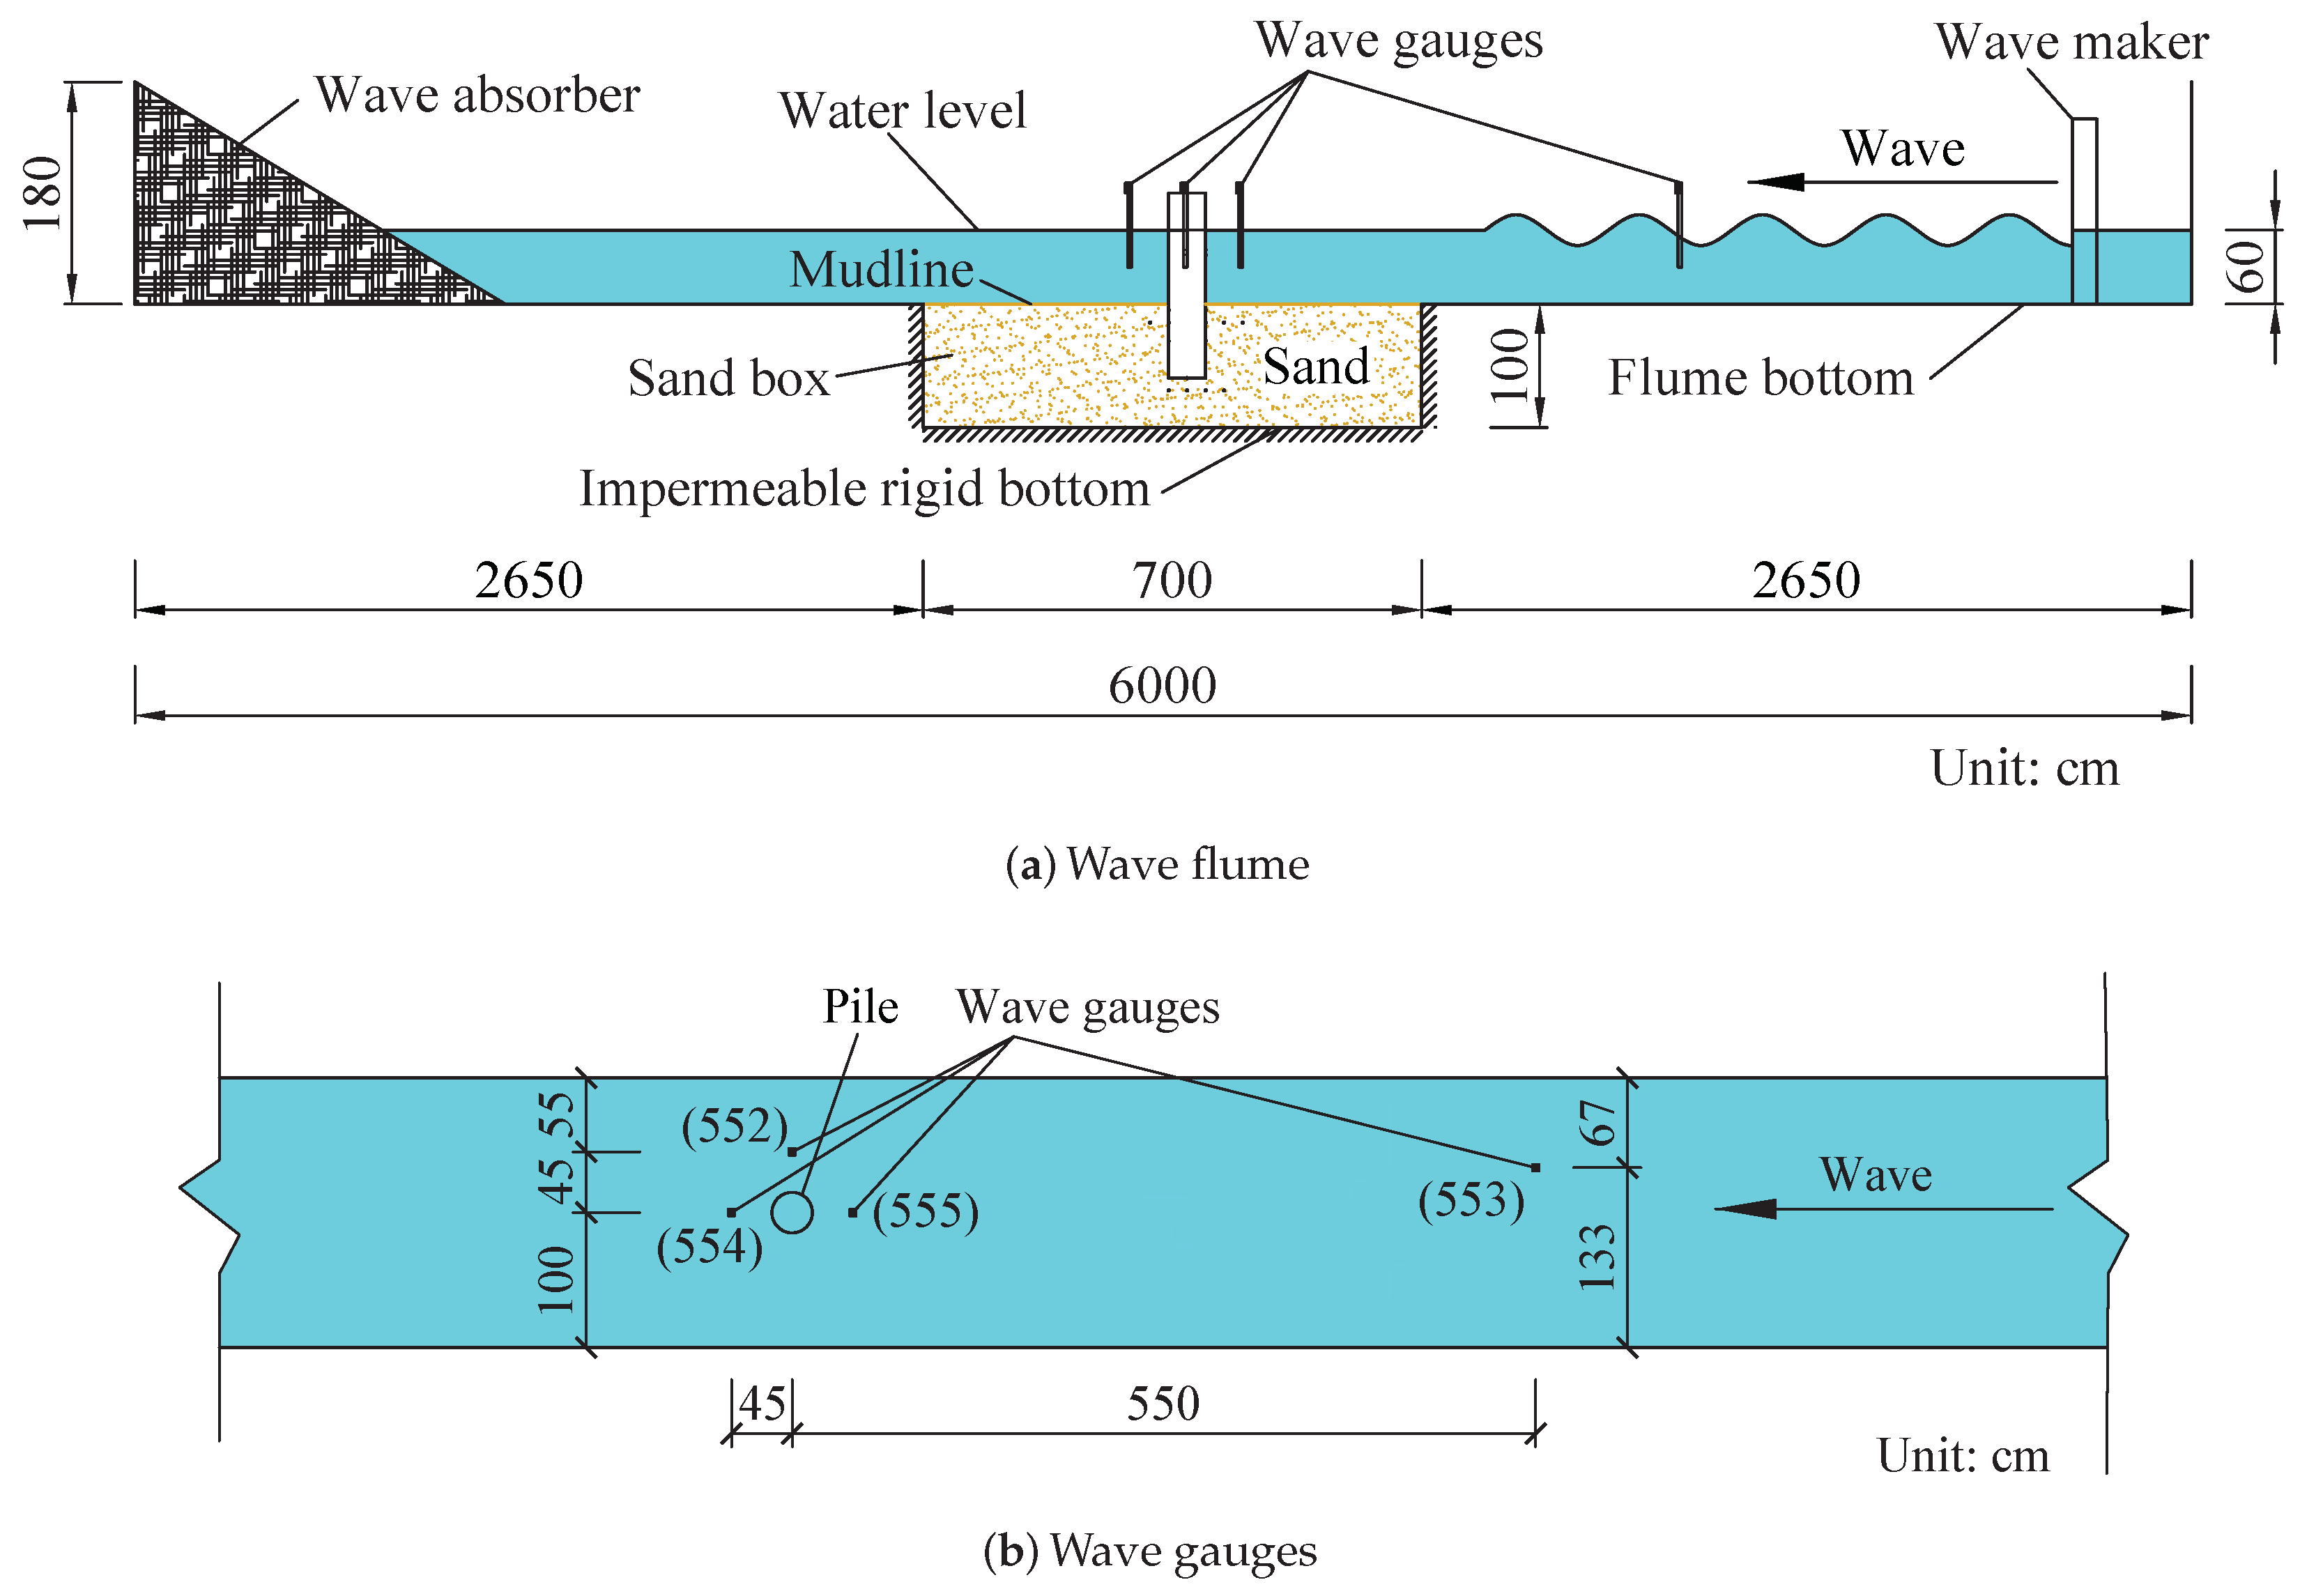
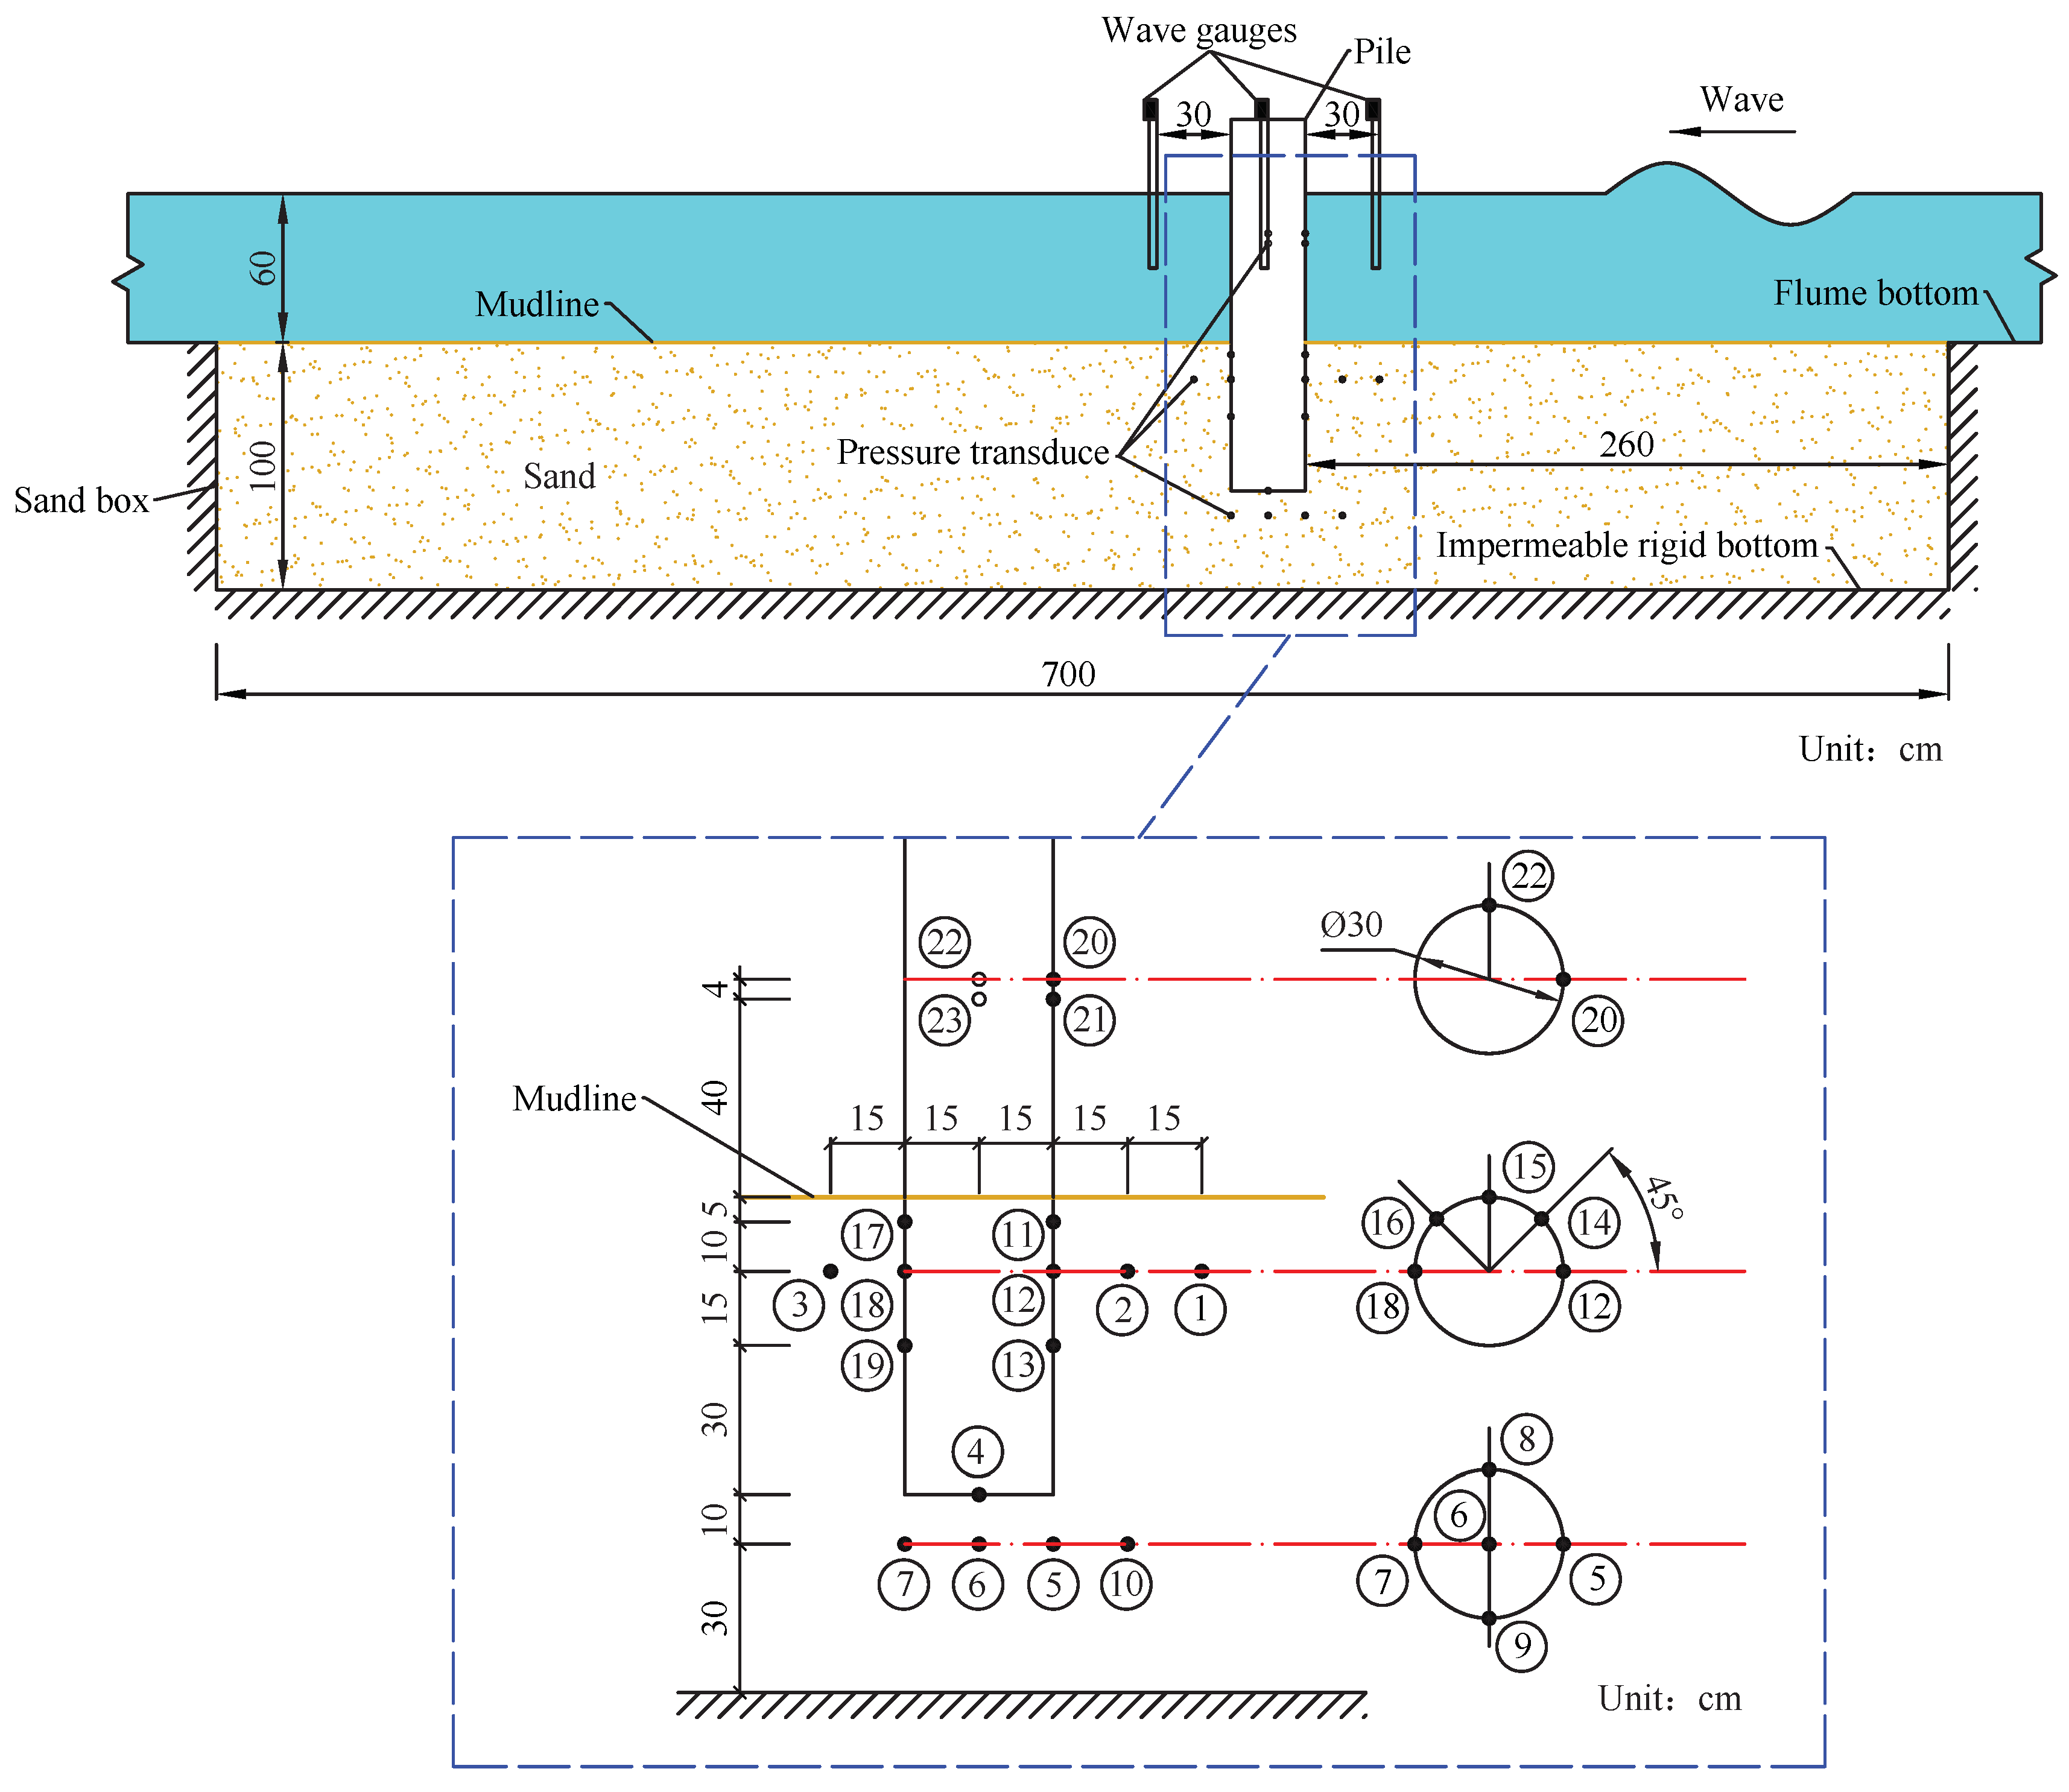
2.1. Experimental Setup

The experiments were conducted at Southwest Jiaotong University in a wave flume whose dimensions are 60 m (length) × 1.8 m (height) × 2.0 m (width). Figure 1 shows the experimental setup. As shown in Figure 2a, the wave flume is equipped with an upstream hydraulic piston-type wavemaker and a downstream wave absorber that dissipates the incoming wave energy to minimize the wave reflection effect. The wavemaker is capable of generating regular waves with a wave period of 0.6–2.0 s and a maximum wave height of 0.16 m. Located 21 m from the wave generator is a sediment tank; its dimensions are 7.0 m (length) × 2.0 m (width) × 1.0 m (depth), and it was manufactured specifically for the experiments (see Figure 3). The surrounding walls and the bottom of the test sand-pit are made of rigid and impermeable concrete. Note that the top and bottom ends of the pile are fixed with supports as shown in Figure 1, so that the vibration of the pile can be neglected.
In the experiments, the wave-induced pore-water pressure variation and the water surface elevation around a pile foundation were measured simultaneously by pore-water pressure transducers and wave height gauges, as listed in Table 1. The CY306 type pore-water pressure transducers (6 mm in outer diameter) are designed and manufactured by Shengying Cekong. The measurement range of these transducers is 30 kPa with an accuracy of ±0.1%. Nineteen (19) pressure transducers were installed within the seabed (Points 1–19 in Figure 3) to measure the pore-water pressures, and four (4) pressure transducers were installed on the wall of the cylinder (Points 20–23 in Figure 3) to measure the wave pressures acting on the mono-pile. The locations of the pressure transducers are depicted in Figure 3, and those located in the soil are fixed by the bracket shown in Figure 4. The switch and digital sensor hubs were used to collect the pressure data. Four (4) wave height gauges designed by Yufan Co. Ltd. (Chengdu, China) with a measurement range of 0.60 m and accuracy of 0.5% were installed (see Figure 2b).

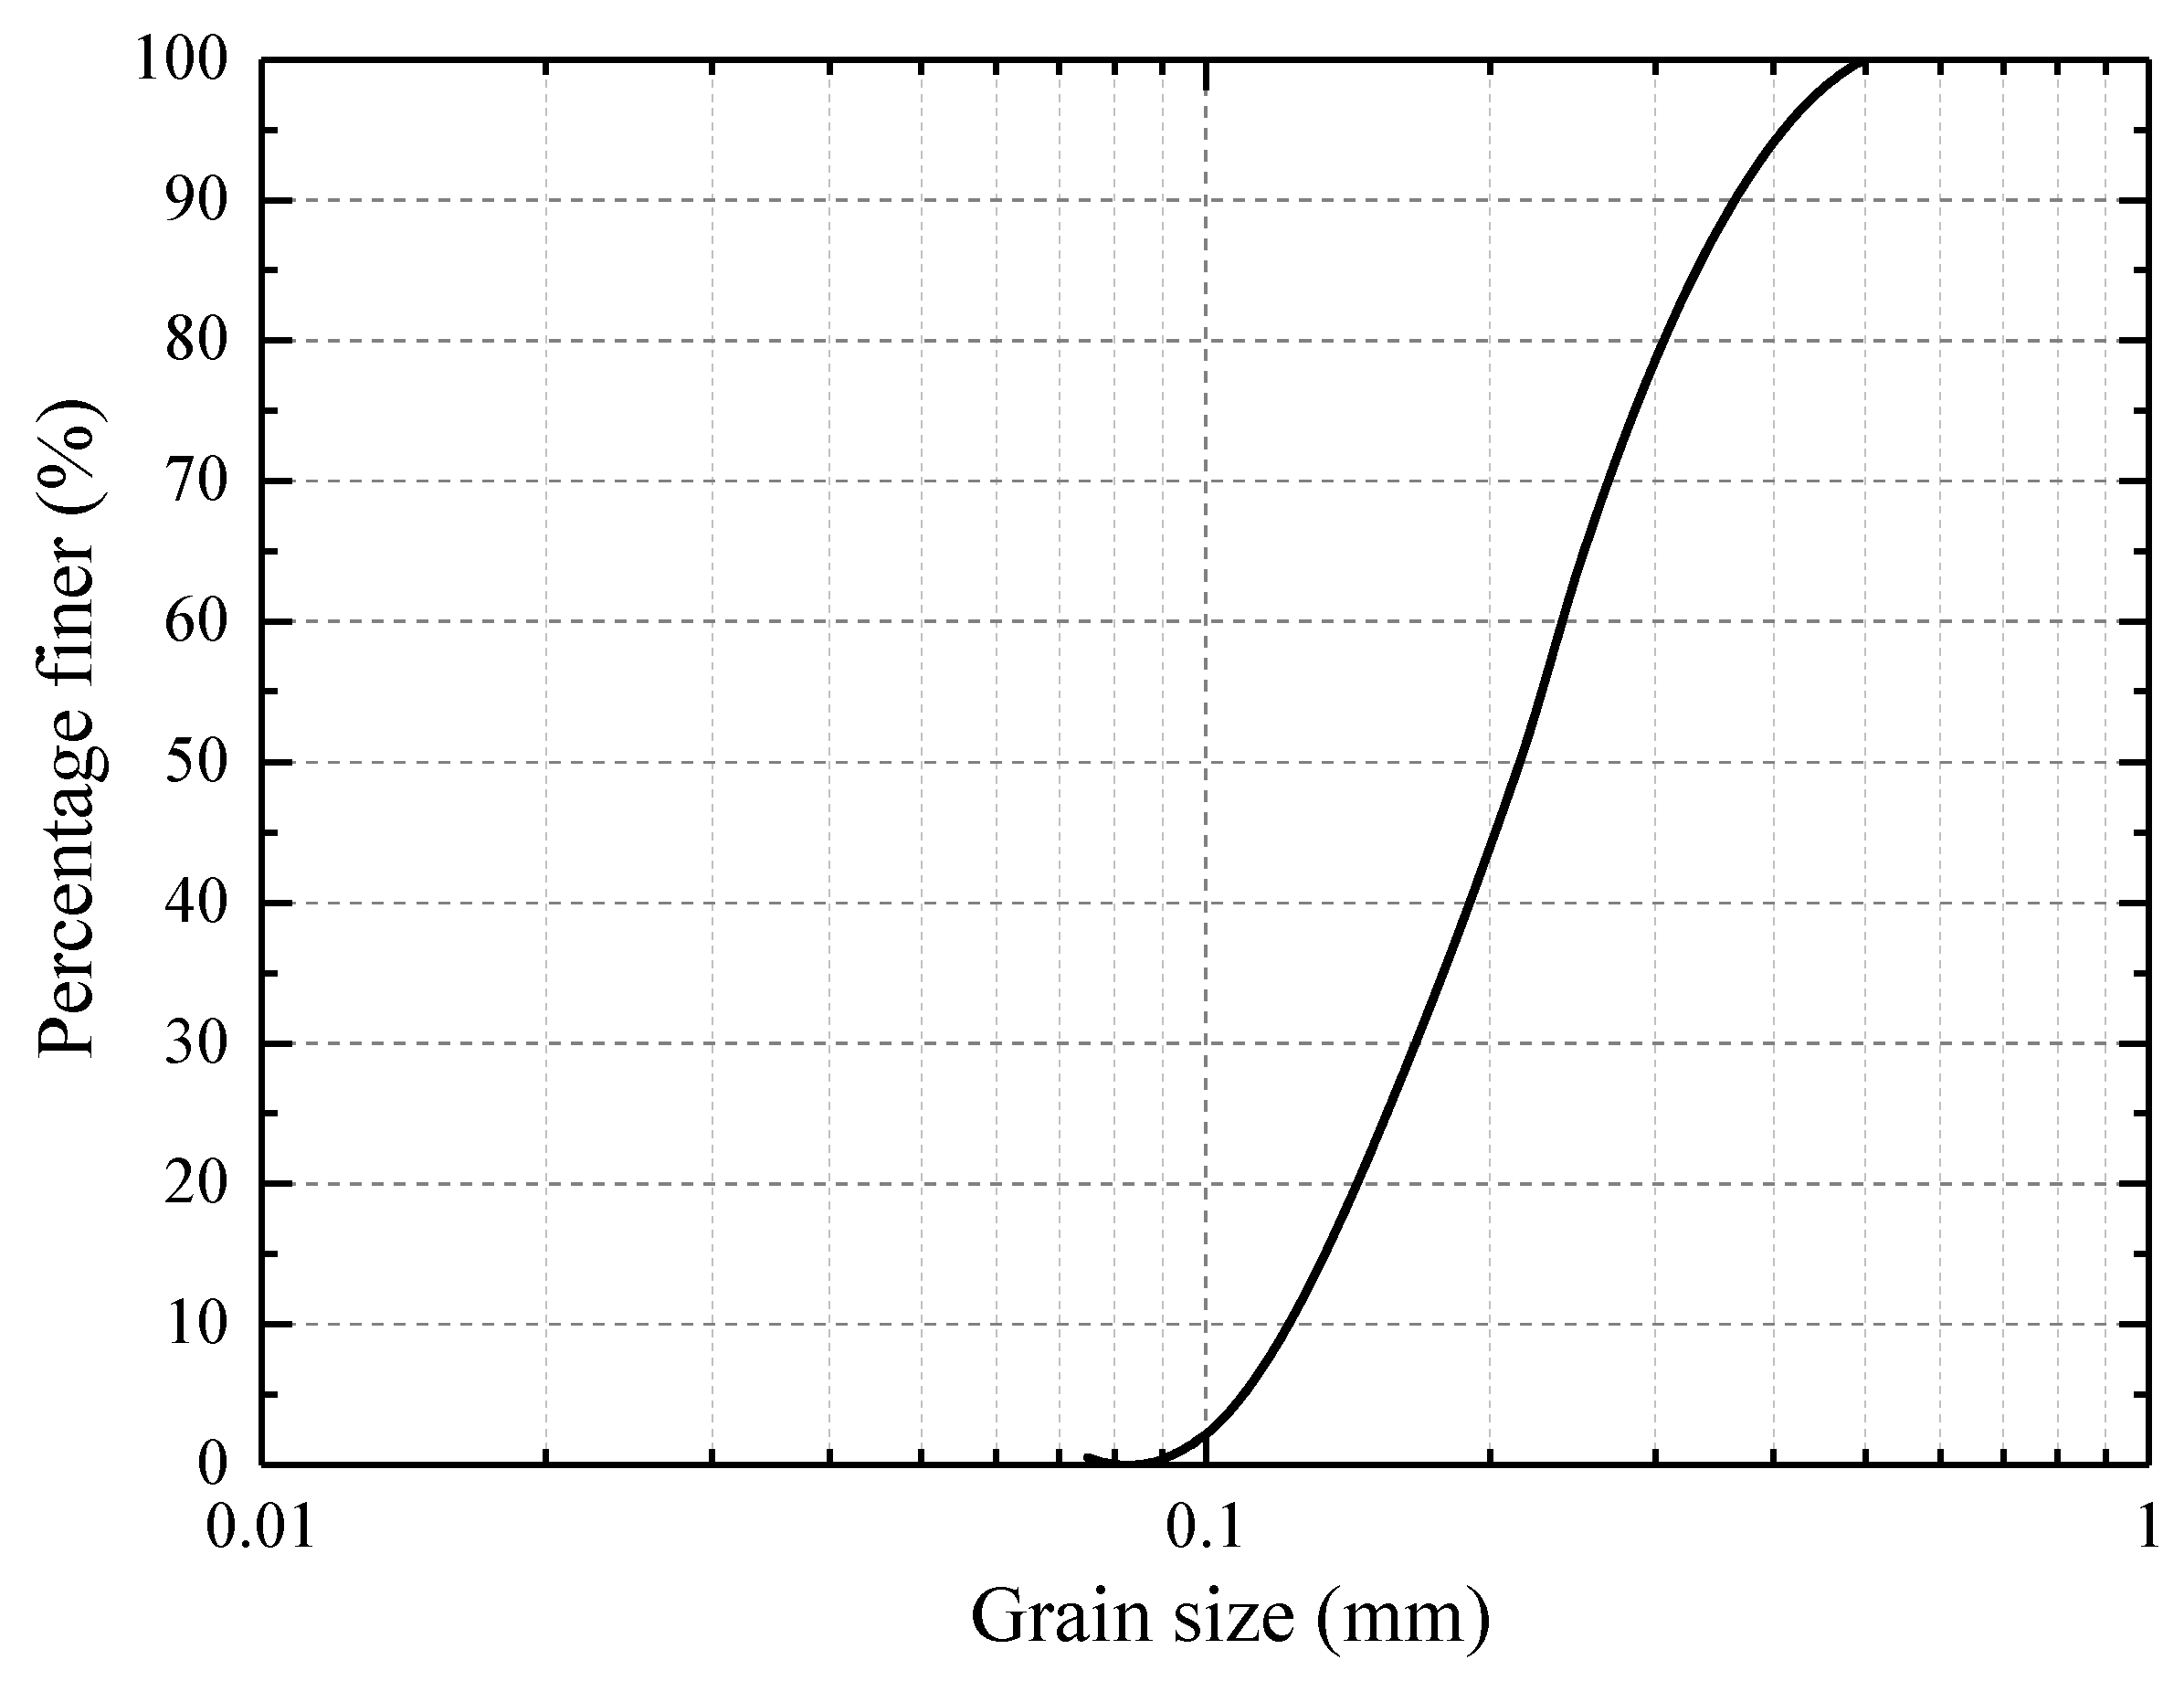
2.2. Properties of Seabed Sediments

As mentioned in the introduction, different types of seabed will directly affect the mechanism of wave-induced soil response. According to Tzang and Ou, Wang et al., Kirca et al.’s [6,7,8] experimental results, the phenomenon of pore pressure build-up would be insignificant in a sandy seabed. In the laboratory experiments, due to limited resources, we can only select a particular sediment for our study. Besides, we focus on the transient soil response around a mono-pile, so the present experimental study is based solely on a sandy bed. In order to reveal the distribution of transient excess pore-water pressure, sandy sediment (quartz sand) with a mean particle size of d 50 = 0.215 mm was used as the seabed material in the experiments. The particle-size distribution of the soil sample, which was measured by sieving method, is plotted in Figure 5, where c c denotes the coefficient of curvature, defined by
c c = d 30 2 d 60 d 10
c u is the coefficient of nonuniformity, defined by
c u = d 60 d 10
The sieving method needs balances, the screening machine, screens, a electric drying box, etc. The grain density of the soil ( ρ s ) is measured by the flask method, i.e., using a 100 mL volumetric flask to measure the volume of water drained by soil particles, which denotes the volume of sand particles ( V s ), and m s equals to the dry mass of the soil. In addition, balances, a thermometer, a dropper, a electric drying box and so on are also needed. Permeability ( k s ) was determined using a constant head permeability meter. In addition, the shear modulus (G) was determined by the elastic modulus, which was measured by a triaxial apparatus, and Poisson’s ratio ( μ ), which took an empirical value. The void ratio of sand sample used in the experiment can be expressed as:
e = ρ s ρ w ρ d 1
in which ρ w is the density of water, ρ d is the density of the sand sample after drying. The maximum void ratio and minimum void ratio were calculated by measuring the loose density and compaction density, D r is the relative density of the seabed soil, defined by
D r = e m a x e e m a x e m i n
The equipment is shown in Table 2 and physical properties are listed in Table 3.

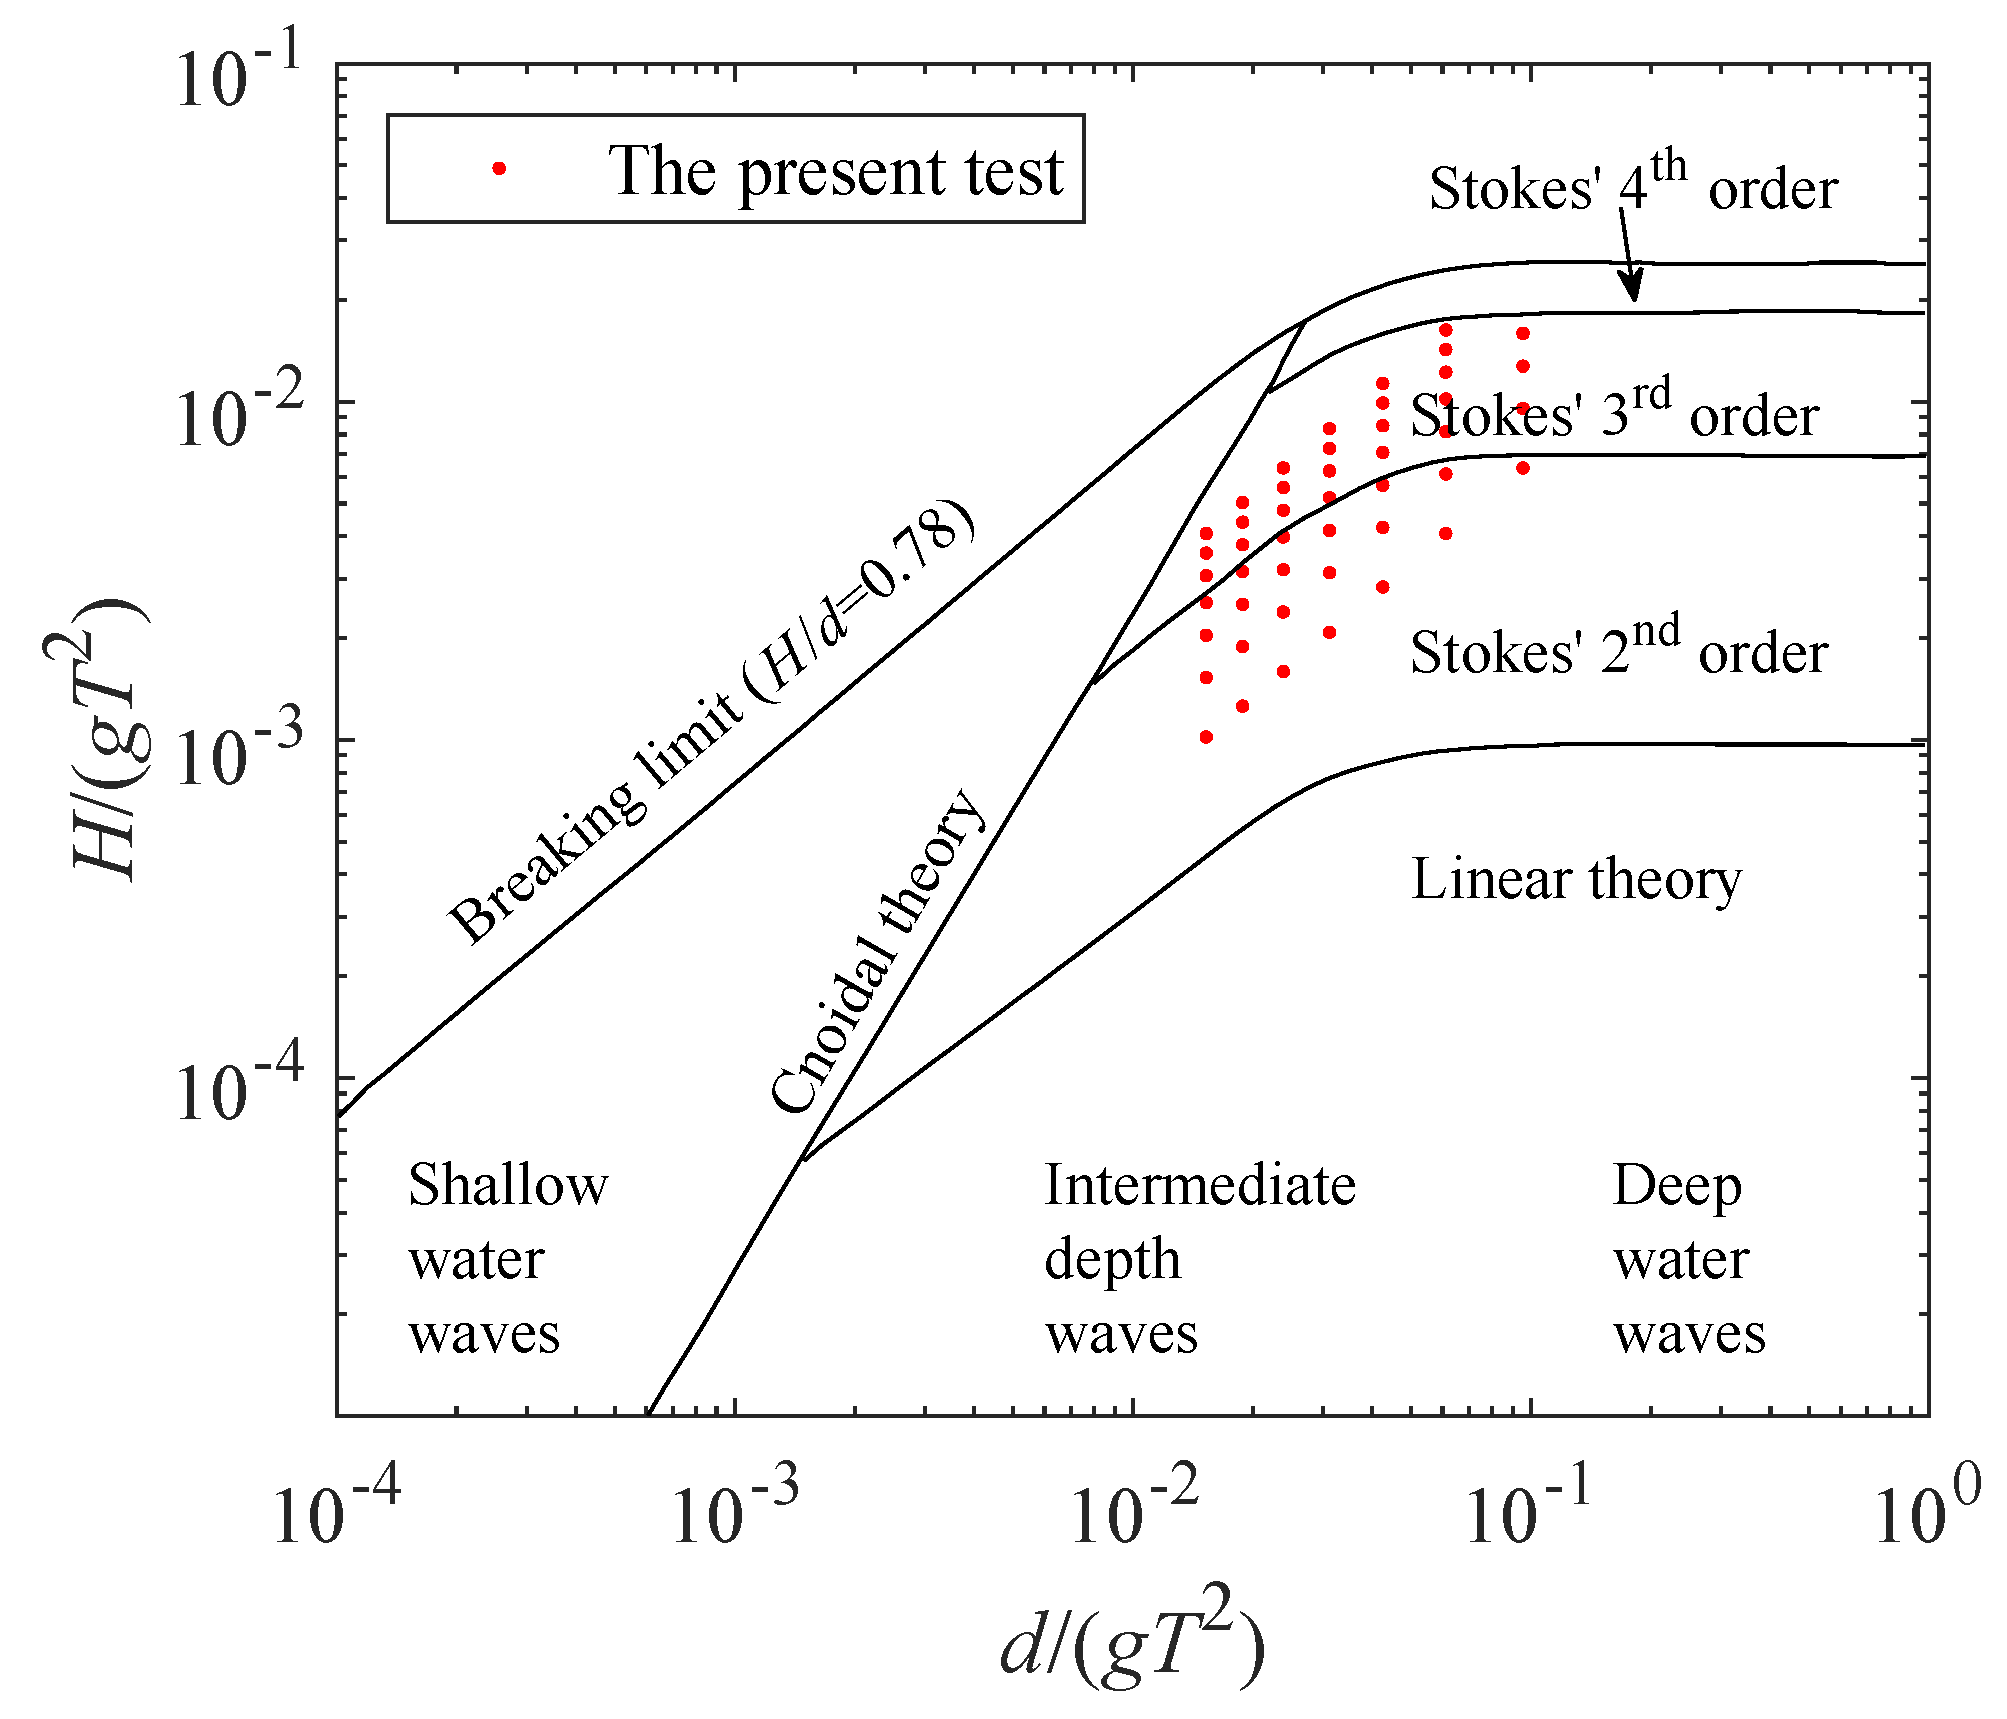
2.3. Wave Conditions

In this study, we conduct the experiments for a simple harmonic wave loading (Sines waves), which is an idealized wave loading. This is to provide some fundamental understanding of the physical process. To better simulate the realistic engineering problem, a random wave loading is required. This is the next experimental task in our research group. With a scale of 1:10, the physical model of the pile was produced based on the Froude criterion of gravitational similarity. According to the Froude gravitational similarity law, when the geometric scale is 1:10, the time scale is 1: 10 , the velocity scale is 1: 10 , the density scale is 1, and other physical quantities can be analogous.
We tried to make the range of both wave height and period relatively large so as to analyze the effects of different wave conditions on pore water pressure response. Based on the wave generating capacity of the experimental flume, 46 tests were conducted. Each test was run at least twice to ensure the correct data were obtained. The wave conditions used for the experiments are listed in Table 4. The wave height (H) varied from 4 to 16 cm, and the wave period varied from 0.8 to 2.0 s. The mean water depth (d) was kept at 0.6 m in all cases. For the wave period of T = 0.8 s, the wave height could only reach 10 cm. The value of wavelength (L) can be obtained from the dispersion relationship:
L = g T 2 2 π t a n h ( k d )
where k = 2 π / L is the wave number. According to Le Méhaut’e [28], wave conditions of the present experiments mainly fall in Stokes’ second-order and third-order wave theory zones (as shown in Figure 6). Note that, g is the gravitational acceleration.

2.4. Test Procedure

The procedure of tests is as follows:
(1)
Placement of the mono-pile and instruments: 23 pressure transducers and four wave height gauges were installed in the locations specified in Figure 3. Since the pore-pressure transducers are equipped with sand filters, they must be submerged in water for at least 24 h to ensure that the air is completely exhausted.
(2)
Filling the sediment tank: Prior to the experiments, the large amount of sand was first poured into the soil-mixture tank slowly, and water was gradually added to the tank with continuous and thorough stirring until the mixture reached a homogeneous liquid state. The mixture was then pumped into the test section, where it was left to consolidate for at least three days. Finally, a soil layer with a thickness of about 1.0 m was produced.
(3)
Filling the water tank: The water was poured into the water tank slowly until the water depth reached 0.6 m.
(4)
The wavemaker was switched on.
(5)
Sampling the statistics of pore pressure and wave height: The duration of data collection was at least 240 s after the full development of the oscillatory soil response in the sandy seabed and the equilibrium state was reached.
(6)
The wavemaker was switched off.
(7)
Steps 4–6 were repeated for the next test.
In all 46 tests, each test was repeated twice to ensure that we obtained consistent results. We collected the data after waves reached a steady equilibrium state. We only re-configured the sand box when we found there was significant changes of seabed profile after the test. Theoretically, it is required to empty the sandbox and re-fill for each test. However, in reality, it is impossible to have such experiments for wave-soil interactions. There is some minor impact to the initial condition of the sandbox during the tests, however, it can be ignored, when we compare two identical tests with the same wave conditions.

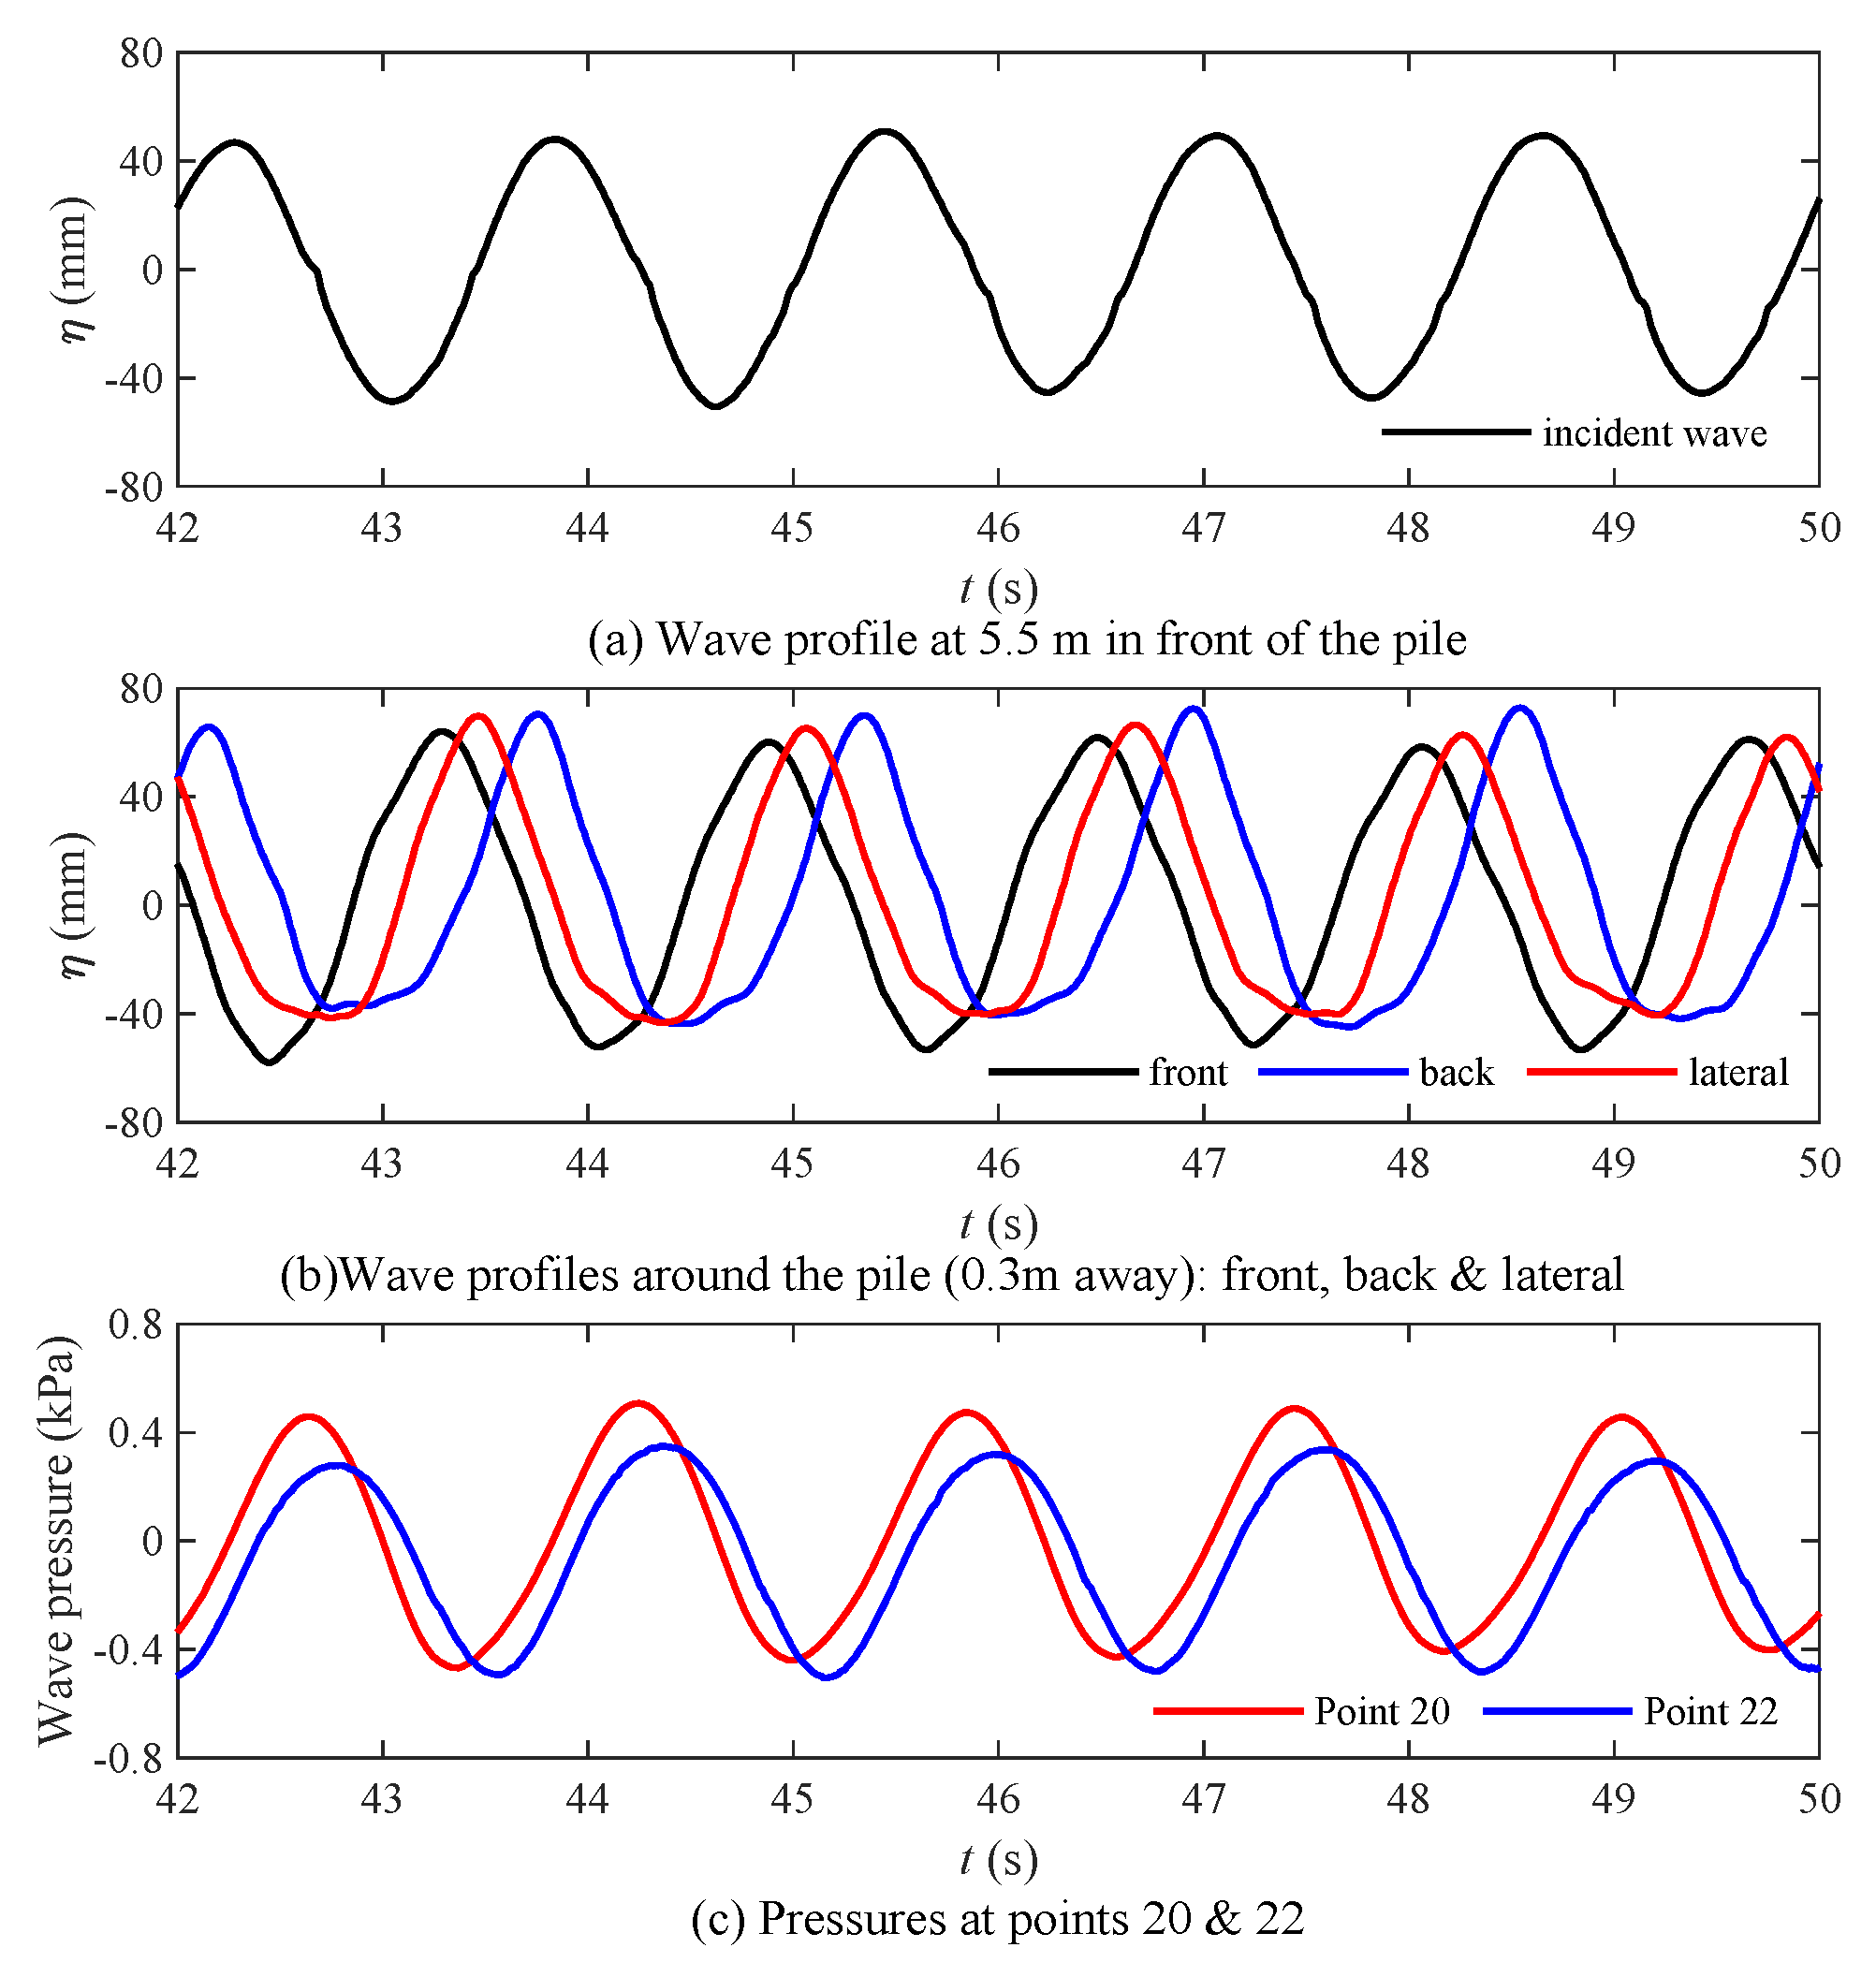
3. Wave Profiles near the Mono-Pile and Dynamic Wave Pressures on the Mono-Pile

In this study, four wave-gauges were installed at four different positions. As shown in Figure 2, the first (gauge 553 in Figure 2b) was located 5.5 m from the center of the mono-pile (the diameter of the pile is 30 cm) to measure the incident wave heights. The other three were located 30 cm from the mono-pile (gauges 552, 554, and 555 in Figure 2b). With these measurements, we aimed to understand the wave profiles around a mono-pile. As an example, Test 29 is presented: the wave height was 10 cm, the wave period was 1.6 s, and the water depth was 60 cm. Figure 7a shows the wave profiles measured at a location 5.5 m from the front of the mono-pile (gauge 533); this location represents the incident wave.
Figure 7b plots the wave profiles around the mono-pile (gauges 552, 554, and 555 in Figure 2b). Compared with the incident wave in Figure 7a, the wave crest in the front of the pile rises and the wave height becomes larger, which is because the presence of the pile leads to reflection and diffraction of the wave, and part of the kinetic energy is converted into potential energy. Besides, the wave on the lateral side of the pile and behind the pile is slightly deformed duo to diffraction effect.
Figure 7c presents the wave pressures acting on the mono-pile (Points 20 and 22, in Figure 3). Point 20 is on the front side of the pile, and Point 22 is located on the lateral side of the pile. As shown in the figure, the wave pressure on the lateral side of the pile is less than that in front of the pile because of the wave run-up in front of the pile. The wave profiles around the pile could not only help to understand the cause of pore pressure distribution around the pile more systematically, but also provide reference for numerical simulation.

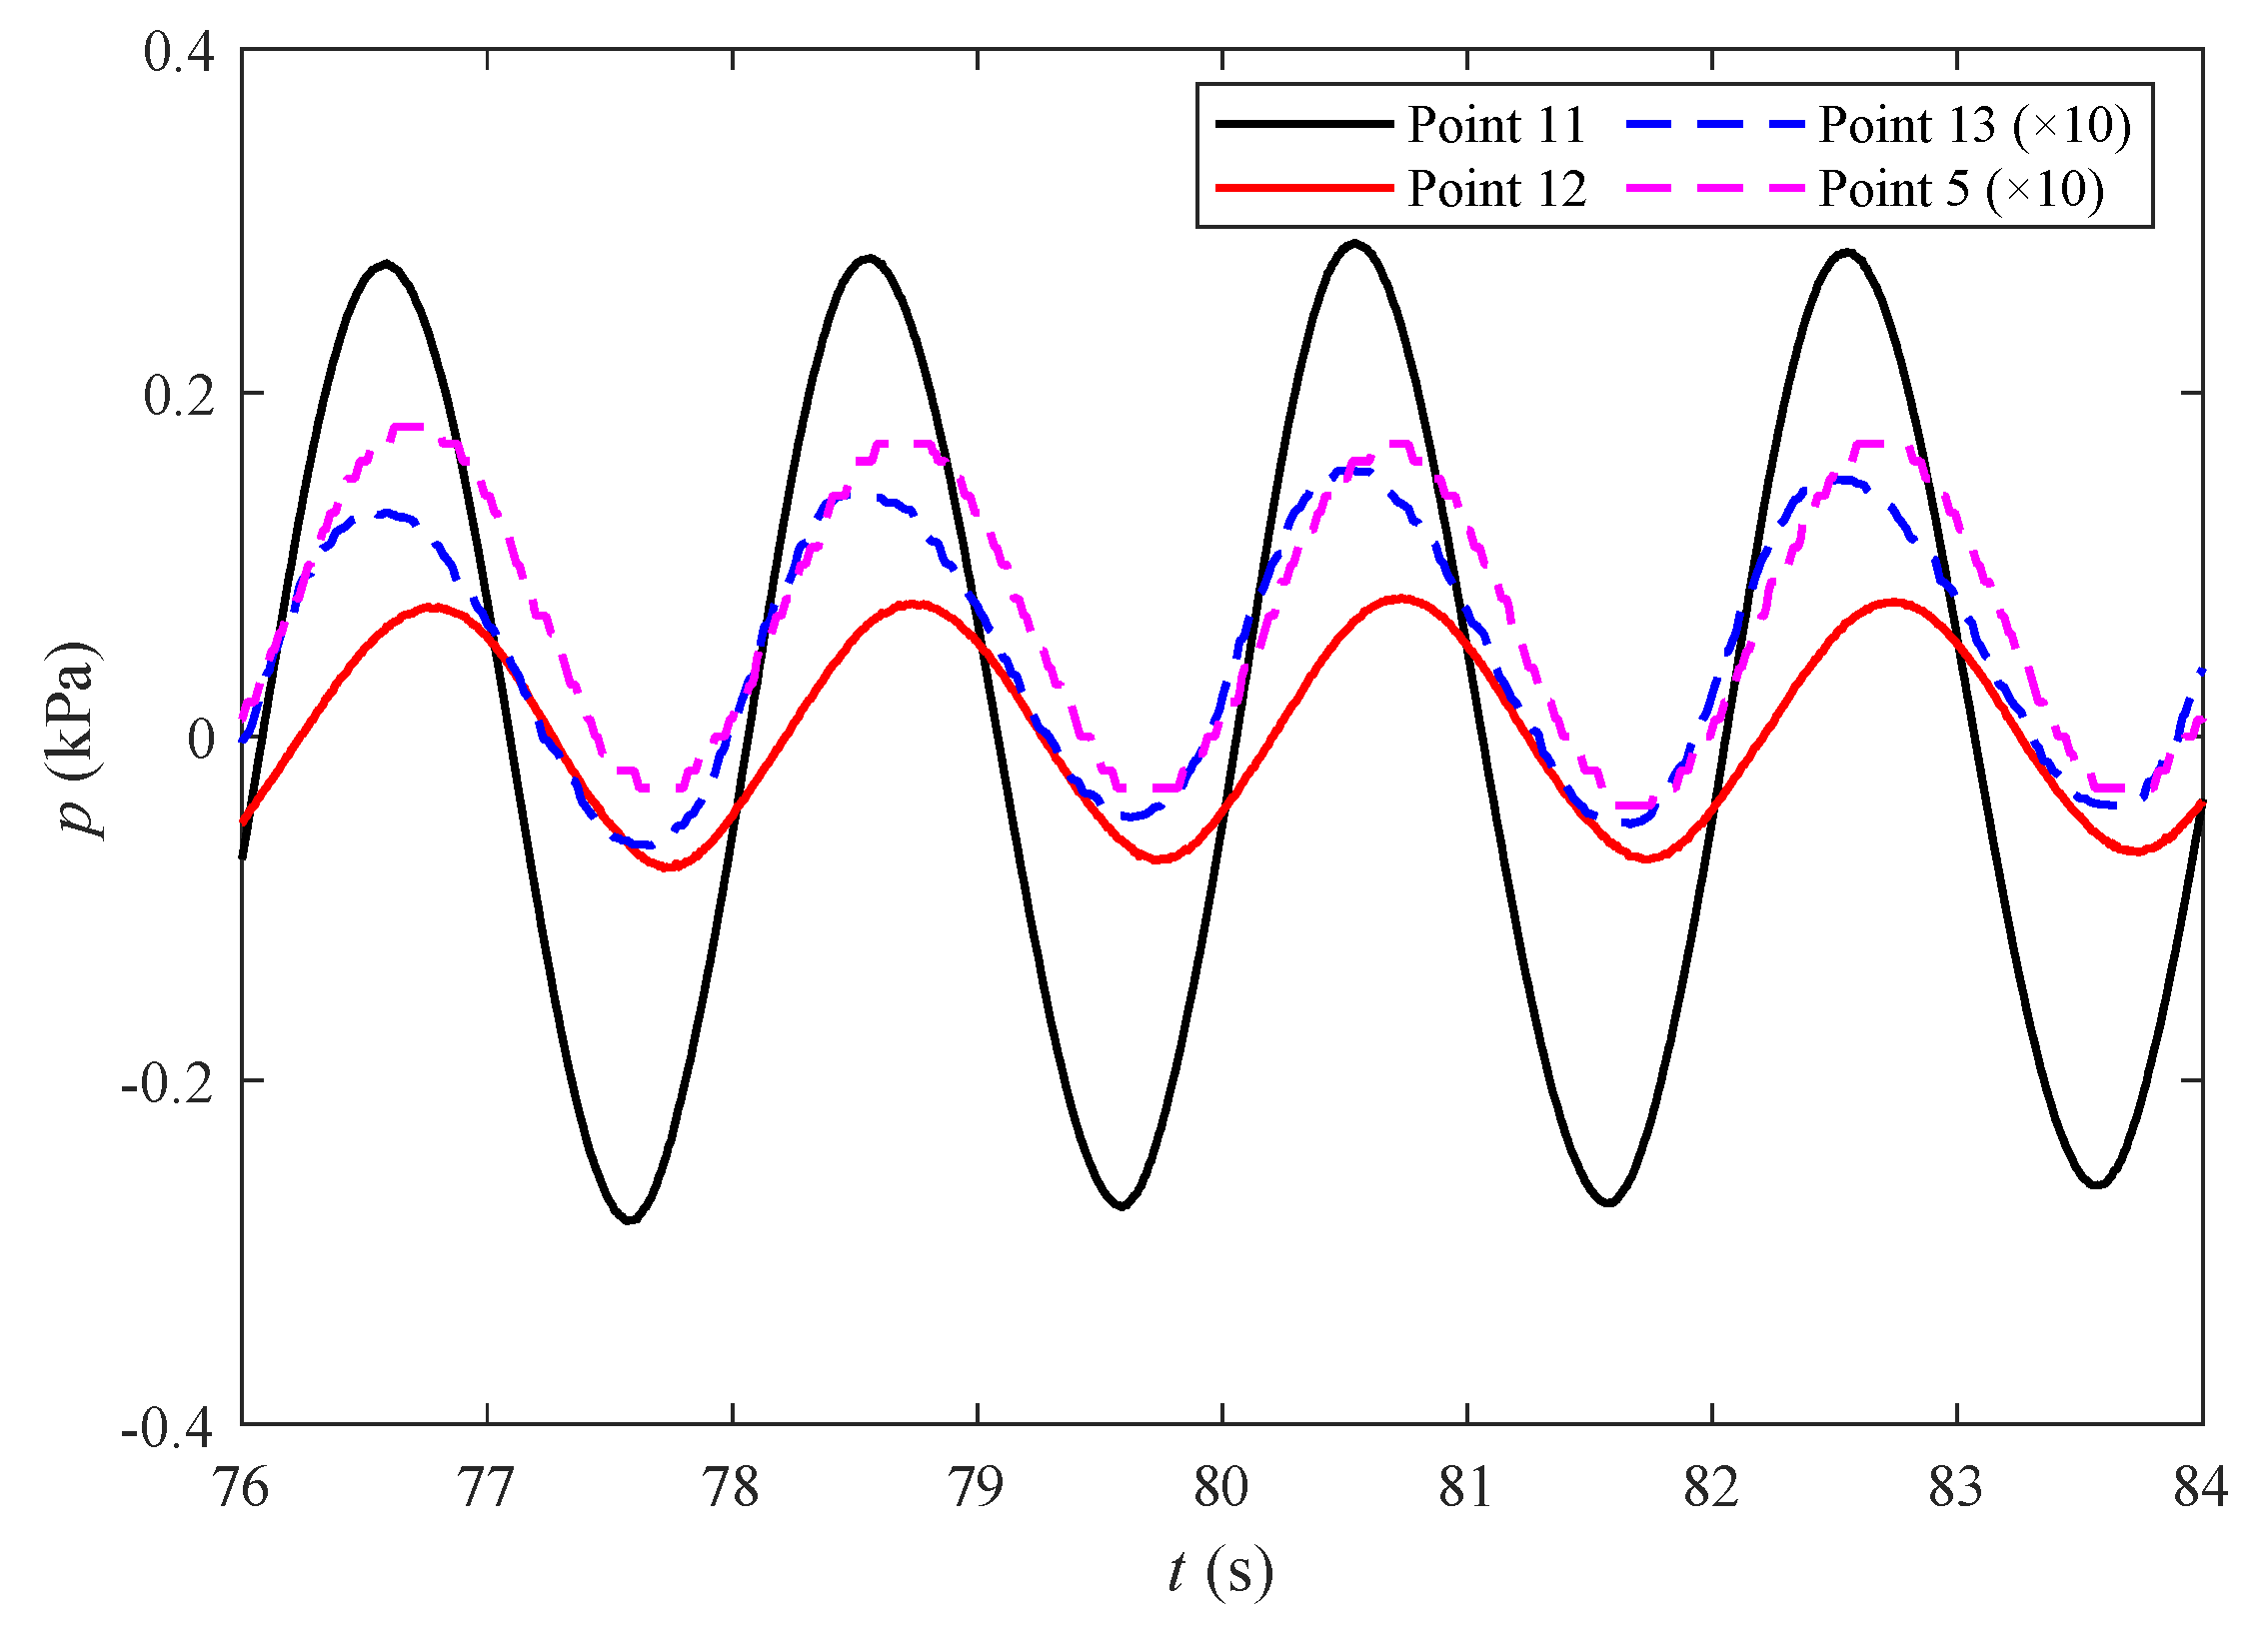
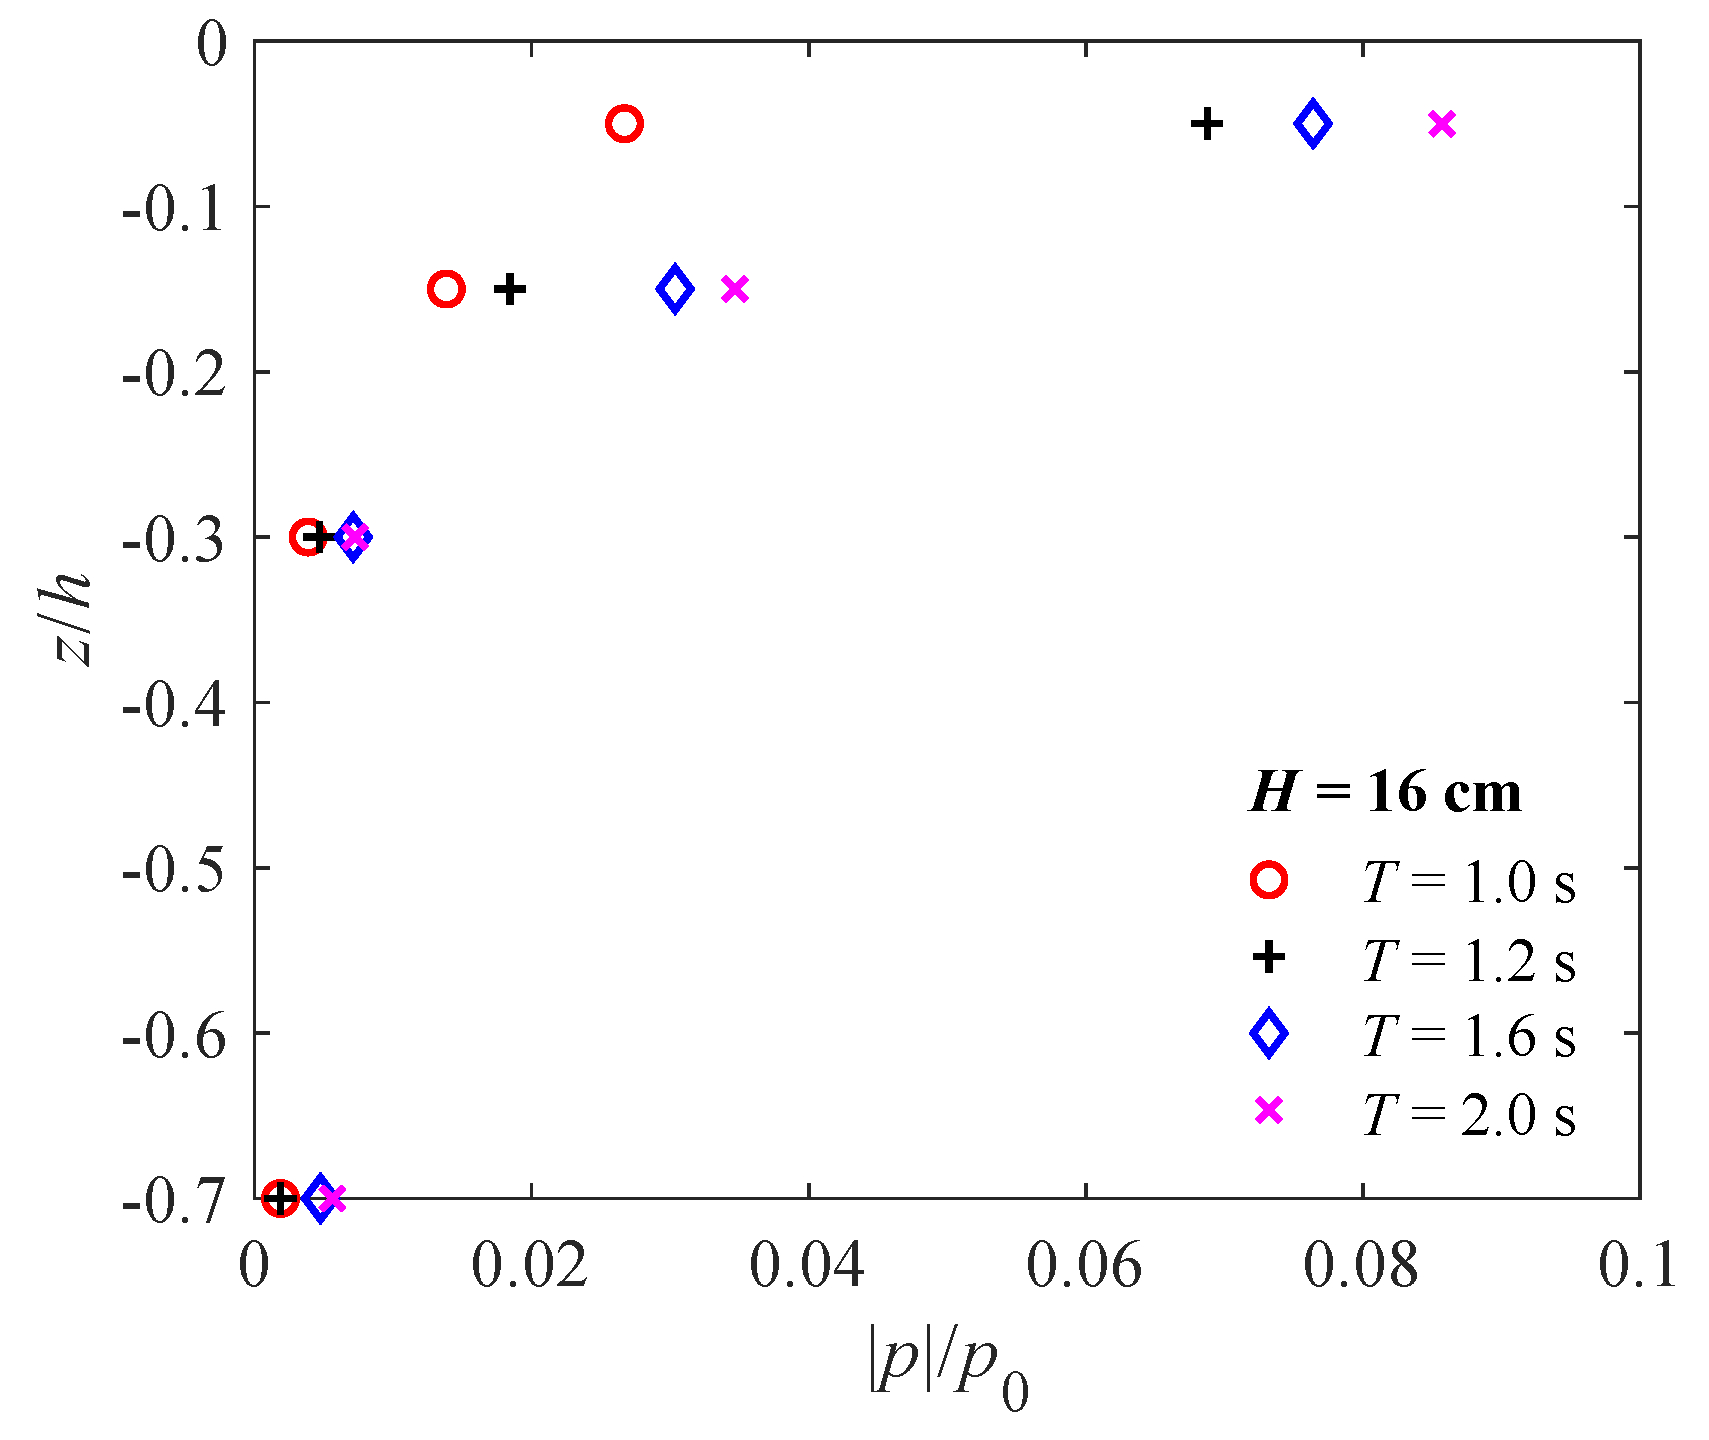
4. Pore-Water Pressures in the Seabed

In this section, the results for the wave-induced pore-water pressures in the seabed around the mono-pile are presented. We focus on the experimental results that were not discussed in the previous study [26]. The presented results include the time series of the pore-water pressure distribution at the section in front of the mono-pile and the vertical distribution of the maximum amplitude of pore-water pressure around the pile. Note that p 0 = γ w d is the static water pressure at the seabed surface in the following analysis, where γ w is the unit weight of water, d is the mean water depth.

4.1. In front of the Mono-Pile

Here, we take Test 43 as a example. Figure 8 presents the time series of pore-water pressure at the cross-section in front of the mono-pile (x = 0.15 m). The measurement points are Points 11, 12, 13, and 5 in Figure 3. It is observed that the pore-water pressures decrease as the soil depth increases. For example, the pore pressure at Point 11 (0.05 m below the seabed surface) is three times that at Point 12 (0.15 m below the seabed surface). It is also noted that there is a slight phase lag in the pore pressure between Points 11 and 12 and other points (in Figure 3). This phase lag is a result of the seabed being a two-phase medium that consists of a fluid and solid. The observed phenomenon of phase lag between wave pressures and pore pressures in the seabed in our experiments was previously reported by a study that employed analytical approximation [29].
In the next example, we focus on the vertical distribution of the maximum amplitude of the wave-induced pore pressure ( | p | / p 0 ) versus soil depth ( z / h ) in various wave conditions. Figure 9 plots the results for various wave periods for a wave height of H = 16 cm. Since a wave height of H = 16 cm cannot be generated for cases with short wave periods (for example, T = 0.8 s), only the results for T = 1.0, 1.2, 1.6, and 2.0 s are presented in the figure. As shown in Figure 9, the wave-induced maximum amplitude of pore-water pressure decreases with the increase of depth, which can be attributed to the gradual attenuation of the pore water pressure. Furthermore, with the soil depth increasing, the dissipation rate of pore pressure decreases. Besides, the maximum of the pore pressure increases, as the wave period increases, because the wave energy acting on the seabed becomes larger and larger, which intensifies the seabed response. These trends are more pronounced near the seabed surface (in the region between the seabed surface and 30 cm below it). For the region below 0.3 m (Points 13 and 5 in Figure 3), the influence of the wave period becomes insignificant.
Figure 10 further illustrates the effects of various wave heights (H = 4, 8, 12 and 16 cm) for a wave period of T = 2.0 s. As shown in the figure, the maximum amplitude of pore pressures also decreases as soil depth increases, and the rate of decay is getting slower and slower. Furthermore, the maximum amplitude of pore pressures increases as the wave height increases due to the increasing wave pressure acting on the seabed. Again, these trends are also significant in the region between the seabed surface and 0.3 m below it and not obvious below 0.3 m. In addition, the trend is similar to that of Lin et al.’s numerical simulation [15].
As is well known, the seepage force is proportional to the pore pressure gradient ( j x = p / x , j y = p / y , j z = p / z ). When the seepage force is upward, the sediment particles are subjected to the upward force, and the seabed is more likely to liquefy. On the contrary, when the seepage force is downward, the sediment is oppressed. It can be concluded from Figure 9 and Figure 10 that the pore pressure gradient between points 11 and 12 is about three times that between points 12 and 13. The pore pressure gradient decays rapidly with the increase of depth in the region above −0.3 m. The closer to the surface of the seabed, the greater the seepage force, the more prone to transient liquefaction. Furthermore, with the increase of wave period and wave height, the pressure gradient also increases, i.e., the seepage force increases, which indicates that the seabed is more prone to liquefaction with larger wave heights and periods. In the area below 0.3 m, the pore pressure changes very little, and the seepage force is much smaller than the upper area, so it is difficult to cause transient liquefaction of the seabed. Furthermore, liquefaction is controlled not only by pore pressure but also by initial effective stress [2].

4.2. Behind the Pile

It is also interesting to investigate the pore-water pressures behind the mono-pile. Here, we use Test 43 as an example again, as shown in Figure 11, and the results at Points 17, 18, 19, and 7 (in Figure 3) are presented. The time history of the pore pressures is similar to the results in front of the mono-pile, as can be seen by comparing Figure 8 and Figure 11. However, the magnitude of the pore-water pressure is smaller behind the pile than that of the pressure in front of the pile.
Figure 12 illustrates the vertical distribution of the maximum amplitude of the wave-induced pore-water pressure ( | p | / p 0 ) versus soil depth ( z / h ) for various wave periods with a wave height of H = 16 cm. Similar to Figure 9, the maximum amplitude of pore pressures decrease as seabed depth increases and wave period decreases. Figure 9 compared with Figure 12 reveals that the magnitude of the pore-water pressure behind the mono-pile is smaller than that of the pressure in front of the mono-pile, which is consistent with Qi and Gao’s experimental results [27]. In their opinion, this is attributed to the influence of the large-scale wake vortices.
Again, the effects of wave height on the pore-water pressure behind the mono-pile are plotted in Figure 13. The amplitude of pore pressures behind the mono-pile increases as the wave height increases, and decreases as seabed depth increases, which is similar to that in front of the pile.
Besides, there is something interesting that the pore pressure at Point 17 (0.05 m below the seabed surface behind the pile) of Test 32 (H = 16 cm, T = 1 . 6 s in Figure 12) is lower than Test 44 (H = 12 cm, T = 2 s in Figure 13). Comparing the results of Test 32 (in Figure 12 and Figure 14) and those of Test 44 (in Figure 13 and Figure 15), it can be seen the pore pressure of Test 32 is larger than that of Test 44 except for Point 17. Note that the wave energy (E) is proportional to H 2 L . The energy of incident wave of Test 32 is larger, which leads to larger response of the seabed, so the overall pore pressure of Test 32 is larger. As for Point 17, the dynamic wave pressure mainly come from wave diffraction due to the existence of the mono-pile. Moreover, wave diffraction is closely related to the wavelength, which depends on the wave period. When the wave period is different, the distribution of wave energy is changed by diffraction, so the pore pressure at Point 17 of Test 32 is smaller. In addition, the pore pressure within the seabed (0.15 m below the seabed surface) could come from the directly dynamic wave pressures acting on the top of the seabed (vertical direction of seepage flow) and the lateral soil (horizontal seepage flow), so the pore pressure within the seabed of Test 32 is still larger. This could be the reason why the result is different from the case in front of the mono-pile.

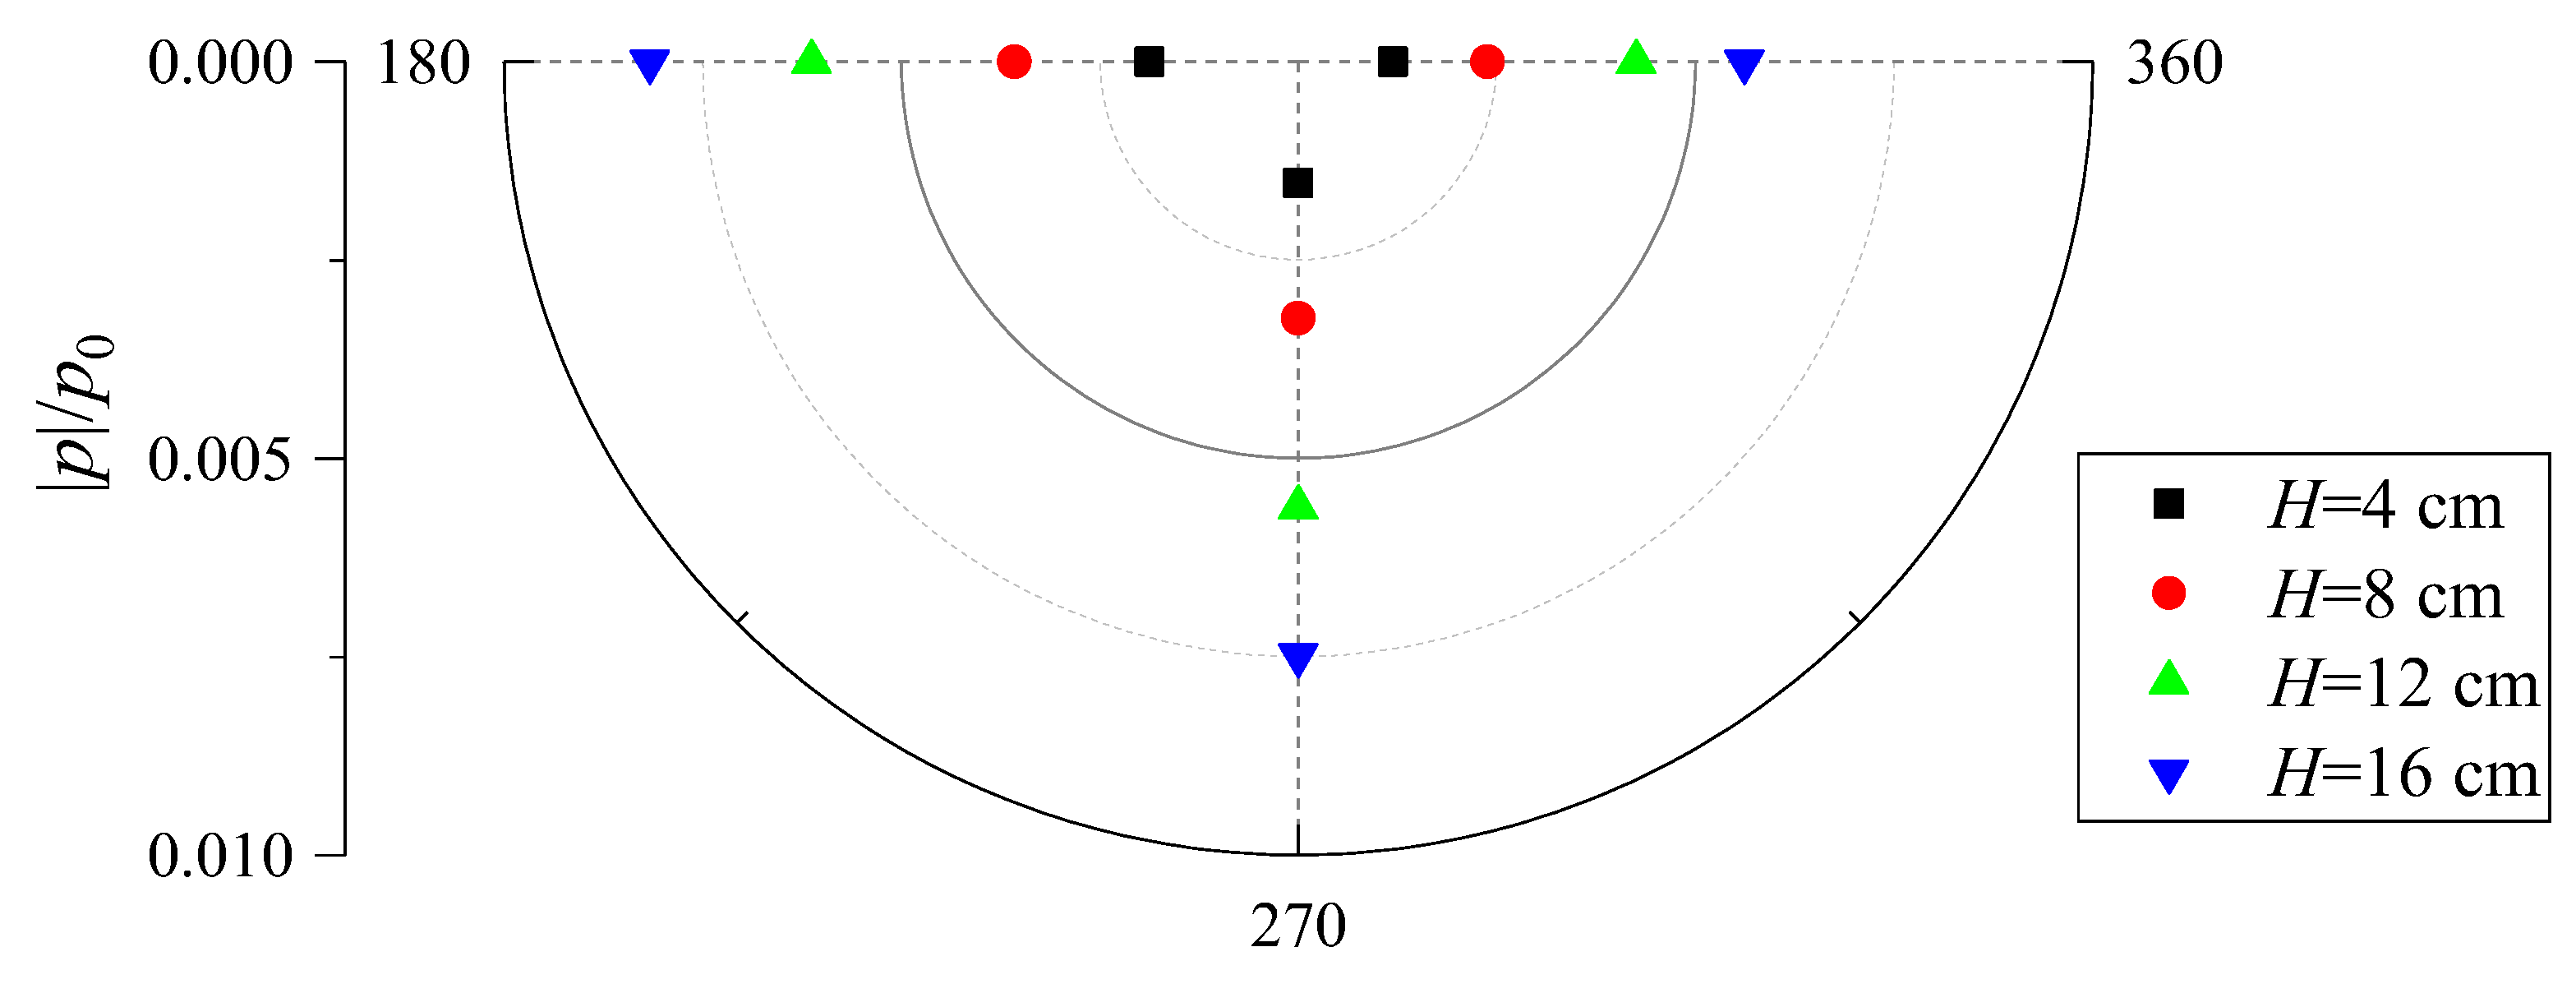
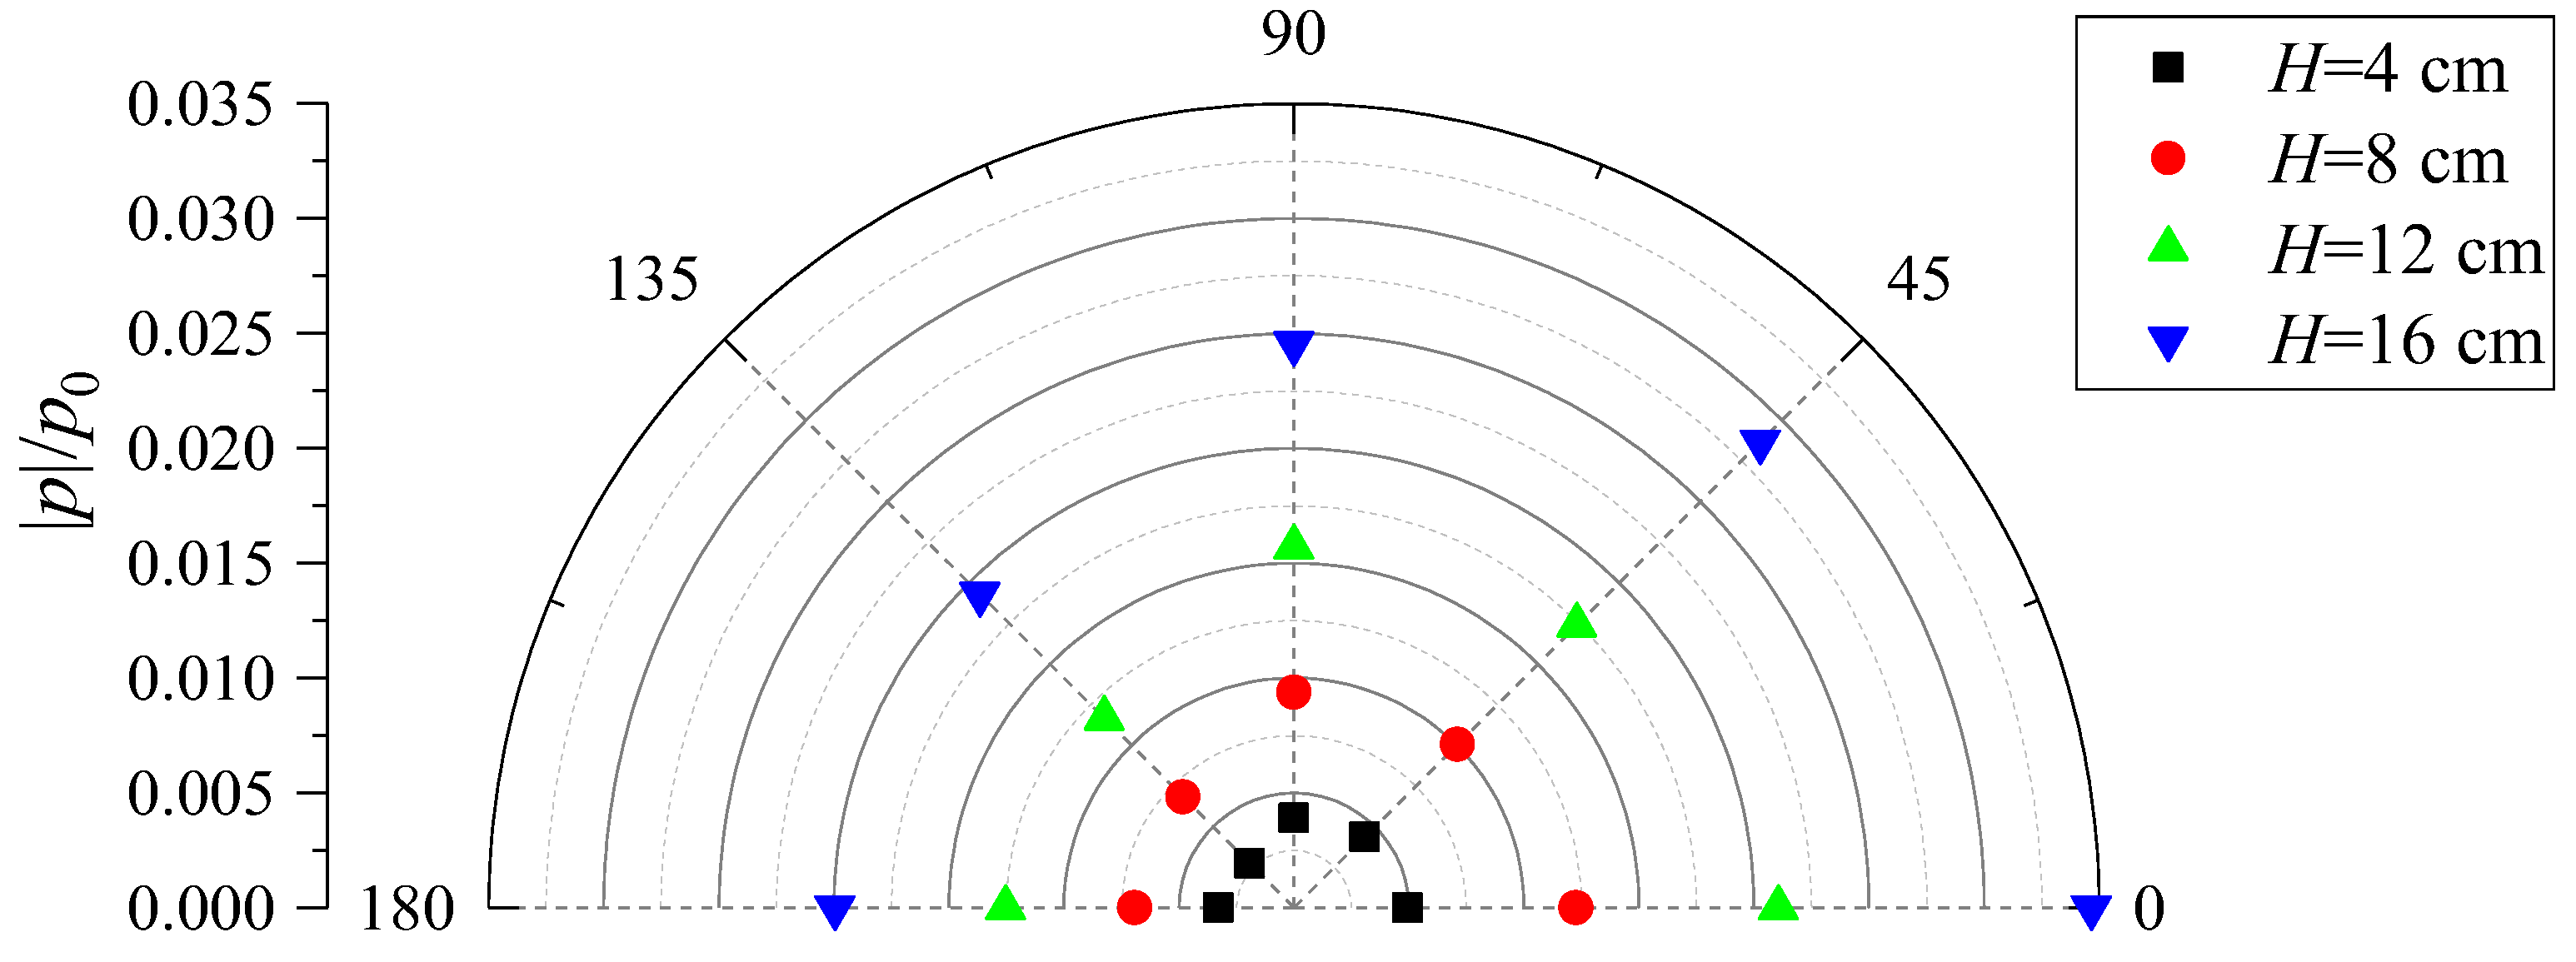
4.3. Around the Pile

In the present study, we measured the pore-water pressures around the mono-pile at different depths. At z = 0 . 15 m, five points were measured, i.e., Points 12, 14, 15, 16, and 18 (in Figure 3). At z = 0 . 7 m, four points were measured, i.e., Points 5, 8, 7, and 9 (in Figure 3). Figure 14 illustrates the pore pressures around the mono-pile for various wave periods for H = 16 cm. In the figure, 0 or 360 represents the front of the pile, and 180 is the back of the pile. As shown in the figure, the maximum pore pressure appears at the front of the pile, while the minimum appears in the rear. It can be calculated from the figure that the pore pressure increases as wavelength increases due to larger wave energy. However, the distribution of pore pressure is slightly different for various wave periods, and the relationship between pore pressure and wavelength is not ideal linear, which may attribute to the wave diffraction around the pile. Wave diffraction, which is affected by different wavelengths, changes the distribution of wave energy and leads to the change of pore pressure distribution.
Figure 15 plots the distribution of the pore-water pressures around the mono-pile for various wave heights for T = 2 s at z = 0 . 15 m. As shown in the figures, the pore-water pressure in the front ( 0 ) is the largest, while that in the rear is the smallest, which is close to Sui et al.’s numerical simulation results [16]. It is also noted that as the wave height increases, the pore pressure increases more rapidly. Figure 16 shows the quadratic polynomial fitting curves of the relationship between pore pressure and wave height at different points around the pile, in which R 2 is the coefficient of determination. According to Figure 16, the fitting curves are in good agreement with the experimental results, which suggests that pore pressure is related to wave energy ( E H 2 L ). As for the difference of the curves for different points, it may be because the presence of the pile changes the distribution of the wave energy.

4.4. Beneath the Center of the Pile

As mentioned previously, one major difference between the present experiment and the previous experiment [26,27] is that the mono-pile is placed in the seabed to a depth of 0.6 m in the present study, rather than being fully buried in the seabed [26,27]. The above results describe the pore pressures along the surface of the mono-pile. It is also interesting to investigate the distribution of pore pressures beneath the pile. For this, we plotted the pore pressures at z = 0 . 7 m, which is 10 cm below the bottom of the pile, for four points: Points 5, 8, 7, and 9 (see Figure 3). Another interesting result is from the measurement point at the bottom of the mono-pile, i.e., Point 4 ( z = 0 . 6 m in Figure 3). Figure 17 shows the time series of the wave-induced pore pressures at Point 4. The distribution of the pore pressures is still oscillatory, even though there is no direct wave pressure acting on the seabed surface since it is beneath the center of the pile. The pore pressures are transferred from the soil next to this point.
Figure 18 illustrates the effects of wave height on pore pressure for T = 2 . 0 s at z = 0 . 7 m. As shown in the figure, the pore pressure increases as wave height increases for larger wave energy. However, the largest pore pressure occurs behind the pile, while the smallest occurs in front of the pile ( 0 ). This result was not reported in the previous experimental study [26,27] because the pile was fully buried in the seabed. Note that the magnitude of the pore-water pressures at z = 0 . 7 m are much smaller than those at z = 0 . 15 m. The reason may be that the seabed below the pile is not directly under wave loading—the pore pressures are transferred from the surrounding soil under direct wave loading. The pore pressures of these points have to be affected by the structure; if there is no structure, the pore pressure distribution should be monotonous. Besides, Figure 17 clearly shows the horizontal propagation of the pore pressure under the pile.
Figure 19 illustrates the effects of the wave period on the pore pressures for H = 16 cm at z = 0 . 70 m. As shown in the figure, the maximum pore-water pressures increase as the wave period increases. Furthermore, the largest one appears behind the pile. Combining Figure 19 and Figure 18 reveals that both the wave height and wave period significantly affect the pore pressure at z = −0.7 m.

5. Conclusions

In this paper, the results of a series of experiments on the wave-induced pore-water pressures of sandy seabed in the vicinity of a mono-pile are reported. The pile was installed to a point that is 0.6 m below the seabed surface, and the top and bottom of the pile are fixed. On the basis of the experimental results, the following conclusions can be drawn.
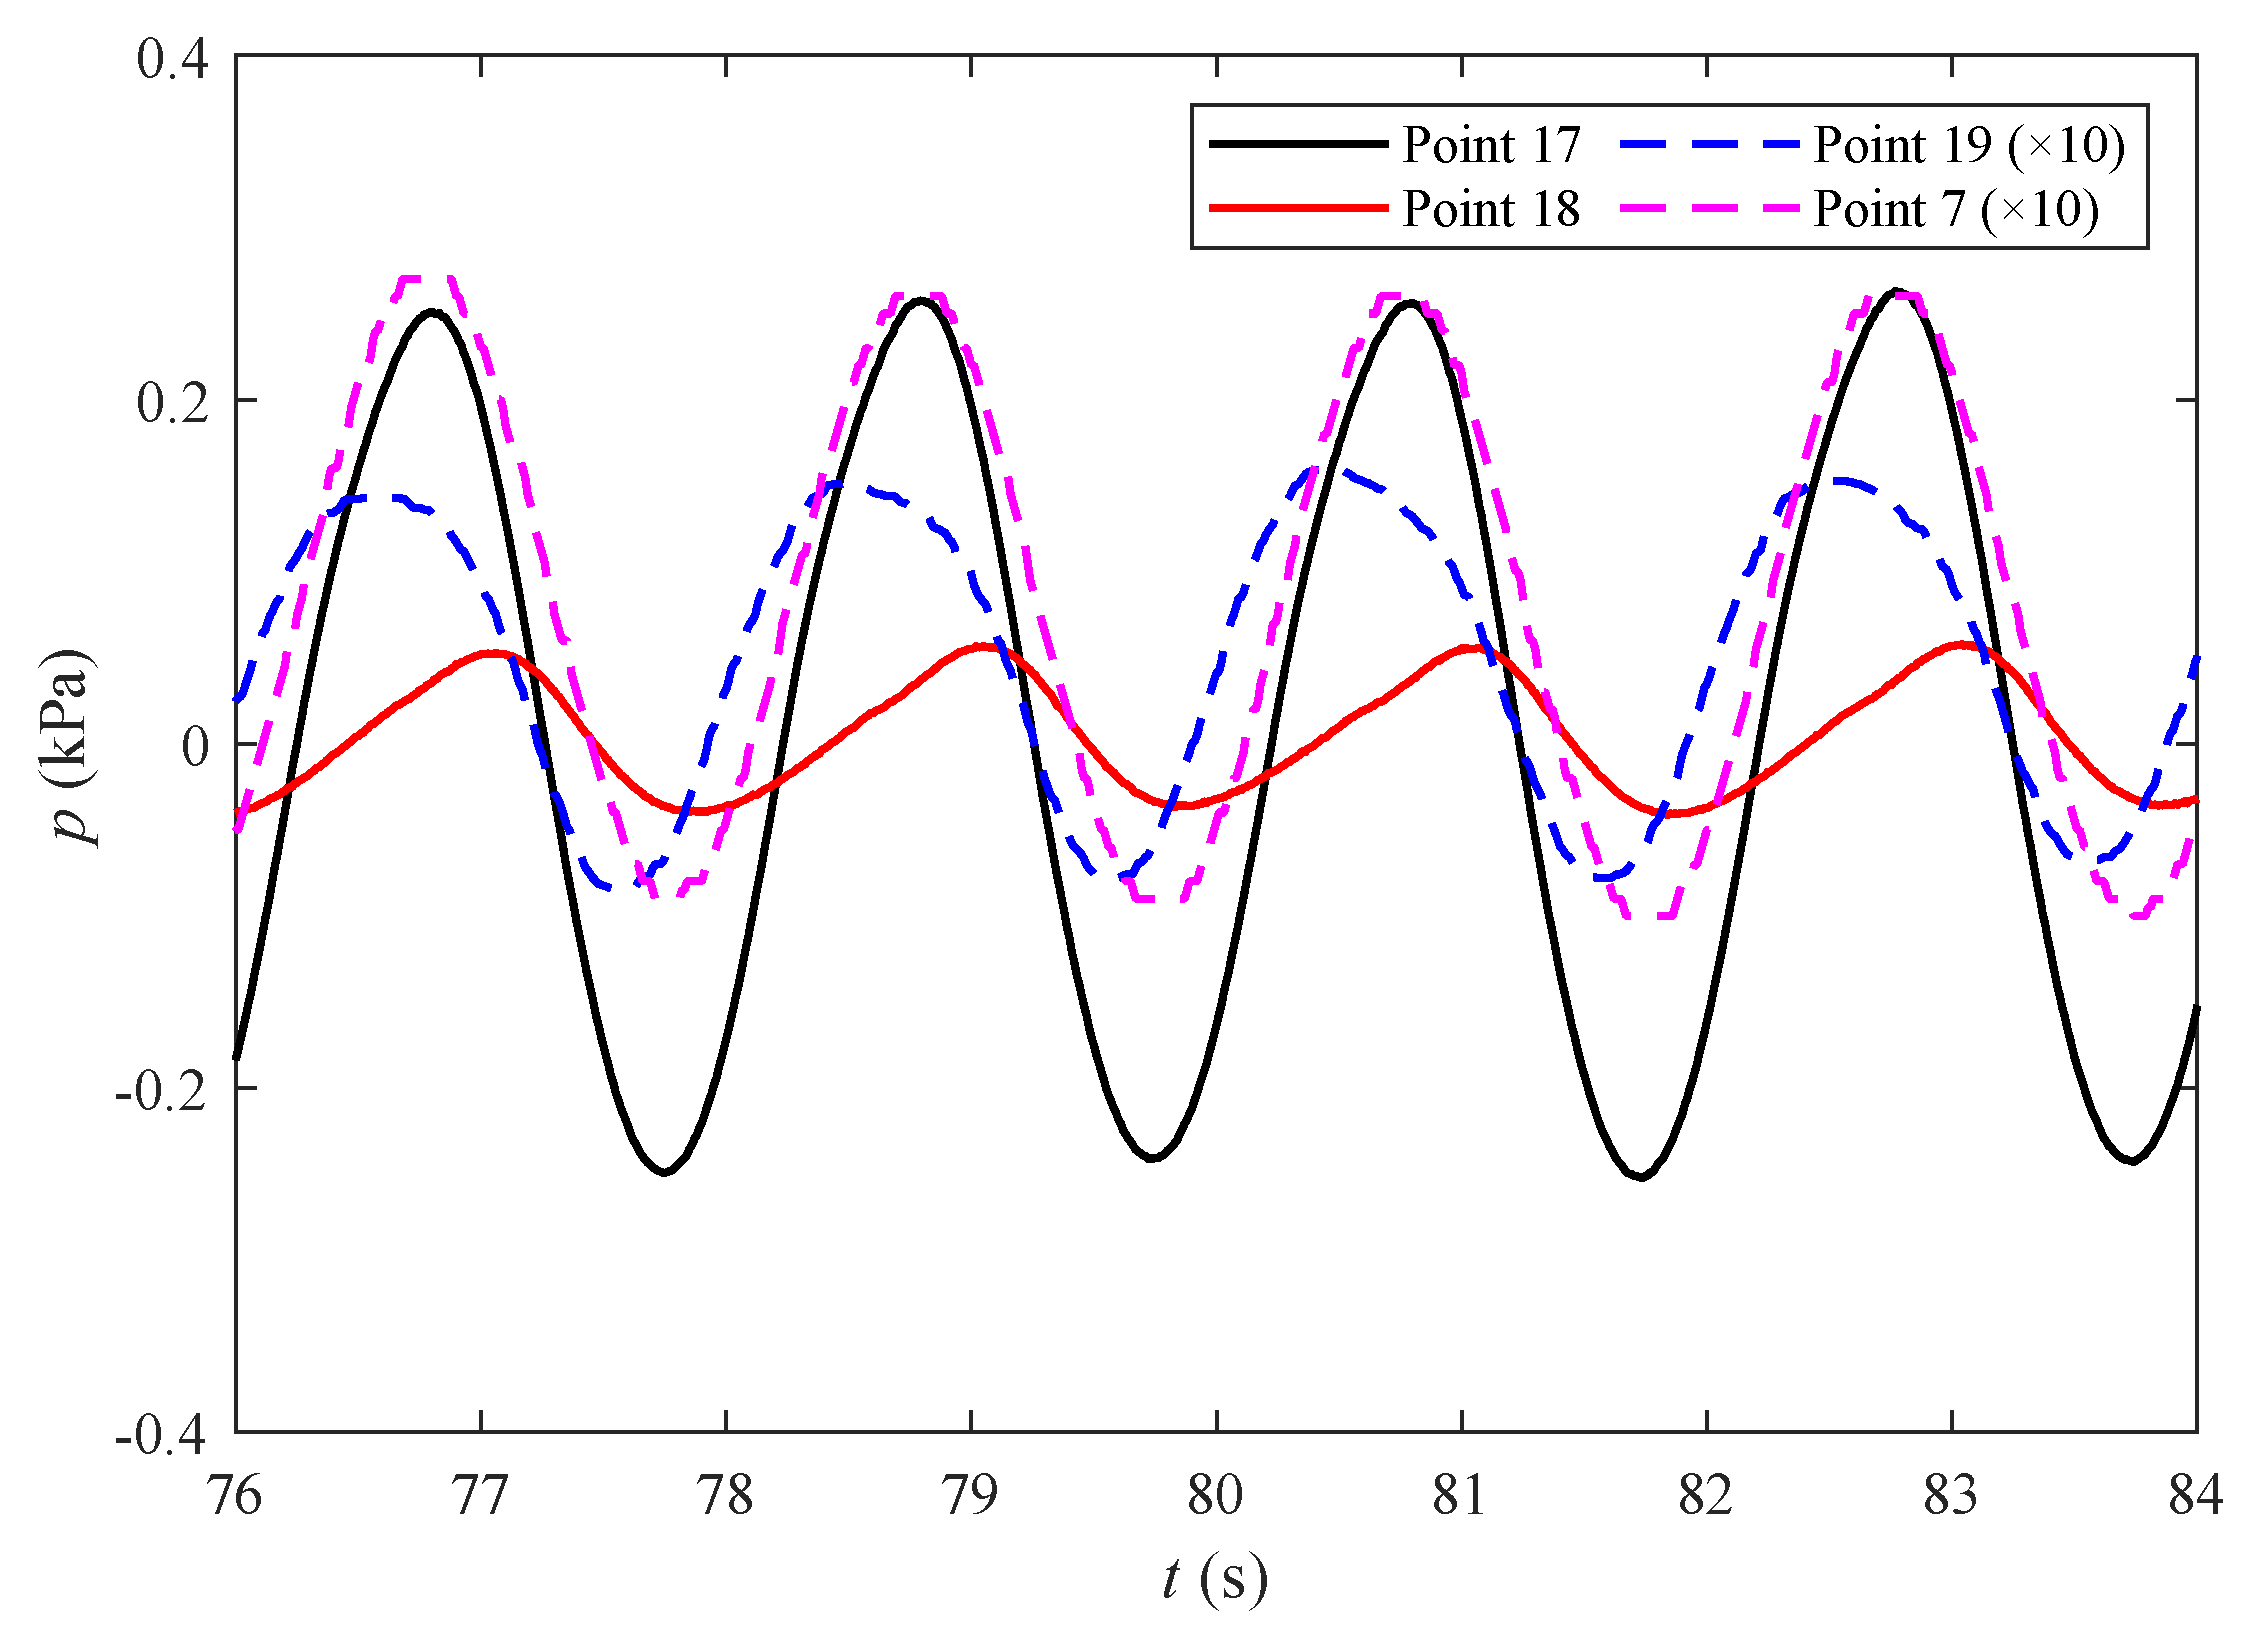
  • The wave is affected by the presence of the pile and the waveform is deformed near the pile due to diffraction and reflection, which will have an effect on the response of the seabed. The wave pressure on the front of the pile is greater than that on the side of the pile.
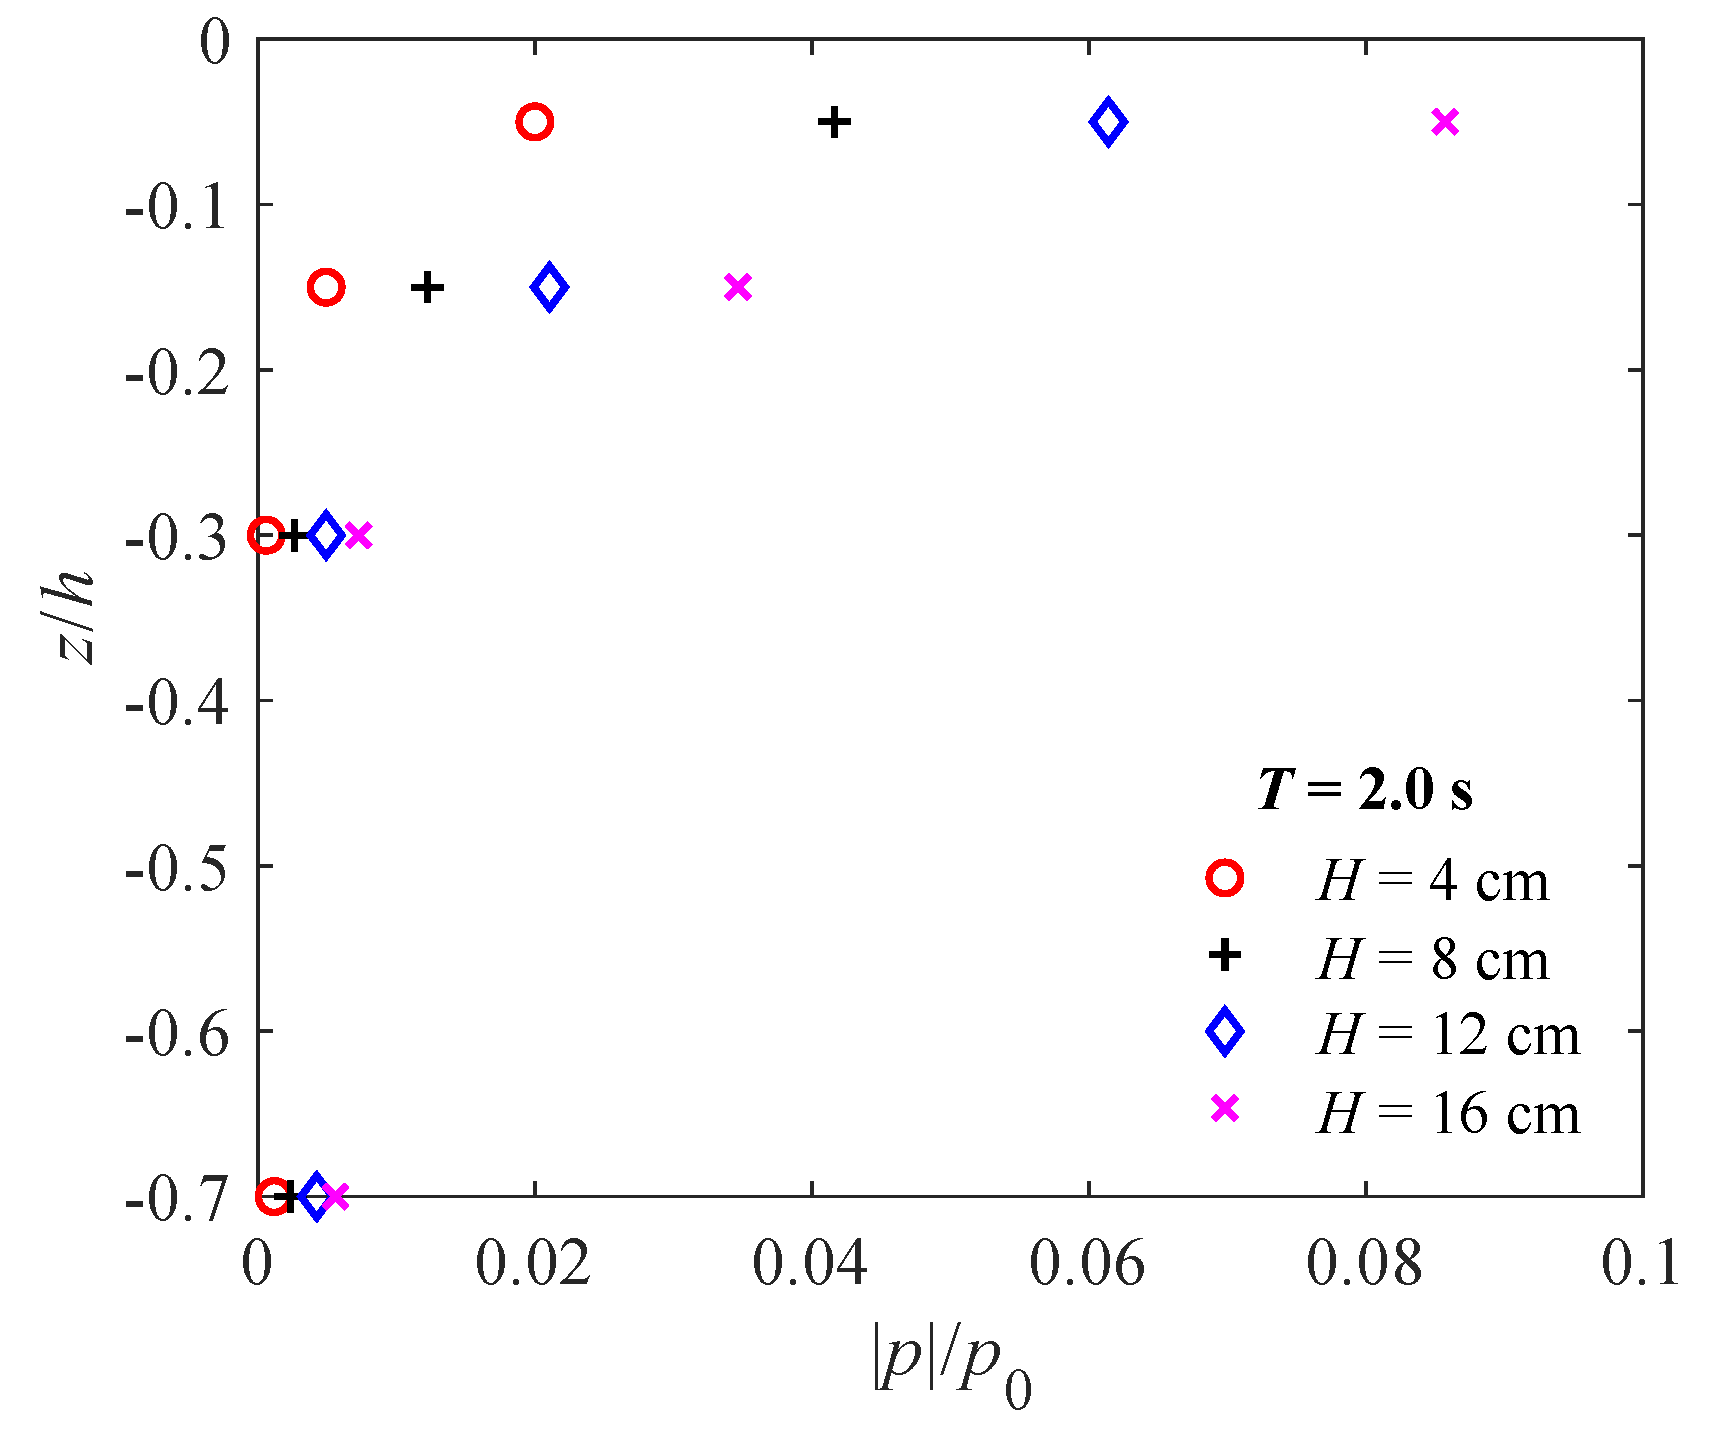
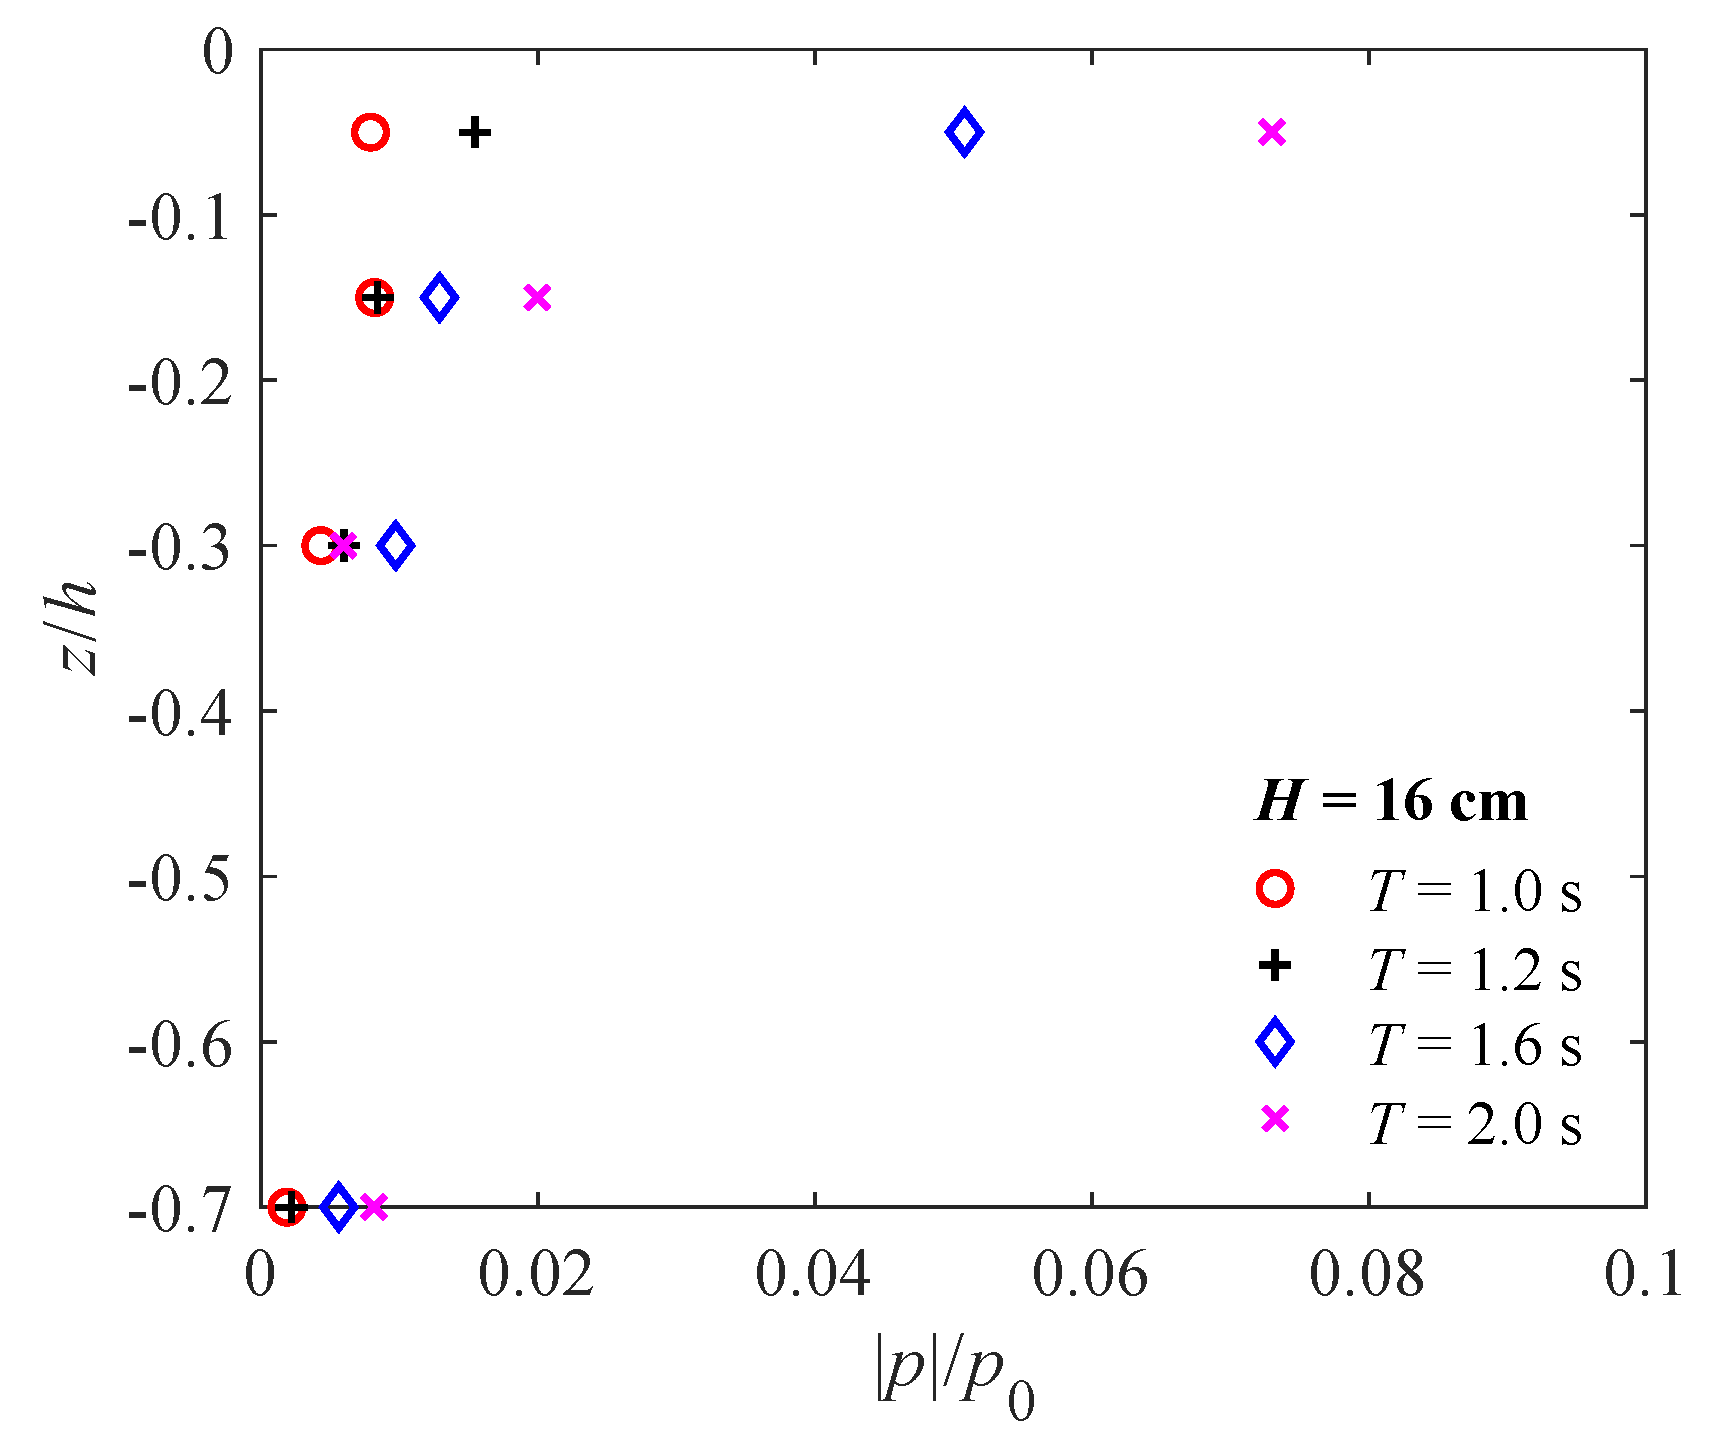
  • The seabed dynamic responses are more pronounced near the surface (in the region above 30 cm deep), and the rate of pore pressure attenuation gradually slows down. For the region below 0.3 m, the response is much smaller, and the influence of the wave conditions becomes insignificant.
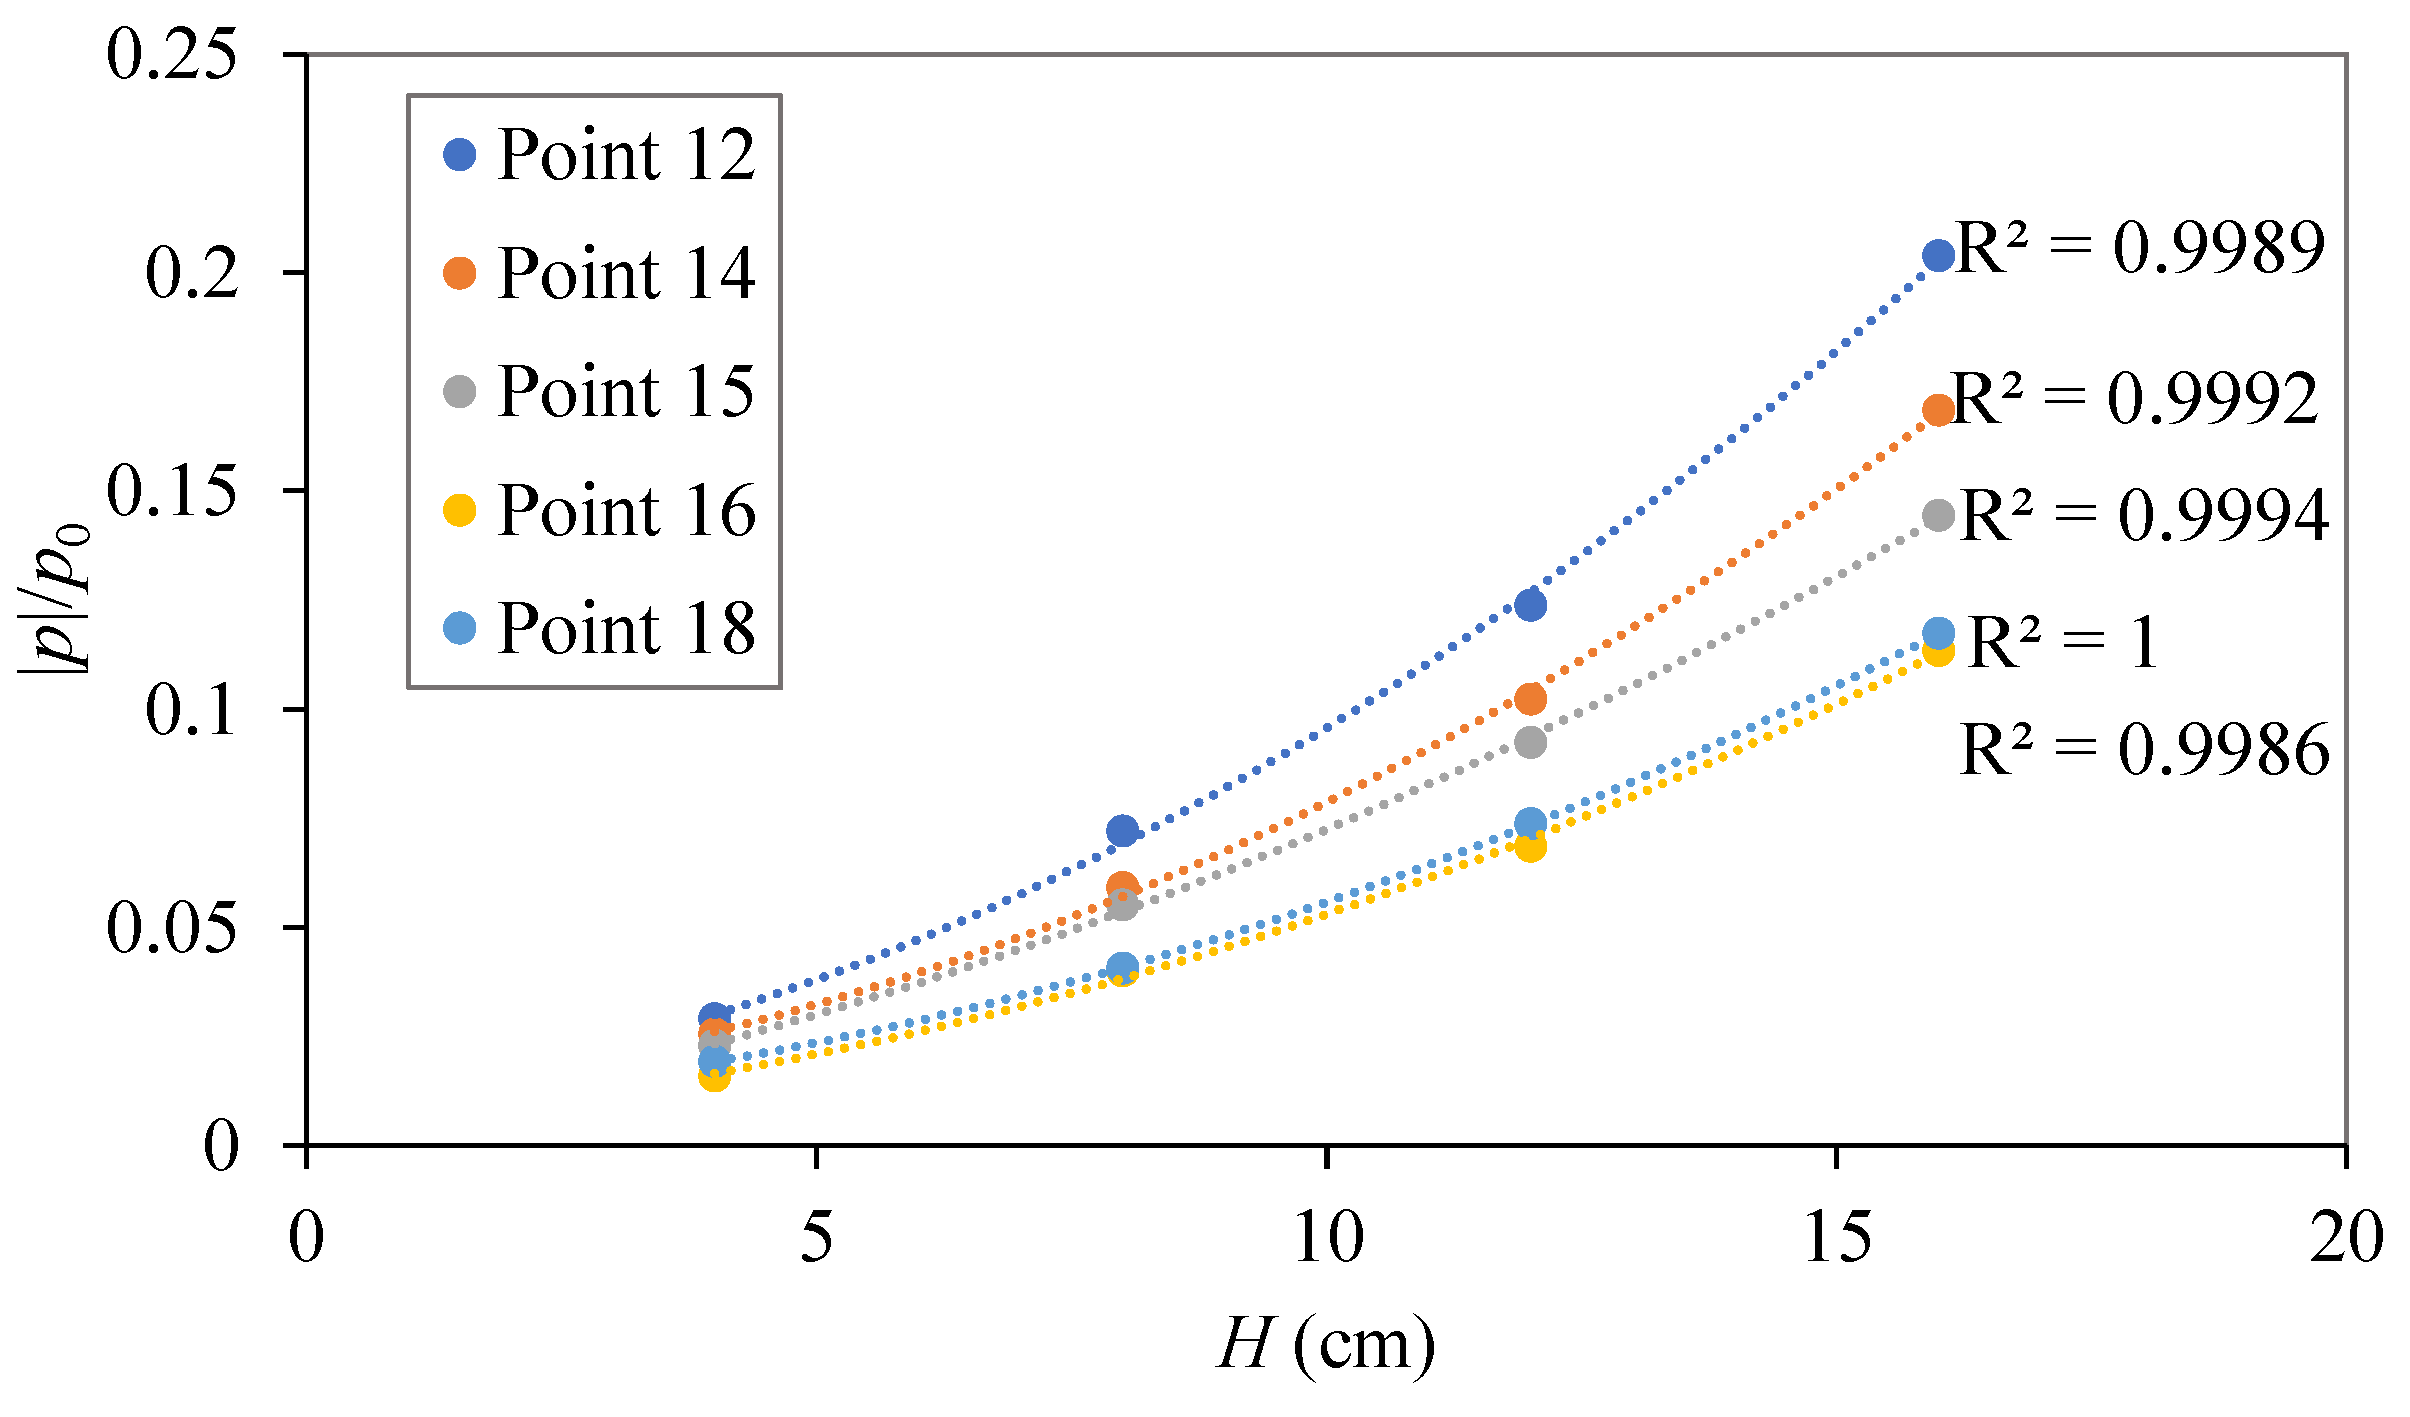
  • In general, the pore-water pressure along the surface of the mono-pile increases as the wave height and wave period increase, which is related to wave energy.
  • The presence of the pile has an obvious effect on the response of the seabed. The experimental results suggest that the spatial distribution of pore pressure near the pile will change with different wave periods, which can be attributed to wave diffraction around the pile, while the wave height only has a significant effect on the amplitude.
  • The pore-pressure amplitude of topsoil ( z = 0 . 15 m) in front of the mono-pile ( 0 ) is larger, while beneath the pile ( z = 0 . 7 m), the largest pore pressures occur behind the pile ( 180 ). Pore pressure is produced by the wave load on the seabed, but the propagation of pore pressure is also affected by the structure.

Author Contributions

Conceptualization, D.-S.J.; methodology, Q.Z. and S.W.; validation, S.W. and Q.Z.; formal analysis, S.W., P.W., H.Z.; data curation, Q.Z., S.W., P.W., H.Z., L.D., L.C., Y.L.; writing original draft preparation, D.-S.J.; writing review and editing, Q.Z., S.W., L.D., L.C., P.W., H.Z., Y.L; visualization, D.-S.J., P.W.; supervision, D.-S.J.

Funding

The authors are grateful for the support of National 1000 Talent Project (No: A1920502051907-3).

Conflicts of Interest

The authors declare no conflict of interest.

References

  1. Sumer, B.M. Liquefaction around Mainre Structures; World Scientific: Hackensack, NJ, USA, 2014. [Google Scholar]
  2. Jeng, D.S. Mechanics of Wave-Seabed-Structure Interactions: Modelling, Processes and Applications; Cambridge University Press: Cambridge, UK, 2018. [Google Scholar]
  3. Zen, K.; Yamazaki, H. Mechanism of wave-induced liquefaction and densification in seabed. Soils Found. 1990, 30, 90–104. [Google Scholar] [CrossRef]
  4. Sumer, B.M.; Fredsoe, J. The Mechanics of Scour in the Marine Environment; World Scientific Publishing Co. Pte. Ltd.: Singapore, 2002. [Google Scholar]
  5. Jeng, D.S. Porous Models for Wave-Seabed Interactions; Springer: Berlin, Germany, 2013. [Google Scholar]
  6. Tzang, S.Y.; Ou, S.H. Laboratory flume studies on monochromatic wave-fine sandy bed interactions: Part 1. Soil fluidization. Coast. Eng. 2006, 53, 965–982. [Google Scholar] [CrossRef]
  7. Wang, L.; Pan, D.; Pan, C.; Hu, J. Experimental investigation on wave-induced response of seabed. China Civil Eng. J. 2007, 40, 101–109. (In Chinese) [Google Scholar]
  8. Kirca, V.S.O.; Sumer, B.M.; Fredsøe, J. Influence of clay content on wave-induced liquefaction. J. Waterw. Port Coast. Ocean Eng. ASCE 2014, 140, 04014024. [Google Scholar] [CrossRef]
  9. Biot, M.A. General theory of three-dimensional consolidation. J. Appl. Phys. 1941, 26, 155–164. [Google Scholar] [CrossRef]
  10. Yamamoto, T.; Koning, H.; Sellmeijer, H.; Hijum, E.V. On the response of a poro-elastic bed to water waves. J. Fluid Mech. 1978, 87, 193–206. [Google Scholar] [CrossRef]
  11. Madsen, O.S. Wave-induced pore pressures and effective stresses in a porous bed. Géotechnique 1978, 28, 377–393. [Google Scholar] [CrossRef]
  12. Hsu, J.R.C.; Jeng, D.S. Wave-induced soil response in an unsaturated anisotropic seabed of finite thickness. Int. J. Numer. Anal. Methods Geomech. 1994, 18, 785–807. [Google Scholar] [CrossRef]
  13. Li, X.J.; Gao, F.P.; Yang, B.; Zang, J. Wave-induced pore pressure response and soil liquefaction around pile foundation. Int. J. Offshore Polar Eng. 2011, 21, 233–239. [Google Scholar]
  14. Chang, K.T.; Jeng, D.S. Numerical study for wave-induced seabed response around offshore wind turbine foundation in Donghai offshore wind farm, Shanghai, China seabed response around mono-pile foundation: Donghai Offshore Wind Farm in China. Ocean Eng. 2014, 85, 32–43. [Google Scholar] [CrossRef]
  15. Lin, Z.; Pokrajac, D.; Guo, Y.; Jeng, D.S.; Tang, T.; Rey, N.; Zheng, J.; Zhang, J. Investigations of nonlinear wave-induced seabed response around mono-pile foundation. Coast. Eng. 2017, 121, 197–211. [Google Scholar] [CrossRef]
  16. Sui, T.; Zhang, C.; Guo, Y.; Zheng, J.; Jeng, D.; Zhang, J.; Zhang, W. Three-dimensional numerical model for wave-induced seabed response around mono-pile. Ships Offshore Struct. 2016, 11, 667–678. [Google Scholar] [CrossRef]
  17. Sui, T.T.; Zhang, C.; Guo, Y.; Jeng, D.S.; Zheng, J.; Gao, Y. Wave-induced seabed residual liquefaction around a mono-pile foundation with various embedded depth. Ocean Eng. 2019, 172, 157–173. [Google Scholar] [CrossRef]
  18. Zhang, Y.; Liao, C.; Chen, J.; Tong, D.; Wang, J. Numerical analysis of interaction between seabed and mono-pile subjected to dynamic wave loadings considering the pile rocking effect. Ocean Eng. 2018, 155, 173–188. [Google Scholar] [CrossRef]
  19. Zhu, B.; Ren, J.; Ye, G.L. Wave-induced liquefaction of the seabed around a single pile considering pile-soil interaction. Mar. Georesour. Geotechnol. 2018, 36, 150–162. [Google Scholar] [CrossRef]
  20. Chowdhury, B.; Dasari, G.R.; Nogami, T. Laboratory study of liquefaction due to wave-seabed interacton. J. Geotech. Geoenviron. Eng. ASCE 2006, 132, 841–851. [Google Scholar] [CrossRef]
  21. Liu, B.; Jeng, D.S.; Ye, G.; Yang, B. Laboratory study for pore pressures in sandy deposit under wave loading. Ocean Eng. 2015, 106, 207–219. [Google Scholar] [CrossRef]
  22. Sassa, S.; Sekiguchi, H. Wave-induced liquefaction of beds of sand in a centrifuge. Géotechnique 1999, 49, 621–638. [Google Scholar] [CrossRef]
  23. Tsui, Y.; Helfrich, S.C. Wave-induced pore pressures in submerged sand layer. J. Geotech. Eng. ASCE 1983, 109, 603–618. [Google Scholar] [CrossRef]
  24. Sumer, B.M.; Hatipoglu, F.; Fredsøe, J.; Sumer, S.K. The sequence of sediment behaviour during wave-induced liquefaction. Sedimentology 2006, 53, 611–629. [Google Scholar] [CrossRef]
  25. Sumer, B.M.; Kirca, V.S.O.; Fredsøe, J. Experimental Validation of a Mathematical Model for Seabed Liquefaction Under Waves. Int. J. Offshore Polar Eng. 2012, 22, 133–141. [Google Scholar]
  26. Qi, W.G.; Gao, F.P. Physical modelling of local scour development around a large-diameter monopile in combined waves and current. Coast. Eng. 2014, 83, 72–81. [Google Scholar] [CrossRef]
  27. Qi, W.; Gao, F. Equilibrium scour depth at offshore monopile foundation in combined waves and current. Sci. China Technol. Sci. 2014, 57, 1030–1039. [Google Scholar] [CrossRef] [Green Version]
  28. Le M’ehaut’e, B.L. An Introduction to Hydrodynamics and Water Waves; Springer: Berlin/Heidelberg, Germany, 1976. [Google Scholar]
  29. Okusa, S. Wave-induced stress in unsaturated submarine sediments. Géotechnique 1985, 35, 517–532. [Google Scholar] [CrossRef]
Figure 1. A photo of the experimental setup.
Jmse 07 00237 g001
Figure 2. (a) Experimental setup for the wave flume and (b) the location of wave gauges.
Jmse 07 00237 g002
Figure 3. Locations of pressure transducers.
Jmse 07 00237 g003
Figure 4. The pressure transducer bracket.
Jmse 07 00237 g004
Figure 5. Grain-size distribution of soil sample: d 50 = 0.215 mm, d 10 = 0.081 mm, d 30 = 0.167 mm, d 60 = 0.239 mm; c u = 2.972, and c c = 1.448.
Jmse 07 00237 g005
Figure 6. Range of suitability of various wave theories.
Jmse 07 00237 g006
Figure 7. Distribution of wave profiles and wave pressures on the mono-pile vs time. (a) Wave profile 5.5 m from the mono-pile; (b) wave profiles around the mono-pile (0.3 m away); and (c) wave pressures on the mono-pile at Points 20 and 22 (Test 29 ( T = 1.6 s, H = 10 cm)).
Jmse 07 00237 g007
Figure 8. Distribution of pore-water pressures vs time in front of the pile in Test 43 (x = 0.15 m, T = 2.0 s, H = 10 cm).
Jmse 07 00237 g008
Figure 9. Distribution of the maximum pore-water pressure vs soil depth (z) in front of the pile for various wave periods (x = 0.15 m, H = 16 cm, Points 11, 12, 13, and 5).
Jmse 07 00237 g009
Figure 10. Distribution of the maximum pore-water pressures vs soil depth (z) in front of the pile for various wave heights (x = 0.15 m, T = 2 s, Points 11, 12, 13, and 5).
Jmse 07 00237 g010
Figure 11. Distribution of pore-water pressures vs time behind the pile for Test 43 (x = −0.15 m, T = 2.0 s, H = 10 cm).
Jmse 07 00237 g011
Figure 12. Distribution of the maximum pore-water pressures vs soil depth ( z / h ) behind the pile for various wave periods (x = −0.15 m, H = 16 cm, Points 17, 18, 19, and 7).
Jmse 07 00237 g012
Figure 13. Distribution of the maximum pore-water pressures vs soil depth ( z / h ) behind the pile for various wave heights (x = −0.15 m, T = 2 s, Points 17, 18, 19, and 7).
Jmse 07 00237 g013
Figure 14. Distribution of the maximum pore-water pressures around the pile for various wave periods at z = −0.15 m ( H = 16 cm, Points 12, 14, 15, 16, and 18 in Figure 3).
Jmse 07 00237 g014
Figure 15. Distribution of the maximum pore-water pressures around the pile for various wave heights at z = −0.15 m ( T = 2 s, Points 12, 14, 15, 16, and 18).
Jmse 07 00237 g015
Figure 16. Fitting curve of the relationship between pore pressure and wave height at different points around the pile.
Jmse 07 00237 g016
Figure 17. Distribution of pore-water pressures vs time beneath the center of the pile ( x = 0, T = 2.0 s, H = 10 cm, Point 4).
Jmse 07 00237 g017
Figure 18. Distribution of the maximum pore-water pressures around the pile for various wave heights at z = −0.70 m ( T = 2 s, Points 5, 9, and 7 in Figure 3).
Jmse 07 00237 g018
Figure 19. Distribution of the maximum pore-water pressures around the pile for various wave periods at z = −0.70 m, ( H = 16 cm, Points 5, 9, and 7 in Figure 3).
Jmse 07 00237 g019
Table 1. Measuring equipment and specifications.
NameMeasuring RangeAccuracySampling FrequencyTypeNumber
Pore-water pressure transducer0–30 kPa0.1%100 HzCY30623
Digital sensor hub485-202
SwitchSG1051
Wave height gauge0–600 mm0.5%100 HzYWS2004
Table 2. Sand parameter measuring equipment.
NameType
ScreenStandard Screens (2, 1, 0.5, 0.25, 0.075 mm)
Temperature controlerXGQ-2000
Counter scale1 g division value
Volumetric flask100 mL
PermeameterTST-70
Traxial apparatusModel TCK-1 Traxial Test Controlled Apparatus
Relative density test apparatusModel JDM-1 Electric Relative density Test Apparatus
Table 3. Soil properties used in the experiment.
Soil PropertiesValueUnit
Grain density ( ρ s )2679kg/m 3
Permeability ( k s )2.382 ×10 5 m/s
Shear modulus (G)8.58 × 10 6 N/m 2
Poisson’s Ratio ( μ )0.3-
Soil porosity (n)0.448-
Void ratio (e)0.812-
Maximum void ratio ( e m a x )0.892-
Minimum void ratio ( e m i n )0.643-
Relative density ( D r )0.321-
Average grain diameter ( d 50 )0.215mm
Table 4. Wave conditions of the experiments.
Test No.Wave HeightWave PeriodTest No.Wave HeightWave Period
(H, cm)(T, s)(H, cm)(T, s)
Test 140.8
Test 26
Test 38
Test 410
Test 54 Test 264
Test 66 Test 276
Test 78 Test 288
Test 8101.0Test 29101.6
Test 912 Test 3012
Test 1014 Test 3114
Test 1116 Test 3216
Test 124Test 334
Test 136 Test 346
Test 148 Test 358
Test 15101.2Test 36101.8
Test 1612 Test 3712
Test 1714 Test 3814
Test 1816 Test 3916
Test 194Test 404
Test 206 Test 416
Test 218 Test 428
Test 22101.4Test 43102.0
Test 2312 Test 4412
Test 2414 Test 4514
Test 2516 Test 4616

