Article

Analysis of Dynamic Characteristics of an Ultra-Large Semi-Submersible Floating Wind Turbine

1
State Key Laboratory of Coastal and Offshore Engineering, Dalian university of Technology, Dalian 116024, Liaoning, China
2
Institute of Earthquake Engineering, Faculty of Infrastructure Engineering, Dalian University of Technology, Dalian 116024, Liaoning, China
3
Deepwater Engineering Research Center, Offshore Renewable Energy Research Center, Dalian University of Technology, Dalian 116024, Liaoning, China
*
Author to whom correspondence should be addressed.
J. Mar. Sci. Eng. 2019, 7(6), 169; https://doi.org/10.3390/jmse7060169
Submission received: 10 April 2019 / Revised: 7 May 2019 / Accepted: 28 May 2019 / Published: 1 June 2019

Abstract

:
An initial design of the platform for the moderate water depth (100 m) is performed by upscaling of an existing 5 MW braceless semi-submersible platform design to support the DTU (Danish University of Science and Technology) 10 MW wind turbine. To investigate the dynamic characteristics of the ultra-large semi-submersible floating offshore wind turbine (FOWT), an aero-hydro-servo-elastic numerical modeling is applied to carry out the fully coupled time-domain simulation analysis. The motion responses of the ultra-large semi-submersible FOWT are presented and discussed for selected environmental conditions. Based on the quasi-static and dynamic analysis methods, the influence of the dynamic effects of the mooring lines on the platform motion responses and mooring line tension responses are discussed. Subsequently, the difference in the motion responses and structural dynamics of the DTU 10 MW and NREL (National Renewable Energy Laboratory) 5 MW FOWT is studied due to the difference in turbine properties. The simulation results reveal that the excitation of the low-frequency wind loads on the surge and pitch motions, the tower-base fore-aft bending moments and the mooring line tension response becomes more prominent when the size of the wind turbine increases, but the excitation action of the 3P effect on the structural dynamics of the 5 MW FOWT is more obvious than those of the 10 MW FOWT.

1. Introduction

Over the past few decades, offshore wind energy has emerged as an attractive alternative to conventional power generation and established itself as a major source of environmentally-friendly, inexhaustible, economical, and importantly renewable energy [1]. China’s offshore wind energy resources can reach 750 GW [2]. The development of the offshore wind energy is characterized by more consistent wind, less space constraints and visual impacts on the residents, which has become the main area of the development of China’s wind energy industry.
In shallow waters (<50 m), bottom-fixed substructures, such as gravity-based structures, mono-piles, multi-piles, high-piles, jackets, and buckets are usually applied to support the offshore wind turbines. However, many promising sites are at deeper water depths (>50 m), where bottom-fixed substructures can no longer be used [3]. A floating structure can be used as an alternative from an economic perspective [4], such as spar-buoys [5], semi-submersible [6], barges [7], and tension leg platforms (TLP) [8], which have the advantages of reduced noise during installation, no required scour protection, and cheap anchor installation for the mooring system. However, the floating offshore wind turbine (FOWT) is a rigid and flexible hybrid multi-body system with the complex interaction (aerodynamic-hydrodynamic coupling) of wind turbine (including blades, hub, and nacelle)-tower-support platform-mooring system, which makes the analysis of the dynamic characteristics of the FOWT system extremely complex and challenging [9].
At present, considerable research on the dynamic characteristics of 5 MW FOWT has been conducted by domestic scholars. Jonkman et al. [10] developed a HydroDyn module coupled with the original aero-servo-elastic FAST code for land-based wind turbines and analyzed various TLP and barge designs for the NREL (National Renewable Energy Laboratory) 5 MW wind turbines. A TLP support platform for the 5 MW wind turbine was the focus of a study by Matha [11], whereby its performance was compared to that of other floating platform concepts in load computations, and its major instabilities were identified. Li et al. [12] investigated the wind-wave-induced global motion responses and mooring tension responses of the 5 MW OC4-DeepCwind semi-submersible FOWT, and a quadratic damping model was developed to gain a better consideration of the viscous performance. Ma et al. [13] analyzed the motion responses and structural dynamics of the 5 MW OC3-Hywind Spar-type FOWT in different sea states and investigated the coupling effects between various motion modes of the FOWT. Furthermore, the coupled wind-wave-induced analyses of the 5 MW OC3-Hywind FOWT of different hydrodynamic models based on the Morison formula, Pressure integration method, and Panel method was conducted by Madjid [14], then, the effect of damping and inertia forces of the mooring lines on the mooring line tension responses was discussed. Guo et al. [15] also analyzed the influence of the dynamic behaviors (including the structural inertial effect and fluid drag) of the mooring lines on the integrated motion responses of the 5 MW Spar-type FOWT based on the improved three-dimensional dynamic catenary theory.
The recent trend in the offshore wind industry is going to larger wind turbines, farther offshore and deeper water due to lack of offshore wind resources in shallow water area [15]. An ultra-large wind turbine can absorb more wind power, potentially reduce the installation and construction costs, take advantage of economies of scale, and thus capitalize on the stronger and more consistent wind resources farther offshore [16]. The DTU (Danish University of Science and Technology) 10 MW wind turbine [17] jointly proposed by the DTU and Vestas Wind Technologies corporation has become an extensively accepted reference wind turbine. Owing to the ultra-large wind turbine requirements of larger support structures, Xue [18], Tian [19], and Islam [20] formulated a preliminary design of a floater to support the 10 MW wind turbine by upscaling the existing 5 MW OC3-Hywind, MIT-TLP, and WindFloat concepts. This design satisfied the basic requirements of hydrostatic stability and dynamic properties of the 10 MW FOWTs. Xu et al. [21] also considered the DTU 10 MW wind turbine as the research object and used FAST to analyze the dynamic characteristics of the OC3-Hywind Spar-type FOWT under the joint action of the wind-wave-induced loads. However, the ultra-large FOWT was faced with more complicated marine environmental conditions given the increased turbine size. The aeroelastic effects of the giant flexible blades, the large and strong nonlinear motions of the support platform, the strong nonlinear coupling effects between the mooring system and support platform are still to be extensively and thoroughly investigated.
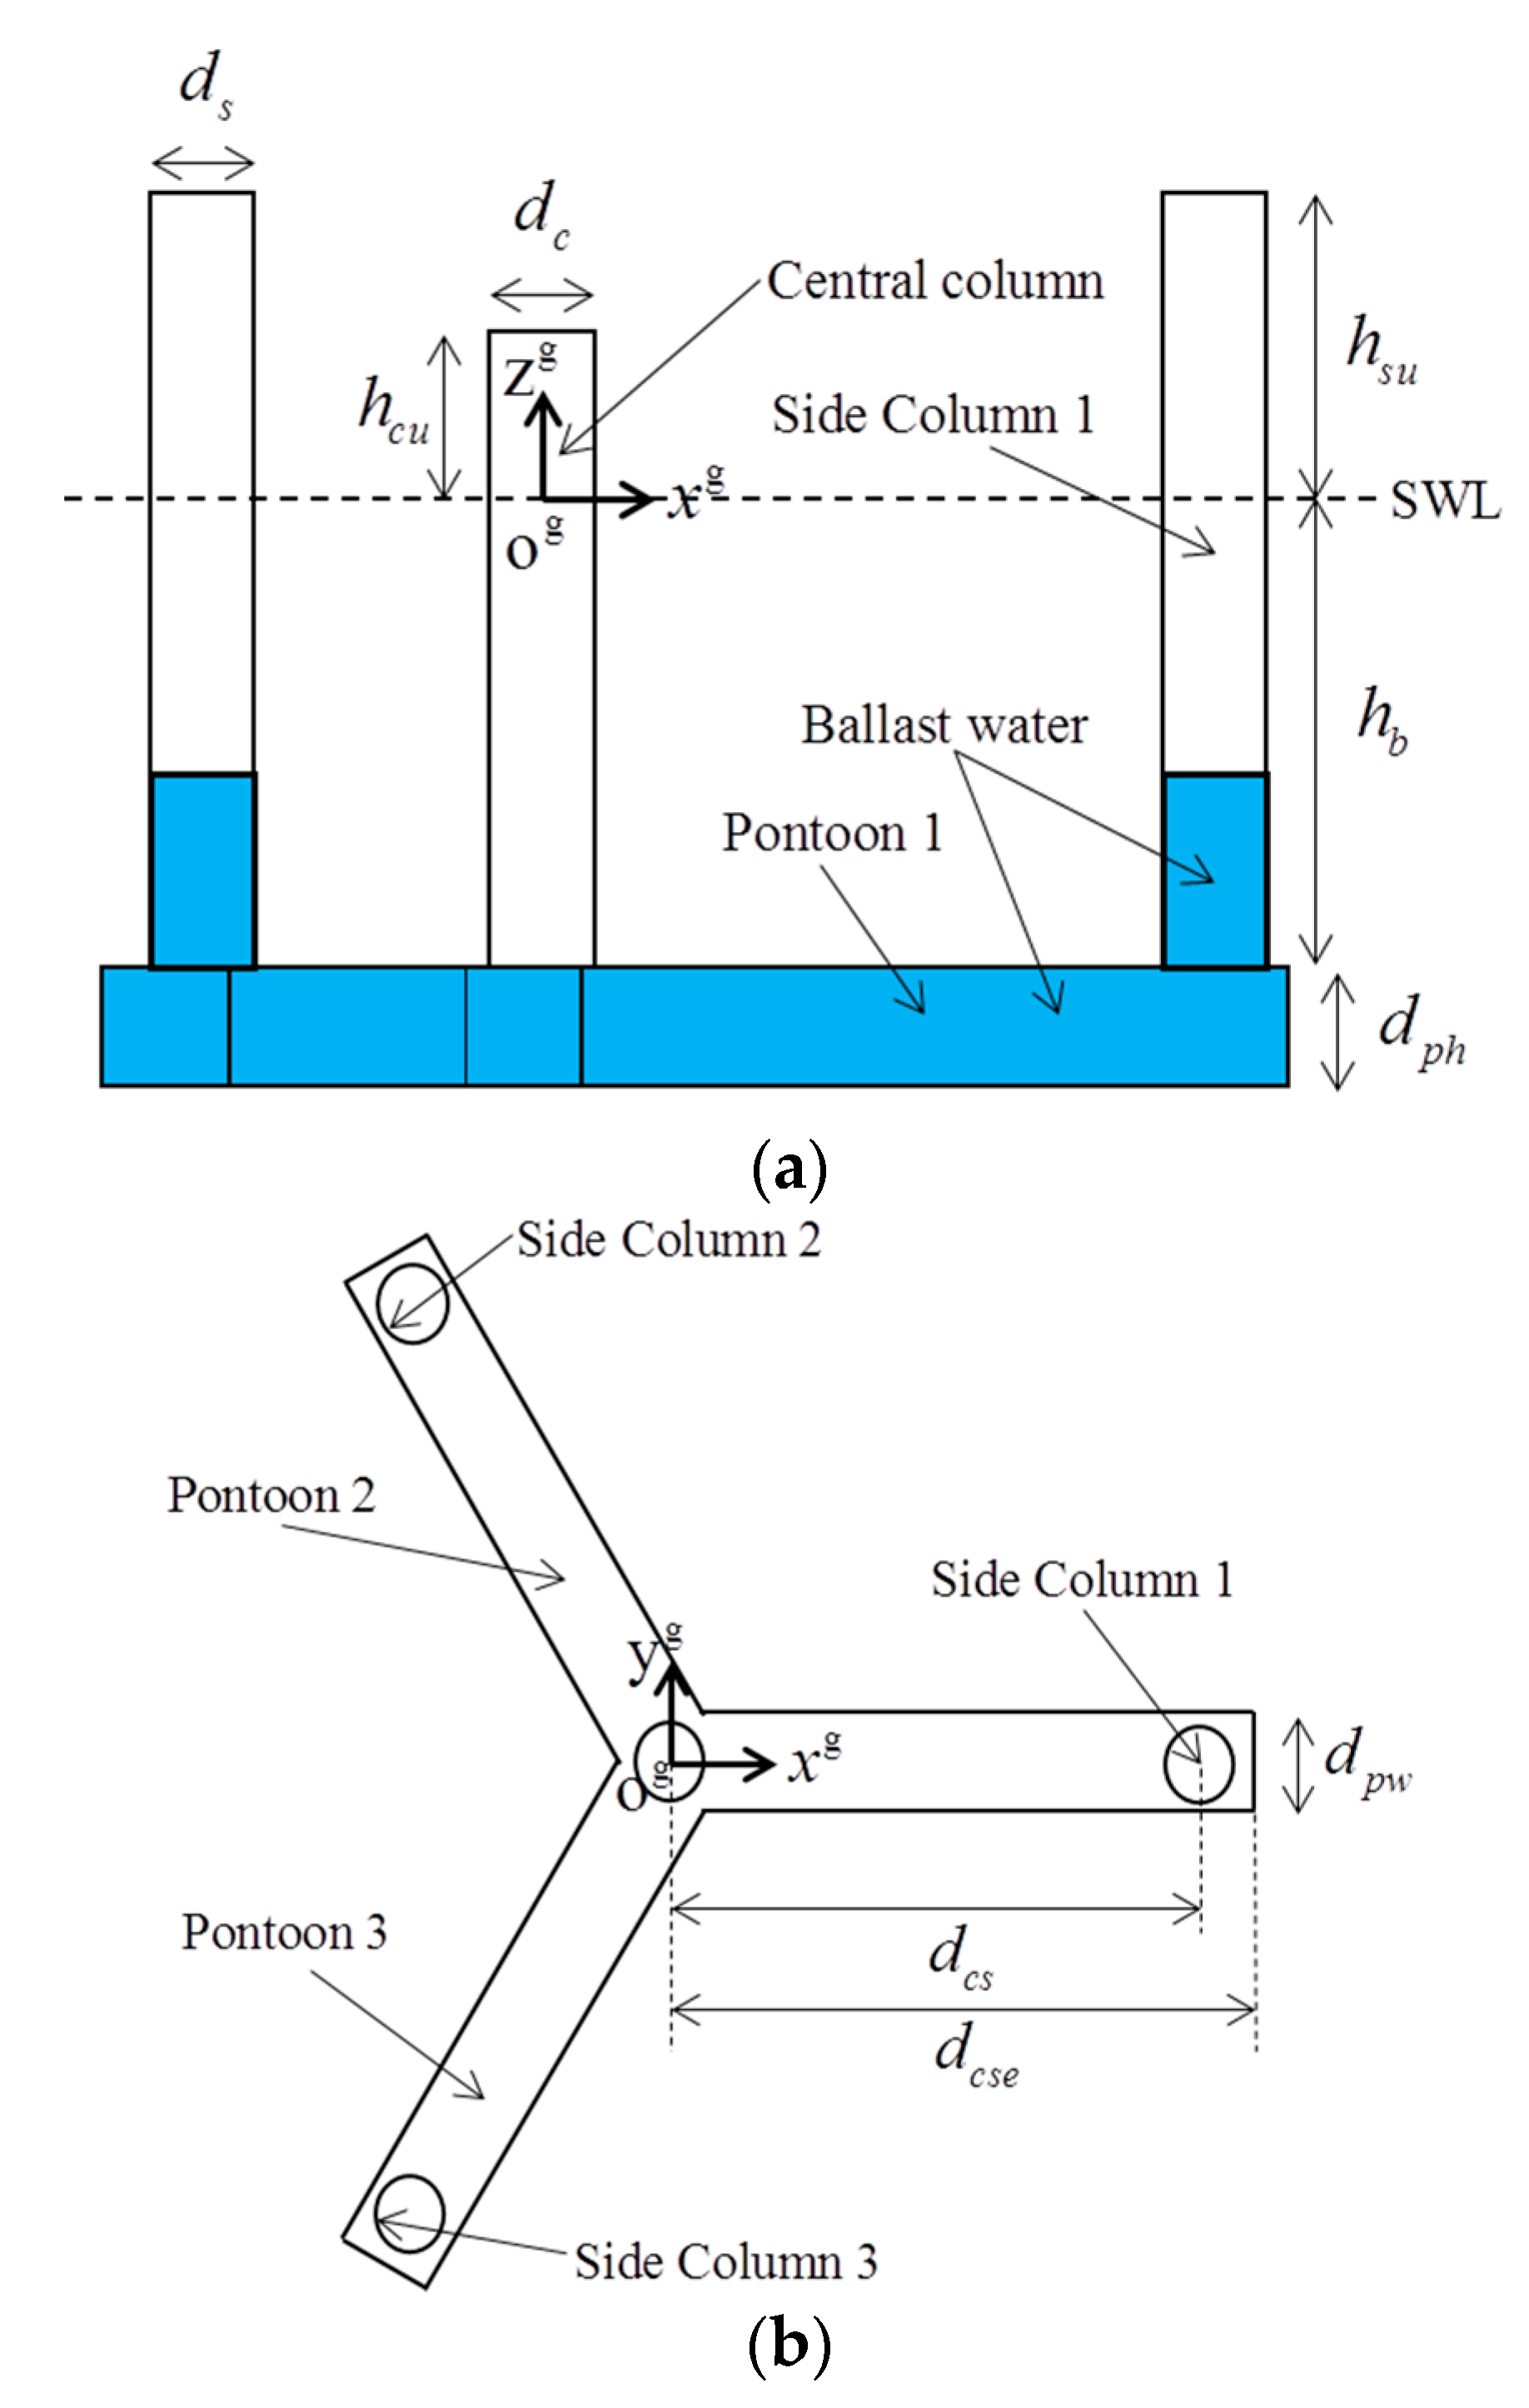
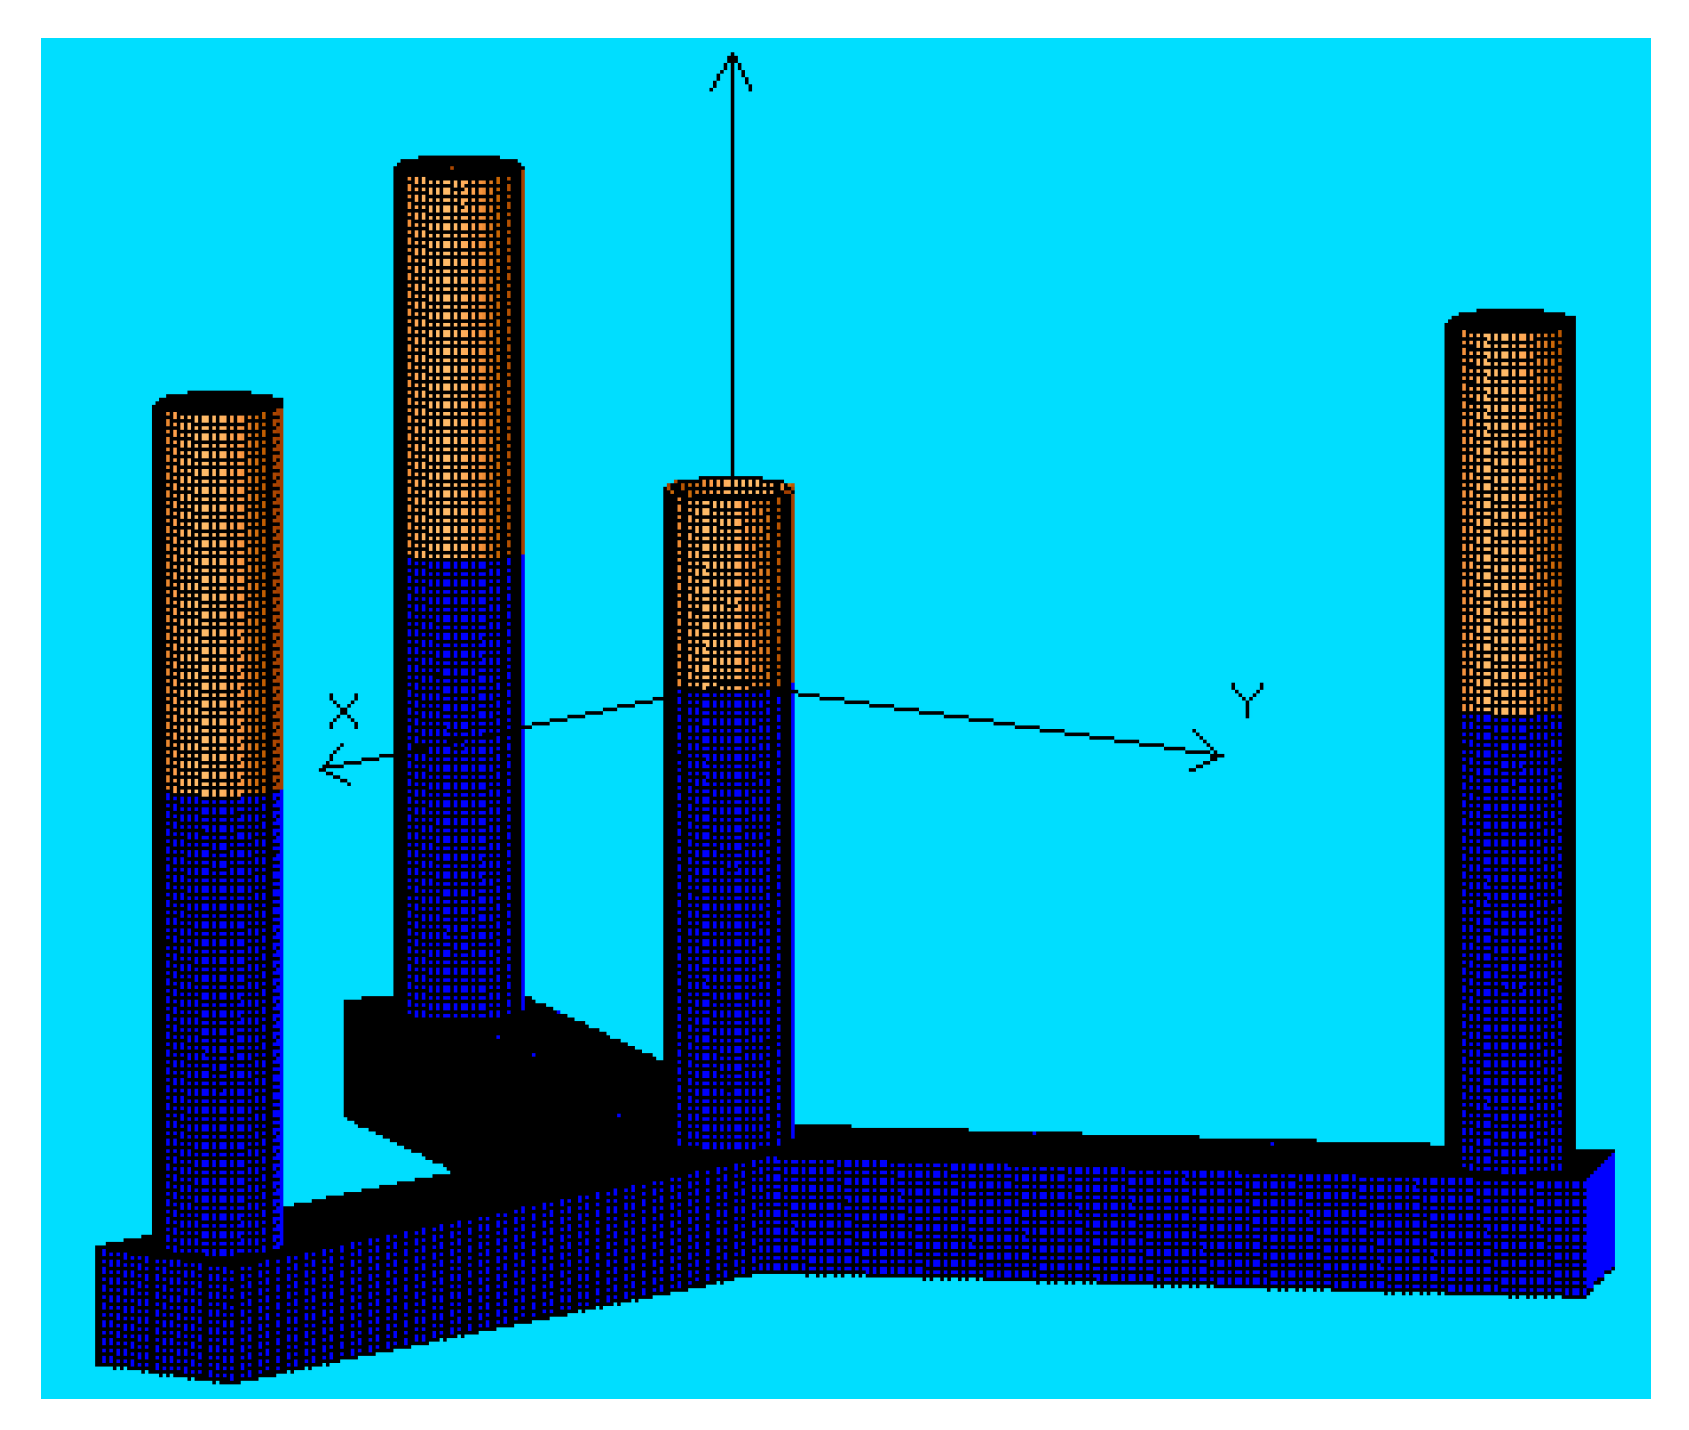
In this study, the DTU 10 MW wind turbine is selected as the research object, and the columns of the braceless semi-submersible wind turbines are connected by pontoons rather than braces, which can reduce design complexity and the construction cost of additional heave plate and avoid the stress concentration effect at the joint [22]. Therefore, an initial design is performed by upscaling of an existing 5 MW braceless semi-submersible platform design proposed by Luan et al. [
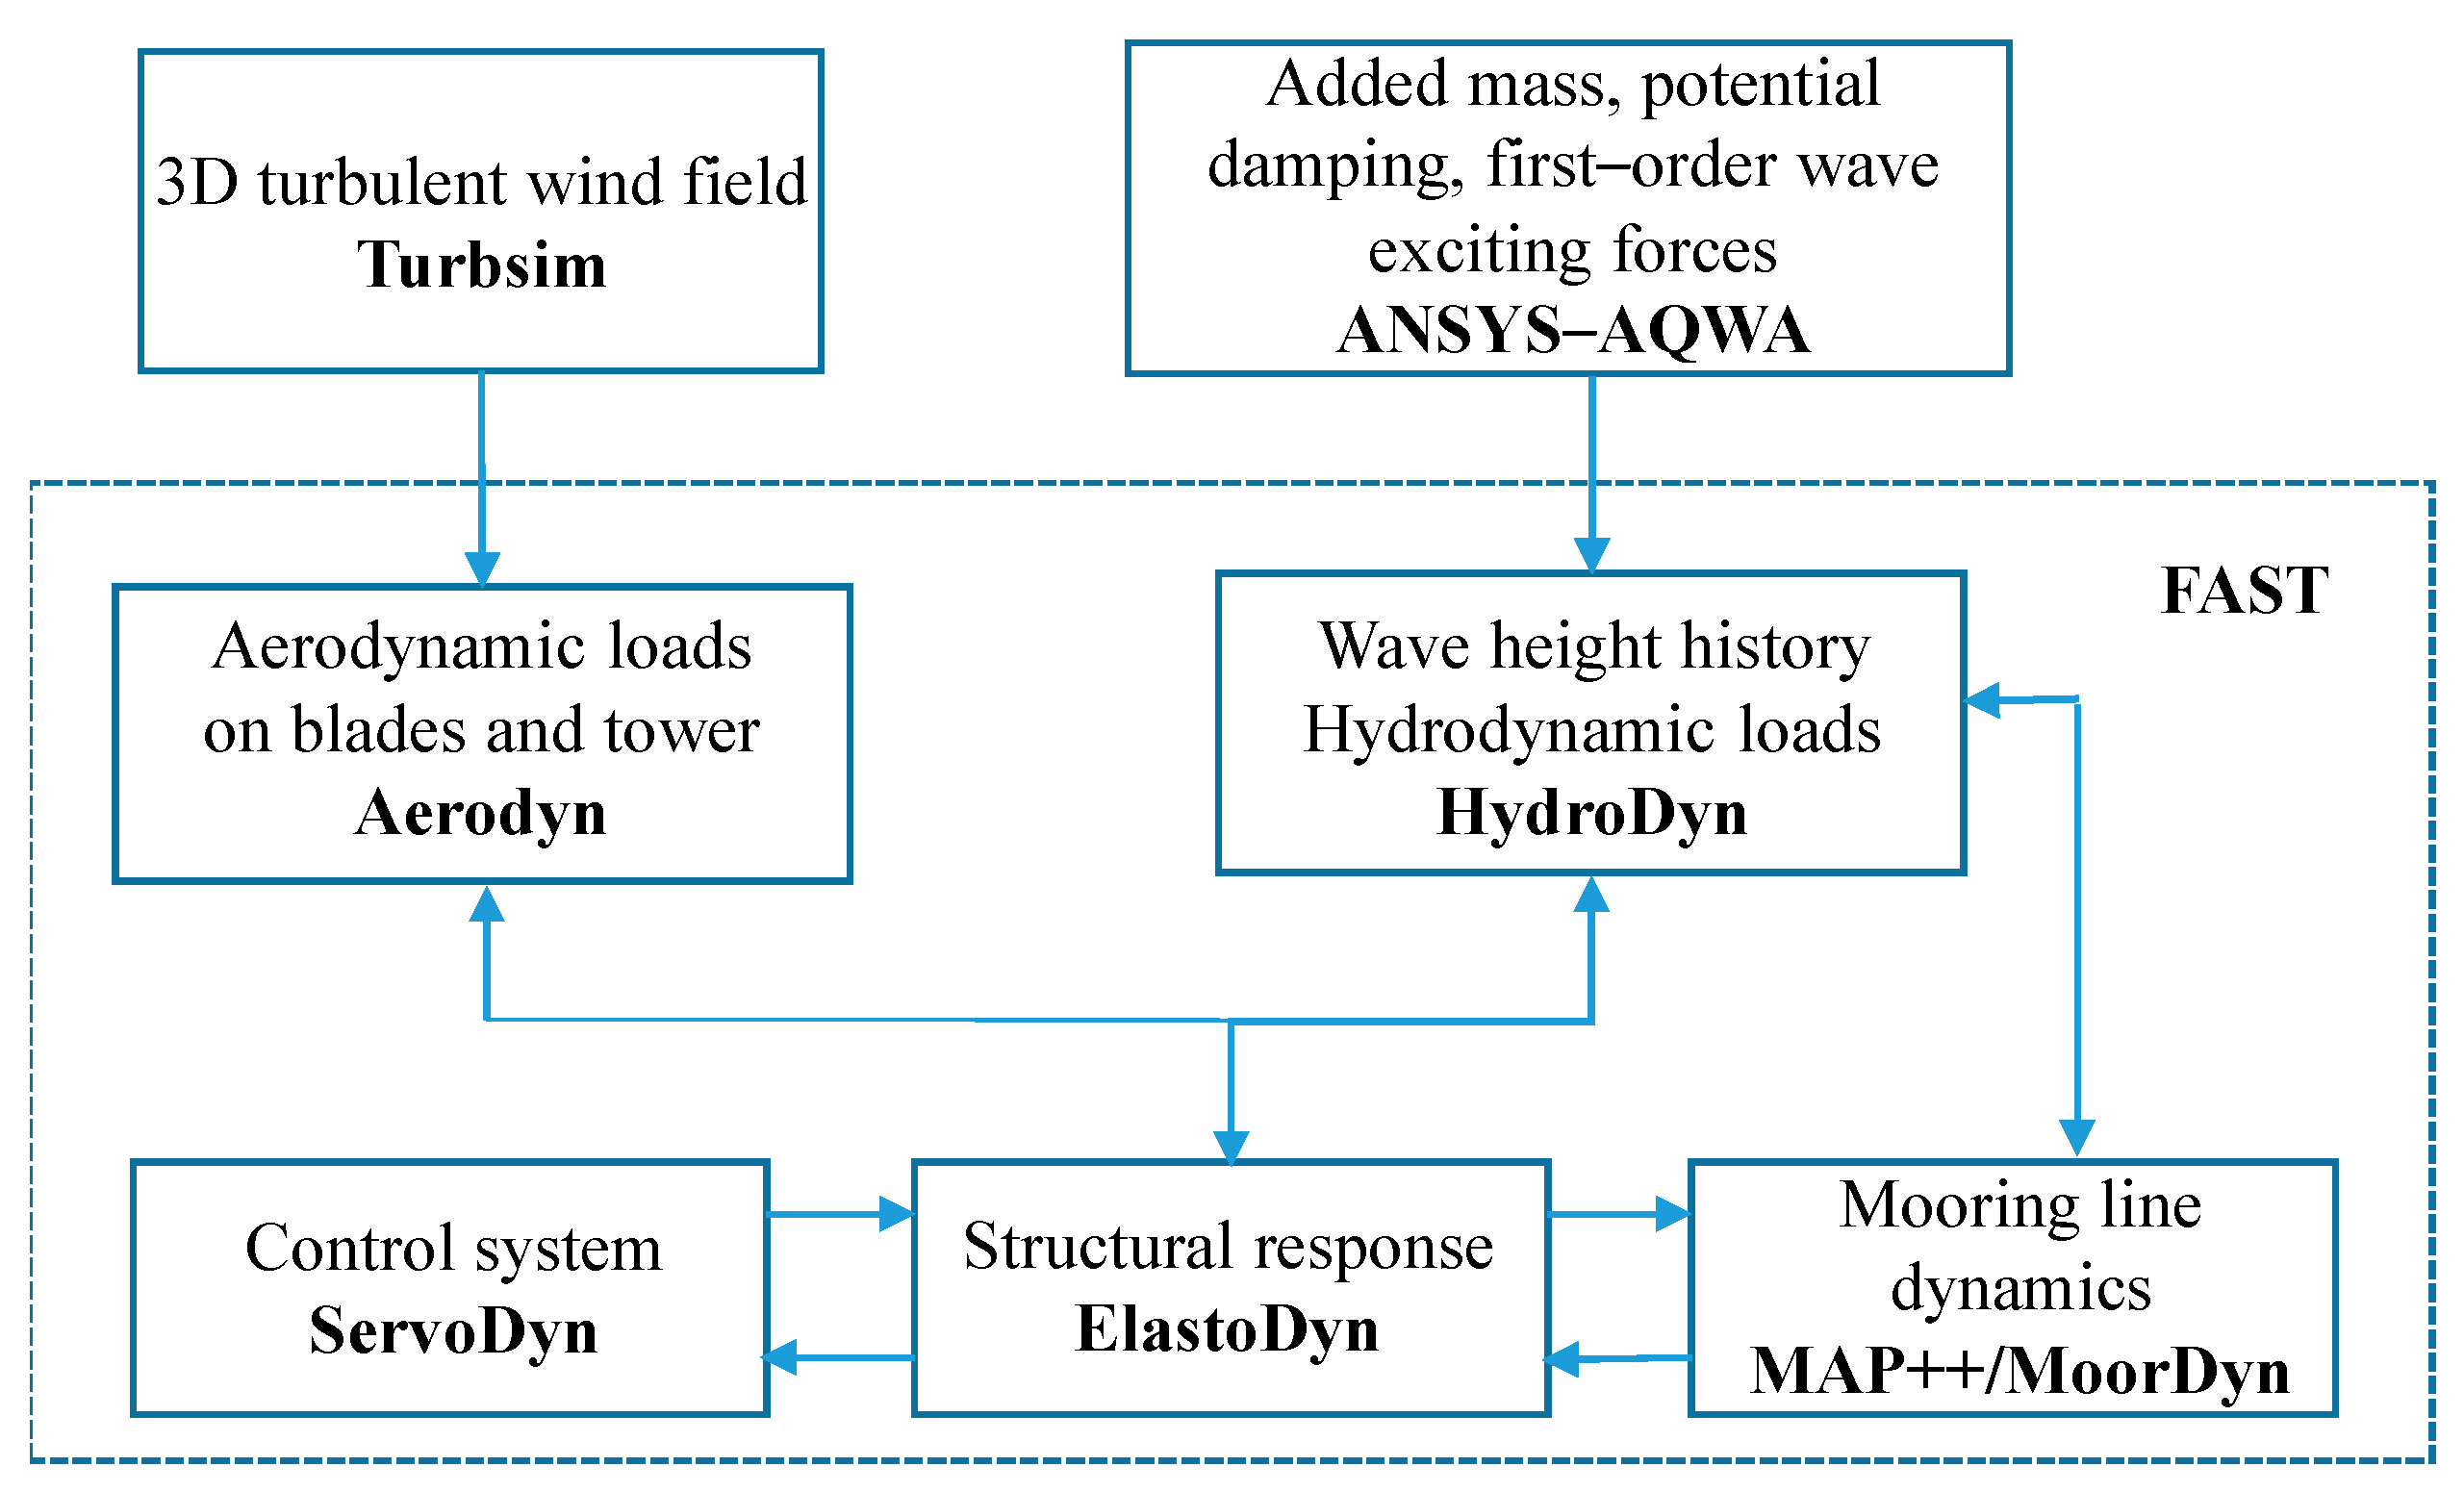
23] to support the DTU 10 MW wind turbines in the moderate water depths (100 m). Aero-hydro-servo-elastic numerical modeling is used to conduct fully coupled time-domain simulation analyses to investigate the dynamic characteristics of the ultra-large semi-submersible FOWT for the selected environmental conditions. Furthermore, the impact of additional dynamic behaviors of the mooring line on the integrated motion responses of the FOWT is studied based on the mooring dynamic analysis modeling, including the hydrodynamic damping and inertia forces of the mooring lines, and compared with the quasi-static modeling. Additionally, the difference in the motion responses and structural dynamics of the NREL 5 MW and DTU 10 MW FOWTs is studied due to the complexity of the dynamic characteristics and coupling mechanism of the ultra-large FOWTs, which can provide a reference for the design and engineering practices of the ultra-large FOWTs.

2. Theoretical Background

2.1. Coupled Motion Equation of the FOWT

Based on the theory of aerodynamics, hydrodynamics and multi-body dynamics, the coupled motion equation of the FOWTs under the joint action of the wind-wave induced loads can be expressed by [24]
( M + A ) x ¨ ( t ) + h ( t τ ) x ˙ ( τ ) d τ + ( K m ( x ) + K h ) x ( t ) = F exc ( x , x ˙ , t ) ,
where M is the mass matrix of the floating system, A is the added mass matrix at infinite frequencies, K h is the hydrostatic restoring stiffness matrix, K m is the nonlinear restoring stiffness matrix from the mooring system, x ¨ , x ˙ , and x , are the acceleration, velocity, and displacement of the platform, respectively, h ( t τ ) is the retardation function which represents the fluid memory effect, and F exc is the excitation force which includes the aerodynamic force, hydrostatic force, radiation force, diffraction force, and nonlinear viscous drag force.

2.2. Hydrodynamic Loads

Four parts of the hydrodynamic properties of the floating platform are calculated in this model. (1) The linear hydrostatic restoring force, (2) the added mass and radiation damping from the linear wave radiation including the free-surface memory effects, (3) the incident-wave excitation from the linear diffraction in regular or irregular seas, and (4) the nonlinear viscous drag from the incident-wave kinematics and the platform motions. Therefore, the total force F i Platform acting on the floating platform is expressed by [25]
F i Platform = F i Hydrostatic + F i Radiation + F i Diffraction + F i Drag ,
where F i Hydrostatic is the hydrostatic force, F i Radiation is the radiation force, F i Diffraction is the diffraction force, F i Drag is the nonlinear viscous drag force.
The radiation force includes contributions from the added mass and radiation damping, which are proportional to the acceleration and velocity of the floating platform motions, respectively. The radiation force can be given in time domain by
F i Radiation = A x ¨ j ( t ) 0 t h ij ( t τ ) x ˙ j ( t ) d τ ,
where h ij ( τ ) is the retardation function which can be described by
h ij = 2 π 0 B ij ( ω ) cos ( ω t ) d ω ,
in which B ij is the linear radiation damping matrix.
The diffraction force refers to the total excitation loads acting on the floating platform from the incident waves. In considering stochastic sea states defined by an appropriate wave spectrum, the wave elevation ζ ( t ) and diffraction force F i Diffraction can be determined by [26,27]
ζ ( t ) = 1 2 π W ( ω ) 2 π S ζ 2 -sided ( ω ) e j ω t d ω ,
F i Diffraction = 1 2 π W ( ω ) 2 π S ζ 2 -sided ( ω ) X i ( ω , β ) e j ω t d ω ,
where S ζ 2 -sided ( ω ) is the two-sided power spectral density of the wave elevation per unit time, ω is the circular frequency of the wave, W ( ω ) is the Fourier transform of a realization of a white Gaussian noise(WGN) time-series process with zero mean and unit variance, X i ( ω , β ) is the i th component of the frequency- and direction-dependent complex incident-wave-excitation force on the support platform per unit wave amplitude.
The nonlinear viscous drag load [28] can be calculated according to the Morison equation, which is proportional to the square of relative velocity between the fluid and the floating platform and can be expressed by
F i Drag = 1 2 C D ρ w A [ u i ( t ) x ˙ i ( t ) ] | u i ( t ) x ˙ i ( t ) | ,
where u i ( t ) is the wave particle velocity estimated at the instantaneous position of the center of gravity (COG), C D is the viscous drag coefficient in the specific direction with a projection area A .
The hydrostatic force F i Hydrostatic includes the buoyancy force from Archimedes’ principle, and the linear hydrostatic force and moment resulting from the effects of the water-plane area and the center of buoyancy (COB) as the floating platform is displaced, which can be described by [25]
F i Hydrostatic = ρ w g V 0 ν i 3 C ij Hydrostatic x j ( t ) ,
where ρ w is the density of the seawater, V 0 is the displaced volume of fluid when the floating platform is in its undisplaced position, ν i 3 is ( i , 3 ) component of the Kronecker-Delta function, and non-zero only when the degrees of freedom (DOFs) i = 3 , C ij Hydrostatic is the ( i , j ) component of the linear hydrostatic-restoring matrix from the effects of water-plane area and the COB.

2.3. Aerodynamic Loads

The aerodynamic loads on the turbine are calculated based on the blade element momentum (BEM) theory [29], which assumes that the blades can be divided into many small elements, and the forces of each element are superimposed along the span of the blades in order to calculate the total forces and moments exerted on the turbine. According to the blade element theory, the aerodynamic loads on a single blade element can be described by
d T = d L cos φ + d D sin φ = 1 2 ρ a V r e l 2 ( C L cos θ + C D sin θ ) c d r ,
d Q = d L sin φ d D cos φ = 1 2 ρ a V r e l 2 ( C L sin θ C D cos θ ) c d r ,
where d T and d Q is the thrust and moment acting on a single blade element, respectively, C L and C D is the lift and drag coefficients of the airfoil, respectively, ρ a is the air density, c is the chord of the airfoil, V r e l is the relative speed, θ is the inflow angle, and r is the distance of the airfoil section from the blade root.
The aerodynamic effects of the tip losses, the hub losses, and the skewed wake are incorporated. The unsteady aerodynamics is enabled based on the semi-empirical Beddoes–Leishman dynamic stall model [30].

2.4. Mooring Line Tension

The mooring line tension can be calculated using a multi-segmented quasi-static method or dynamic analysis method. The multi-segmented quasi-static method [31] is based on the classic catenary theory, which allows the evaluation of the mooring system by considering the average mooring line loads, the seabed friction of each mooring line, and the nonlinear geometric restoring forces for the catenaries and taut mooring systems. However, the individual line bending stiffness, the inertia and the hydrodynamic damping forces of the mooring lines are neglected. As shown in Figure 1, a single mooring line with undercover length in a local coordinate system is demonstrated. Then the Newton–Raphson iteration scheme is used to solve the mooring line tension in which the force analysis formulation of the mooring line is given by [25]
X F ( H F , V F ) = L V F ω M + H F ω M ln [ V F H F + 1 + ( V F H F ) 2 ] + H F L E A + C B ω M 2 E A [ ( L V F ω M ) 2 + ( L V F ω M H F C B ω M ) M A X ( L V F ω M H F C B ω M , 0 ) ]
Z F ( H F , V F ) = H F ω M [ 1 + ( V F H F ) 2 1 + ( V F ω M L H F ) 2 ] + 1 E A ( V F L ω M L 2 2 ) ,
where H F and V F are the horizontal and vertical components of the effective tension in the mooring line at the fairlead, respectively, H A and V A are the horizontal and vertical components of the effective tension in the mooring line at the anchor, respectively, x ( s ) and z ( s ) are the horizontal and vertical coordinates of the reference points of the mooring line, respectively, ω M is the apparent weight of a line in fluid per unit length of line, L is the total unstretched length of a mooring line, A is the cross-sectional area of the mooring line, C B is the coefficient of the static-friction drag between the seabed and a mooring line, and E A is the extensional stiffness of a mooring line.
The dynamic analysis of the mooring line that captures mooring stiffness and damping forces in the axial direction, weight, and buoyancy effects, seabed contact force (without friction), and hydrodynamic loads from the mooring motion using the Morison equation. In this paper, the dynamic analysis of the mooring line is based on a lumped-mass modeling approach [32,33] to discretize the cable dynamics over the length of the mooring line. As shown in Figure 2, the mooring line is broken up into N evenly-sized line segments connecting N + 1 node points. The indexing starts at the anchor (or lower end), with the anchor node given a value of zero, and the mooring line segment between nodes 0 and 1 given an index of 1 / 2 . The right-handed inertial reference frame with the z-axis being measured positive up from the water-plane is defined in this model, and each node’s position is defined by a vector r , which contains the x , y , and z coordinates of the node position. Each segment i + 1 / 2 of a mooring line has identical properties of unstretched length, diameter, density, and Young’s modulus. This allows mooring lines with different sets of properties and supports features such as point masses and line interconnections. The detailed calculation of the dynamic analysis model of the mooring line can refer to [34].
In this paper, the dynamic analysis method of the mooring line tension is used in the fully coupled analysis of the 5 MW and 10 MW FOWT. The multi-segmented quasi-static method is only used when analyzing the dynamic effects of the mooring line (including hydrodynamic damping and inertia forces of the mooring lines) on the motion responses of the 10 MW FOWT.

3. Baseline Model Description and Numerical Tool

3.1. Design of the FOWT

Taking DTU 10 MW wind turbine as the research object, the specifications of the DTU 10 MW wind turbine is as shown in Table 1. However, owing to the platform height above still water level (SWL), the tower of the DTU 10 MW wind turbine was shortened by 12.3 m. The overall properties of the new tower are listed in Table 2.
The braceless semi-submersible platform can offer the advantage of reducing the number of welding connections, improving the floater reliability as it is less sensitive to fatigue and corrosion hot-spot, and also simplifies the fabrication process [35]. Therefore, referring to the size of the NTNU (Norwegian University of Science and Technology)braceless semi-submersible platform [23] for the NREL 5 MW wind turbine, a scaled-up model of the braceless semi-submersible platform to hold the DTU 10 MW wind turbine was completed based on the Froude scaling rather than redesigning the floating platform completely to improve the efficiency of the design process [36]. The main properties of the platform are given in Table 3 and the side and top views of the braceless semi-submersible platform are demonstrated in Figure 3. The mooring system is arranged as shown in Figure 4, and properties of the mooring system are shown in Table 4. In addition, the layout of the FOWT is presented in Figure 5.

3.2. Introduction of Numerical Tool

Using FAST, fully coupled aero-hydro-servo-elastic time domain simulations for the ultra-large FOWT can be conducted. The modules used in FAST are shown in Figure 6. The aerodynamic loads of the DTU 10 MW wind turbine were calculated by AeroDyn v14 [29], while the influence of the tower on the local airflow was not considered. Based on a combination of the linear potential flow theory and Morison equation, HydroDyn was used to calculate the hydrodynamic loads. According to a linearized model proposed by Frank Lemmer [37], a single-input-single-output (SISO) Proportional-Integral (PI) controller was chosen for the ServoDyn. The modules of MAP++ for the quasi-static method [38] and the modules of MoorDyn [39] for the dynamic method were respectively utilized to calculate the mooring line tensions. The structural dynamic response of the integrated FOWT, including the rotor, drivetrain, nacelle, tower, and platform were simulated in ElastoDyn.
During the analysis, two additional modules were introduced. One is ANSYS-AQWA [40], which was used to calculate the hydrodynamic coefficients of the braceless semi-submersible platform in the frequency domain, including the added mass, potential damping, and first-order wave exciting forces. The panel mesh model of the braceless semi-submersible platform below the SWL is shown in Figure 7. The results of hydrodynamic coefficients were converted to the WAMIT [41] format to perform fully coupled time-domain simulations in FAST. The other is TurbSim [42], which was used to generate the 3D turbulent wind velocity fields which were input into AeroDyn.
At each time step, the dynamic equilibrium equations of the rotor, drivetrain, nacelle, platform, and mooring system, with the rotor’s rotational speed and blade pitch angle regulated by the ServoDyn, were solved in Elastodyn and Map++/MoorDyn. Then, the platform motions were transferred to HydroDyn to update the hydrodynamic loads. Meanwhile, the displacements, velocities, and accelerations of the blade and tower elements were transferred to the AeroDyn to update the aerodynamic loads. The updated loads will be applied to the dynamic equilibrium equations at the next time step [3].

4. Simulation Results and Discussion

4.1. Free Decay Test

Free decay simulation tests were conducted in FAST by applying a specific initial tower and platform displacement without the existence of wind, wave, or current. Time histories of decay tests were recorded, such as those shown in Figure 8 for the surge decay histories of the 5 and 10 MW FOWTs. Based on the Fourier transforms of the numerical time histories, the natural frequencies of the 5 and 10 MW FOWTs are obtained, as listed in Table 5. It can be observed that the rotor frequency (1P) is much larger than the natural frequencies of the platform and much smaller than the natural frequencies of tower, and the blade passing frequency (3P) is larger than the natural frequencies of the tower. Therefore, resonance will not occur during the operation of the FOWTs.

4.2. Dynamic Response of the FOWT

4.2.1. Environmental Conditions

A series of representative load cases (LCs) were selected to investigate the dynamic characteristics of the ultra-large semi-submersible FOWT, the dynamic effects of mooring lines and the difference in dynamic characteristics of 5 and 10 MW FOWTs, as shown in Table 6. In the LC4 and LC7 cases, a turbulent wind field over a 200 × 200 m vertical plane centered on the rotor was generated in TurbSim using IEC Kaimal spectra based on NTM (normal turbulence model) conditions and turbulence category A. However, steady wind was selected for other load cases. The JONSWAP spectrum was used to generate the irregular wave time series. As can be observed in Figure 4, the wind and waves were correlated and directionally aligned in the positive X-direction.

4.2.2. Statistics of Motion Simulation Results for the 10 MW FOWT

Based on the environmental conditions in Table 6, the fully coupled time domain simulation of the 10 MW FOWT was conducted in different cases. Each simulation lasted 4200 s and corresponded to an hour dynamic analyses because the first 600 s were filtered to eliminate the startup transient effects. This study only compared and analyzed the surge, heave, and pitch motion responses, which were critical for the braceless semi-submersible FOWT. Table 7 summarizes the statistical values of the platform motion responses. First, the steady-state responses of the integrated 10 MW turbine-platform-mooring system in all the simulations are found to be in a reasonable range, such as the mean pitch angle is significantly less than the design value of 10° [43]. Therefore, the initial design of the braceless semi-submersible platform for the DTU 10 MW wind turbine by upscaling of the existing 5 MW platform design is feasible. This provides a reference for the design of support platform of the ultra-large wind turbines. However, more detailed adjustment of size and layout, strength checks for fatigue and ultimate limit states, hydrodynamic performance and economic analysis of the braceless semi-submersible platform need to be further implemented to hold the ultra-large wind turbines.
Additionally, the load effects of wind and wave were analyzed in detail by comparing the statistical values of the system motions of the 10 MW FOWT subjected to the single wind loads, the single wave loads, and the joint action of the wind-wave induced loads. The wind loads determine the mean value of the system motions of the 10 MW FOWT. The standard deviation of the system motions of the 10 MW FOWT are governed by the wave loads, which increase significantly when the wave height increases. The extreme value of the system motions and the amplitude of its change increased significantly in turbulent wind cases. At the rated wind speed case, platform responses are characterized by the large mean value of surge and pitch motions owing to the maximum aerodynamic loads. However, the mean value of the heave motion is slightly increased. This can be attributed to the 5° angle between the rotation shaft of the rotor of the DTU 10 MW wind turbine and the horizontal plane. Additionally, the low-frequency aerodynamic force in the rotor is a downward force in the vertical direction and affected the mean value of the heave motion.

4.2.3. Comparative Analysis of the Motion Responses for the 10 MW FOWT

Analysis of Wind and Wave Load Effects of the 10 MW FOWT

The time histories of the system motions for different combinations of loads are illustrated in Figure 9. In the single wind loads case (LC1), the surge motion is balanced at 7.75 m along the surge direction after the integrated system of the FOWT reached the quasi-equilibrium state. In the single wave loads case (LC2), the integrated system slightly vibrates at the initial position of the surge motion. Under the joint action of the wind-wave induced loads (LC3), the integrated system vibrates around an offset value of 7.76 m. Therefore, the wind loads determine the mean value of the surge motion, and the wave loads mainly cause the oscillation of the surge motion, which determines the amplitude of the system’s surge motion. Similarly, the same trend is observed in heave and pitch motions.
In Figure 9, the power spectra of surge, heave and pitch motions are compared in two cases: (a) with wave loads only, and (b) with joint wind-wave induced loads to observe and compare the load effects of the wind and wave. Accordingly, the resonant response could occur if the excitation frequencies are close to the natural frequencies of the system motions. Under the joint action of the wind-wave induced loads, it can be found from Figure 9 that there is a large resonance response at the surge natural frequency of 0.082 rad/s, the heave natural frequency of 0.226 rad/s and the pitch natural frequency of 0.245 rad/s. In the single wind loads case, the surge, heave, and pitch motions are mainly dominated by the wave frequency response and the wave frequency response for the wave only case is significantly higher than those values for the wind-wave induced loads case, which is caused by the positive aerodynamic damping induced by the wind loads. Furthermore, it can be observed that the natural frequencies of the system motions differ considerably from the wave peak spectral frequency so that the response energies excited by the wind-wave induced loads do not coincide in the frequency range. This indicates that the wind and wave loads affect the system motions of the FOWT separately in a decoupled way.

Comparison of Motion Responses of 10 MW FOWT for the Rated and Over-Rated Wind Speeds

The power spectra of the system motions of FOWT in the over-rated wind speed case (LC5) and in the rated wind speed case (LC3) are compared in Figure 10. It can be observed that the surge and pitch resonant responses are significantly increased in LC5 with the blade-pitch controller, while the heave resonant response and the wave-frequency response of the system motions of FOWT have hardly changed. This resonant phenomenon is caused by negative damping from the blade-pitch controller in the over-rated wind speed range, according to [44,45].

Comparison of Motion Responses of the 10 MW FOWT for the Steady and Turbulent Wind

The time histories of surge motion under the steady and turbulent wind cases are compared in Figure 11a,c. The system motions are highly oscillating in time owing to the turbulent effects, which is consistent with the statistical results in Table 7. The maximum and standard deviation of the system motions increased significantly. This is owing to the turbulent wind which acted on the rotor with a time-varying longitudinal force and moments.
The power spectra of surge motion between the turbulent and steady wind cases are compared in Figure 11b,d. In the rated wind-speed case, Figure 11b shows that the turbulent wind loads excite the natural frequencies of the rigid body’s surge and pitch motions, and the surge motion of the 10 MW FOWT is mainly dominated by the low-frequency surge and pitch resonant responses. This can be clearly explained as the turbulent wind has energy in the low-frequency region. However, there is no obvious difference in the wave frequency response of the surge motion between the turbulent and steady wind cases. Furthermore, the surge motion is also governed by the low-frequency component above the rated wind speed case of the turbulent wind as indicated in Figure 11d. However, the amplitude of the low-frequency resonant responses is reduced compared to those of the rated wind speed case.

4.3. Dynamic Analysis of Mooring Lines for the 10 MW FOWT

4.3.1. Dynamic Analysis of Mooring Lines Based on the Dynamic Analysis Modeling

The dynamic analysis of the mooring line of the 10 MW FOWT based on a lumped-mass method is carried out by using the FAST-MoorDyn module in the rated wind speed case (LC3). As shown in Figure 12a, there is a significant difference between the tension responses of the downstream and upstream mooring lines. This is observed since the Mooring line 1 (ML1) is the only mooring line acting downstream. Consequently, the tension and fluctuating components of ML1 attained smaller values than those of the Mooring line 2 (ML2) and the Mooring line 3 (ML3).
Figure 12b illustrates the power spectra of mooring line tension response in the LC3 case. The mooring system of the FOWT is mainly induced by the low-frequency, wave-frequency and high-frequency components in the marine environment. The low-frequency components are related to slowly-varying platform motions primarily induced by low-frequency wind loads, such as surge, yaw and pitch. At the same time, an obvious peak occurs at the surge natural frequency of 0.082 rad/s and the pitch natural frequency of 0.245 rad/s, respectively. This indicates that there is a coupling effect between the platform motions and the mooring line tension response. The wave-frequency component is mainly caused by the action of the wave loads, and an obvious peak around the wave peak spectral frequency of 0.616 rad/s exists. The high-frequency components are mainly induced by the elastic response of the tower, which is excited by the harmonics of the wave loads [46].

4.3.2. Analysis of Dynamic Effects of Mooring Lines Based on Quasi-Static and Dynamic Models

In the process of the fully coupled analysis of the 10 MW FOWT, the mooring system was simulated using the dynamic mooring module (MoorDyn) and the multi-segmented quasi-static mooring module (MAP++) to study the dynamic effects of the mooring lines. The statistical results of the system motions and tension responses for the LC3 case are listed in Table 8. It can be clearly observed that the dynamic effects of the mooring lines do not significantly affect the mean values of motions, or the tension responses of the 10 MW FOWT. However, the system motions and the mooring line tension responses based on the dynamic (MoorDyn) mooring model yield larger standard deviations than those elicited by the quasi-static (MAP++) model owing to dynamic amplification effects.
The power spectra of platform motion responses based on the dynamic (MoorDyn) and quasi-static (MAP++) mooring models were compared, as shown in Figure 13. The peak values of low-frequency resonant responses based on the quasi-static mooring model is significantly higher than that of dynamic mooring model, especially for the surge and heave motions. However, there is no significant change in the wave-frequency responses. Therefore, the dynamic effects of the mooring lines significantly affects the low-frequency resonant responses of the platform motions, while the quasi-static mooring model ignoring the dynamic effects of the mooring lines significantly overestimates the amplitude of the low-frequency resonant responses.
Since the dynamic effects of the mooring lines have significant influences on the standard deviation of the mooring line tension responses and the resonant response of the platform motions, the dynamic effects of the mooring lines must be fully taken into account in the design of the mooring system of the ultra-large FOWT so as to accurately check the fatigue and ultimate limit states of the mooring lines, and to optimize the mooring system.

5. Comparison and Analysis of the Dynamic Characteristics of the 10 MW and 5 MW FOWT

The design data of a 5 MW braceless semi-submersible FOWT was listed in detail in [23], and the same mooring system was used to investigate the difference in dynamic characteristics of the NREL 5 MW and DTU 10 MW FOWT under the joint action of wind-wave induced loads (LC3 and LC6) due to the different in turbine properties. Then, a comparative analysis associated with the dynamic characteristics of the 5 MW and 10 MW FOWT was conducted by FAST, including the main natural frequencies, motion responses and structural dynamics.

5.1. Comparison of Natural Frequencies for the 5 and 10 MW FOWT

Free decay motion simulations were first conducted to study the resonant properties of the coupled system of the FOWTs. Therefore, time histories of the surge decay test and main natural frequencies of the coupled system of the 5 and 10 MW FOWTs were compared, as shown in Figure 8 and Table 5. The surge motion of the 5 MW FOWT decays faster than that of the 10 MW FOWT, but the natural frequencies of the six DOFs of the rigid body motions of the 5 and 10 MW support platforms are nearly the same. Furthermore, the first-order natural frequency of the tower of the NREL 5 MW and DTU 10 MW FOWTs are significantly different.

5.2. Comparison of Motion Responses for the 5 and 10 MW FOWT

The simulation results of the platform motions of the 5 MW FOWT are listed in Table 9, which are compared with those of the 10 MW FOWT in the LC3 and LC6 cases (Table 7). The fluctuation of the motion responses of the 5 MW FOWT is very obvious for the rated and over-rated wind speed cases, but the mean value of the surge motion of the 10 MW FOWT is 29.1% and 19.3% higher than that of the 5 MW FOWT, respectively, which indicates that the 10 MW FOWT needs the mooring system to provide a larger surge restoring force to reduce the mean value of the surge motion. In addition, the 10 MW FOWT can offer large restoring forces and moments for the heave and pitch motions owing to its large structural weight and buoyancy, but it also suffers from the greater wind and wave loads. Accordingly, the mean values of the heave and pitch motions of the 10 MW FOWT are significantly higher than those of the 5 MW FOWT for the rated and over-rated speed cases.
Figure 14 shows a comparison of the power spectra of surge and pitch motion responses for the NREL 5 MW and DTU 10 MW FOWTs in the LC3 and LC6 cases. The amplitude of the surge and pitch resonant response of the 10 MW FOWT excited by the low-frequency wind loads is higher than that of the 5 MW FOWT for the LC3 and LC6 cases, but the wave-frequency response of the surge and pitch motion excited by the wave loads is obviously smaller. Therefore, it can be predicted that the excitation of the low-frequency wind loads on the motion responses of the FOWTs becomes more prominent from the relative proportions of low-frequency and wave-frequency kinetic energy of the 5 and 10 MW FOWTs when the size of the wind turbine increases.

5.3. Comparison of Structural Dynamics for the 5 and 10 MW FOWT

As shown in Table 10, a comparison of the structural dynamics of the DTU 10 MW and NREL 5 MW FOWT in the LC3 and LC6 cases was conducted for the out-of-plane blade-root bending moments (RootMyc1), the rotor thrust, the fore-aft force and bending moments in the tower base (TwrBsFxt and TwrBsMyt) and the ML1 tension. Structural loads diagram of the FOWT system is presented in Figure 15. The mean and maximum values of the structural loads of the 10 MW FOWT are more than two times than those of the 5 MW FOWT for the LC3 and LC6 cases. In addition, the fluctuation of the structure loads of the 10 MW FOWT is very significant, especially for the LC6 case with a relatively high significant wave height. This provides a future reference for the design, application, and the reliability analysis for the ultra-large FOWT.
Figure 16 depicts a comparison of the power spectra of RootMyc1 response for NREL 5 MW and DTU 10 MW FOWTs in the LC3 and LC6 cases. It is readily apparent that the RootMyc1 response of the 5 and 10 MW FOWTs are mainly stimulated by the 1P effect for the LC3 and LC6 cases, and the stimulating of the 1P effect on the RootMyc1 response of the 10 MW FOWT is more obvious than that of the 5 MW FOWT for the rate wind speed case. However, the excitation of the 1P effects on the RootMyc1 response of 10 MW FOWT above the rated wind speed case is diminished. In addition, the excitation of the wave loads on the RootMyc1 response of the 10 MW FOWT is prominent for the LC3 and LC6 cases, but the excitation of the 3P effect on the RootMyc1 response of the 5 MW FOWT is significant.
Power spectrum analyses of the TwrBsMyt response for NREL 5 MW and DTU 10 MW FOWTs were also performed in the LC3 and LC6 cases, as depicted in Figure 17. It demonstrates that the TwrBsMyt responses of the 5 and 10 MW FOWTs are mainly dominated by the wave loads for the LC3 and LC6 cases, and the amplitude of the TwrBsMyt responses of the 10 MW FOWT excited by the wave loads is significantly higher than those of the 5 MW FOWT. Furthermore, the excitation of the 3P effect on the TwrBsMyt response of the 5 MW FOWT is very prominent. However, the excitation of the low-frequency wind loads and the tower elastic response on the TwrBsMyt response of the 10 MW FOWT is significant, especially for the over-rated speed case.
As shown in Figure 18, the downstream mooring line (ML1) was selected as the research object and the comparison of the power spectra of ML1 tension response for NREL 5 MW and DTU 10 MW FOWTs is demonstrated in the LC3 and LC6 cases. The most significant difference of ML1 tension response is in the low-frequency and wave-frequency components. As the low-frequency resonant response of the 10 MW FOWT induced by the wind loads is more significant, this results in a significantly higher low-frequency component of the ML1 tension response for the 10 MW FOWT than that of the 5 MW FOWT. By contrast, the excitation effect of the wave loads on the ML1 tension response for the 5 MW FOWT is more significant, especially for the over-rated speed case with a relatively high significant wave height. In addition, the 3P effect has a significant impact on the ML1 tension response of the 5 MW FOWT, but the elastic response of the tower has a more obvious stimulation effect on the ML1 tension response of the 10 MW FOWT.

6. Conclusions

In this study, an initial design was performed by upscaling of an existing 5 MW braceless semi-submersible platform design to support the DTU 10 MW wind turbines and the fully coupled time domain simulation was conducted to investigate the dynamic characteristics of an ultra-large semi-submersible FOWT under typical sea states. The influence of the dynamic effects of the mooring line on the motions of the integrated motion responses of the FOWT was highlighted. Meanwhile, the motion responses and structural dynamics of the DTU 10 MW and NREL 5 MW braceless semi-submersible FOWTs were compared and studied. The conclusions drawn from the study can be summarized as follows:
(1)
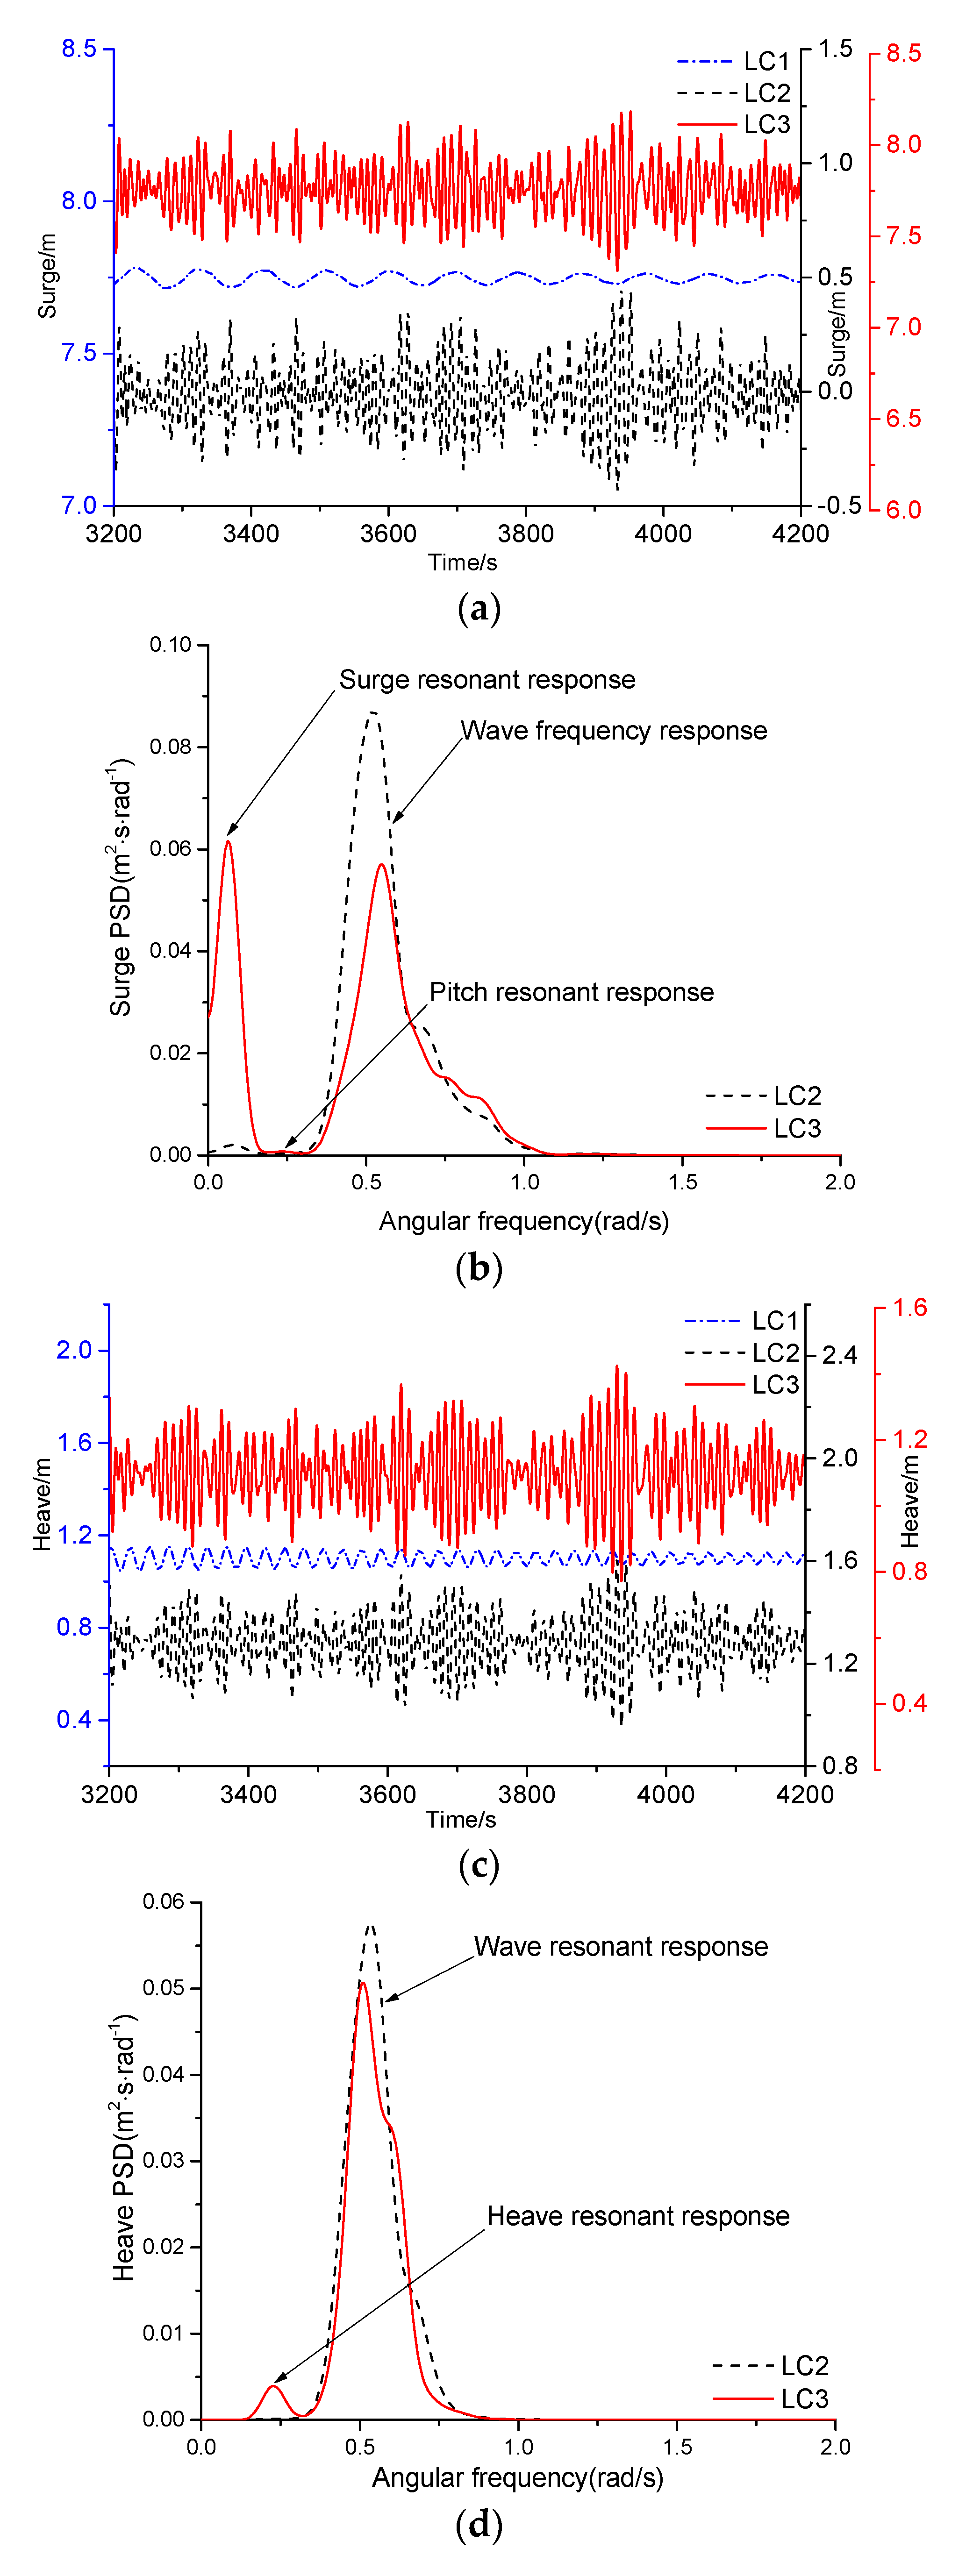
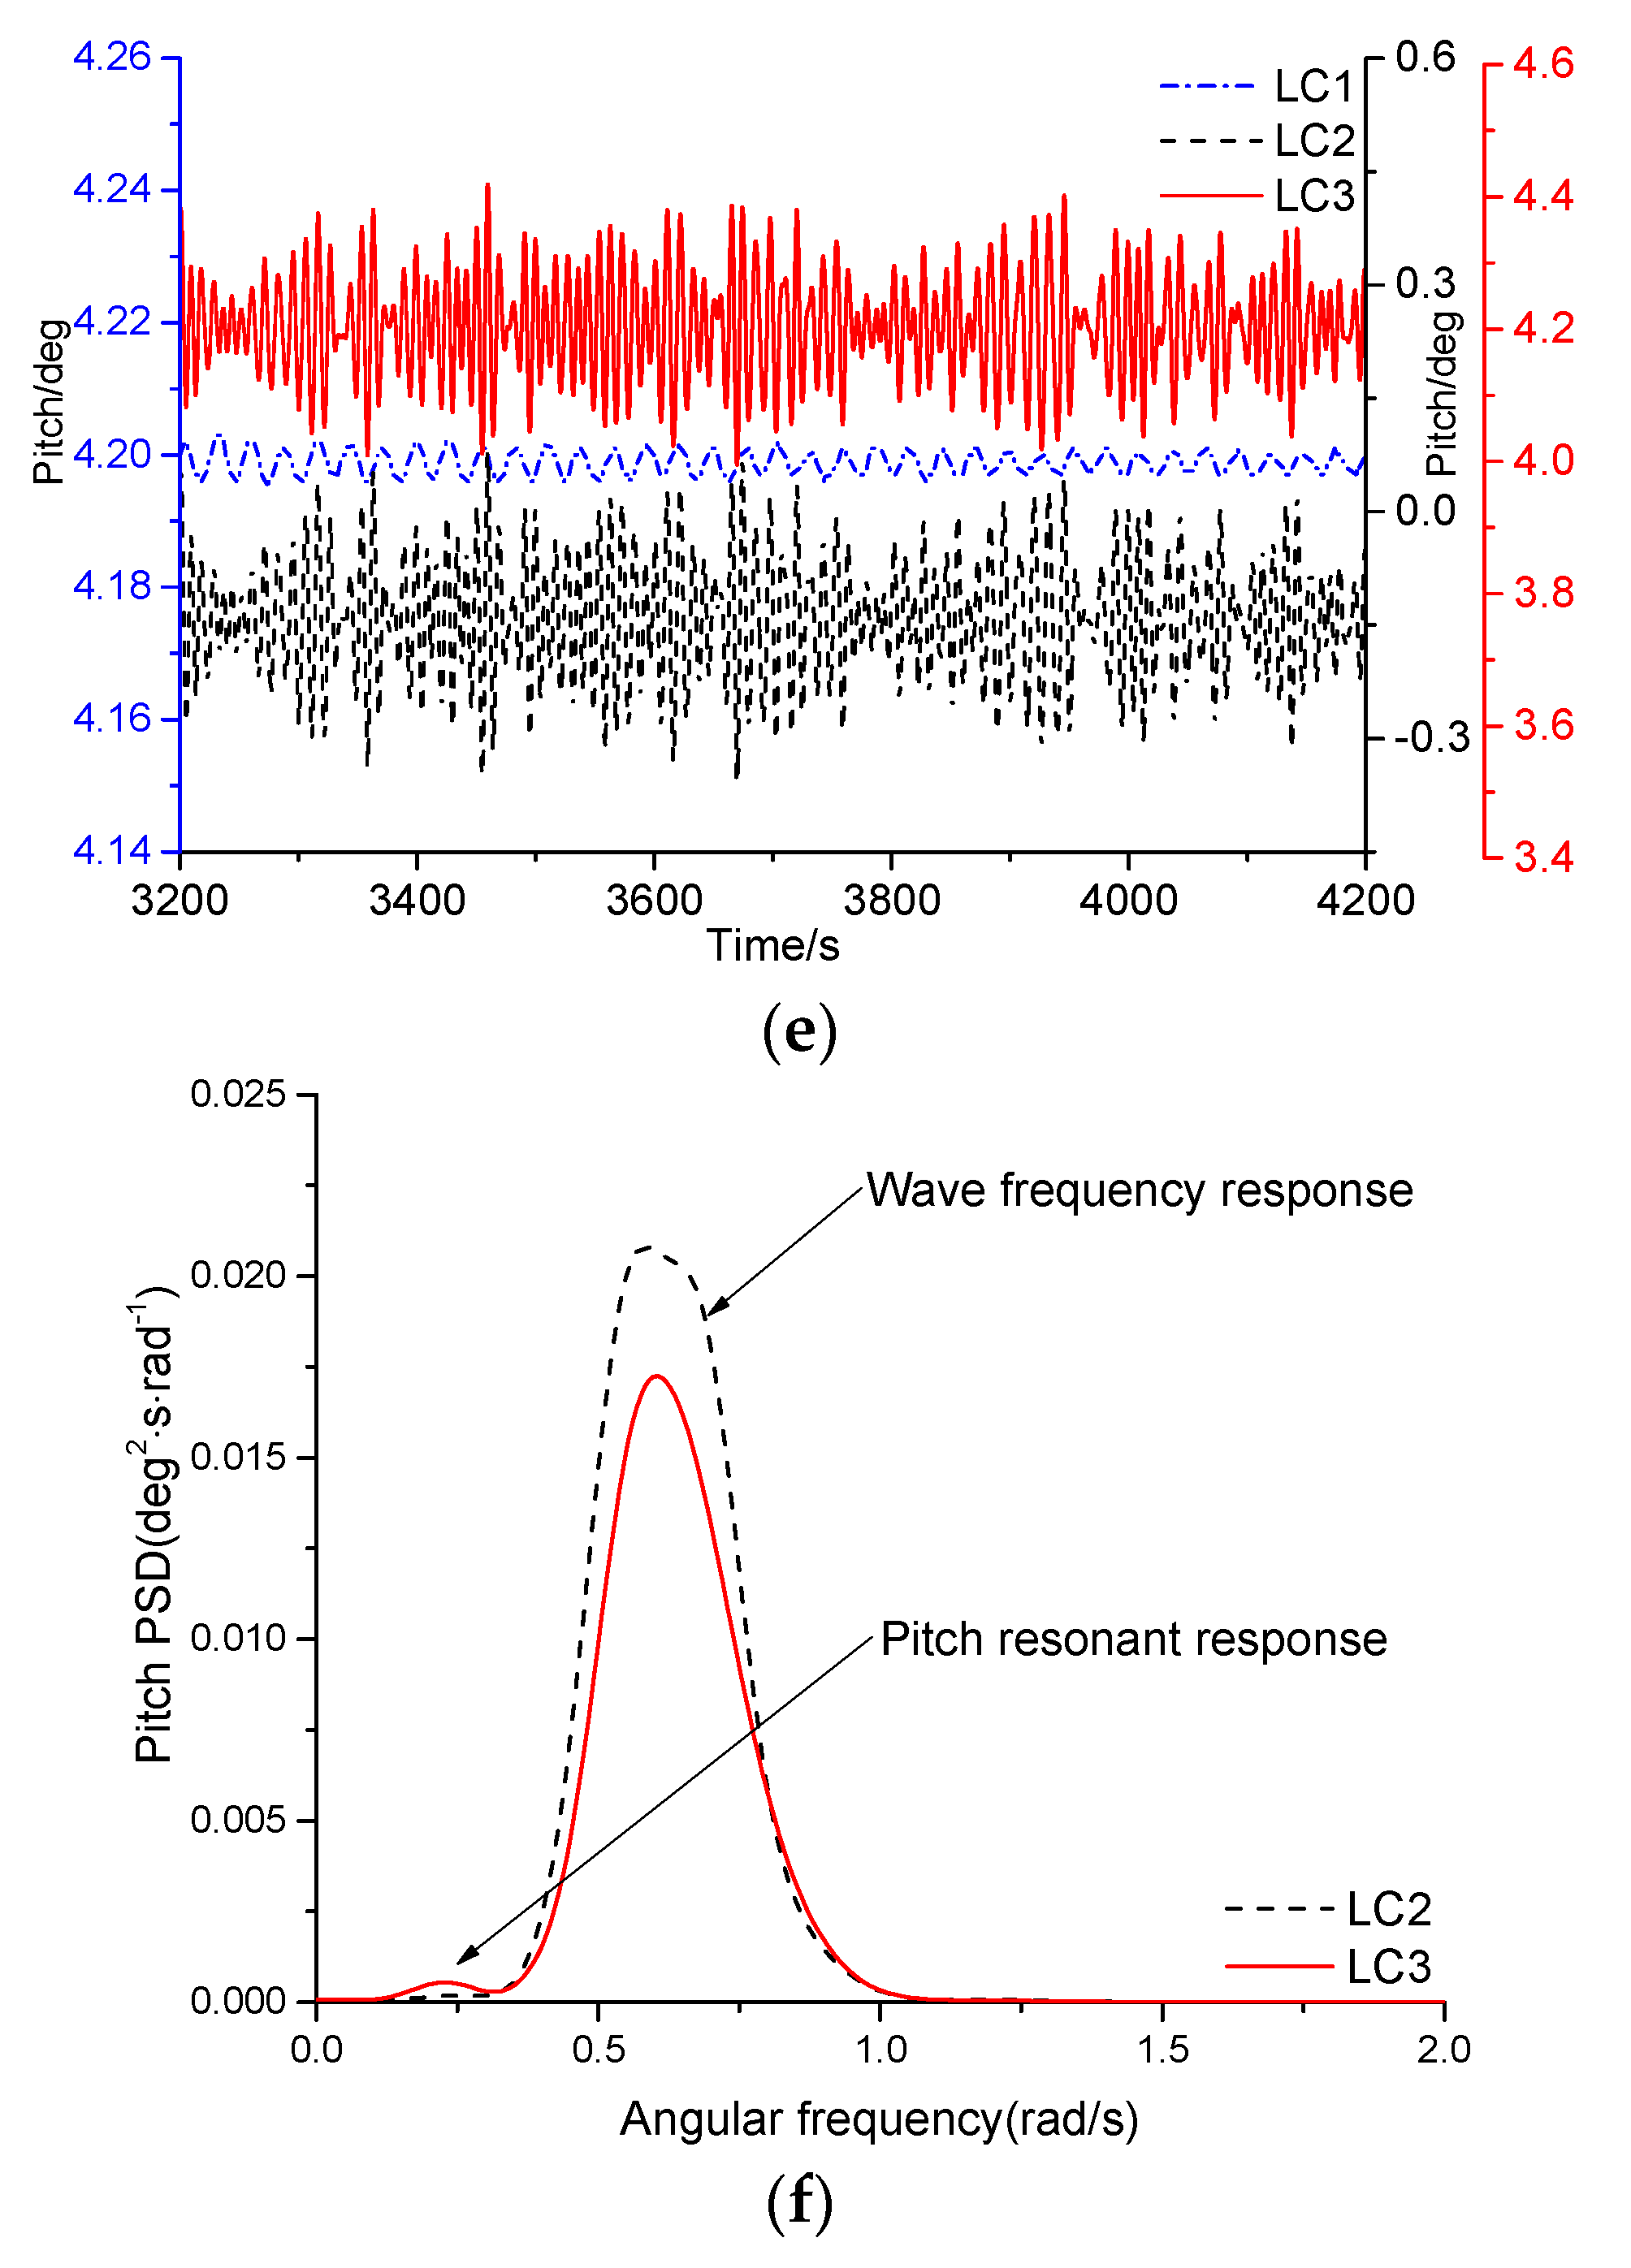
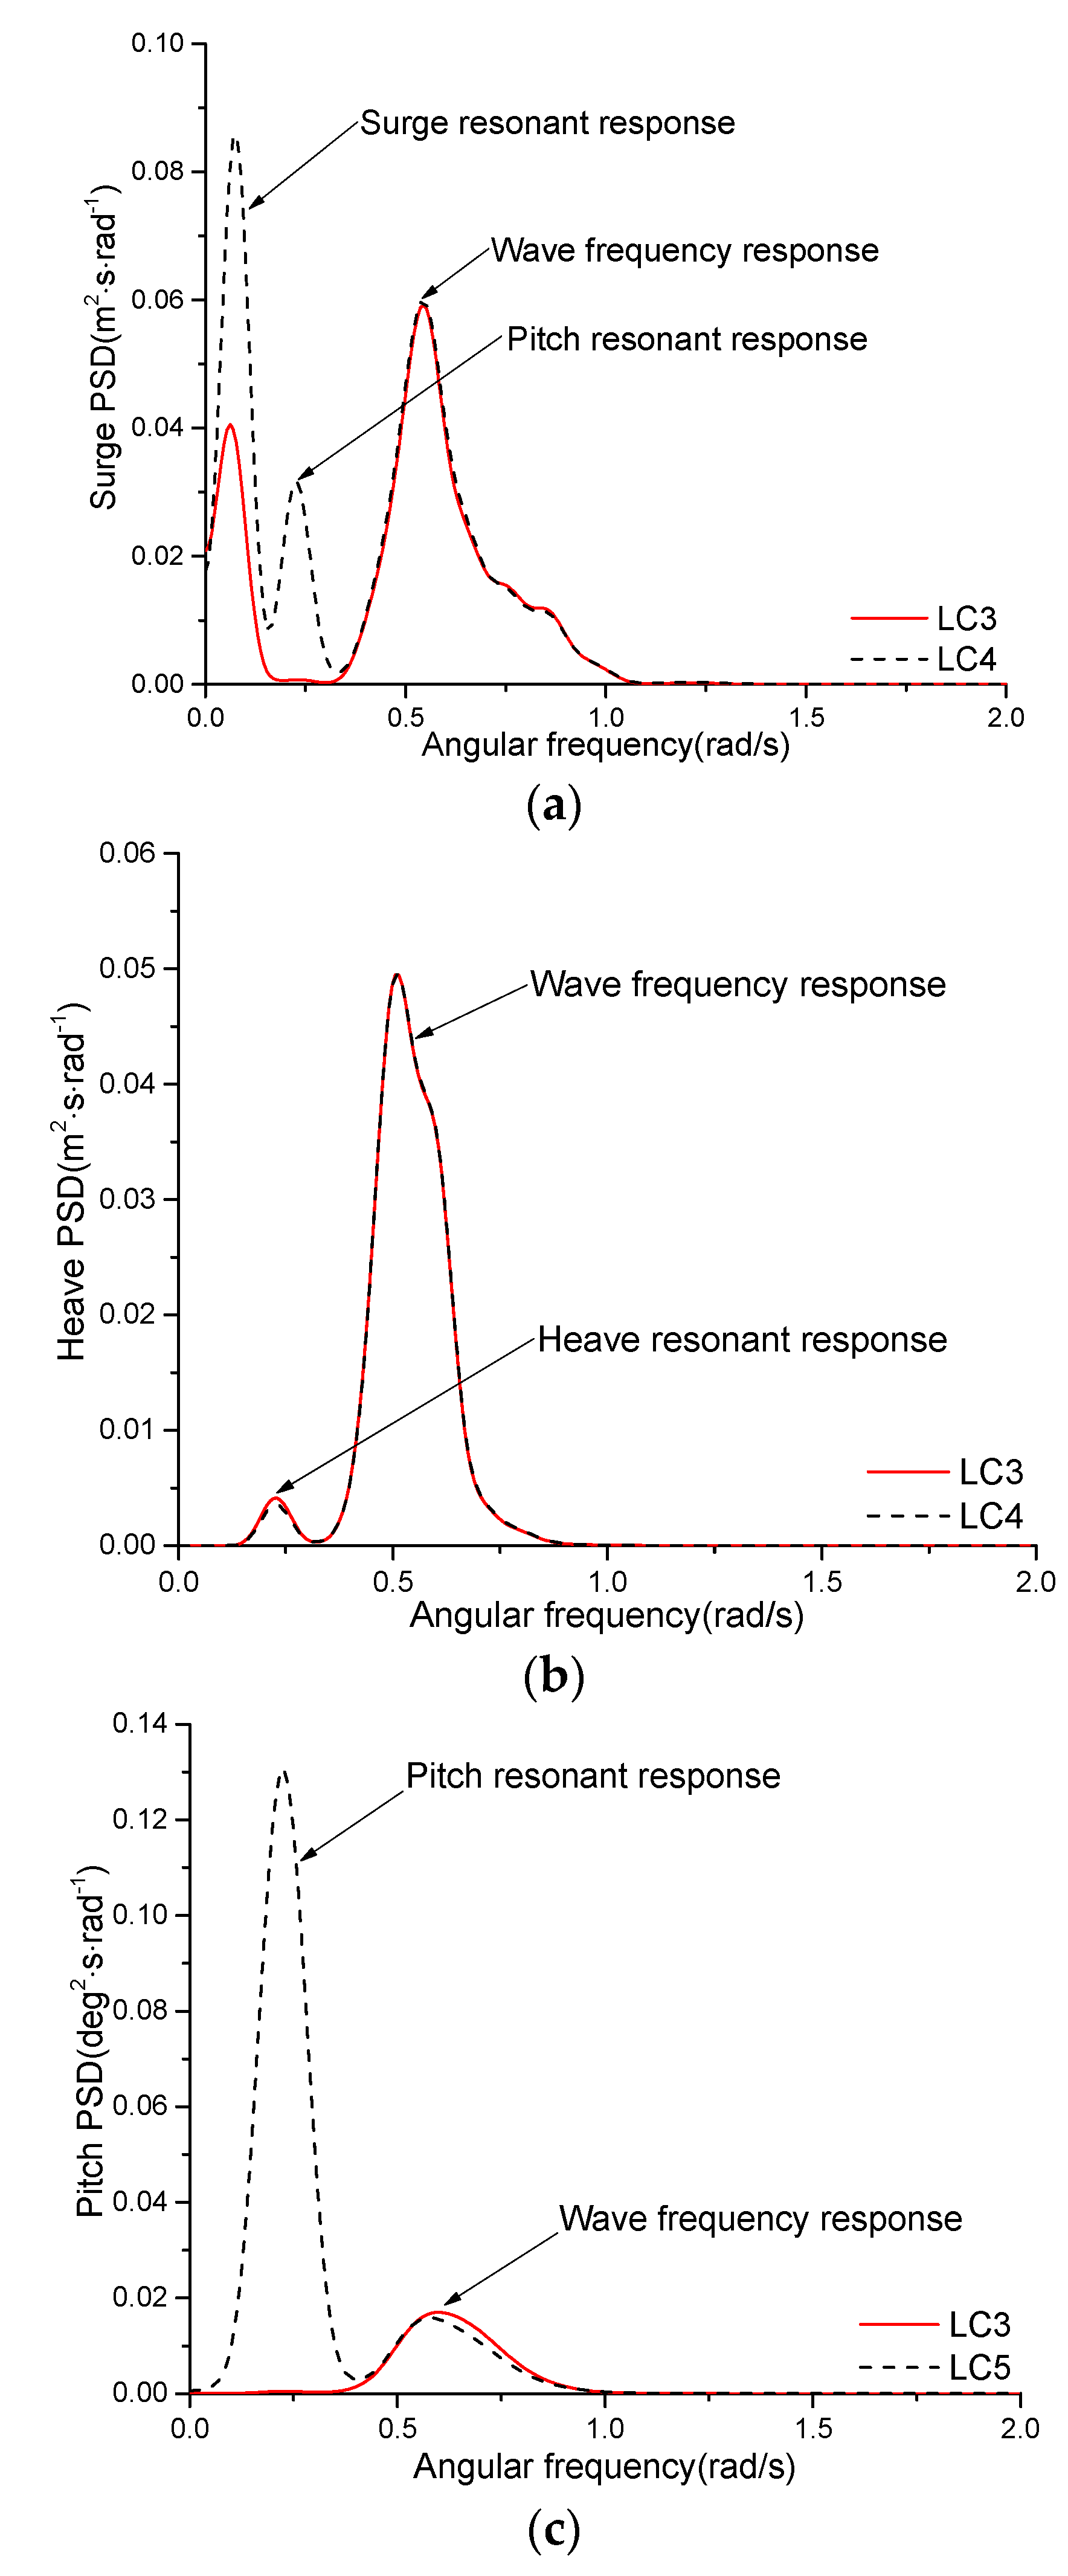
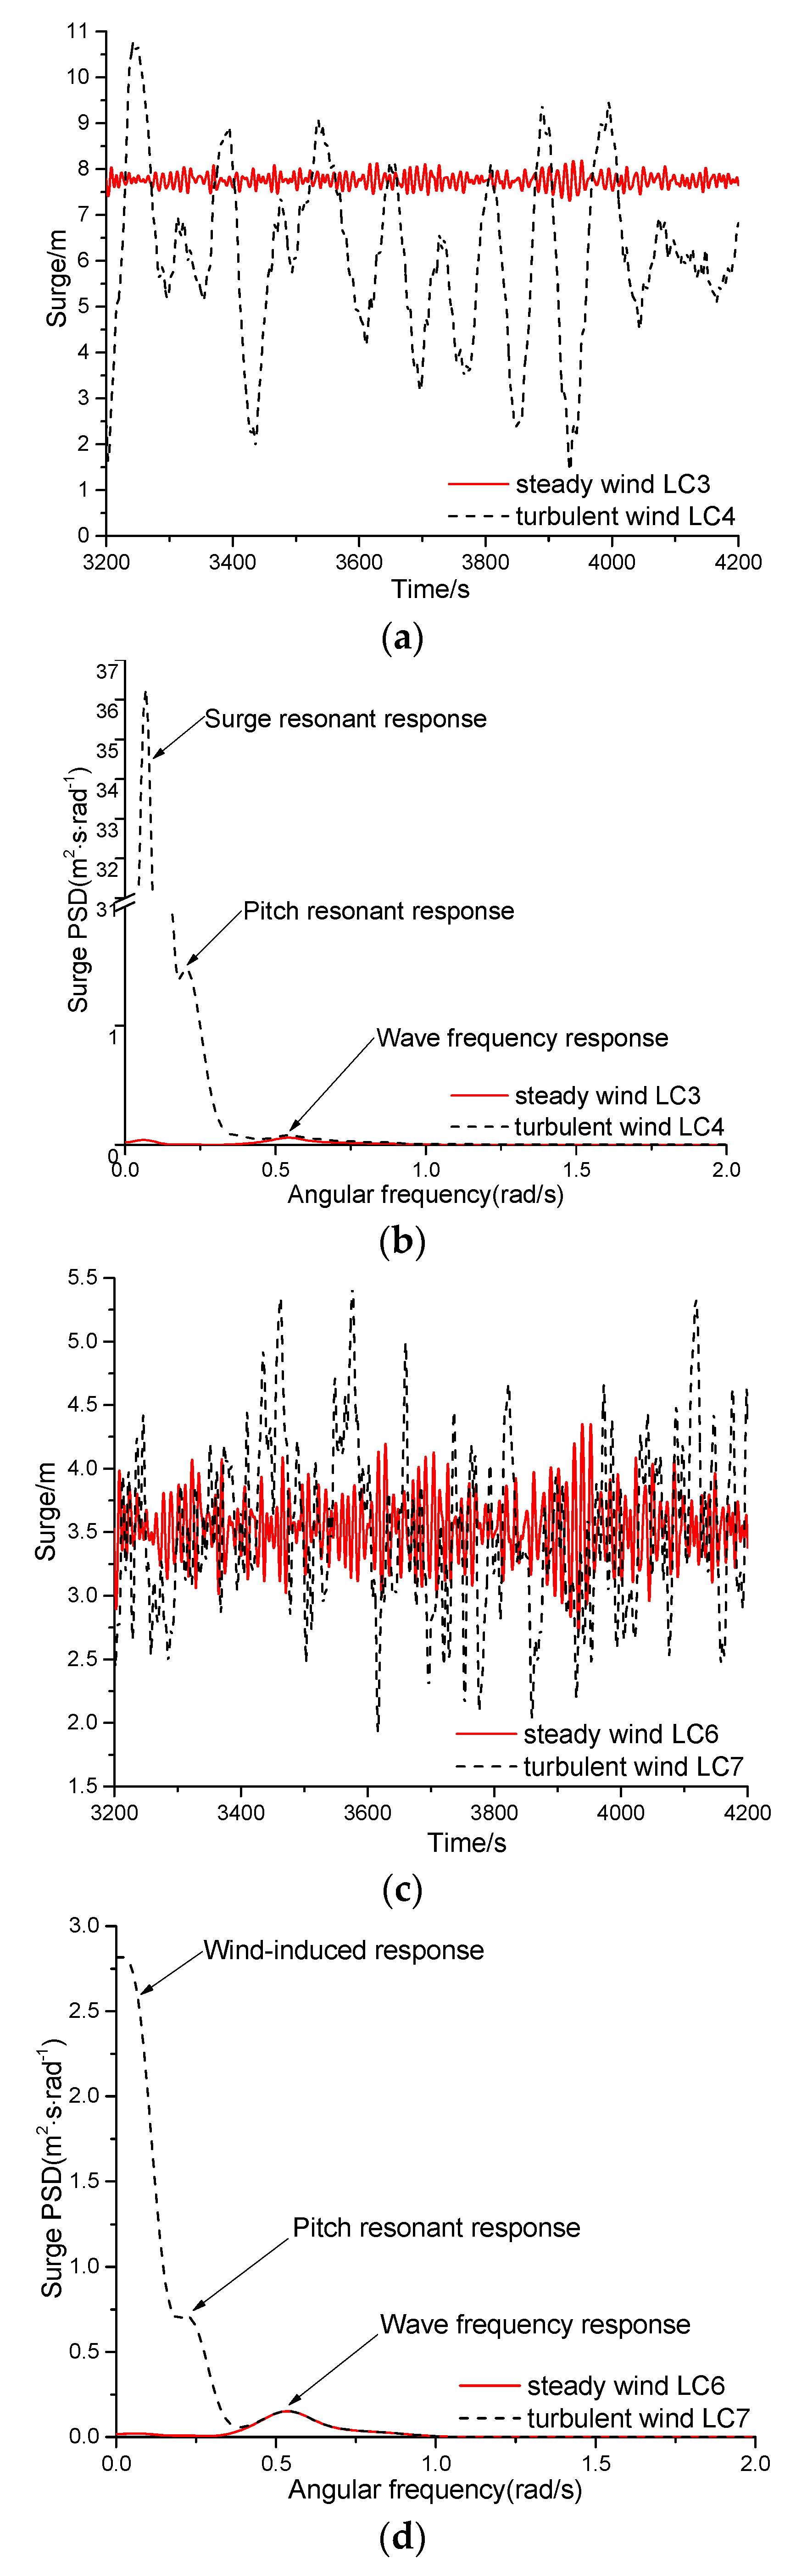
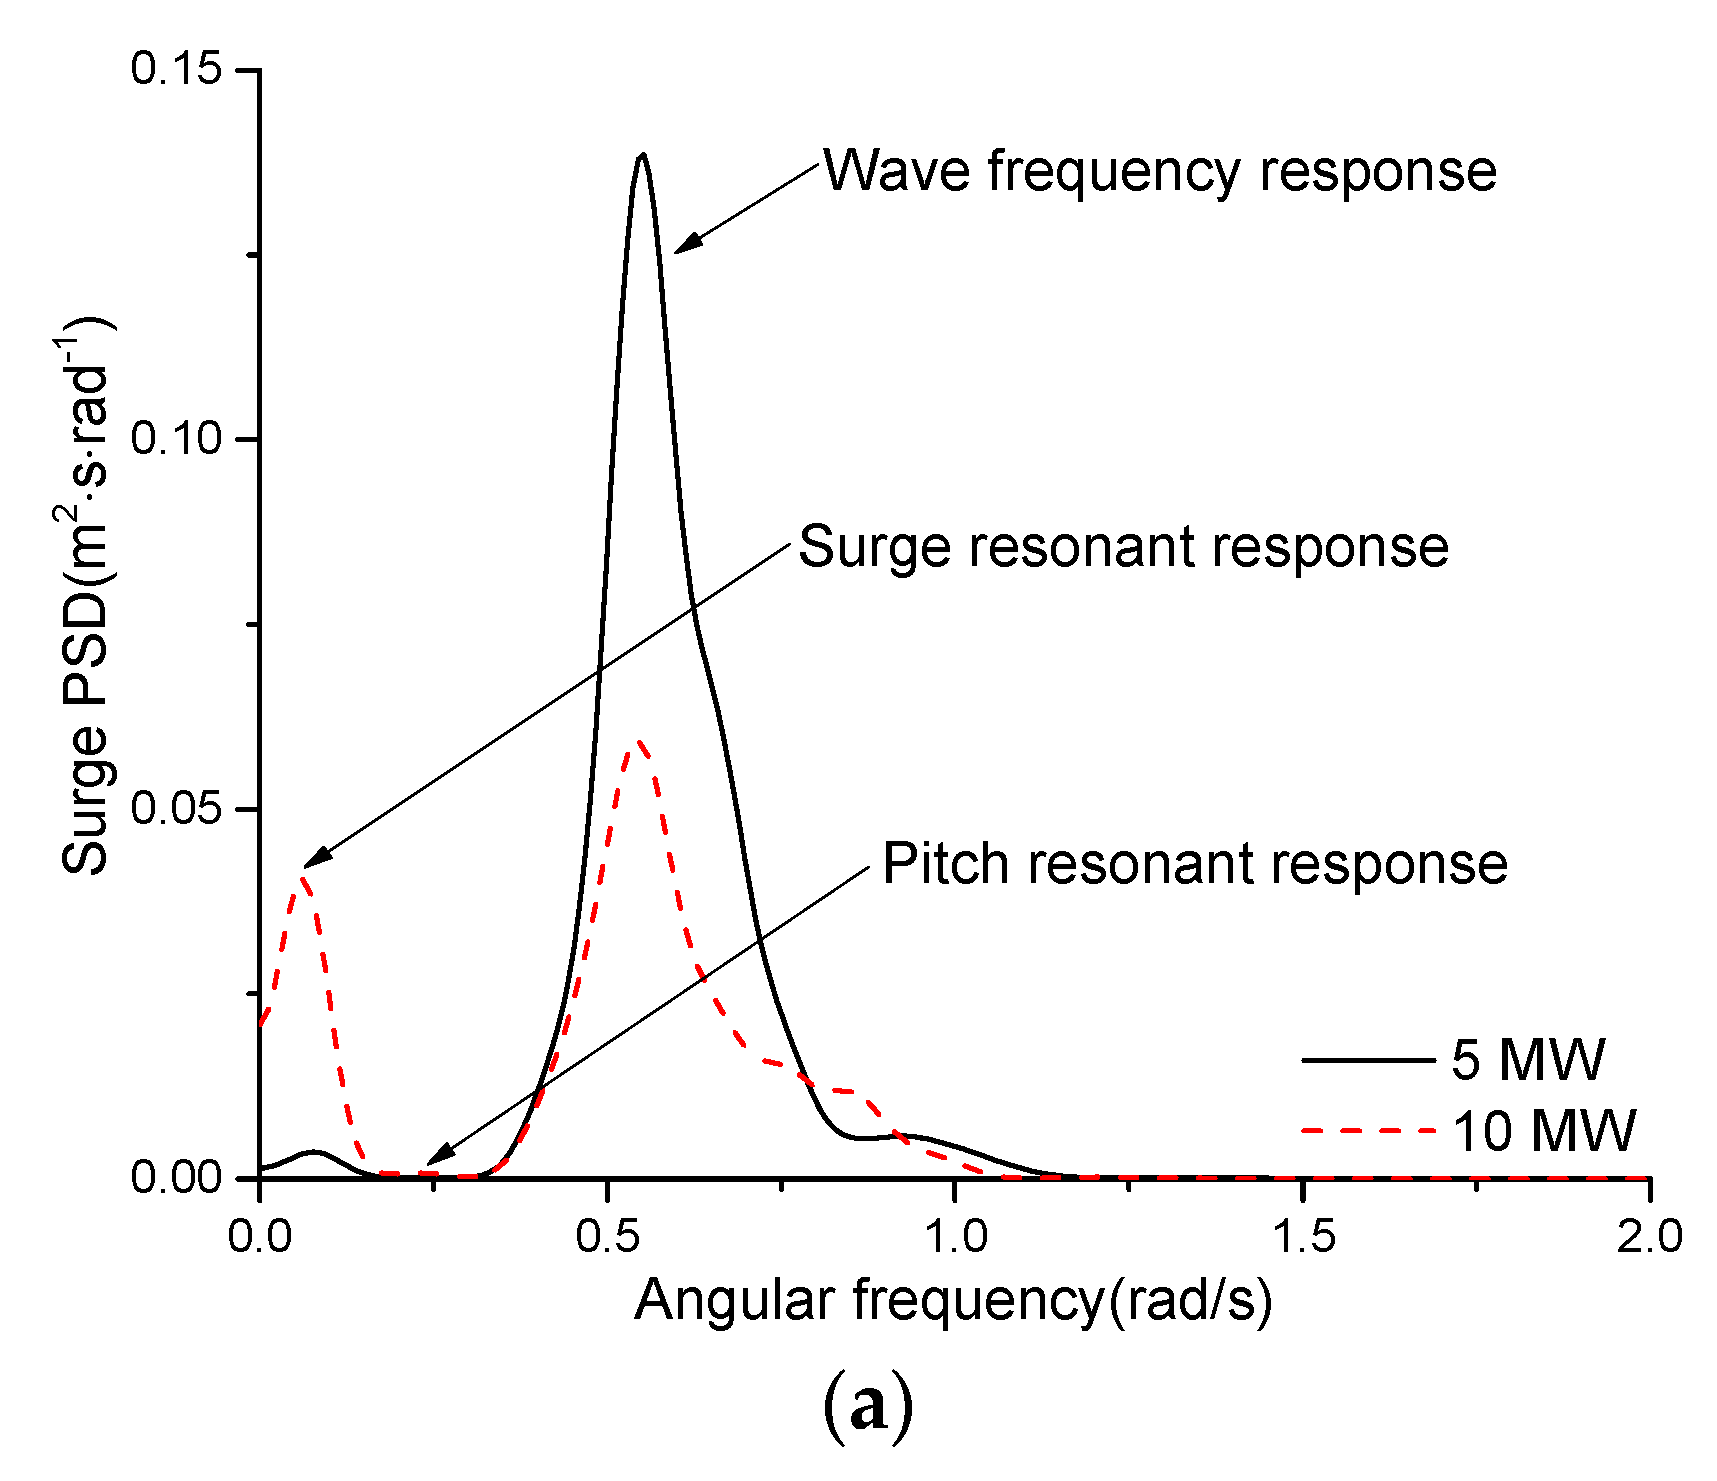
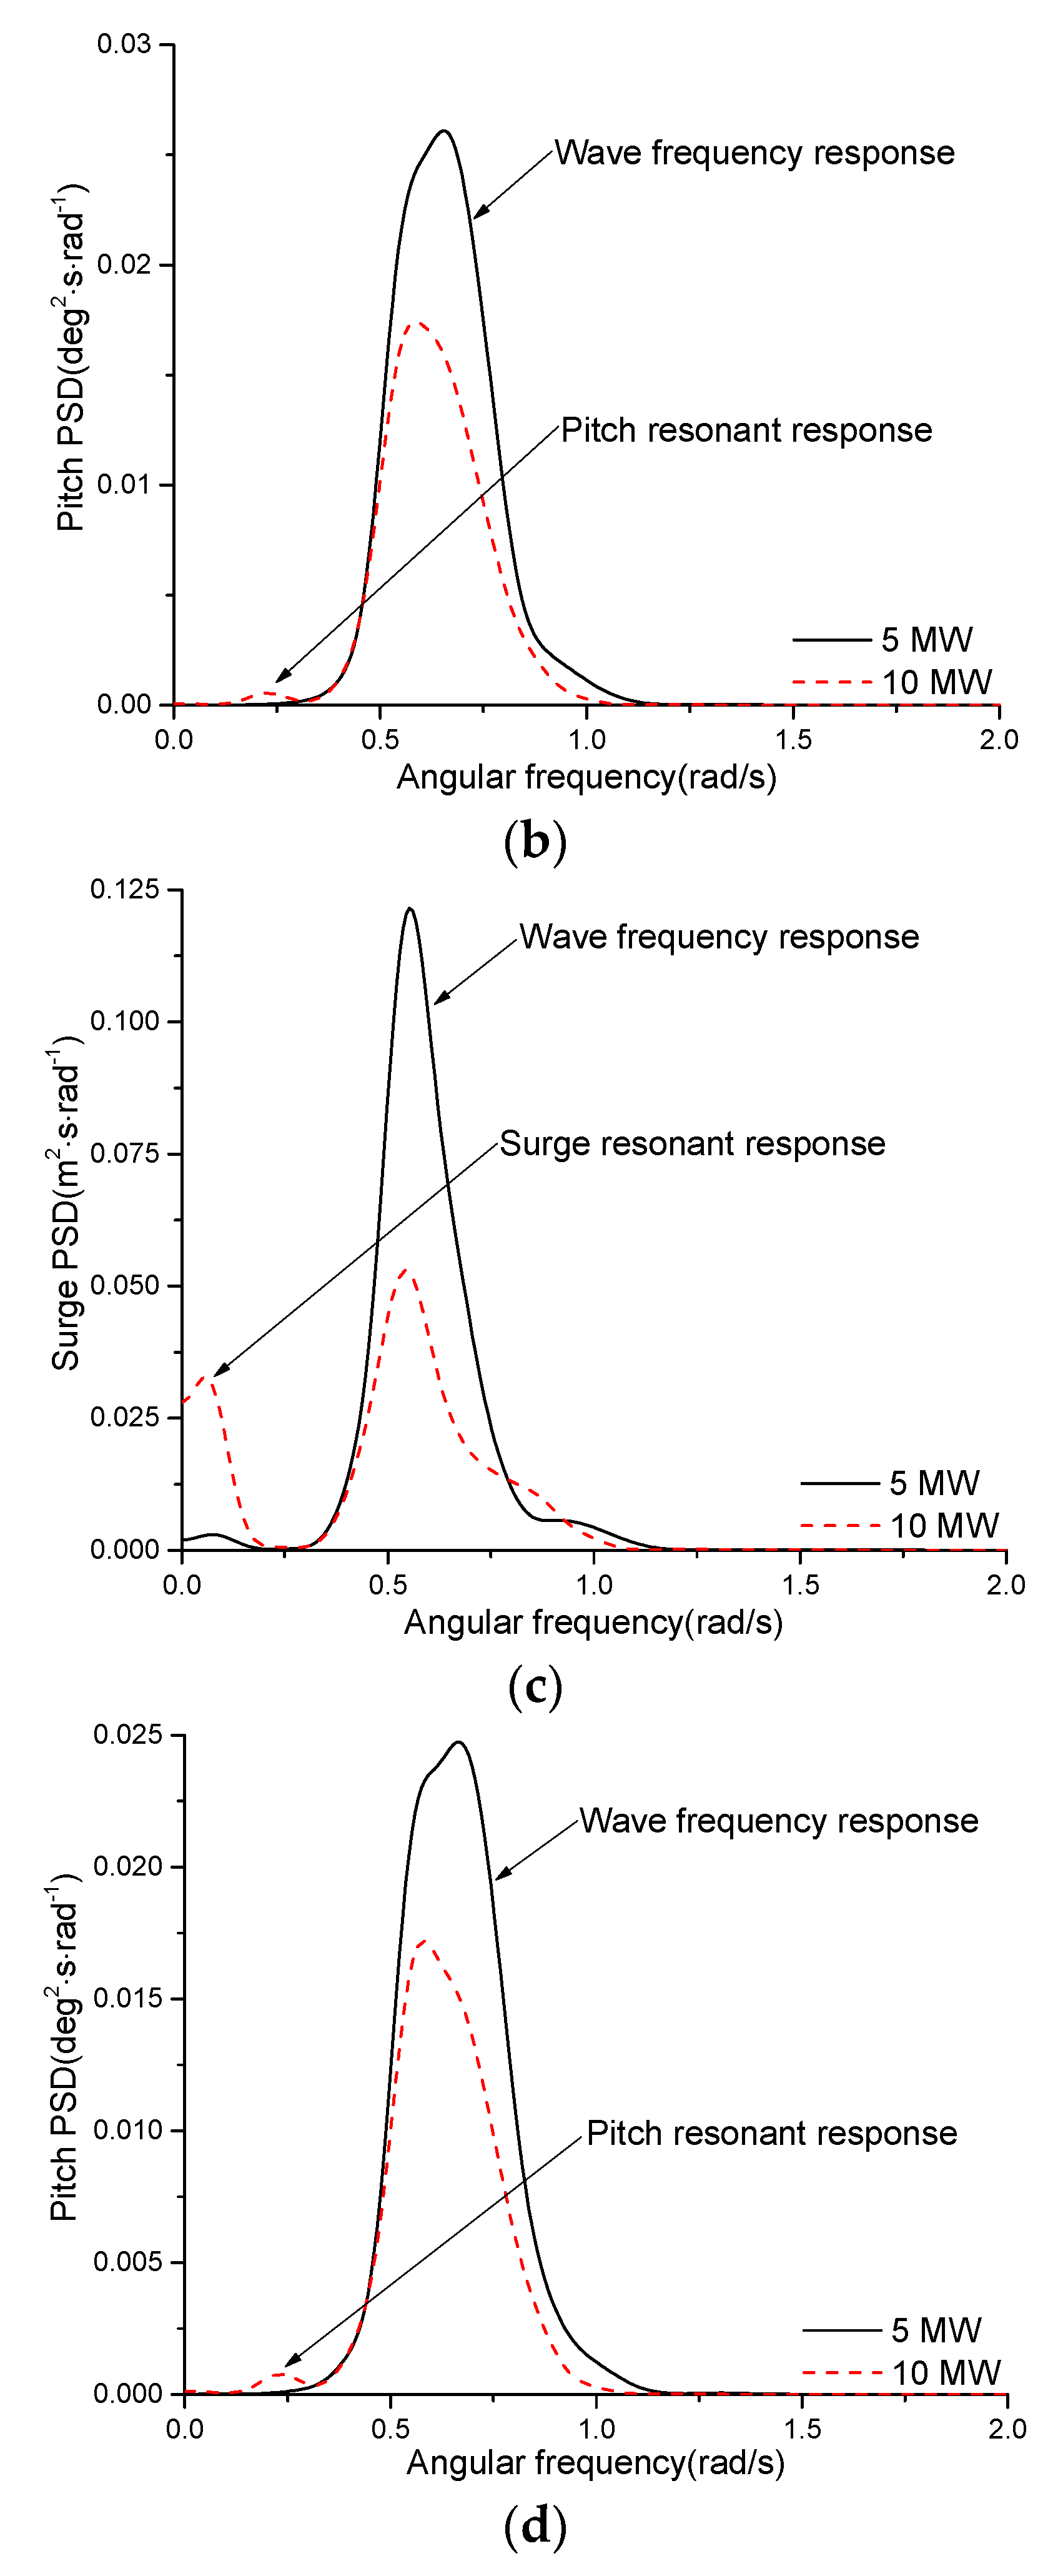
The aerodynamic and wave loads induced motion responses differently and independently. Specifically, in the case of turbulent wind, the low-frequency excitation of the wind loads on the system motions should be more prominent so that the fluctuating components of the system motions increase significantly. Additionally, the surge and pitch resonant responses are significantly increased owing to the negative damping from the blade-pitch controller in the over-rated wind case.
(2)
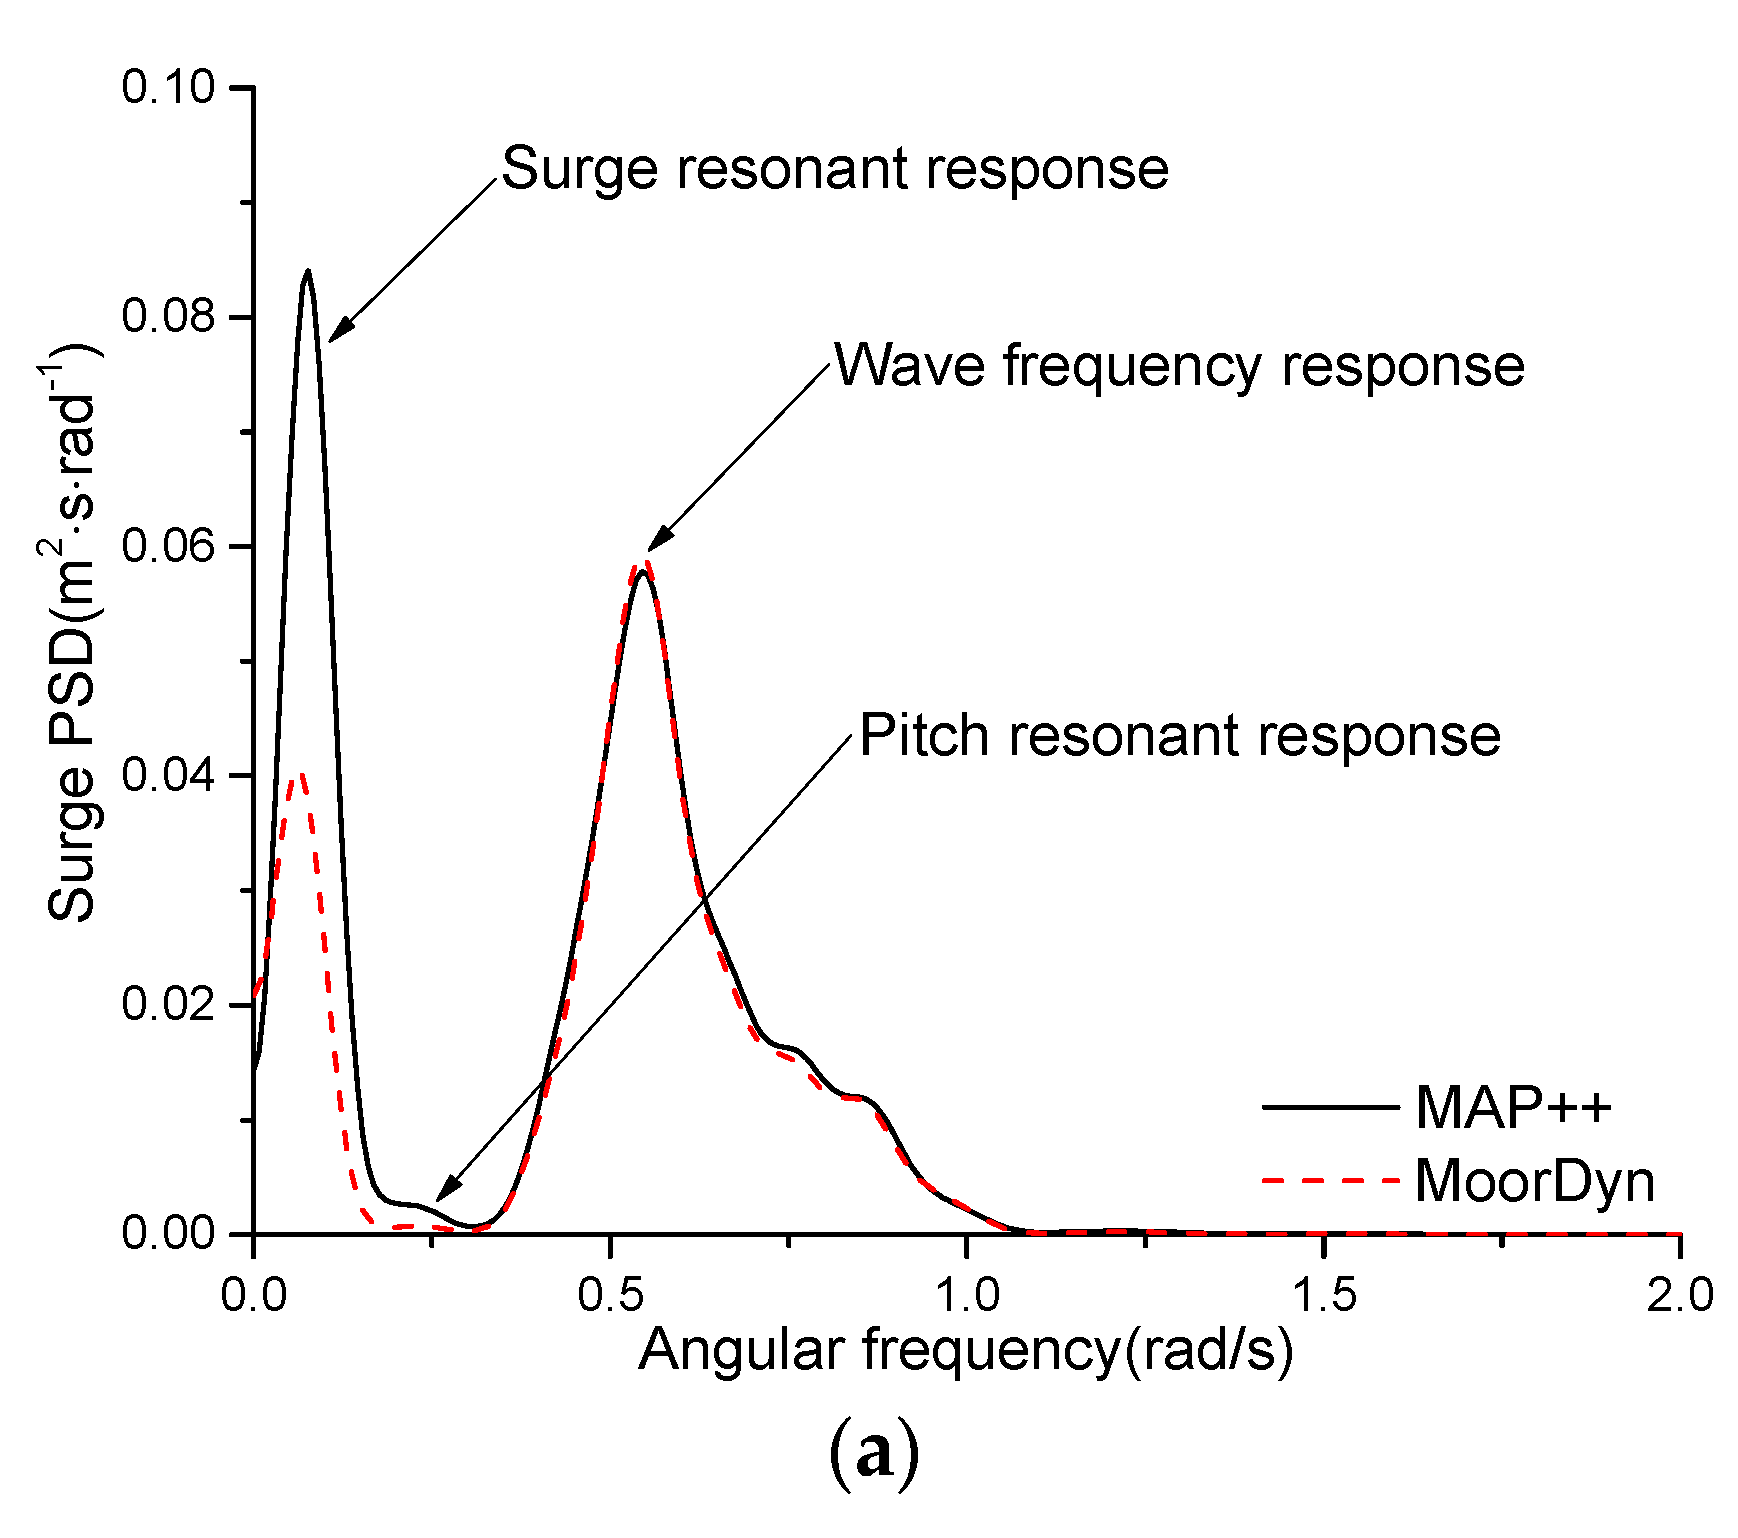
The dynamic effects of the mooring line significantly reduced the low-frequency resonant responses of the system motions but had minor effects on the mean values of the integrated motion responses and the mooring tension responses. Accordingly, the integrated motion responses and the mooring tension responses yielded large standard deviations owing to the dynamic amplification effects. This could provide a valuable reference for the safety evaluation and the mooring line design of the ultra-large FOWT.
(3)
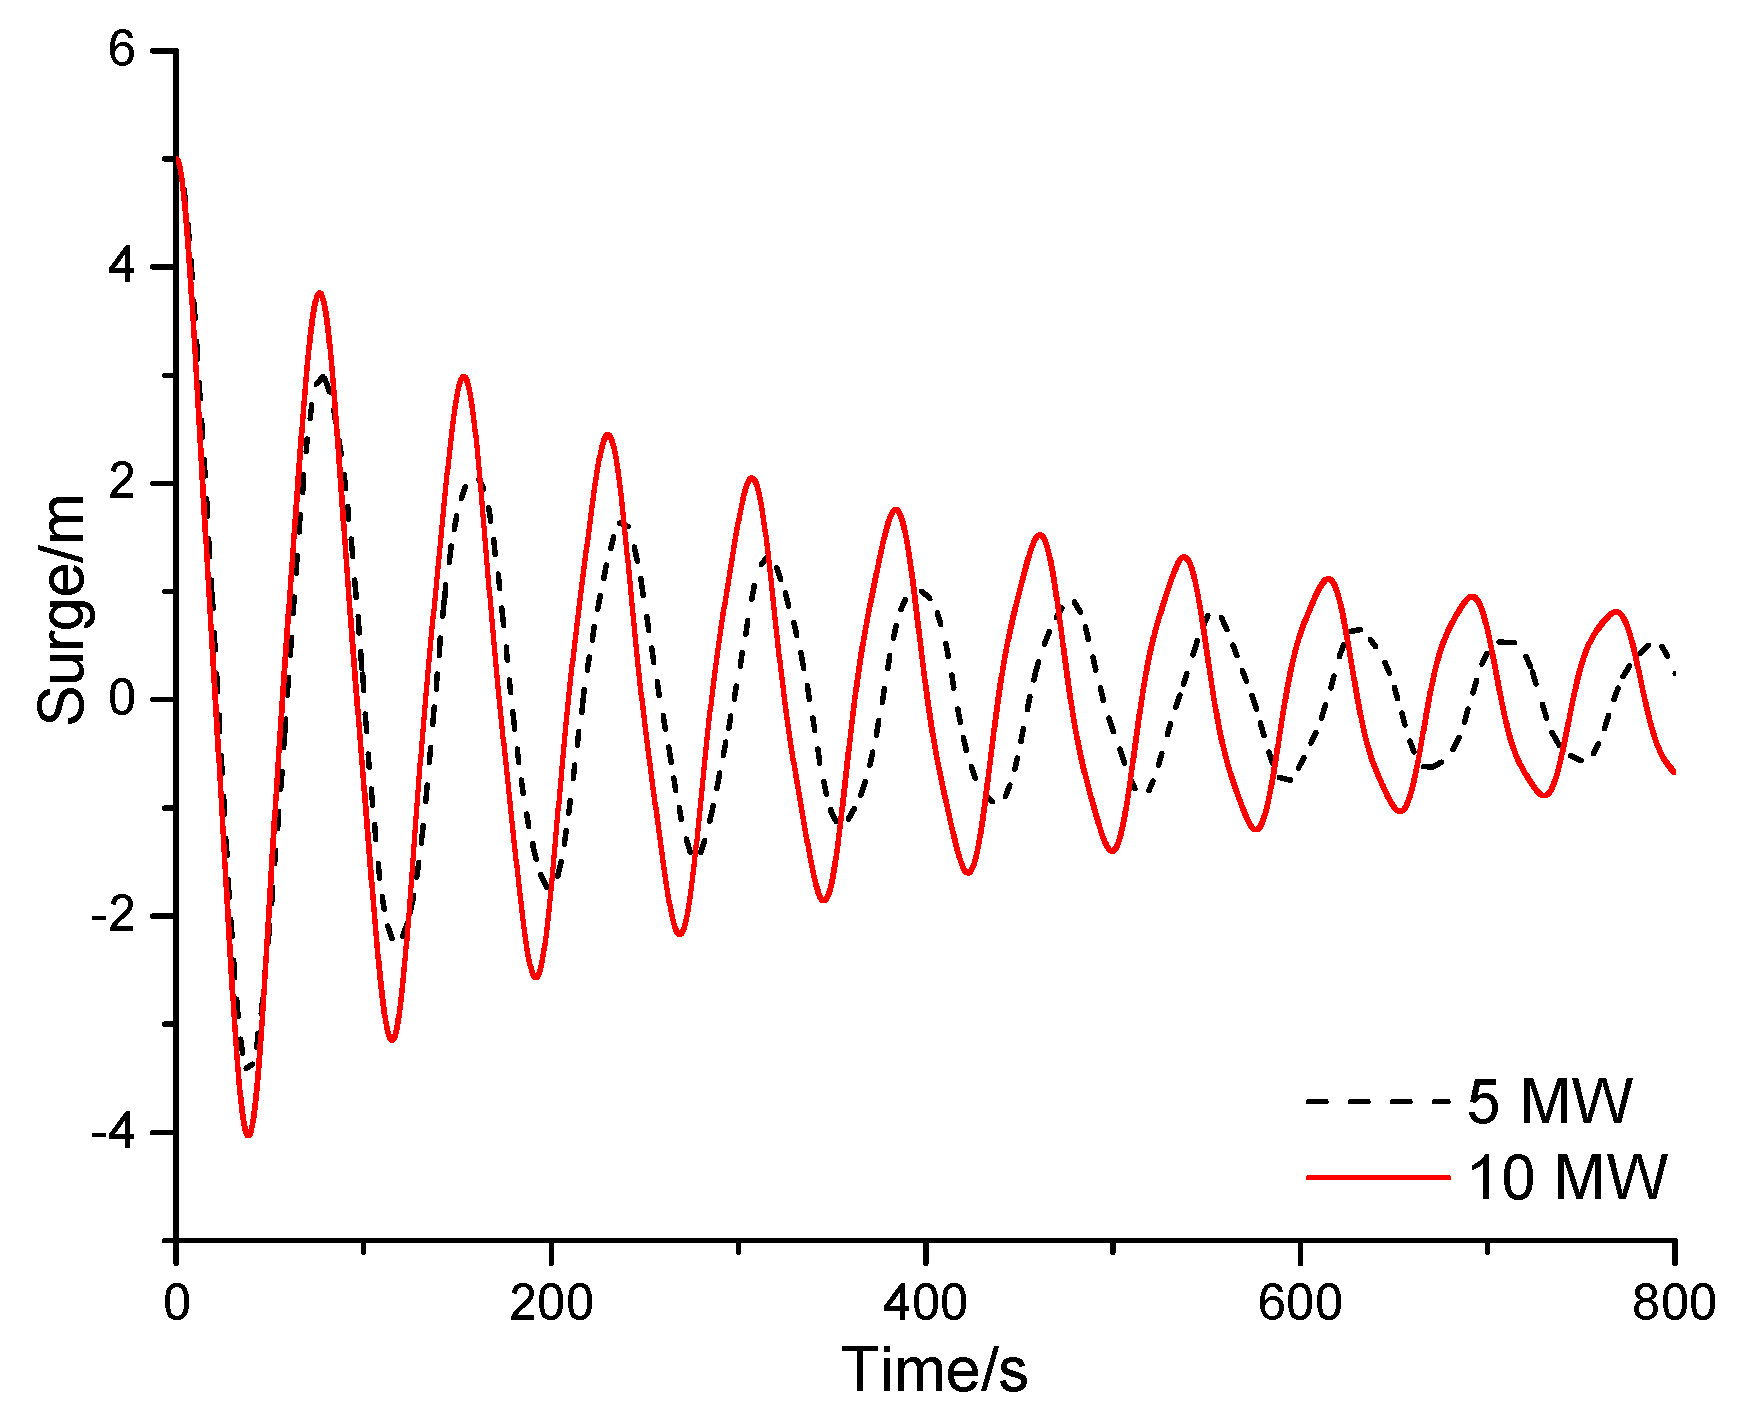
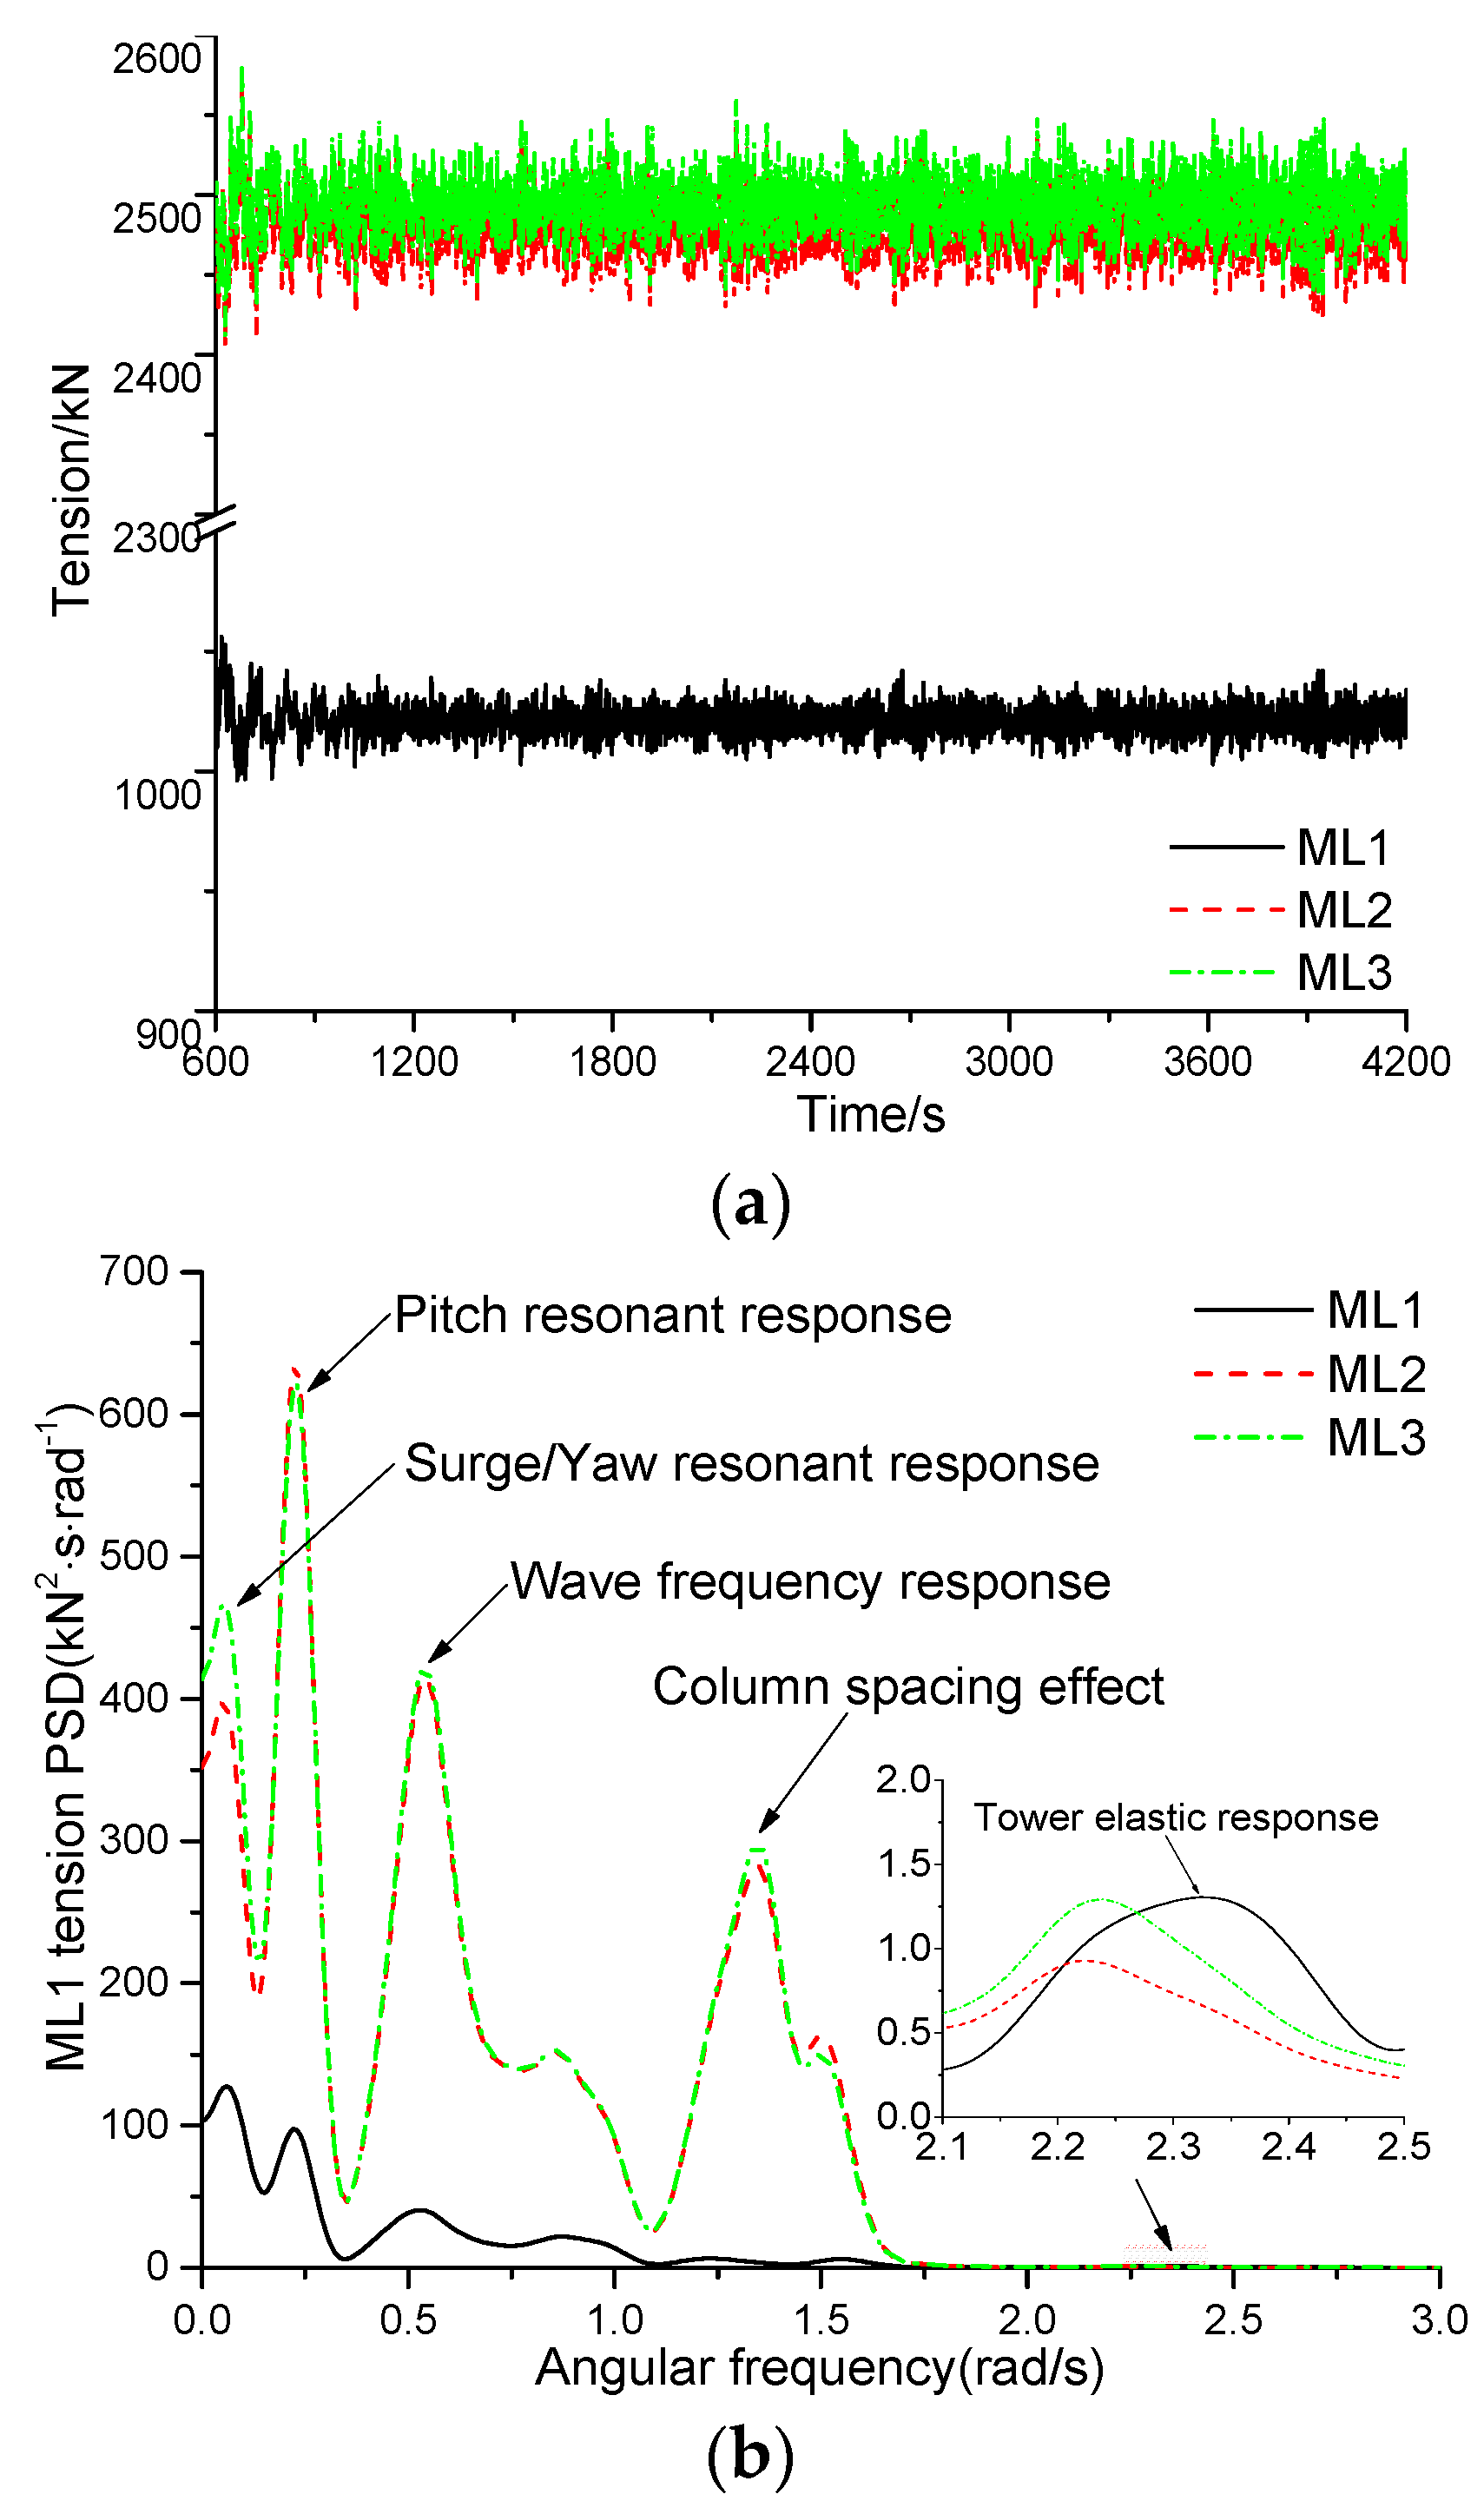
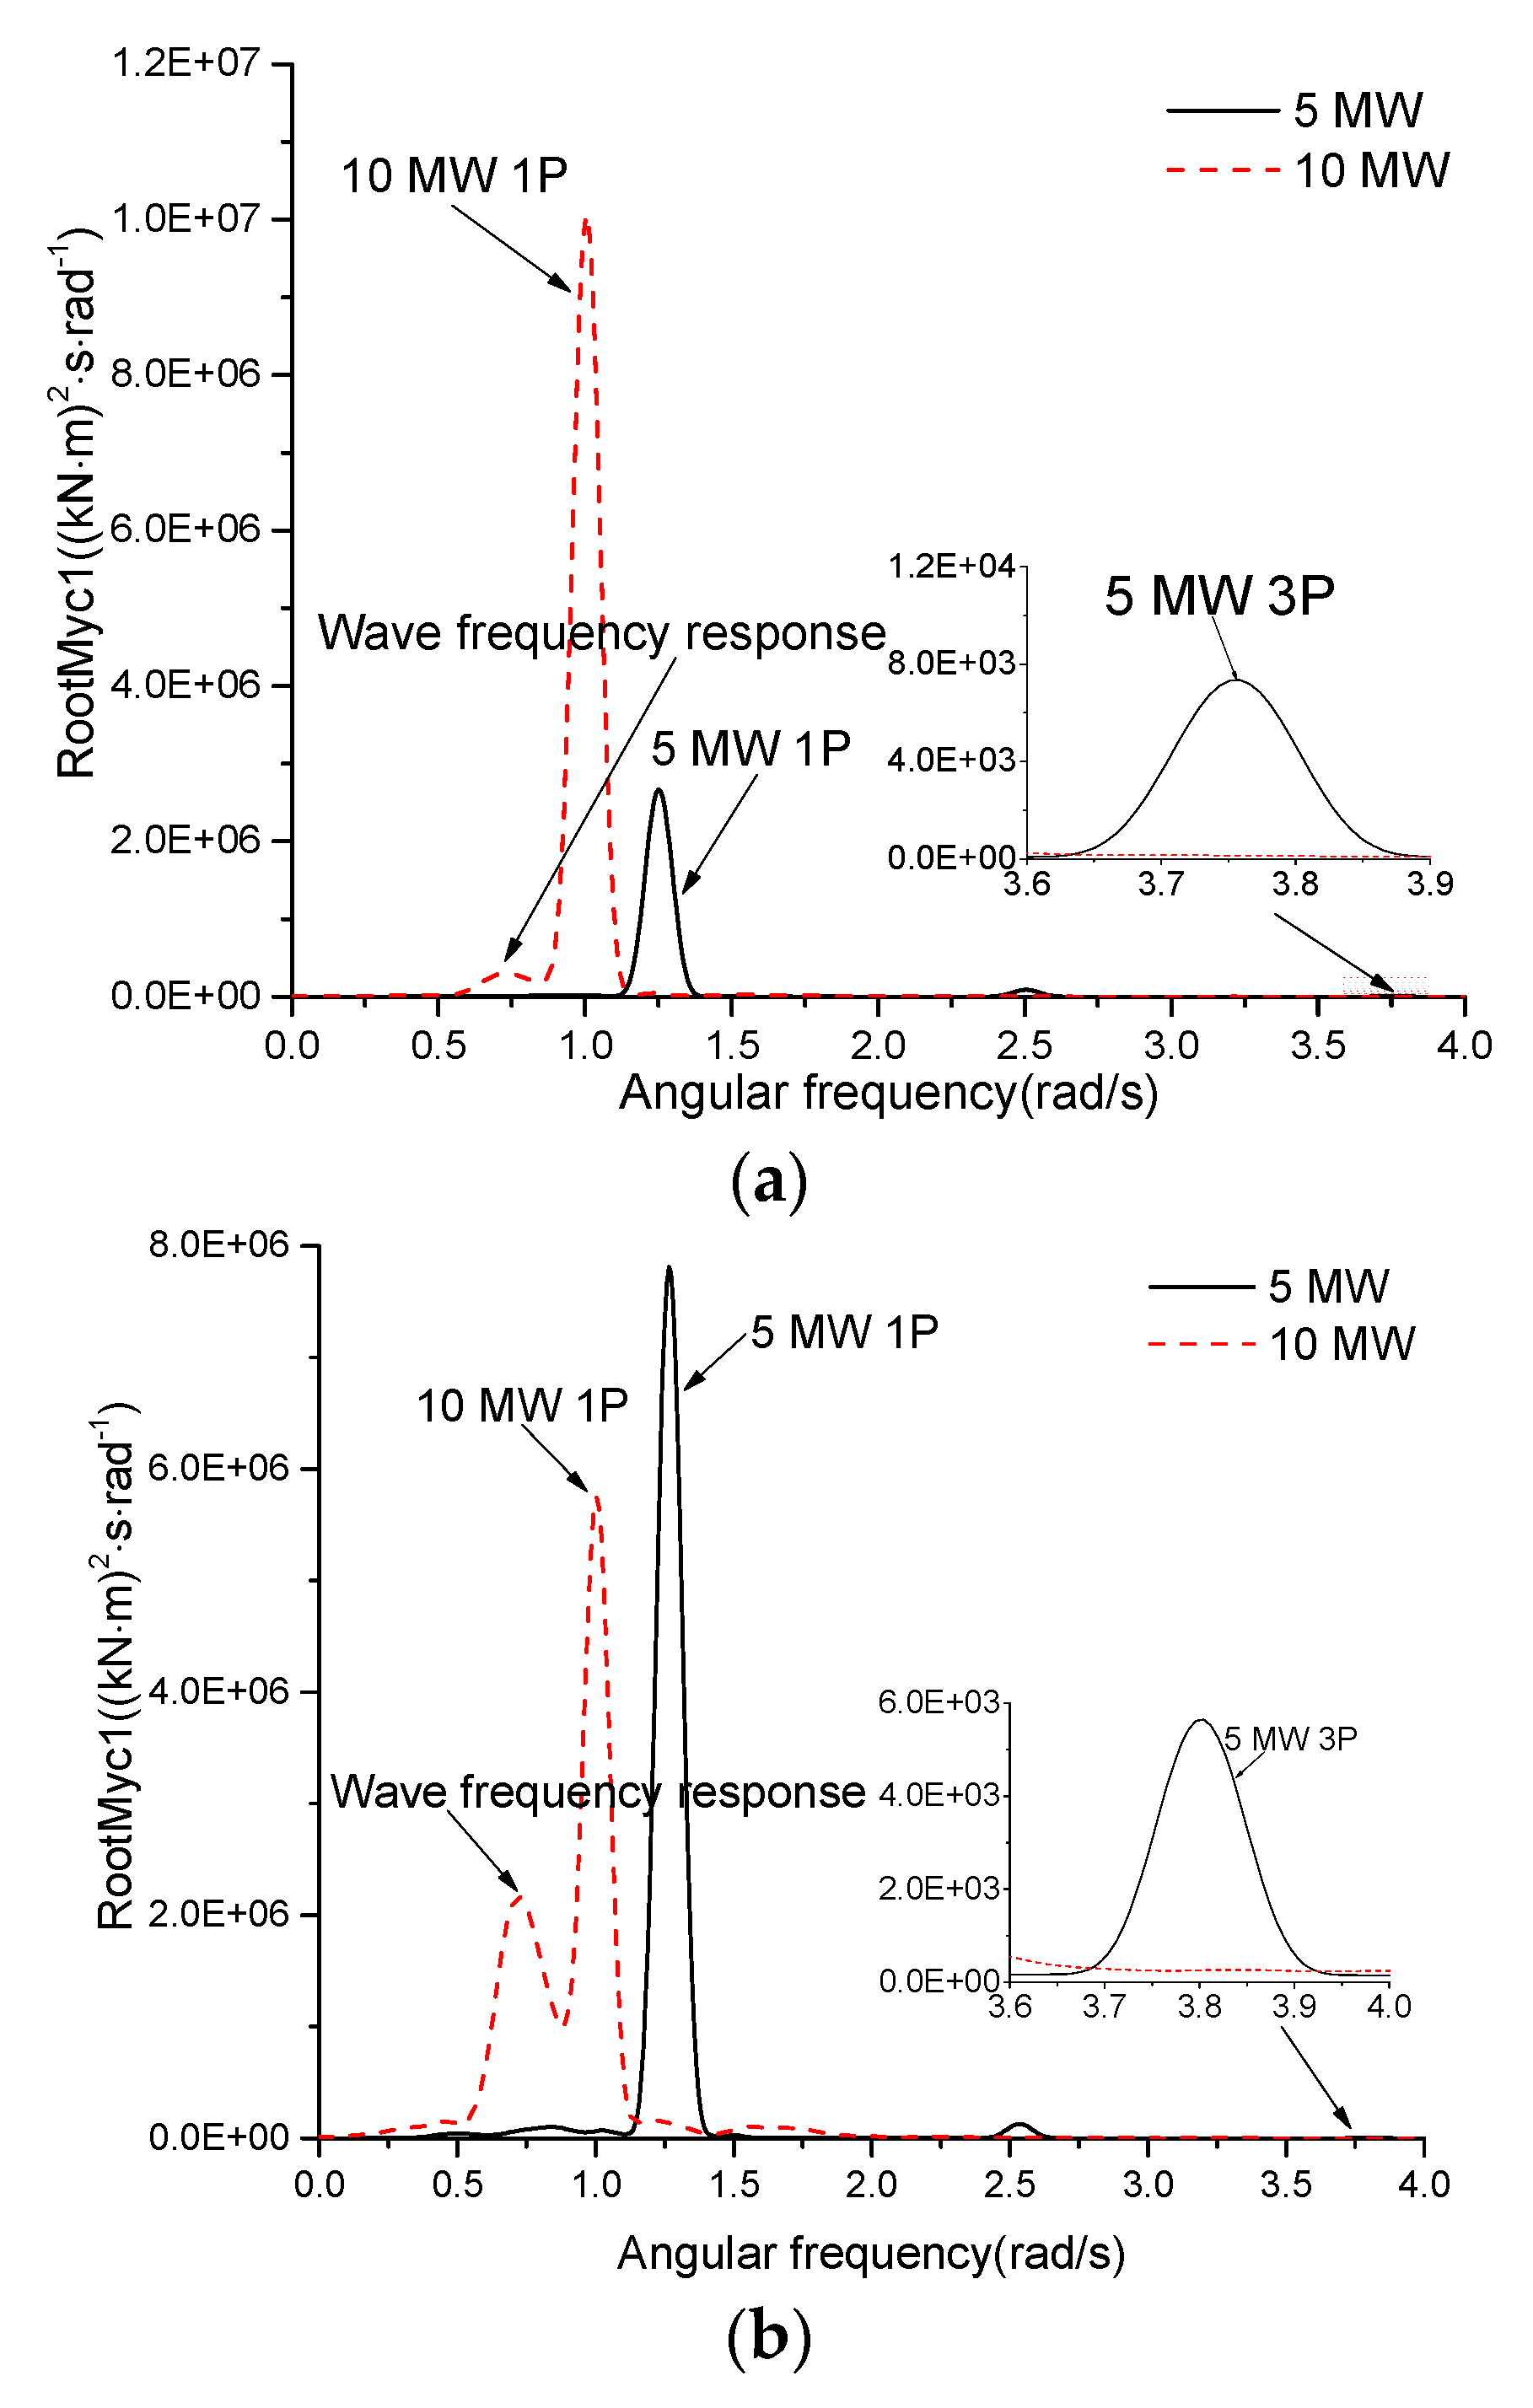
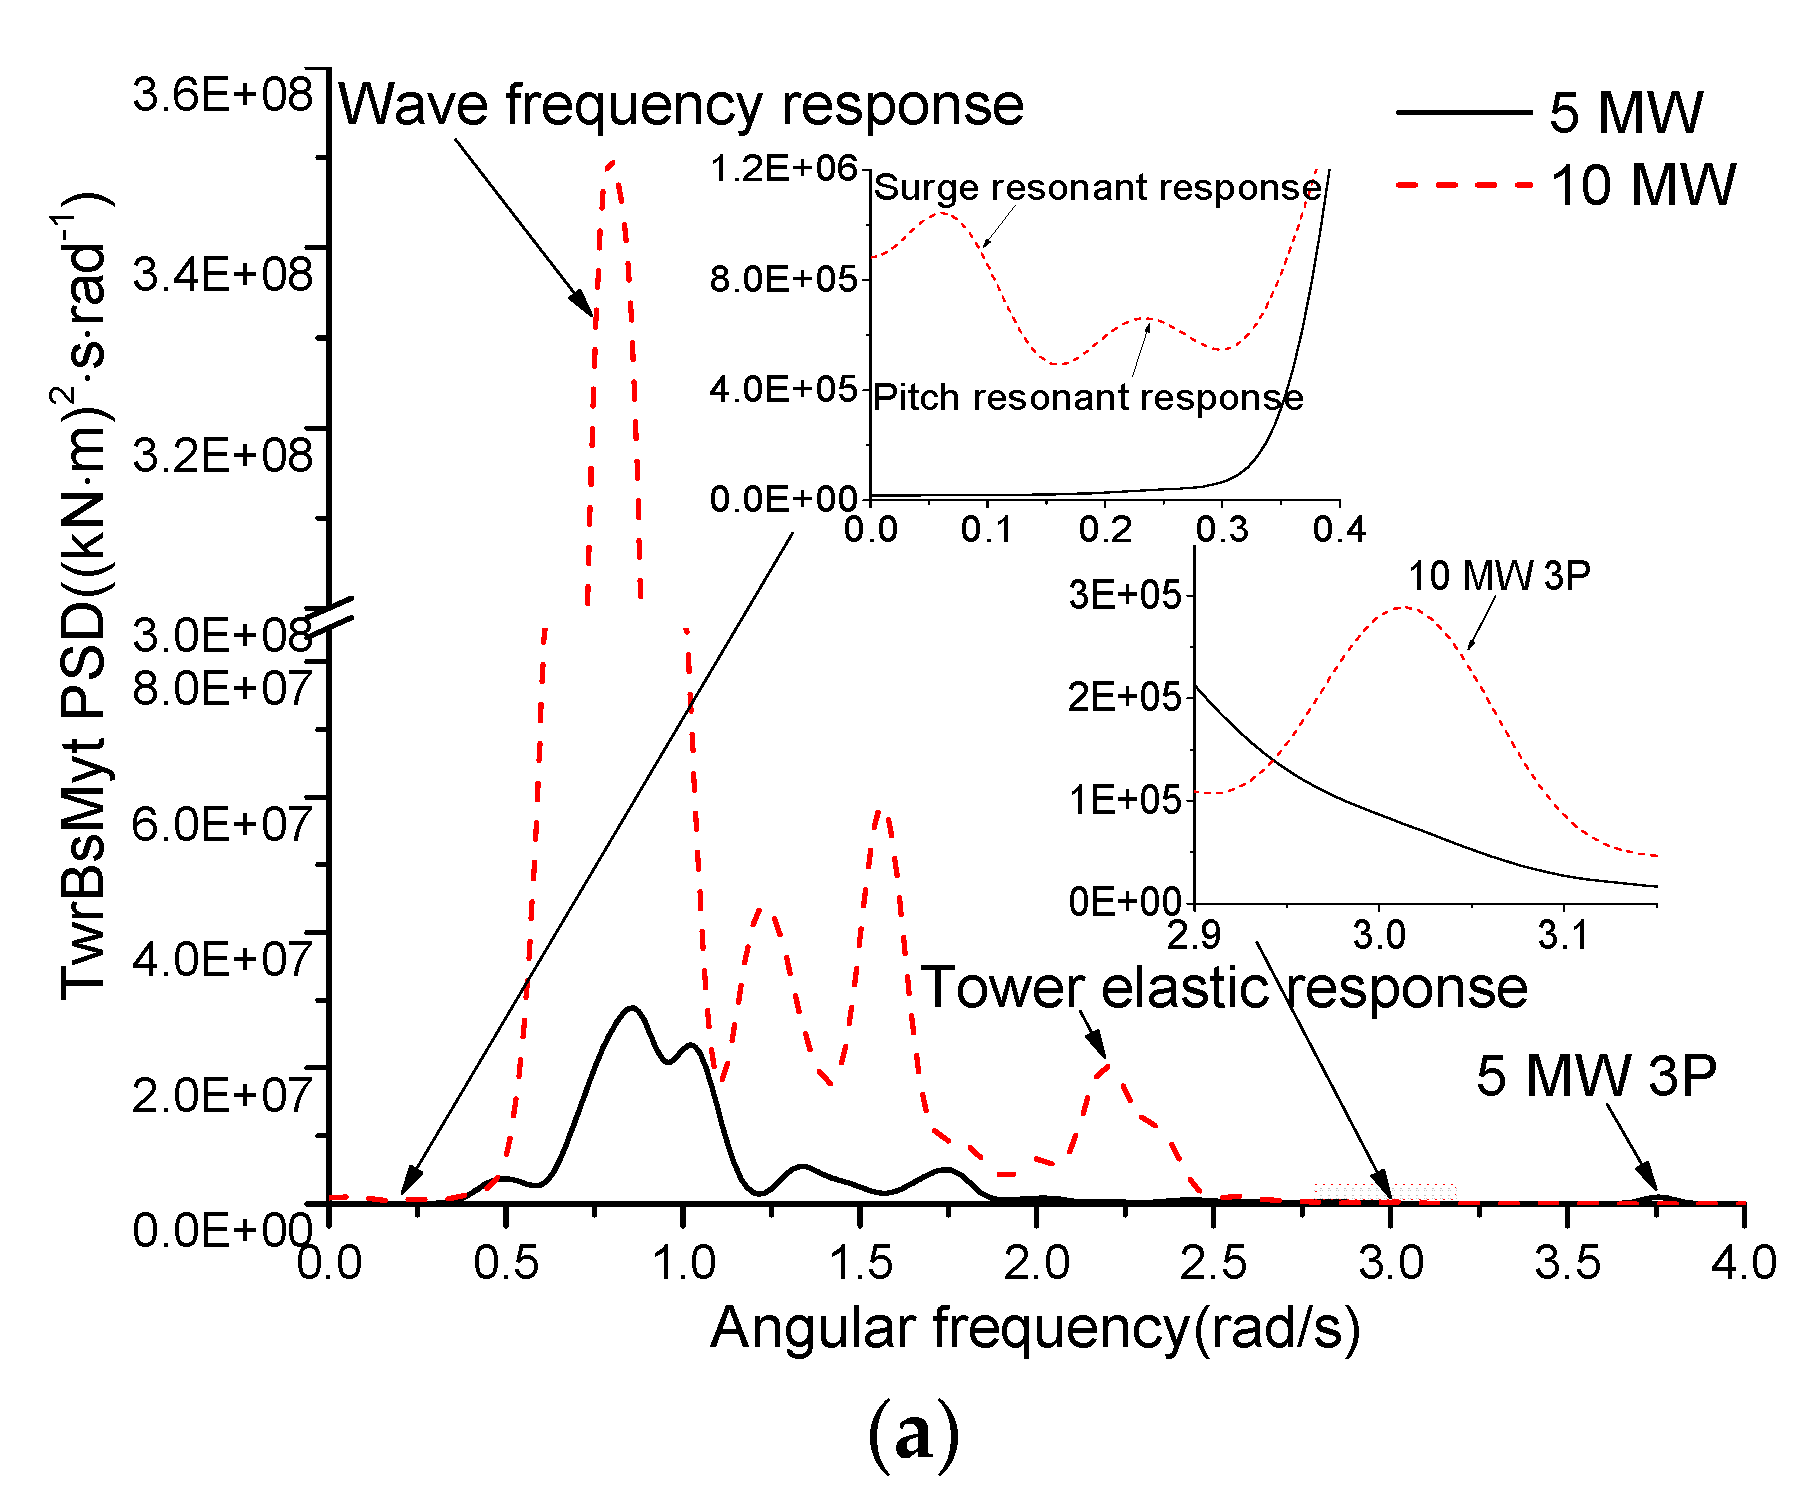
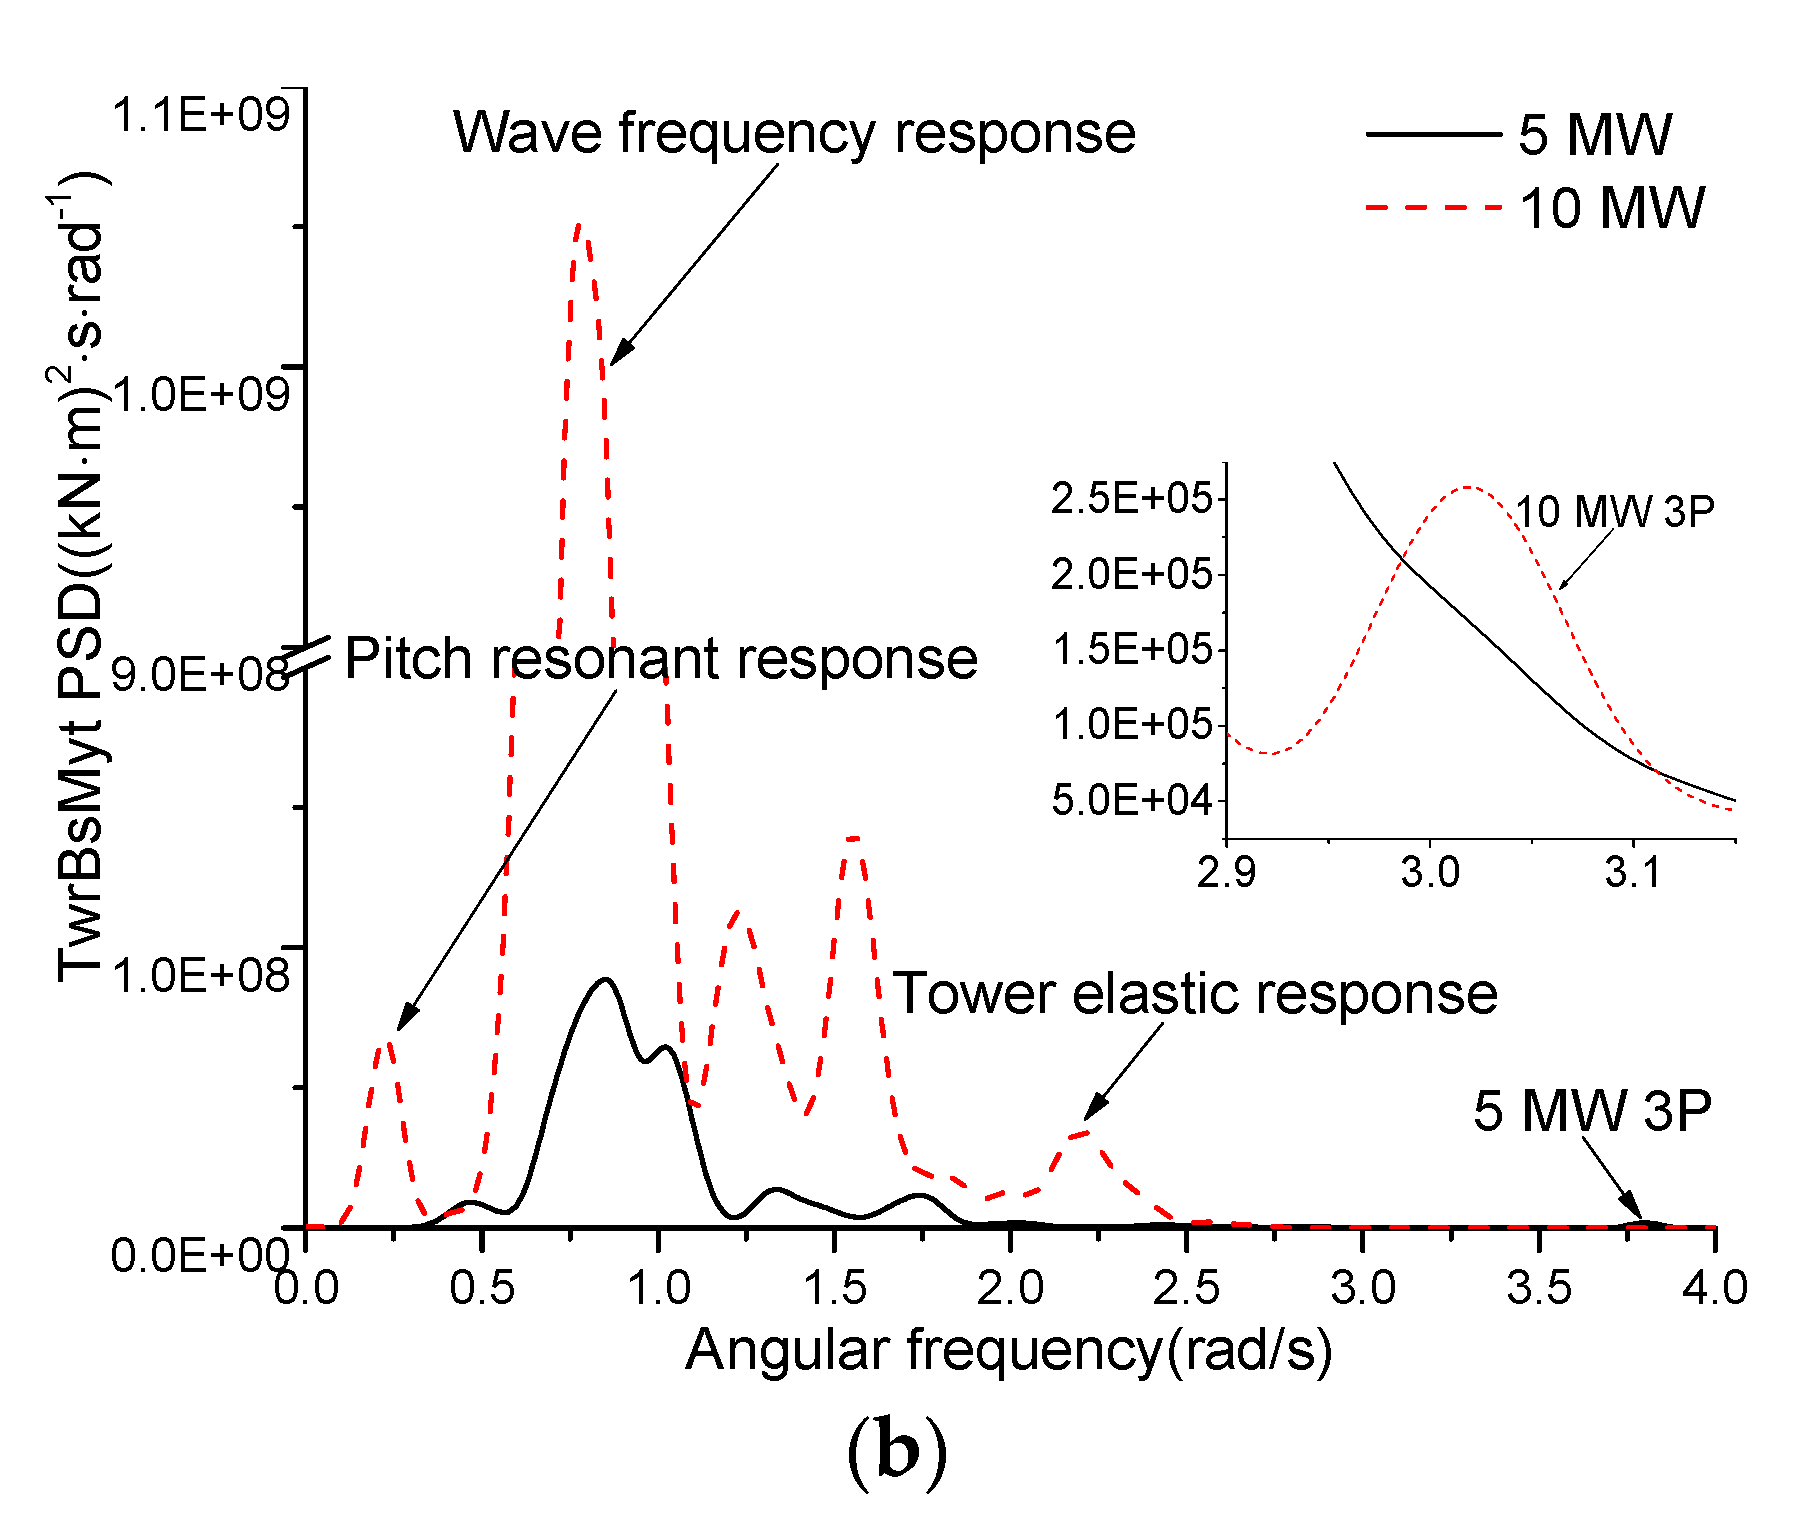
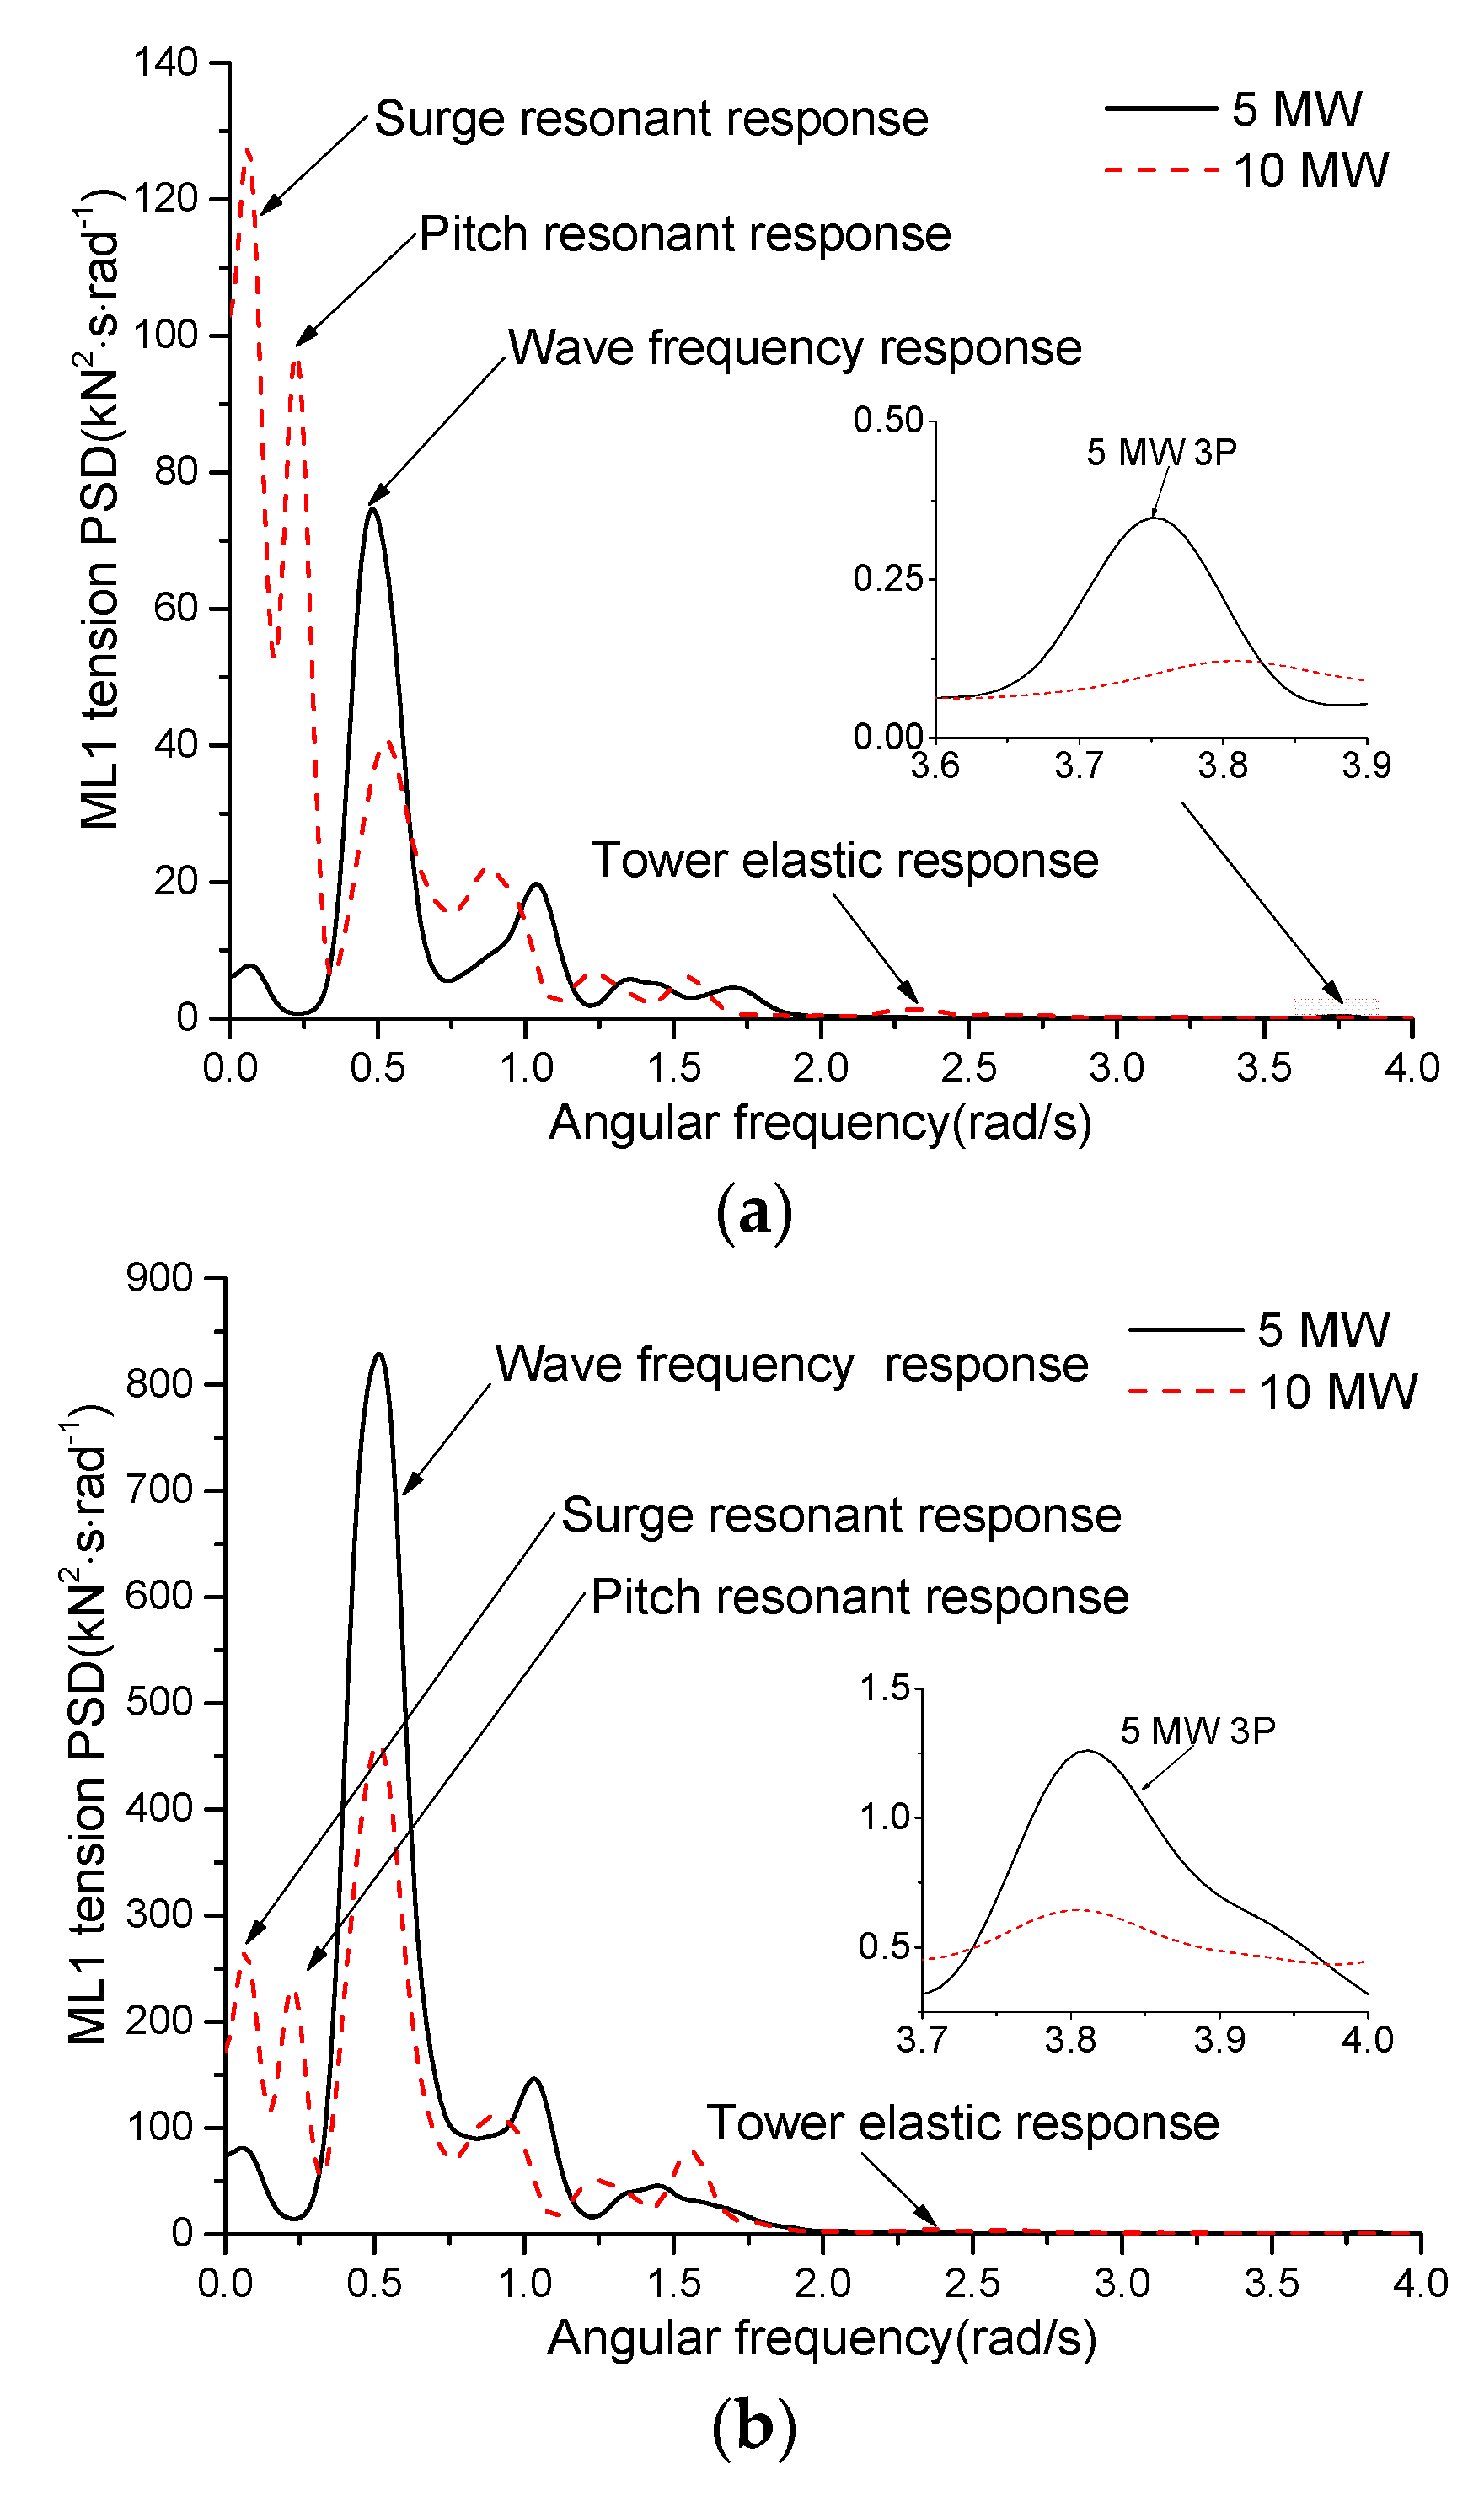
With the increase in the turbine size, the integrated motion responses and structural dynamics were significantly increased, but the integrated motion responses were in a reasonable range. This showed the initial design of the support platform for the DTU 10 MW wind turbine by upscaling of the existing 5 MW platform design is feasible. Correspondingly, the dynamic behaviors between the motion responses and structural dynamics of the 5 and 10 MW FOWTs were significantly different. It can be seen that the low-frequency excitations of the wind loads on the surge and pitch motions, the tower-base fore-aft bending moments and the mooring line tension responses of the 10 MW FOWT were more prominent than those of the 5 MW FOWT, but the 3P effect on the structural dynamics of the 5 MW FOWT was significant.
In general, the studies conducted herein provided prominence to the feasibility of the application of a braceless semi-submersible platform to hold the DTU 10 MW reference wind turbine for specific environmental conditions. This provides a reference for the design and application of the ultra-large FOWT in the future. However, if the braceless semi-submersible platform is used to support the ultra-large wind turbines in practice, more design requirements such as the adjustment of size and layout, detailed strength checks for fatigue and ultimate limit states, hydrodynamic performance and economic analysis, and a long-term extreme analysis should be conducted in further study.

Author Contributions

Z.Z. and X.L. formulated the problem addressed in this study; Z.Z., X.L., W.W., and W.S. formed the basis for the integrated FOWT system design and carried out all the modeling and numerical studies; all the authors contributed to the first draft and final version of the paper.

Acknowledgments

The authors would like to acknowledge the support from the National Natural Science Foundation of China (Grant No. 51879040, 51709039).

Conflicts of Interest

The authors declare no conflict of interest.

References

  1. Liu, J.; Thomas, E.; Manuel, L.; Griffith, D.; Ruehl, K.; Barone, M. Integrated system design for a large wind turbine supported on a moored semi-submersible platform. J. Mar. Sci. Eng. 2018, 6, 9. [Google Scholar] [CrossRef]
  2. Luo, C.X. Latest Developments in the World’s Wind Power Industry. Sino-Glob. Energy 2012, 17, 32–39. [Google Scholar]
  3. Han, Y.; Le, C.; Ding, H.; Cheng, Z.; Zhang, P. Stability and dynamic response analysis of a submerged tension leg platform for offshore wind turbines. Ocean Eng. 2017, 129, 68–82. [Google Scholar] [CrossRef]
  4. Snyder, B.; Kaiser, M.J. Ecological and economic cost-benefit analysis of offshore wind energy. Renew. Energy 2009, 34, 1567–1578. [Google Scholar] [CrossRef]
  5. Jeon, S.H.; Cho, Y.U.; Seo, M.W.; Cho, J.R.; Jeong, W.B. Dynamic response of floating substructure of spar-type offshore wind turbine with catenary mooring cables. Ocean Eng. 2013, 72, 356–364. [Google Scholar] [CrossRef]
  6. Roddier, D.; Cermelli, C.; Aubault, A.; Weinstein, A. WindFloat: A floating foundation for offshore wind turbines. J. Renew. Sustain. Energy 2010, 2, 033104. [Google Scholar] [CrossRef]
  7. Philippe, M.; Babarit, A.; Ferrant, P. Modes of response of an offshore wind turbine with directional wind and waves. Renew. Energy 2013, 49, 151–155. [Google Scholar] [CrossRef]
  8. Bachynski, E.E.; Moan, T. Design considerations for tension leg platform wind turbines. Mar. Struct. 2012, 29, 89–114. [Google Scholar] [CrossRef]
  9. Butterfield, S.; Musial, W.; Jonkman, J.M.; Sclavounos, P. Engineering Challenges for Floating Offshore Wind Turbines; National Renewable Energy Laboratory (NREL): Golden, CO, USA, 2007.
  10. Jonkman, J.M.; Matha, D. Dynamics of offshore floating wind turbines—analysis of three concepts. Wind Energy 2011, 14, 557–569. [Google Scholar] [CrossRef]
  11. Matha, D. Model Development and Loads Analysis of an Offshore Wind Turbine on a Tension Leg Platform with a Comparison to Other Floating Turbine Concepts: April 2009; National Renewable Energy Laboratory (NREL): Golden, CO, USA, 2010.
  12. Li, L.; Hu, Z.; Wang, J. Dynamic responses of a semi-type offshore floating wind turbine. In Proceedings of the 33rd International Conference on Ocean, Offshore and Arctic Engineering, San Francisco, CA, USA, 8–13 June 2014. [Google Scholar]
  13. Ma, Y. Research on Dynamic Analysis for a Spar Type Offshore Floating Wind Turbine. Master’s Thesis, Shanghai Jiao Tong University, Shanghai, China, 2014. [Google Scholar]
  14. Karimirad, M. Modeling aspects of a floating wind turbine for coupled wave–wind-induced dynamic analyses. Renew. Energy 2013, 53, 299–305. [Google Scholar] [CrossRef]
  15. Sun, X.; Huang, D.; Wu, G. The current state of offshore wind energy technology development. Energy 2012, 41, 298–312. [Google Scholar] [CrossRef]
  16. Harrison, R.; Hau, E.; Snel, H. Large Wind Turbines: Design and Economic; Wiley: Chichester, UK, 2000. [Google Scholar]
  17. Bak, C.; Bitsche, R.; Yde, A. Light Rotor: The 10-MW reference wind turbine. In Proceedings of the EWEA 2012-European Wind Energy Conference & Exhibition, Copenhagen, Denmark, 16–19 April 2012. [Google Scholar]
  18. Xue, W.F. Design, Numerical Modelling and Analysis of a Spar Floater Supporting the DTU 10 MW Wind Turbine. Master’s Thesis, Norwegian University of Science and Technology, Trondheim, Norway, 2016. [Google Scholar]
  19. Tian, X.S. Design, Numerical Modelling and Analysis of a TLP Floater Supporting the DTU 10 MW Wind Turbine. Master’s Thesis, Norwegian University of Science and Technology, Trondheim, Norway, 2016. [Google Scholar]
  20. Islam, M.T. Design, Numerical Modelling and Analysis of a Semi-Submersible Floater Supporting the DTU 10 MW Wind Turbine. Master’s Thesis, Norwegian University of Science and Technology, Trondheim, Norway, 2016. [Google Scholar]
  21. Xu, Y.; Hu, Z.; Liu, G. Kinetic characteristics research of the 10 MW-level offshore floating wind turbine. Ocean Eng. 2018, 36, 44–51. [Google Scholar]
  22. Luan, C.Y.; Gao, Z.; Moan, T. Design and analysis of a braceless steel 5-mw semi-submersible wind turbine. In Proceedings of the 35th International Conference on Ocean, Offshore and Arctic Engineering, Busan, Korea, 19–24 June 2016. [Google Scholar]
  23. Luan, C. Design and Analysis for a Steel Braceless Semi-Submersible Hull for Supporting a 5-MW Horizontal Axis Wind Turbine. Ph.D. Thesis, Norwegian University of Science and Technology, Trondheim, Norway, 2018. [Google Scholar]
  24. Cheng, Z.; Madsen, H.A.; Gao, Z.; Moan, T. A fully coupled method for numerical modeling and dynamic analysis of floating vertical axis wind turbines. Renew. Energy 2017, 107, 604–619. [Google Scholar] [CrossRef]
  25. Jonkman, J.M. Dynamics Modeling and Loads Analysis of an Offshore Floating Wind Turbine; National Renewable Energy Laboratory (NREL): Golden, CO, USA, 2007.
  26. Jonkman, J.M.; Robertson, A.; Hayman, G.J. HydroDyn User’s Guide and Theory Manual; National Renewable Energy Laboratory: Golden, CO, USA, 2014.
  27. Faltinsen, O. Sea Loads on Ships and Offshore Structures; Cambridge University Press: Cambridge, UK, 1993. [Google Scholar]
  28. Zhao, Y.; Yang, J.; He, Y.; Gu, M. Dynamic response analysis of a multi-column tension-leg-type floating wind turbine under combined wind and wave loading. J. Shanghai Jiao Tong Univ. 2016, 21, 103–111. [Google Scholar] [CrossRef]
  29. Moriarty, P.J.; Hansen, A.C. AeroDyn Theory Manual; National Renewable Energy Laboratory: Golden, CO, USA, 2005.
  30. Hansen, M.O.L.; Sørensen, J.N.; Voutsinas, S. State of the art in wind turbine aerodynamics and aeroelasticity. Prog. Aerosp. Sci. 2006, 42, 285–330. [Google Scholar] [CrossRef]
  31. Jonkman, J.M. Dynamics of offshore floating wind turbines-model development and verification. Wind Energy 2009, 12, 459–492. [Google Scholar] [CrossRef]
  32. Giuseppe, R.T.; Alberto, M.A.; Luigia, R. Dynamic modelling of spar bouy wind turbine. In Proceedings of the 33rd International Conference on Ocean, Offshore and Arctic Engineering, Trondheim, Norway, 25–30 June 2017. [Google Scholar]
  33. Masciola, M.; Robertson, A.; Jonkman, J.; Coulling, A.; Goupee, A. Assessment of the importance of mooring dynamics on the global response of the DeepCwind floating semisubmersible offshore wind turbine. In Proceedings of the Twenty-Third International Offshore and Polar Engineering Conference, Anchorage, AK, USA, 30 June–5 July 2013. [Google Scholar]
  34. Hall, M.; Goupee, A. Validation of a lumped-mass mooring line model with DeepCwind semisubmersible model test data. Ocean Eng. 2015, 104, 590–603. [Google Scholar] [CrossRef] [Green Version]
  35. Vittori, F.E. Design and Analysis of Semi-Submersible Floating Wind Turbines with Focus on Structural Response Reduction. Master’s Thesis, Norwegian University of Science and Technology, Trondheim, Norway, 2015. [Google Scholar]
  36. Leimeister, M. Rational Upscaling and Modelling of a Semi-Submersible Floating Offshore Wind Turbine. Master’s Thesis, Norwegian University of Science and Technology, Trondheim, Norway, 2016. [Google Scholar]
  37. Lemmer, F.; Raach, S.; Schlipf, D. Prospects of Linear Model Predictive Control on a 10 MW Floating Wind Turbine. In Proceedings of the 34th International Conference on Ocean, Offshore and Arctic Engineering, Houston, TX, USA, 13–19 November 2015. [Google Scholar]
  38. Masciola, M.; Jonkman, J.; Robertson, A. Implementation of a multisegmented, quasi-static cable model. In Proceedings of the 23th International Offshore and Polar Engineering Conference, Anchorage, AK, USA, 30 June–5 July 2013. [Google Scholar]
  39. Hall, M. MoorDyn—Users Guide; Department of Mechanical Engineering, University of Maine: Orono, ME, USA, 2015. [Google Scholar]
  40. ANSYS A.W., Inc. AQWA Manual Release 15.0; ANSYS A.W., Inc.: Canonsburg, PA, USA, 2013. [Google Scholar]
  41. M. WAMIT Inc. WAMIT v7.0 Manual; M. WAMIT Inc.: Chestnut Hill, MA, USA, 2013. [Google Scholar]
  42. Jonkman, B.J. TurbSim User’s Guide: Version 1.50; National Renewable Energy Laboratory (NREL): Golden, CO, USA, 2009.
  43. Wei, T. The Study of Offshore Floating Wind Turbine on a Tension Leg Platform. Master’s Thesis, Jiangsu University of Science and Technology, Jiangsu, China, 2014. [Google Scholar]
  44. Jonkman, J.M. Influence of control on the pitch damping of a floating wind turbine. In Proceedings of the 46th AIAA Aerospace Sciences Meeting and Exhibit, Reno, NV, USA, 7–10 January 2008. [Google Scholar]
  45. Nielsen, F.G.; Hanson, T.D.; Skaare, B. Integrated dynamic analysis of floating offshore wind turbines. In Proceedings of the 25th International Conference on Offshore Mechanics and Arctic Engineering, Hamburg, Germany, 4–9 June 2006. [Google Scholar]
  46. Karimirad, M.; Michailides, C. V-shaped semisubmersible offshore wind turbine: An alternative concept for offshore wind technology. Renew. Energy 2015, 83, 126–143. [Google Scholar] [CrossRef] [Green Version]
Figure 1. A single mooring line with undercover length in a local coordinate system.
Jmse 07 00169 g001
Figure 2. Mooring line discretization and indexing.
Jmse 07 00169 g002
Figure 3. Side (a) and top (b) views of the braceless semi-submersible platform [23].
Jmse 07 00169 g003
Figure 4. Arrangement of the mooring system.
Jmse 07 00169 g004
Figure 5. Layout of the FOWT.
Jmse 07 00169 g005
Figure 6. Overview of FAST used in the fully coupled analysis.
Jmse 07 00169 g006
Figure 7. Panel mesh model of the braceless semi-submersible platform.
Jmse 07 00169 g007
Figure 8. Time histories of surge decay test.
Jmse 07 00169 g008
Figure 9. Power spectra and time histories of the platform motions for different load cases. (a) Time histories of surge motion; (b) power spectra of surge motion; (c) time histories of heave motion; (d) power spectra of heave motion; (e) time histories of pitch motion; (f) power spectra of pitch motion.
Jmse 07 00169 g009aJmse 07 00169 g009b
Figure 10. Comparison of power spectra of motion responses for the rated and over-rated wind speeds. (a) Power spectra of surge motion; (b) power spectra of heave motion; (c) power spectra of pitch motion.
Jmse 07 00169 g010
Figure 11. Comparison of time histories and power spectra of surge motion for the steady and turbulent wind cases. (a) Time histories of surge motion; (b) power spectra of surge motion; (c) time histories of surge motion; (d) power spectra of surge motion.
Jmse 07 00169 g011
Figure 12. Time histories and power spectra of mooring line tension response in the rated wind speed (LC3) case. (a) Time histories of mooring line tension; (b) power spectra of mooring line tension.
Jmse 07 00169 g012
Figure 13. Comparison of motion responses based on the dynamic and quasi-static models. (a) Power spectra of surge motion; (b) power spectra of heave motion; (c) power spectra of pitch motion.
Jmse 07 00169 g013aJmse 07 00169 g013b
Figure 14. Comparison of power spectra of platform motion responses. (a) Power spectra of surge motion for the LC3 case; (b) power spectra of pitch motion for the LC3 case; (c) power spectra of surge motion for the over-rated wind speed (LC6) case; (d) power spectra of pitch motion for the LC6 case.
Jmse 07 00169 g014aJmse 07 00169 g014b
Figure 15. Structural loads diagram of the FOWT system.
Jmse 07 00169 g015
Figure 16. Comparison of the power spectra of RootMyc1 response. (a) Power spectra of RootMyc1 response for the LC3 case; (b) power spectra of RootMyc1 response for the LC6 case.
Jmse 07 00169 g016
Figure 17. Comparison of the power spectra of TwrBsMyt response. (a) Power spectra of TwrBsMyt response for the LC3 case; (b) power spectra of TwrBsMyt response for the LC6 case.
Jmse 07 00169 g017aJmse 07 00169 g017b
Figure 18. Comparison of the power spectra of Mooring line 1 (ML1) tension response. (a) Power spectra of ML1 tension response for the LC3 case; (b) power spectra of ML1 tension response for the LC6 case.
Jmse 07 00169 g018
Table 1. Specifications of the wind turbine [20].
Turbine TypeDTU 10 MWNREL 5 MW
Wind regimeIEC Class 1AIEC Class 1B
Rotor orientation, configurationClockwise, upwind, three bladesClockwise, upwind, three blades
ControlVariable speed, collective pitchVariable speed, collective pitch
Cut-in, rated, cut-out wind speed (m/s)4.0, 11.4, 253.0, 11.4, 25
Rated thrust (kN)1500750
Rotor, hub diameter (m)178.3, 5.6126, 3
Hub height (m)11990
Drive trainMedium speed, multiple-stage gearboxHigh speed, multiple-stage gearbox
Rated generator speed (rpm)480.01173.7
Gearbox ratio50:197:1
Rated tip speed (m/s)9080
Hub overhang(m), shaft tilt (°), precone (°)7.07, 5, −2.55.0, 5, −2.5
Blade prebend (m)3.3320.000
Rotor mass, nacelle mass(t)229.0, 446.0110, 240.0
Table 2. Properties of the tower of the floating offshore wind turbine (FOWT).
Turbine TypeDTU 10 MWNREL 5 MW
Elevation of tower top above SWL (m)115.6387.6
Elevation of tower base above SWL (m)12.3010
Overall tower length (m)103.3377.6
Tower top diameter and thickness (m)5.50, 0.023.87, 0.019
Tower base diameter and thickness (m)8.00, 0.0366.5, 0.027
Tower steel density (kg·m−3)85008500
Overall (integrated) tower mass (t)527.362249.65
Center of gravity above SWL on tower centerline (m)56.0043.35
Table 3. Properties of the platform of the FOWT.
Turbine TypeDTU 10 MWNREL 5 MW
dc (m)86.5
ds (m)86.5
hcu (m)12.3010
hsu(m)24.6020
hb (m)29.5224
dpw (m)11.079
dph (m)7.386
dcs (m)50.4341
dcse (m)55.96545.5
Depth of water (m)100100
COG of the platform during operation phase (m)(0, 0, −30.092)(0, 0, −24.36)
Displacement (m3)19257.1310555
Platform steel density (kg·m−3)78507850
Platform mass, including ballast water (t)17942.219789
Platform steel mass (t)32591804
COG of the platform steel mass(0, 0, −19.089)(0, 0, −12.31)
Table 4. Properties of the mooring system.
Number of the Mooring Line3
Mooring line typeSpiral rope
Transversal drag coefficient1.2
Longitudinal drag coefficient0.02
Transversal added-mass coefficient0
Longitudinal added-mass coefficient1
Length of each line (m)666.5
Mass of per length (kg·m−1)466
Diameter of the mooring line (m)0.153
Equivalent axial stiffness (N)2.5 × 10⁹
Fairlead distance from platform center (m)54.3
Table 5. Natural frequencies of the NREL (National Renewable Energy Laboratory) 5 MW and DTU (Danish University of Science and Technology) 10 MW FOWTs.
Turbine TypeDTU 10 MWNREL 5 MW
Surge/Sway (Hz)0.0130.015
Heave (Hz)0.0360.039
Roll/Pitch (Hz)0.0390.042
Yaw (Hz)0.0120.012
1st tower side-side (Hz)0.3680.436
1st tower fore-aft (Hz)0.3790.442
Minimum rotor speed (rpm)6.06.9
Maximum rotor speed (rpm)9.612.1
Table 6. Definition of load cases.
Load Cases (LCs) Wind   Speed   ( m / s ) Hs (m)Tp (s)Turbulence IntensityTurbine Status
LC111.4---operating
LC2-2.510.2-operating
LC311.42.510.2-operating
LC411.42.510.20.15operating
LC5182.510.2-operating
LC6184.110.5-operating
LC7184.110.50.13operating
Table 7. Statistical results of the platform motions in different cases.
ModeStatisticLC1LC2LC3LC4LC5LC6LC7
Surge (m)Maximum7.770.458.1910.773.974.355.43
Minimum7.72−0.437.311.453.122.721.93
Mean7.75−0.017.766.093.533.533.52
STD0.010.150.151.870.140.250.64
Heave (m)Maximum1.141.611.431.521.551.841.91
Minimum1.060.950.770.820.920.630.60
Mean1.101.281.101.151.231.231.23
STD0.030.110.110.120.110.180.21
Pitch (°)Maximum4.200.074.405.472.142.304.74
Minimum4.20−0.363.991.011.741.63−0.56
Mean4.20−0.144.203.381.941.942.04
STD0.000.080.080.810.080.130.93
Table 8. Comparison of dynamic analysis of mooring lines for the LC3 case.
Surge (m)Heave (m)Pitch (°)Mooring Line Tension (kN)
MeanSTDMeanSTDMeanSTDMeanSTD
Quasi-static7.670.141.060.104.200.081025.582.52
Dynamic7.760.151.100.114.200.081021.155.16
Table 9. Statistics of platform motions of the 5 MW FOWT.
ModeLoad CaseMaximumMinimumMeanSTD
Surge (m)LC36.655.406.010.21
LC64.061.862.960.36
Heave (m)LC30.780.000.340.15
LC61.27−0.400.450.27
Pitch (°)LC33.242.692.970.09
LC61.540.541.040.17
Table 10. Statistics of structural loads of the 5 and 10 MW FOWT.
IssueLoad CaseTurbineMaximumMinimumMeanSTD
RootMyc1 (kN·m)LC35 MW11,030.008957.0010,120.37569.76
10 MW31,700.0026,910.0029,577.441113.86
LC65 MW6459.00 2655.004643.67973.99
10 MW15,980.009524.0012,847.271935.73
Thrust (kN)LC35 MW908.00826.50868.4713.04
10 MW1984.001776.001878.3233.15
LC65 MW548.50378.40467.9326.70
10 MW1211.00785.90997.1371.49
TwrBsFxt (kN)LC35 MW1175.00827.001009.7054.94
10 MW2715.001990.002348.44120.63
LC65 MW724.40163.60454.6492.06
10 MW1731.00518.701111.01199.66
TwrBsMyt (kN·m)LC35 MW87,030.0063,910.0076,202.473709.71
10 MW259,600.00191,000.00224,712.3811,288.86
LC65 MW55,010.0015,760.0035,860.256316.27
10 MW163,800.0049,500.00103,991.0919,004.32
ML1 tension (kN)LC35 MW418.20378.60396.813.28
10 MW1042.001003.001021.155.16
LC65 MW582.70388.00492.566.61
10 MW1431.001312.001368.169.17

