Field Test on Buoyancy Variation of a Subsea Bottom-Supported Foundation Model


Abstract
1. Introduction
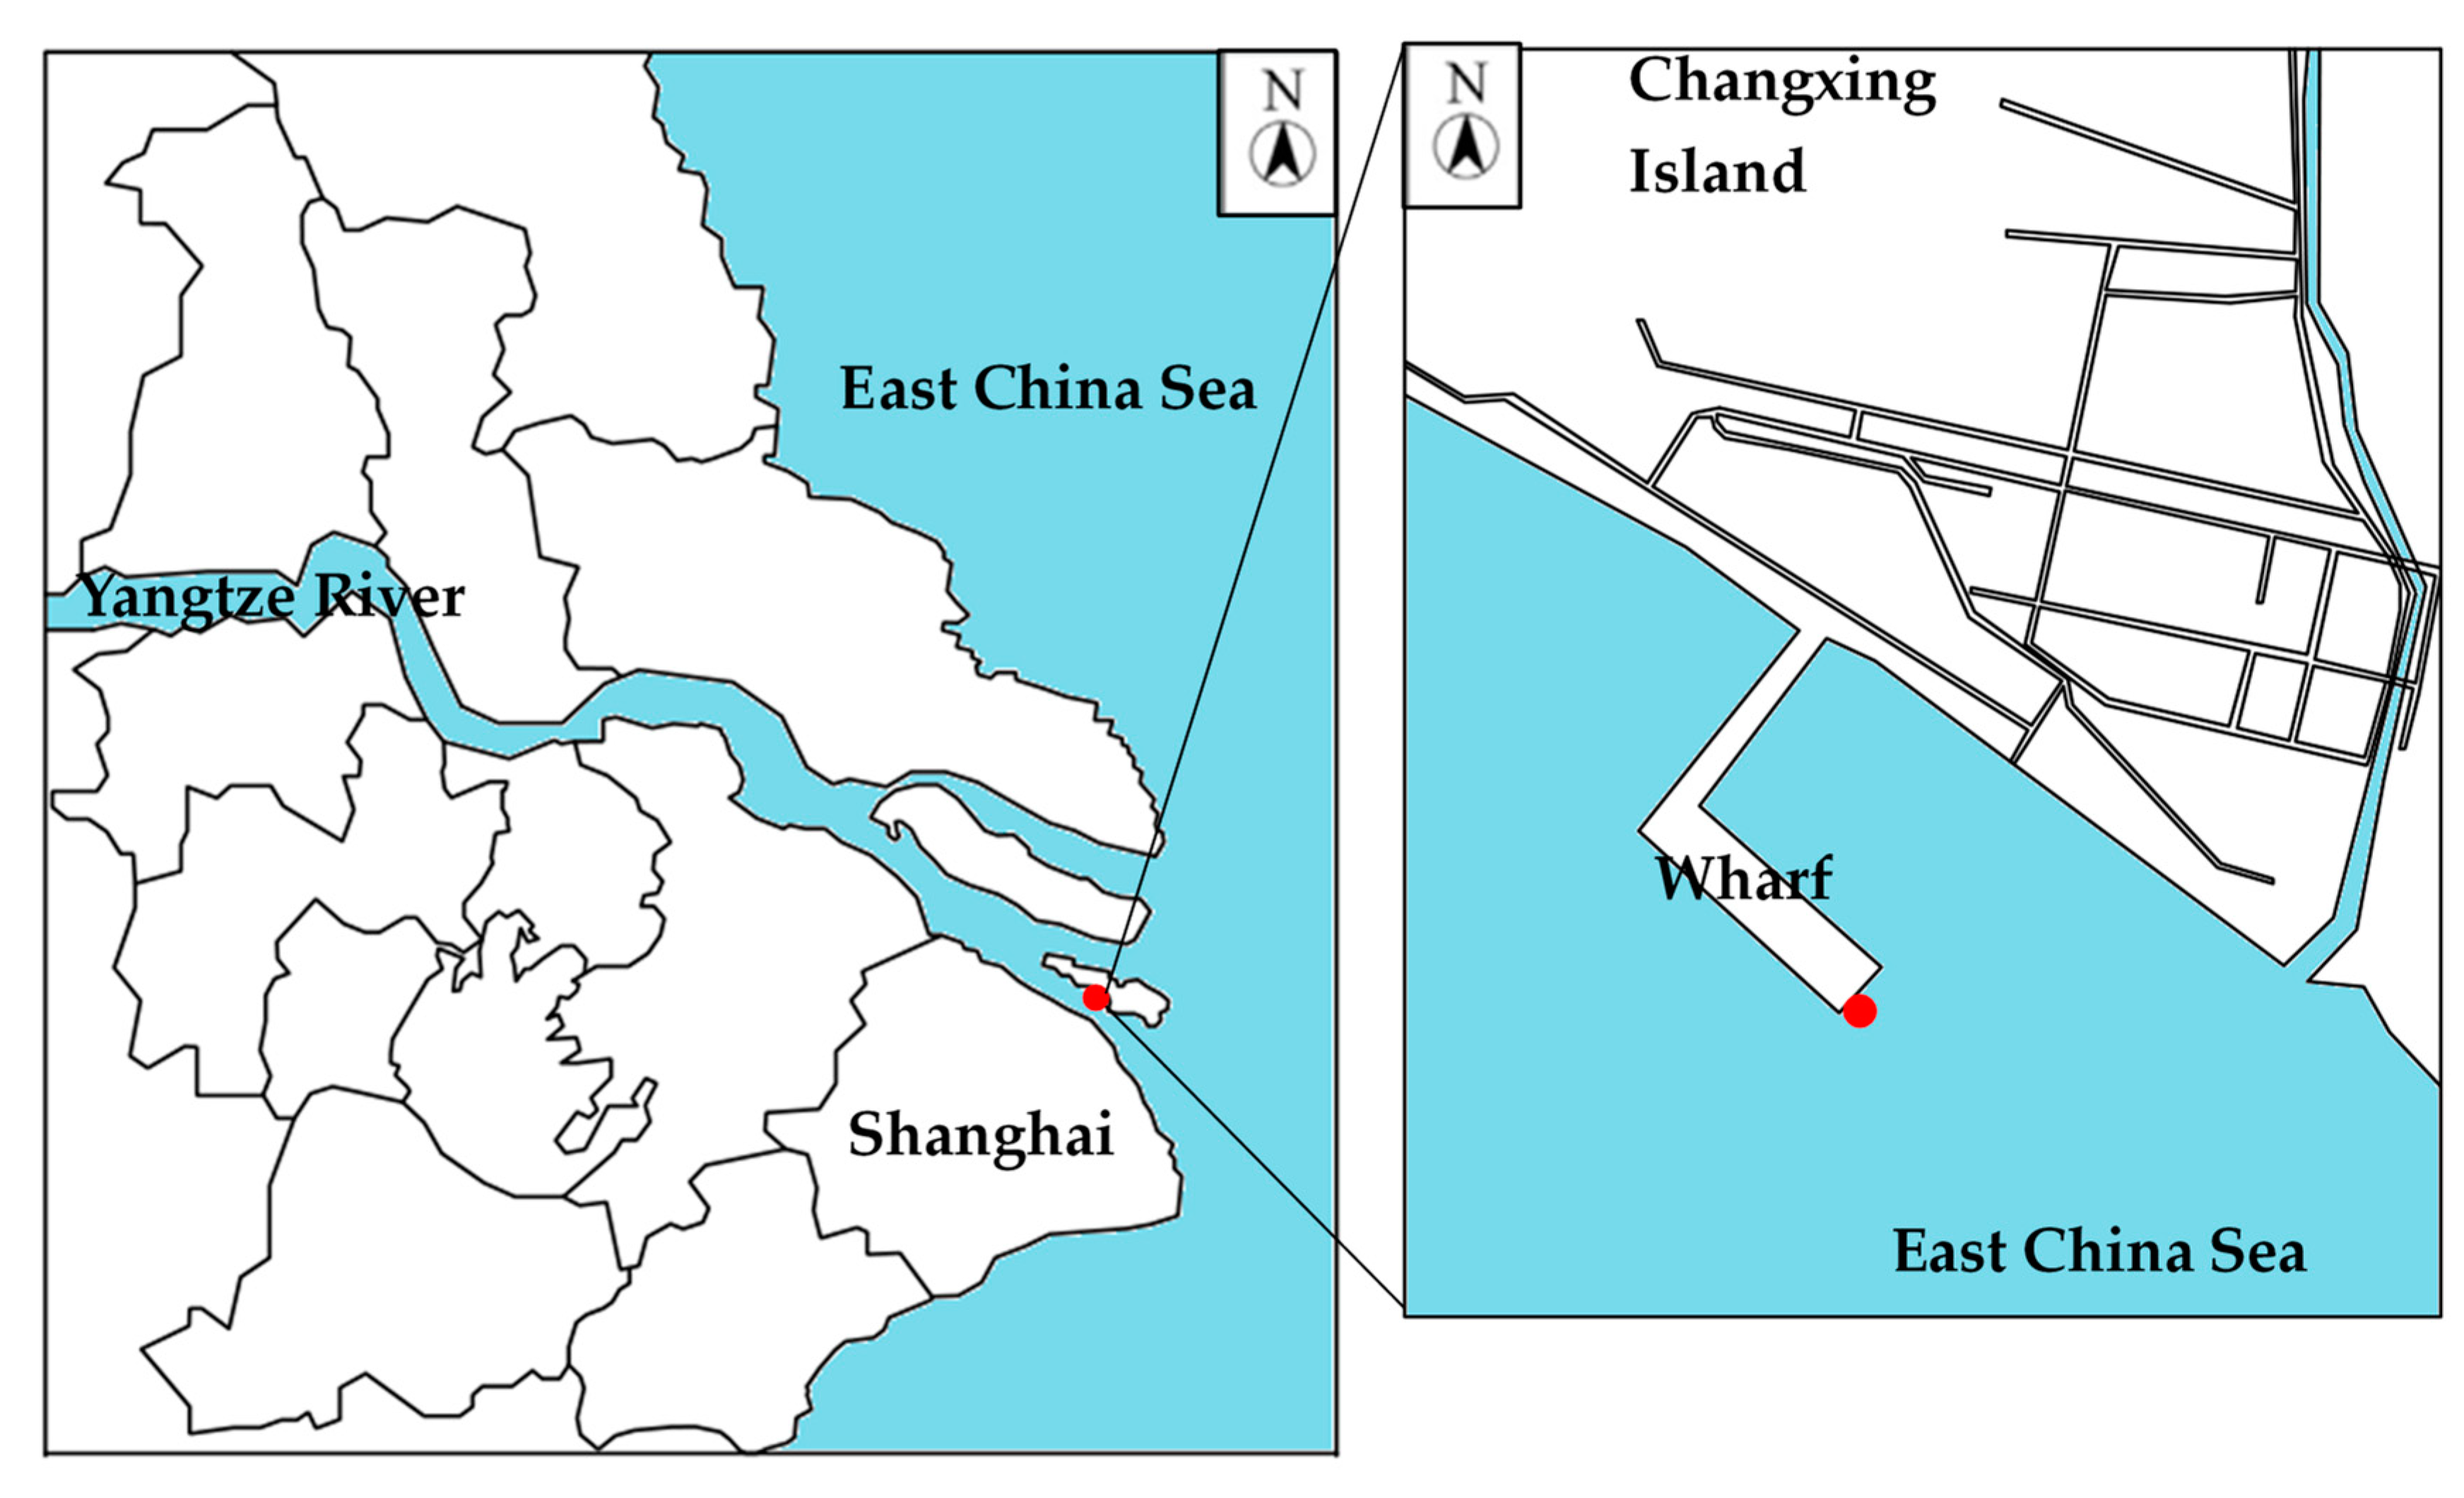
2. Field Tests
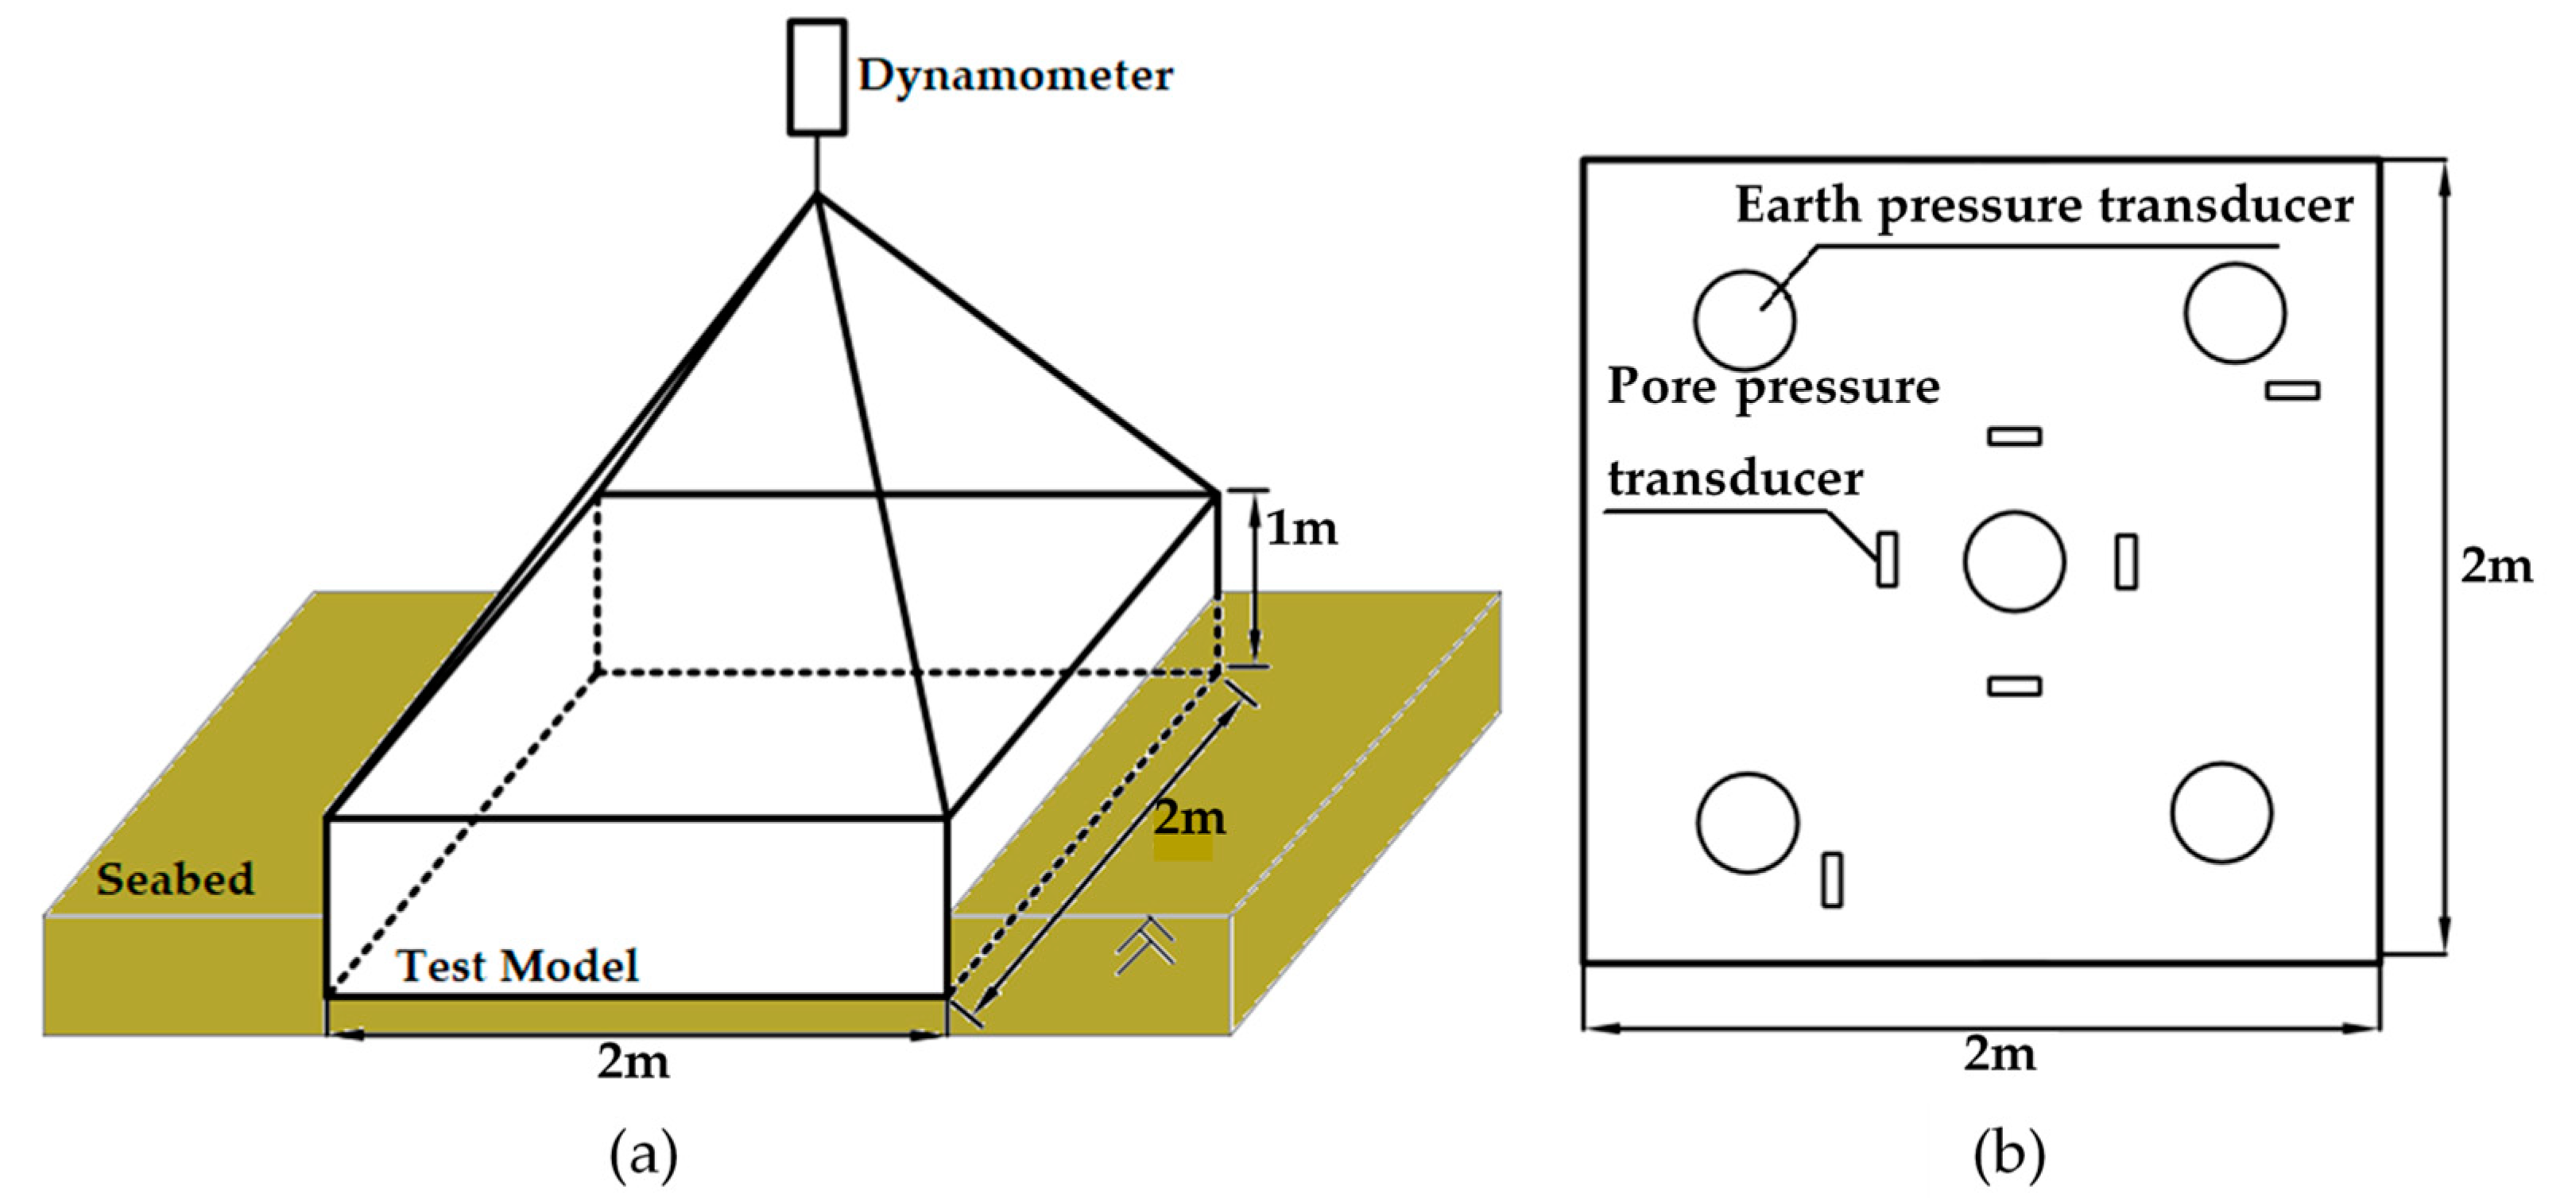
2.1. Test Model
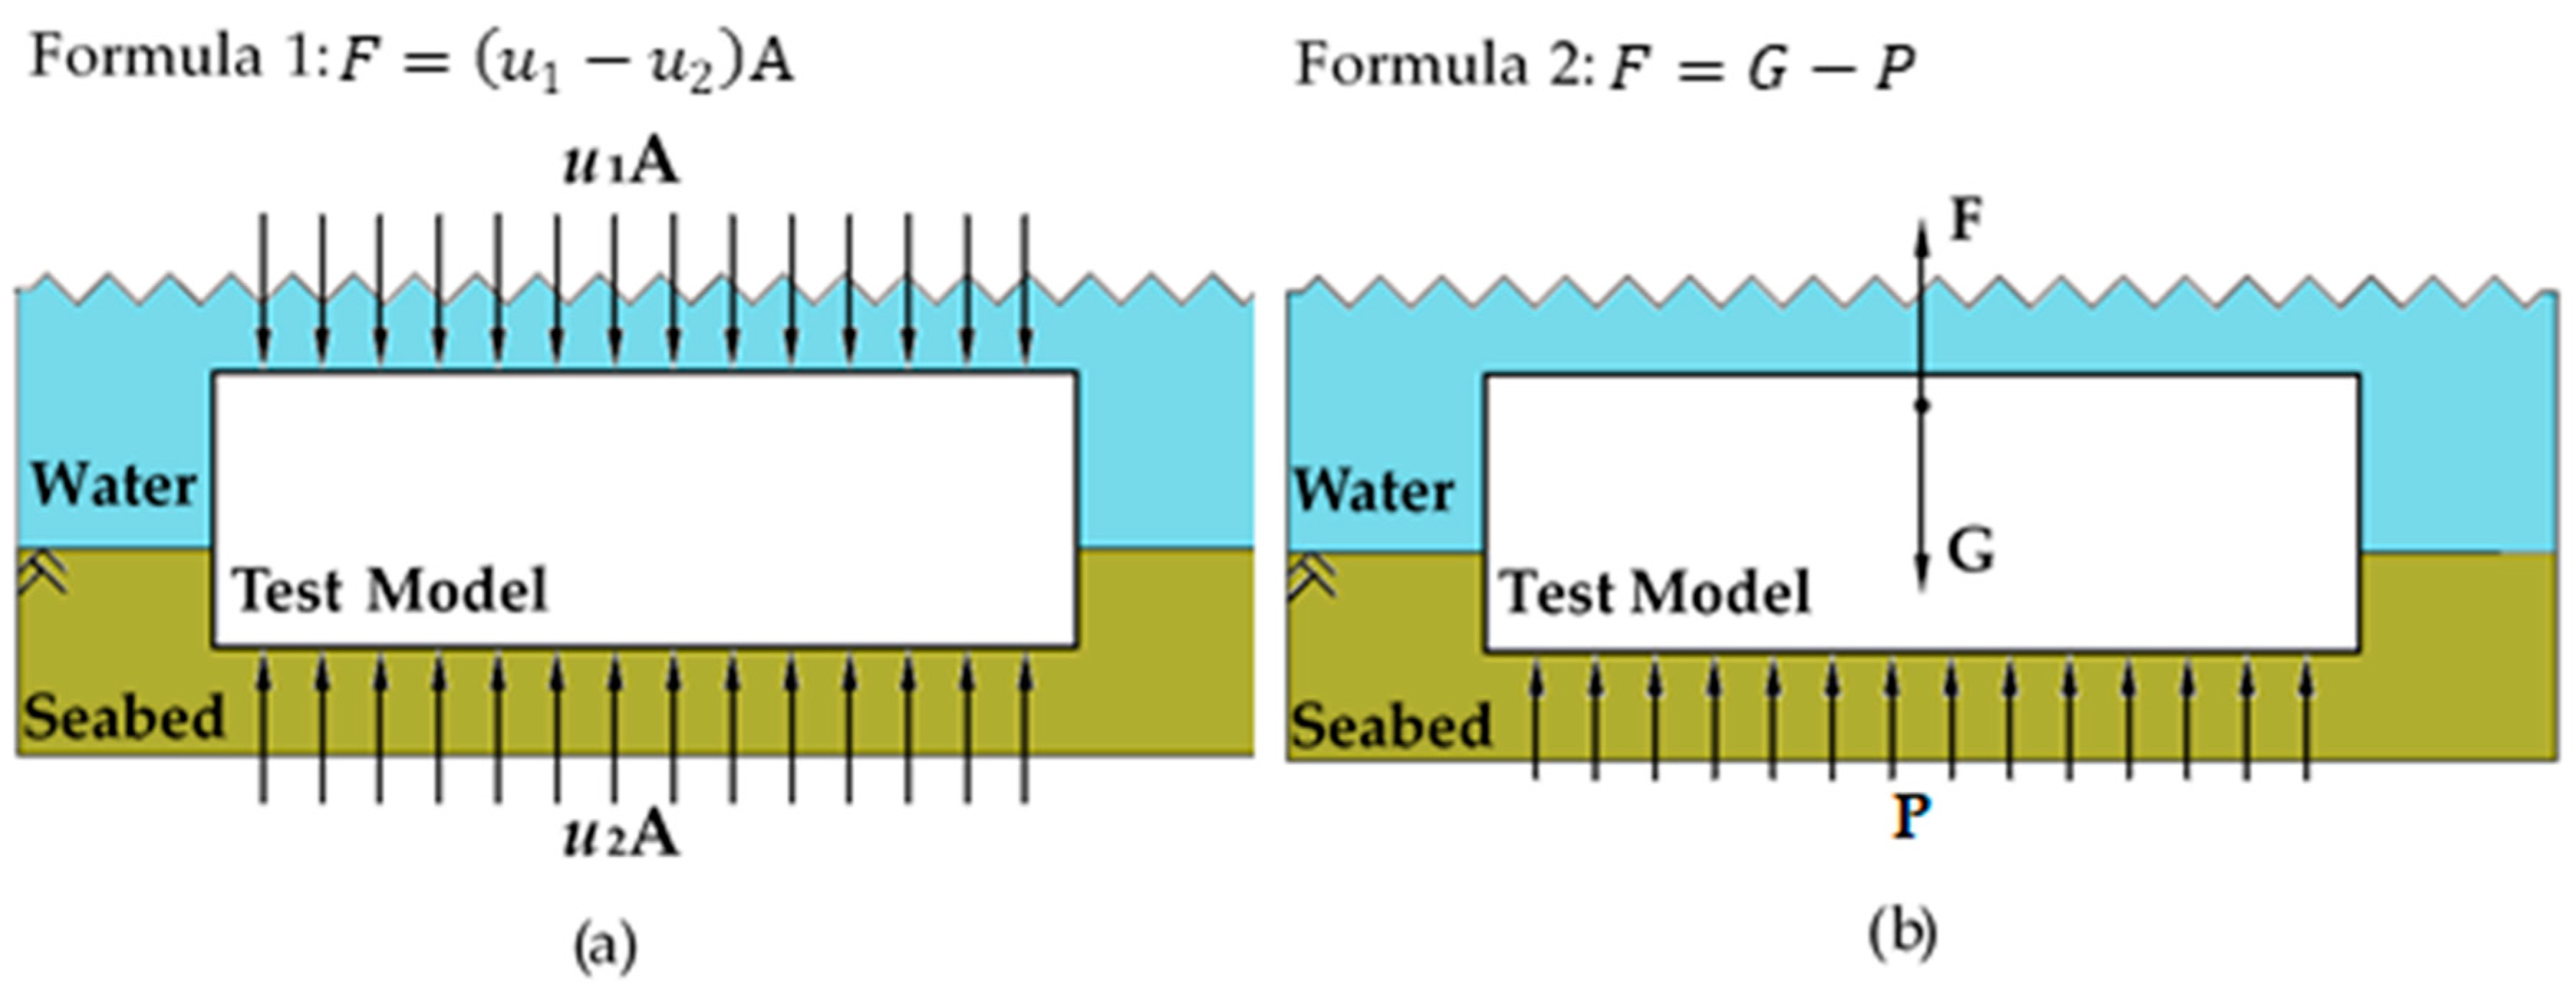
2.2. Test Principles
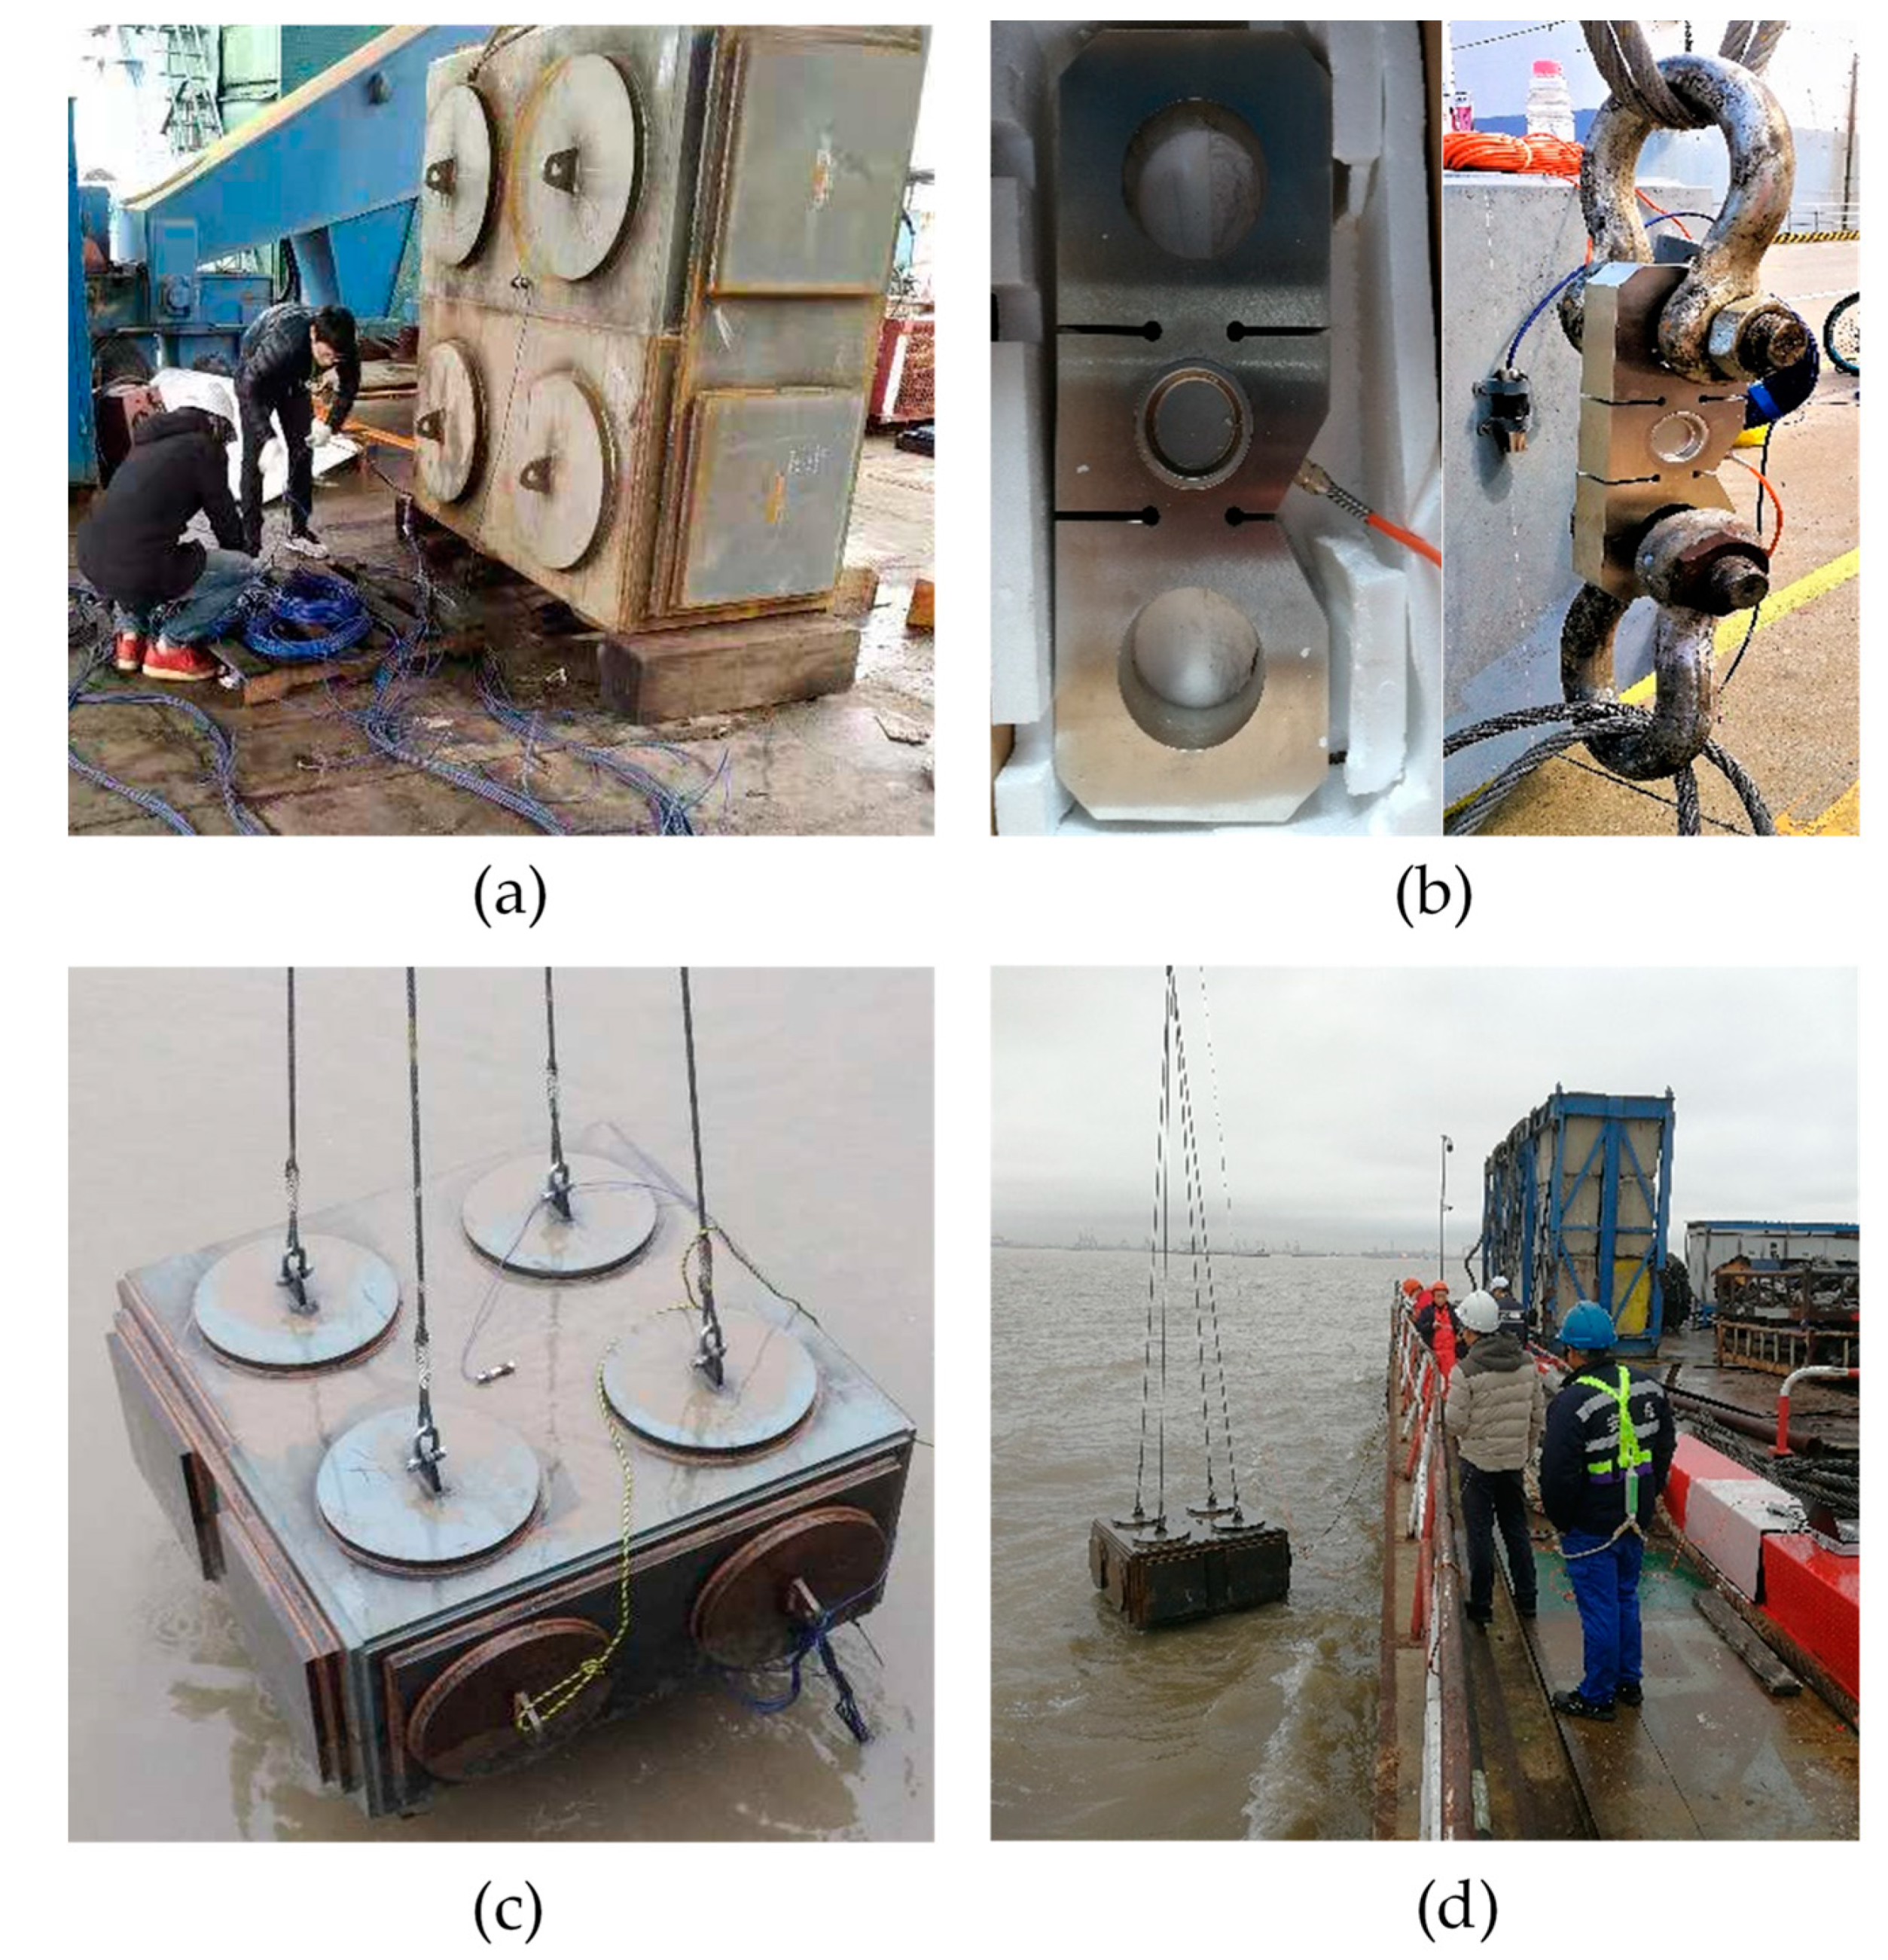
2.3. Test Plan
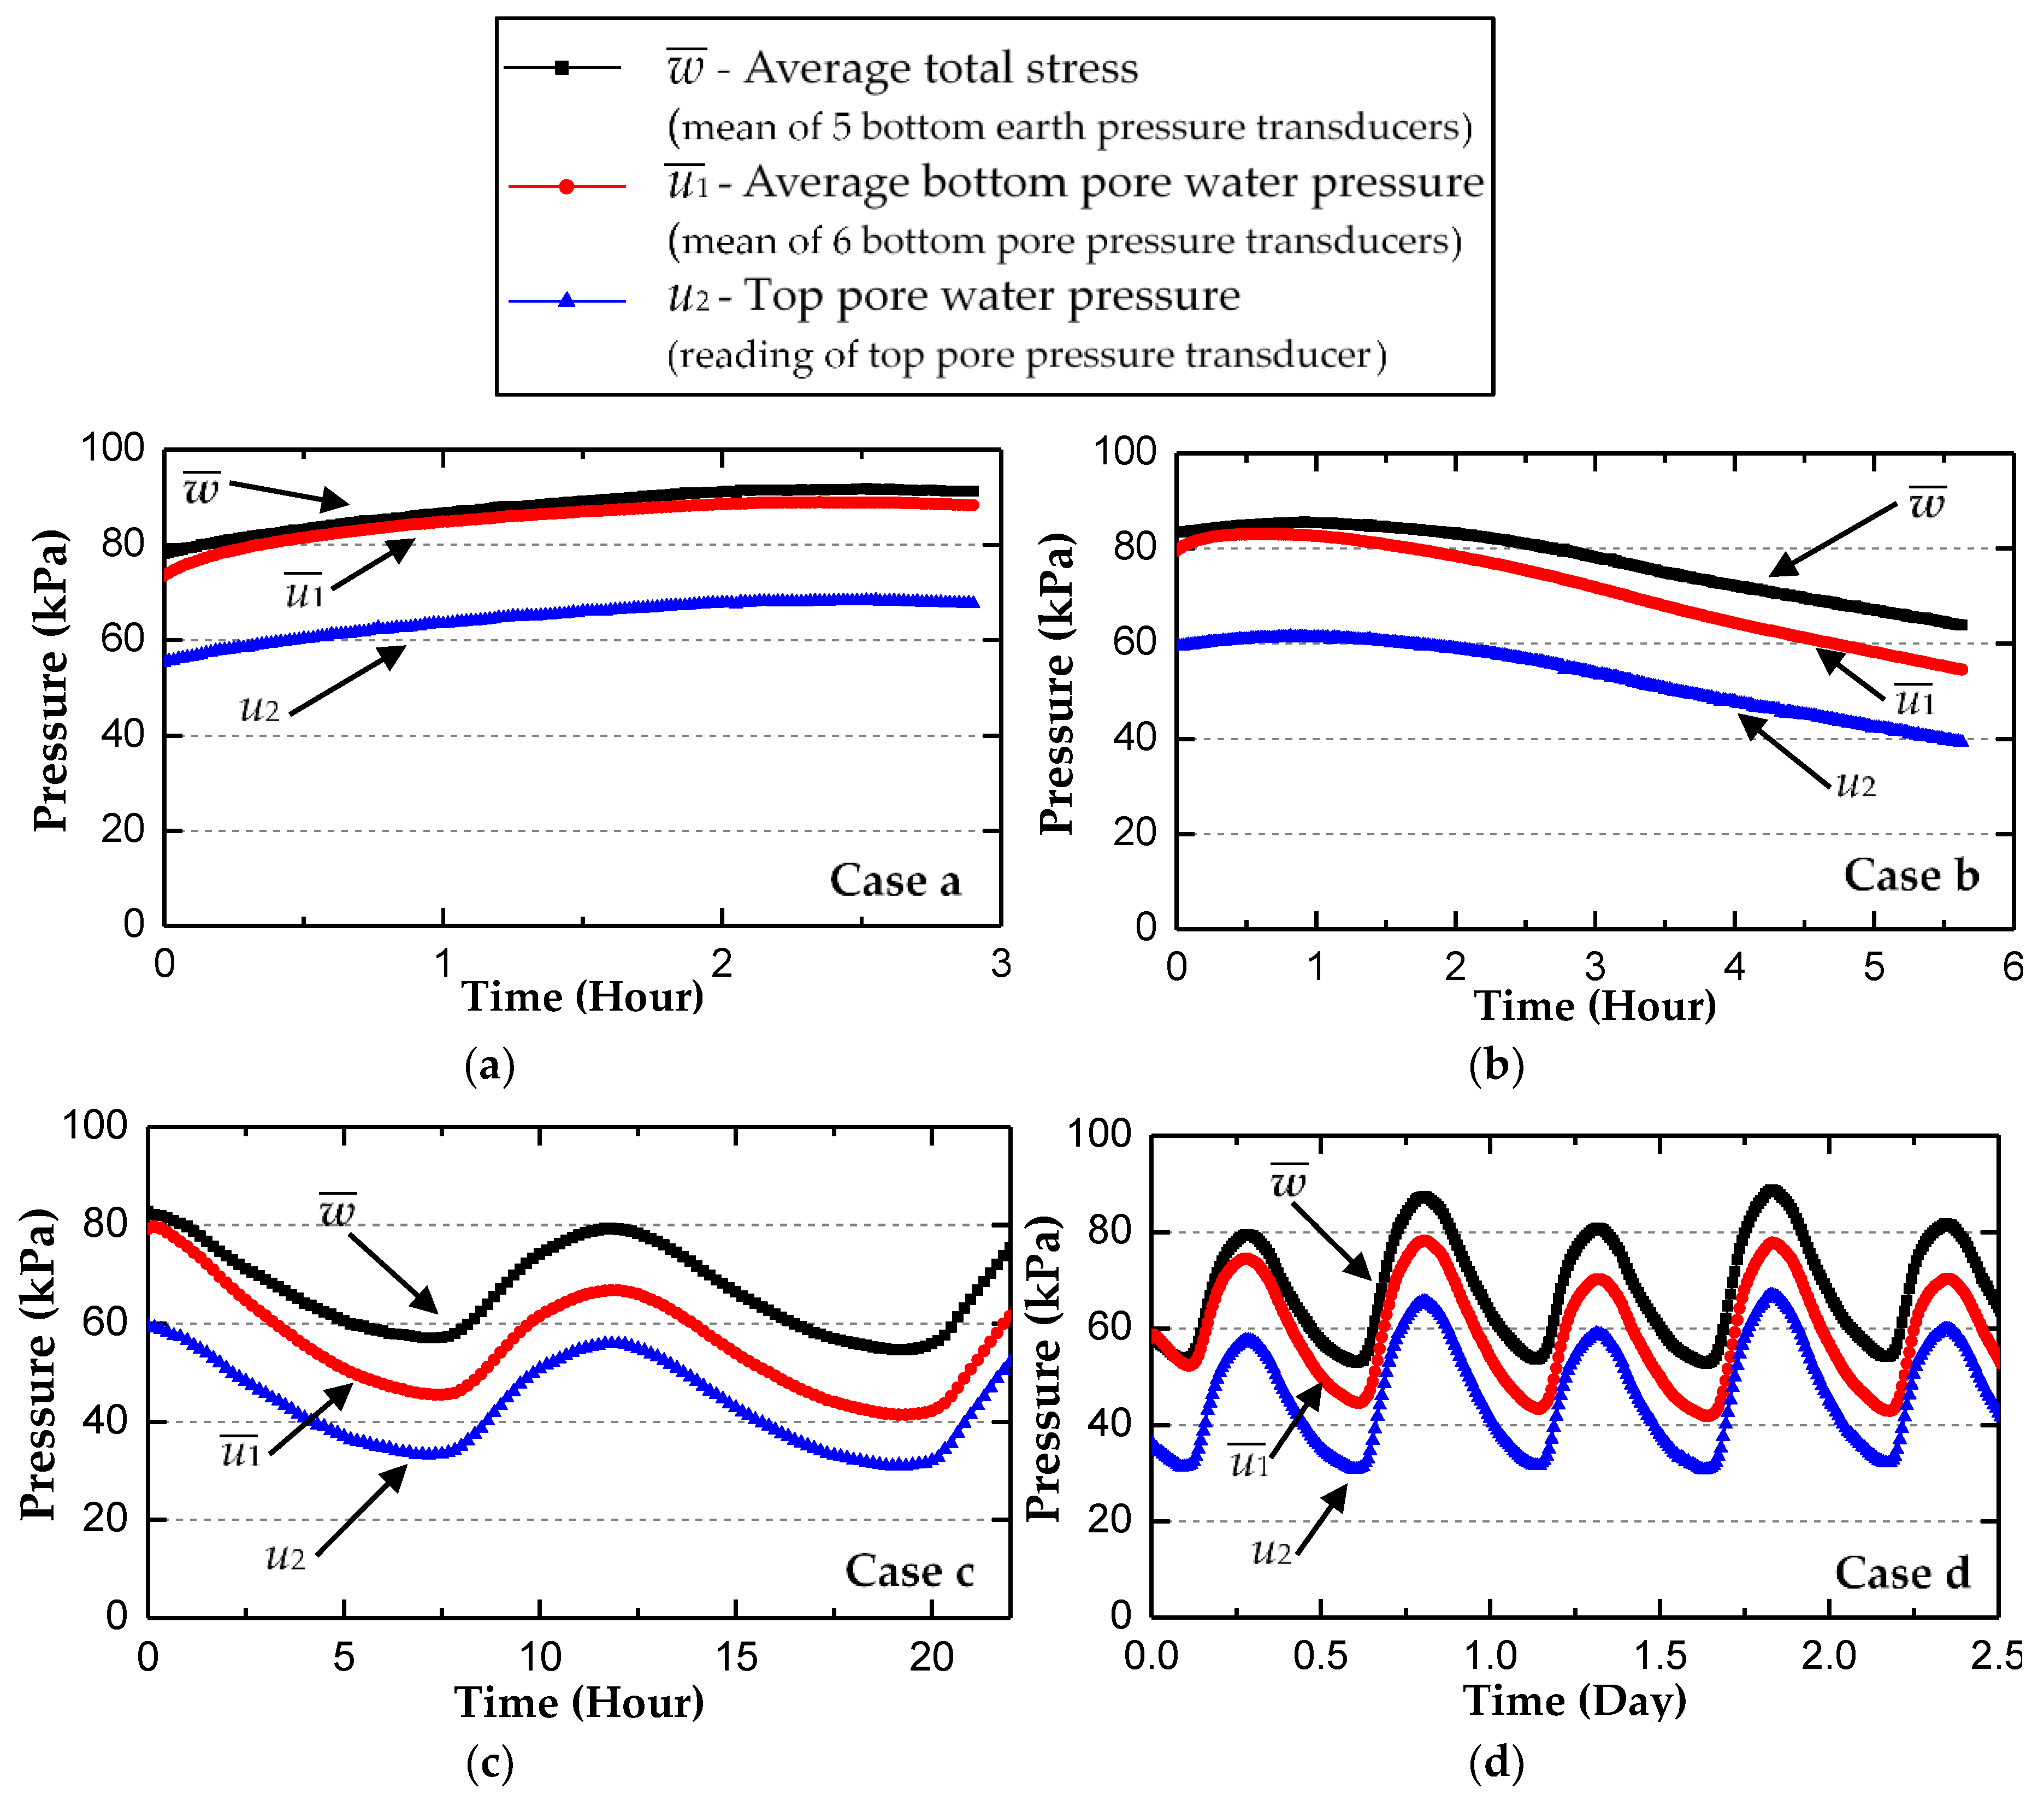
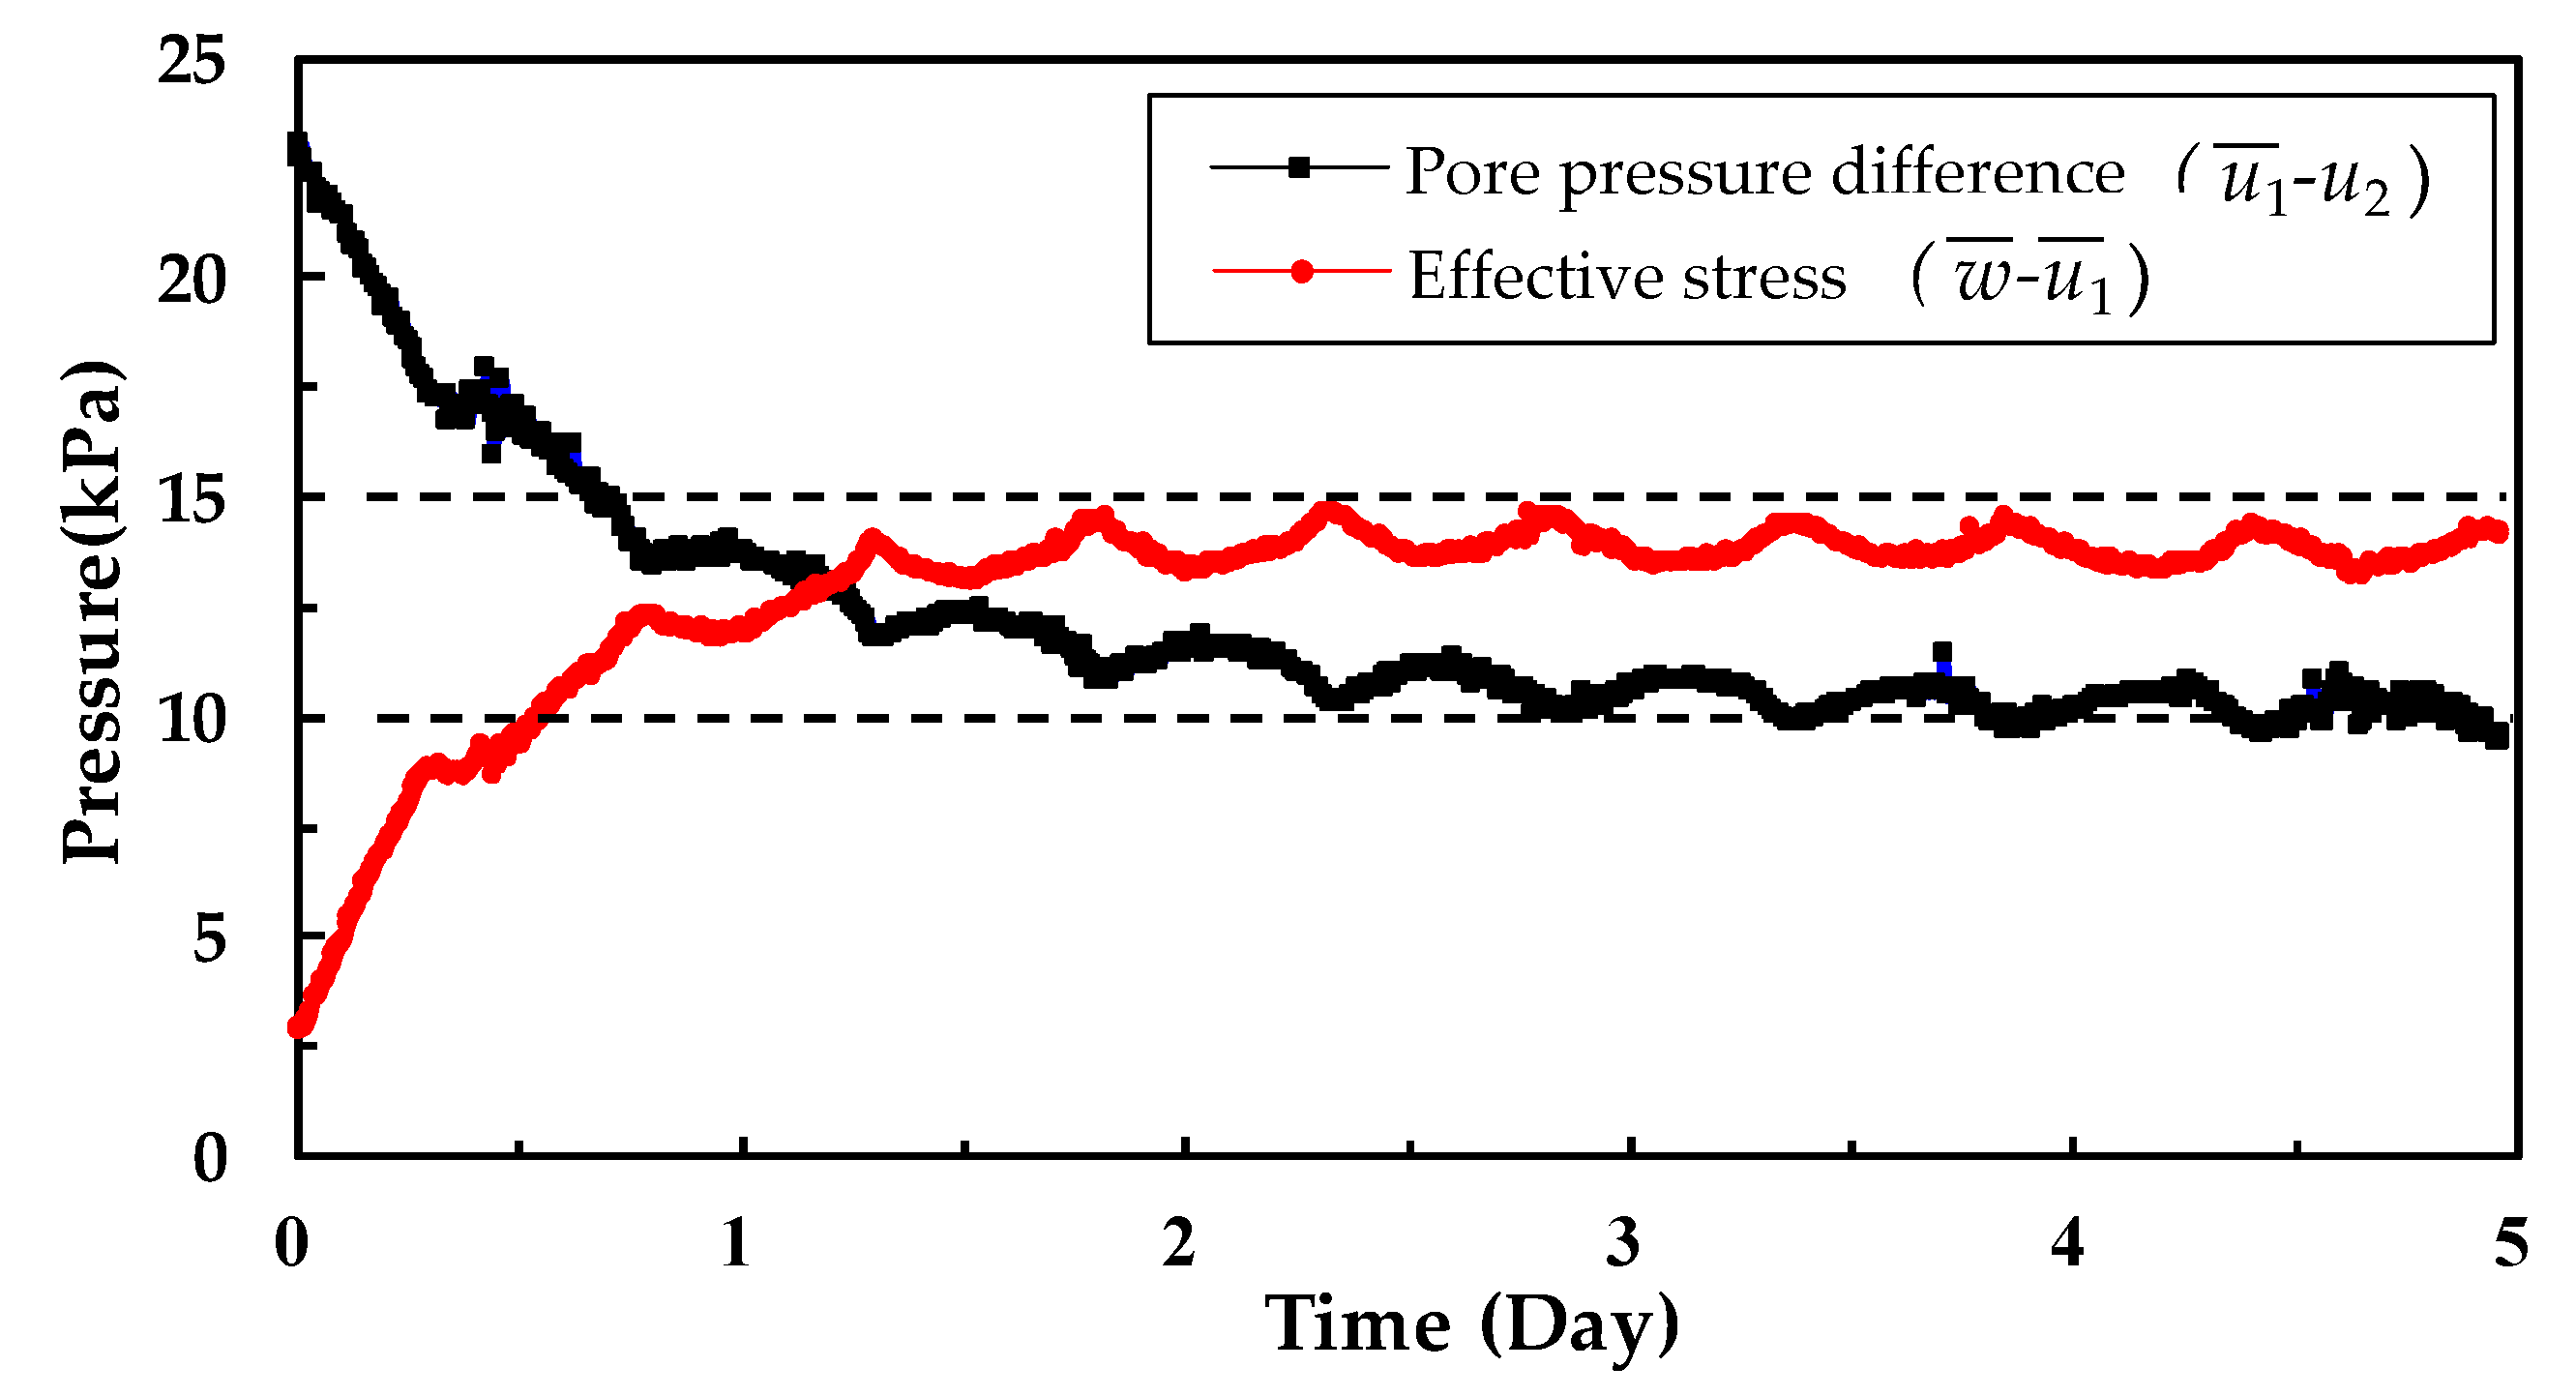
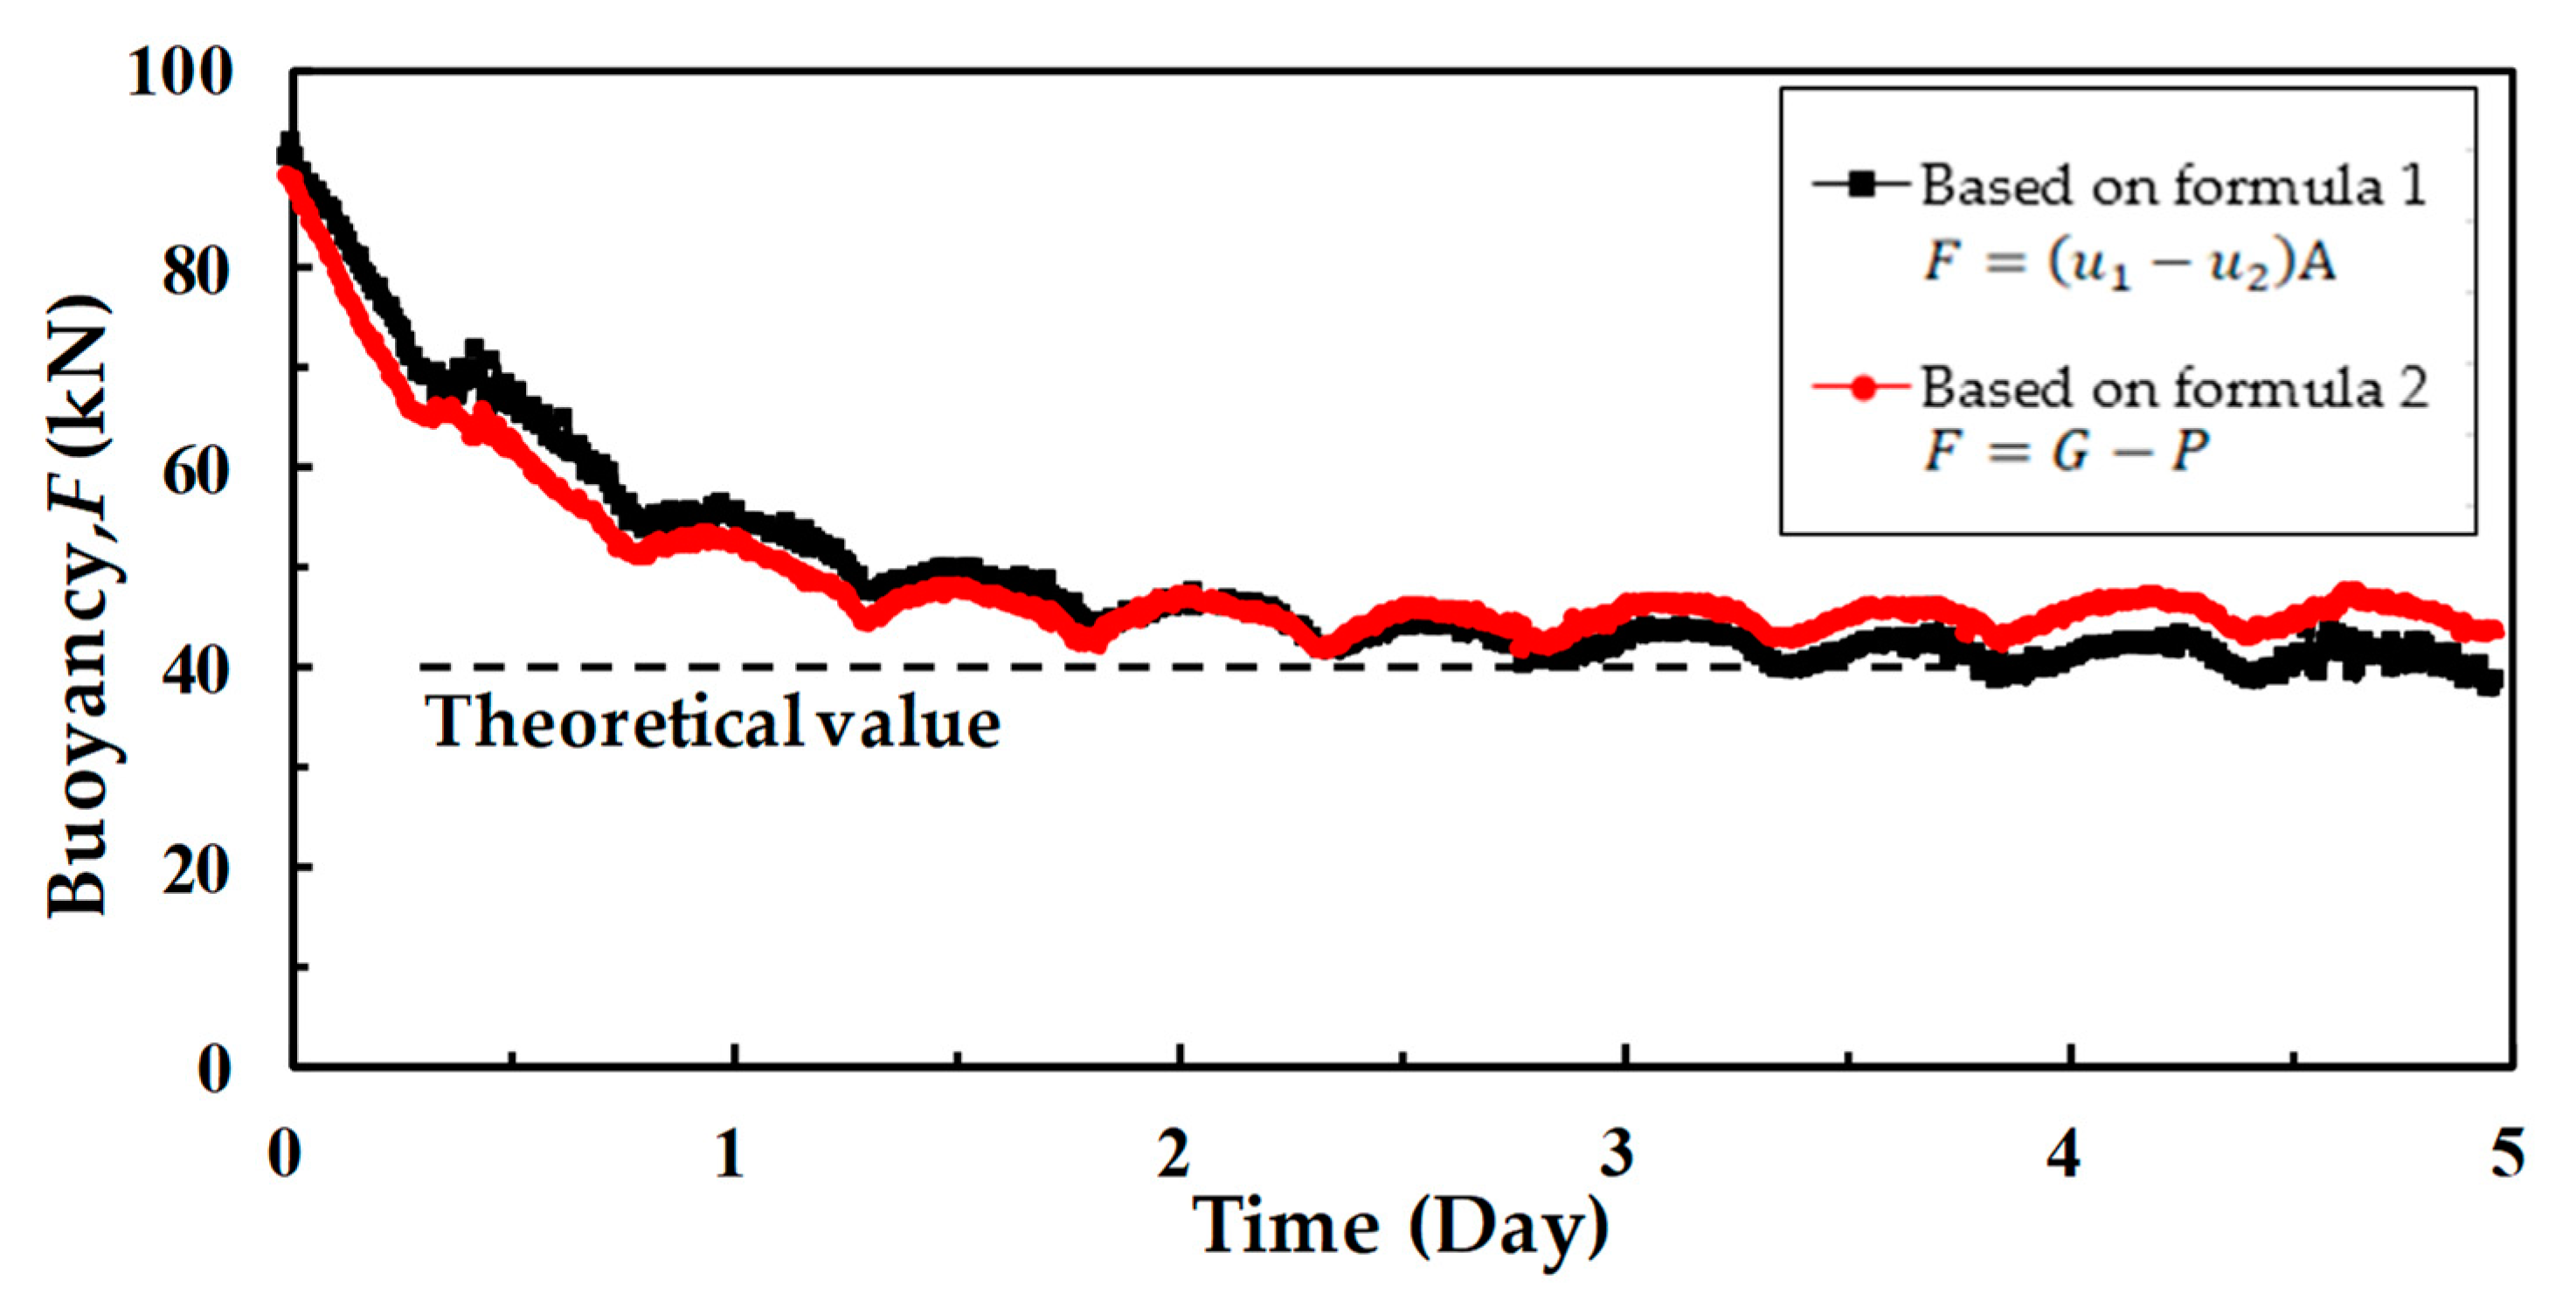
2.4. Tests Results
3. Numerical Simulation
3.1. Soil Property
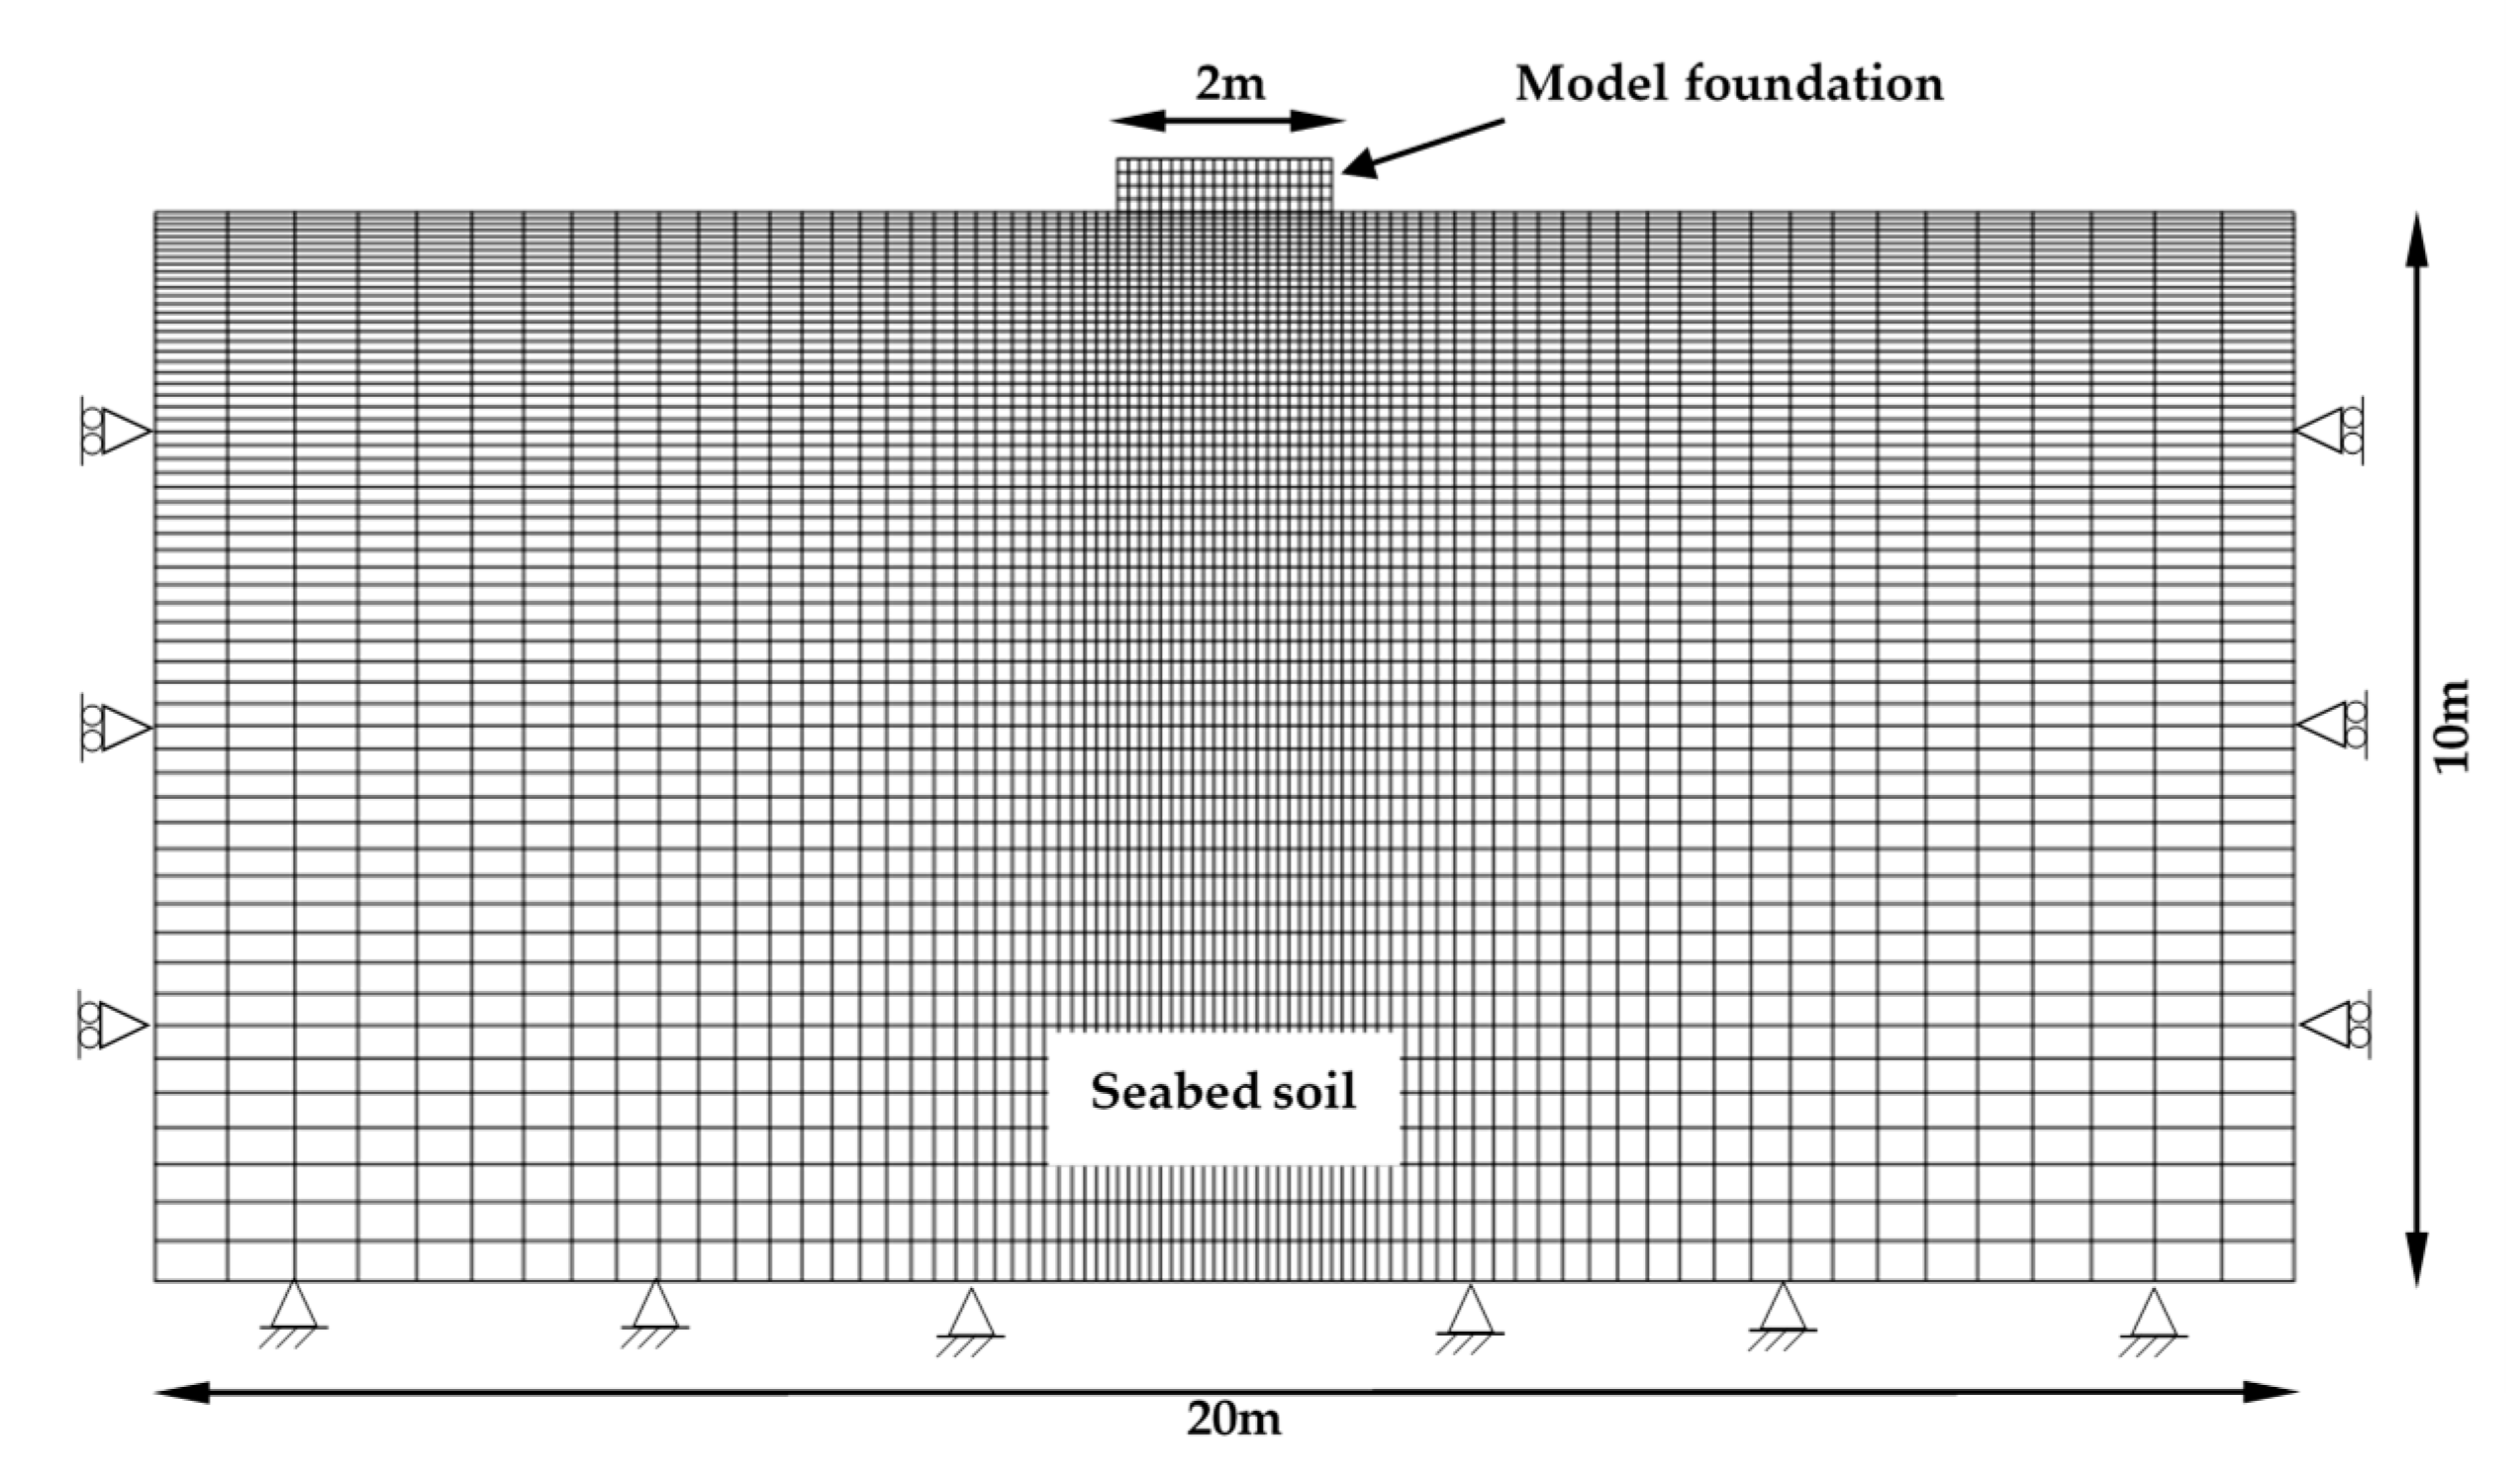
3.2. Model and Mesh
3.3. Comparison between Numerical Analysis and Field Test
4. Conclusions
- (a)
- The model foundation was subjected to buoyancy during the entire sitting time because of the connectivity of the pore water in the seabed to the outside seawater.
- (b)
- At the initial stage of the sitting time, the buoyancy of the model could reach twice the theoretical value. As the sitting time increased, the buoyancy gradually decreased and eventually stabilized near the theoretical value. The fluctuation of buoyancy was due to the difference of the pore pressure response speed between the top and the bottom surfaces when the water level changed. The pore pressure response of the bottom surface had a phase lag relative to that of the upper surface, since the lower half of the model was buried in the lowly permeable seabed.
- (c)
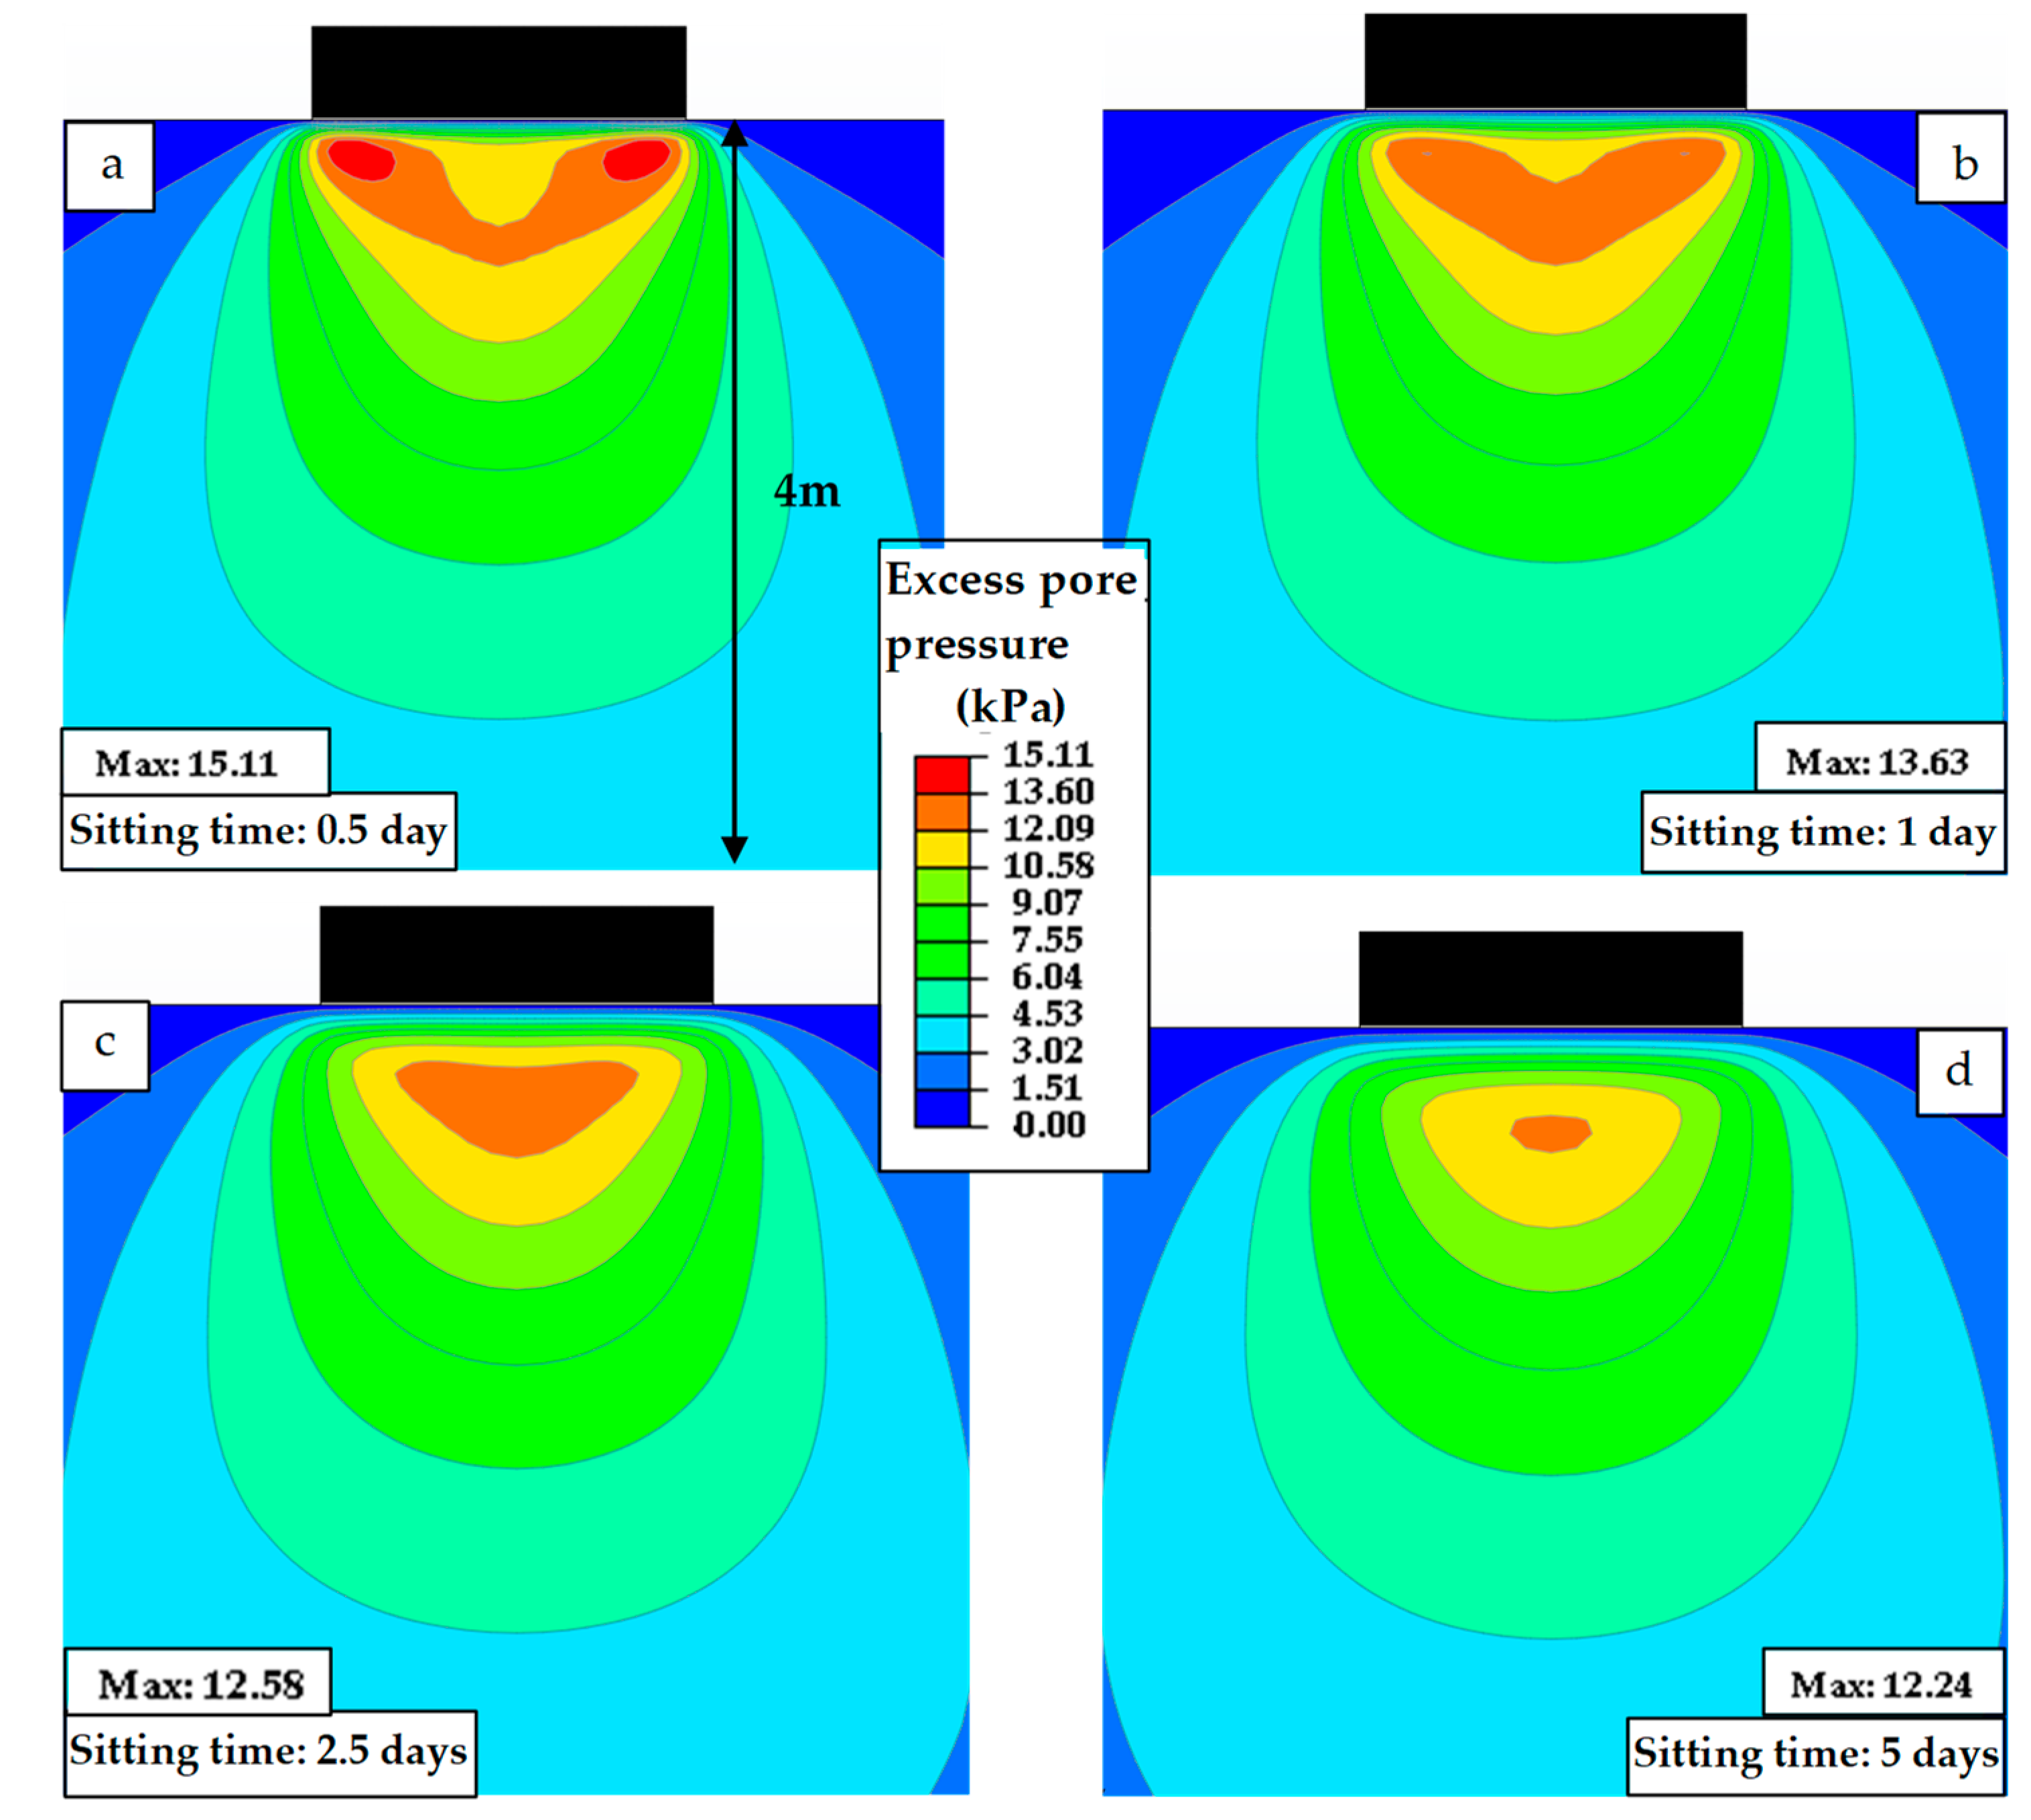
- The soil–water coupled numerical analysis demonstrated that the buoyancy acting on the model was closely related to the pore water pressure at the bottom of the model. The buoyancy reached twice the theoretical value at the beginning as a consequence of the significant excess pore pressure at the bottom. With the dissipation of the excess pore pressure at the surface of the seabed, the buoyancy decreased. The deep excess pore pressure had little effect on the buoyancy acting on the model foundation.
Author Contributions
Funding
Acknowledgments
Conflicts of Interest
References
- Zhang, Q.; Ouyang, L.; Wang, Z.; Liu, H.; Zhang, Y. Buoyancy Reduction Coefficients for Underground Silos in Sand and Clay. Indian Geotech. J. 2018, 49, 1–8. [Google Scholar] [CrossRef]
- Xiang, K.; Zhou, S.; Zhan, C. Model test study of buoyancy on shallow underground structure. J. Tongji Univ. (Nat. Sci.) 2010, 38, 346–357. [Google Scholar] [CrossRef]
- Mohri, Y.; Fujita, N.; Kawabata, T. A Simulation on Uplift Resistance of Buried Pipe by DEM. In Proceedings of the Pipelines 2001: Advances in Pipelines Engineering and Construction, San Diego, CA, USA, 15–18 July 2001; ASCE: Reston, VA, USA, 2004. [Google Scholar]
- Suenaga, S.; Mohri, Y.; Matsushima, K. Performance of Shallow Cover Method with Geogrid at Large Blasting Test. In Proceedings of the Pipeline Engineering and Construction International Conference, Baltimore, Maryland, USA, 13–16 July 2003; ASCE: Reston, VA, USA, 2003. [Google Scholar]
- Chian, S.C.; Tokimatsu, K.; Madabhushi, S.P.G. Soil Liquefaction–Induced Uplift of Underground Structures: Physical and Numerical Modeling. J. Geotech. Geoenviron. Eng. 2014, 140, 1–18. [Google Scholar] [CrossRef]
- Song, L.; Wang, Y.; Fu, L.; Mei, G.X. Test and analysis on buoyancy of underground structure in soft clay. Rock Soil Mech. 2018, 39, 753–758. [Google Scholar] [CrossRef]
- Song, L.; Kang, X.; Mei, G. Buoyancy force on shallow foundations in clayey soil: An experimental investigation based on the “Half Interval Search”. Ocean Eng. 2017, 129, 637–641. [Google Scholar] [CrossRef]
- Achari, G.; Joshi, R.C.; Bentley, L.R.; Chatterji, S. Prediction of the hydraulic conductivity of clays using the electric double layer theory. Canada Geotech. J. 1999, 36, 783–792. [Google Scholar] [CrossRef]
- Singh, P.N.; Wallender, W.W. Effects of Adsorbed Water Layer in Predicting Saturated Hydraulic Conductivity for Clays with Kozeny–Carman Equation. J. Geotech. Geoenv. Eng. 2008, 134, 829–836. [Google Scholar] [CrossRef]
- Zhang, J.; Cao, J.; Mu, L.; Wang, L.; Li, J. Buoyancy Force Acting on Underground Structures considering Seepage of Confined Water. Complexity 2019, 2019, 7672930. [Google Scholar] [CrossRef]
- Gu, X.; Zhou, T.; Cheng, S. The Soft Soil Foundation Consolidation Numerical Simulation Based on the Model of Modified Cam-Clay. Appl. Mech. Mater. 2014, 580, 3223–3226. [Google Scholar] [CrossRef]
- Lim, Y.X.; Tan, S.A.; Phoon, K.-K. Interpretation of horizontal permeability from piezocone dissipation tests in soft clays. Comput. Geotech. 2019, 107, 189–200. [Google Scholar] [CrossRef]
- Zen, K.; Yamazaki, H. Mechanism of wave-induced liquefaction and densification in seabed. Soils Found. 1990, 30, 90–104. [Google Scholar] [CrossRef]
- Yamamoto, T.; Koning, H.L.; Sellmeijer, H.; Hijum, E.V. On the response of a poro-elastic bed to water waves. J. Fluid Mech. 1978, 87, 193–206. [Google Scholar] [CrossRef]
- Liao, C.; Chen, J.; Zhang, Y. Accumulation of pore water pressure in a homogeneous sandy seabed around a rocking mono-pile subjected to wave loads. Ocean Eng. 2019, 173, 810–822. [Google Scholar] [CrossRef]
- Liao, C.; Tong, D.; Chen, L. Pore Pressure Distribution and Momentary Liquefaction in Vicinity of Impermeable Slope-Type Breakwater Head. Appl. Ocean. Res. 2018, 78, 290–306. [Google Scholar] [CrossRef]
- Jeng, D.-S.; Ye, J.H. Three-dimensional consolidation of a porous unsaturated seabed under rubble mound breakwater. Ocean Eng. 2012, 53, 48–59. [Google Scholar] [CrossRef]
- Ye, G.-L.; Leng, J.; Jeng, D.-S. Numerical testing on wave-induced seabed liquefaction with a poro-elastoplastic model. Soil Dyn. Earthq. Eng. 2018, 105, 150–159. [Google Scholar] [CrossRef]
- Zheng, J.-J.; Lu, Y.-E.; Yin, J.-H.; Guo, J. Radial consolidation with variable compressibility and permeability following pile installation. Comput. Geotech. 2010, 37, 408–412. [Google Scholar] [CrossRef]
- Gaudin, C.; Li, X.; Tian, Y.; Cassidy, M.J. About the uplift resistance of subsea structure. In Proceedings of the 19th International Conference on Soil Mechanics and Geotechnical Engineering, Seoul, Korea, 17–21 September 2017; ISSMGE: London, UK, 2017. [Google Scholar]
- Ye, G.; Ye, B. Investigation of the overconsolidation and structural behavior of Shanghai clays by element testing and constitutive modeling. Undergr. Space 2016, 1, 62–77. [Google Scholar] [CrossRef]
- Zhang, S.; Ye, G.; Wang, J. Elastoplastic Model for Overconsolidated Clays with Focus on Volume Change under General Loading Conditions. Int. J. Geomech. 2018, 18, 1–14. [Google Scholar] [CrossRef]
- Zhang, S.; Ye, G.; Liao, C.; Wang, J. Elasto-plastic model of structured marine clay under general loading conditions. Appl. Ocean. Res. 2018, 76, 211–220. [Google Scholar] [CrossRef]
- Li, X.; Tian, Y.; Gaudin, C.; Cassidy, M.J. Comparative study of the compression and uplift of shallow foundations. Comput. Geotech. 2015, 69, 38–45. [Google Scholar] [CrossRef]
- Yadav, S.K.; Ye, G.-L.; Xiong, Y.-L.; Khalid, U. Unified numerical study of shallow foundation on structured soft clay under unconsolidated and consolidated-undrained loadings. Mar. Georesour. Geotech. 2019, 1–17. [Google Scholar] [CrossRef]


| Test Case | a | b | c | d | e |
|---|---|---|---|---|---|
| Sitting time | 3 h | 6 h | 22 h | 2.5 days | 5 days |
| Sampling frequency | every 1 min | every 1 min | every 10 min | every 10 min | every 10 min |
| Parameter | Symbol | Value |
|---|---|---|
| Slope of normally consolidated line in e − ln p’ space | λ | 0.2 |
| Slope of swelling and recompression line in e − ln p’ space | κ | 0.04 |
| Slope of critical state line in p’ − q space | M | 1.2 |
| Poisson’s ratio | ν | 0.3 |
| Void ratio at p’ = 1 kPa on critical line | ecs | 1.28 |
| Permeability | k (m/s) | 10−9 |
| Saturated bulk density of soil, | γ (kN/m3) | 18 |
| Coefficient of earth pressure | K0 | 0.6 |
© 2019 by the authors. Licensee MDPI, Basel, Switzerland. This article is an open access article distributed under the terms and conditions of the Creative Commons Attribution (CC BY) license (http://creativecommons.org/licenses/by/4.0/).
Share and Cite
Fang, T.; Liu, G.; Ye, G.; Pan, S.; Shi, H.; Zhang, L. Field Test on Buoyancy Variation of a Subsea Bottom-Supported Foundation Model. J. Mar. Sci. Eng. 2019, 7, 143. https://doi.org/10.3390/jmse7050143
Fang T, Liu G, Ye G, Pan S, Shi H, Zhang L. Field Test on Buoyancy Variation of a Subsea Bottom-Supported Foundation Model. Journal of Marine Science and Engineering. 2019; 7(5):143. https://doi.org/10.3390/jmse7050143
Chicago/Turabian StyleFang, Tianyi, Guojun Liu, Guanlin Ye, Shang Pan, Haibin Shi, and Lulu Zhang. 2019. "Field Test on Buoyancy Variation of a Subsea Bottom-Supported Foundation Model" Journal of Marine Science and Engineering 7, no. 5: 143. https://doi.org/10.3390/jmse7050143
APA StyleFang, T., Liu, G., Ye, G., Pan, S., Shi, H., & Zhang, L. (2019). Field Test on Buoyancy Variation of a Subsea Bottom-Supported Foundation Model. Journal of Marine Science and Engineering, 7(5), 143. https://doi.org/10.3390/jmse7050143