Article

KNSwing—On the Mooring Loads of a Ship-Like Wave Energy Converter

1
Ramboll Group A/S, Hannemanns Allé 53, DK-2300 Copenhagen S, Denmark
2
Department of Civil Engineering, Aalborg University, Thomas Manns Vej 23, 9220 Aalborg Ø, Denmark
*
Author to whom correspondence should be addressed.
J. Mar. Sci. Eng. 2019, 7(2), 29; https://doi.org/10.3390/jmse7020029
Submission received: 10 January 2019 / Revised: 23 January 2019 / Accepted: 26 January 2019 / Published: 1 February 2019
(This article belongs to the Special Issue Advances in Ocean Wave Energy Conversion)

Abstract

:
The critical function of keeping a floating Wave Energy Converter in position is done by a mooring system. Several WECs have been lost due to failed moorings, indicating that extreme loads, reliability and durability are very important aspects. An understanding of the interaction between the WEC’s motion in large waves and the maximum mooring loads can be gained by investigating the system at model scale supported by numerical models. This paper describes the testing of a novel attenuator WEC design called KNSwing. It is shaped like a ship facing the waves with its bow, which results in low mooring loads and small motions in most wave conditions when the structure is longer than the waves. The concept is tested using an experimental model at scale 1:80 in regular and irregular waves, moored using rubber bands to simulate synthetic moorings. The experimental results are compared to numerical simulations done using the OrcaFlex software. The experimental results show that the WEC and the mooring system survives well, even under extreme and breaking waves. The numerical model coefficient concerning the nonlinear drag term for the surge motion is validated using decay tests. The numerical results compare well to the experiments and, thereby, the numerical model can be further used to optimize the mooring system.

1. Introduction

Ocean wave energy has the potential to contribute to carbon-free energy production, on the order of 10–25% of current global electricity consumption. A detailed description of the resource is given in [1].
Large-scale exploitation of wave energy will most likely progress gradually from breakwater-based and nearshore devices (e.g., shoreline Oscillating Water Columns (OWC)) to smaller- and finally larger-scale WEC’s at deep-water sites. Wave energy converter (WEC) technology is, however, still relatively young and must overcome significant hurdles before achieving economically competitive designs. One of the design challenges is the mooring design, which keeps the WEC in position. In deep water, attenuator devices (long ship-like structures oriented parallel to the main direction of wave propagation) can theoretically have high energy absorption and low mooring loads. The low mooring loads are due to the exploitation of internal (non-rigid-body mode) degrees of freedom and a subsequent cancelation of forces along the hull. The degrees of freedom which are used to extract energy from the waves can be hinged motions [2] individual mechanical oscillators [3], or OWC chambers such as presented in Moody’s I-Beam Attenuator [4] or the Japanese Kaimei experiment under IEA (Japan) [5,6]. OWC chambers have the additional attractive feature of having no moving parts in the water, albeit at the expense of a generally reduced Power Take Off (PTO) conversion efficiency associated with existing air turbines compared to hydraulic systems.
This paper presents a study on the mooring loads of a ship shaped attenuator WEC, moored to face the incoming waves with its bow, called KNSwing. The concept is related to Kaimei and the I-Beam attenuator and was tested in 2013 at small scale at the 1m deep HMRC basin Ireland, with focus on energy performance and energy production. A summary is given in the Marinet user report [7] and further concept and development descriptions are described in [8,9]. A second round of testing was performed at the 0.55 m deep QUB water basin in Portaferry in 2015 to complement the performance measurements with survivability tests and initial mooring designs [10].
This paper is based on these experimental results from Portaferry in November 2015 with specific focus on the mooring system, compared to numerical simulations prepared as part of the Danish research project Mooring Solutions for Large Wave Energy Converters (MSLWEC) [11], examining new mooring systems solutions using a turret mooring system with synthetic ropes.
The paper is structured with this introductory section, followed by a section describing the KNSwing, previous investigations and conclusions. Subsequently, the test setup is described with a presentation of the experimental results. The paper presents the numerical model and compares results between experiments and simulations. Finally, conclusions are drawn with respect to loads scaled up to full scale at the Danish test site DanWEC or the Danish central part of the North Sea.

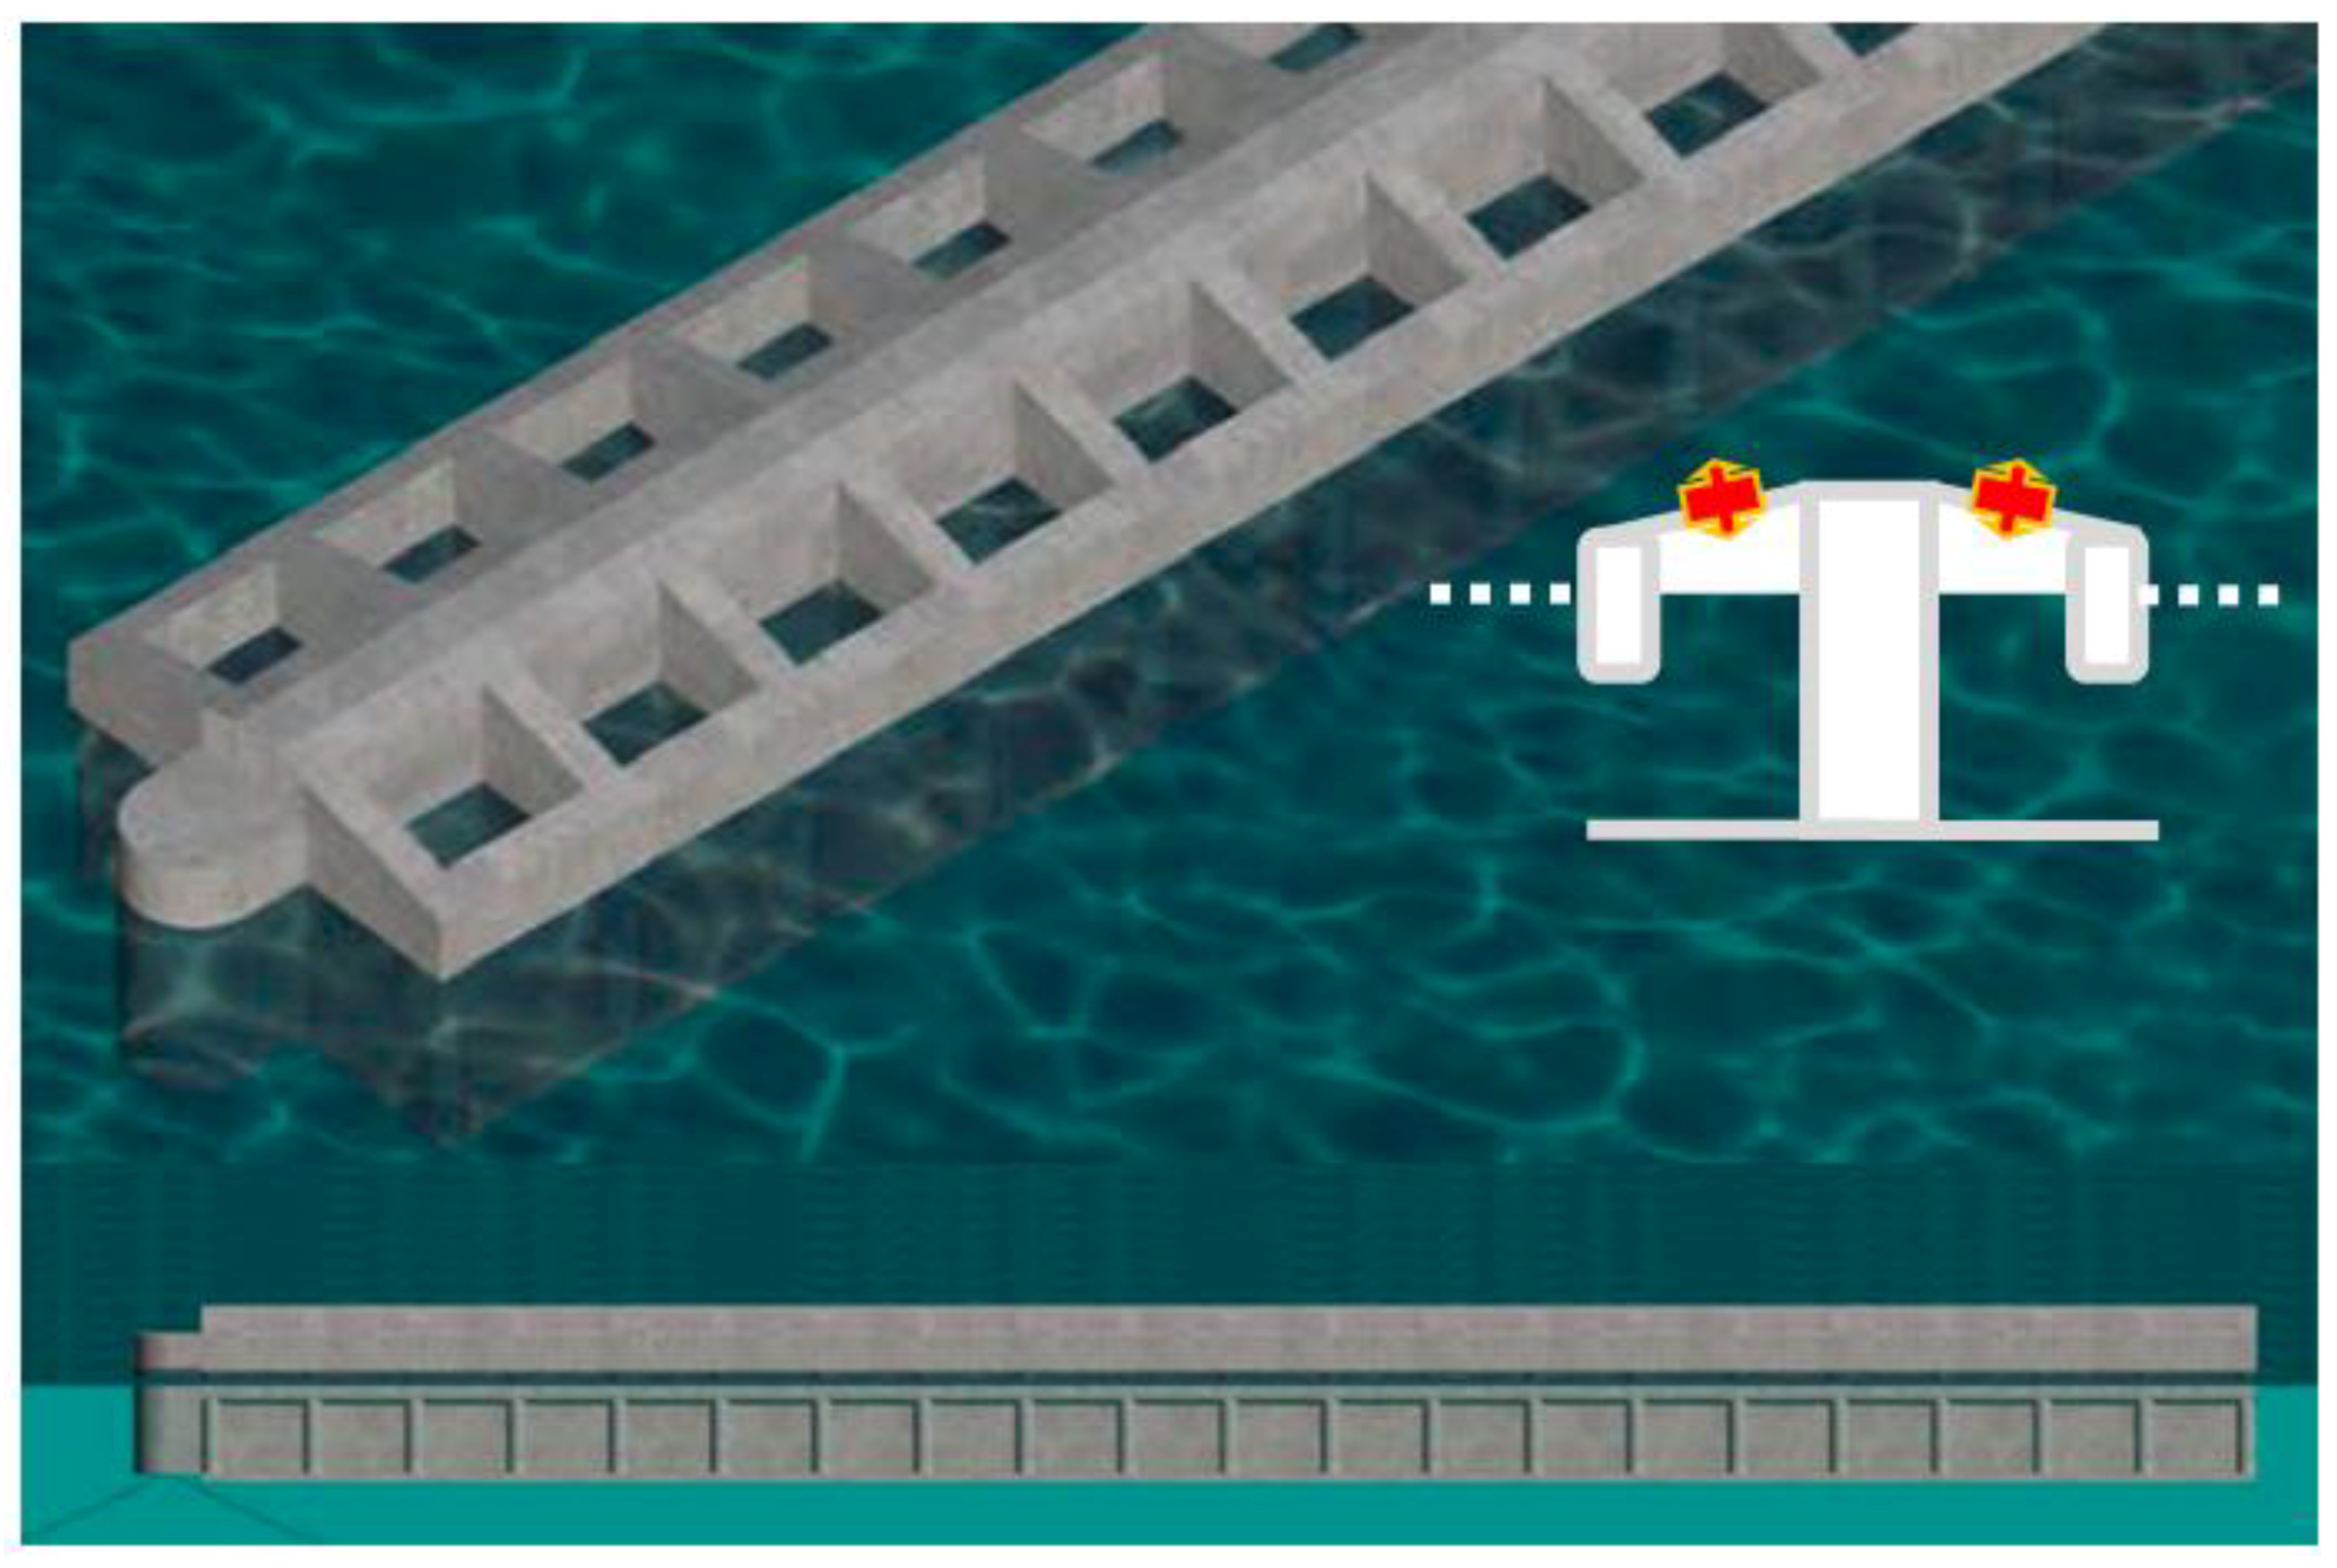
2. Preliminary Design of the KNSWING

The KNSWING shown in Figure 1 is a long ship-like structure with Oscillating Water Columns (OWCs) along both sides, which means it absorbs the wave energy as it passes down along its hull. The structure is proposed to be built in concrete to make it less expensive and more corrosion resistant compared to a steel structure. A serial production using a continuous forming technique like the methodology to be used at the Fehmarn Belt tunnel project is proposed in [10]. Located at strategic sites, such production facilities could be maintained for several years, supplying WECs to designated locations.
The size of the wave farm depends on how many structures will be deployed side by side in an array. The dimensions of the WEC should be optimized to suit the specific site, i.e., the Danish part of the North Sea, or even more exposed Atlantic sites or any other location with suitable wave conditions and infrastructure.
The wave energy is absorbed by the OWC chambers in which the water oscillates up and down. This up and down motion of the water in each chamber pushes and pulls air in and out via air turbines that drive electrical generators. Highly efficient air turbines suited for the conversion are under development in Portugal [12].

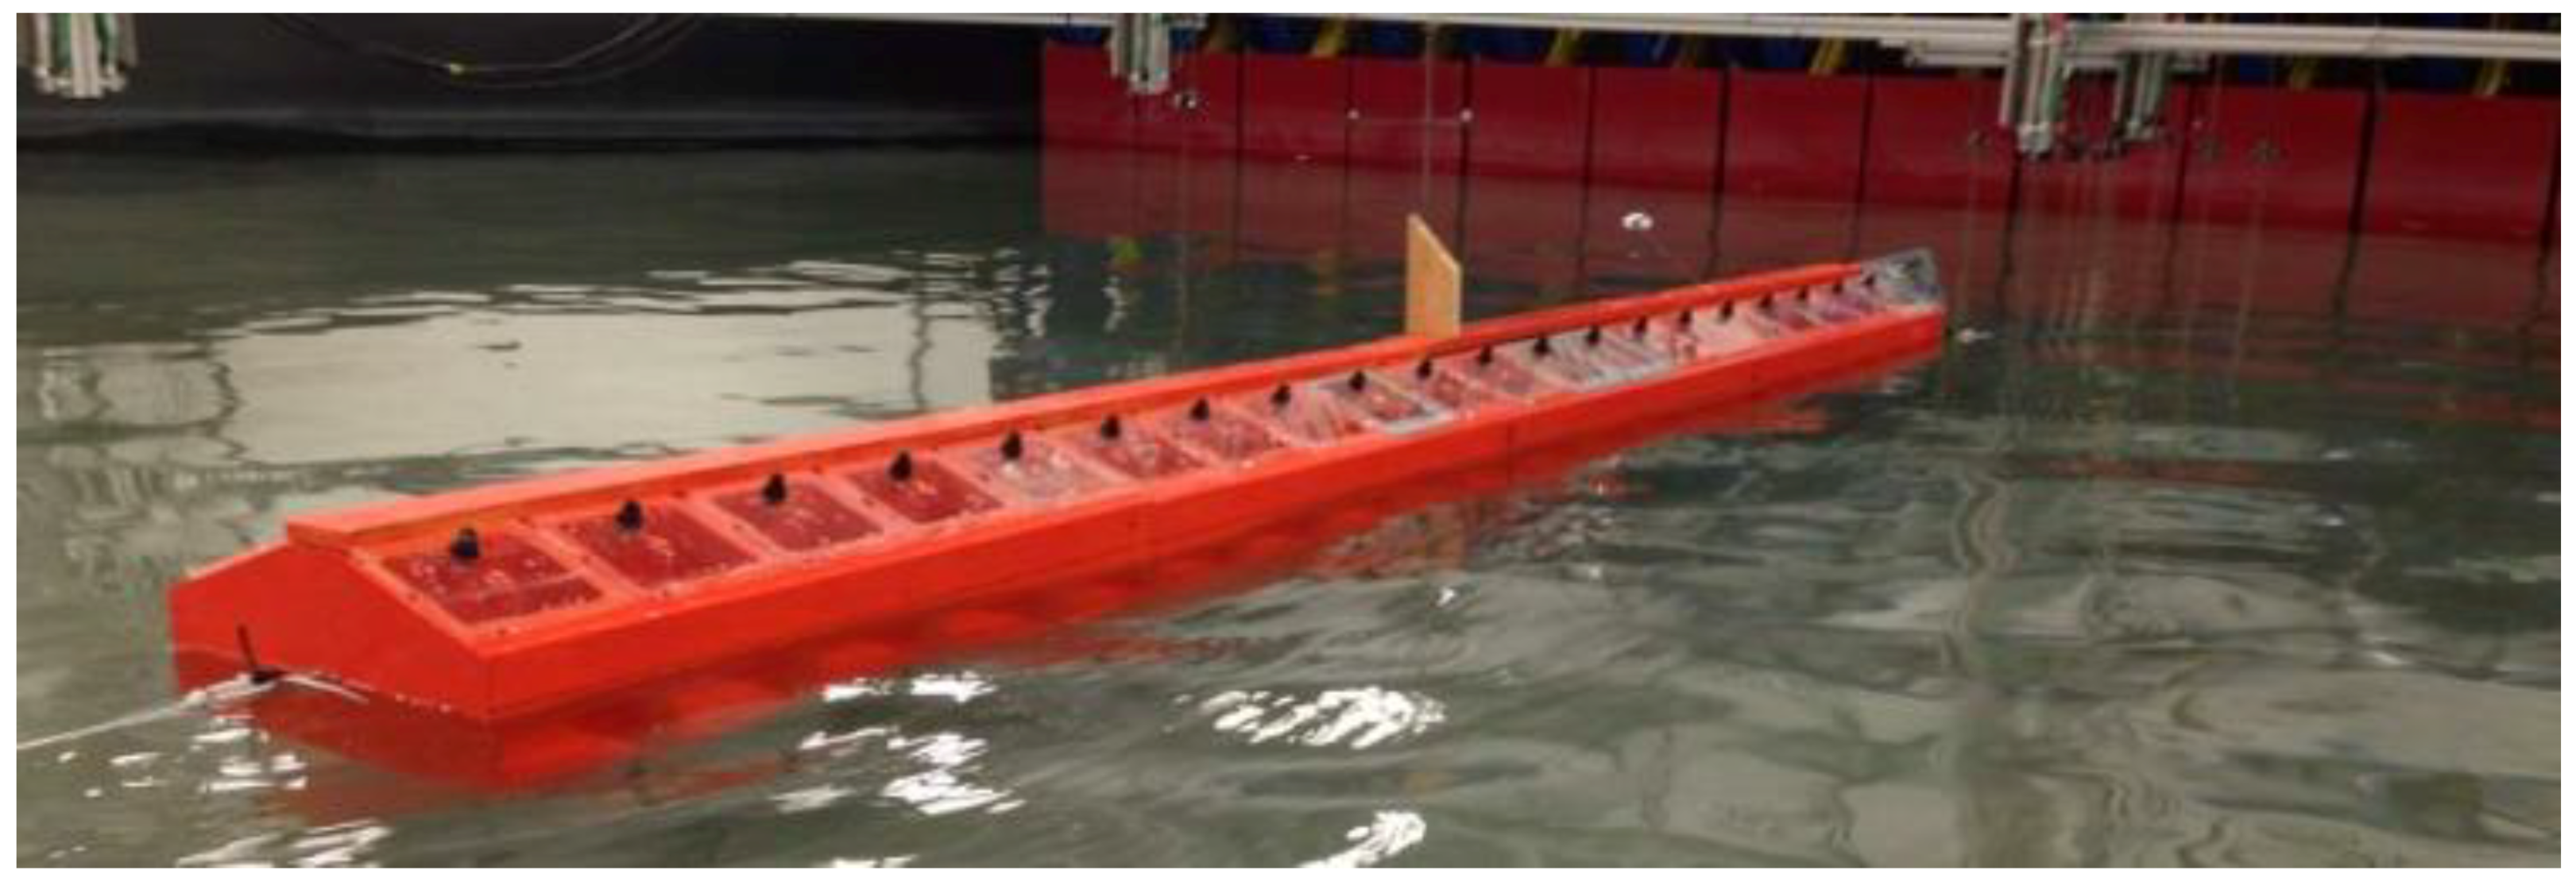
3. The Experimental Model KNSwing

The WEC is moored at the bow of the structure using a turret mooring system and an additional optional mooring line can be attached to the stern (aft) for practical or safety reasons. The WEC is intended to turn itself towards the incoming waves, but the testing showed that a slight angle to the wave can increase the power absorption on the side facing the incoming waves.
A 3-m-long experimental model of the WEC was built as a student project at DTU [7] in 2015 and includes 40 OWC chambers, each damped by an orifice hole Ø14mm. The water plane area of each OWC chamber was 120 mm × 100 mm. The model, shown in Figure 2, was also used in the present study for additional experimental tests and validation.
The dimensions of the experimental model are given in Table 1, below. The final dimensions of a full-scale KNSwing must be based on optimization in relation to a specific site and further structural and numerical work. However, a geometrical similarity of the mooring design requires scaling also the water depth. The initial testing at HMRC in their 1.0-m-deep basin was scaled up by 50, comparable to a water depth of 50 meters, at a North Sea location. The experiments at the Portaferry basin with 0.55-m-deep water was scaled up by a factor of 80. Examples of upscaling are shown in the table below.

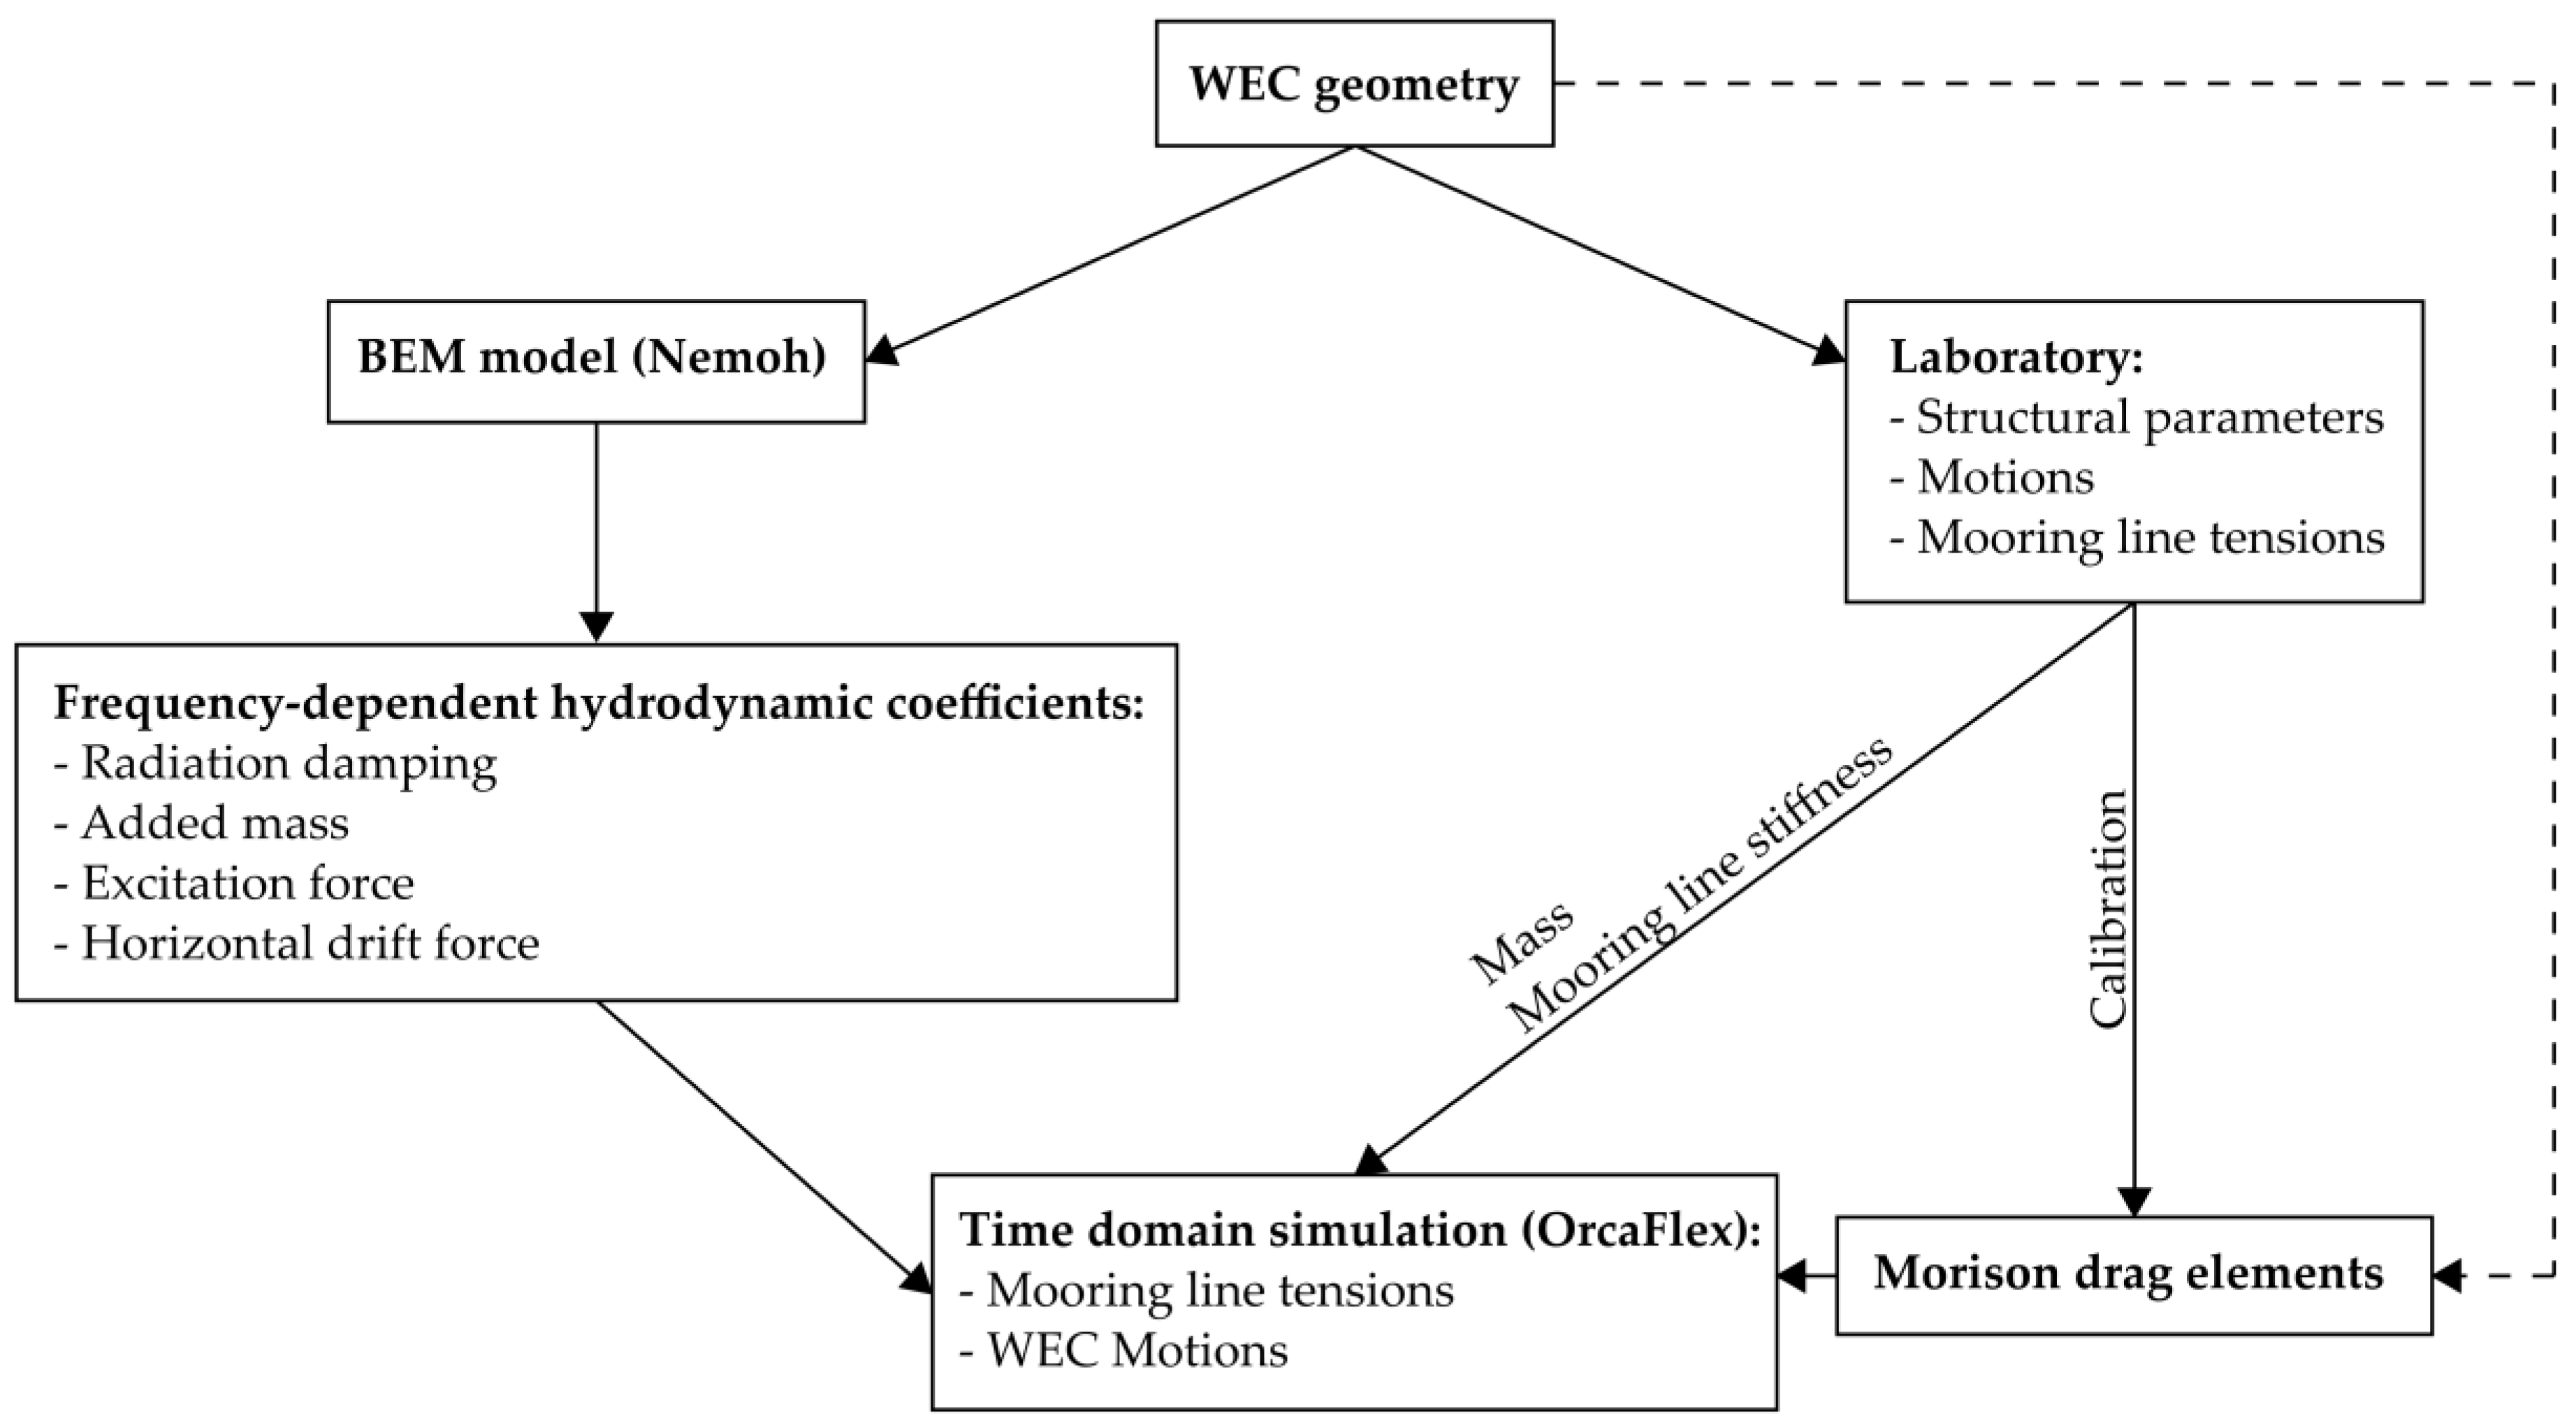
4. The Numerical Model of the Structure and Mooring Solution

Numerical models are expected to form a significant part of the future design and evaluation of the KNSwing, due to the easy automation, adaptability and efficiency compared to, e.g., full experimental campaigns. Work on numerical models of the KNSwing and its mooring system has previously been described and used in [13]. However, in [13], there was no validation against experimental data and the simplified methodology described in [14] was applied. The present paper continues the work on the numerical model and utilizes the present experimental data to validate and calibrate the model.
The numerical model is built using the Boundary Element Method (BEM) code Nemoh [15] to calculate the wave-structure interaction, and the time domain mooring solver OrcaFlex v. 10.2c [16] to simulate time series of motions, tensions, etc. Based on the geometry built in the laboratory, a panel mesh was constructed and used in Nemoh. The mesh is presented in Figure 3.
The numerical model is built as presented in Figure 4, below. Based on the geometry used in the experiments, the panel mesh was constructed and used in Nemoh to calculate the frequency-dependent hydrodynamic coefficients (cf. Figure 4). These values provide input to OrcaFlex, together with mooring line stiffness and structure mass, measured in the laboratory. The frequency-dependent parameters are used to simulate time series using Cummin’s Equation [17]. Nemoh does not account for viscous drag forces and hence, Morison drag elements [18] are added to account for the viscous forces on the structure. The methodology described in [14] is used to define the drag elements. Based on the geometry, coarse estimates of the drag coefficients are defined. Later, the surge decay and irregular sea state simulations are used to calibrate damping further to improve the agreement between model and experiment.
The mooring lines in OrcaFlex are modeled using a lumped mass approach where the lines are divided into several massless segments with all hydrodynamic properties lumped to the nodes [16]. Naturally, a higher discretization of the lines provides higher accuracy, paid by larger computational time. The mooring line model was treated further in e.g., [14].
All values and results from the experiments are scaled up (1:80) using Froude’s scaling law. The results in the rest of this paper are presented at full scale. The present study only treats the compliant mooring system in the validation.

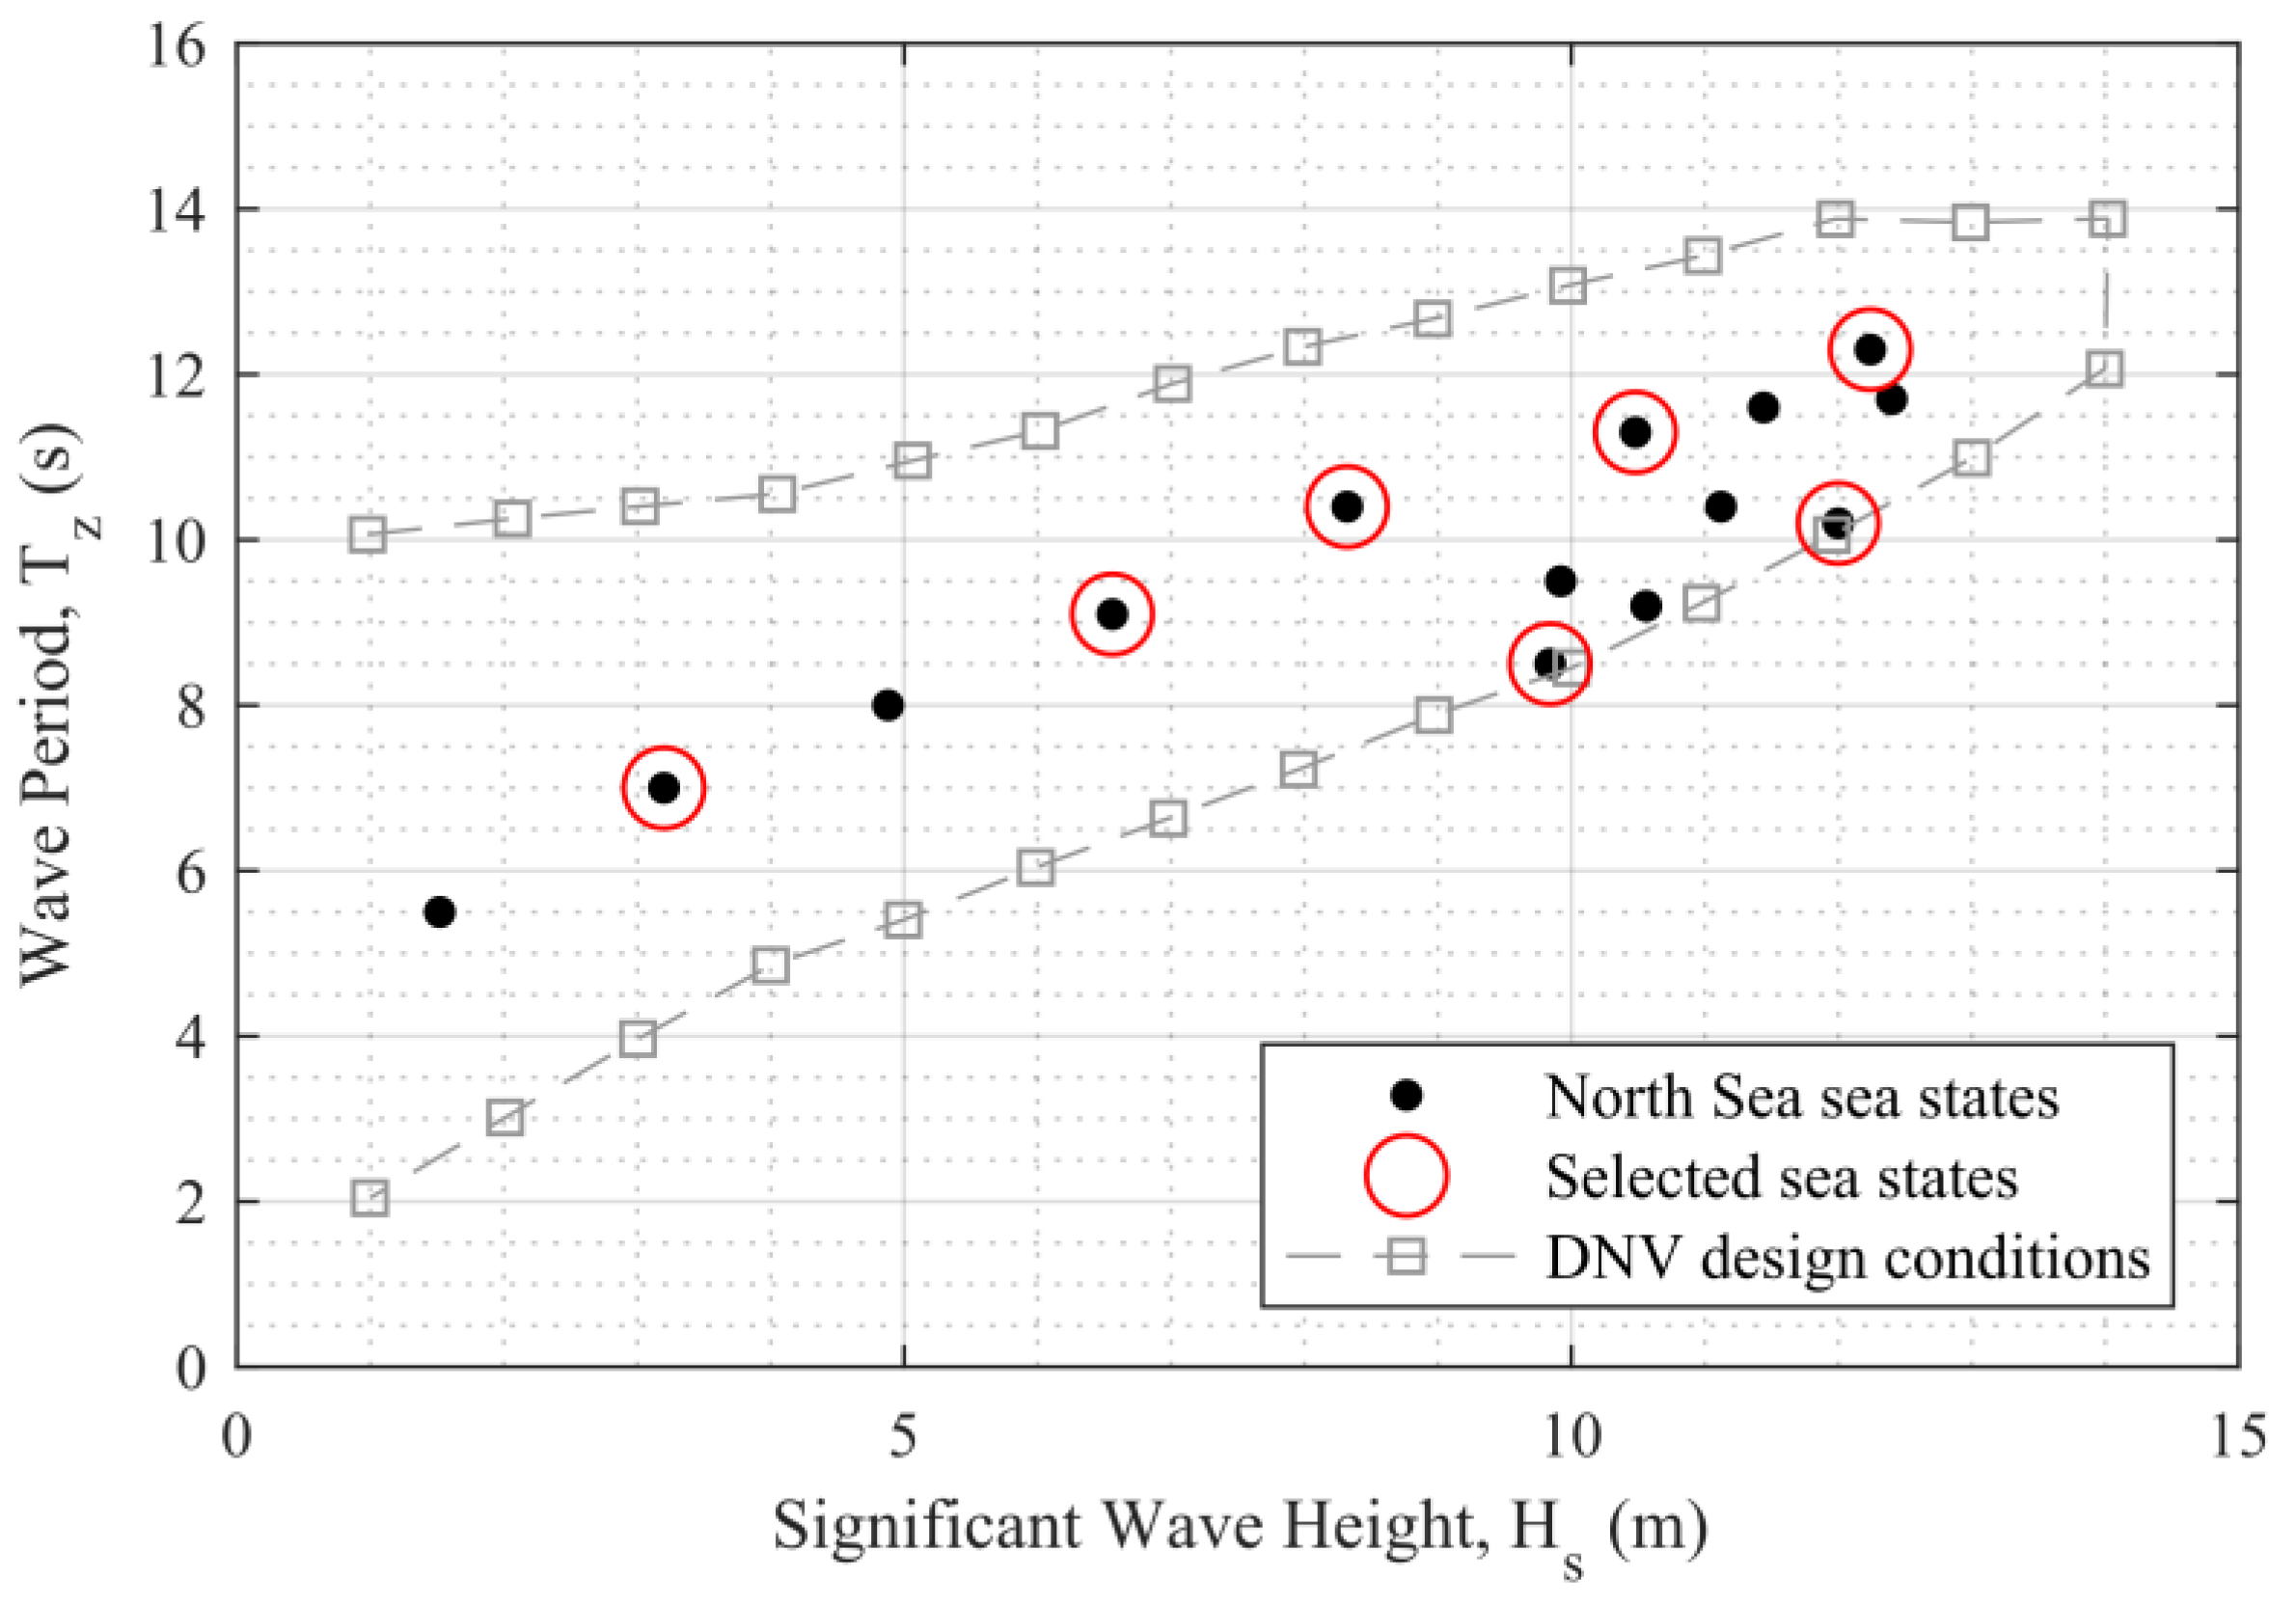
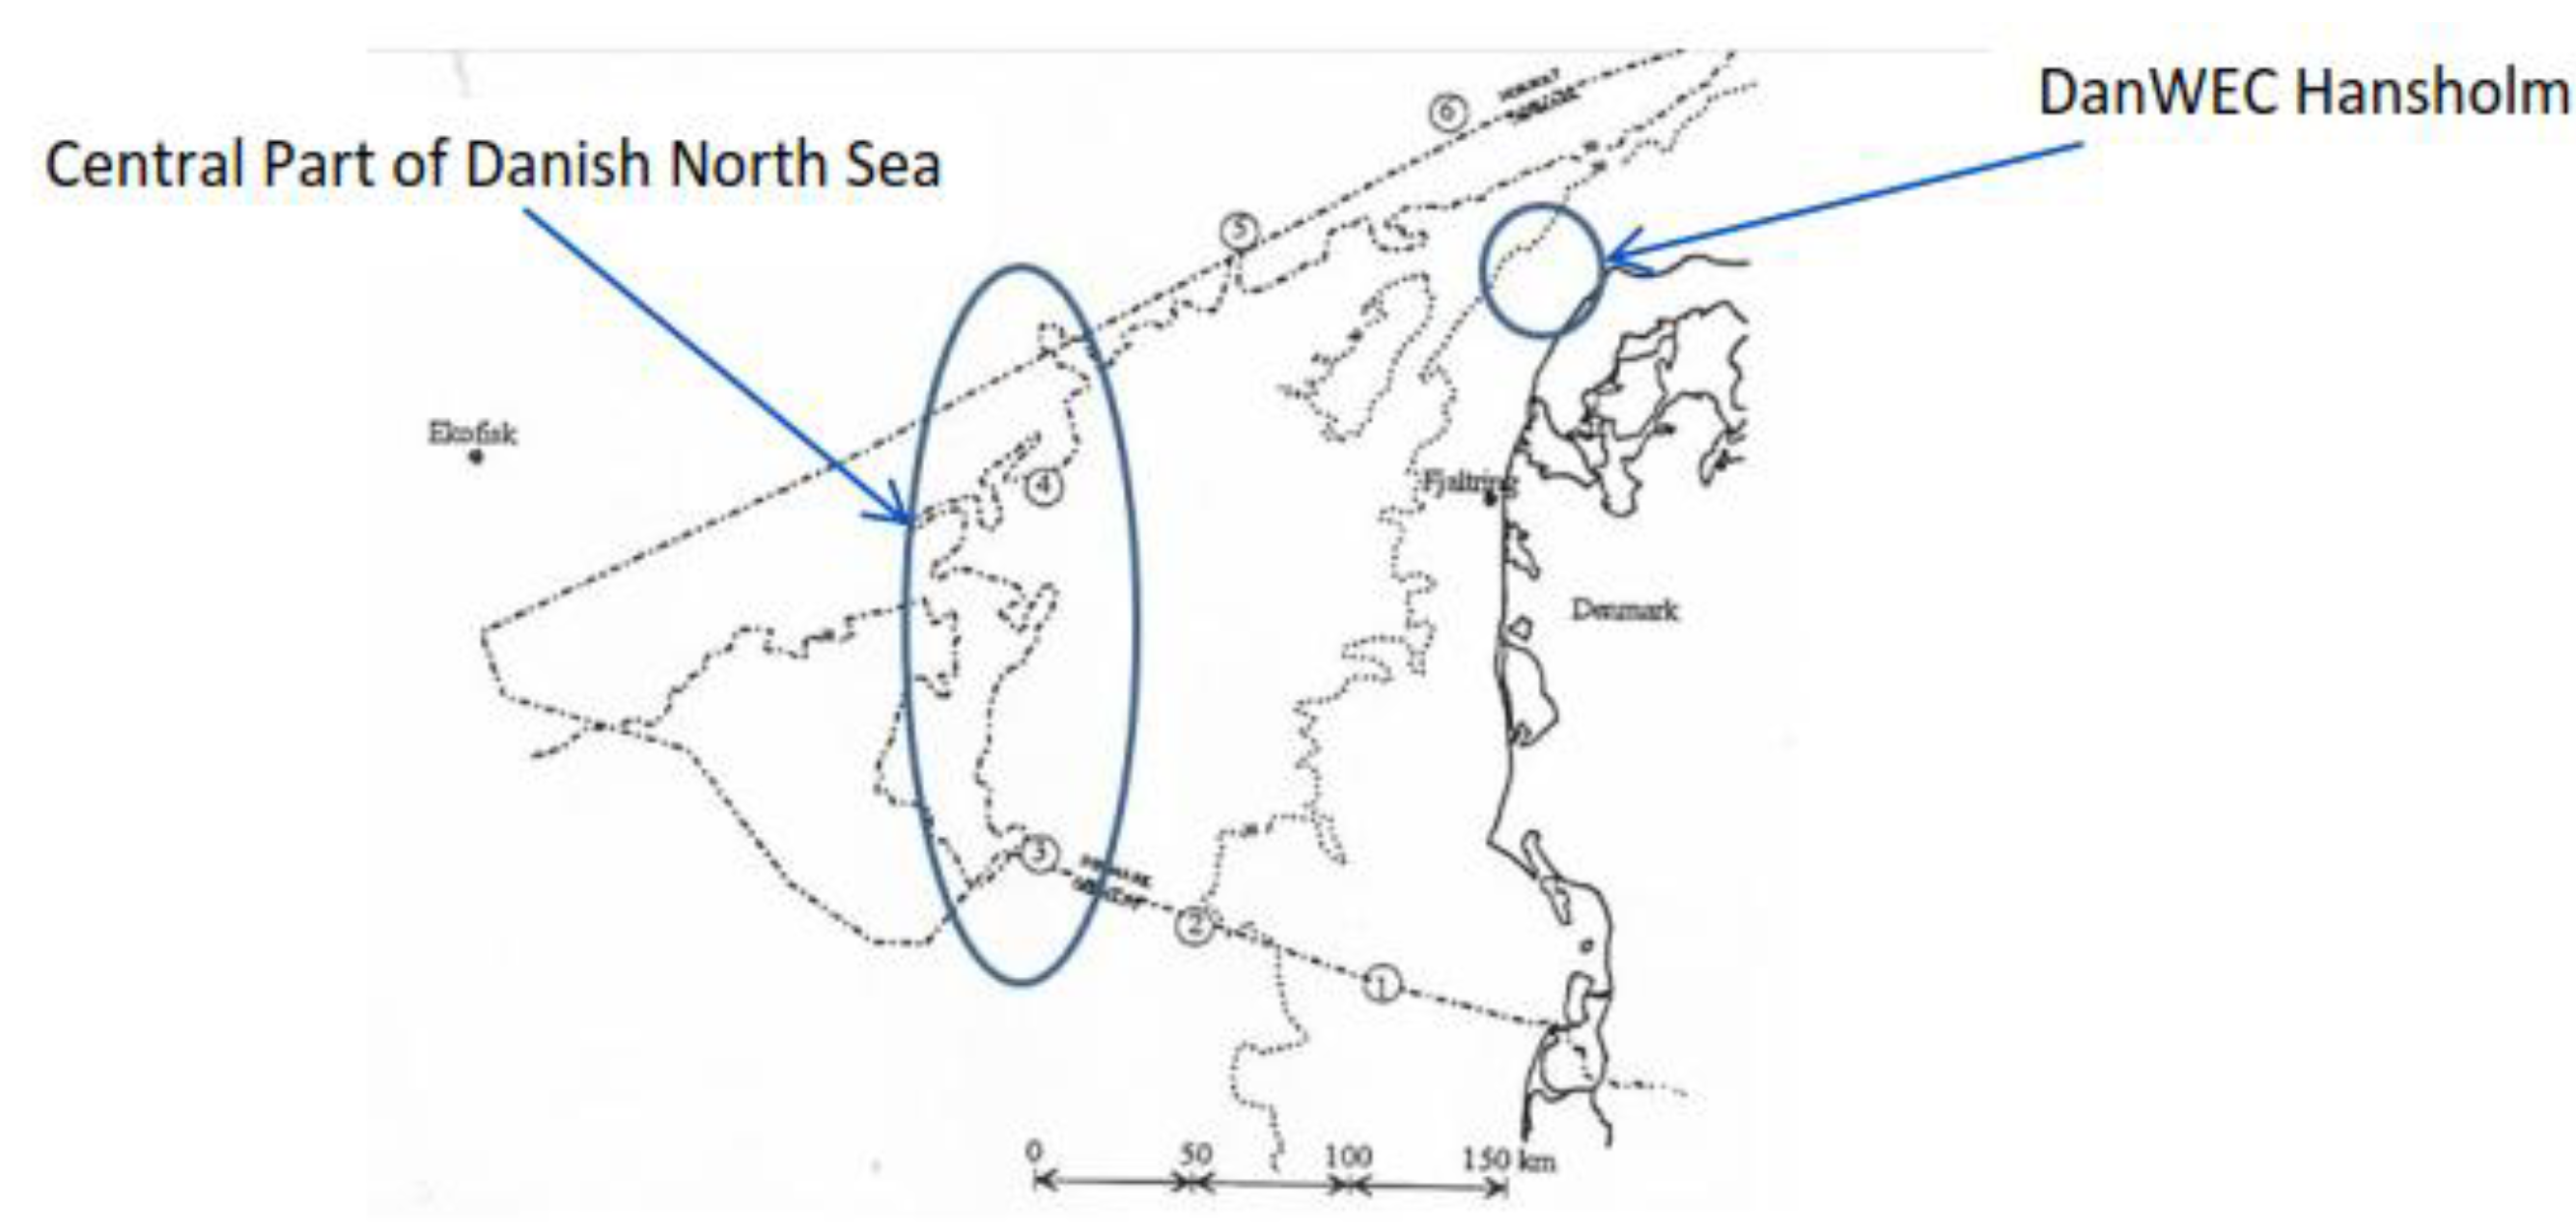
5. The Wave Conditions in the North Sea

The design of the mooring system should be able to survive the extreme sea states at a given location considering wave conditions with a 100-year return period [19]. In the central part of the Danish part of the North Sea, at a water depth of about 45 m, the magnitude of the significant wave height Hs and wave period T02 are as indicated in Table 2.
The envelope of sea-states that can appear in the North Sea is shown in Figure 5 based on the DNV standards [20]. The circled combination of Hs and T02 in the center of this envelope was selected as basis for the experiments with additional steeper and often breaking waves using the shorter wave period at the lower envelope curve. These conditions imposed the most severe impact on the structural response and mooring loads measured.
To match the North Sea extreme wave conditions to suit the water depth and wave conditions that could be generated in the basin, a scaling ratio of 1:80 was chosen. In the North Sea, current speed can be up to about 1 m/s. At scale 1:80, this is 0.12 m/s. This has, however, not been modeled in the experiments, and will not be treated further.

6. The Experimental Setup in the Basin

The experimental setup in the wave tank is shown on the Figure 6. The model is placed approximately 4 m from the wave makers, asymmetric to the centerline of the basin. In front of the device was a group of wave probes initially calibrated. The motion response of the WEC was measured using a camera system registering the 4 reflective markers on the WEC. After initial calibration, only 4 wave probes were used to measure wave elevation and the mooring line loads were measured using load cells mounted to the superstructure above the basin, cf. the following section.

6.1. The Experimental Procedure

Initially, the wave trains were measured and calibrated without the WEC model in the basin, to tune and measure the wave conditions using a reference wave probe WPR located at the center front half point of the model. The stiffness of the mooring lines was measured as described in Section 6.3. The stability and metacentric height were determined by attaching ballast weights and measuring the inclination. The installed stiffness of the combined mooring system was measured, as well as the free decay in surge when the WEC was given an initial displacement from its mean position. The experiments in survival conditions included measuring the 3 mooring loads and the excursions in the predefined wave conditions, which were also measured by the three wave probes. In addition, the reference WP was removed. The wave Probes were calibrated daily, the load cells on a weekly basis.

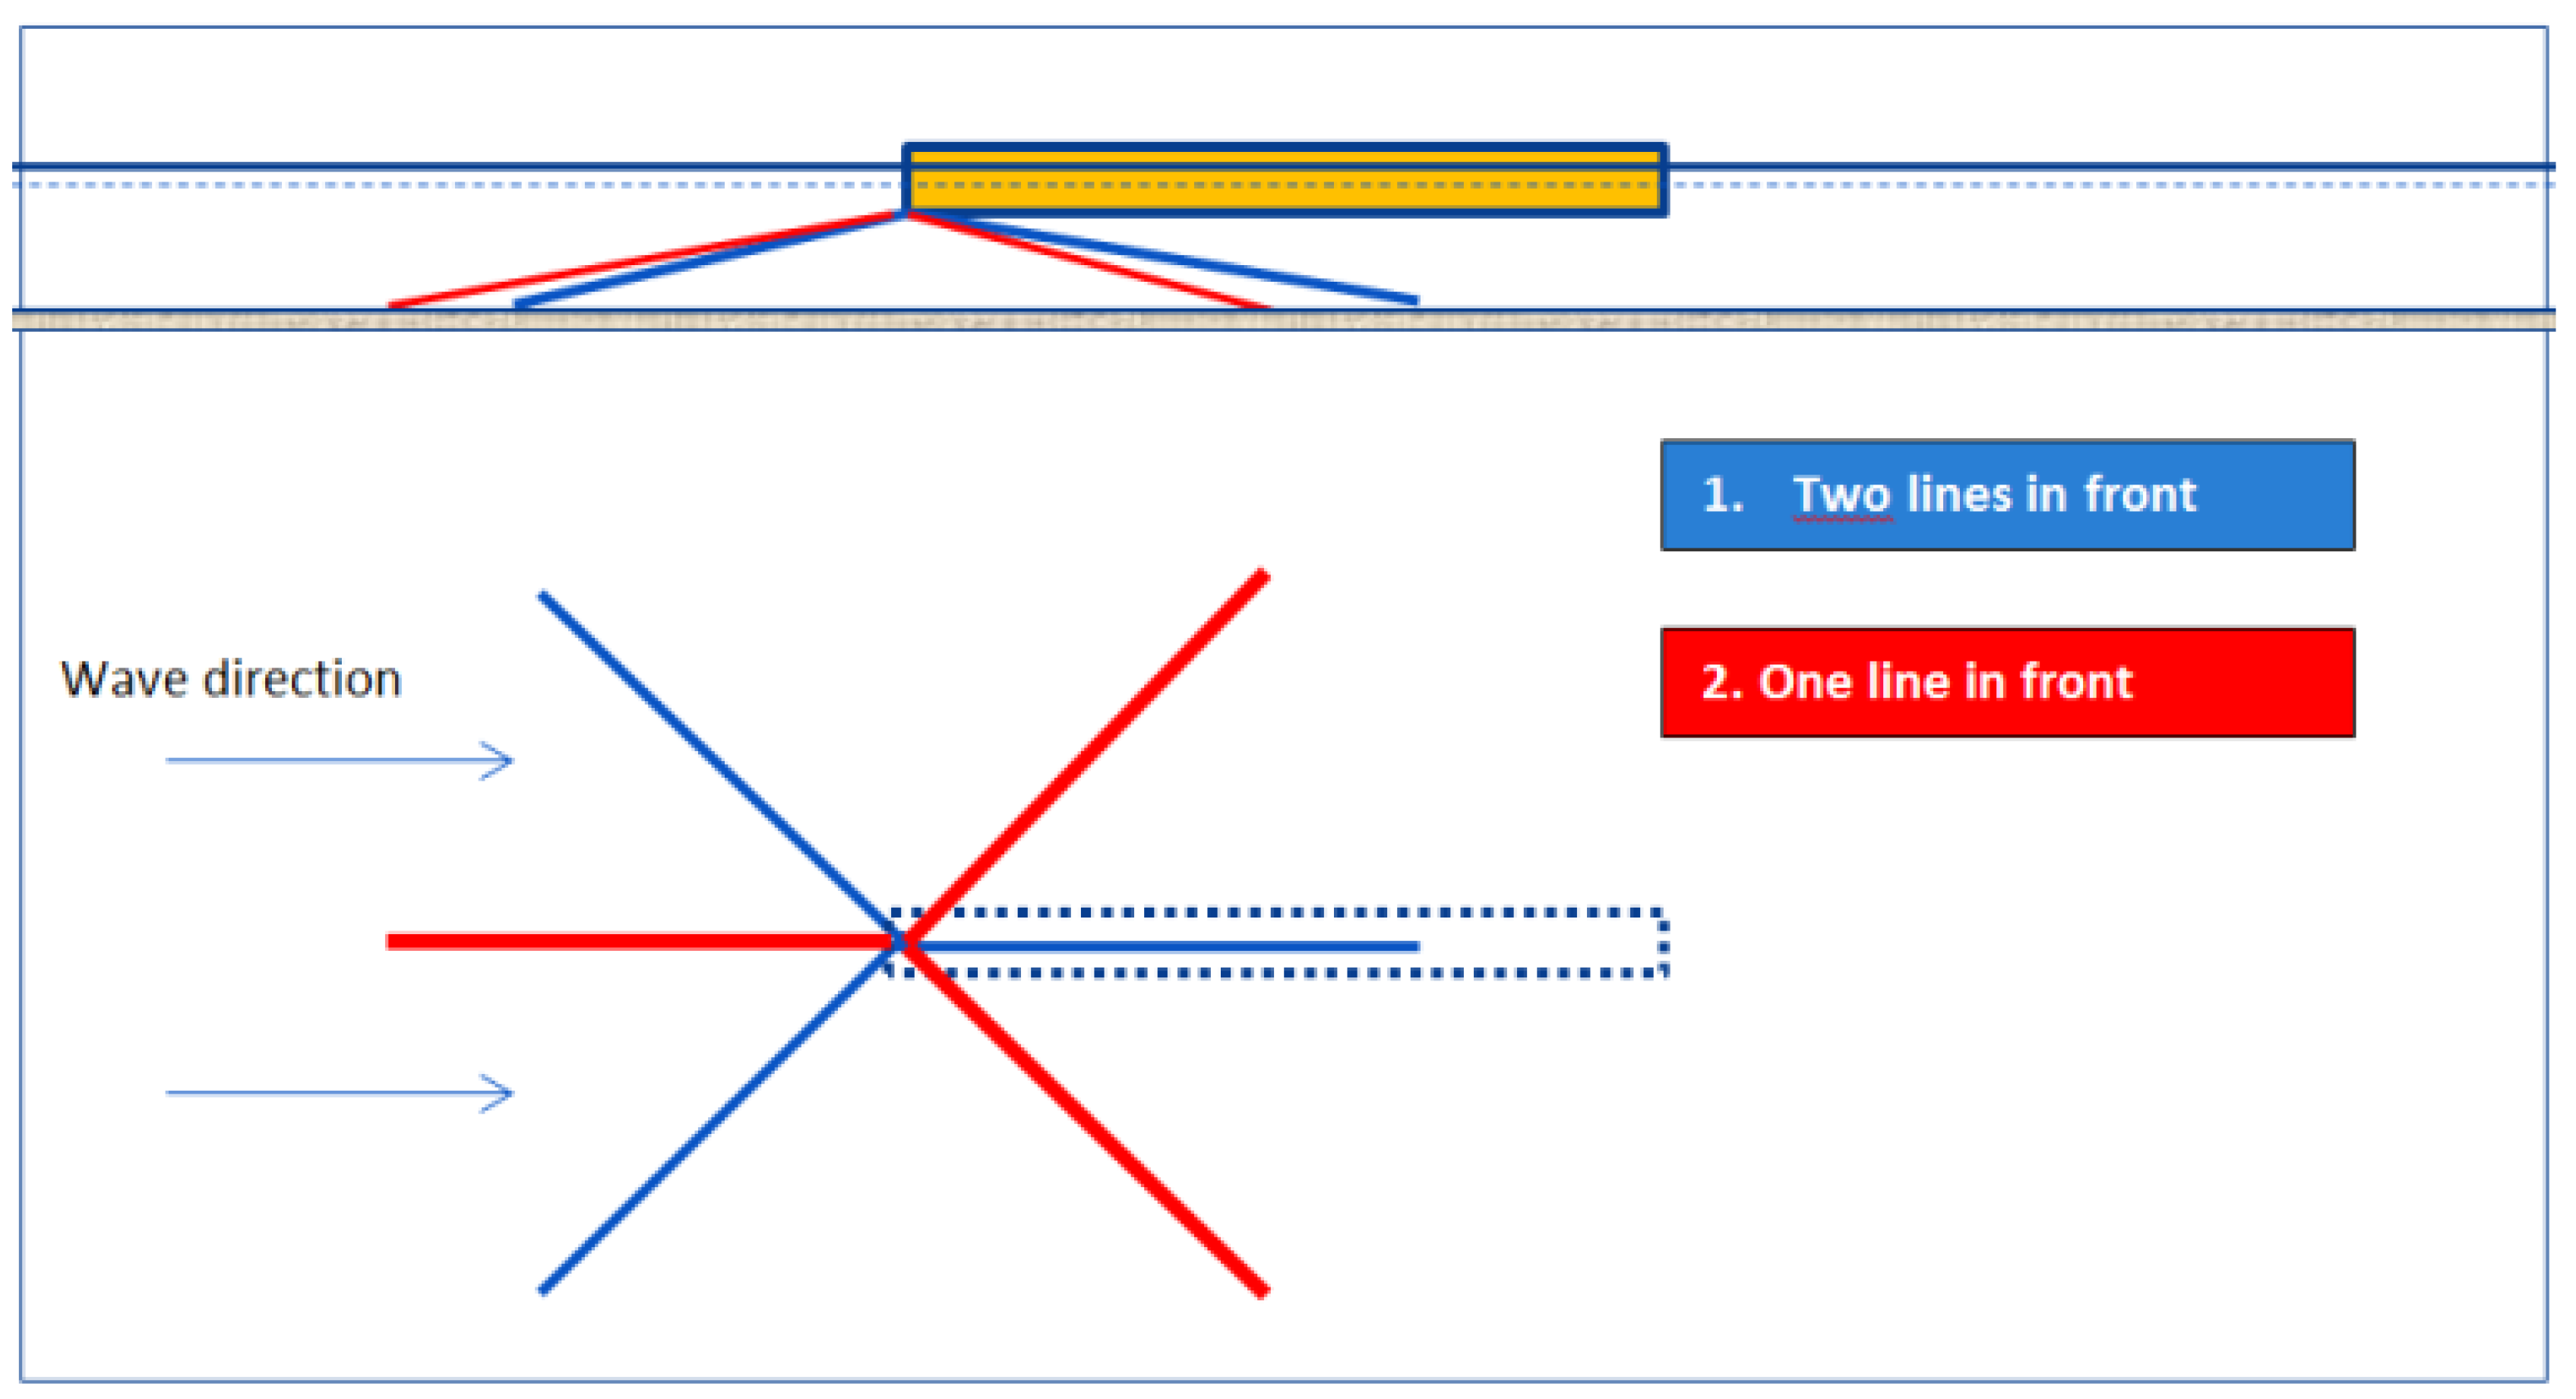
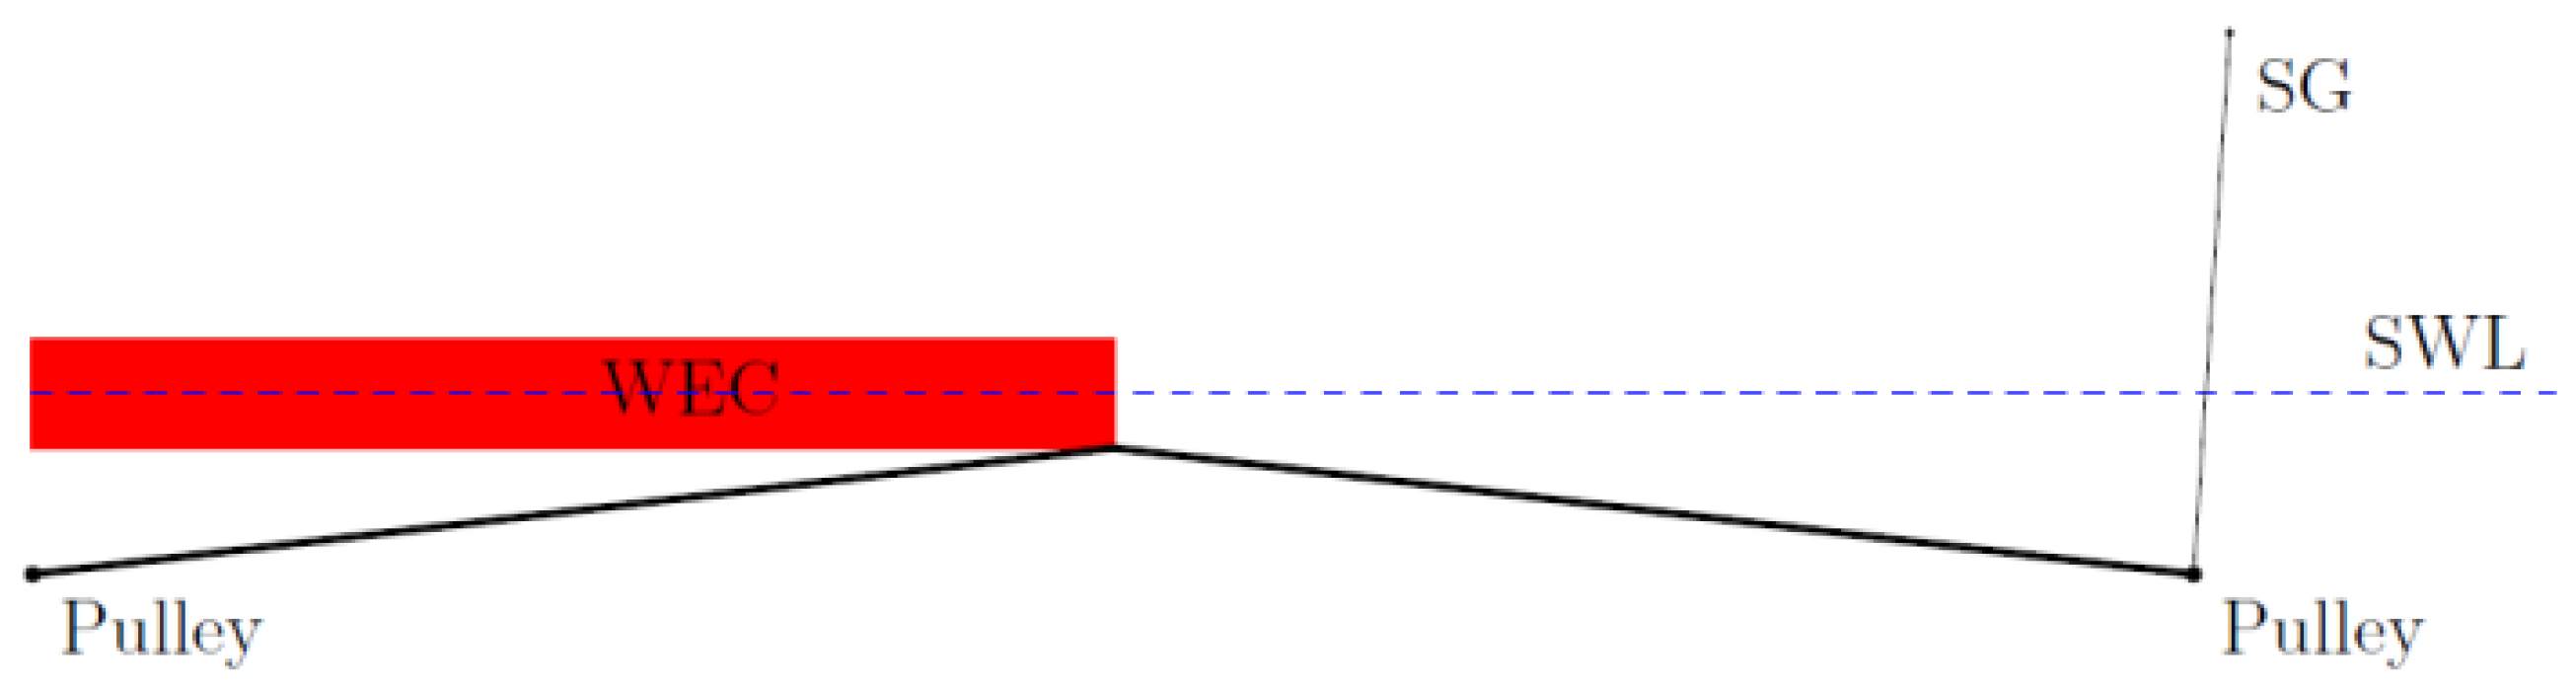
6.2. Modeling the Mooring System

The mooring design investigated in this study is a turret mooring system using several synthetic mooring lines attached to a “turret” at the bow of the WEC at one end and attached to anchor points on the seabed at the other end. In the model experiments, the turret mooring design was simulated by three elastic mooring lines attached to the bow of the model and to mooring points on the basin floor. The setup is shown in Figure 7. The configuration with two lines to the front facing the incoming waves and one line to the aft was chosen for the present validation experiments. On the vertical level the three lines were attached to the model at the keel level of the bow.
Designing and optimizing the mooring system is an iterative process, as the mooring line load will depend on the rope length, breaking strength (rope diameter) and stiffness. To do this optimization, the numerical model used in [13] is further investigated and calibrated. A 2 meter experimental model mooring rope of medium softness was prepared to roughly resemble a 160 m long Bridon, “Viking Braidline Nylon” rope of diameter 216 mm. The rope reaches its Mean Breaking Strength (MBS) at 9807 kN, at an extension of 43 m (27% for worked line). Assuming a linear load extension, the stiffness of the nylon rope is on the order of K = 230 kN/m, which scales to about 35 N/m for the 2 m model rope. The experimental mooring lines resemble the linear stiffness of a full-scale synthetic mooring line but naturally, differences in line properties such as mass and non-linearities are likely to be present. In the final design of a mooring for the KNSwing, the actual line properties for a selected line type should be applied.

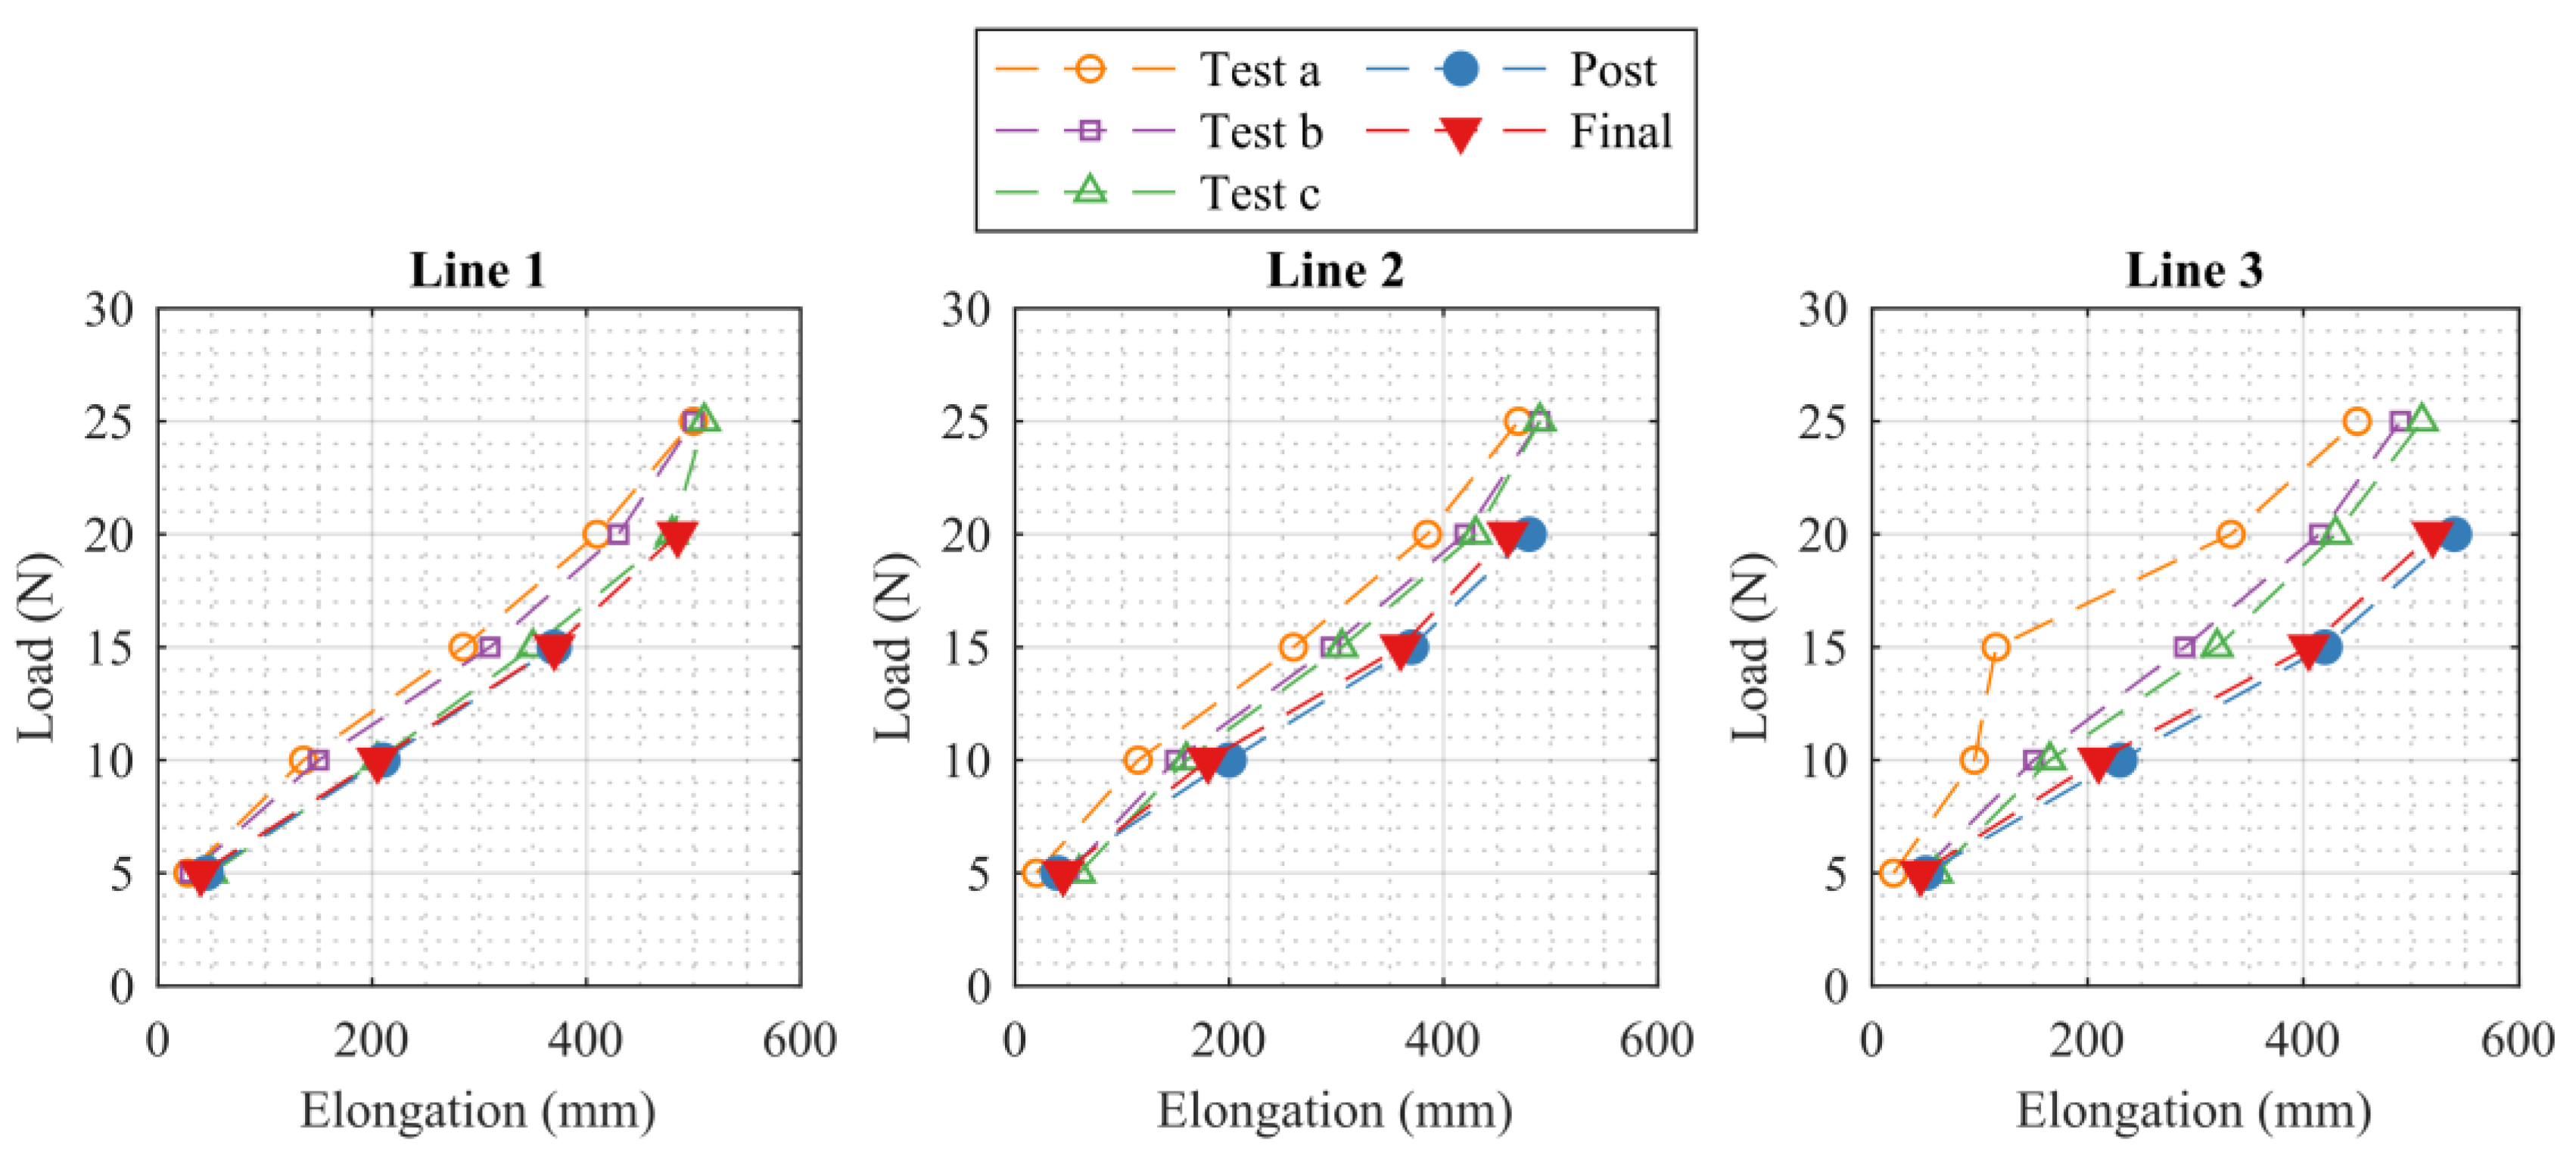
6.3. Calibration of the Mooring Lines

Two different stiffnesses of each mooring line were tested in the present study. The stiffness of each elastic mooring line of “rubber band” was calculated from the measured relation between length and load applied for three different cases. The relations between load and extension have been plotted, as shown on Figure 8. Inserting a linear trend line, the stiffness is expressed by the slope of the trend line. The results are presented in Table 3.
The target stiffness at model scale was about 35 N/m. This model stiffness was reached by using approximately 65 cm long rubber springs, which were statically calibrated as indicated in Table 3. The average of these measurements indicated a stiffness of 42 N/m before testing started. After two days of testing, the stiffness was measured to 31–34 N/m, which is close to the target.

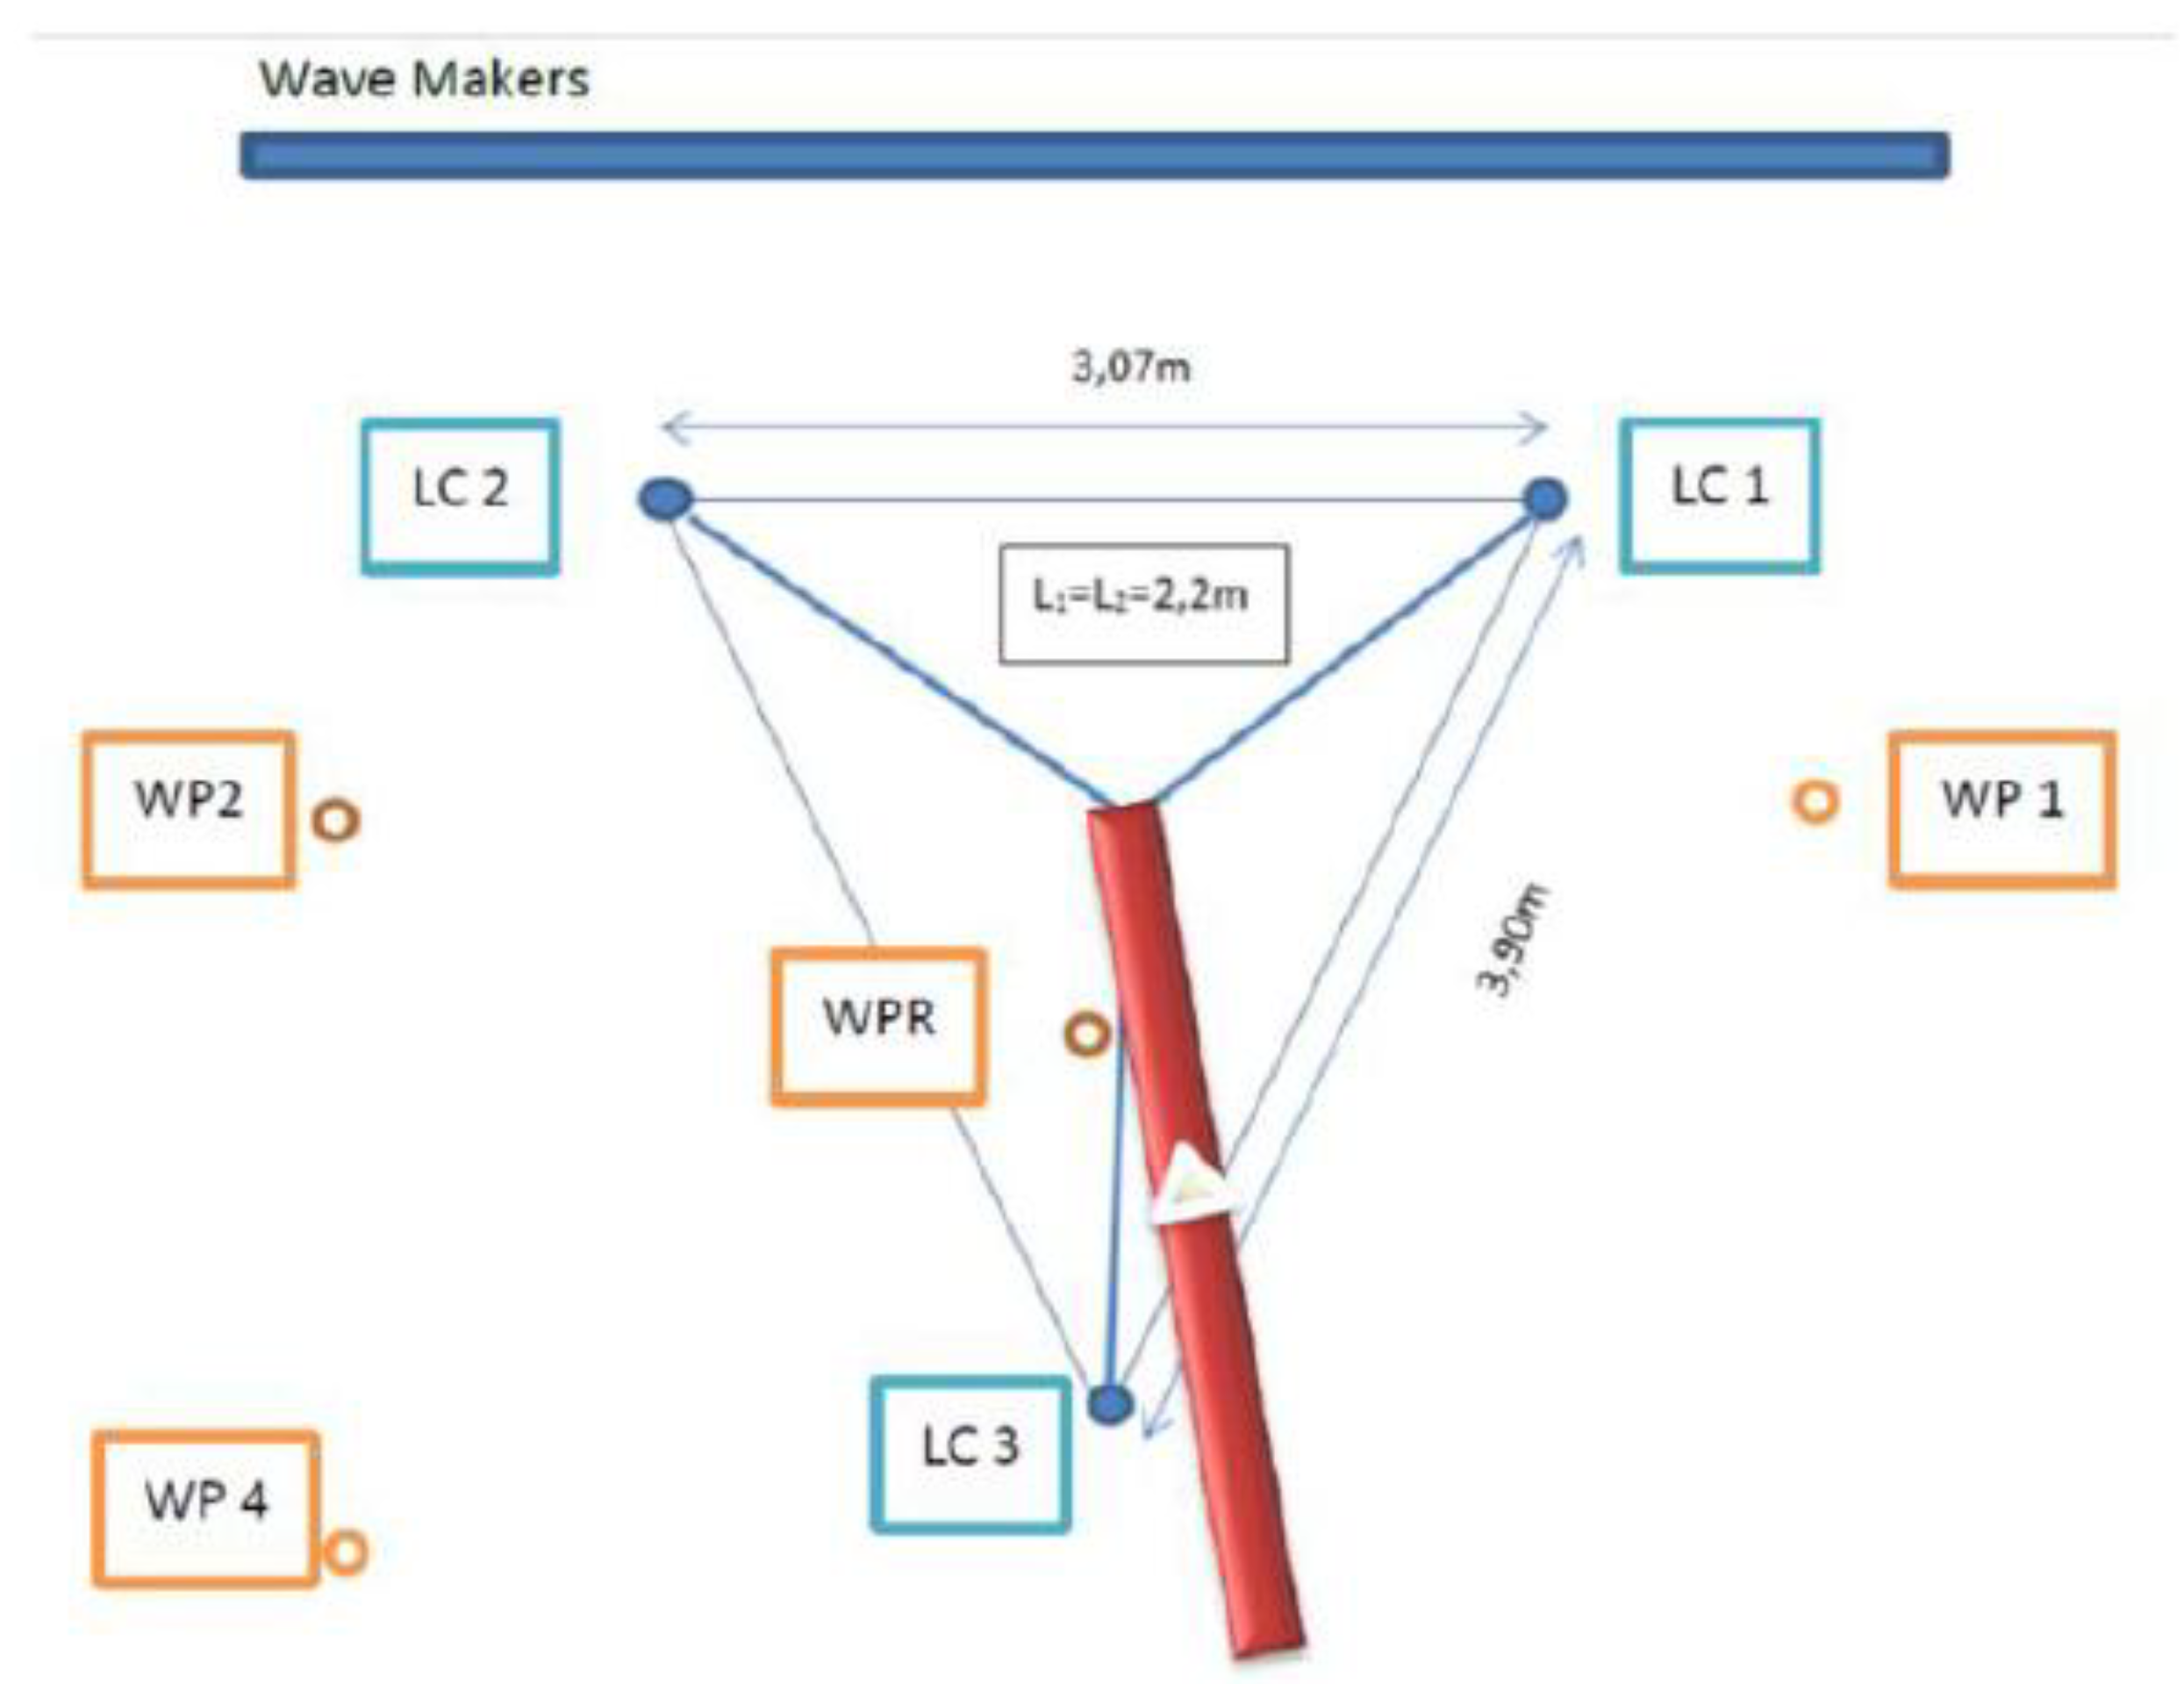
6.4. Experimental Setup for Measurement of the Mooring Loads

The mooring lines were constructed from a piece of rubber cord fixed to the WEC at one end and to a thin non-stretchable string at the other end going through a pulley mounted in the basin floor to a fixed load cell hanging from the gantry above the basin, cf. Figure 9. As previously mentioned, both approximately 30–40 N/m (one rubber band 650 mm) and 130 N/m (rubber band folded double) were tested.

6.5. Motion and Load Tracking

The mooring loads were measured as time series using the equipment described in the previous sections. The motion of the WEC was monitored using the camera equipment available at QUB, to determine the surge, heave, pitch and roll, sway and yaw response to the waves. This allows the relation between horizontal movements and mooring loads to be evaluated. Reflective markers were placed on the WEC.

7. Results Comparing Experiments to Numerical Simulations

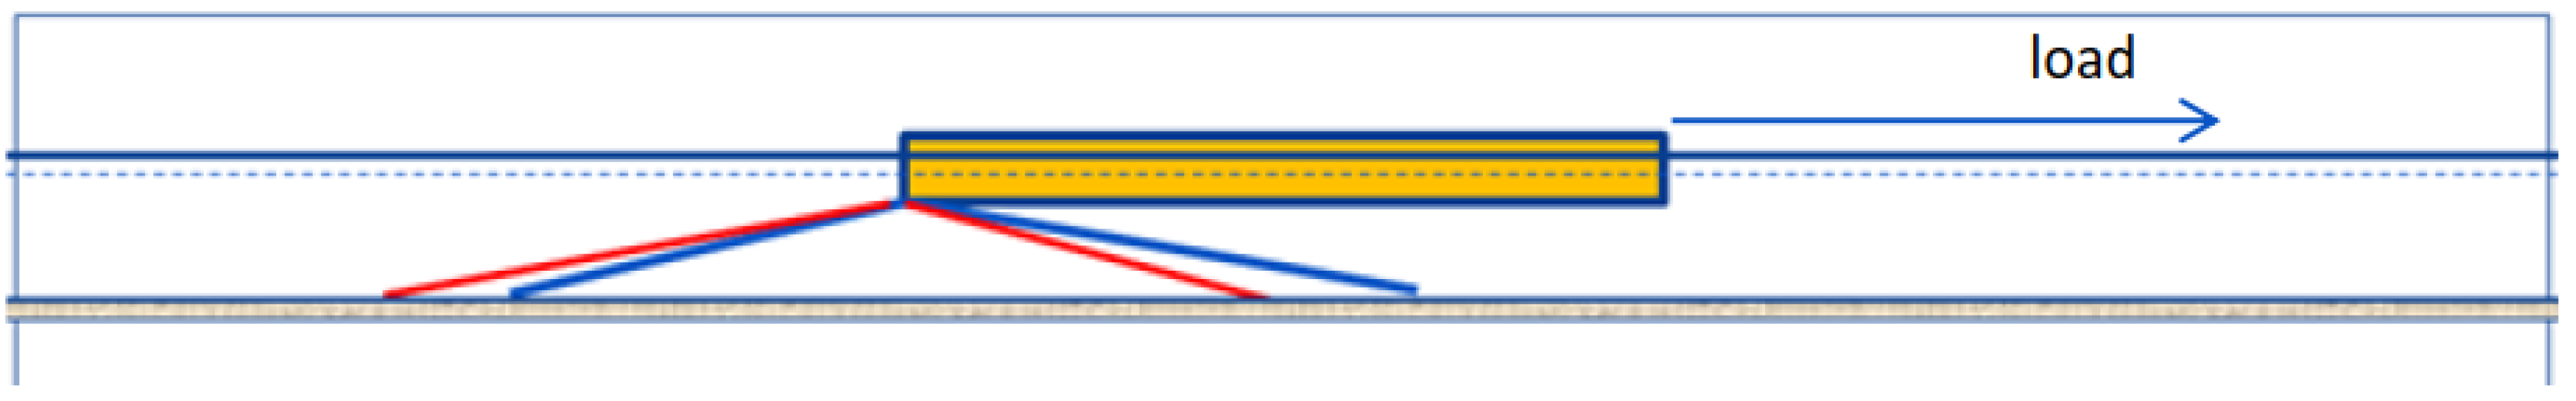
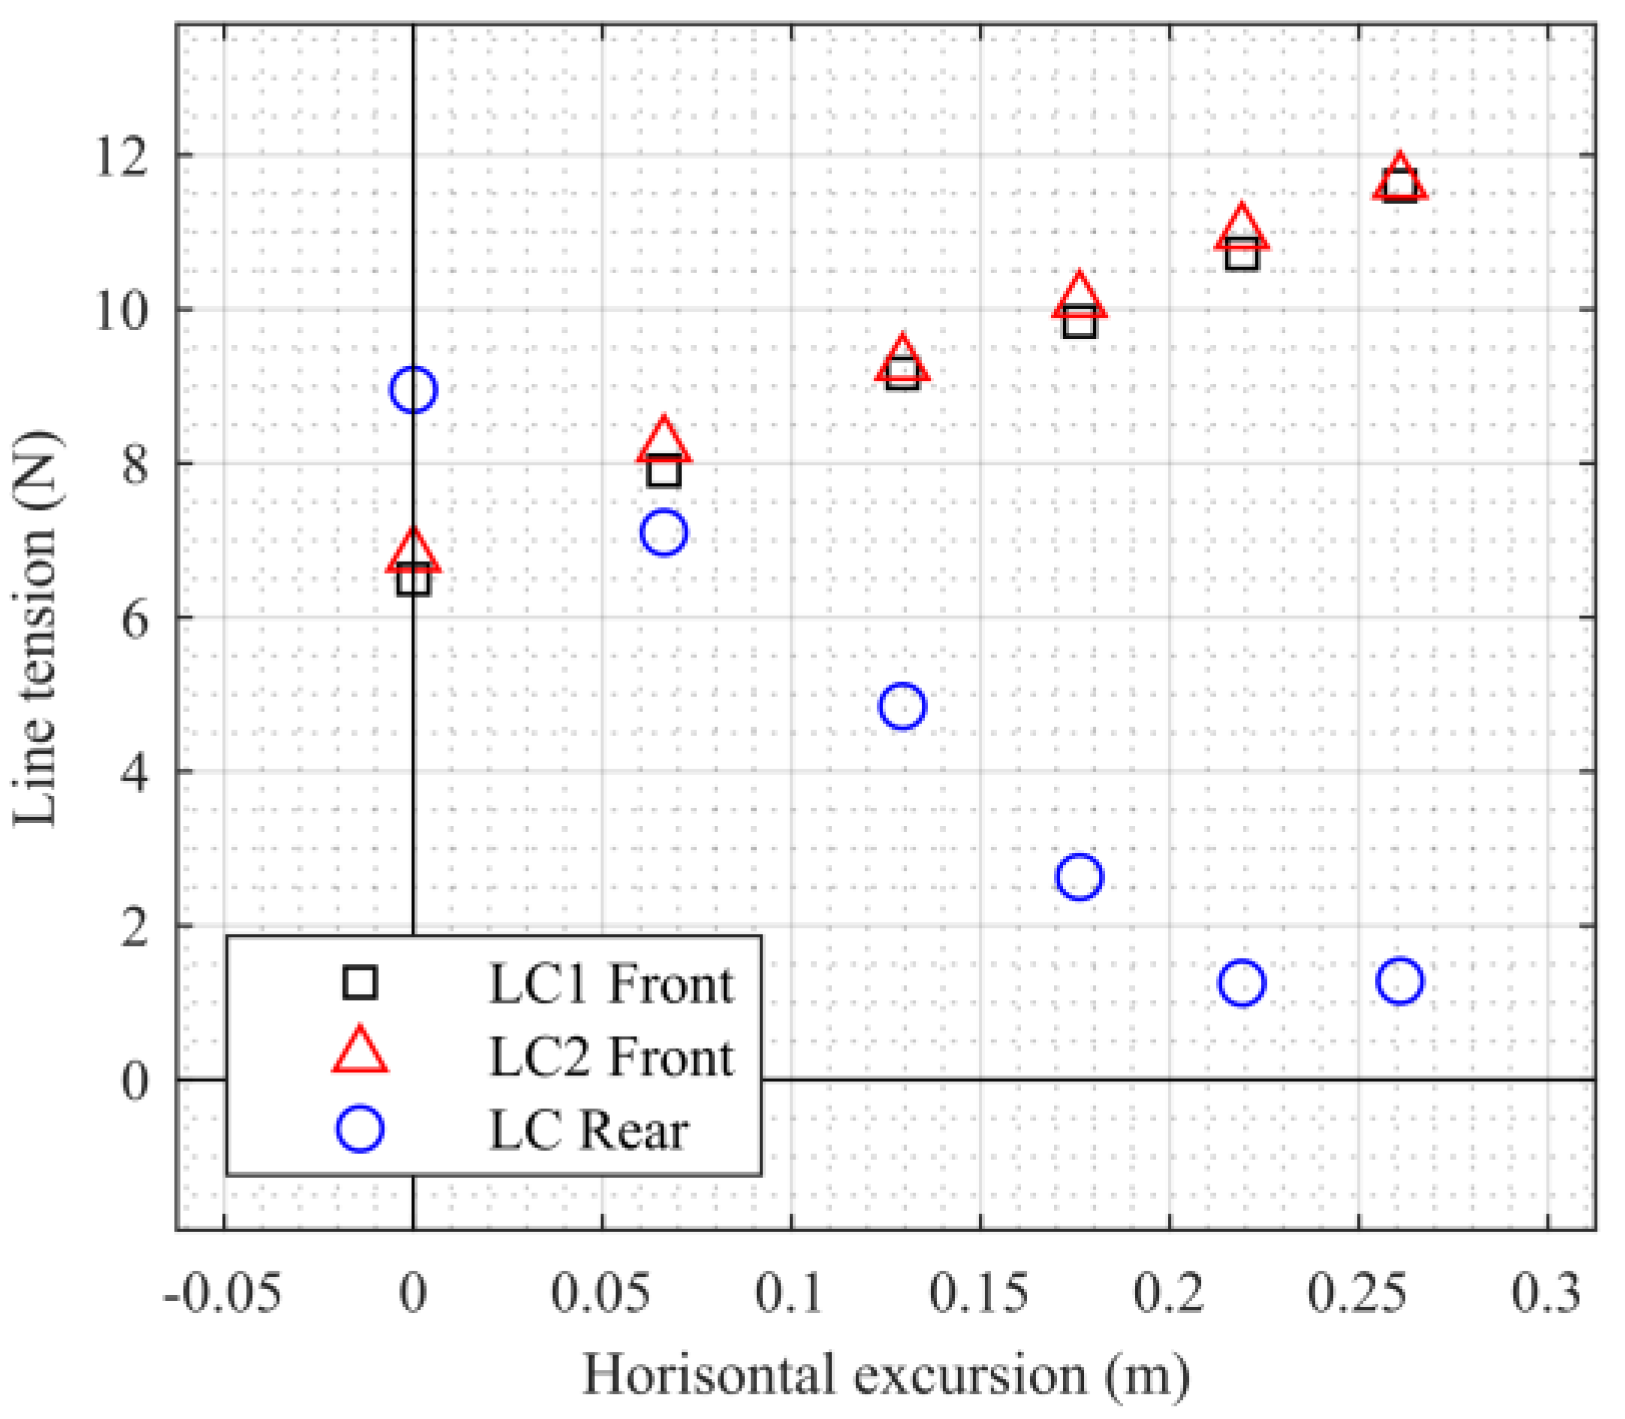
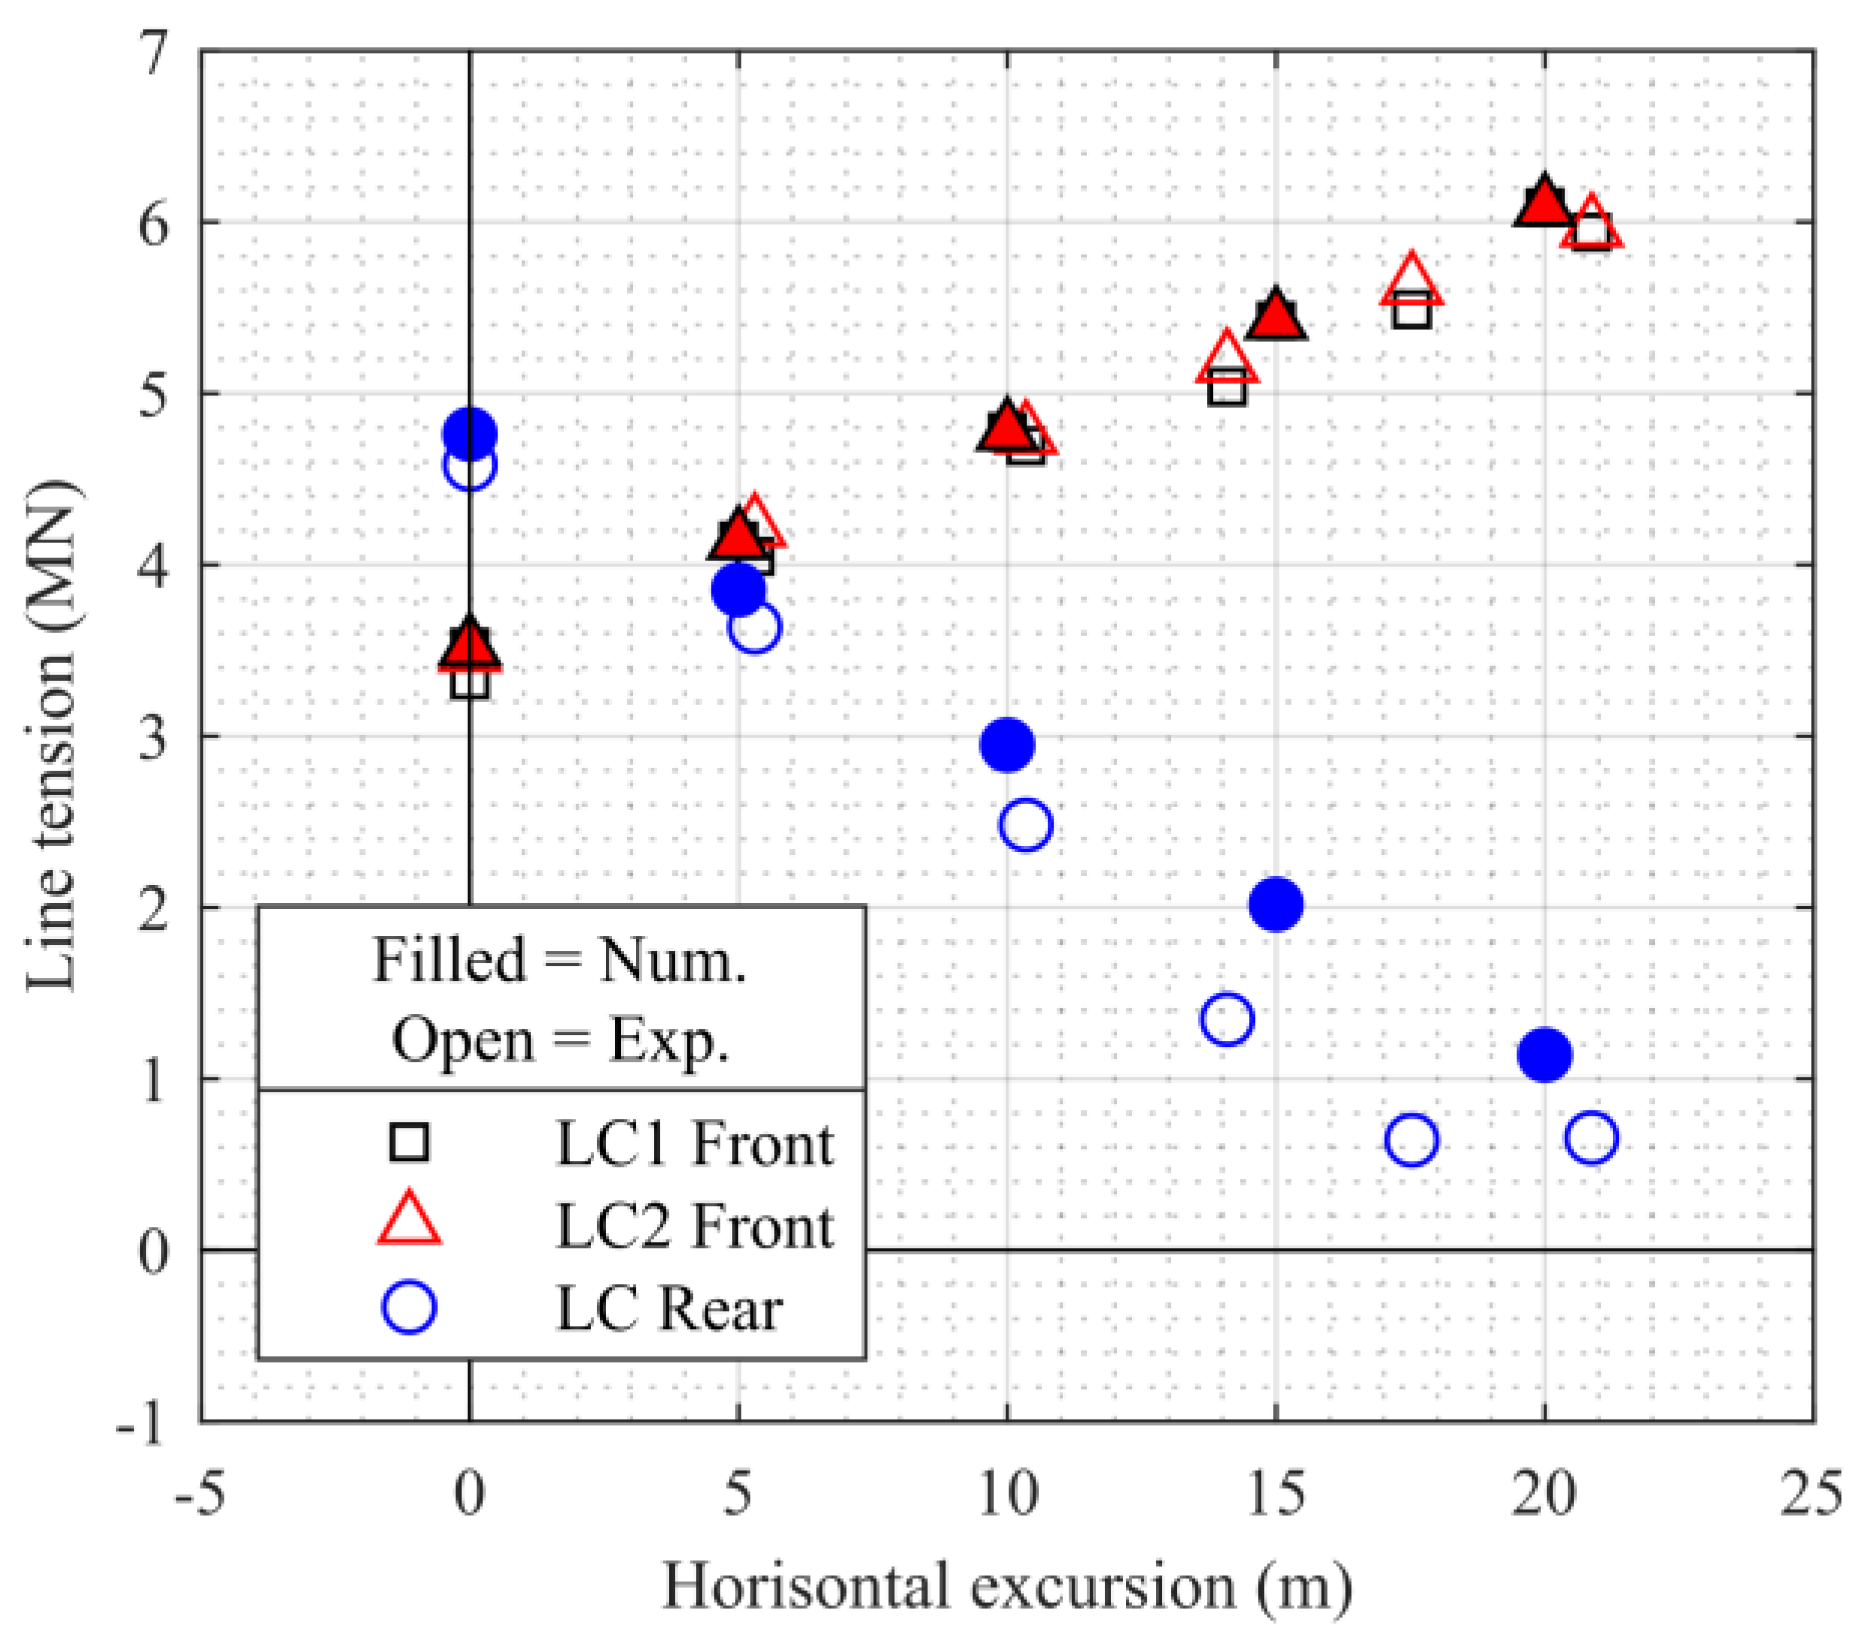
7.1. Static Mooring Stiffness Test

The setup shown in Figure 10 was used to measure the mooring loads resulting from a statically applied horizontal displacement.
The measured horizontal excursion and measured loads in the mooring lines are presented in Figure 11, below, for the compliant line. The figure clearly illustrates a linear increase in the mooring loads in the front lines when the model is excursed. The rear line experiences a decrease in tension until the line is slacked at which point the tensions appears constant. The line still experiences tension as a result of the presence of the load cell.
The numerical model was used to replicate the static stiffness test and the values have been converted to full scale. The results of measured tensions against surge motion are presented in Figure 12. A clear agreement between tensions in both front and rear lines is observed. Some discrepancies are observed in the rear line tension when the line is slacked. The results illustrate an agreement between the experimental and the numerical mooring system. The experiment provides a non-linear decrease with the excursion, while the numerical model follows a linear trend.

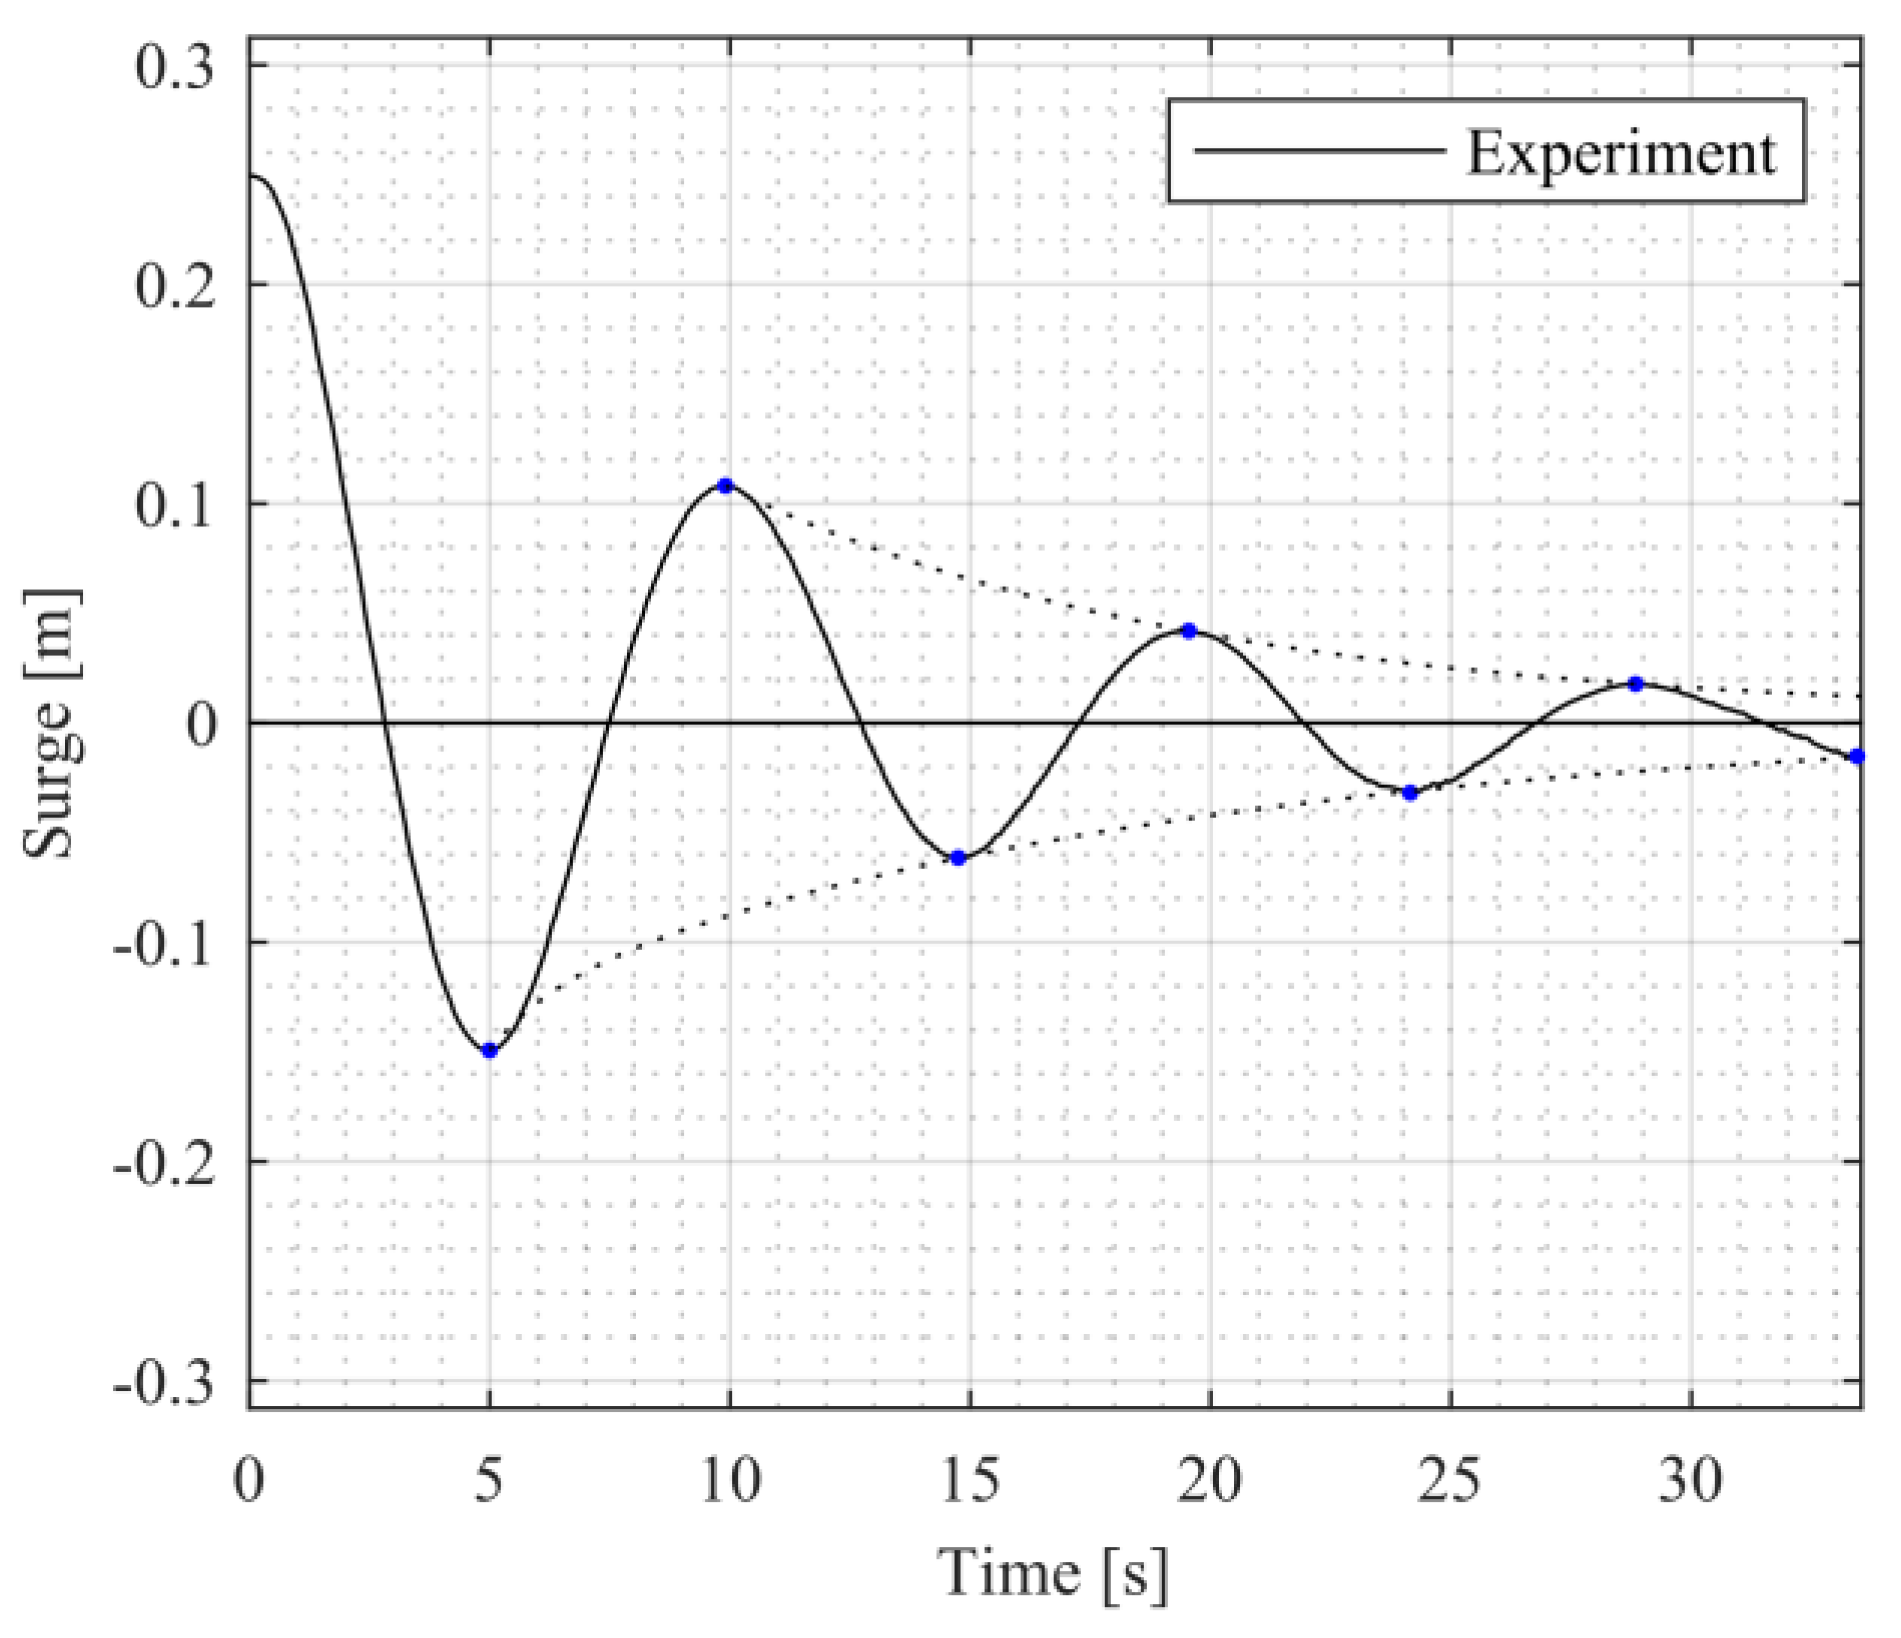
7.2. Free Surge Decay Test

Figure 13 illustrates the moored WEC as a mass M placed between to springs of stiffness k. The mass of the WEC activated in horizontal motion, including water in the chambers is approximately:
M = D · B · L · ρ = 0.165   m · 0.345   m · 3   m · 1000   kg m 3 = 171 kg
where ρ is themassdensity of water, D is the draught, B is the beam and L is the length, as the added mass in surge is insignificant compared to the mass of the vessel and enclosed water in the OWC chambers. The stiffness felt by the model when attached to a pretension turret is about twice the stiffness of the individual mooring. K = 2 k where k is the stiffness of the mooring line.
T 0 k = 2 · π · M K = 2 · π · M 2 k ,
Resulting in T035N/m = 9.79 s, which is close to the observed model scale values shown on Figure 14. The calculated stiffness is based on an assumption of linear stiffness, while the experimental mooring stiffness is expected to be non-linear and will affect the measured results particularly for large excursions. Time series of the motions from the decay test are presented in Figure 14. Extracting the average time distance between peaks and troughs, the surge natural frequency is defined. The results provided a value of T = 9.6 s for the compliant line.
The surge decay test was used to compare and calibrate the surge natural frequency and the surge linear and quadratic damping in the numerical model. Figure 15a illustrates in full scale values in a comparison between the numerical and experimental decay tests. In this system, no drag elements are added, clearly illustrating a difference between the natural frequencies, and a significant underestimation of the damping in the system. Using iterative calibration, Figure 15b presents the optimized model, where the drag element has been added to provide quadratic damping. Additional linear damping is added, to provide agreement between the experimental and numerical models. In Table 4, the natural frequencies are presented.
Minor differences are observed between the numerical and experimental natural frequencies. As previously explained, the experimental mooring stiffness is expected to be non-linear resulting both from non-linear axial mooring line stiffness and the geometrical changes of the system when excursed. The numerical model is capable of accommodating the geometrical changes while a linear stiffness has been used for the mooring line. This might explain the discrepancy.

7.3. Dynamic Mooring Load Tests for the Turret Mooring

The irregular long crested wave tests are based on Bretschneider spectra, with significant wave heights and periods as listed in Table 5 and plotted in Figure 16.

7.4. The Experimental Setup and Test Series

During the experiments the waves was measured using the three wave probes, the mooring loads using 3 load cells and the motions using cameras.
The survival experiments were carried out for two different mooring systems with different compliances, each run was identified by a series number, used stiffness, mooring geometry and initial pretension as indicated in Table 6 below. For each stiffness two different values of pretension were tested, and the tests were repeated to gain some data concerning the uncertainty of the experiments, i.e., how accurate and repeatable the measurements are.
The experiments M8 and M9 were carried out in regular waves, but will not be treated further in this study.

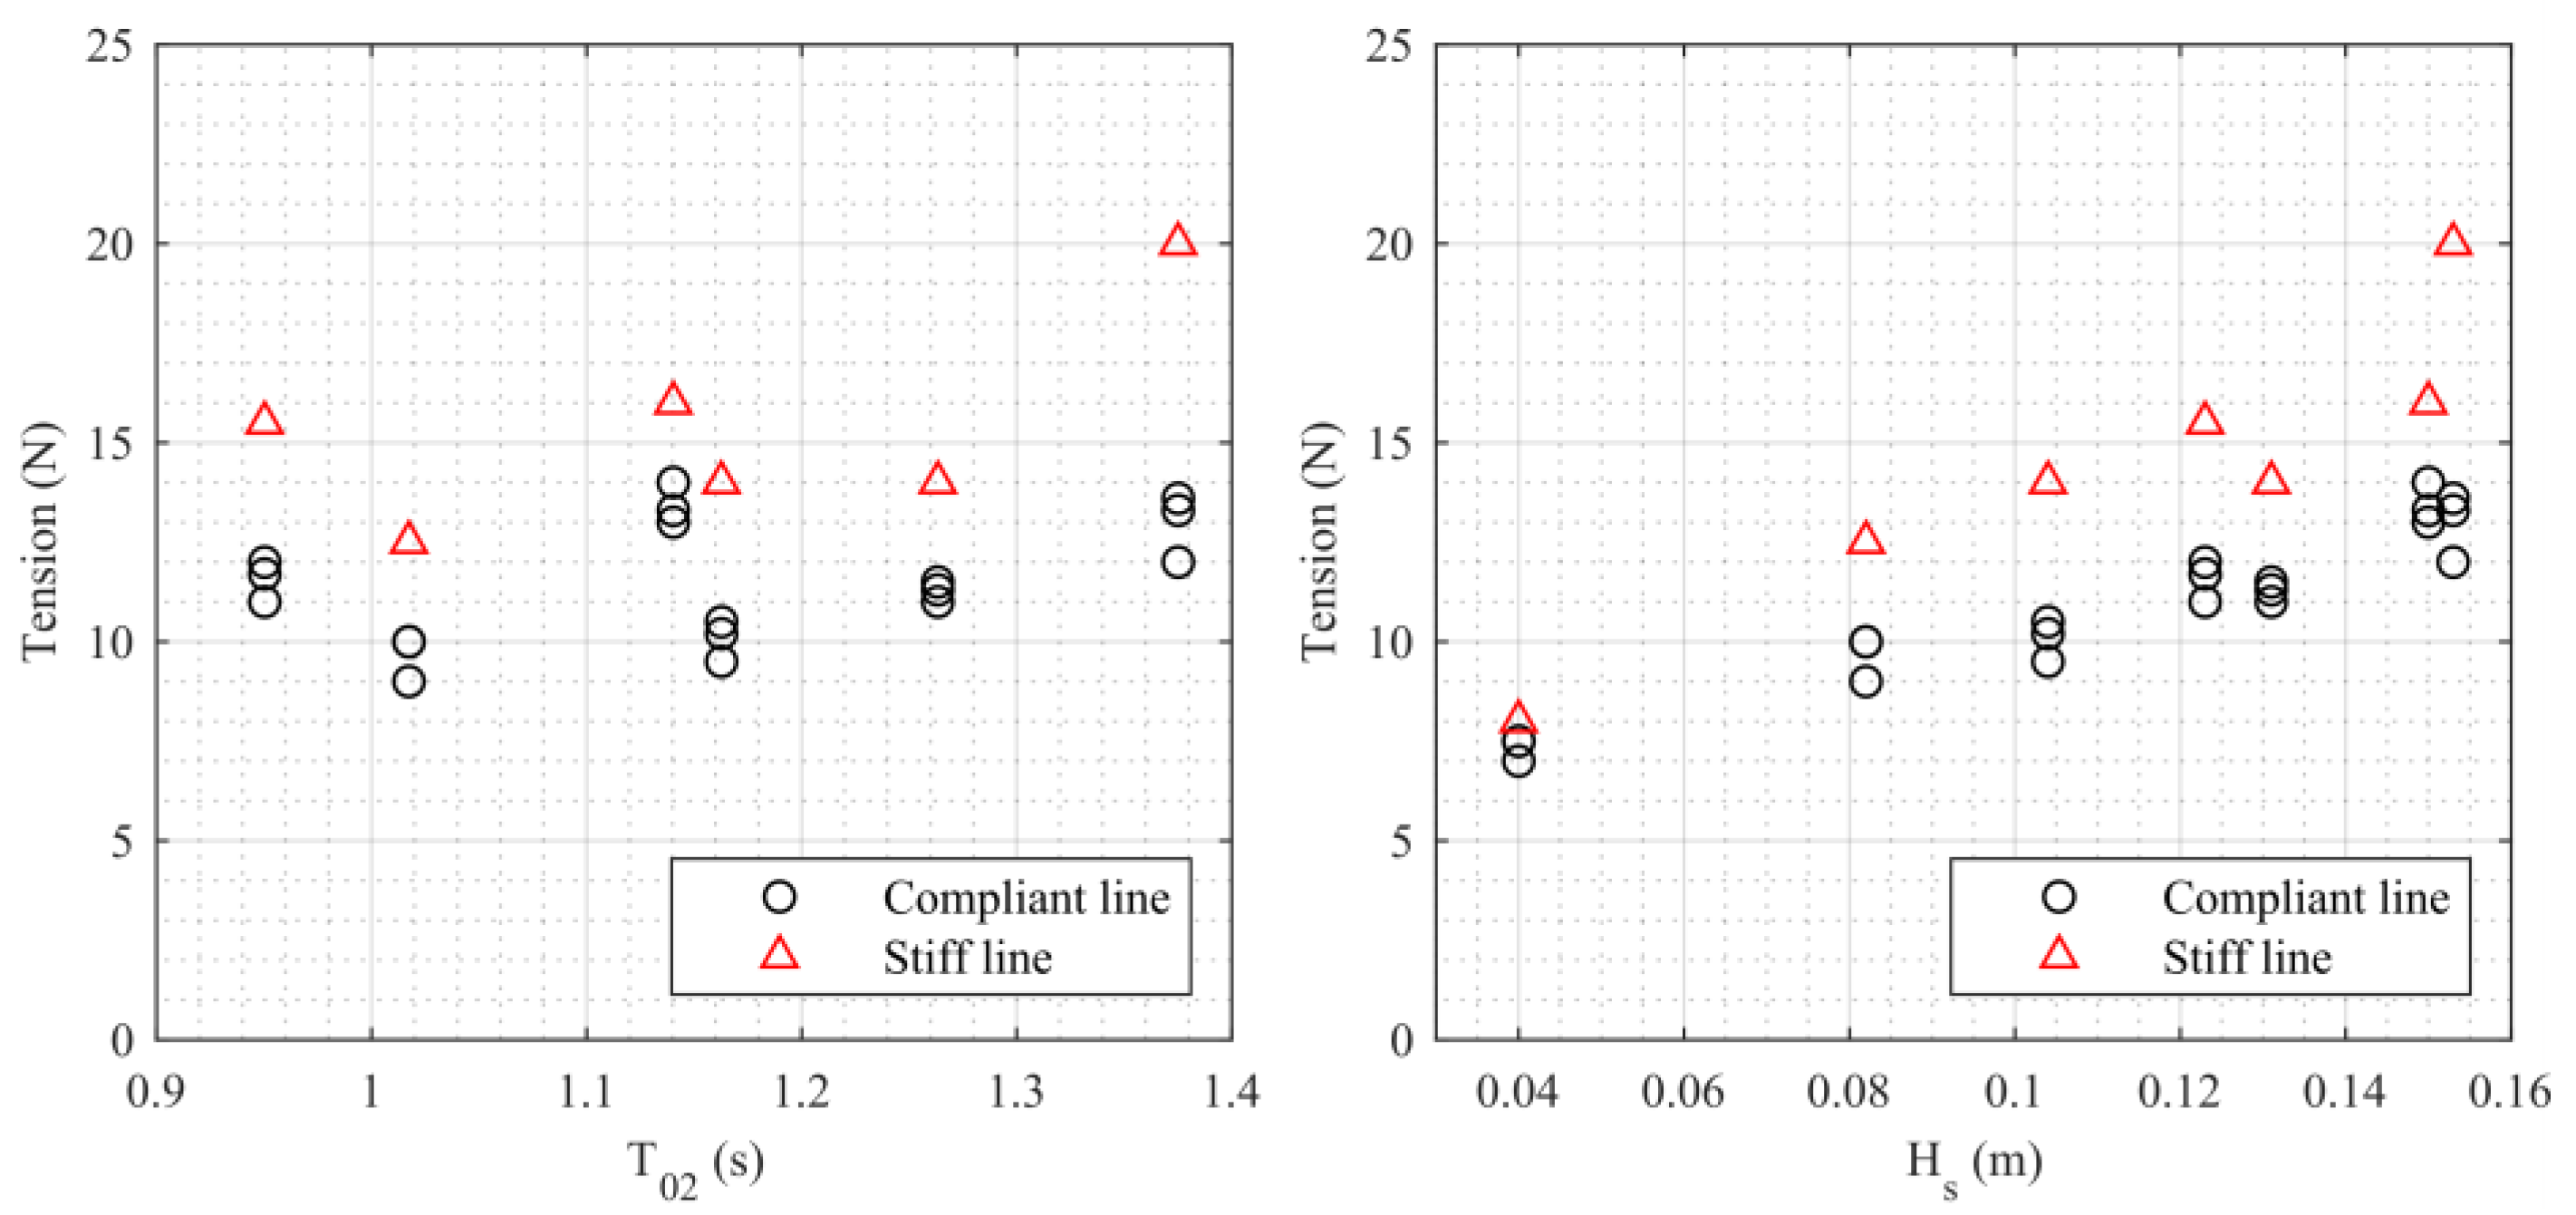
7.5. The Measured Mooring Loads

The tension results from the different mooring setups and sea states are presented in Figure 17. As seen from the figure, the repeated tests of each sea state in the experimental setup have provided a spread in the results. As expected, the stiff line provides higher loads compared to the more compliant line, but a stiffer line also results in smaller surge motions. Furthermore, a clear tendency of increasing loads with increasing wave height is also observed, which is also to be expected.

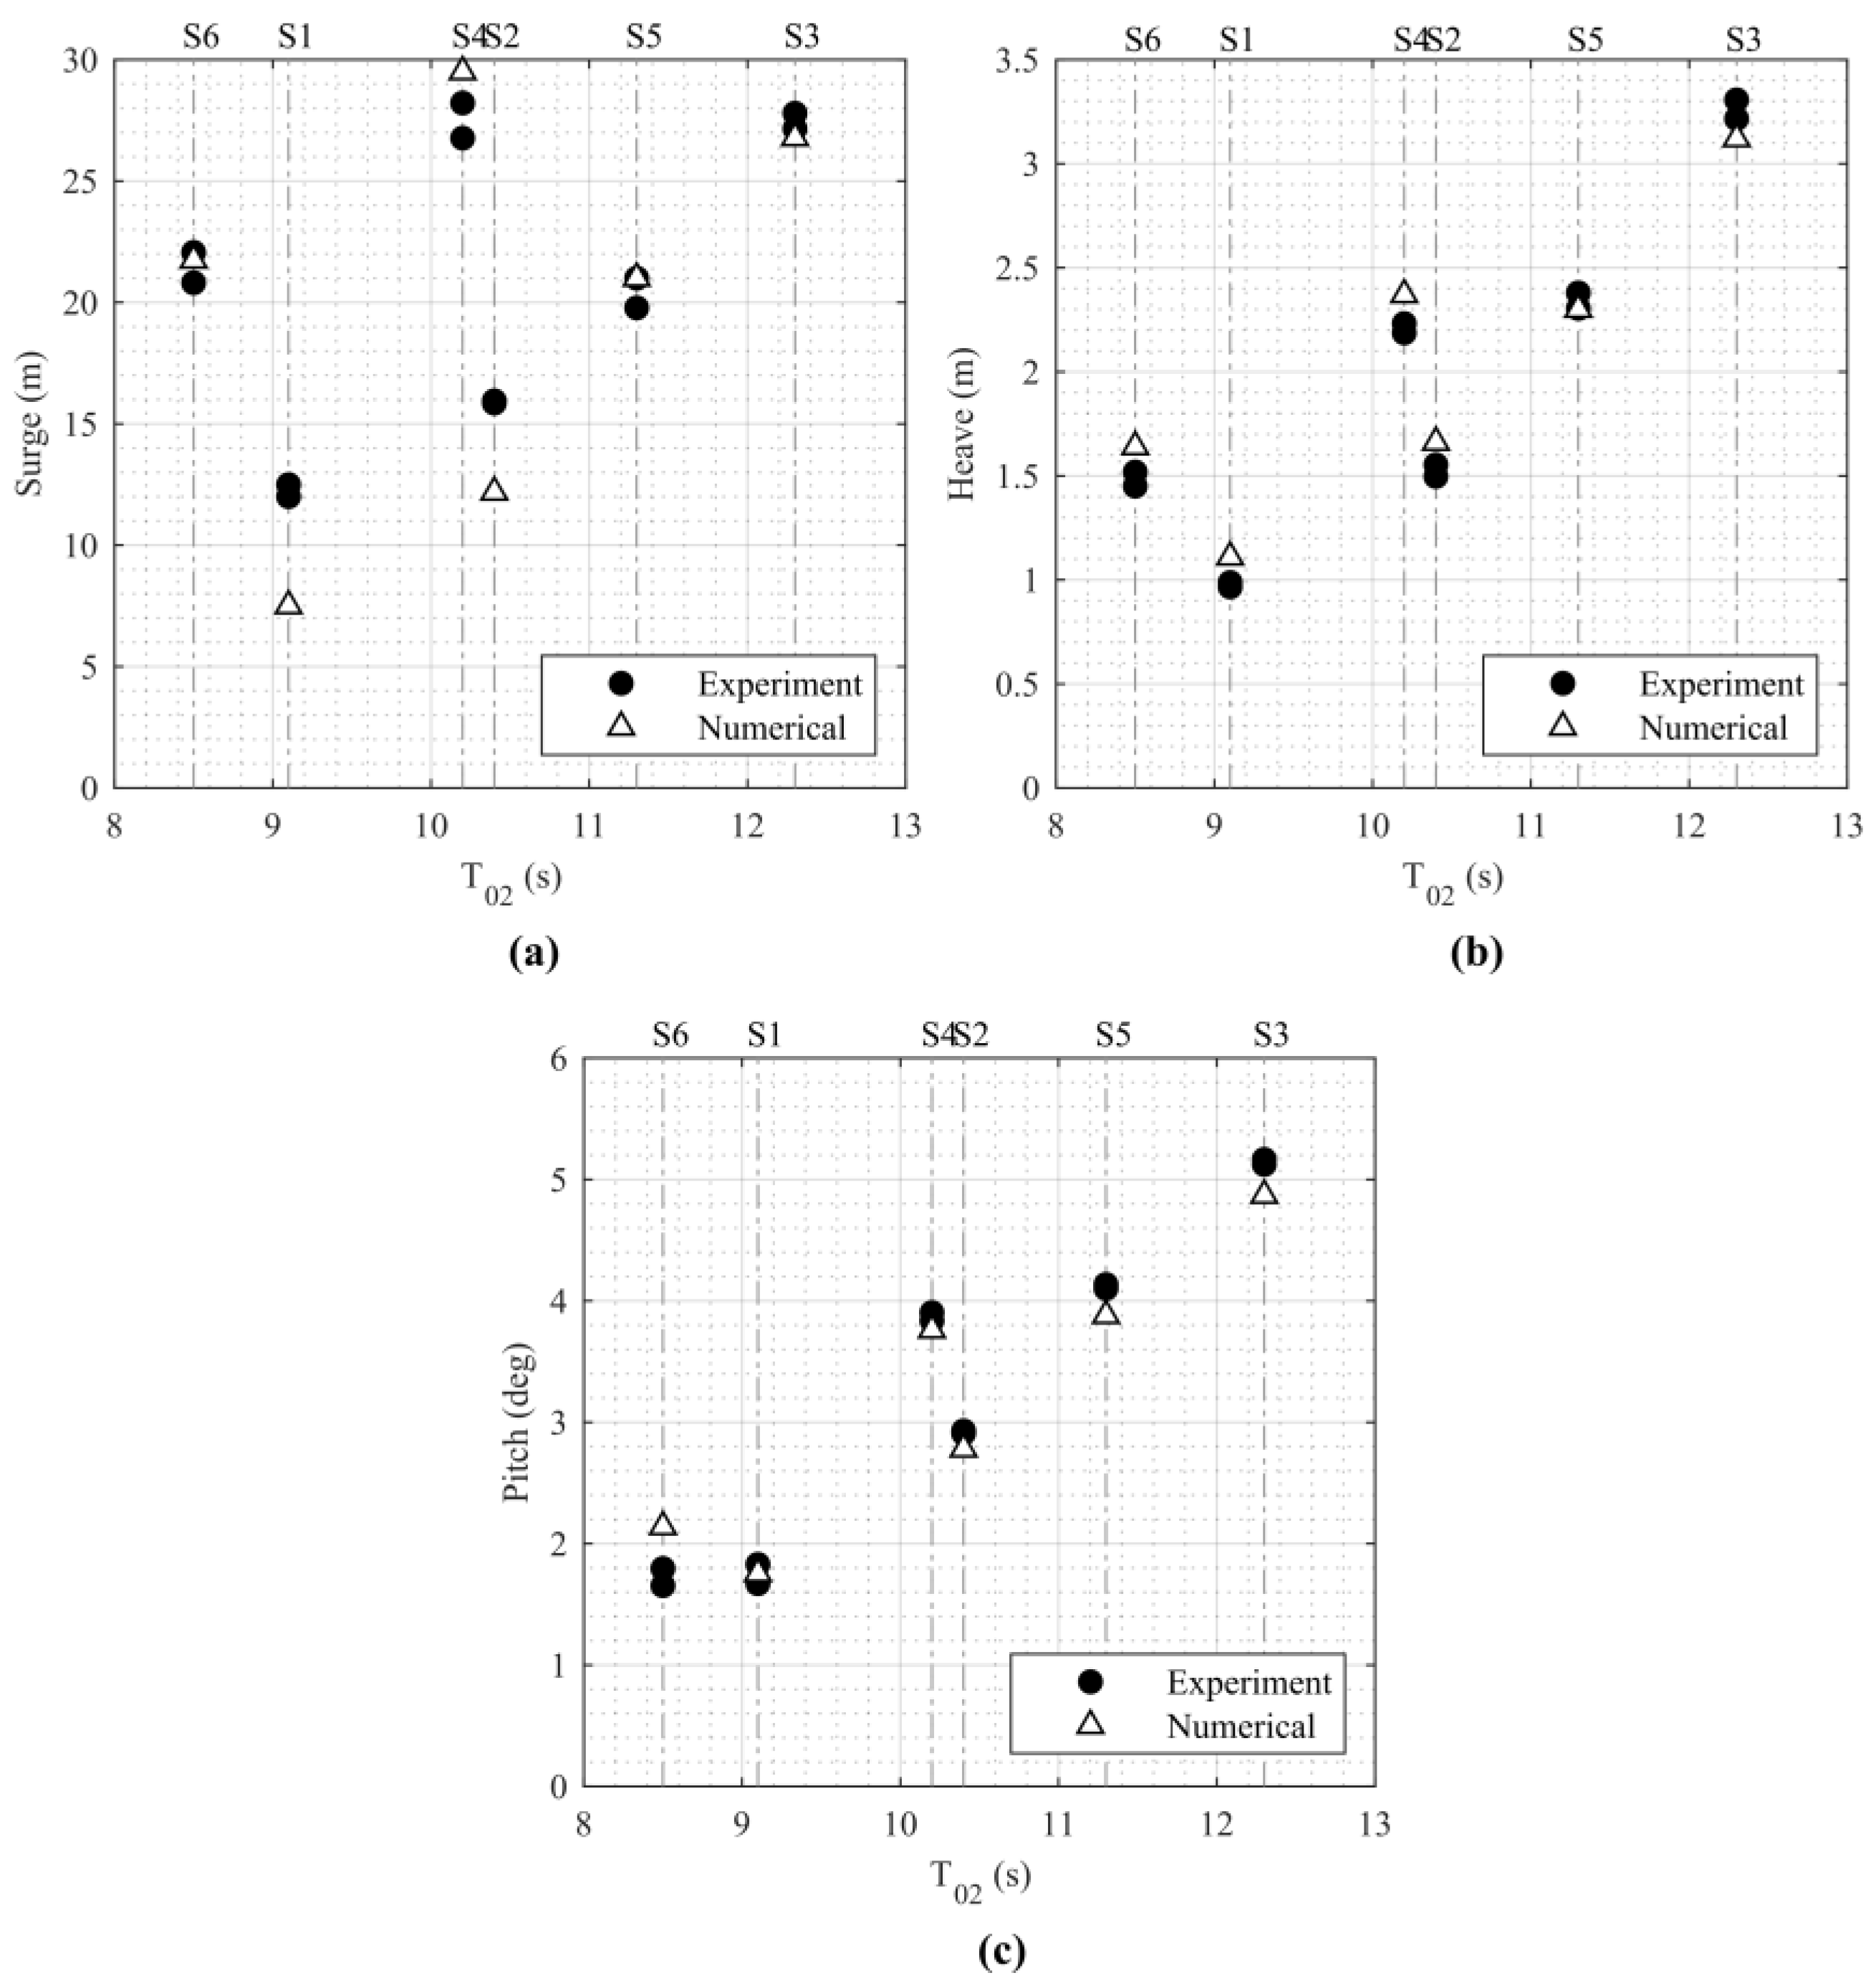
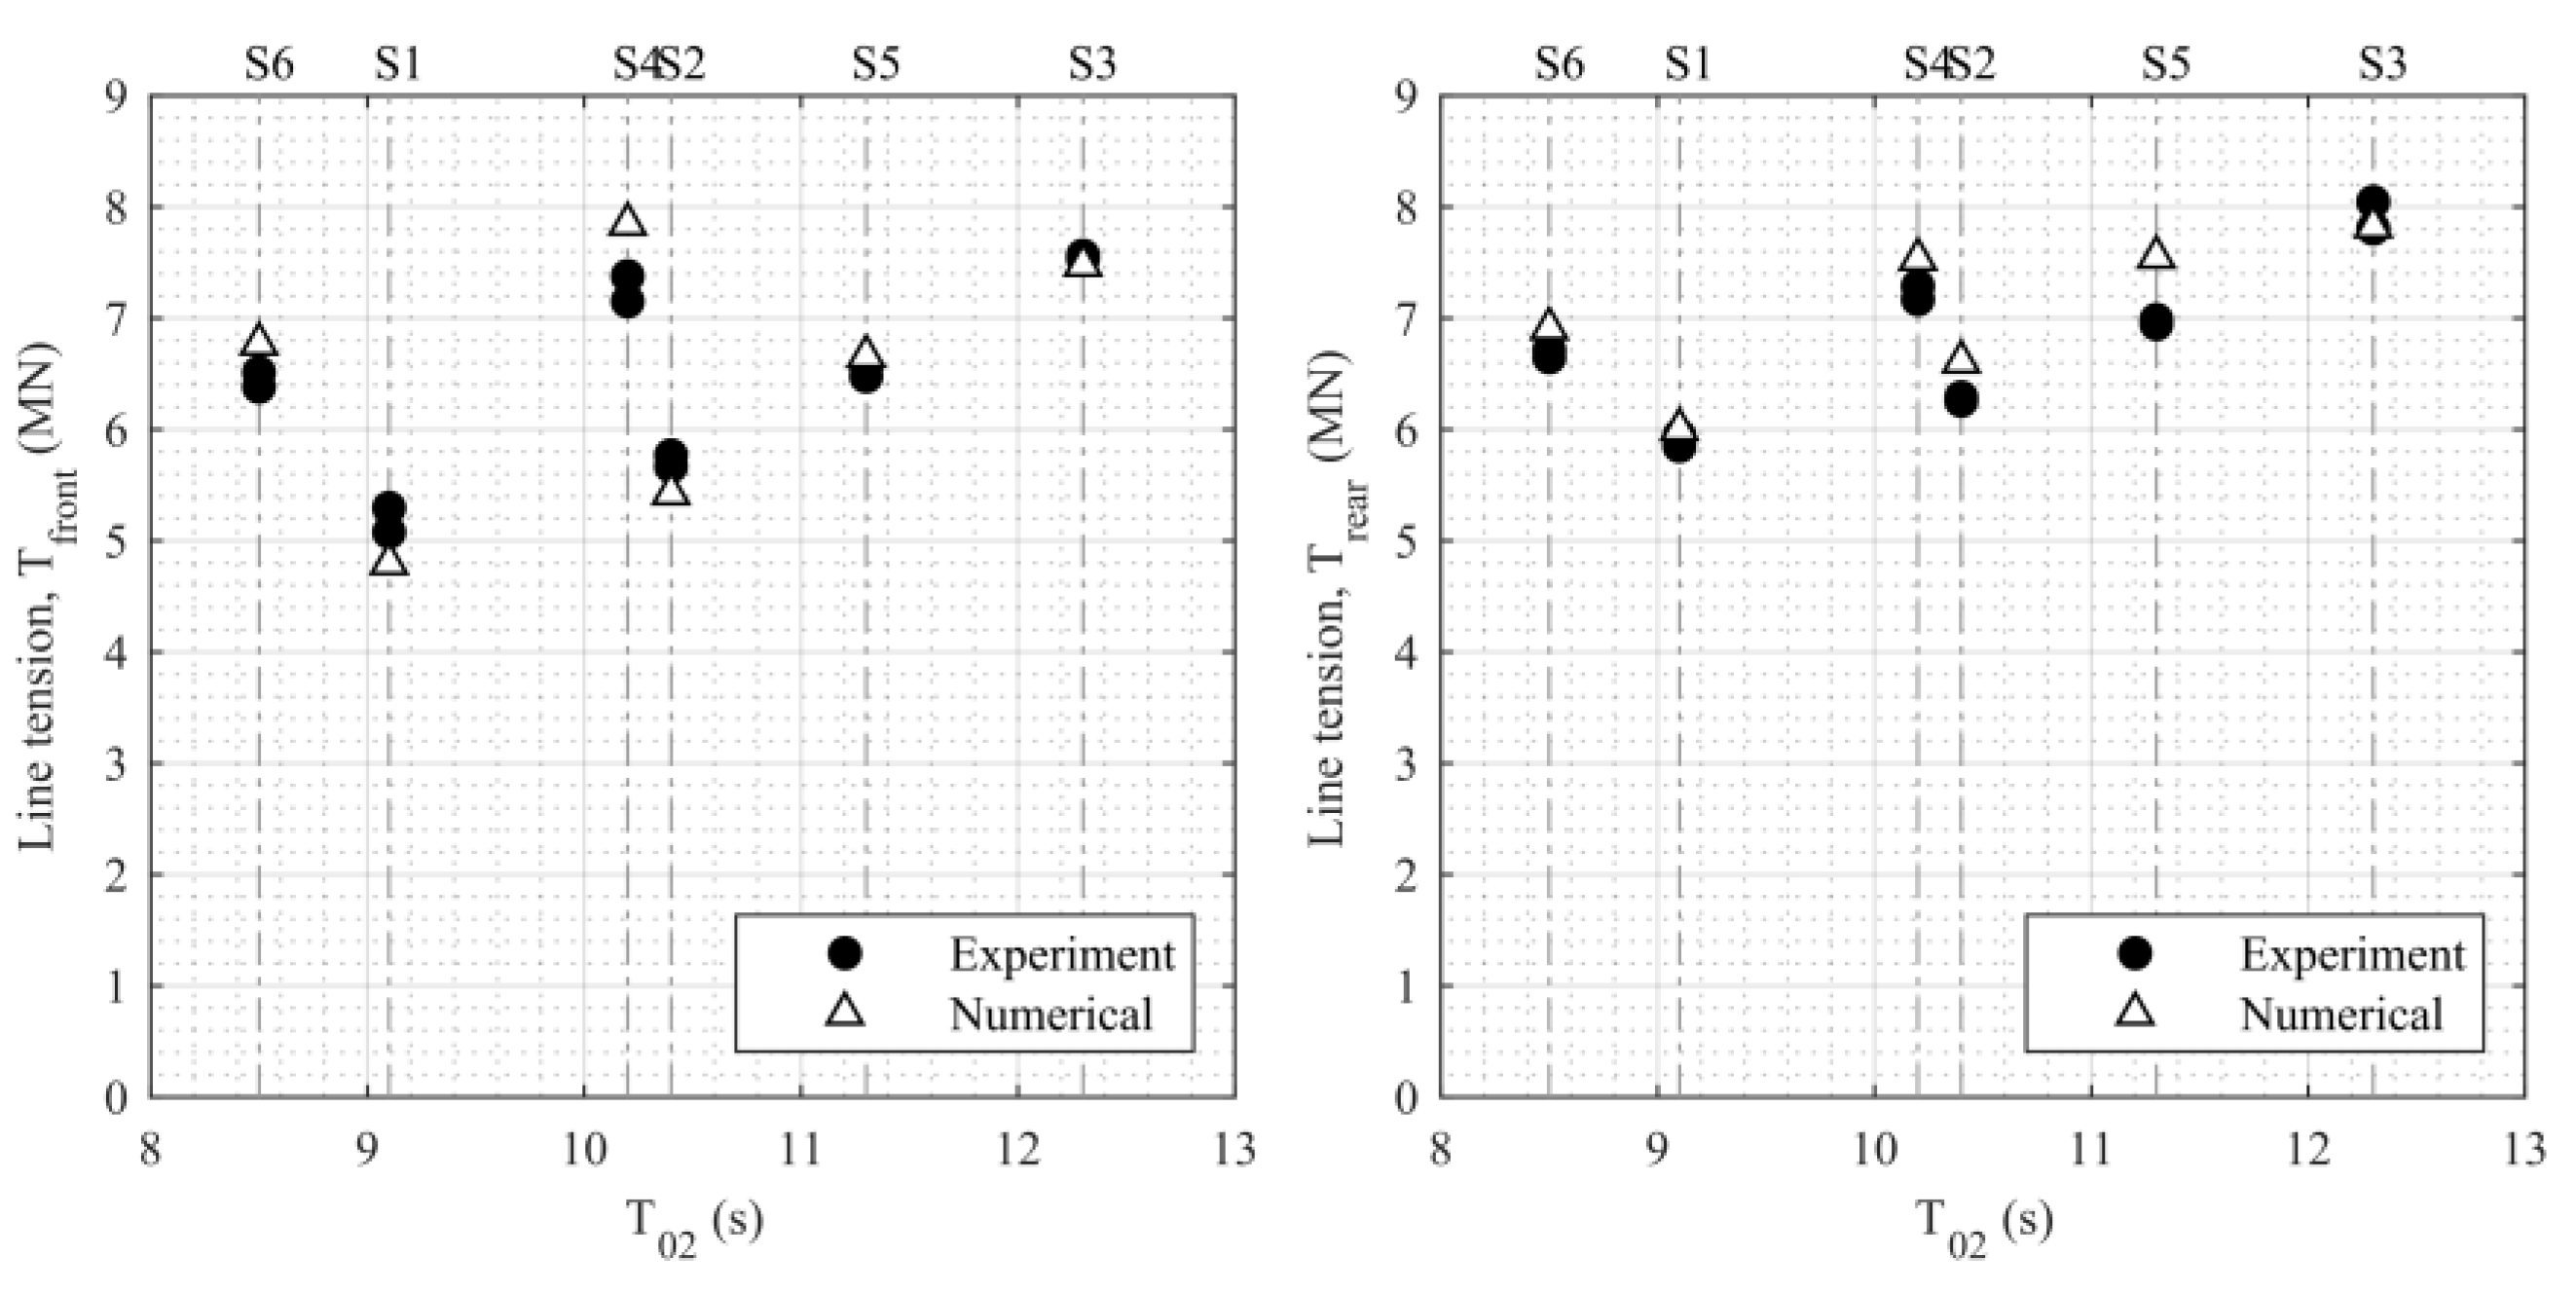
7.6. The Calculated Mooring Loads Compared to Selected Experiments

The sea states were simulated in OrcaFlex with the calibrated numerical model. Similar sea conditions and spectra were applied and tested for a selected duration of time to provide a sufficient number of waves. A comparison between the obtained Most Probable Maximum (MPM) motion values are presented in Figure 18. In design standards such as DNV-OS-E301 [18], MPM values are used as design values for mooring systems, hence the use of this in this study. The value is calculated from the time series and corresponding spectrum using the following equation.
X MPM = μ + σ 2   ln ( N ) ,
where XMPM is the MPM value, μ is the mean value, σ is the standard deviation and N is the number of oscillations in 1000 waves. Comparison of e.g., maximum values between the numerical and experimental is only reasonable if the wave elevation time series are identical. Otherwise, the maximum values are random and not comparable. The MPM value is based on the spectrum of calculated and measured tensions/motions, and hence makes a direct comparison more reasonable.
A clear agreement between the motions is observed, where the numerical model follows the same tendency as the experimental. There is no clear tendency in whether the numerical results are overestimating or underestimating the motions.
All values and results from the experiments are scaled up (1:80) using Froude’s scaling law. The results in the remain of the section is presented in full-scale values. For simplicity, the present study only treats the results found from the compliant mooring system.
Like the motions in Figure 18, the line tensions are compared between the numerical and experimental models. The results are presented in Figure 19. Again, an agreement is observed between the experimental and numerical values. For the rear mooring line, the tensions are overestimated in the numerical model, while a clear tendency is difficult to deduce for the front lines.

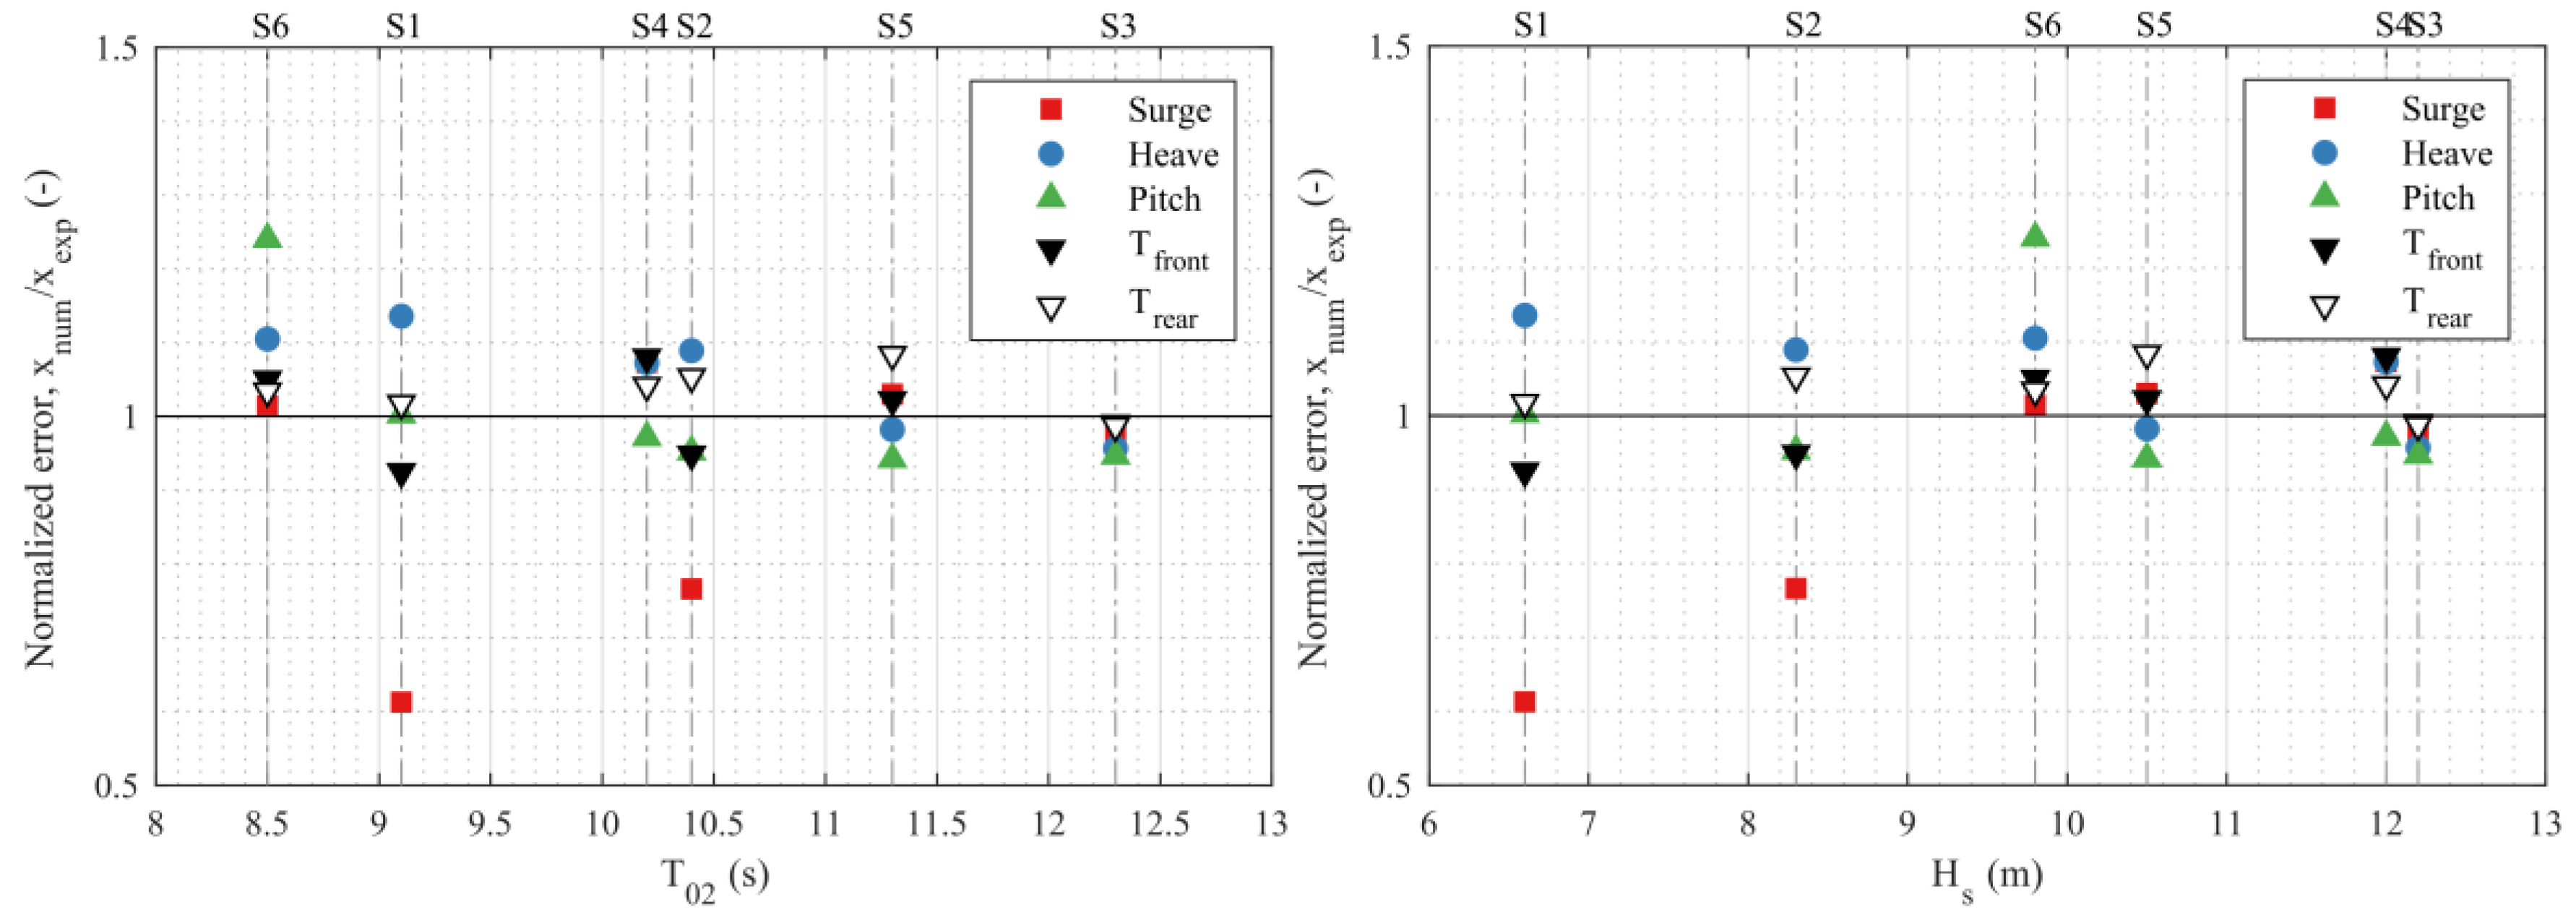
8. Discussion of the Accuracy of Results

Figure 20 presents the normalized error between the experimental and numerical tests. The right part of the figure illustrates how the error is most critical for the tests with smaller significant wave heights. In the calibration of the model, extreme waves were given most influence; hence, the error is larger for the smallest waves. Considering survivability, this assumption is reasonable.

9. Conclusions and Up-Scaling of the Result

The tested WEC survived the design wave conditions in terms of stability. The turret mooring system layout seemed to agree well with the wave-induced motions of the WEC. Scaled up by a ratio of 1:50, the results compare with a 150-meter-long attenuator WEC in survival wave conditions similar to those at the Danish test site DanWEC in Hanstholm. Scaled up by ratio of 1:80, the tests resemble the 240-meter-long attenuator placed in 45-meter-deep water in the central part of the North Sea. Both the test site DanWEC and the Central Part of the North Sea are shown on Figure 21.
The experimental and numerical tests indicated that mooring loads in the range 5–8 MN could be expected from the full-scale mooring lines, with excursions in the expected range. Considering the MBS for the lines considered earlier in the paper, this range of values is acceptable, even though safety factors have not yet been considered. The tests provided a calibration and validation of the numerical model, to be used in future investigation and design.
A preliminary relationship between the stiffness of the mooring lines and the loads measured is showed in the Table 7 below.
The next steps in the development of the KNSwing are related to the structural design. How large is the midship bending moment, and is the concrete structure strong enough to survive the extreme wave induced loads on the hull?

Author Contributions

K.N and J.B.T. jointly performed the experimental work at Portaferry as part of the Marinet KNSwing project developed jointly by K.N. The numerical simulations were conducted by J.B.T. as part of the MSLWEC project. K.N. and J.B.T. defined the outline of the conceptualization study and the experimental work. J.B.T. analyzed the data and performed the numerical analysis. K.N. drafted the paper, with input from J.B.T on the sections on numerical model and data analyses. The review needed for finalization of the paper which was done in a shared effort.

Funding

This research was funded by MARINET, a European Community Research Infrastructure Action under the FP7 “Capacities” Specific Programme, and the development of the numerical model was funded by the Energy Technology Development and Demonstration Program (EUDP) and its project “Mooring Solutions for Large Wave Energy Converters” (Grant Number 64014-0139).

Acknowledgments

The authors want to express their gratitude to the assistance received from Queens to reach the results described in this report. A special thanks to Bjoern Elsaesser and Trevor Whittaker for hospitality, advice and fruitful discussions on the future of wave power. Thanks to Paul Lamont-Kane who assisted in preparing the mooring spots in the tank, setup of the experiments as well as calibrating the sea-states for the experiments and to David Crooks for assisting with the motion capture equipment. To professor Harry B. Bingham for support and discussions and providing Master students assisting in the development of the project such as Oliver Billeskov from DTU Department of Mechanical Engineering and Frederik Pors Jacobsen who graduated from DTU in 2013.

Conflicts of Interest

The authors declare no conflict of interest.

References

  1. Barstow, S.; Mørk, G.; Mollison, D.; Cruz, J. The wave energy resource. In Ocean Wave Energy, Status and Future Perspectives; Cruz, J., Ed.; Springer: Berlin, Germany, 2008. [Google Scholar]
  2. Pelamis Wave Power. Available online: http://www.pelamiswave.com/ (accessed on 1 January 2014).
  3. Wavestar Energy. Available online: http://wavestarenergy.com/ (accessed on 1 January 2014).
  4. Moody, G.W. The NEL oscillating water column: Recent developments. In Proceedings of the First Symposium on Wave Energy Utilization, Gothenburg, Sweden, 30 October–1 November 1979; Chalmers University of Technology: Gothenburg, Sweden, 1980; pp. 283–296. [Google Scholar]
  5. Masuda, Y. Experimental full scale result ofwave power machine Kaimei in 1978. In Proceedings of the 1st International Symposium on Wave Energy Utilization, Gothenburg, Sweden, 30 October–1 November 1979. [Google Scholar]
  6. Ishii, S.; Miyazaki, T.; Masuda, Y.; Kai, G. Reports and future plans for the kaimei project. In Proceedings of the 2nd International Symposium on Wave Energy Utilization, Trondheim, Norway, 22–24 June 1982. [Google Scholar]
  7. Nielsen, K. Final Report: KNSWING Attenuator Development Phase I. Technical Report, FP7-MARINET, Marine Renewables Infrastructure Network. 2013. Available online: http://www.fp7-marinet.eu/ (accessed on 1 January 2014).
  8. Nielsen, K.; Bingham, H. MARINET experiment KNSWING testing an I-Beam OWC attenuator. Int. J. Mar. Energy 2015, 12, 21–34. [Google Scholar] [CrossRef] [Green Version]
  9. Bingham, H.; Ducasse, D.; Nielsen, K.; Read, R. Hydrodynamic analysis of oscillating water column wave energy Devices. J. Ocean Eng. Mar. Energy 2015, 1, 405–419. [Google Scholar] [CrossRef]
  10. Nielsen, K.; Bingham, H.; Thomsen, J. On the Absorption of Wave Power Using Ship Like Structures. In Proceedings of the Twenty-Eighth (2018) International Ocean and Polar Engineering Conference, ISOPE, Sapporo, Japan, 10–15 June 2018. [Google Scholar]
  11. Thomsen, J.B. On Mooring Solutions for Large Wave Energy Converters. In Proceedings of the 12th European Wave and Tidal Energy Conference, European Wave and Tidal Energy Conference. Technical Committee of the European Wave and Tidal Energy Conference, Cork, Ireland, 27 August–1 September 2017. [Google Scholar]
  12. Falcão, A.F.; Gato, L.M.; Henriques, J.C.; Borges, J.E.; Pereiras, B.; Castro, F. A novel twin-rotor radial-inflow air turbine for oscillating-water-column wave energy converters. Energy 2015, 93, 2116–2125. [Google Scholar] [CrossRef]
  13. Thomsen, J.B.; Ferri, F.; Kofoed, J.P.; Black, K. Cost Optimization of Mooring Solutions for Large Floating Wave Energy Converters. Energies 2018, 11, 159. [Google Scholar] [CrossRef]
  14. Thomsen, J.B.; Ferri, F.; Kofoed, J.P. Validation of a tool for the initial dynamic design of Mooring systems for large floating wave energy converters. J. Mar. Sci. Eng. 2017, 5, 45. [Google Scholar] [CrossRef]
  15. Babarit, A.; Delhommeau, G. Theoretical and numerical aspects of the open source BEM solver NEMOH. In Proceedings of the 11th European Wave and Tidal Energy Conference (EWTEC2015), Nantes, France, 6–11 September 2015. [Google Scholar]
  16. Orcina Ltd. Orcaflex User Manual; Orcina Ltd.: Cumbria, UK, 2018. [Google Scholar]
  17. Cummins, W.E. The Impulse Response Function and Ship Motions; No. DTMB-1661; David Taylor Model Basin: Washington, DC, USA, 1962. [Google Scholar]
  18. Morison, J.R.; Johnson, J.W.; Schaaf, S.A. The force exerted by surface waves on piles. J. Pet. Technol. 1950, 2, 149–154. [Google Scholar] [CrossRef]
  19. Nielsen, K.; Rugbjerg, M.; Hesselbjerg, J. Kortlægning af bølgeenergiforhold i den danske del af Nordsøen; Project Report; Rambøll: Copenhagen, Denmark, 1999. [Google Scholar]
  20. Det Norske Veritas. Offshore Standard DNV-OS-E301 Position Mooring; Det Norske Veritas: Høvik, Norway, 2010. [Google Scholar]
Figure 1. The conceptual design of the KNSWING.
Jmse 07 00029 g001
Figure 2. The 3-meter experimental model of the KNSWING.
Jmse 07 00029 g002
Figure 3. Panel mesh of the KNSwing used in the BEM code for estimation of hydrodynamic coefficients.
Jmse 07 00029 g003
Figure 4. Flow-chart of the numerical model.
Jmse 07 00029 g004
Figure 5. Plot of the sea states in DNV OS E301 North Sea [20]—Ekofisk (North Sea), and selected scaled-up sea states used for the model testing.
Jmse 07 00029 g005
Figure 6. Experimental setup in the 12-meter-wide and 16-meter-long shallow water wave basin under QUBS in Portaferry.
Jmse 07 00029 g006
Figure 7. Illustration of the mooring model.
Jmse 07 00029 g007
Figure 8. Load-elongation curve for the three lines used in the experimental mooring system.
Jmse 07 00029 g008
Figure 9. Model mooring load measurement, the load cell “SG” is the strain gauge attached above the basin, used to measure the mooring line loads, the pulleys are attached to the floor of the basin.
Jmse 07 00029 g009
Figure 10. Experimental setup used to define load extension characteristics of the mooring system.
Jmse 07 00029 g010
Figure 11. Relation between horizontal excursion and mooring line tension for the compliant mooring system.
Jmse 07 00029 g011
Figure 12. Comparison between numerical and experimental static stiffness test.
Jmse 07 00029 g012
Figure 13. Simplified system used to estimate natural periods.
Jmse 07 00029 g013
Figure 14. Time series of experimental surge decay test in model scale.
Jmse 07 00029 g014
Figure 15. Comparison of experimental and numerical surge decay tests. (a) is without added drag and linear damping. (b) is the optimized model with Morison drag elements and added linear damping.
Jmse 07 00029 g015
Figure 16. Plot and naming of selected sea states in full scale used in the present experimental analysis and numerical validation.
Jmse 07 00029 g016
Figure 17. Experimentally measured maximum tensions in model-scale values for the compliant line (series M2, M3, M5) and stiff line (Series M6) as function of wave period (left) and wave height (right).
Jmse 07 00029 g017
Figure 18. (a) Surge, (b) Heave and (c) Pitch comparison of WEC motions determined from experiments and numerical model in full-scale values for series M2.
Jmse 07 00029 g018
Figure 19. Comparison of mooring line tensions determined from experiments and numerical model in full scale values for series M2 Front mooring (left) and rear mooring (right).
Jmse 07 00029 g019
Figure 20. Normalized error between numerical model and experimental results as function of wave period (left) and wave height (right).
Jmse 07 00029 g020
Figure 21. Map showing the location of the test site DanWEC and the central part of the North Sea where larger wave farms could be located.
Jmse 07 00029 g021
Table 1. Dimensions of the model and scaled-up version of KNSwing.
KNSWINGModel = 3 mL = 150 mL = 240 m
Upscaling15080
Length L3 m150 m240 m
Beam B0.345 m17.25 m27.60 m
Height H0.230 m11.5 m18.4 m
Beam of buoyance chamber b0.10 m5 m8 m
Draught D0.165 m8.25 m13.2 m
Freeboard:0.05 m2.5 m4 m
Displacement87.4 kg11,000 ton45,000 ton
BMT0.063 m
KB0.075 m
Waterplane area0.5 m2
Water Plane Inertia roll0.0061 m4
Water depth Portaferry0.55 m27.5 m44 m
Water depth HMRC 1.0 m50 m80 m
Table 2. 100-year environmental parameters in the North Sea.
Environmental ParameterFull-Scale ValuesModel Scale Values (1:80)
Water Depth, h45.0 m0.55 m
Significant Wave Height, Hs11.0–12.0 m0.14–0.15 m
Wave Period, T0211.0–12.0 s1.2–1.3 s
Table 3. Measured stiffness of the three ropes applied to the experimental mooring system.
RopeStiffness aStiffness bStiffness cAveragePostFinal
N/mN/mN/mN/mN/mN/m
140.840.440.240.530.033.0
242.443.043.643.033.034.0
342.042.939.341.433.031.0
Table 4. Experimentally and numerically determined natural periods in surge (full scale).
ValueExperimentalNumerical
Surge natural period85.6 s86.6 s
Table 5. Full-scale and model-scale values for selected sea states.
Full ScaleModel Scale 1:80
ReferenceHmo [m]T02 [s]Hmo [mm]To2 [s]
S1S04 (S1)6.69.1821.02
S1S05 (S2)8.310.41041.16
S6S01(S3)12.412.31531.38
S6S03 (S4)12.010.21501.14
S6s07 (S5)10.511.31311.26
S6S09 (S6)9.88.51230.95
Table 6. Experimental setups and test series.
SeriesStiffness
[N/m]
Mooring Geometry
[mm]
Pretension
[N]
ResonancePeriod
[s]
MKL1L2L3s1s2s3To
Irregular Waves
1352122122125.058.010
2
3
5
6.9
7.0
6.5
6.7
7
6.1
8.6
9.0
6.7
61302082082159.49.611.25
Regular Waves
8130 8.68.610.65
935 7.57.510.210
Table 7. Dimensions of the scaled-up version of KNSwing.
KNSWINGModelKNSwing 150KNSwing 240
Ave. Absorbed Power @ Hs = 5 m 2500 kW10,000 kW
Length L3 m150 m240 m
Beam B0.345 m19.5 m28.80 m
Draught D0.165 m8 m12.8 m
Displacement87.4 kg12.000 ton45.000 ton
Location PortaferryDanWECNorth Sea
Water depth0.54 m27 m45 m
Max Hs0.152 m7.6 m12.2 m
Peak Period Tp1.77–1.87 s12.5–13.2 s15.8–16.7 s
Mooring Geometry
Length 2 m100 m160 m
Stiffness Medium33 N/m92 kN/m236 kN/m
Stiffness Stiff 130 N/m328 kN/m830 kN/m
Mooring Loads Medium11.5 N1440 kN5900 kN
Mooring Loads Stiff16.8 N2100 kN8600 kN

