Article

A Study on the Air Cavity under a Stepped Planing Hull

1
College of Computer Science and Technology, Harbin Engineering University, Harbin 150001, China
2
China Ship Scientific Research Center, Wuxi 214082, China
*
Author to whom correspondence should be addressed.
J. Mar. Sci. Eng. 2019, 7(12), 468; https://doi.org/10.3390/jmse7120468
Submission received: 28 October 2019 / Revised: 13 November 2019 / Accepted: 14 November 2019 / Published: 17 December 2019
(This article belongs to the Special Issue Ship Hydrodynamics)

Abstract

:
Based on the FVM (finite volume method) numerical method, the flow field around the stepped planing hull in Taunton series was simulated. According to the general procedure of numerical uncertainty analysis, the numerical uncertainty in the high-speed flow field simulation of the stepped planing hull was discussed. Combined with the wave-making characteristics of the hull, the generation mechanism, shape evolution of air cavity, and the pressure distribution characteristics under the influence of the cavity, focuses on the variation of the flow around the stepped planing when the hull is in the triangle planing stage. Numerical results suggest that, as the air cavity enlarges, the cover rate of the air cavity can rise up to 77.8% of the whole wetted surface of the planing hull bottom. While, in the triangle planing stage, there is additional wetting at the aft bilge, which leads to the decrease of the air cavity rate and the increase of the wetted area. At the same time, the pressure distribution concentrates to the center of gravity.

1. Introduction

The stepped planing hull, which is named from a step setting under the bottom of a hull, is a high performance high-speed hull. When the hull reaches a certain speed, the water flow separates from the step and air is absorbed from the atmosphere to form air cavity. Air cavity can substantially reduce the wetted area compared with that from conventional planing hulls, which enhances the hull performance correspondingly.
Investigation on hydrodynamic characteristics of stepped planing hulls can be traced to 1950s, when the adopted method was mainly based on model tests. Lee et al. [1] carried out model tests on a series of single stepped planing hull with different beam, deadrise angle, aft length, and step height. Garland et al. [2], Savitsky et al. [3], and Taunton et al. [4] also investigated on the hydrodynamic characteristics of stepped planing hulls with various profile features through model tests. Two stepped planing hulls also have been investigated in recent years. Huo et al. [5] discussed the influence of parameters increment on hydrodynamics characteristics of a two stepped planing hull. Li et al. [6] analyzed gravity center, weight effect on the resistance performance of a deadrise angle hull. Moreover, Shen et al. [7] and Jiang et al. [8] studied the resistance regression formula obtained for a two stepped hull and the mounting angle effects of stern flaps on the resistance performance of stepped planing hulls. Filippo [9,10,11] discussed the frictional component of the resistance, the airflow path lines, and the volume of fraction in transversal and longitudinal sections in the ACS and multi- stepped hull design, and used air cavity solution to reduce the frictional component of the resistance of a high-speed planing yacht. M.V. Makasyeyev [12] discussed that in comparison with a step less hull, transverse steps can lead to higher lift-drag ratio.
The above studies made qualitative analysis on the resistance performance of stepped planing hulls based on test data. Although experiments are the most reliable way to study the flow around hulls, high cost and time consuming are their inherent limitations. These shortcomings motivate researchers to adopt the computational fluid dynamics (CFD) techniques. CFD techniques are more powerful in the research about the details of the flow field, which can help to study physical phenomena more intuitively [13,14,15]. Moreover, Veysi et al. [16] investigated the influence of the step on the pressure distribution, hydrodynamics characteristics, and wake profile of a modern high-speed chine planing hull. M.V. [17,18] Makasyeyev investigated the relationship between wake amplitude and cavitation number, as well as the design and setting angles of the steps, besides, his research shows that high-speed heavy loaded monohull ships can benefit from application of drag-reducing air cavities under stepped hull bottoms.
However, few attention has been paid on the hull bottom flow details associated with air cavity that appears around the wetted surface of a stepped planing hull. This paper employed the CFD technique to study the air cavity of a single stepped hull selected from Taunton Series (C1 stepped hull form), as well as the cavity revolution and hydrodynamic characteristics of the planing hull. This paper can provide the optimization direction for the stepped hull design and installation of the ship appendages (e.g., spray strips, stern flap). When the stepped planing hull is at high speed, the incoming flow will separate from the bottom of the hull at the step, and slams the planing surface after passing a certain distance. This kind of motion of incoming flow will form cavity step, so the wetted area of the stepped planing hull is significantly lower than that of the conventional planing hull, and the resistance will be correspondingly reduced at high speed [19]. Since the drag reduction effect of the step depends on the cavity pattern, it is necessary to study the flow details and the relationship between cavity pattern and the hydrodynamic characteristics.

2. Numerical Setup

The CFX software, based on the finite volume method, is used to numerically study the fluid field around the planing hull. The fluid governing equations are described by the Reynold-averaged Navier–Stokes equations:
u i x i = 0
( ρ u i ) t + ( ρ u i u j ) x i = p x i + x j ( μ u i x j ρ u i u j ¯ ) + S i
where t is time; u i and u j are the time-average of the velocity component (i,j = 1,2,3); p is the mean of the pressure; ρ is the water density; μ represents the dynamic viscosity coefficient of water; ρ u i u j and S i are Reynolds stress term and volumetric force, respectively.
To precisely capture the adverse pressure gradients caused by the flow separate at hull bottom, the SST (shear stress transport) turbulence model is introduced to enclose the aforementioned equations [20]. The volume of fluid (VOF) model is adopted to track the evolution of free surface. In this model a transport equation is employed to capture the volume ratio of the air and water phases.

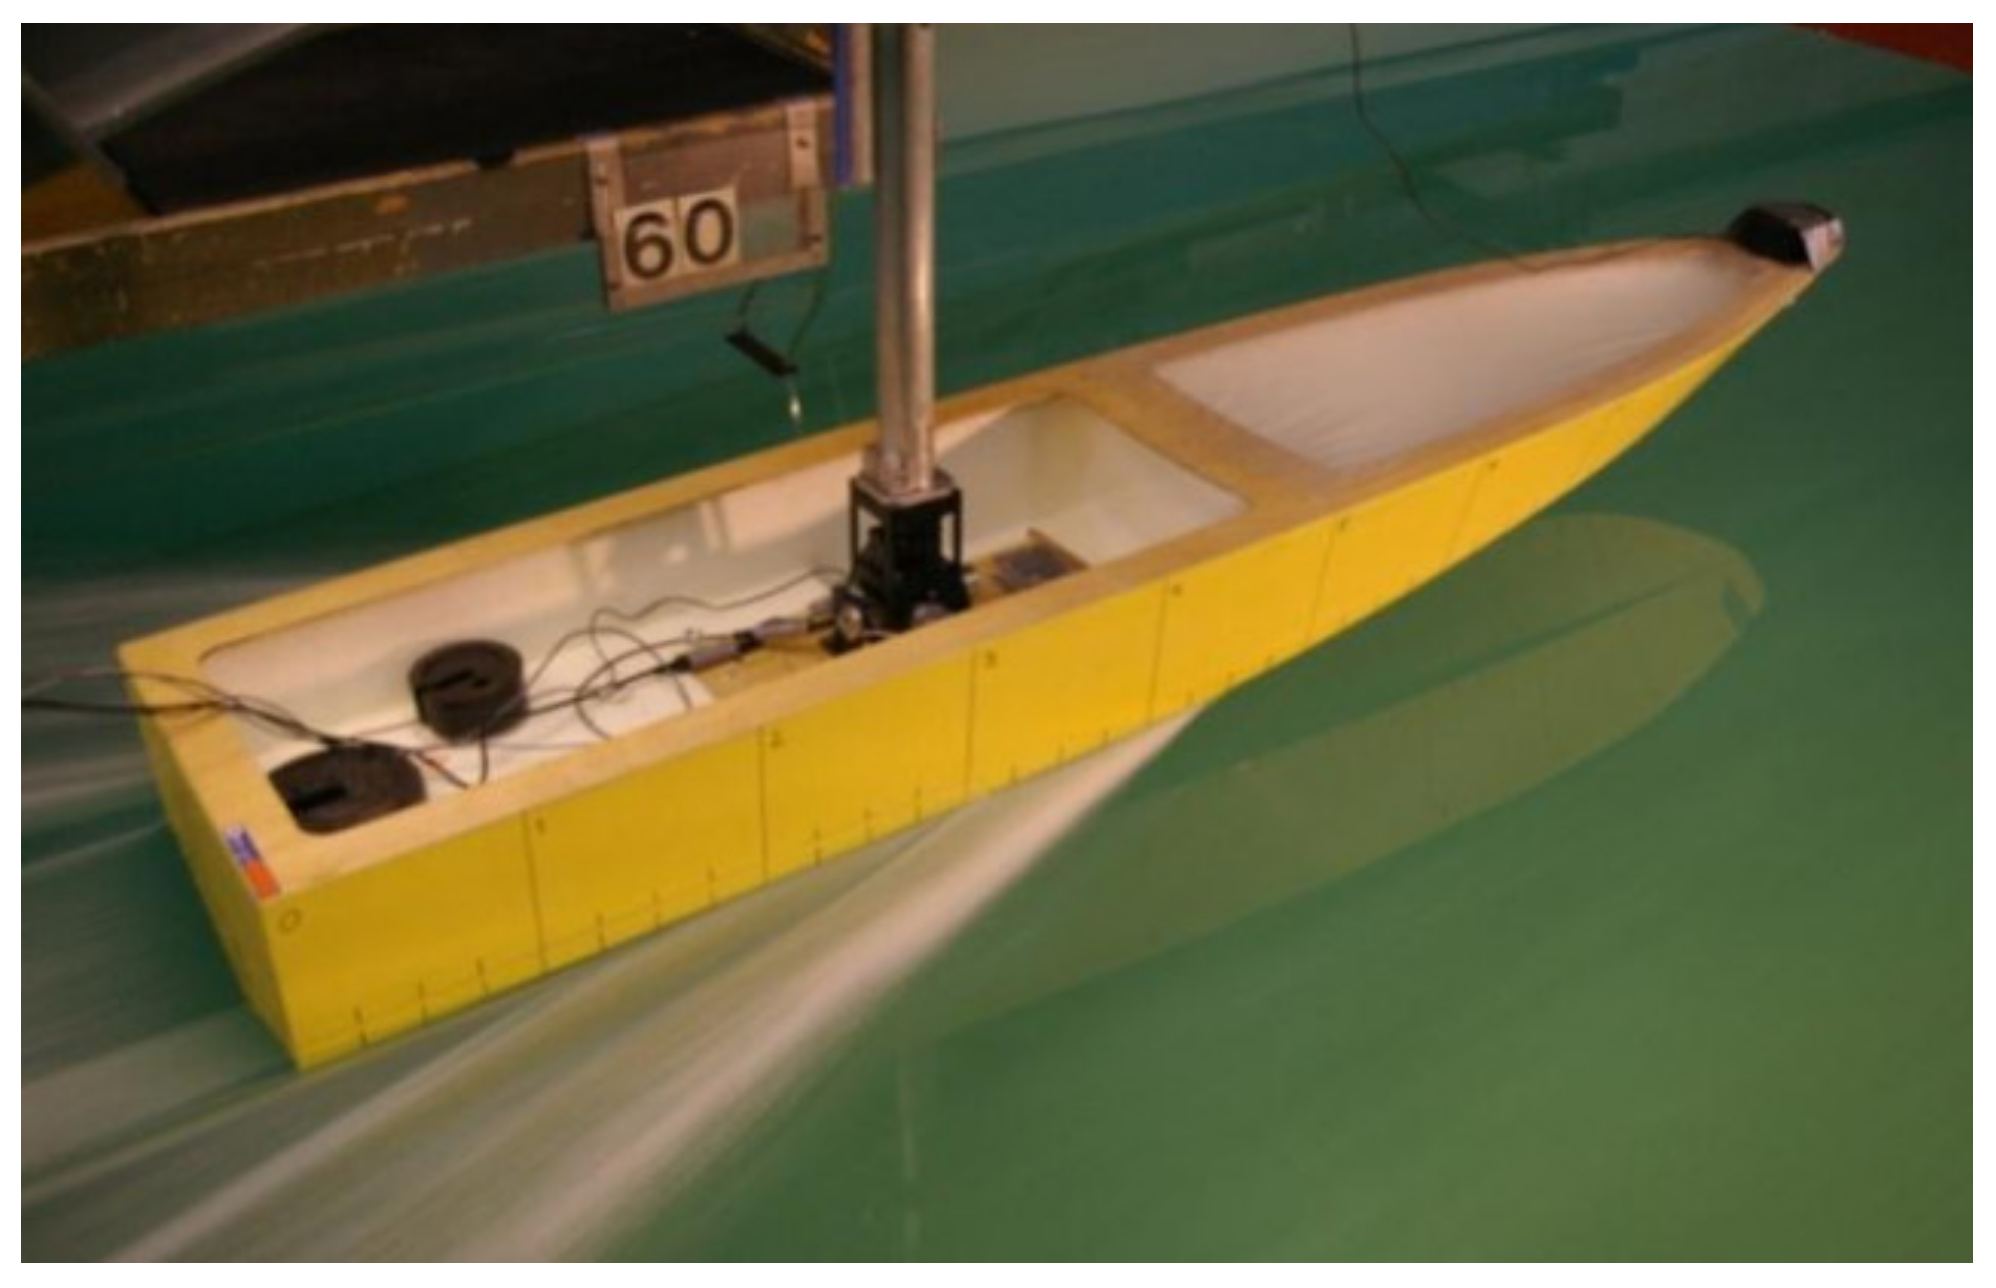
2.1. Test Facilities

The experiments were carried out in the GKN Westland Aerospace No.3 Test Tank, at their cowes facilities in Cowes on the Isle of Wight, England. The tow post was installed at the center of gravity of the model. As illustrated in Figure 1, the model trim angle and dynamic sinkage which was indicated by the gravity centre sinkage measured with rotary potentiometer. The model resistance was measured with a force block dynamometer. The main dimensions of the tank are as follows:
  • Length: 198 m
  • Breadth: 4.57 m
  • Depth: 1.68 m
  • Maximum Carriage Speed: 15 m/s

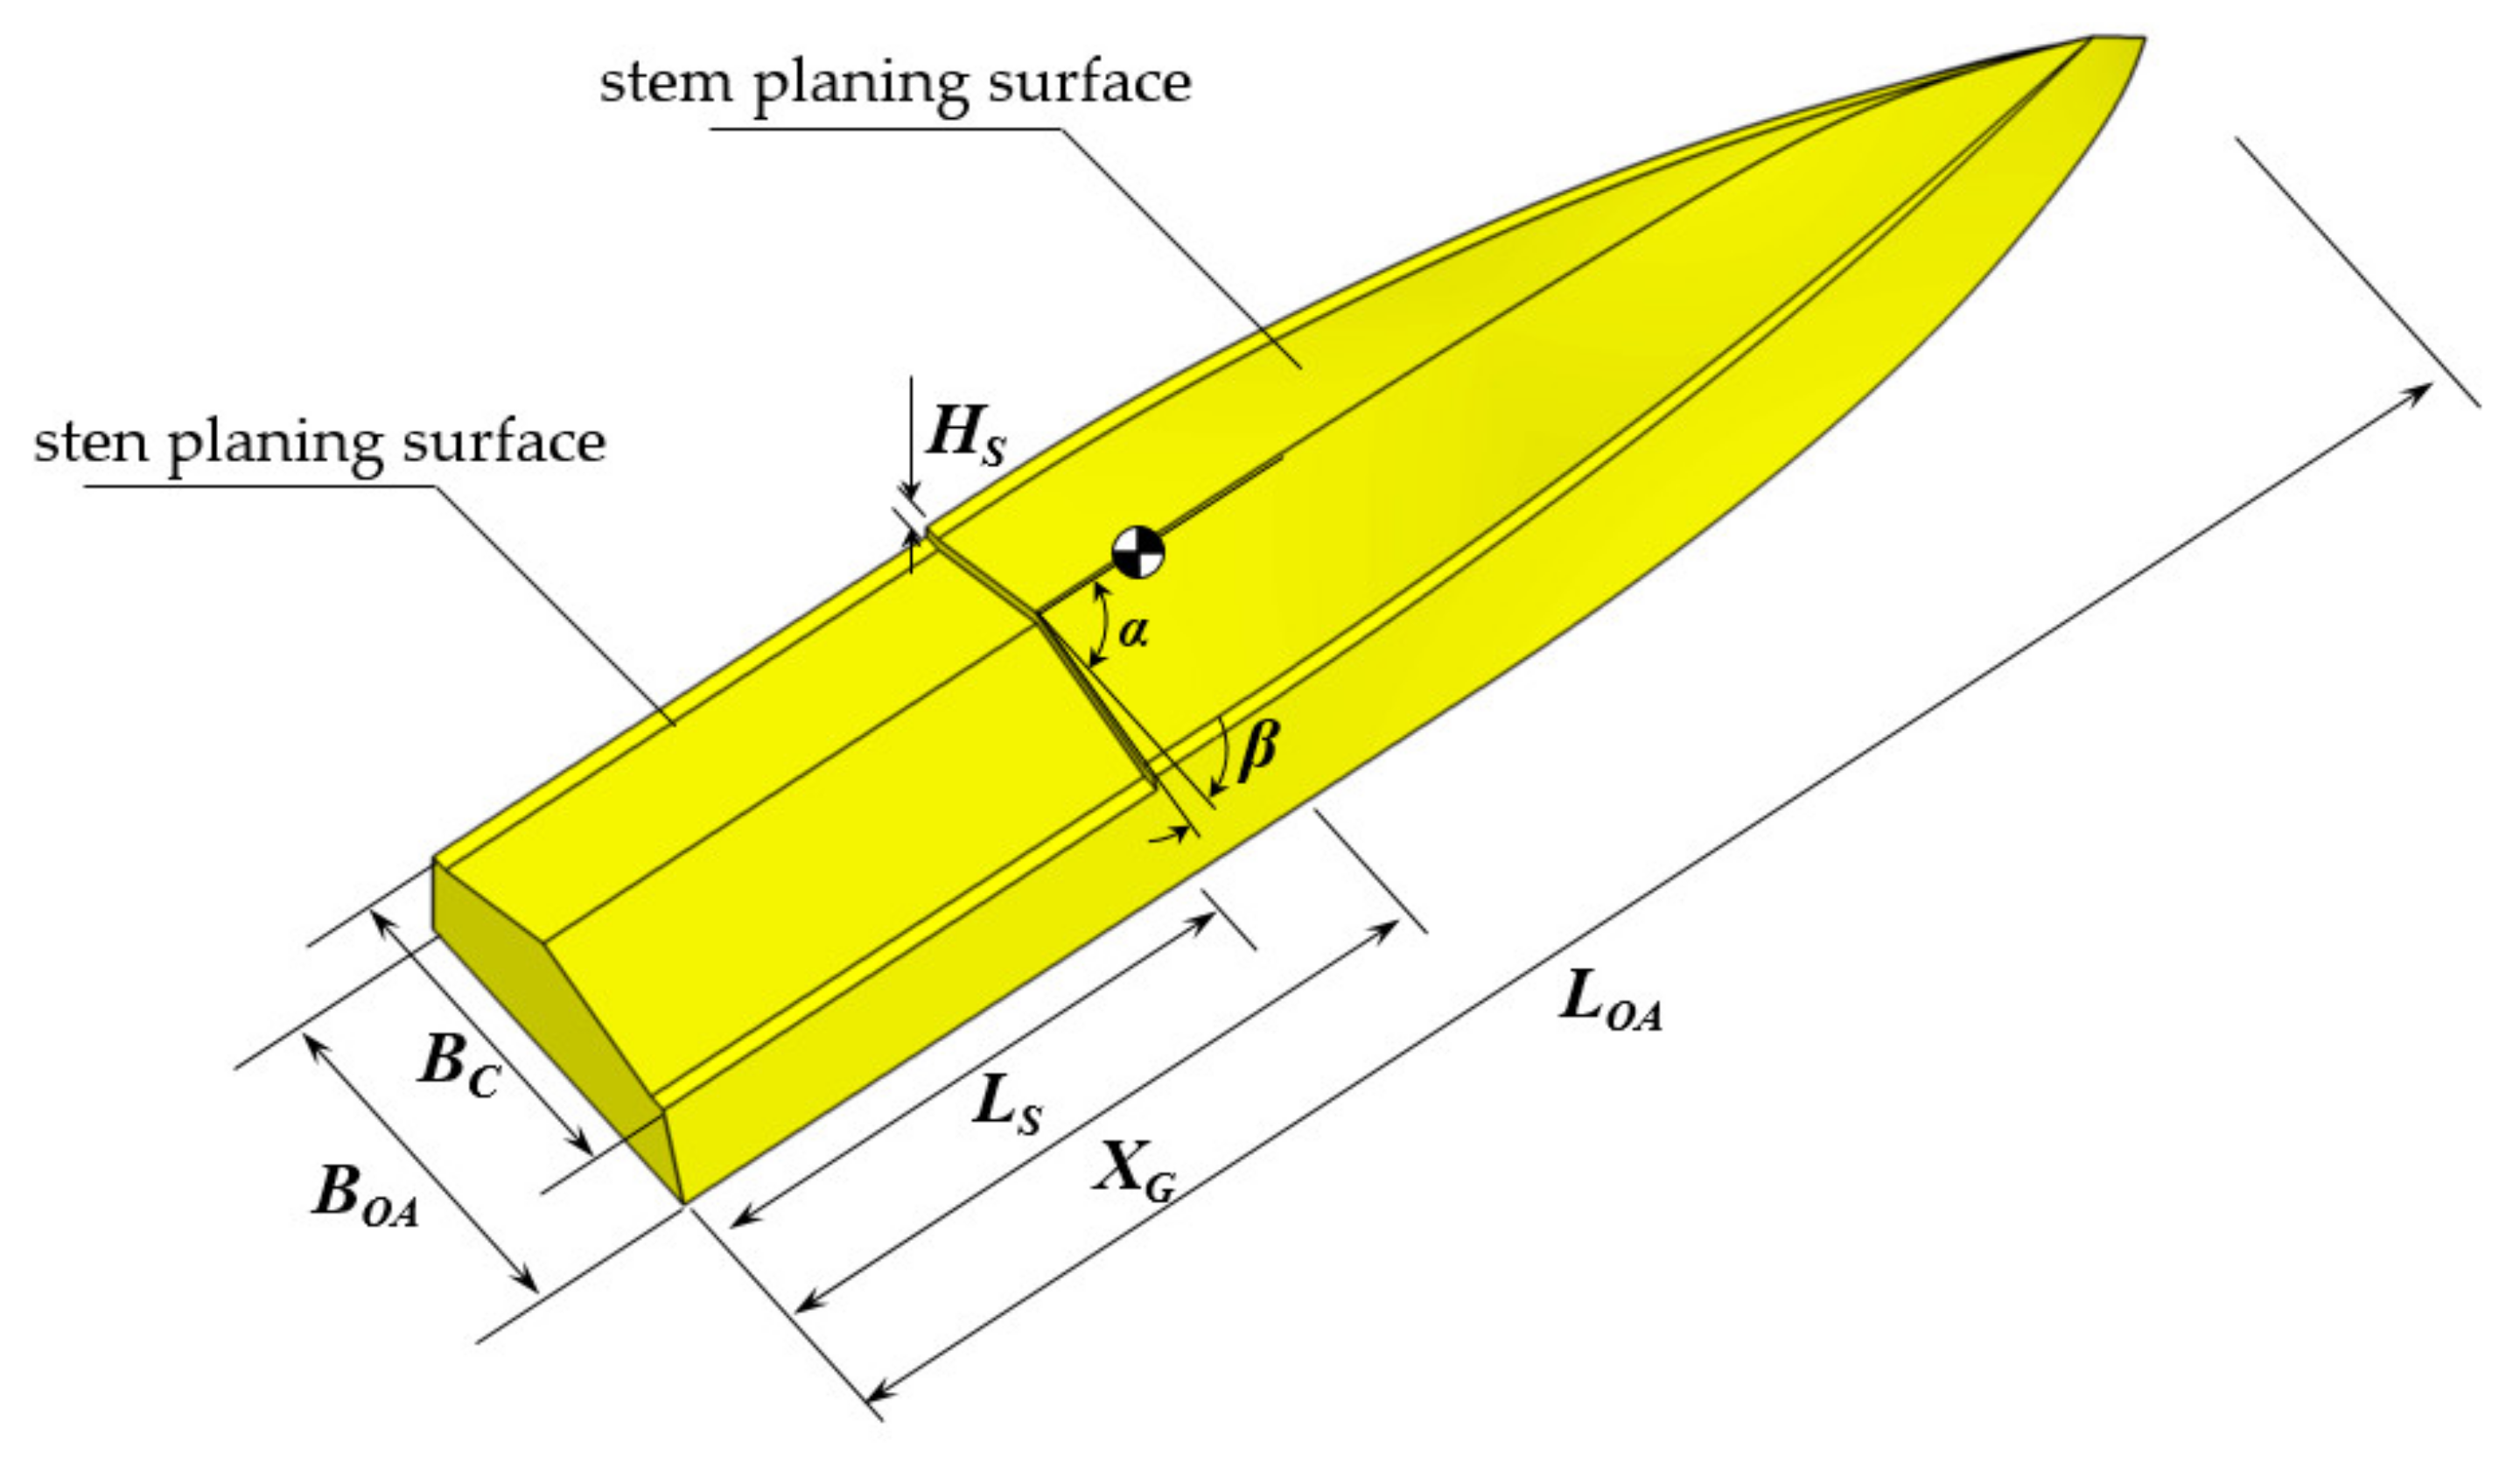
2.2. Description of Hull Geometry

Taunton series models [4] were developed from typical high-speed planing hull forms, from which the C-type model is carried out to study stepped hull resistance. Figure 2 and Table 1 present the main dimensions and configuration features of the C1 stepped hull form model. To facilitate the discussion, planing surfaces before and after the step is named as stem planing surface and stern planing surface, respectively.

2.3. Numerical Method

The hull motion behavior significantly varies with speed, and this variation has significant impact on the resistance. The shear force and pressure field distribution can be obtained by solving initial field. Force and moment applied on planing hull can be obtained by Equations (3) and (4). In this paper, the flow field and the attitude of the hull are solved to simulate the two degrees of freedom motion (pitch and heave) of the hull.
F = S ( [ τ ] p [ I ] ) n d S G  
    M = S ( r r G ) × ( [ τ ] p [ I ] ) n dS G      
where [ τ ] , p [ I ] , and G are shear force, pressure, and gravity, respectively, n is external normal vector of hull surface, r and G are random point on the hull and displacement on the gravity center. The hull motion can be obtained from the following differential equations:
F = m d 2 X d t 2  
M = d d t ( I d θ d t )
According to the results of each iteration, the mesh nodes on the hull surface and in the computational domain move to a new position, while the further flow field solution is carried out on the new mesh. Through the coupling of flow field and motion solution, the external forces and moments on the hull gradually converge to a smaller range. The hull body can be considered to achieve the balance state when variation of external forces and moments approaches to zero.

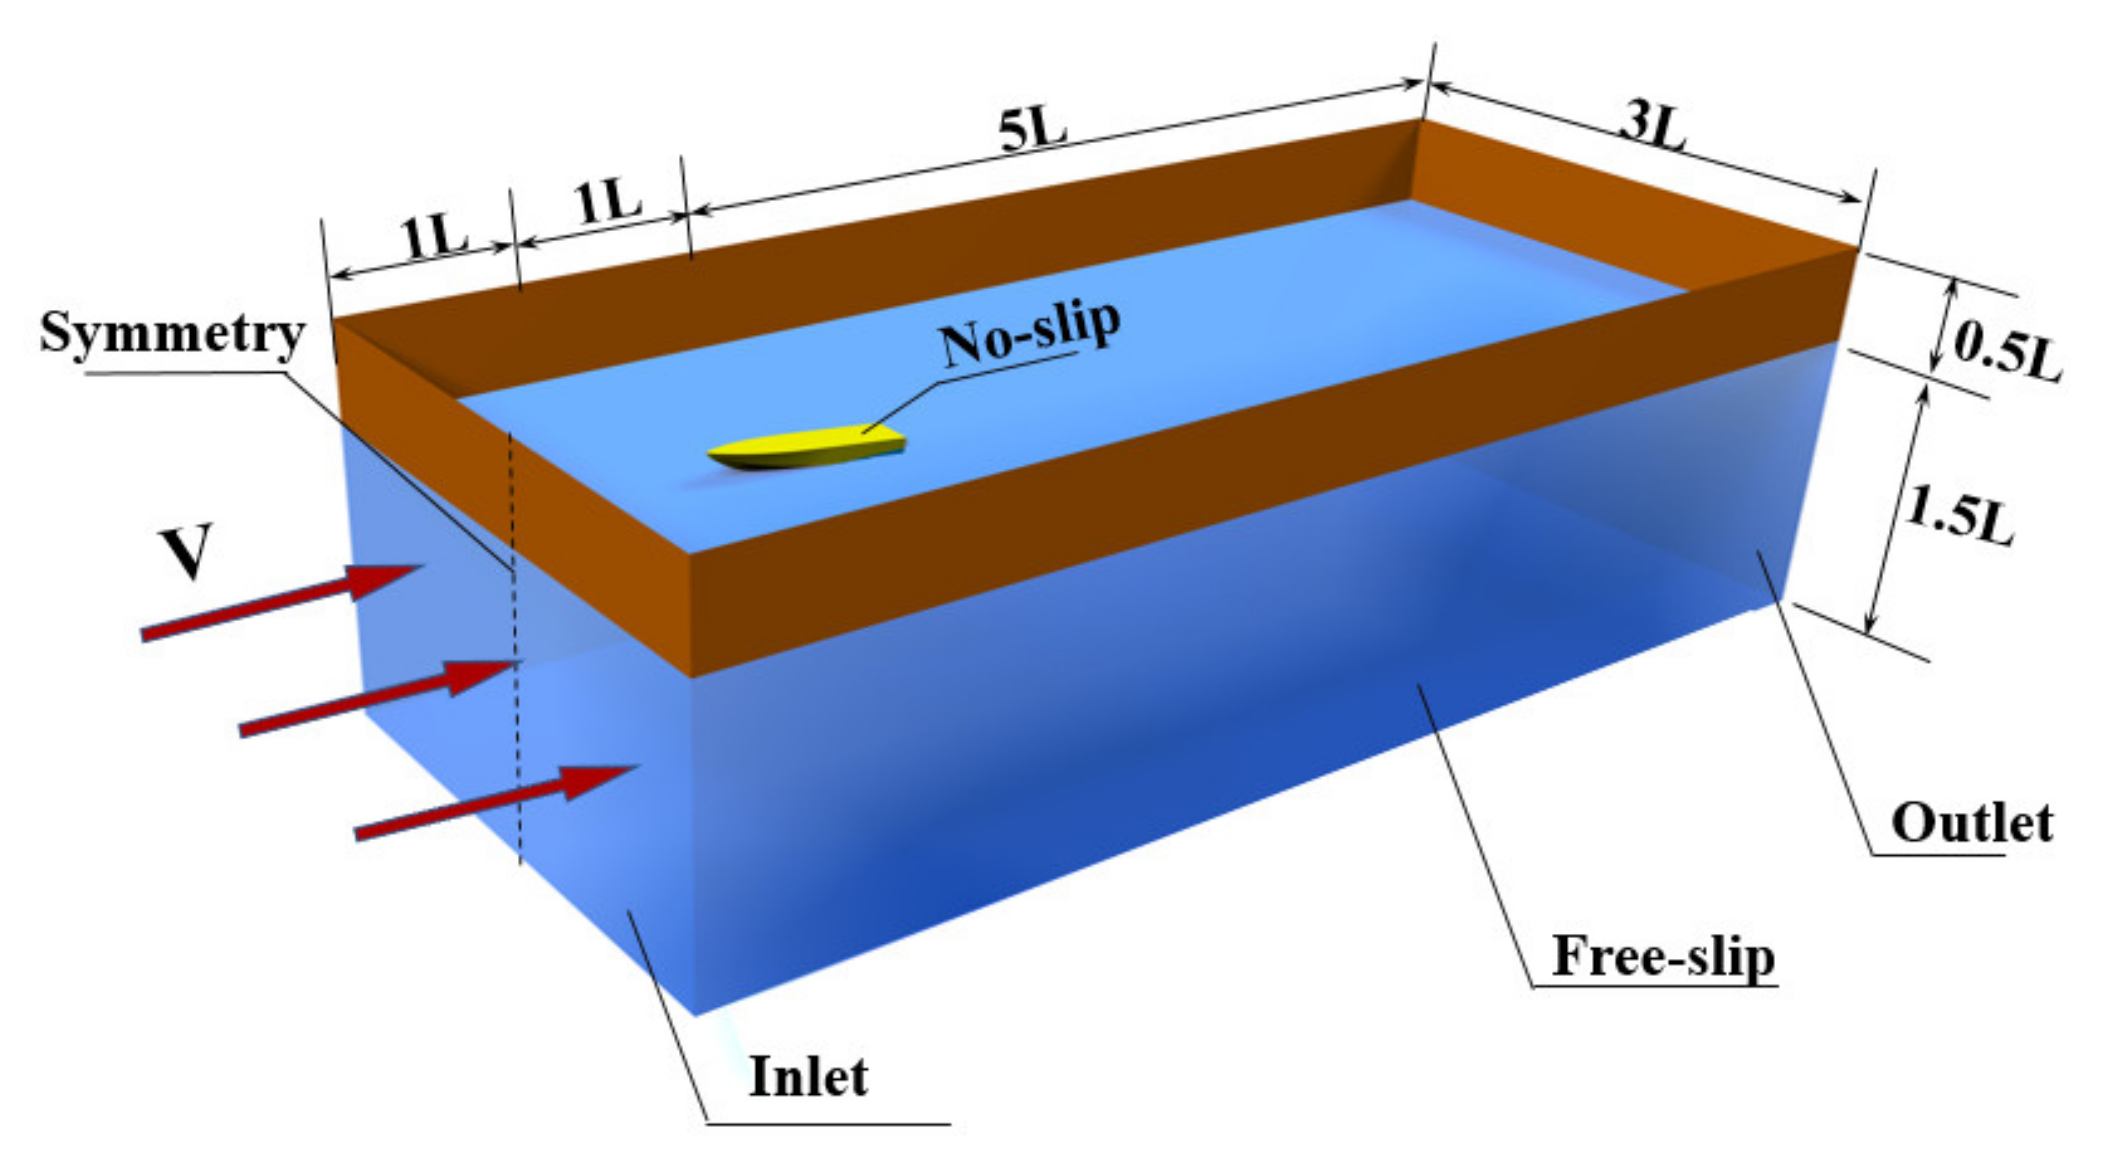
2.4. Domain and Boudary Conditions of the Numerical Tank

Figure 3 presents the dimensions and boundary conditions of the numerical tank, where L is the length of the planing hull. Since the length of wave increases rapidly with the speed, the angle between wake and longitudinal section in center plane is smaller than conventional ship. Hence, the longitudinal dimension of numerical tank in this work has been extended to 7 L (1 L from bow to inlet, 5 L from stern to outlet), while the transverse dimension remains to be 3 L, which is the same as conventional cases. Since only the gravity center heave and ship pitch degrees were released in the test, the model motion and the flow field symmetrical about the longitudinal section, hence a calculation domain was firstly established for half of hull body. The boundary conditions are set as follows. A uniform velocity at inlet equal to the velocity of the hull. The hydrostatic pressure condition is imposed on the outlet. The boundaries of the numerical tank are set as free-slip condition. A no-slip condition is applied to the hull surface. The symmetric boundary condition is used at the hull center plane.

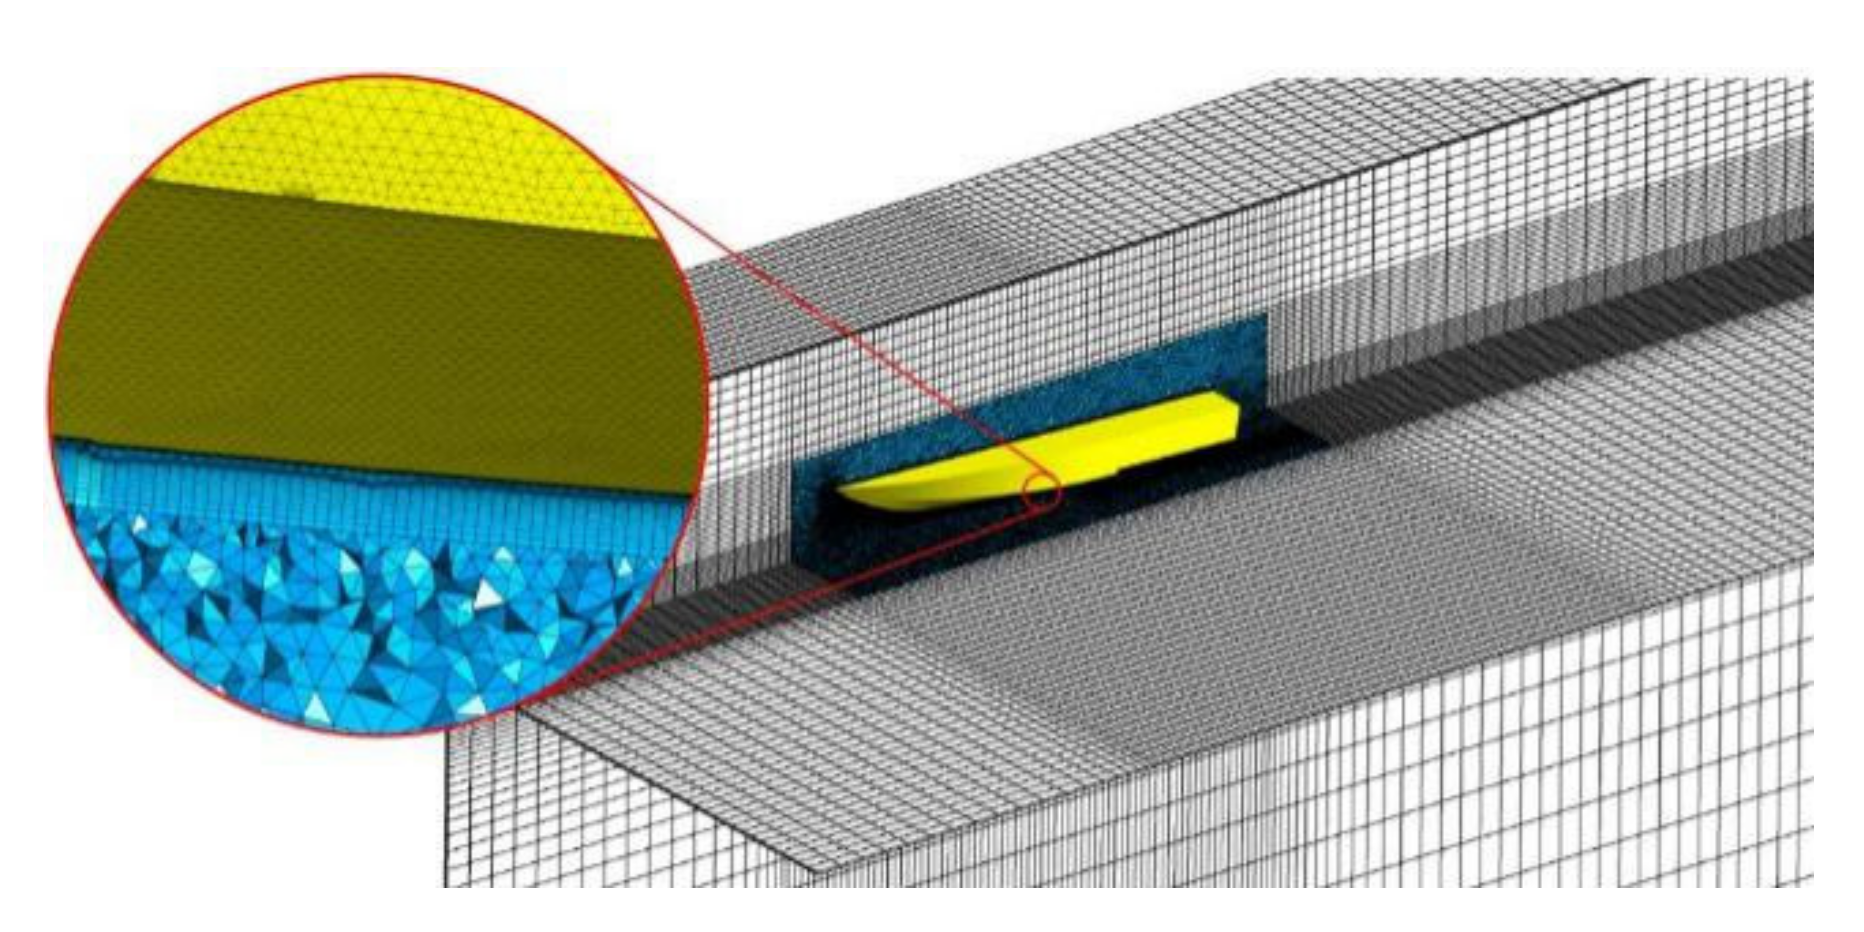
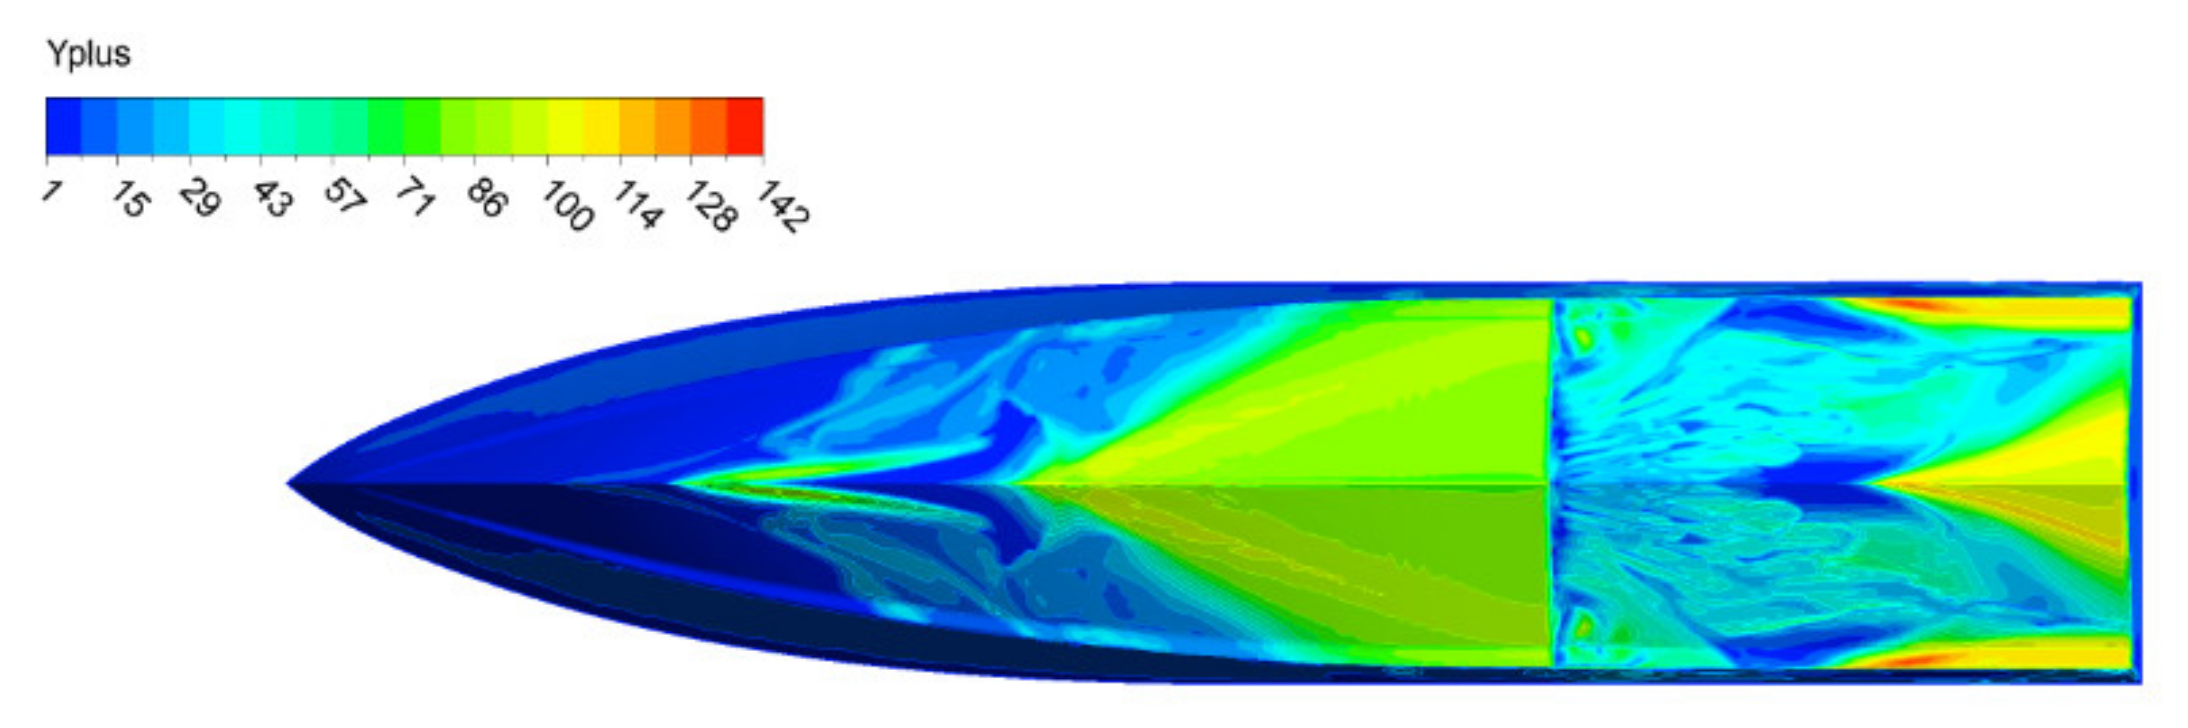
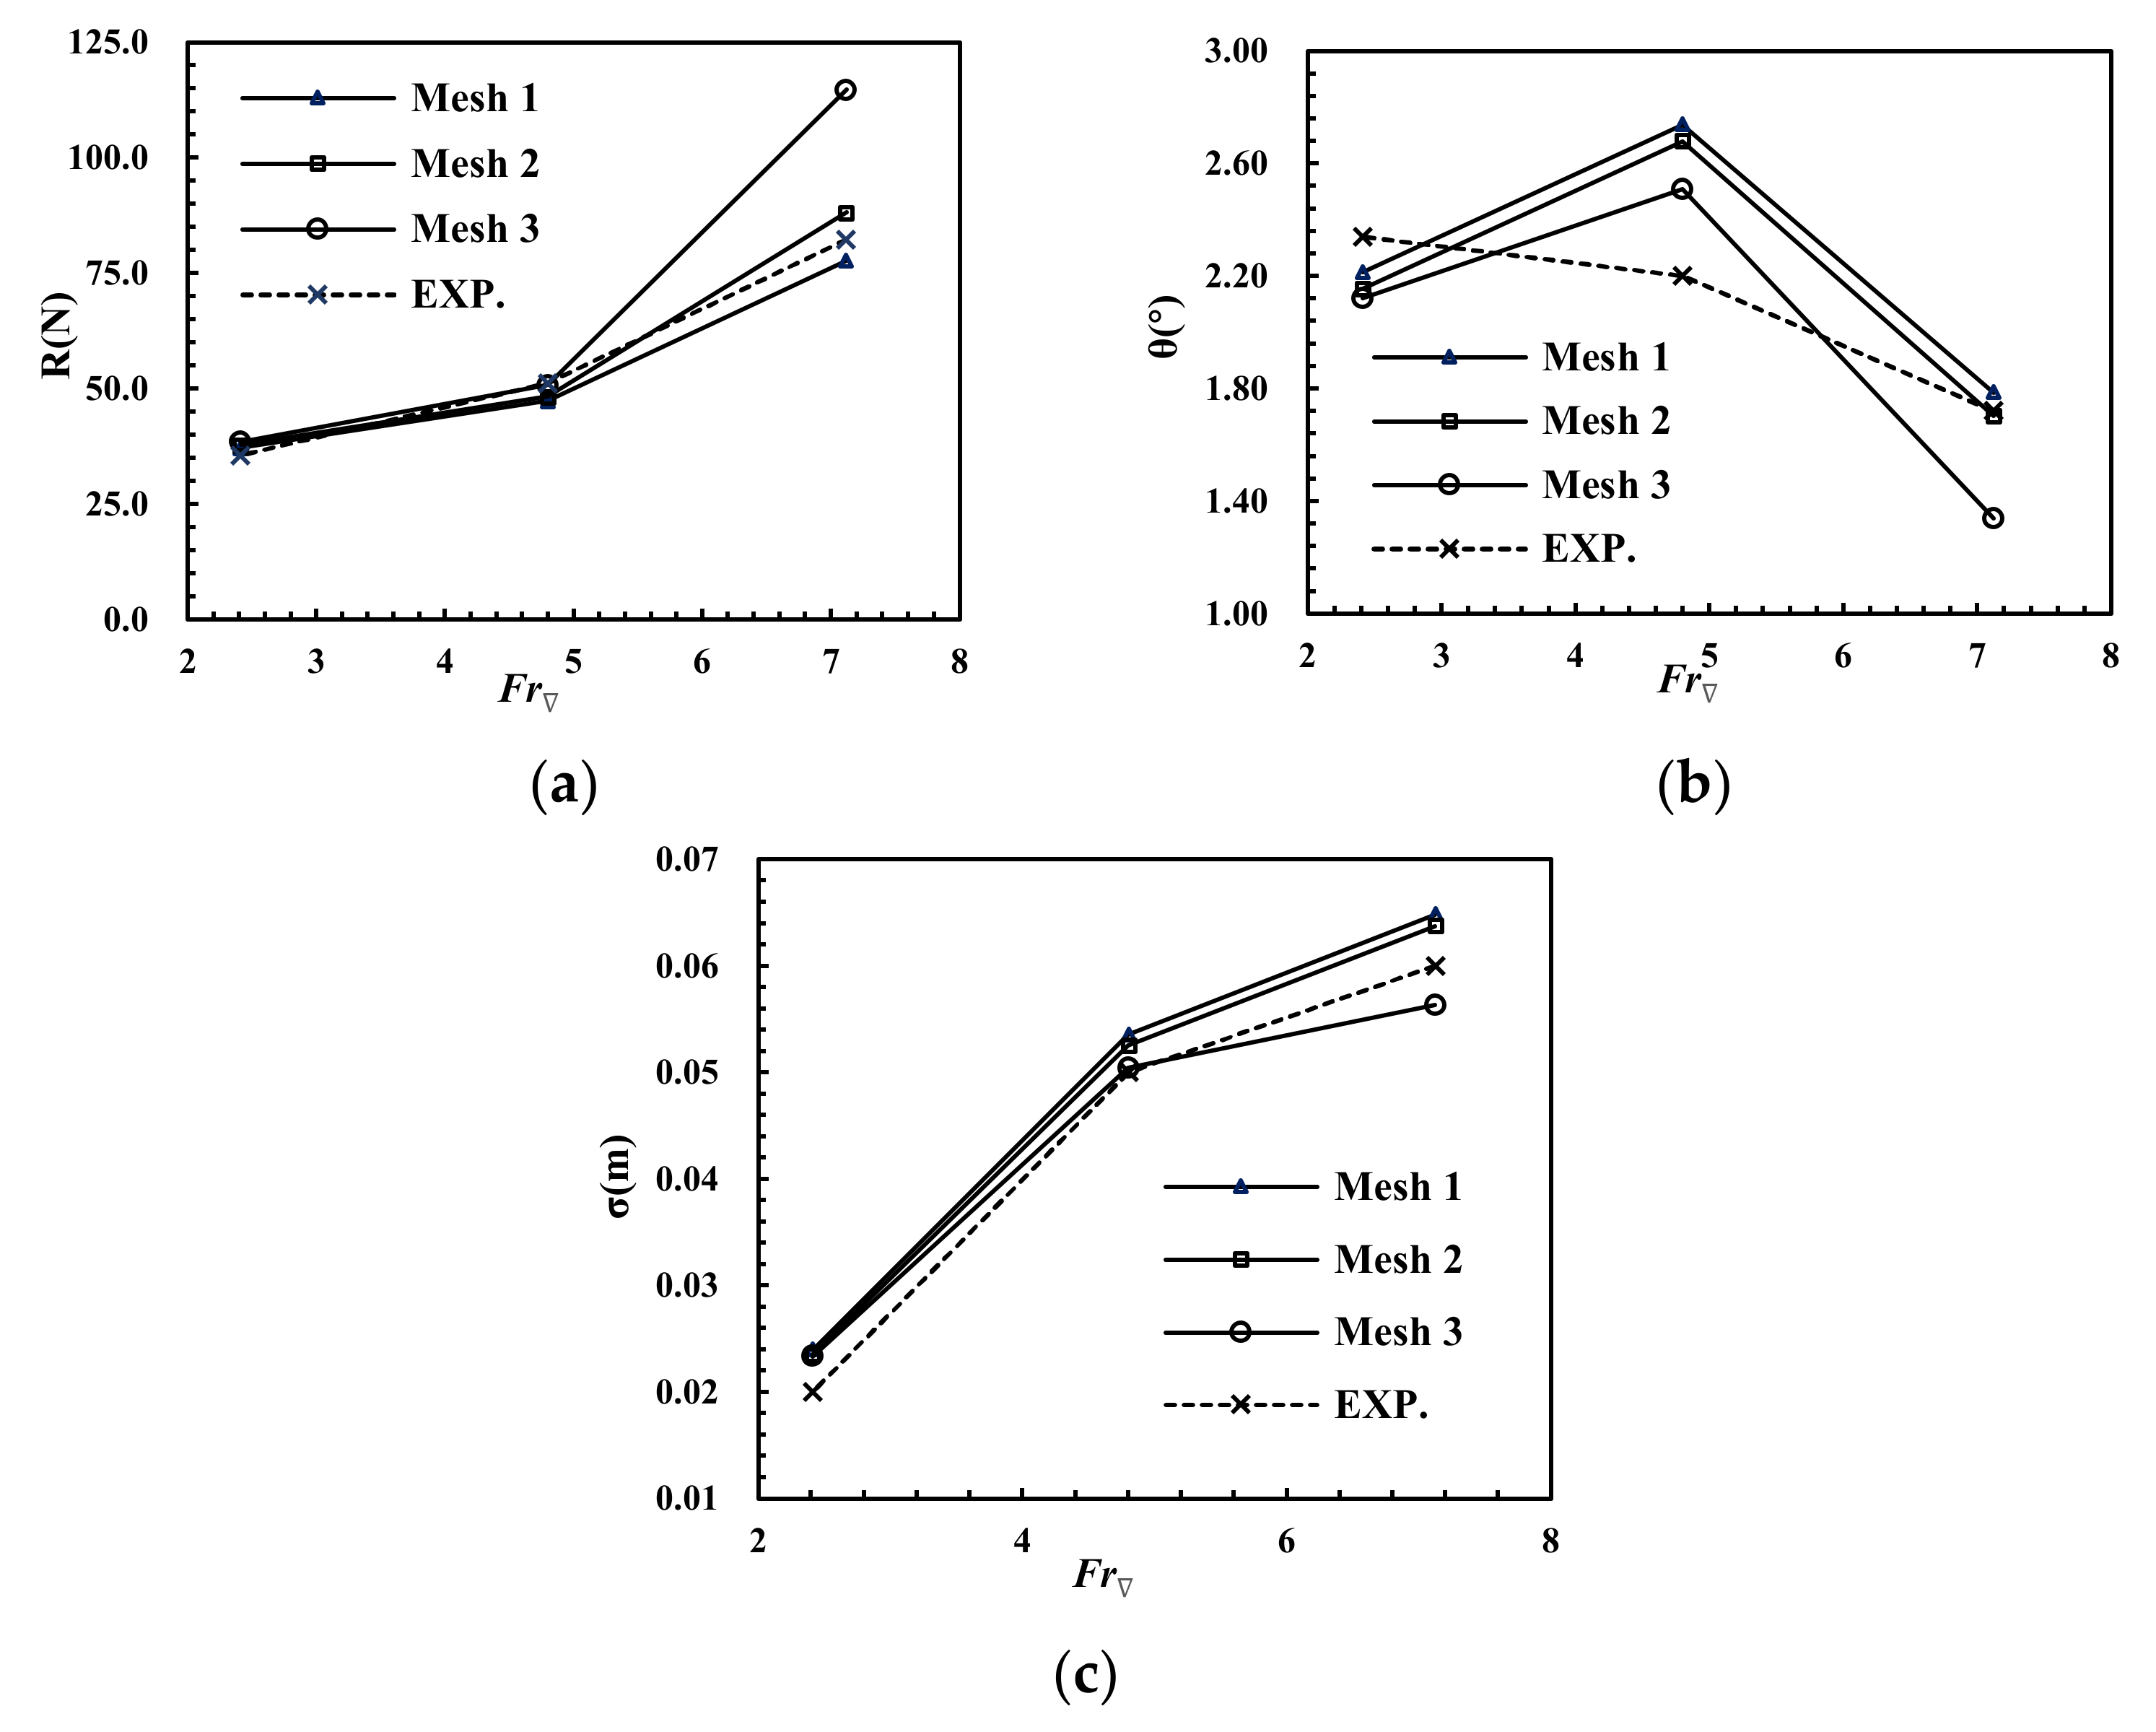
2.5. Mesh Generation

Since the geometry of the C1 stepped hull form is complex and the mesh deformation might appear due to the hull motion, the computational domain is divided into internal domain around the hull and adjacent domain in far field. Since the interior domain contains the main information of the flow around the hull, the interior domain is discretized by tetrahedral mesh. As in Figure 4, refinement is applied to the domain around the step and chine. A structured mesh is adopted to describe the wave-making characteristics of far-field regions. In numerical calculation, the hull geometry is described by the hull surface mesh. On the hull surface, unstructured triangular element is used to accurately capture the complex geometric feature. The laminar flow in the boundary layer has a significant impact on the friction resistance, and the velocity gradient near the hull is large. Therefore, to capture the velocity gradient effects along the walls of the ship model accurately, the 15 prism layers mesh was generated on the hull surface by extruding surface element outwards. Wall function was used for numerical simulation.
The wall function was used for the near wall treatment, and the y+ is the wall treatment used for all simulations. High y+ wall treatment means coarse meshes while the low y+ wall means fine meshes. The y + value varies greatly with flow velocity and medium. In this paper, the y+ range is given as the value in the wetted zone. y+ is very small in air medium and very large in water medium, especially in stationary point area. Figure 5 shows Y+ value at the hull bottom when Fr = 5.99.
The errors in CFD mainly come from model errors and numerical errors. Numerical errors can be reduced by improving the discretization accuracy. Related studies show that numerical errors are mainly caused by mesh scale. The uncertainty caused by mesh factors can be determined by the study of mesh convergence. In accordance with the CFD examination and determination procedures recommended by 28th ITTC, the Richard Extrapolation (RE) method is used to refine the unstructured meshes on the hull surface and inner domain. Three mesh strategies, mesh 1, mesh 2, and mesh 3, from fine to coarse, respectively, are generated with the mesh refinement rate of 2 . The specific mesh size parameters of each plan are given in the Table 2.
The calculated values of different mesh strategies are represented in Figure 6, including resistance, trim, and sinkage between numerical and experimental results.
Figure 7 is a typical resistance convergence time-history curve for planing hull simulation. The resistance value oscillates greatly in the short time of the initial model, but gradually converges steadily to 0.19 after 2 s.
The uncertainty of calculation has always been the focus of research [20,21,22,23], mesh uncertainty is the main source of numerical uncertainty. Usually, the calculation time step and physical model selection can be determined by the calculation data of similar ships.
The calculated values of different mesh strategies are represented by S 1 , S 2 , and S 3 , whose differences can be expressed as:
ε 21 = S 2 S 1
ε 32 = S 3 S 2
The convergence rate is defined as R G = ε 21 ε 32 . According to the literature [24], there are four possible convergence situations: Monotonic convergence, oscillatory convergence, monotonic divergence, and oscillatory divergence. If monotonic convergence is satisfied, the uncertainty and error caused by mesh can be estimated by the RE method. For the oscillatory convergence, the uncertainty can be estimated simply by using the upper and lower limits of the oscillation:
U G = 1 2 ( S U S L )
For monotonic divergence and oscillatory divergence, the uncertainty and error cannot be estimated. In the RE method, when there are three simulation solutions, the uncertainty estimates are usually written as follows:
U G = F S δ R E G *
where F S is the safety factor, δ R E G * is the estimated value of the error caused by the mesh. Its definition is as follows:
δ R E G * = ε 21 r G p G 1
where p G = ln ( ε 32 ε 21 ) / ln ( r G ) is the order of accuracy. Stern et al. [25] proposed a correction factor to replace the safety factor, which is defined as follows:
C G = r G p G 1 r G p G e s t 1
In the reference [26], it is suggested that P G e s t = 2. According to the range of C G , the uncertainty is estimated as follows:
U G = { [ 9.6 ( 1 C G ) 2 + 1.1 ] | δ R E G * | | 1 C G | < 0.125 [ 2 | 1 C G | + 1 ] | δ R E G * | | 1 C G | 0.125
The above process can be used to verify the mesh convergence under different conditions. The difference lies in whether the convergence coefficient R G meets the requirements of the RE method, and the calculation method of the uncertainty U G . Therefore, in this paper we do not elaborate on the calculation process, but through key data to verify the convergence. In this paper, volumetric Froude number Fr was introduced to represent the stepped hull speed. The date is listed in Table 3.
In Table 3, E represents the error between experimental and numerical simulation values. It can be concluded that the test of calculated resistance has reached monotonic convergence, which has been verified when the speed was Fr = 2.41 and Fr = 7.12. The pitch and heave did not reach monotonic convergence when the speed was Fr = 2.41, and the pitch was verified only at the maximum speed, while the heave was not verified.
The wetted area showed oscillatory convergence at the maximum speed, and the uncertainty was calculated according to Equation (8), while the verification of the wetted area was not achieved at the speed of Fr = 4.8.
From the verification of the overall numerical results one can find that, in most conditions, the drag have been verified, while the behavior has not been verified. As shown in Figure 8, the drag, pitch, and heave were obtained by the refined mesh scheme. As compared with the experimental values, the maximum error of the calculation resistance of the Mesh (1) scheme is 7.62%. In accordance with the provisions of the ITTC conference [24], multi-hull ship, planing hull, and new concept ship, the error less than 10% is acceptable compared with model test. Hence, mesh 1 was adopted to study air cavity under a stepped planing hull.

3. Numerical Results

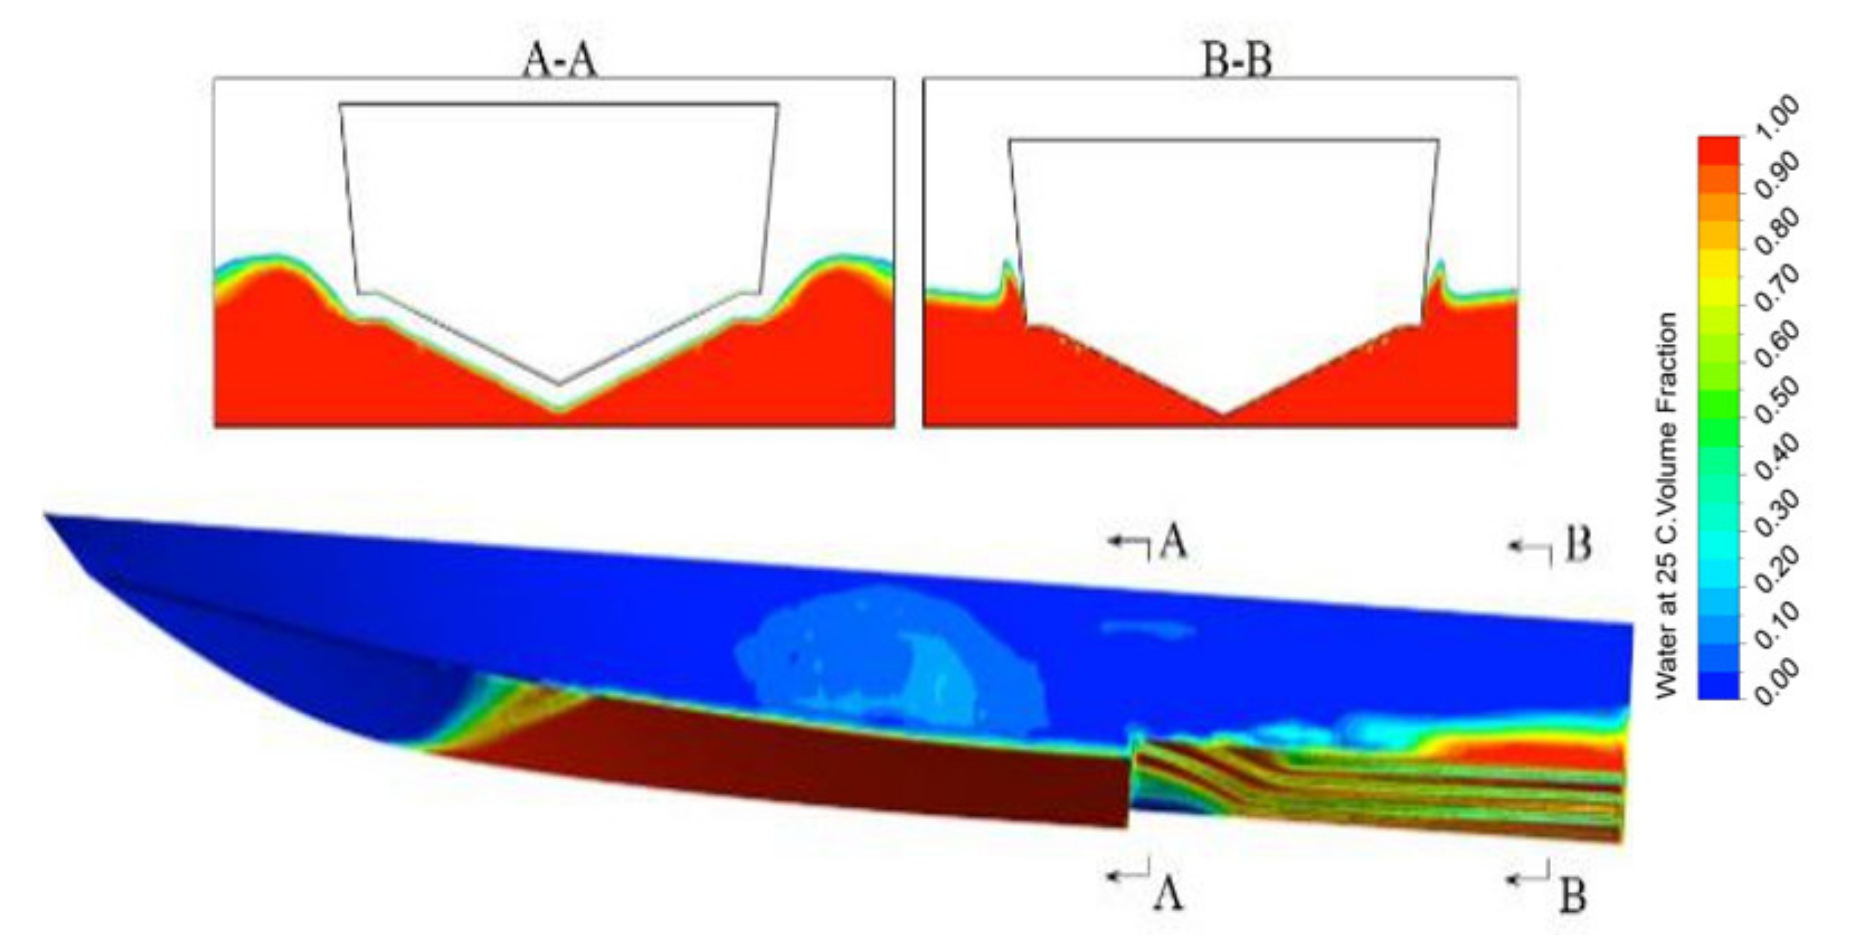
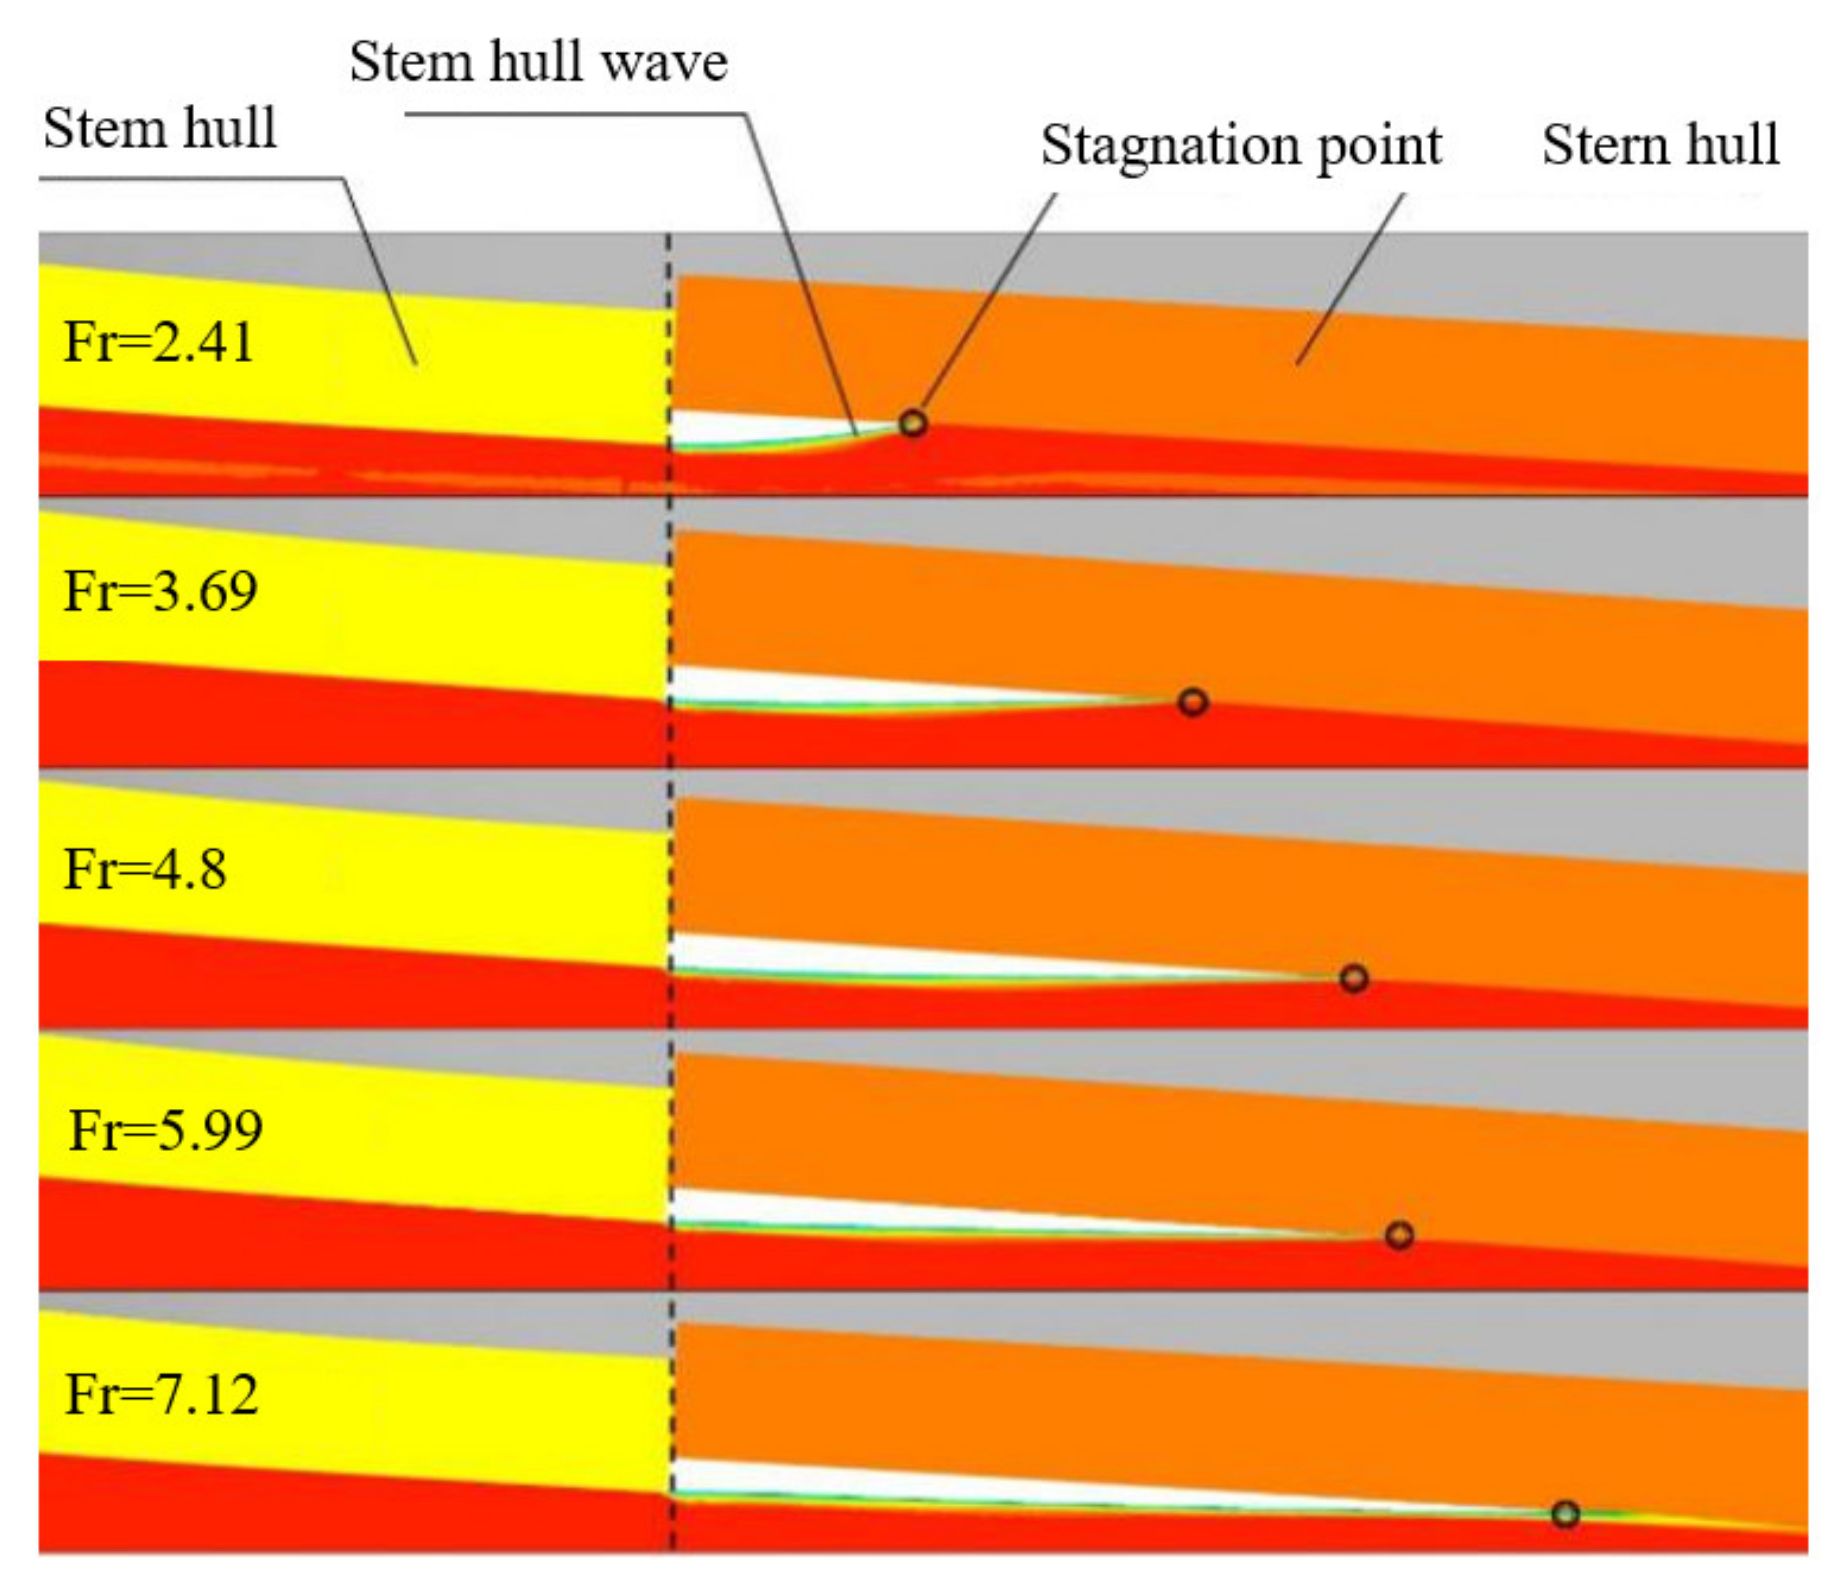
3.1. Cavity and Wave-Making

The air cavity of the stepped planing hull is formed by natural ventilation. The shape of the cavity is mainly affected by the hull configuration and the flow field. In the displacement phase, the submerged step below the water line is unable to produce the cavity at low speed. With the increase of speed, the dynamic pressure on the bottom gradually lifts hull out of the water. The wave-making of the planing hull mainly generates at the intersection of the bow and the water surface. Splashing occurs when wave-making propagates to the hull stern and makes side in a wet state.
To intuitively represent the airflow field at the hull bottom, waveform slices in the sections of X L O A = 0.05 and 0.3 (adjacent to the break stage) are also shown in Figure 9. As shown in the figure, step communicates with the atmosphere at the side, and cavity gradually occurs behind the step. Under this condition, wetted area forms behind the cavity. In other words, air can enter the bottom from the hull side to generate cavity only when the evolution of wave-making makes both ends of the step no longer submerged in water.

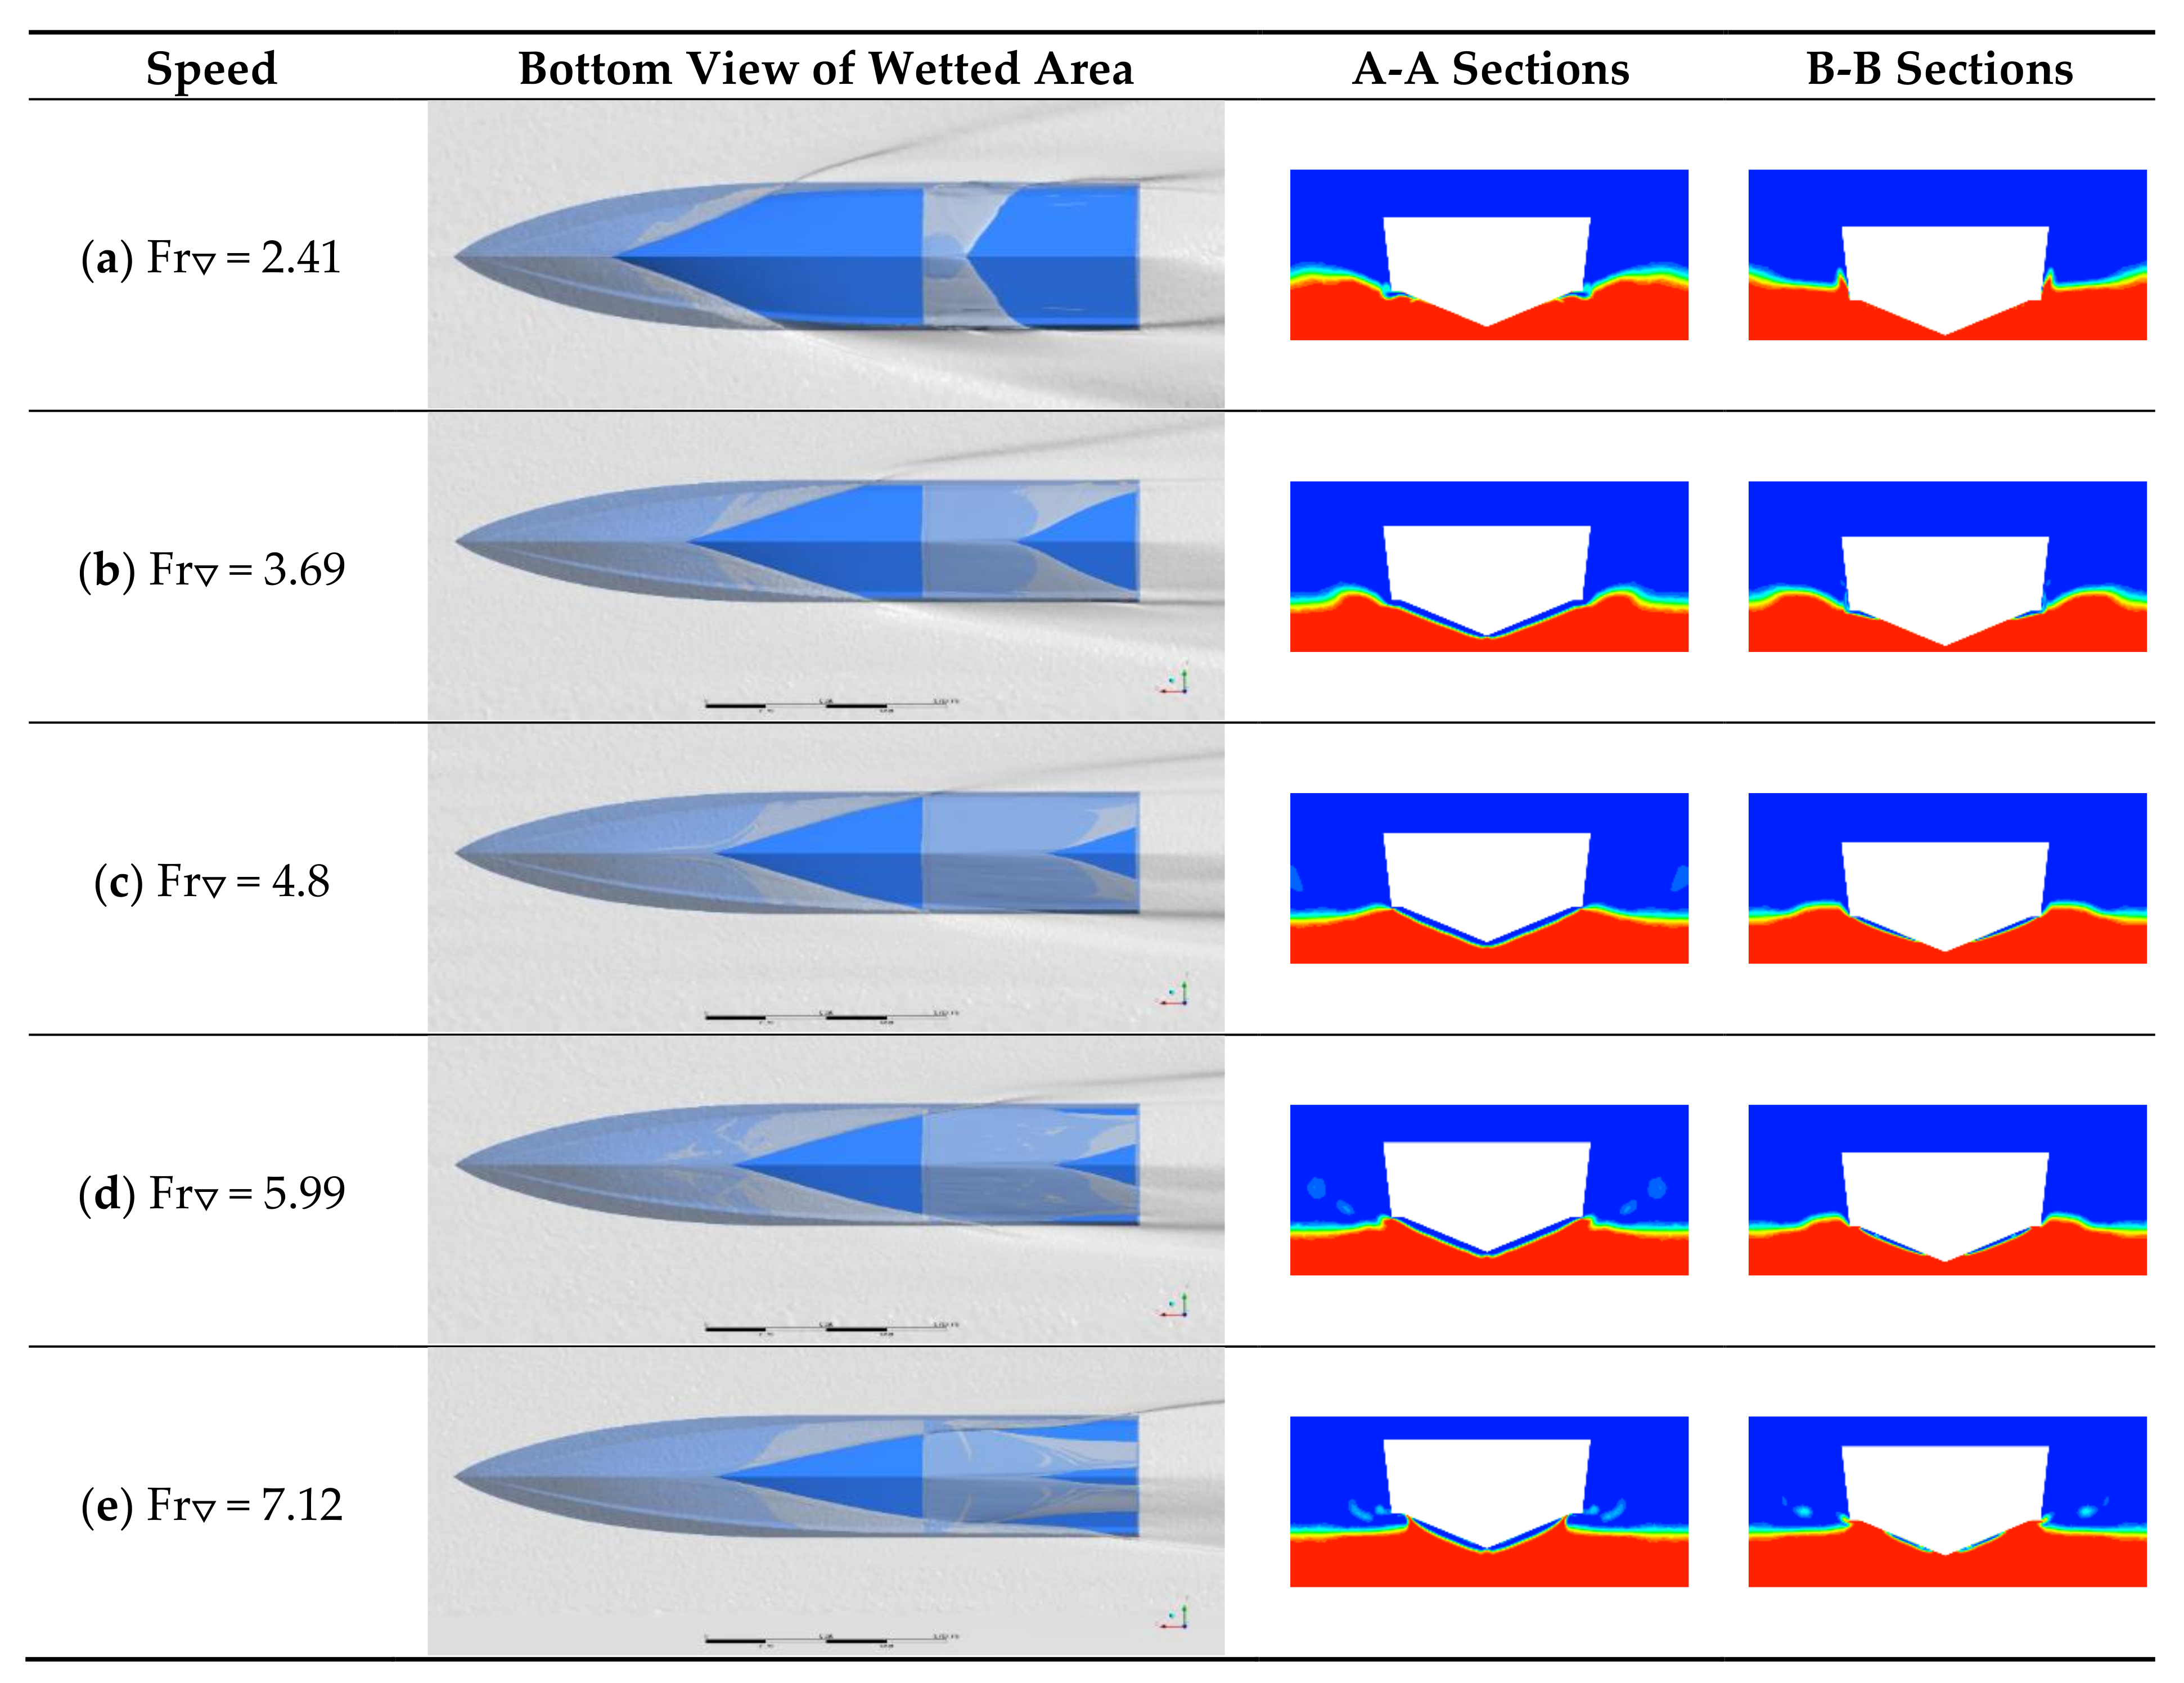
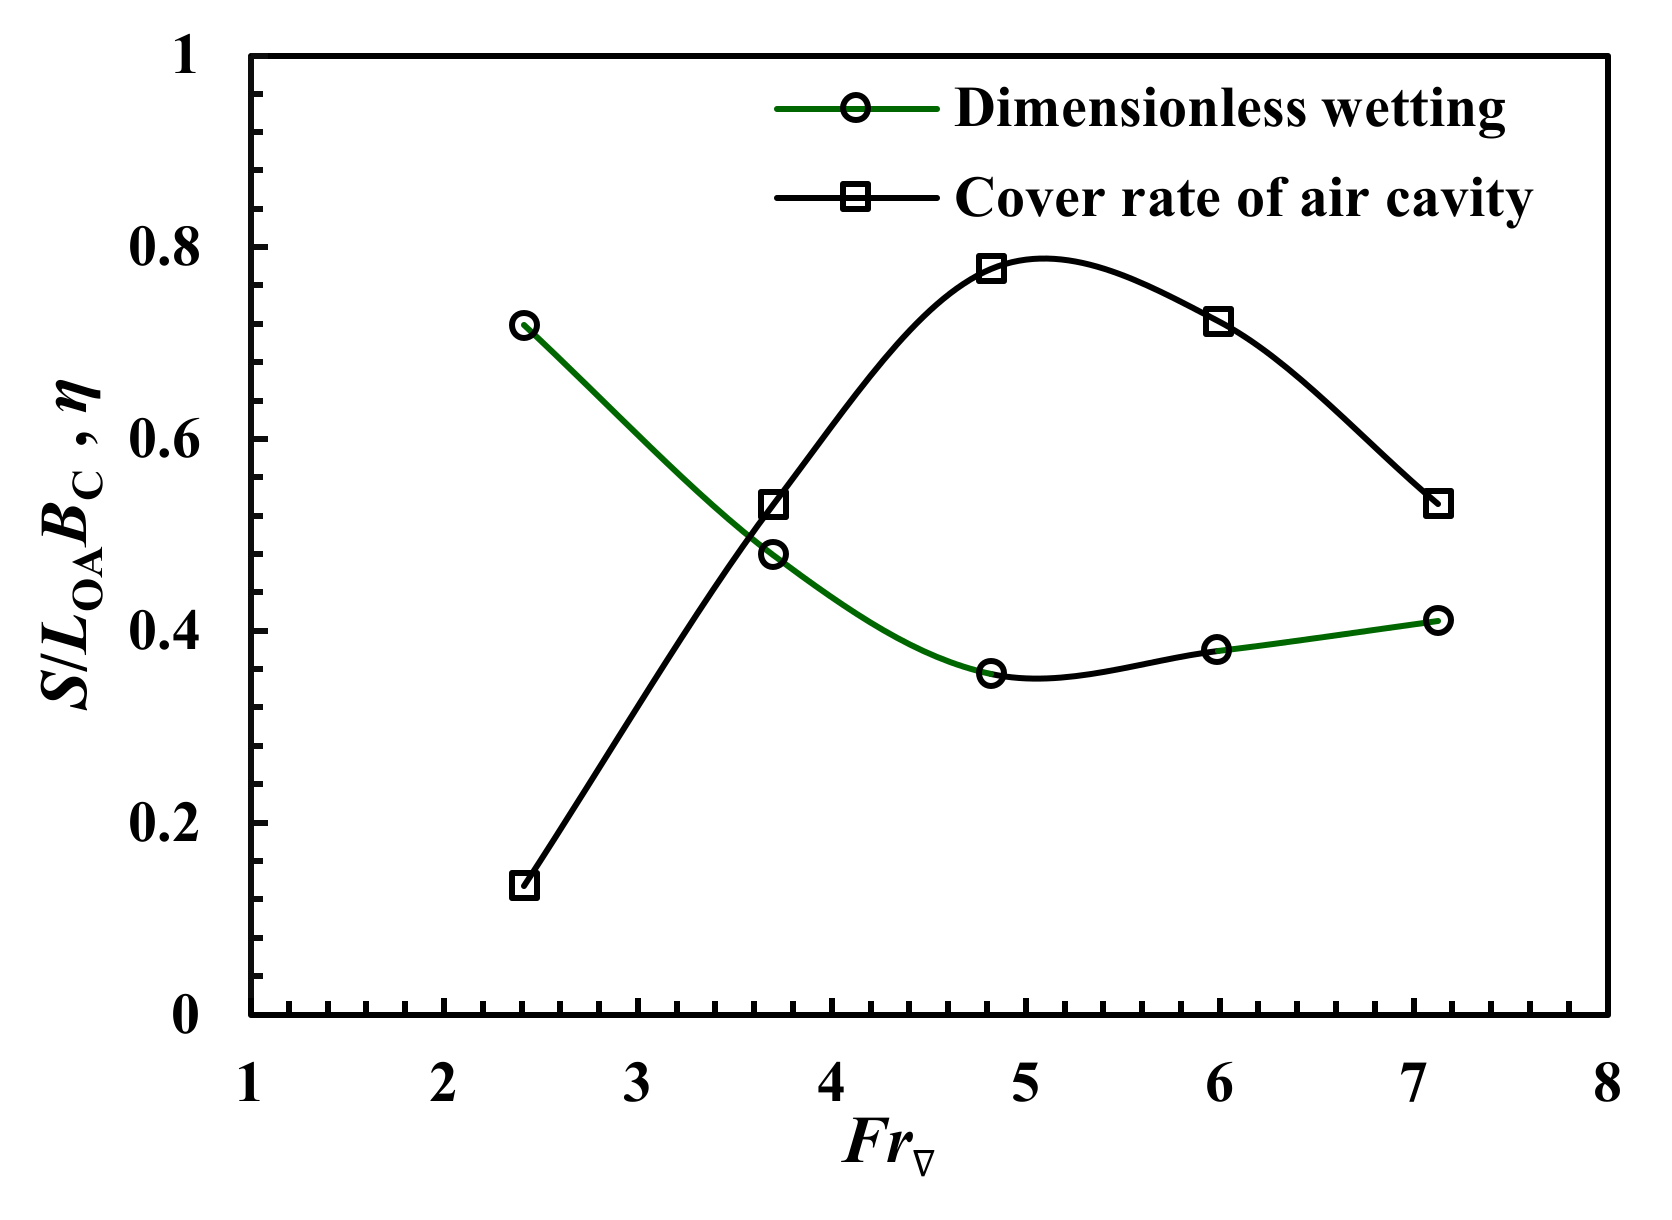
3.2. Evolution of Air Cavity Pattern and Wetted Area

Compared with conventional planing hull, the existence of cavity behind the step leads to a significant wetted area reduction on the hull bottom. Figure 10 shows the recorded development of the cavity at the certain speed. It can be seen that the cavity originates at step line and cannot extend longitudinally due to the stagnation line limitation on the planing surface.
As shown in Figure 11, in order to illustrate the change of the stagnation line position, the whole planing hull is deemed as two planing hulls arranging in sequence along the longitudinal direction, and the rear hull can be considered to sail above the wake of the front hull. With the increase of speed, the cocktail formed by the front hull will move backwards gradually, which makes waveform flattening. Meanwhile, the intersection point (stagnation point) between the wave and the stern is far away from step and close to keel gradually. When Fr = 3.69, the width of the wetted surface has begun to be smaller than chine width.
With the further increase of the speed, the cavity pattern enlarges steadily. When the velocity reaches Fr = 5.99, the shrinkage of the stem stagnation line causes the chine in a chine-dry condition. At this time, the actual wetted width at the stepped is less than the hull width, meanwhile the stagnation line of the stem planing surface and the stepped form a triangle. This stage called triangle planing stage. At this point, the stagnation line intersects with the step line. The bow wave passing through the intersection point could slam directly at the stern chine in the process of propagating toward the hull stern, which will cause additional wetted surface area. The additional wetted surface area patterns gradually became obvious accompanies with the shrinkage of the bow stagnation line.
In order to intuitively express the relationship between the cavity development and hull wetted, the cavity cover η is defined as
η = S A S W A / S A
where S A and S W A represent the spreading area and wetted area of the stern planing surface, respectively. Figure 12 shows the variation curves of the cavity cover η and dimensionless wetted S W T / L O A B C with the change of speed. When Fr = 4.8, the cavity cover reached the maximum of 77.8%, while the overall wetted area decreased to the lowest. This trend is reflected in the dimensionless wetted curve shown in the overall wetted. The curve is relatively flat at high speed after Fr = 5.99, but it still increases slightly with the speed. When the hull is in the triangle planing stage, the wetted area of the stern chine enlarges with the speed, while the cavity cover decreases rapidly. On the stem planing surface, the shrinkage of the stagnation line makes the wetted area keep a downward trend.

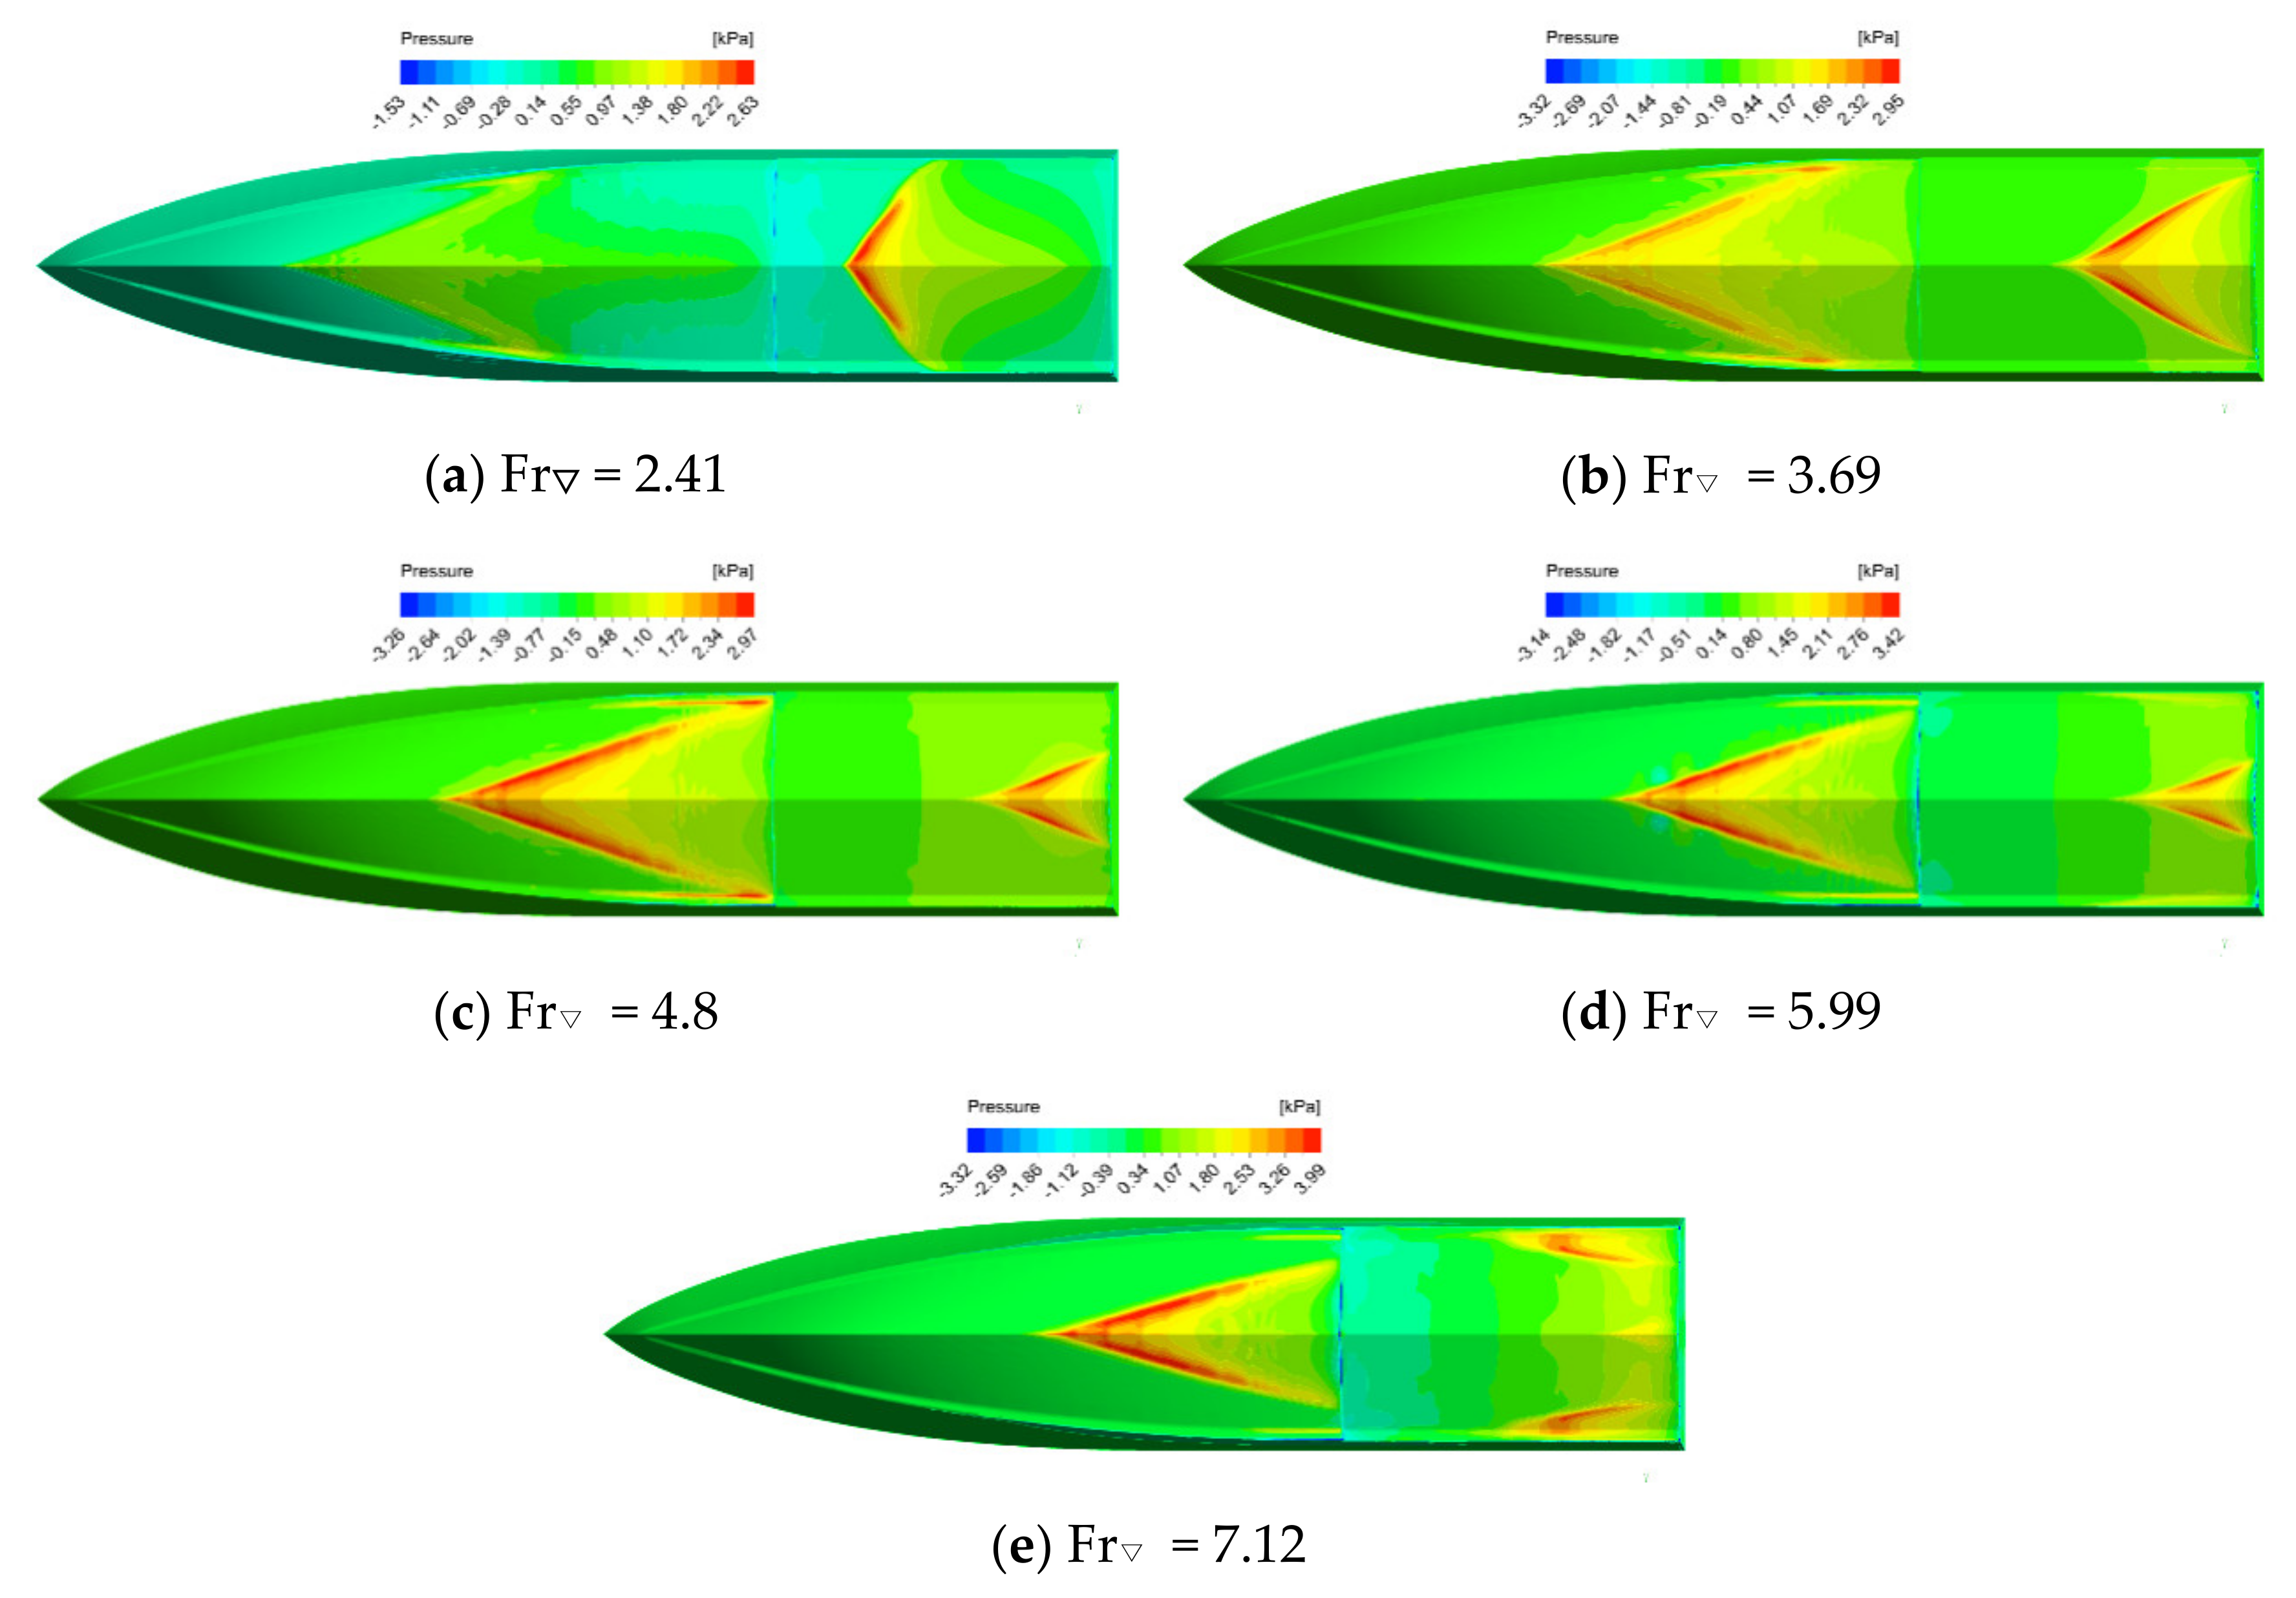
3.3. Pressure Characteristics and Load of Bottom under Cavity Cover

Since hydrodynamic lift is the main support on the planing hull in the planing stage, the variation of wetted area under cavity leads to a distinct pressure distribution pattern, as compared with traditional planing hull. Figure 13 shows the bottom pressure distribution in a large range of speeds. The hydrodynamic pressure is disconnected at the step, and the low pressure area covered by cavity is between the stem and stern high pressure area. The pressure inside the cavity is almost the same to the atmospheric pressure, and there is no significant correlation between the pressure and speed.
When the step enters the triangle planing stage, the stern stagnation line no longer intersects with the chine line, hence the high pressure region on stem disappears. At the same time, due to the wet stem chine, the appearance of the high hydrodynamic pressure at the stem becomes obvious with the decrease of the cavity cover. At the maximum speed, the high hydrodynamic pressure at the chine constitutes the main source of hydrodynamic lift on the stem surface.
The difference of pressure distribution on the hull bottom before and after the step entering the triangle planing stage directly affects the loads on each planing surface and ultimately acts on the hull motion. Figure 14a,b compare the lift and the longitudinal position of pressure center provided by the stem and stern planing surfaces within the speed range, respectively. It shows that the cavity expansion reduces the load on the stern surface, and consequently the stem planing surface supports the most of the hull weight. After entering the triangle planing stage, the appearance of high pressure region at the chine leads to the rapid increase of the load on the stern planing surface. When Fr = 7.12, the stern load reaches 44.6% of the hull’s weight. Under this condition, the pressure center on the stern planing surface begins to move toward the bow. This pressure center movement means the dynamic lift is concentrated near the center of gravity, which is adverse to resist external disturbance. If the pressure distribution in the longitudinal direction is concentrated near the center of gravity, the external disturbance will easily cause the longitudinal instability of the hull, which is called porpoising. In this paper, when Fr = 7.12, the increase of wetted area on the stern planing surface makes the pressure center move forward to the center of gravity, which is disadvantageous to maintain the stability of longitudinal motion. Instability of longitudinal motion will cause slamming which may also strongly influence fatigue life [27], and lead to passenger discomfort and extreme loadings sustained [28] the motions and loads should be significantly reduced.

4. Conclusions

In this paper, the CFD technique was employed to investigate the flow around a stepped planing hull from the Taunton Series C1. The accuracy of numerical simulation was validated by the mesh convergence study. Based on the numerical results, the evolution of cavity pattern behind step, the hull bottom wetted area, and pressure distribution under the effect of cavity were discussed. The main conclusions can be drawn as follows.
(1)
As a result of wave-making evolution, the occurrence of air cavity requires both step ends connecting with the atmosphere. The flattening wake suggests that the cavity gradually enlarges with the increase of speed. This enlargement trend increases the cavity cover and reduces the wetted area, which reduces the sailing resistance.
(2)
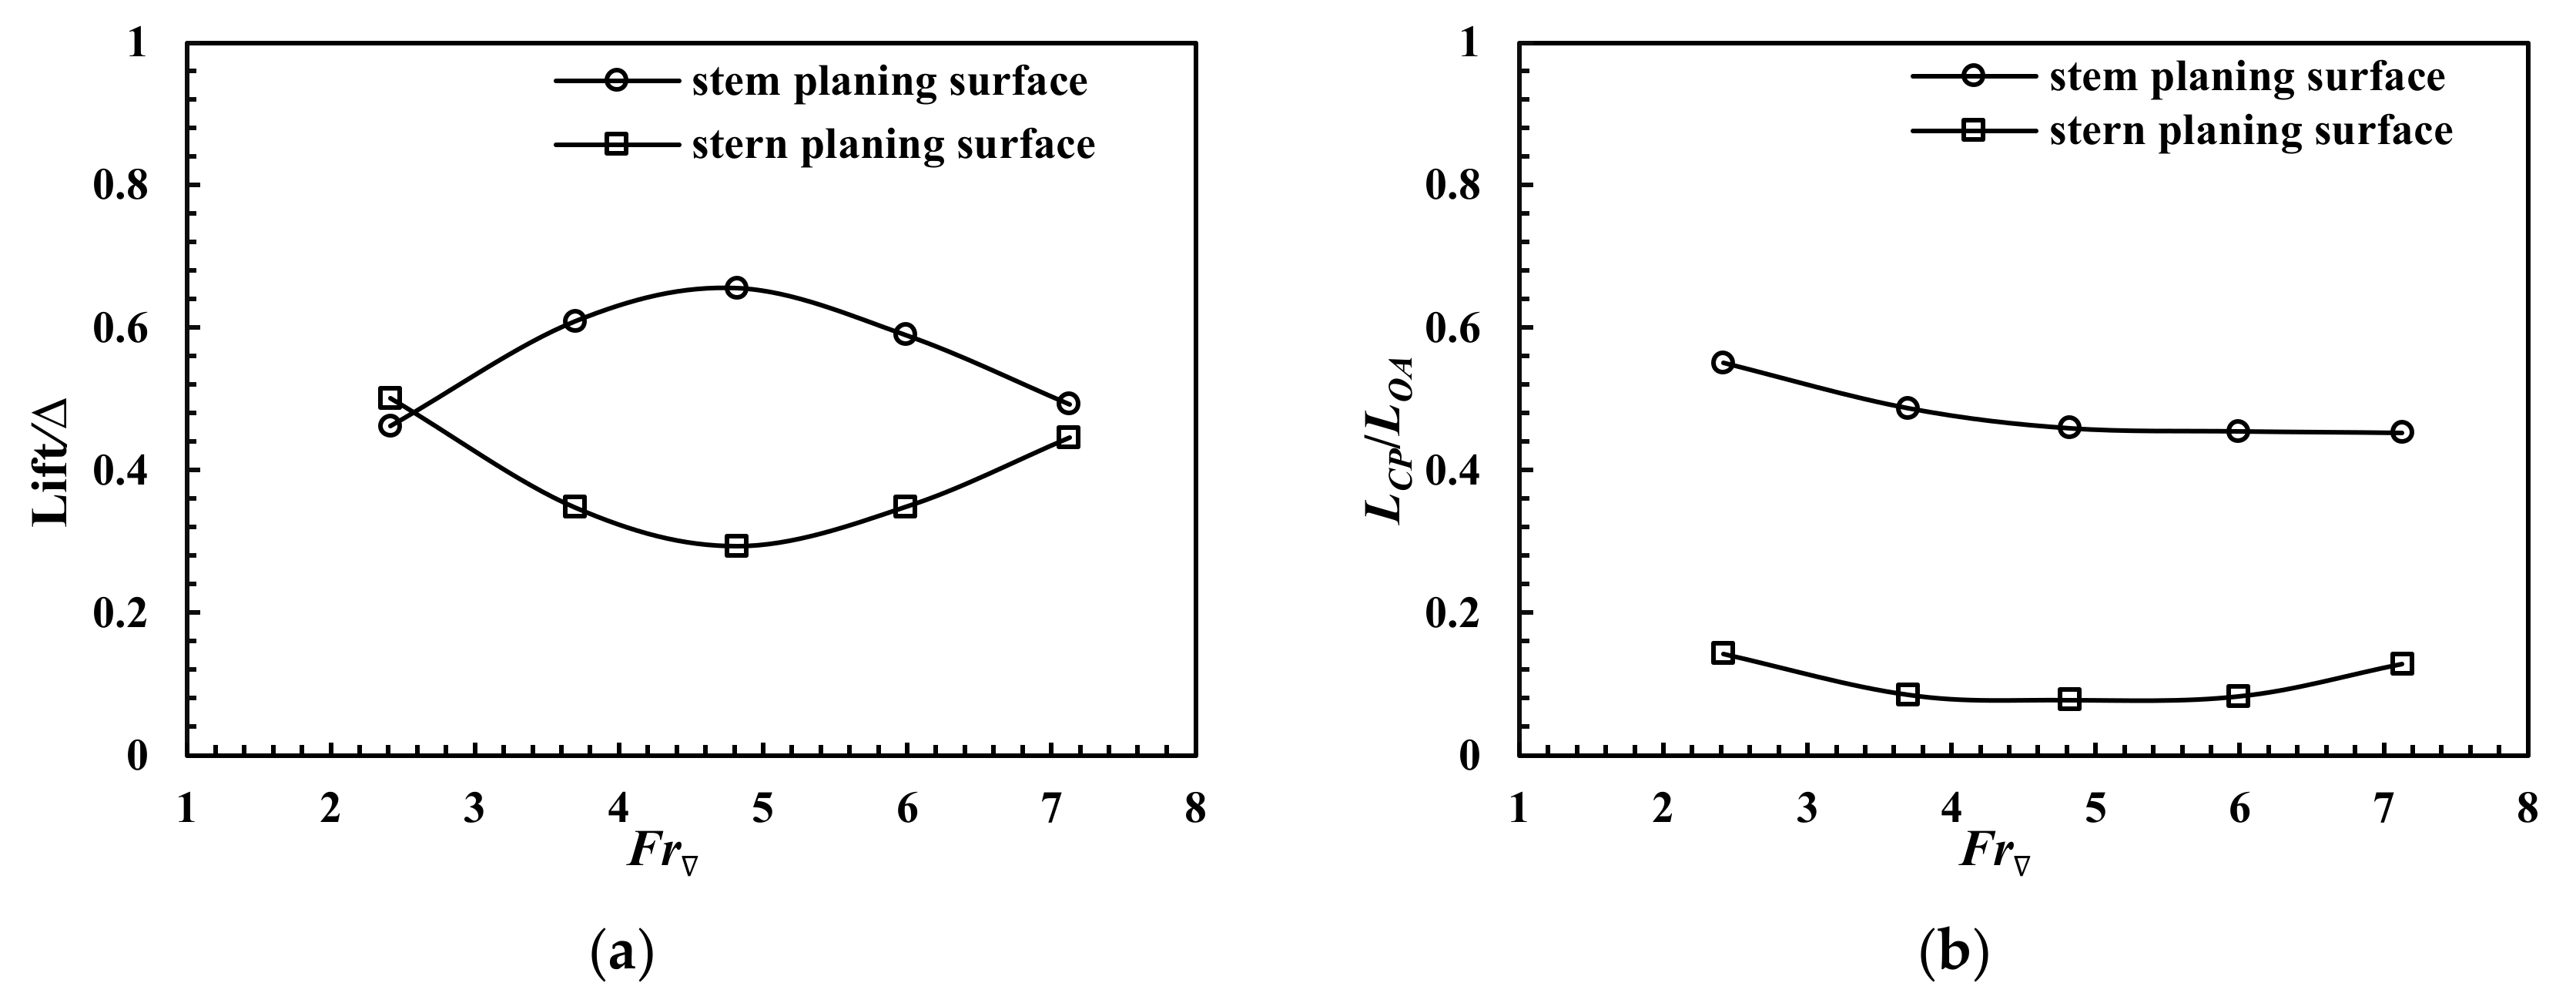
When entering the triangle planing stage, the extra chine wetted reduces the cover of the cavity but leads to a slight increase in overall wetted area. The increasing bottom load causes the pressure move towards to the gravity center and thus reduce the longitudinal stability of the hull.
(3)
Due to the hydrodynamic characteristics of the stepped planing hull in triangle planing stage tend to increase the hull wetted area and decrease the longitudinal stability, it is suggested that the design speed should be limited to the speed at which the stepped planing hull enters triangle planing stage. For this stepped planing hull, the limited Froude number is Fr = 5.99.

Author Contributions

D.Y. and Z.S. designed the framework of the study, conducted fieldwork, and analyzed data. Writing, project administration, and funding acquisition, Y.J.; Supervision, Z.G. All authors discussed the results and commented on the manuscript.

Funding

This research was funded by Key Laboratory Fund (614222303030917) and the National Natural Science Foundation of China (51509055).

Acknowledgments

Thanks for the General Institute of ship and Offshore platform Technology, Harbin Engineering University.

Conflicts of Interest

The authors declare no conflict of interest.

References

  1. Lee, E.; Pavkov, M.; McCue-Weil, L. The Systematic Variation of Step Configuration and Displacement for a Double-step Planing Craft. J. Ship Prod. Des. 2014, 30, 89–97. [Google Scholar] [CrossRef]
  2. Garland, W.R. Stepped planing hull investigation. Trans. Soc. Nav. Archit. Mar. Eng. 2011, 119, 448–458. [Google Scholar]
  3. Savitsky, D.; Morabito, M. Surface Wave Contours Associated With the Forebody Wake of Stepped Planing Hulls. Mar. Technol. 2009, 47, 1–16. [Google Scholar]
  4. Taunton, D.J.; Hudson, D.A.; Shenoi, R.A. Characteristics of a series of high speed hard chine planing hulls—Part 1: Performance in calm water. Int. J. Small Craft Technol. 2010, 152, 55–75. [Google Scholar]
  5. Huo, C.; Yang, J.; Dong, W.C. Factors of influencing resistance performance of double-stepped planing craft in calm water. J. Nav. Univ. Eng. 2012, 5, 21–24. [Google Scholar]
  6. Li, R.C.; Liu, Y.H.; Chai, J.C. Influence of LCG and displacement on resistance performance of double-stepped deep-V planing Craft. China Water Transp. 2016, 16, 1–3. [Google Scholar]
  7. Xiaohong, S.; Qirui, W.; Di, X. A resistance regression formula for double-stepped planning craft. Chin. J. Ship Res. 2010, 5, 59–63. [Google Scholar]
  8. Jiang, Y.; Sun, H.B.; Zou, J.; Yang, D.M.; Hu, A.K. Influence of Angle-Variable Stern Flap on Resistance Performance of Stepped Planing Hull. J. Shanghai Jiaotong Univ. 2017, 51, 320–325. [Google Scholar]
  9. Cucinotta, F.; Guglielmino, E.; Sfravara, F. A critical CAE analysis of the bottom shape of a multi stepped air cavity planing hull. Appl. Ocean Res. 2019, 82, 130–142. [Google Scholar] [CrossRef]
  10. Cucinotta, F.; Guglielmino, E.; Sfravara, F.; Strasser, C. Numerical and experimental investigation of a planing Air Cavity Ship and its air layer evolution. Ocean Eng. 2018, 152, 130–143. [Google Scholar] [CrossRef]
  11. Cucinotta, F.; Guglielmino, E.; Sfravara, F. An experimental comparison between different artificial air cavity designs for a planing hull. Ocean Eng. 2017, 140, 233–243. [Google Scholar] [CrossRef]
  12. Makasyeyev, M.V. Numerical modeling of cavity flow on bottom of a stepped planing hull. In Proceedings of the 7th International Symposium on Cavitation (CAV 2009), Ann Arbour, MI, USA, 16–20 August 2009. [Google Scholar]
  13. Guo, Z.; Ma, Q.; Hu, X. Seakeeping Analysis of a Wave-Piercing Catamaran Using URANS-Based Method. Int. J. Offshore Polar Eng. 2016, 26, 48–56. [Google Scholar] [CrossRef]
  14. Barbaca, L.; Pearce, B.W.; Brandner, P.A. Numerical analysis of ventilated cavity flow over a 2-D wall mounted fence. Ocean Eng. 2017, 141, 143–153. [Google Scholar] [CrossRef]
  15. Jiang, Y.; Sun, H.; Zou, J.; Hu, A.; Yang, J. Experimental and numerical investigations on hydrodynamic and aerodynamic characteristics of the tunnel of planing trimaran. Appl. Ocean Res. 2017, 63, 1–10. [Google Scholar] [CrossRef]
  16. Veysi, S.T.; Bakhtiari, M.; Ghassemi, H.; Ghiasi, M. Toward numerical modeling of the stepped and non-stepped planing hull. J. Braz. Soc. Mech. Sci. Eng. 2015, 37, 1635–1645. [Google Scholar] [CrossRef]
  17. Matveev, K.I. Two-dimensional modeling of stepped planing hulls with open and pressurized air cavities. Int. J. Naval Archit. Ocean Eng. 2012, 4, 162–171. [Google Scholar] [CrossRef] [Green Version]
  18. Matveev, K.I. Hydrodynamic modeling of semi-planing hulls with air cavities. Int. J. Naval Archit. Ocean Eng. 2015, 3, 500–508. [Google Scholar] [CrossRef] [Green Version]
  19. Guo, R.X.; Liu, X.W. Experimental investigation on the resistance reduction of stepped planing craft by formation of air cavity. J. Hydrodyn. 2002, 17, 440–447. [Google Scholar]
  20. Menter, F.R.; Langtry, R.; Völker, S. Transition Modelling for General Purpose CFD Codes. Flow Turbul. Combust. 2006, 77, 277–303. [Google Scholar] [CrossRef]
  21. Eça, L.; Hoekstra, M. A procedure for the estimation of the numerical uncertainty of CFD calculations based on grid refinement studies. J. Comput. Phys. 2014, 262, 104–130. [Google Scholar] [CrossRef]
  22. Eça, L.; Hoekstra, M. Discretizetion Uncertainty Estimation Based on Least Squares Version of the Grid Convergence Index. In Proceedings of the 2nd Workshop on CFD Uncertainty Analysis, Lisbon, Portugal, 16–18 October 2006. [Google Scholar]
  23. Hirdaris, S.E.; Bai, W.; Dessi, D.; Ergin, A.; Gu, X.; Hermundstad, O.A.; Huijsmans, R.; Iijima, K.; Nielsen, U.D.; Parunov, J.; et al. Loads for use in the design of ships and offshore structures. Ocean Eng. 2014, 78, 131–174. [Google Scholar] [CrossRef]
  24. ITTC QM. Uncertainty analysis in CFD verification and validation methodology and procedures. In Proceedings of the 23rd International Towing Tank Conference, Venice, Italy, 8–14 September 2002. [Google Scholar]
  25. Stern, F.; Longo, J.; Penna, R.; Olivieri, A.; Ratcliffe, T.; Coleman, H. International Collaboration on Benchmark CFD Validation Data for Surface Combatant DTMB Model 5415. In Proceedings of the Twenty-Third Symposium on Naval Hydrodynamics, Val de Reuil, France, 17–22 September 2000. [Google Scholar]
  26. De Luca, F.; Mancini, S.; Miranda, S.; Pensa, C. An Extended Verification and Validation Study of CFD Simulations for Planing Hulls. J. Ship Res. 2016, 60, 101–118. [Google Scholar] [CrossRef]
  27. Thomas, G.; Davis, M.R.; Holloway, D.S.; Roberts, T. The effect of slamming and whipping on the fatigue life of a high speed catamaran. Aust. J. Mech. Eng. 2006, 3, 165–174. [Google Scholar] [CrossRef]
  28. Alavi Mehr, J.; Lavroff, J.; Davis, M.R.; Holloway, D.S.; Thomas, G.A. An experimental investigation on slamming kinematics, impulse and energytransfer for high-speed catamarans equipped with Ride Control Systems. Ocean Eng. 2014, 178, 410–422. [Google Scholar] [CrossRef]
Figure 1. Taunton Series (C1) stepped hull form model test at a speed of Fr = 7.12.
Jmse 07 00468 g001
Figure 2. C1 stepped hull form in Taunton series.
Jmse 07 00468 g002
Figure 3. Dimensions and boundary conditions of the numerical tank.
Jmse 07 00468 g003
Figure 4. Mesh generation.
Jmse 07 00468 g004
Figure 5. The y+ value at the hull bottom, Fr =5.99.
Jmse 07 00468 g005
Figure 6. Calculated values of different mesh strategies.(a) Resistance, (b) Trim, (c) Sinkage.
Jmse 07 00468 g006
Figure 7. Typical resistance convergence time-history curve for planing hull simulation.
Jmse 07 00468 g007
Figure 8. Comparison of resistance, trim, and sinkage between numerical and experimental results. (a) Resistance, (b) Trim, (c) Sinkage.
Jmse 07 00468 g008
Figure 9. Wetted area on broadside and transverse wave cuts after step, Fr = 2.41.
Jmse 07 00468 g009
Figure 10. Bottom view of wetted area and wave-making characteristics.
Jmse 07 00468 g010
Figure 11. Longitudinal wave form in the central section.
Jmse 07 00468 g011
Figure 12. Dimensionless wetted and cover rate of air cavity.
Jmse 07 00468 g012
Figure 13. Bottom view of pressure distribution.
Jmse 07 00468 g013
Figure 14. Load coefficient and longitudinal location of pressure center of fore and aft planning surface. (a) Hull lift, (b) Longitudinal position of pressure center.
Jmse 07 00468 g014
Table 1. Main dimensions of C1 stepped hull form.
Main DimensionsSymbolValue
Overall length (m)LOA2.0
Main hull beam (m)BOA0.46
Chine beam BC (m)BC0.392
Draft (m)T0.09
Longitudinal center of gravity (m)LCG0.66
Deadrise angle (°)β22.5
Longitudinal location of step (m)LS0.622
Step height (m)H0.02
Angle between step projection line and longitudinal mid-section (°)α90
Table 2. Mesh size and element number of different mesh plans.
PlanMesh Size ParametersMesh Number
Surface Mesh ( L )Inner Domain Mesh Size
( L )
Non-Dimensional Near-Wall Mesh Size (y+)Surface Mesh Size
(1 × 10⁶)
Inner Domain Mesh Size
(1 × 10⁶)
Total Mesh
(1 × 10⁶)
Mesh 1 ( S 1 )2.004.0090–1500.0872.673.78
Mesh 2 ( S 2 )2.835.6690–1500.0562.023.03
Mesh 3 ( S 3 )4.008.0090–1500.0351.512.52
Table 3. Validation of resistance, trim angle, and sinkage (Mesh 1).
CoefficientFr R G p G | 1 C G | δ R E G * ( D % ) U G ( D % ) | E | ( D % )
7.120.392.710.568.0817.165.51
Resistance4.80.372.880.721.032.507.62
2.410.810.600.777.0217.794.61
7.120.234.232.331.478.303.89
Trim angle4.80.353.060.891.433.1824.50
2.411.75NANANANA5.45
7.120.155.524.770.323.348.06
Sinkage4.80.482.120.091.882.207.07
2.417.12NANANANA19.91

