1. Introduction
Many of the world’s largest commercial ports are situated in estuarine regions that are naturally subject to sedimentation. Dredging of benthic sediments is needed to create (capital dredging) and maintain (maintenance dredging) channels and berths for transportation activities and for safe and efficient port operations globally. In Australia more than 99% by weight of trade goes through ports. Management of these systems requires knowledge of sediment dynamics to inform decisions on issues related to sediment disposal and its environmental impacts [
1]. Much of the sediment dredged from shipping channels during regular maintenance is not significantly different from the sediments found in other regions of natural estuarine environments and recently many organizations have proposed that dredged material should be considered a resource and not a waste product [
2]. In addition, there is strong evidence that removing sediment from the estuarine system can negatively impact the sediment budget resulting in erosion and instability [
3]. Globally, port managers are considering options for retaining sediment within the system rather than relocating the sediment offshore or on to land. Identifying the source of sediment infilling dredged channels gives port managers the knowledge to pursue more effective approaches to reduce infilling and the costs of dredging, (e.g., targeted catchment management, riparian restoration, mudflat revegetation). Further, understanding sediment provenance provides critical information regarding the potential for dredge spoil reuse or appropriate disposal methods of dredged material. (e.g., disposal in areas least likely to be remobilized).
In the Port of Gladstone, Queensland, maintenance dredging is conducted annually by the Gladstone Ports Corporation (GPC) to fulfill its operational obligations under the Queensland Transport Infrastructure Act 1994. The Port of Gladstone is located in the Port Curtis Bay region, which is a macro-tidal estuarine system. It includes an intricate network of rivers, creeks, inlets, shoals, mud banks, channels, and islands. These physical features and complex water circulation patterns occur throughout Gladstone Port and are primarily governed by a large barotropic tidal flow that contributes to high natural sediment loads [
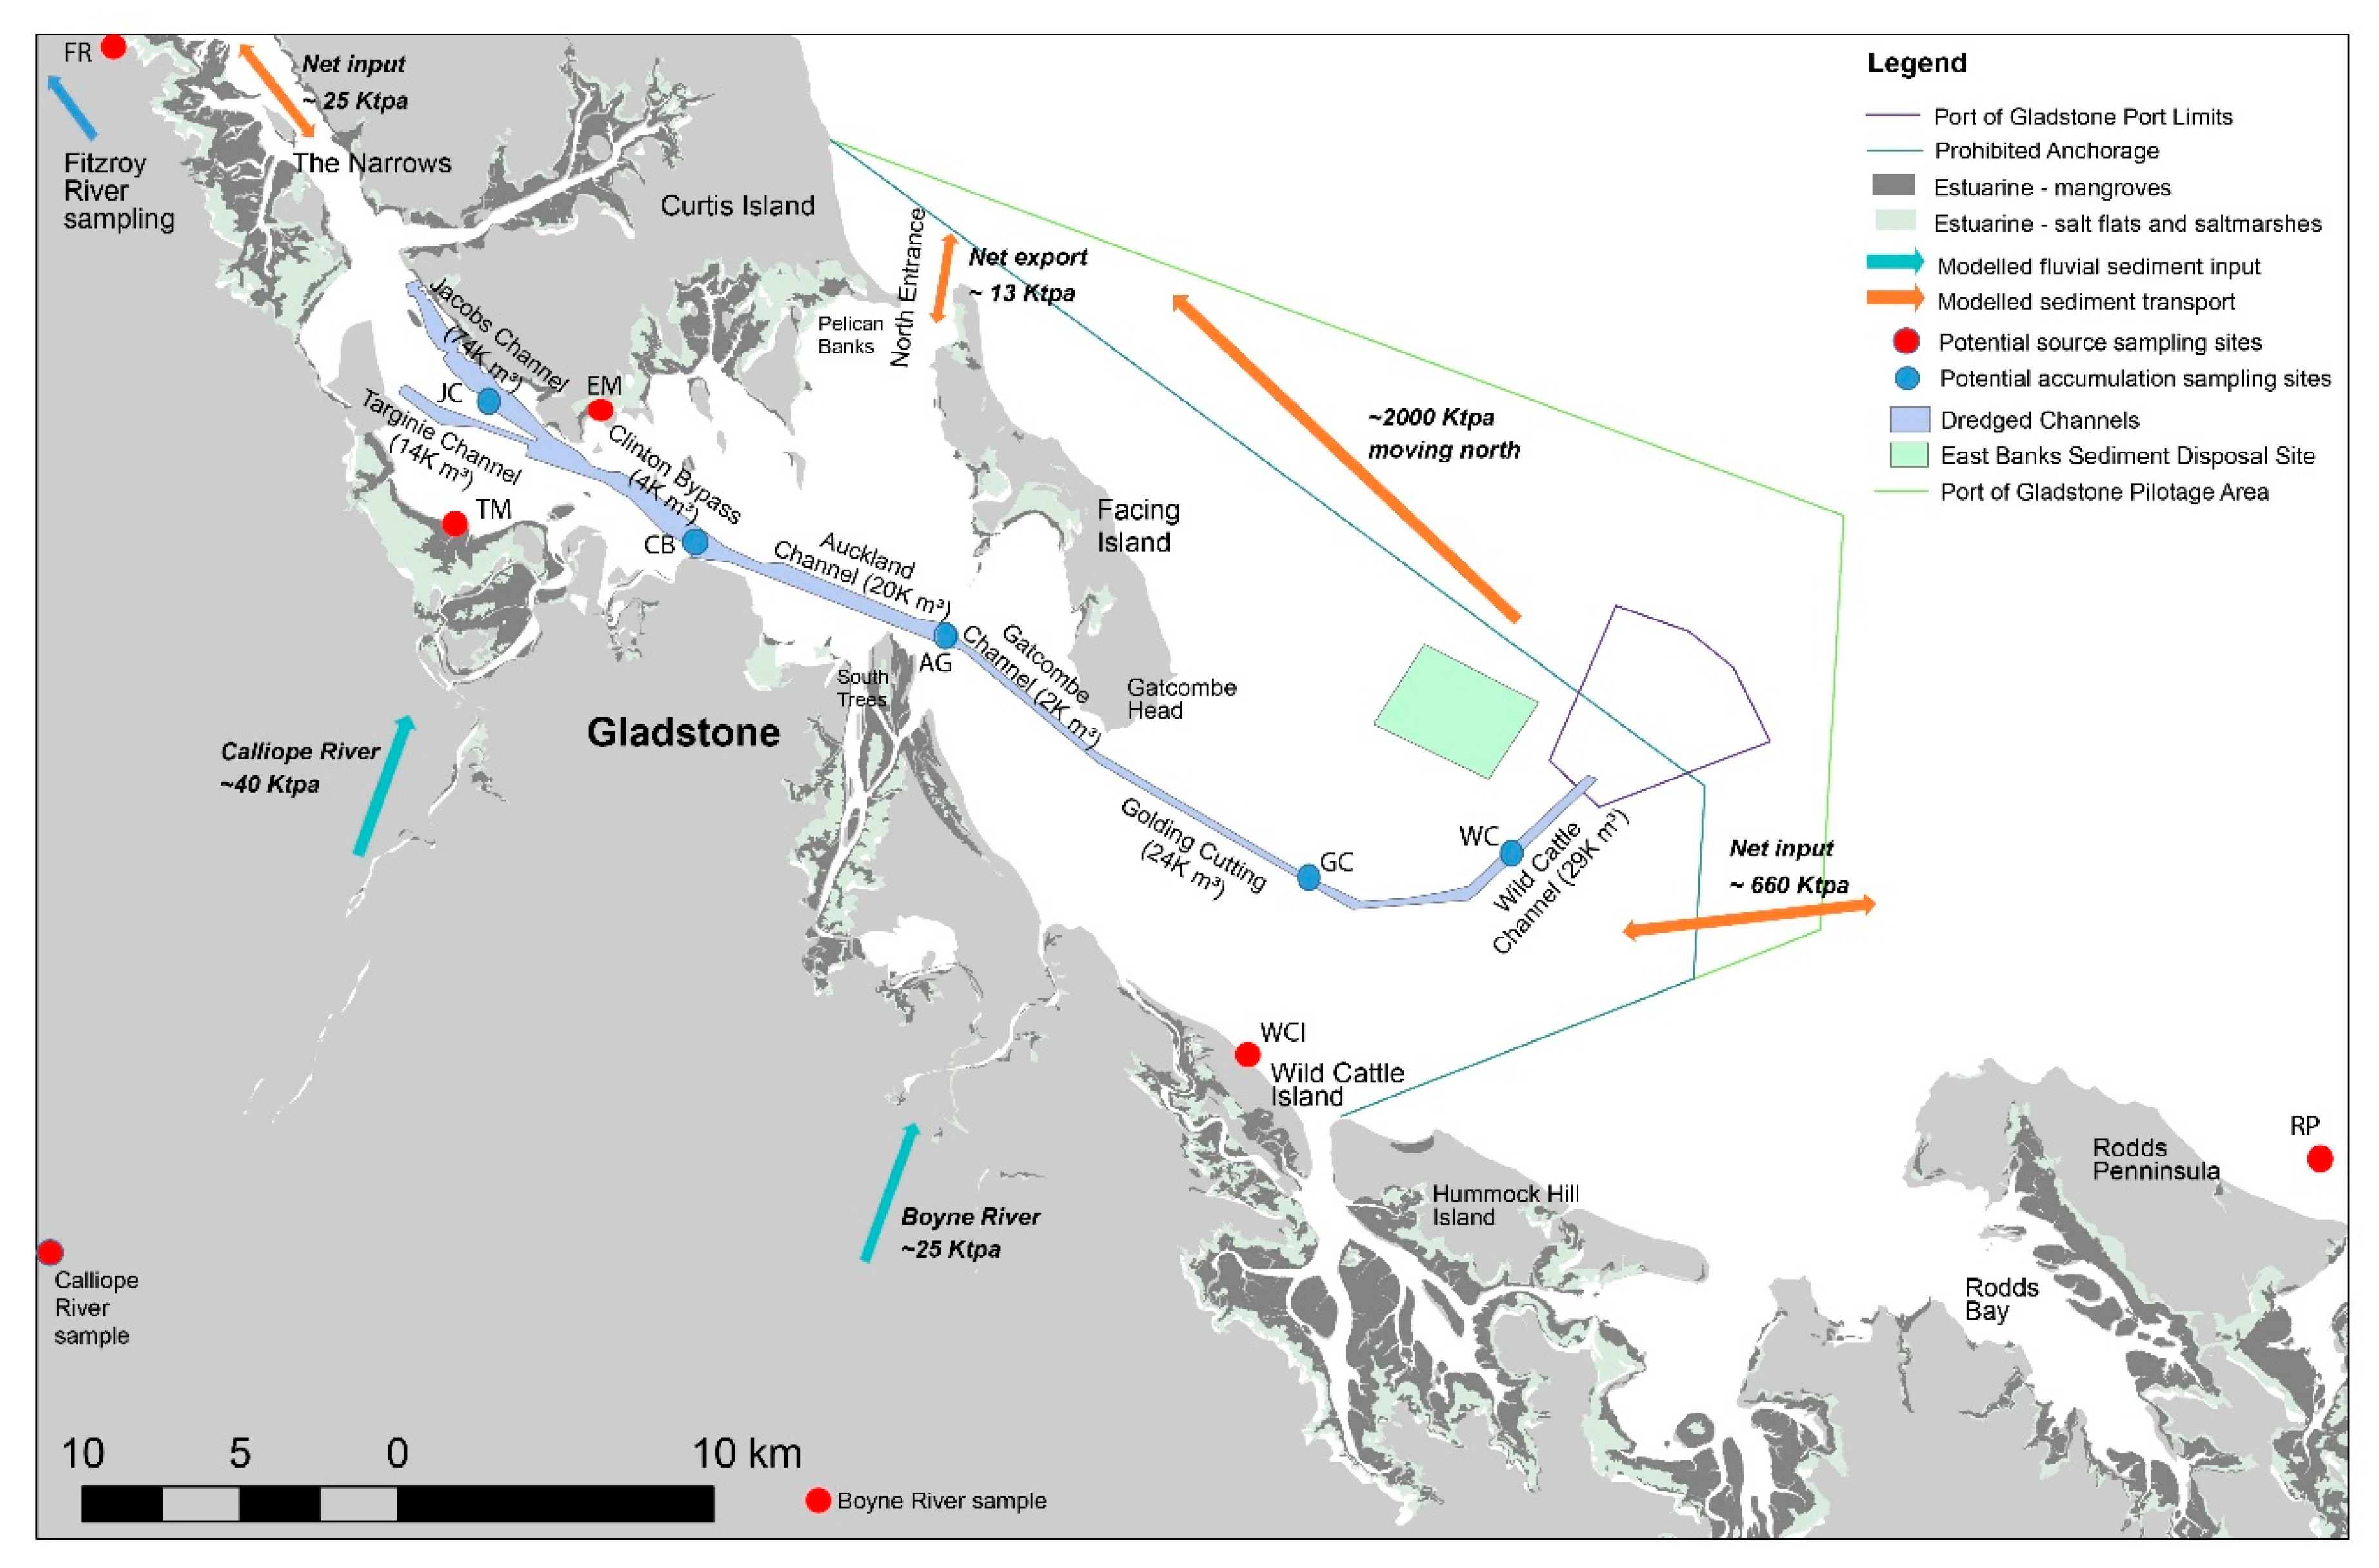
4]. A major natural (although modified through land use) source of sediment into the Port of Gladstone is fluvial transport from landscape erosion of adjacent catchments. Local catchments influence sediment supply to the Port of Gladstone, either directly (e.g., the Boyne and Calliope), via longshore drift (Kolan, Burnett, and Baffle), or via The Narrows (the Fitzroy;
Figure 1) although the full extent of their influence has not been quantified yet. Wide entrances and marine tidal flushing create muddy or sandy deltas with large areas of intertidal habitats. Intertidal mud may become resuspended and transported into and out of the dredged channels by tidal currents in some parts of the port [
4]. In addition, bed sediment outside the Port can be mobilized by wave action, and wave-generated and wind-driven currents, that are thought to result in a net sediment transport flux northwestward through the main entrance of the Port and entering the outer channels [
5]. Eroding land sources exist along the Gladstone coastline and may also be a source of sediment for the dredged channels. The geology of the catchment, land use and rainfall (and hence flow) will all influence the amount of sediment transported to and from a catchment. The geology of the catchment also influences the elemental composition of sediments and may provide a method of assessing the source of material.
In this study, we assessed whether sediment provenance could be determined using a multi-faceted approach. A combination of rare earth elements, strontium isotopes, beryllium-7 (7Be) activity, stable isotopes, and particle size was used with each parameter providing different insights into sediment source and transport pathways. By integrating these multiple methods for identifying sediment source, this study aimed to distinguish the sources of sediments contributing to deposition in the dredged channels in the Port of Gladstone and, importantly, provide a framework for undertaking similar investigative studies in other shipping channels.
2. Materials and Methods
2.1. Study Location
As Queensland’s largest multi-commodity port and the fifth largest coal port in the world [
6], the Port of Gladstone supports several major industries including three liquefied natural gas (LNG) processing plants, alumina refineries, an aluminum smelter, an ammonium nitrate plant, and a cement plant. The region also includes a diversity of marine and coastal habitats from coastal seagrass meadows and mangrove forests to coral reefs, populations of dugong and cetaceans, turtle rookeries, and important recreational and commercial fisheries. Given this juxtaposition of heavy industry and natural marine ecosystems, and the fact that the port lies within the Great Barrier Reef World Heritage Area, the environmental management of port operations is highly valued and regulated by state and federal governments. Currently there is one major shipping channel that splits in the Inner Harbour to service wharves on the mainland and LNG plants on Curtis Island (
Figure 1).
Five accumulation samples from dredged channel locations were compared with material from six possible sources prior to annual maintenance dredging, pre-wet season of 2018/19 and during the wet season. Dredge channel bathymetric surveys were analyzed to identify sampling locations that are representative of accumulation areas. Accumulation areas were also selected based on areas where large volumes of dredge material have been regularly removed (see
Figure 1). Areas most likely to have a distinct particle-size, compositional, or geochemical signatures due to the proximity of sources were also considered in sample site selection and modeled sediment fluxes (see
Figure 1).
Table 1 illustrates the analyses carried out on the samples collected from different locations and times. Not all analyses were carried out on all samples from every site time combination. This combination of sampling was to allow the assessment of different techniques to detect the sediment source and not as a comprehensive assessment of the sediment source across the dredged channel region.
2.2. Strontium Isotope Sampling and Analysis
Strontium (Sr) isotope analysis has been shown to be a useful tool in studies of sediment mobility and the chronostratigraphic analysis of marine sediments [
7,
8]. Strontium concentrations are typically higher in older and high-Ca granite, basalt, and carbonate, and lower in some ultramafic rocks and aragonitic corals. When Rubidium (Rb) and Sr are incorporated into a mineral or rock
84Sr,
86Sr, and
88Sr concentrations are stable over time but
87Sr increases as a product of
87Rb radioactive decay. Therefore, older rocks have higher
87Sr/
86Sr ratios than younger rocks with the same initial Rb/Sr ratio. The Sr concentration and
87Sr/
86Sr ratio of sediments is conserved as those sediments are moved from one area to another as long as the mineral fractions remain constant. The Sr-isotopic composition of river sediment reflects the physical weathering of exposed rock and soils in the catchment. The global ocean is well mixed with respect to
87Sr/
86Sr and yields modern carbonates and marine shells with
87Sr/
86Sr = 0.70917.
Dredged channel sediment samples were collected during the 2018/2019 wet season in January 2019, from the Jacobs Channel (JC), Clinton Bypass (CB), Golding Cutting (GC) and Wild Cattle Channel (WC), and the intersection of Auckland and Gatcombe channels (AG). Channel sediment samples were collected using a Van Veen grab from the CQUniversity research vessel. Grab sediment samples were taken from the middle, surface section of the grab where the sediment had not been in contact with the grab, and from the top 1 cm surface layer of a clean grab (i.e., a grab that has closed properly and where the surface of the sediment is observable and intact). The grab was triple washed in seawater between sampling and locations to avoid cross contamination of samples.
At each site three sediment samples (approx. 10 cm deep) were collected using a polypropylene spoon and quickly transferred into clean acid washed 1 L polyethylene flasks (without head-space). Samples were oven dried at 80 °C and sieved through nylon meshes (63 μm), transferred into clean acid washed 1 L polyethylene flasks and held in a cool room until analyzed. Strontium analysis was carried out at the Isotope Geochemistry Facility, University of Adelaide, using a Thermal Ionization Mass Spectrometer (TIMS, Isotopx Phoenix, Middlewich, UK) calibrated for 87Sr/86Sr analysis and triple-distilled acids. A sub sample (150 mg) of each sample was digested in 15 mL Savillex perfluoroalkoxy vials, dissolved in 2 mL 7 M nitric acid and 4 mL 48% hydorflouric acid on a hot plate at 140 °C in capped vials for at least 48 hours. Uncovered, the samples were evaporated to almost dryness before 1 mL of 15 M nitric was added before taken to dryness. This process was repeated and then the sample was re-dissolved in 6 mL 6 M hydrochloric acid (for conversion to chlorides).
Strontium separation was carried out via column chromatography, by re-dissolving samples in 8 M nitric acid, and extracting the Sr using 50–100 u eichrom Sr resin in Biospin micro columns [
9]. Samples were analyzed on the TIMS for five blocks of 20 cycles (100 ratios) and normalized to
86Sr/
88Sr (0.1194).
2.3. Rare Earth Element Sampling and Analysis
The rare earth elements (REEs) are a group of 17 metals that comprise of lanthanum (La), cerium (Ce), praseodymium (Pr), neodymium (Nd), promethium (Pm), samarium (Sm), europium (Eu), gadolinium (Gd), terbium (Tb), dysprosium (Dy), holmium (Ho), erbium (Er), thulium (Tm), ytterbium (Yb), and lutetium (Lu), in addition to scandium (Sc) and yttrium (Y). REE are conserved under the processes of weathering, denuding, transportation, deposition, and diagenesis. According to their geochemical characteristics, REE can be used not only to trace the sediment provenance, but also to indicate the deposition environment [
10].
Samples were collected in November 2018 from the Calliope River, Boyne River, Fitzroy River, from still waters above the tidal limit, and north of Rodds Peninsula, representative of longshore drift sediment source from the Burnett Mary catchments further south. Sediment samples were also collected from the intertidal mudflats at Targinnie and Enfield and the beach at Wild Cattle Island.
Dredged channel sediment samples were collected as described for strontium isotope analysis during the 2018/2019 wet season in January 2019, from Jacobs Channel, Clinton Bypass, Golding Cutting (GC) and Wild Cattle Channel (WC), and the intersection of Auckland and Gatcombe channels (AG).
At each site three sediment samples (approx. 10 cm deep) were collected using a polypropylene spoon and quickly transferred into clean acid washed 1 L polyethylene flasks (without head-space). Samples were frozen on return to the laboratory. Analysis of REEs was carried out by the National Measurement Institute using an aqua regia digestion followed by Inductively coupled plasma mass spectrometry (ICP-MS) determination of REE. Five percent duplicate samples were used to monitor the precision and accuracy of the tests [
11].
2.4. Beryllium Isotope Sampling and Analysis
The radioactive isotope beryllium-7 (
7Be) is a short-lived (half-life = 53.3 days) radioisotope, which is formed in the earth’s atmosphere through spallation reactions. Due to its short half-life, along with the atmosphere being the only source,
7Be can be used as a tracer for deposition of sediments that were recently exposed to the atmosphere. Once soils and sediments are delivered to rivers and the ocean,
7Be rapidly decays, and therefore the presence of
7Be in channel sediments is a qualitative proxy that they are relatively recently delivered. Further, if
7Be is present, it suggests that the sediment source was exposed to
7Be fallout prior to delivery. For example, where sediments are supplied by deep gully erosion, or long-shore drift, it is unlikely that these sediments would have a
7Be signal, while resuspension and deposition of sediments from inter-tidal mud flats or exposed soils in the catchment would have detectable
7Be activities [
12].
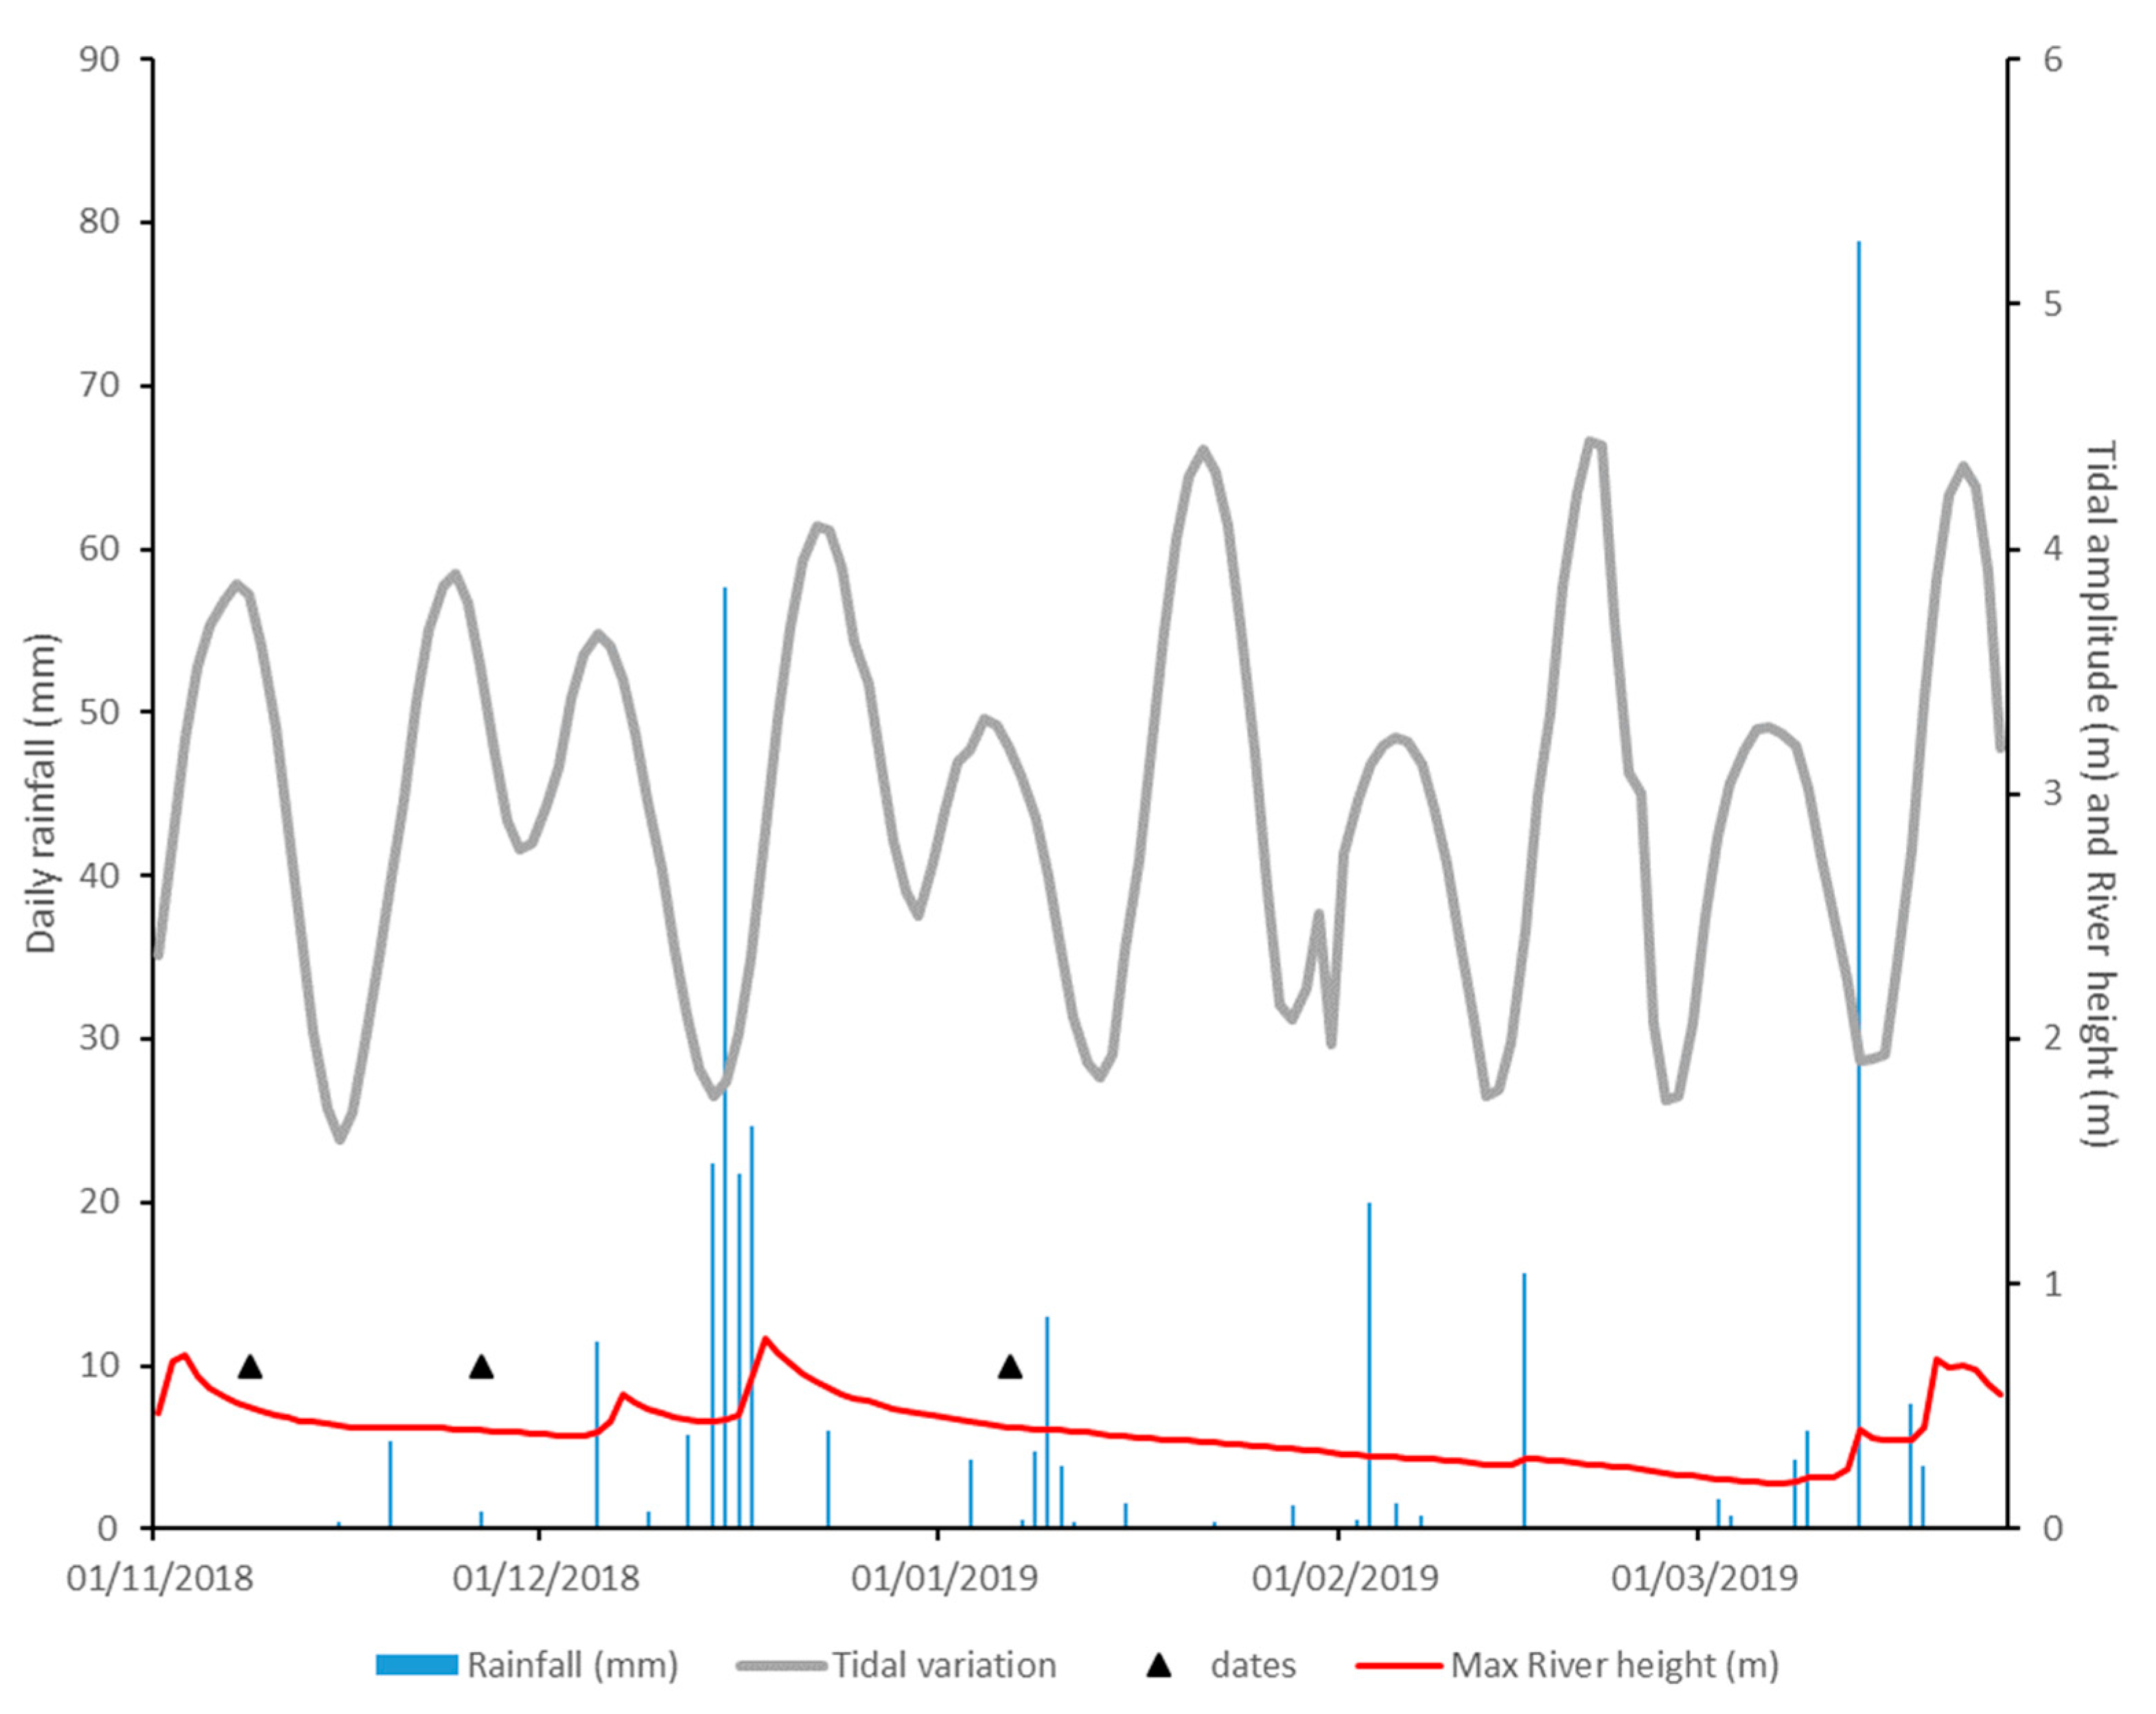
Five channel accumulation sampling sites within the Port of Gladstone (
Figure 1) were sampled in triplicate for
7Be during dry conditions on the 8th November 2018, post the spring tide prior to dredging operations, which began on the 9th of November 2018, and on the 4th January 2019, following 57 mm of rain on the 15th of December 2018. Samples were collected via a Van-Veen grab, with the surface few millimeters sampled and placed wet into 65 mm petri dishes. The petri dishes were sealed and analyzed for
7Be activities using a planar gamma spectrometer at Southern Cross University’s gamma spectrometry laboratory. Following analysis, samples were dried and weighed, and all data are reported as Becquerel per kilogram (Bq kg
−1).
2.5. Stable Isotope Analysis
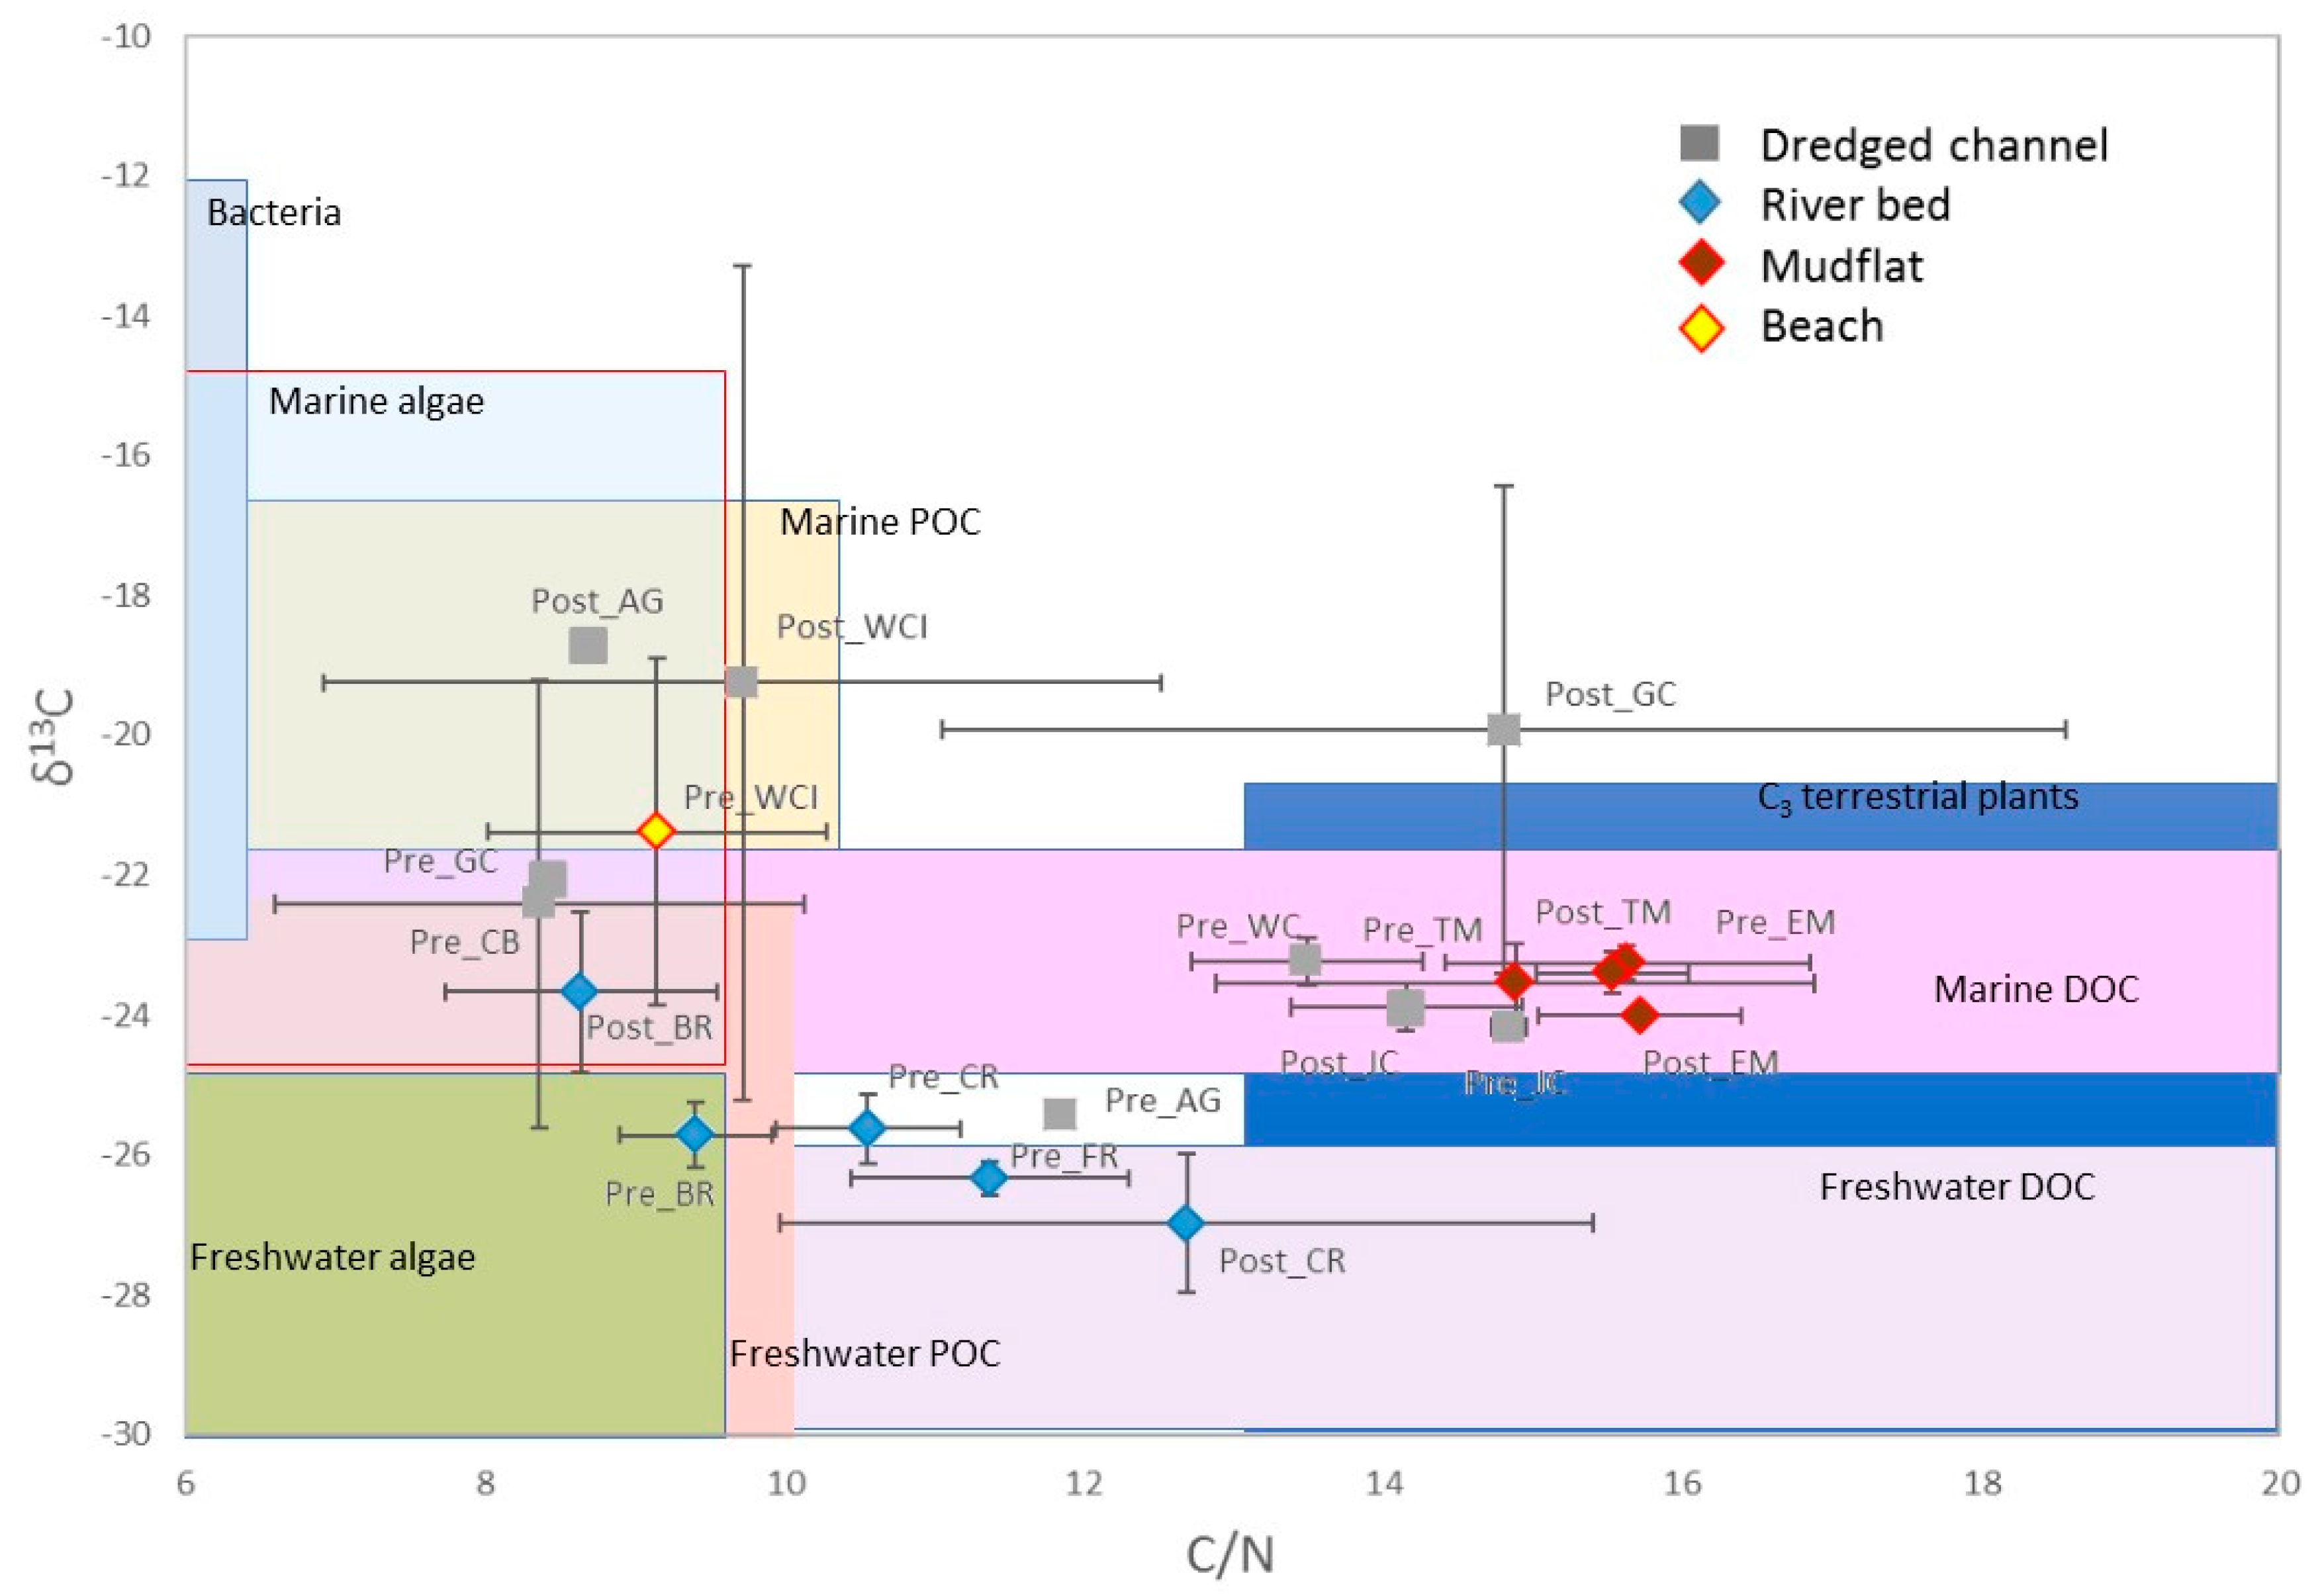
Organic matter (OM) associated with sediments can provide valuable information on the source of the material. The total organic carbon (TOC) to total nitrogen (TN) ratio (C/N ratio) of a sediment sample can provide information on whether the source is terrestrial or oceanic. Terrestrial-derived OM generally has higher C/N ratios (e.g., vascular plants 15–40) than marine-derived OM (e.g., phytoplankton 6–7) [
13]. Furthermore, the identification of source can also be achieved by comparing the stable isotopes of carbon and nitrogen within the sediment. Carbon and nitrogen both have two stable isotopes (
12C and
13C, and
14N and
15N) and chemical and biological reactions altering the ratio (denoted as δ
13C and δ
15N, respectively) [
14]. There is a distinct isotopic variation between terrestrial, marine, and riverine organic carbon sources, due to isotopic fractionation during biological carbon assimilation [
15]. This “fingerprint” of organic matter sources can be used to track the flow of carbon along the terrestrial-marine continuum. Due to the complex nature of carbon and nitrogen in coastal regions, stable isotope (δ
13C and δ
15N) techniques and the C/N ratio are robust tools to elucidate sources in estuarine and coastal regions, based on the different signatures of the sources [
16]. In general, terrestrial organic matter has depleted (more negative) δ
13C and δ
15N values when compared to marine organic matter [
17]. The use of dual isotopes (both δ
13C and δ
15N) improves the accuracy of source identification in complex coastal regions where contributions of organic matter are more complicated.
As per beryllium, the five channel accumulation sampling sites shown in
Figure 1 were sampled in November following a spring tide and prior to dredging and again in February/March after a rain event. Samples were taken from the top 1 cm surface layer of a clean grab (i.e., a grab that has closed properly and where the surface of the sediment is observable and intact). The collected samples were sealed in polyethylene tubes and stored frozen at −20 °C before analysis. Samples were then dried for 24 h at 60 °C, washed in 10% HCl to remove carbonates, redried at 60 °C and then ground into a fine powder. Carbonate-free samples were analyzed by the Australian Rivers Institute’s Stable Isotope Laboratory for
15N and
13C by combustion.
The results were expressed as standard delta (δ) notation per mille (‰) based on the isotopic ratios of the sample and standard, respectively. The carbon standard is referenced against Peedee Belemnite (PDB) and the nitrogen standard was atmospheric N2. For stable isotope analysis, Rodds Peninsula samples were removed due to high amounts of sand and shell material (six samples).
2.6. Particle Size Analysis
Particle size analysis can be used as an additional tool to discriminate among different sediment sources, particularly where sources have distinctive sediment particle size classes and/or distinctive combinations of particle size classes (e.g., 50% sand and 50% silt vs. 100% sand and 0% silt). In this study, a continuous approach was adopted whereby sediment samples were analyzed using laser diffraction (Malvern MasterSizer 3000, Malvern, UK), thus allowing for enumeration of sediment particle sizes along a continuum (as opposed to the discrete size class), and thus a more detailed understanding of the ‘fingerprint’ of sediment sizes from site. Therefore, a comparison of fingerprints between source and sink sites provides additional evidence for the origin of sediments into a site.
For every sediment sample taken, a sub-sample (approximately 100 mL) was collected for particle size analysis to assess whether sediment source can be identified from particle size distribution. Samples were placed in polyethylene bags, placed on ice and cooled to <4 °C immediately after sampling. Within 24 hours each sample was thoroughly mixed and then split into two representative subsamples. One sample split was archived in case of the instrument or other error. The second sample was dried in an oven at 60 °C and weighed on an analytical balance to two decimal places. The sample was then re-wetted and dispersed using sodium hexametaphosphate and then wet sieved through a sieve stack comprising a 2000 µm sieve, 63 µm sieve and a receiving pan. Gravels were retained on the 2000 µm sieve, sands on the 63 µm sieve and muds were retained in the receiving pan. Gravel and sand fractions were again dried and weighed on the analytical balance. The dry weight of the mud fraction was derived by subtracting the dry gravel fraction and sand fraction weights from the original dry weight. The mud and sand fraction were then combined and retained as a wet sample for direct use in the Malvern MasterSizer 3000.
2.7. Data Analysis
A hypothetico-deductive approach was followed to test the following hypotheses (summarized in
Table 2), which the recently deposited sediment in the dredged channels came from: (1) resuspension from intertidal mudflats; (2) transport from beaches; (3) catchment run off; (4) resuspension from subtidal sediments; and (5) long-shore drift. The hypotheses are not mutually exclusive and there is a possibility in a well-mixed macro-tidal system such as the Port of Gladstone that sediment in the channels is from multiple sources. For a hypothesis to be supported, we considered that at least two thirds of its related predictions should be satisfied (
Table 2). A weighting was calculated based on the lines of evidence to score the likelihood of the process for each of the sites. For example, if a site met five out six 6 criteria for hypothesis 1, it would be given the score of 0.83.
4. Discussion
By integrating multiple analytical methods, this study aimed to determine whether sediments contributing to the infilling of channels in the Port of Gladstone could be attributed to having originated from nearby sediment sources. Individually, some methods appear more promising than others, with results from 7Be, REE, 87Sr, and stable isotope analyses providing initial indications of sediment source, which may help to guide management of dredging operations. Other methods tested were not as convincing but may still have use in the provision of additional supporting evidence.
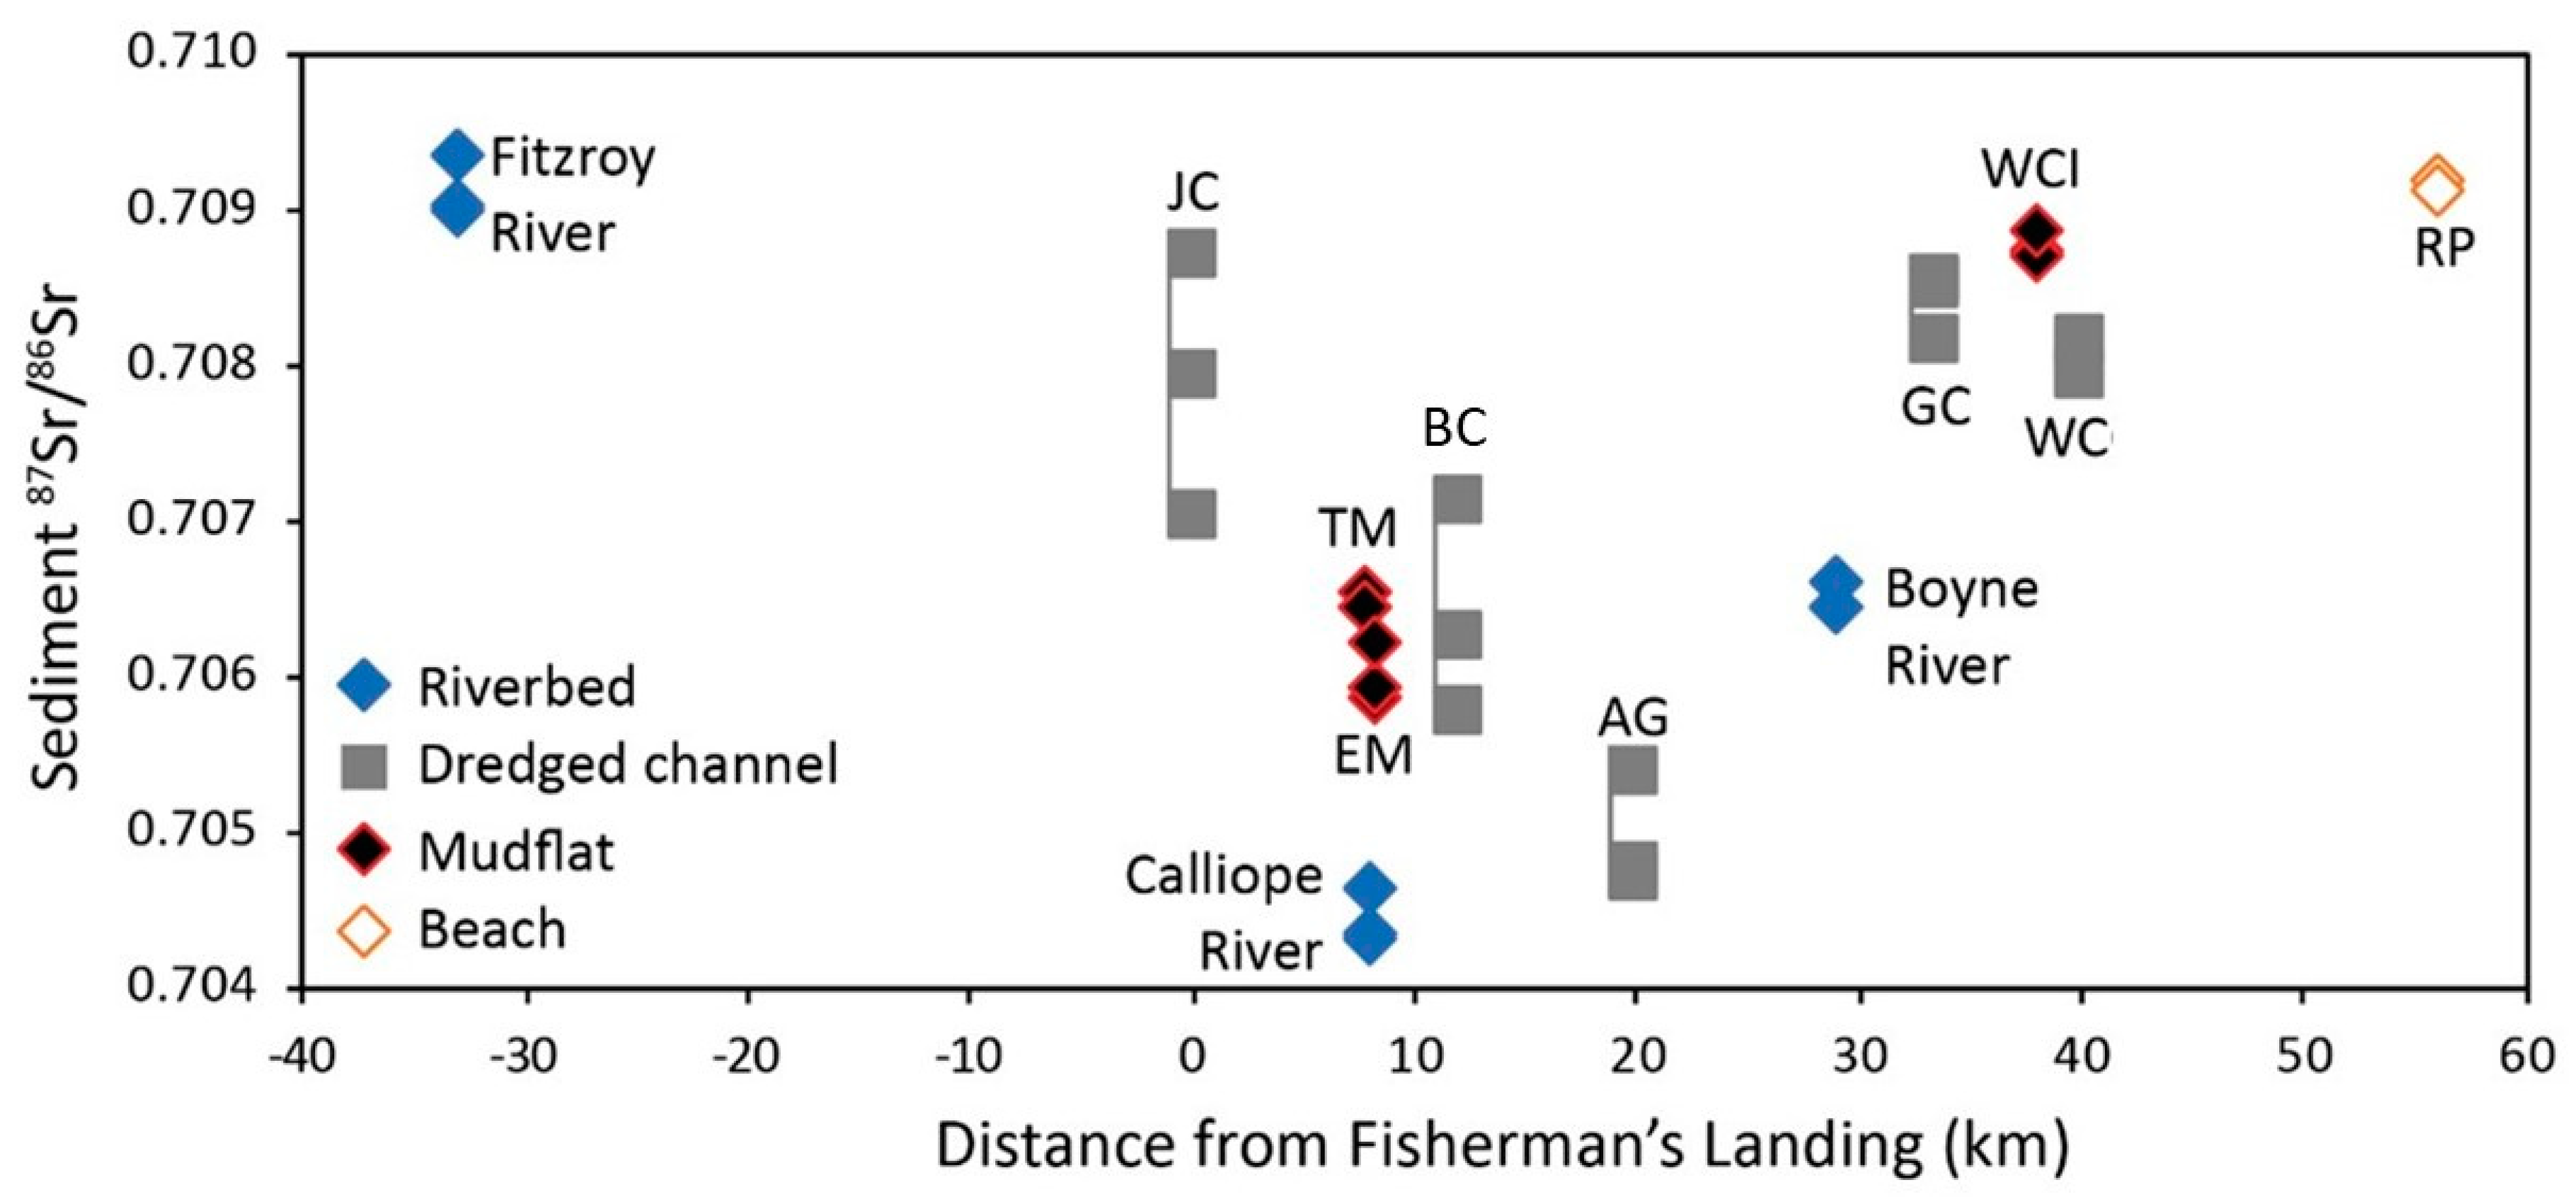
The spatial pattern of
87Sr/
86Sr from sediments in rivers and alongshore in the Gladstone region is consistent with underlying bedrock and longshore drift currents. High values (>0.709) in the Fitzroy River reflect a higher contribution to the sediment loads of Rb-rich rocks in the Fitzroy basin catchment. The Calliope and Boyne River catchment values (<0.707) may reflect a higher contribution of Paleozoic and Mesozoic sediments, especially carbonates. The Rodd’s Peninsula sediments plot almost exactly on the marine
87Sr/
86Sr, reflecting their composition of carbonate shells of marine origin. The channel sediments (
Figure 3) appear to reflect local fluvial inputs modified by long-shore transport of both coastal and marine sediments. Especially striking is the decrease of
87Sr/
86Sr values imparted to channel sediments from the Calliope River, and the influence of marine sediments in the more distal parts of the channel, including Golding Cutting and Wild Cattle Channel, suggesting that catchment source sediments may be retained largely within the harbor, although it is likely that this would change in severe flood events [
20]. The
87Sr/
86Sr of sediments in the distal regions of the channel appear to be consistent with local sediment sources modified by long-shore transport.
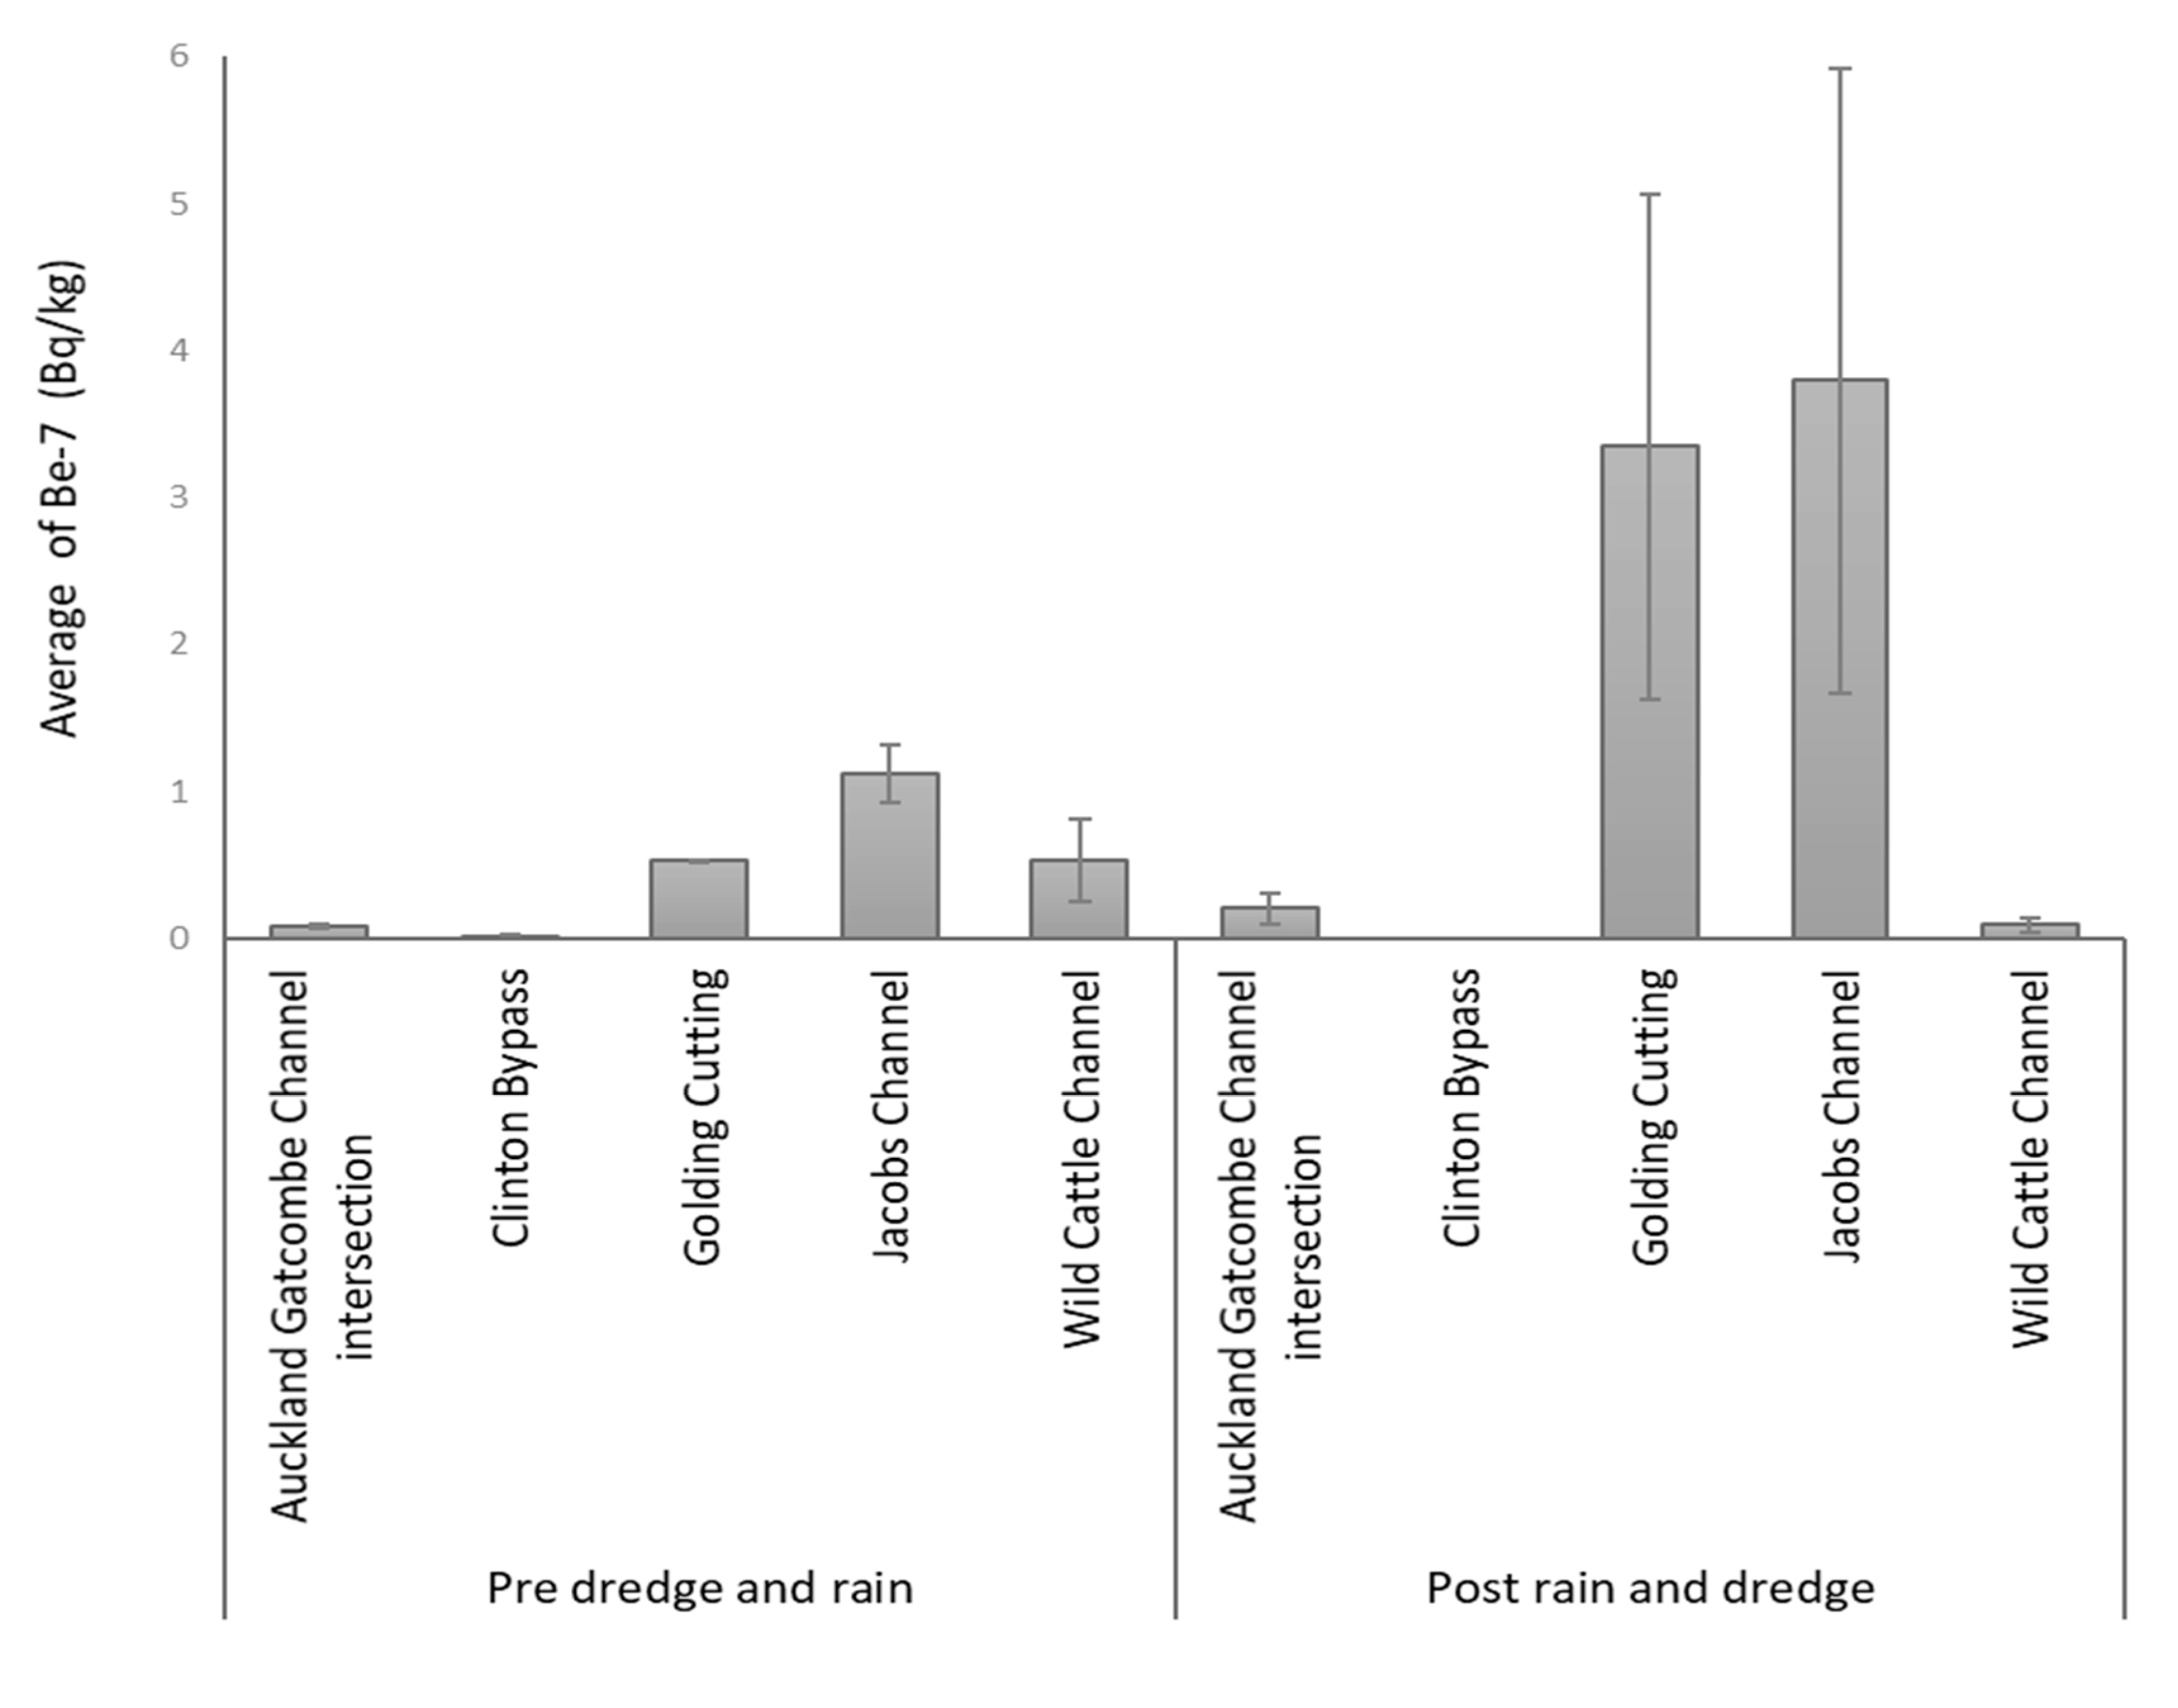
The
7Be data suggest that at all sites (apart from the Clinton Bypass site), the sediment had been recently deposited, and that the source of the sediments had been exposed to atmospheric fall out of
7Be. Considering that the first sampling campaign was undertaken during relatively dry conditions, it is unlikely that the observed
7Be activities were due to catchment erosion but were more likely related to resuspension and deposition of sediments from the nearby intertidal mud flats. This indicates that extensive reworking and transport of existing sediment occurs within Port Curtis. During the wet conditions,
7Be activities were generally higher, potentially indicating a greater contribution of intertidal mud flat sediments to the channel or an additional source of recently eroded soils from the catchment. The Clintons Bypass site had very little to no
7Be throughout both sampling campaigns. Whilst this may suggest either that deposition at this site was negligible, or that the Clinton Bypass site had a unique sediment source, previous modeling and sediment mapping [
21] suggest high velocities at this location, which would limit deposition potentially suggesting that the ongoing deposition that occurs is due to the bedload transport of existing coarser grained sediment in the area.
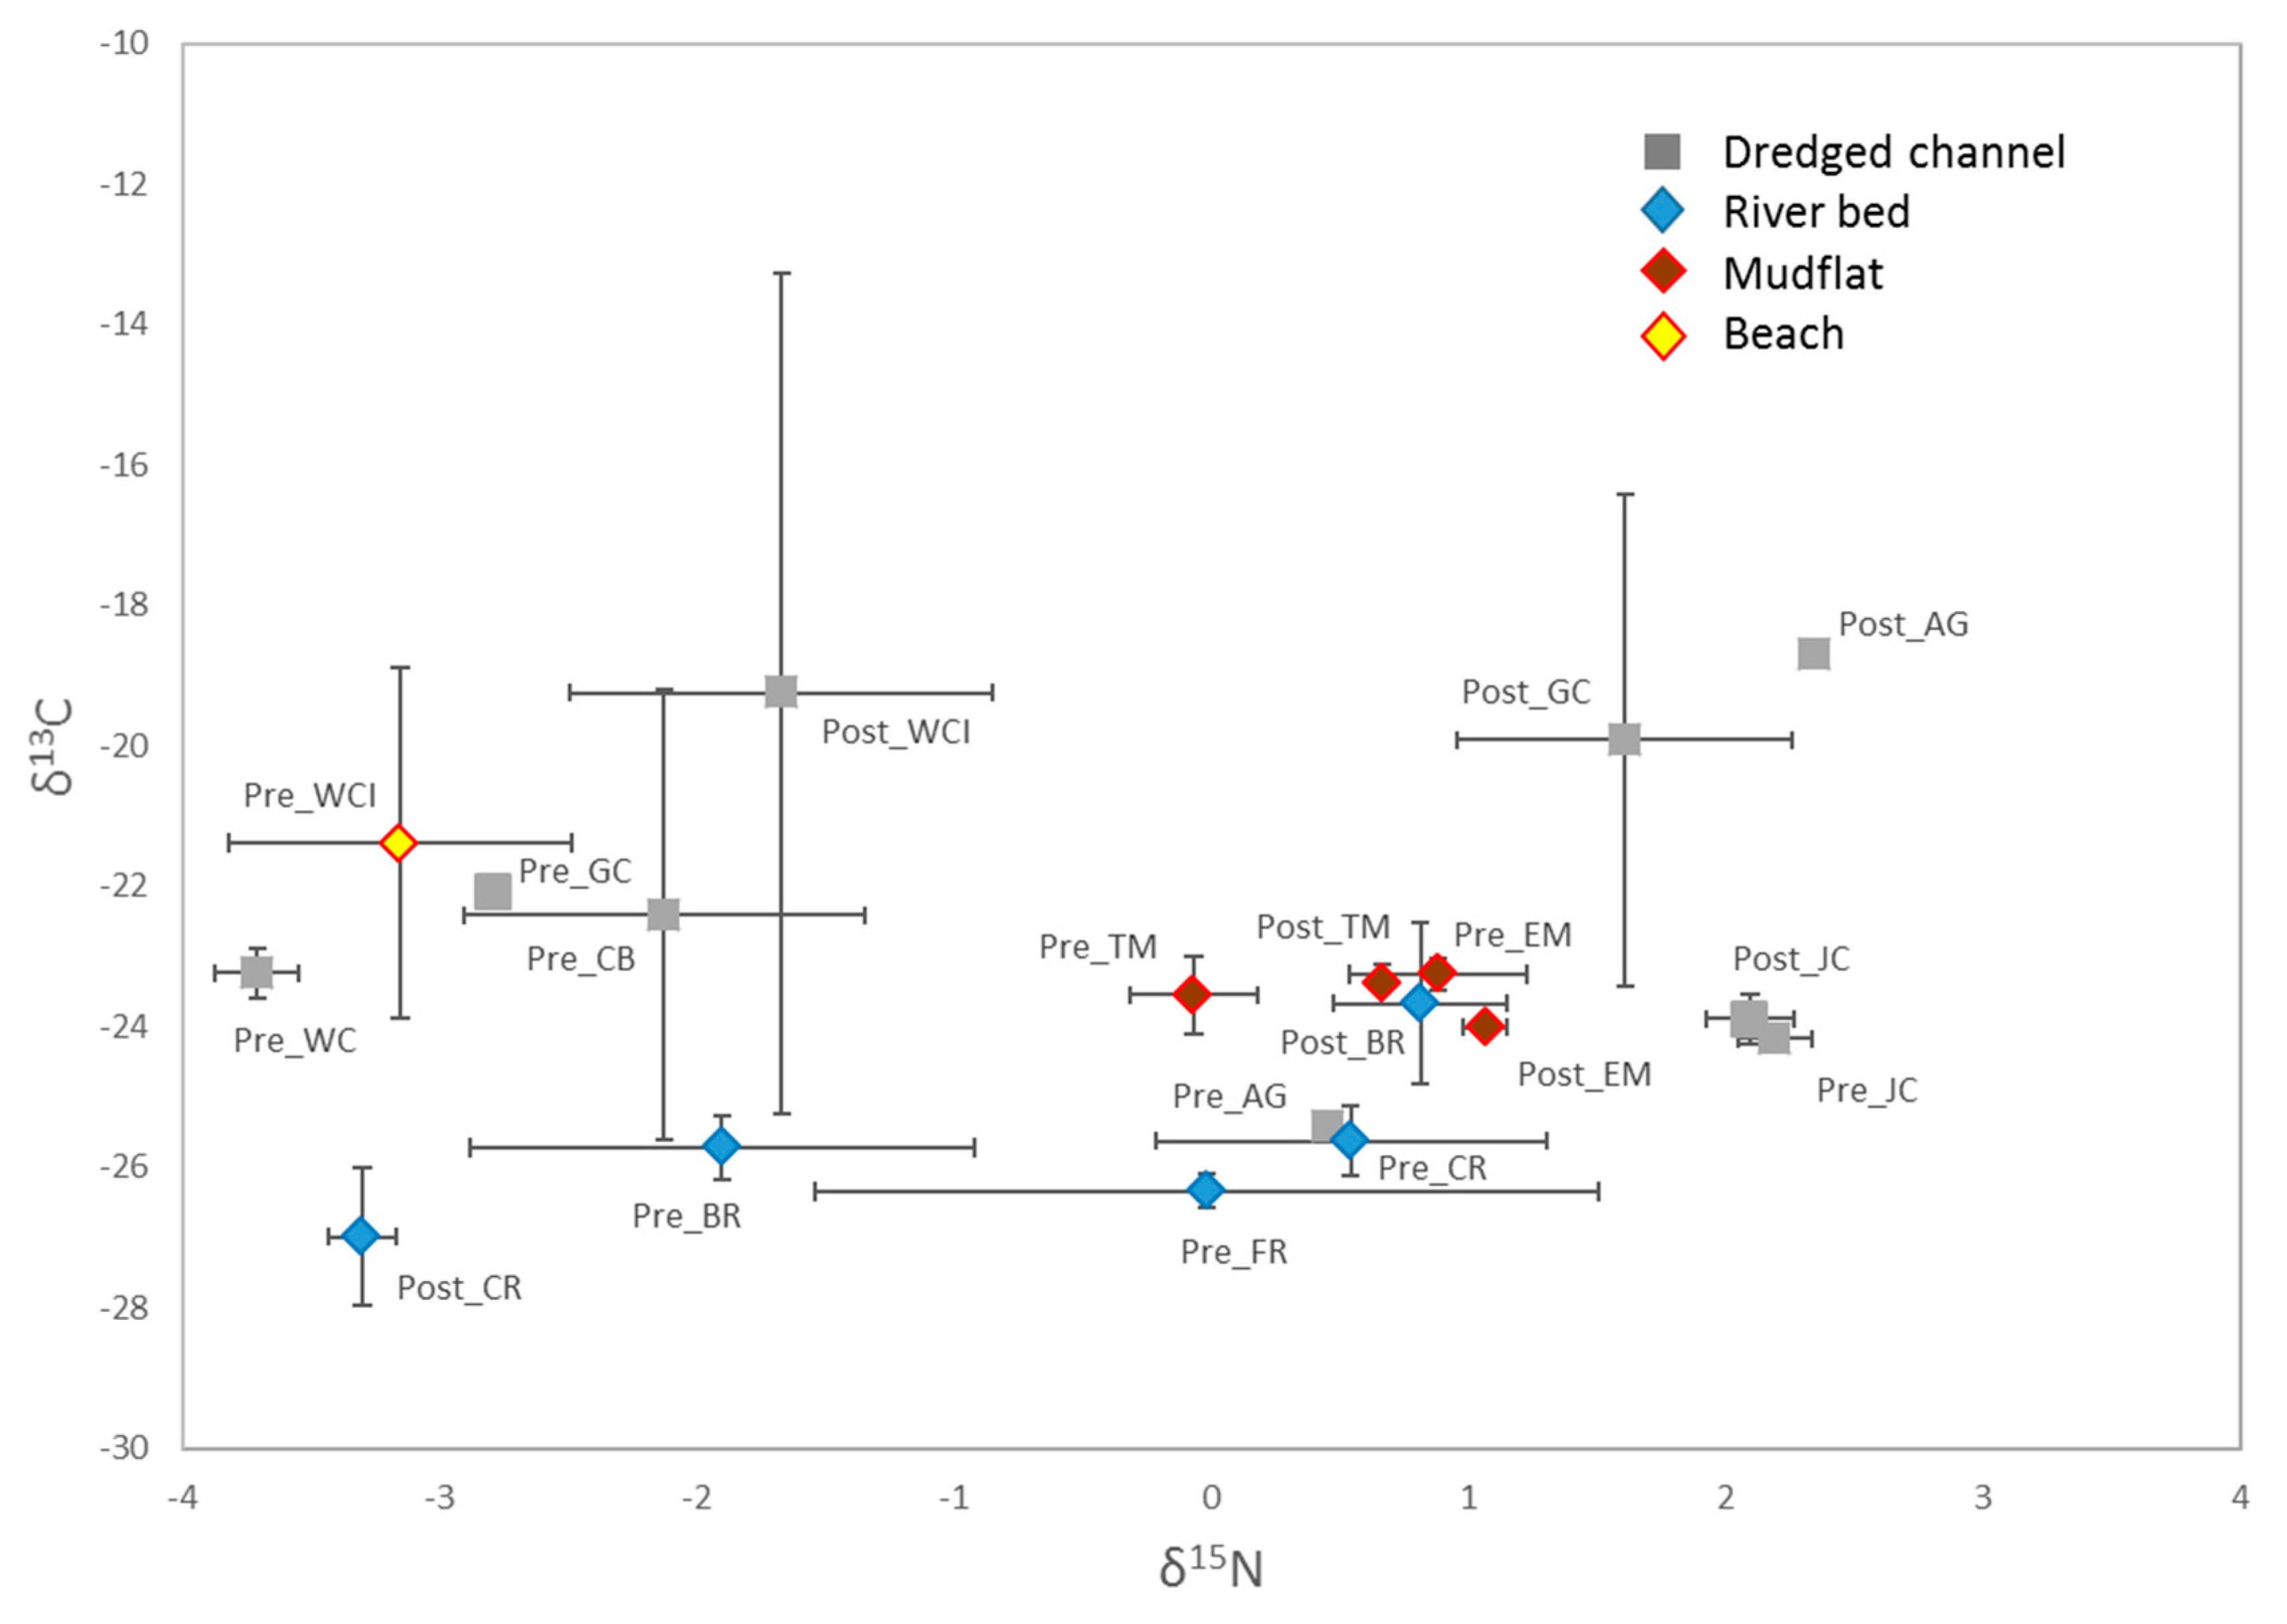
The gradient of depleted to enriched δ
13C from catchment, to mudflat, to inner estuary, then to seaward channels and sandy beaches is in agreement with a move from the input of land-derived organic carbon by river transportation from the C3-dominated systems to inflow of marine- derived organic matter through longshore drift of sediment [
15]. A low correlation between δ
13C and C/N (
r = 0.04) meant that C/N ratios could not be used to evaluate the source of OM at this location. In order to evaluate the contribution of terrigenous OM to the sediments, isotopic mass balance mixing equations could be applied in future analyses using relevant terrestrial and marine values [
22].
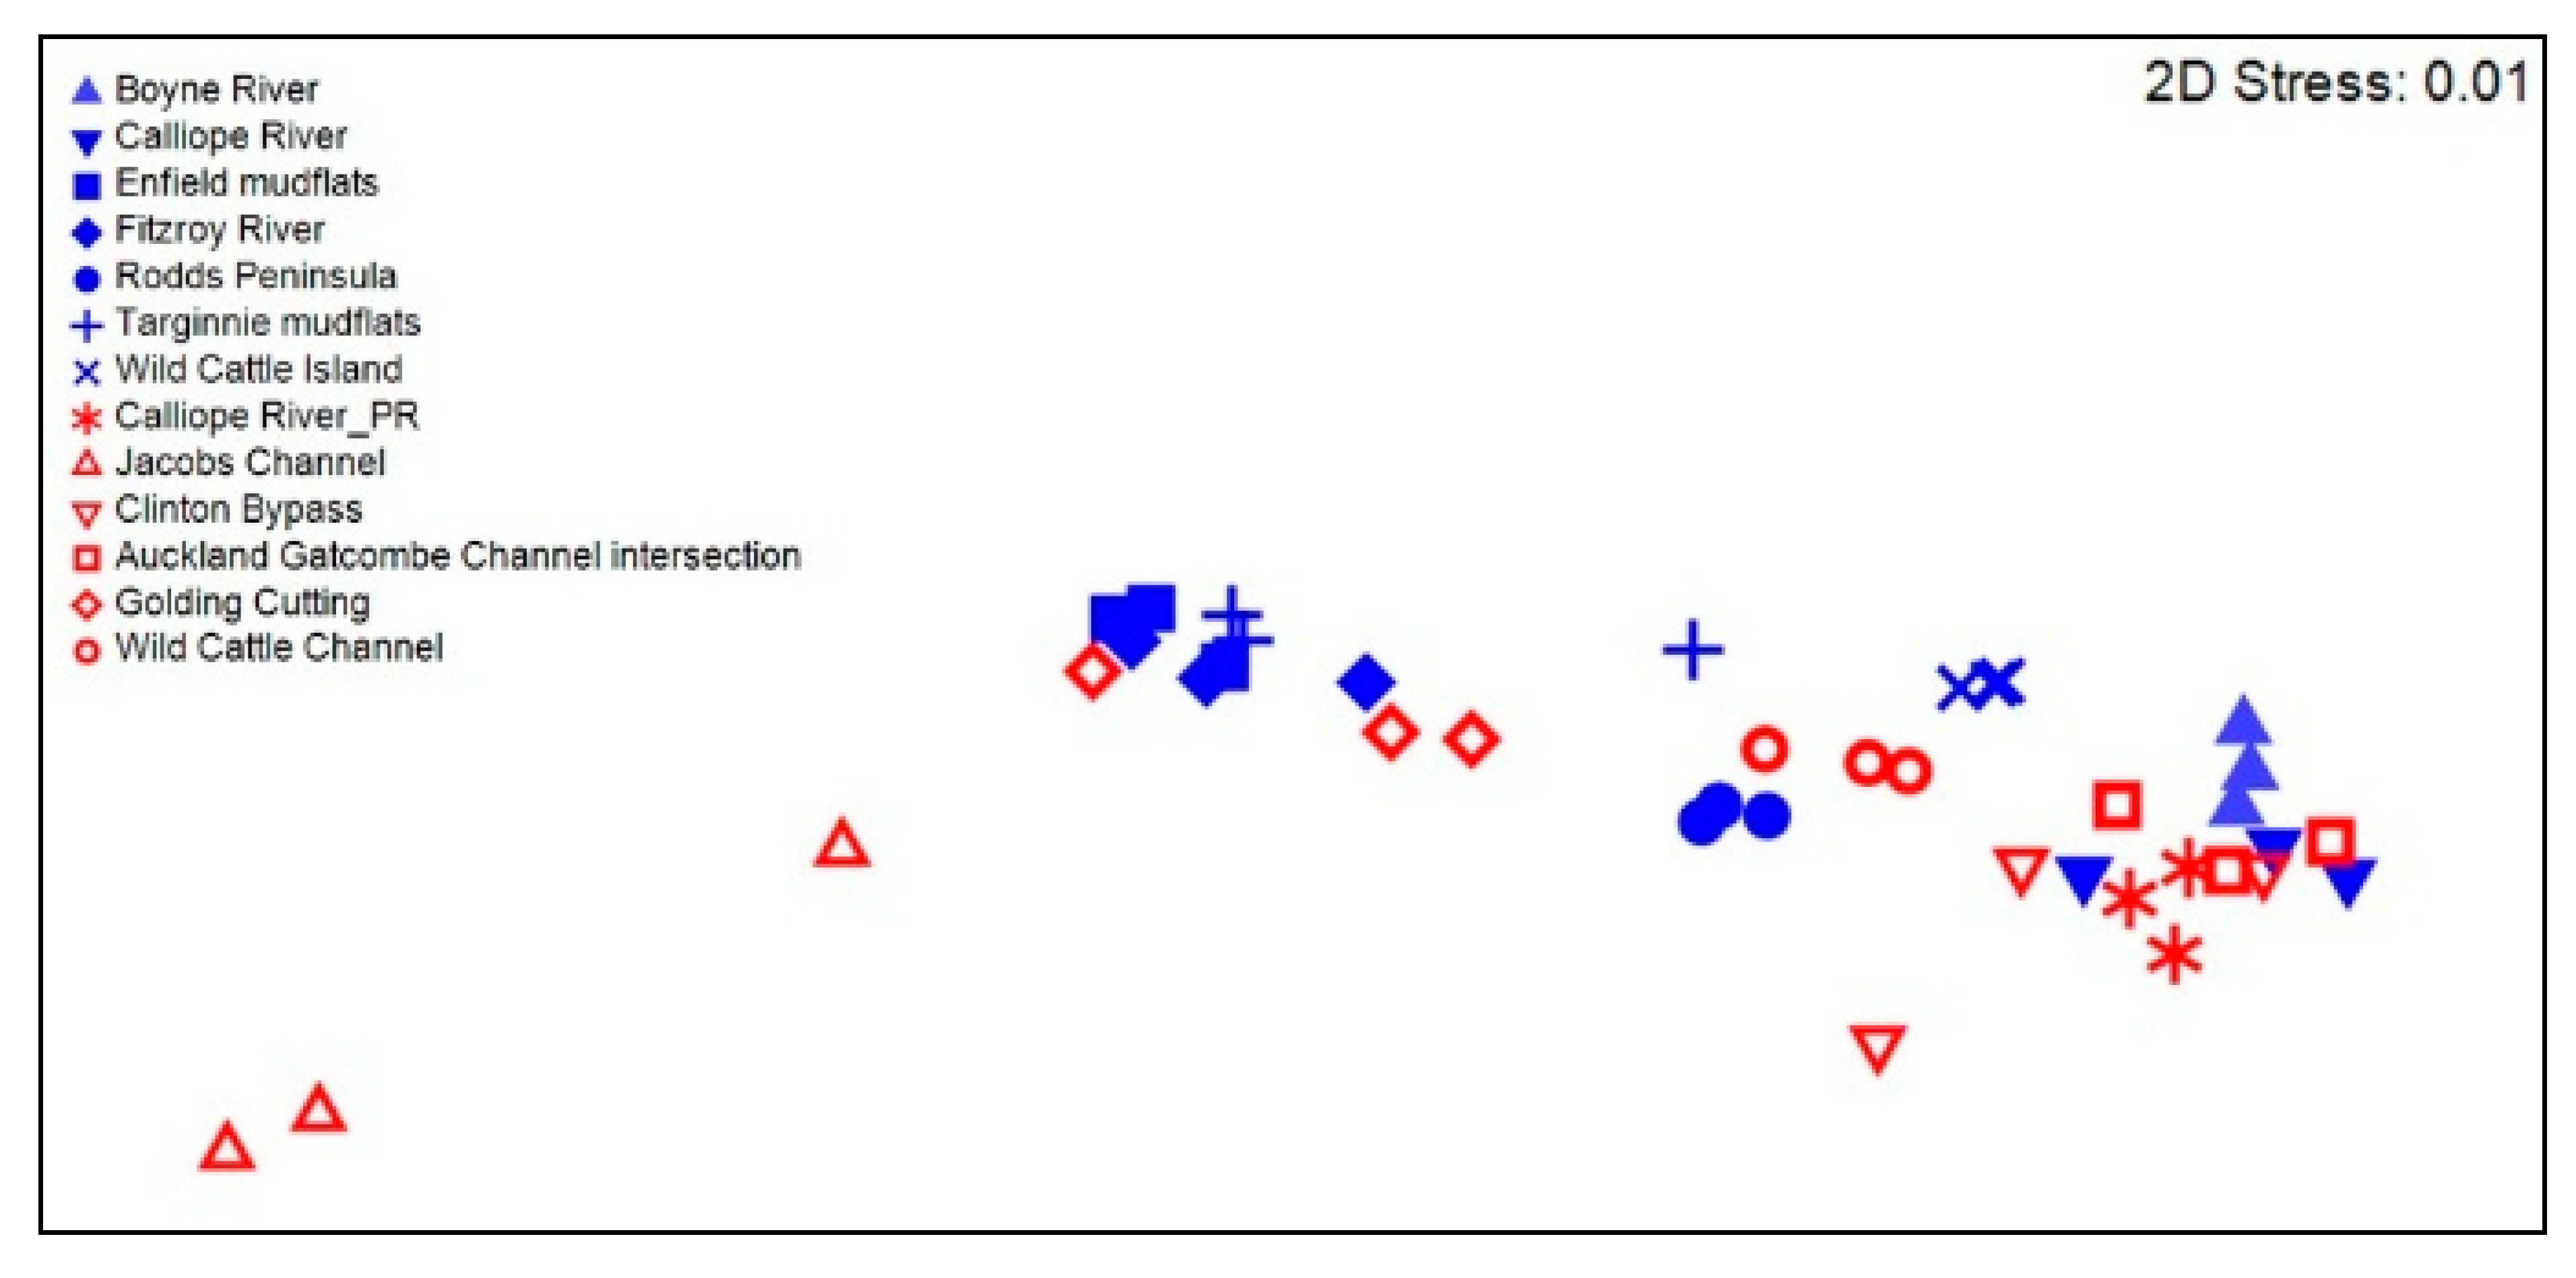
Rare earth elemental composition was similar between river bed samples from the Boyne and Calliope rivers suggesting that these two adjacent catchments may have comparable catchment geology, in the context of what type and quantity of elements are activated into these river systems. Sediments from the Jacobs Channel, a relatively newly created channel where sediment accumulation is high, had the most unique composition of REE and varied the most within site. This difference and the within site variability may reflect anthropogenic activities, where sediments have been exposed/buried, and/or re-worked during channel construction. A consideration of time frames is also important in Jacobs Channel. Jacobs Channel is a recent cut channel with very steep (and in some locations overhanging) sides. Slippage of sediment from different heights up the side of the channel would be indicative of different sedimentation periods and may have impacted on the findings in this study. Finally, the difference may be due to sediment coming from a source not analyzed in this study, for example mud banks in closer proximity to Jacobs Channel. Additional REE sampling from banks adjacent to Jacobs Channel may provide greater insight.
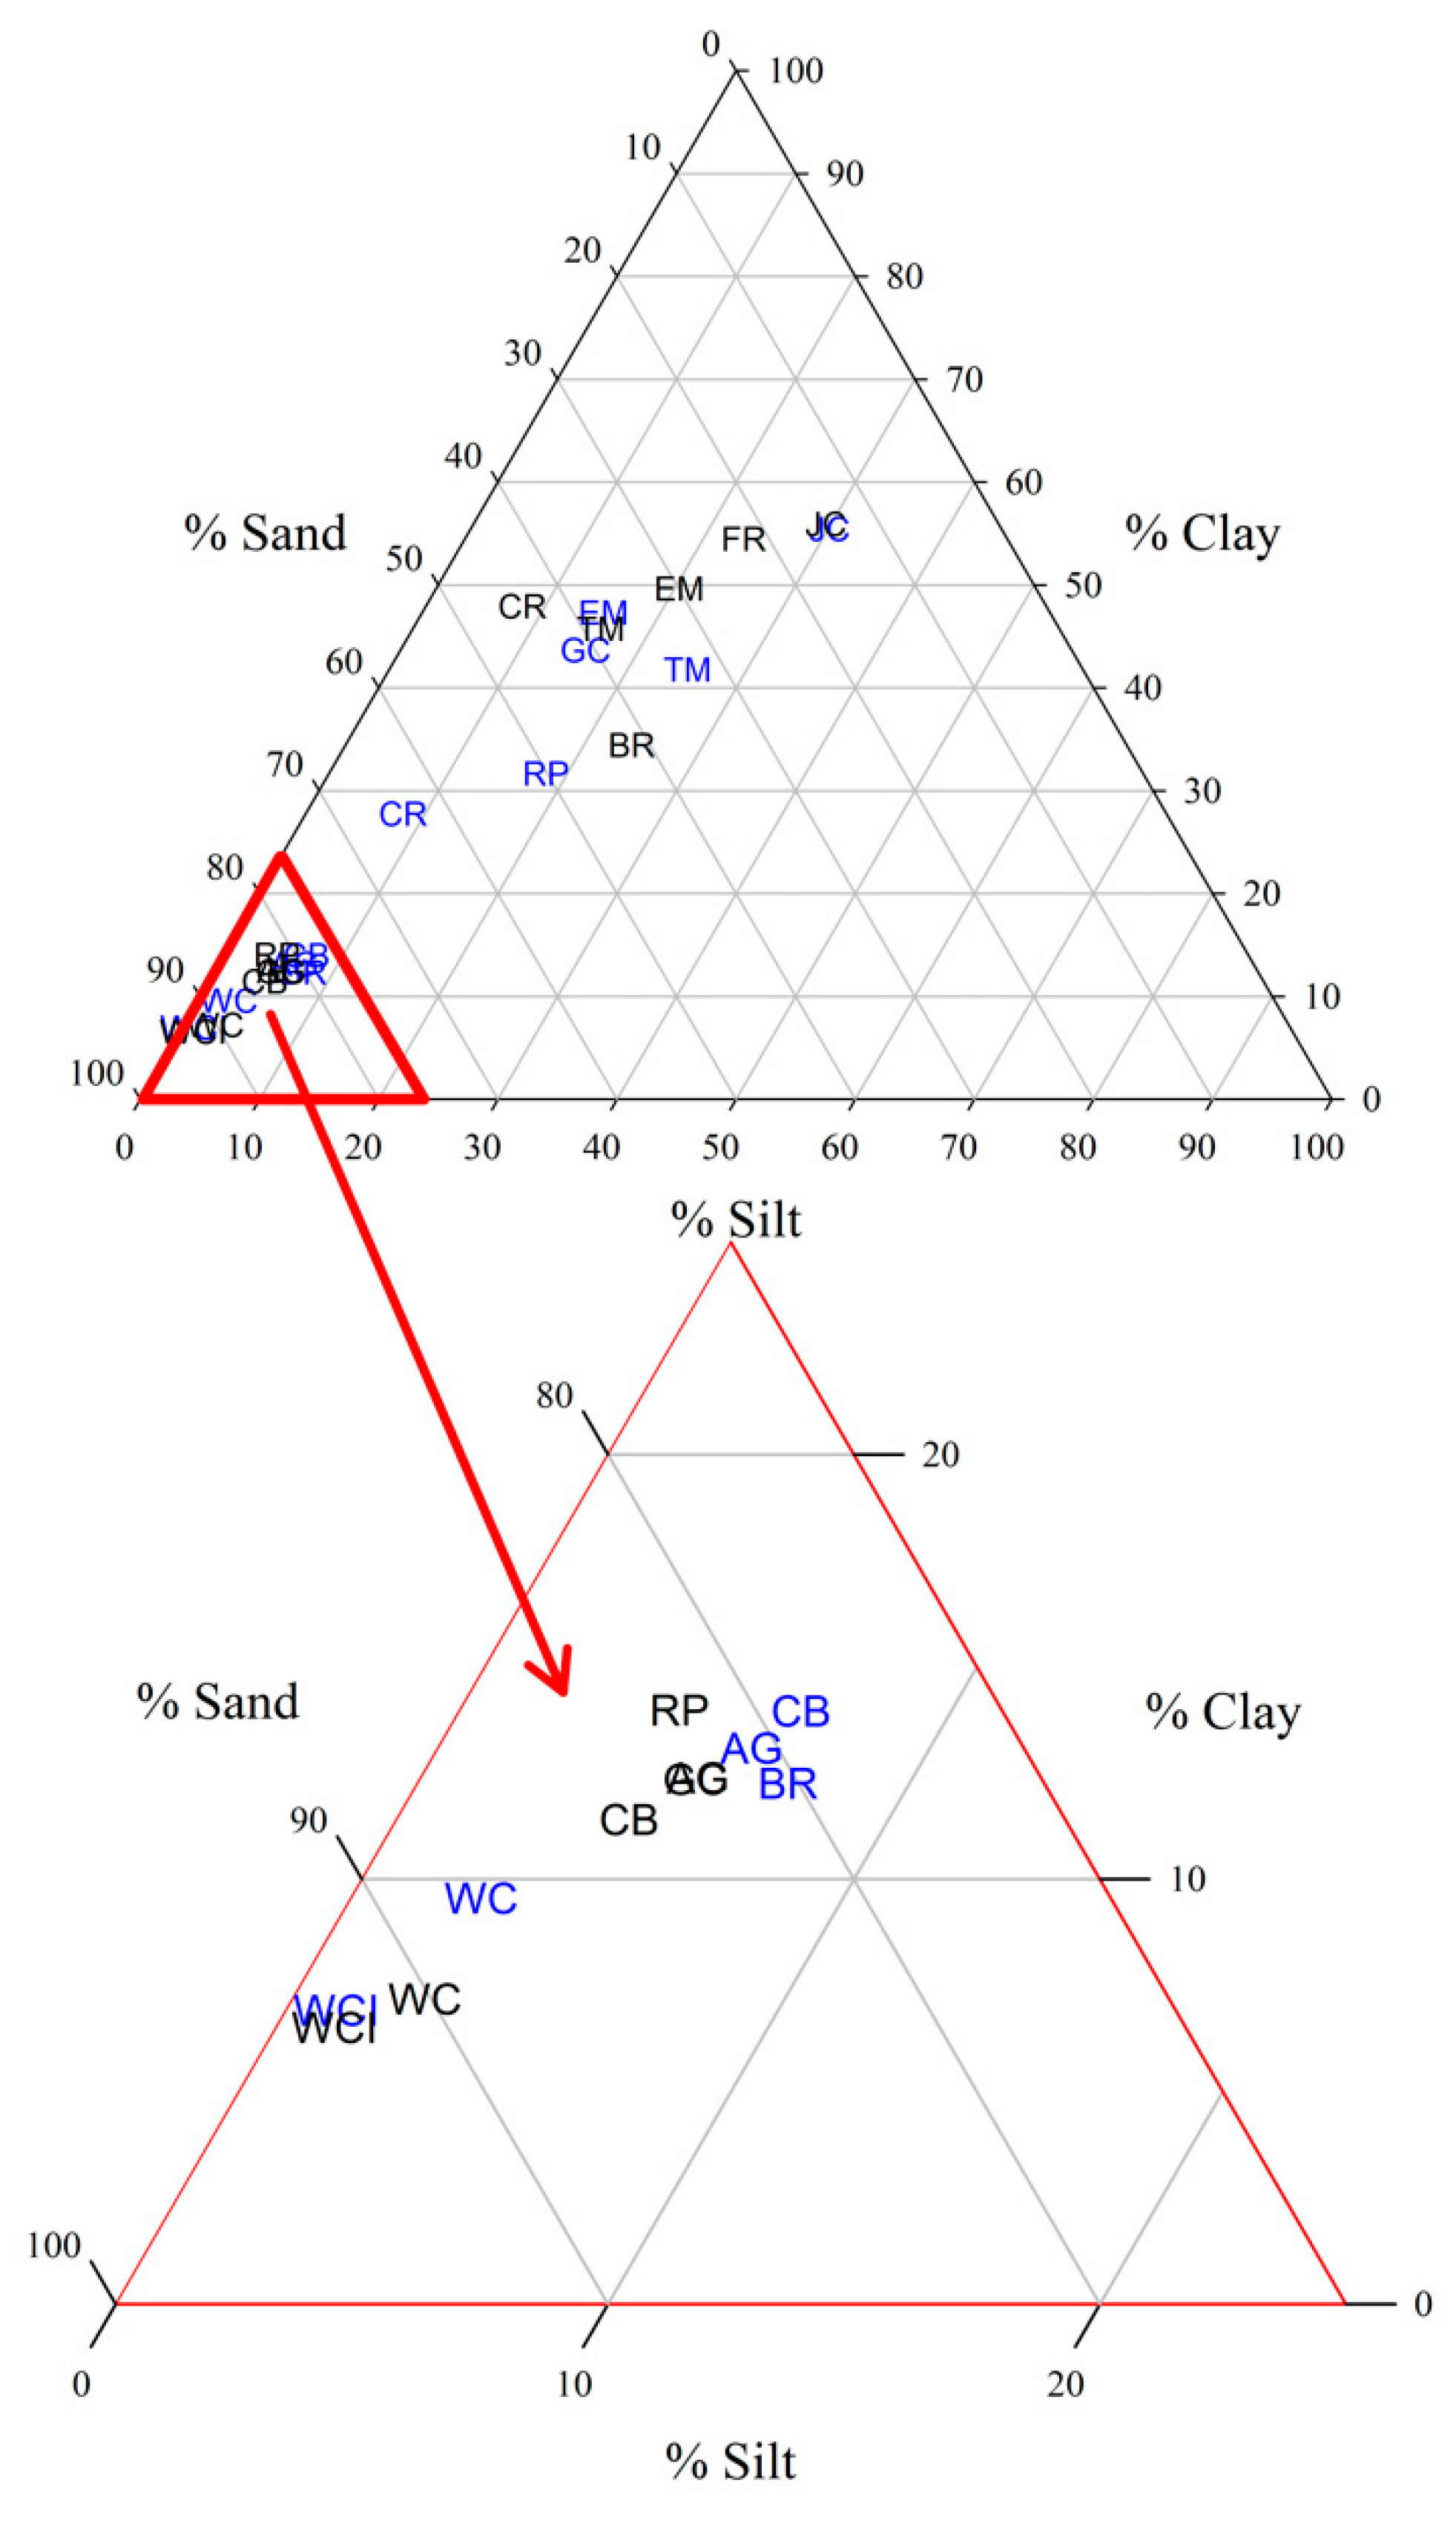
Analysis of sediment particle size showed distinct spatial groupings of sampling sites (
Figure 6). The preservation of this spatial pattern for the majority of sites before vs. after a rainfall event is useful knowledge as it indicates stability of each site’s sediment size characteristics. This understanding can be useful for the long-term monitoring and management of individual sites but may also have use in identifying causes of change in particle size structure (if and when it should occur) and potentially for identifying sources of newly deposited sediments. At one site (Golding Cutting), the sediment size structure changed from being dominated by coarser sizes to finer particles, indicating either new deposition of finer particles at this site between the sampling periods, or the removal of coarse material by dredging leaving finer material behind. However, the
7Be data suggested that the sediment was newly deposited (much higher
7Be in the wet season sampling). Over the wet season there were numerous wave events, which resulted in widespread natural resuspension of sediment in the outer region of the Port [
23]. Therefore, it is likely that the increase in finer particles in the Golding Cutting was predominantly a result of the deposition of recently eroded fine-grained sediment from the surrounding area as opposed to sediment from a fluvial source due to the relative magnitude of the rain event compared to the natural resuspension due to wave action.
Particle size analysis can be a useful supportive tool for the other techniques used herein, potentially indicating whether deposition or erosion has occurred at a site. In the absence of particle tracking data, however, particle size analysis alone cannot be used to reliably indicate sediment provenance.
Without dredging it has been estimated that the Port of Gladstone would have no access even for unladen vessels within 20 years. Identifying where the sediment infilling dredged channels are coming from, provides information that allows Port managers to examine approaches to reducing infilling (for example through promoting catchment management and riparian restoration, and supporting re-vegetation of mudflats). This could potentially save on future dredging costs, but also inform decisions regarding beneficial use or appropriate disposal of the material [
24,
25].
Table 3 summarizes the multiple lines of evidence on the potential sources of deposited sediment sampled within channels and shows the proportions of outcomes met for each hypothesis.
For example, in the outer seaward Wild Cattle Channel the data indicate that the sediment has a marine rather than catchment derivation, with
7Be activities equally low in dry and post wet conditions and less depleted δ
13C. Wild Cattle Channel also had a similar REE composition to sediments from offshore of the Rodds Peninsula, a site chosen as indicative of longshore drift. Such a finding is supported by previous hydrodynamic and sediment movement modeling studies [
4,
5,
25,
26,
27], for a summary see [
28]. For this location disposal of dredged material in a dredge disposal site, which is outside of the estuarine system, or the recharge of sandy beaches on Wild Cattle Island may be an appropriate option for managers.
In comparison in the Golding Cutting the evidence for sediment input suggests multiple sources. For example, evidence for sediment sourced from the catchments is strong, with REE composition reflecting those from the Fitzroy River bed samples and a higher
7Be activities in the samples collected during the wet season. δ
13C levels were also depleted indicating that the organic matter within the sediment was from a terrestrial source, and particle size analysis indicated a change from coarse-to-fine particles during the wet season. It is proposed that sediments in this location may have been existing sediment resuspended by wind and waves and transported by tidal currents from the outer, mid, and inner harbor regions as well as being from sources such as the Calliope or Fitzroy Rivers. The sediment settles in this location due to the high trapping efficiency of the channel as well as the change in direction of the channel here and subsequent reduction in flow velocity. Another potential source may be the plumes from the Boyne River following flood events, which overflow the dam (which did not occur during the sampling period of the study). Modeling of sediment dynamics in the Port of Gladstone indicates that the Calliope may deliver ~50,000 tonnes per year (and the Boyne much less) to the Port and that tides, wind, and waves re-suspend 5,000,000–25,000,000 tonnes per year of sediment within the Port [
29]. Recent analyses also suggest that the relative contribution of sediment transport from the Fitzroy, through The Narrows into the port is inconsequential, even during river flood events [
30]. Similarities with Fitzroy River samples may therefore be artifacts of sediment build up over a long time and not evidence of recent supply. In addition to the riverine sources, the data also indicates that sediment in the Golding Cutting may be from resuspension from nearby mudflats including those sampled at Enfield and Targinnie, with high
7Be activities even during the dry season, and high concurrence in REE composition between sediments from these mud flats and those sampled from the Golding Cutting. However, sediment particle size distribution in the Golding Cutting was similar to samples from Wild Cattle Island, whilst this may suggest that sediments from Wild Cattle Island may move into the Golding Cutting, wind/wave driven movements from a south easterly direction of these coarser sediments, may indicate a common source of material (e.g., longshore drift) to both sites.

 ,
, 


