Article

Study on the Design of an Underwater Chain Trencher via a Genetic Algorithm

1
Manufacturing Innovation School, Inha University, Incheon 22212, Korea
2
Department of Coastal and Ocean Engineering, Korea Institute of Ocean Science & Technology, Busan 49111, Korea
3
Major of Mechanical Engineering, Jeju National University, Jeju 63243, Korea
*
Author to whom correspondence should be addressed.
J. Mar. Sci. Eng. 2019, 7(12), 429; https://doi.org/10.3390/jmse7120429
Submission received: 22 October 2019 / Revised: 19 November 2019 / Accepted: 22 November 2019 / Published: 26 November 2019

Abstract

:
In this study, a genetic algorithm (GA) with an analytic model is adopted to conduct multi-objective optimization for design of an underwater chain trencher. The optimization problem is defined as minimizing a product of the chain power and weight subject to the uniaxial compressive strength, coefficient of traction, bar length (L), nose radius (R) and ratio of the chipping depth over the spacing (l/S), of which the ranges are determined based on the specifications of commercial trenchers satisfying established performance requirements and previous parametric studies. It is found that an optimal design of the GA was obtained with L and l/S close to their low bound and R far from its low bound while that of a simple parametric analysis was acquired with the three parameters close to their low bounds. Moreover, in the most severe soft rock and traction conditions, the power and weight in the optimal design obtained by the GA are turn to be within the feasible ranges of targeted commercial trenchers.

1. Introduction

A trencher is a machine attached to a construction vehicle that digs trenches to lay pipes or electrical cables. Trenchers come in different sizes and types, depending on the required width and depth of the trench and the hardness of the surface to be cut. Wheel and chain trenchers are typical types, and these are typically used in onshore construction projects. Meanwhile, offshore industries such as offshore plants and offshore wind turbine farms have been growing steadily in recent decades, with many underwater trenchers developed and utilized for offshore construction as a result [1].
For design of a chain trencher under specific conditions and to meet certain performance requirements, an effective approach that covers all required important features is mandatory. However, such an approach is lacking. Direct experiments are time-consuming and costly, whereas a strict scientific approach based on first-principles concepts such as theoretical rock mechanics is associated with numerous difficulties, including determining in detail the measured material properties and failure criteria, or selecting the proper fracture theory to use. Regarding these considerations, Mellor published in the 1970s a series of reports covering the mechanics of various cutting and boring machines, such as transverse rotation machines, axial rotation machines, and continuous belt machines, by analytically described the kinematics, dynamics, and energetics of each machine [2,3,4,5]. Mellor’s analytical model of a continuous belt machine is adopted in this study to design a chain trencher.
It is indispensable to adopt an analytical model when designing an underwater chain trencher and considering the kinematics, dynamics, and energetics of the machine. The analytical model in this case contains theoretical equations for the geometry and motion of a continuous chain trencher used in cutting and excavating tasks. The model takes into account the kinematics, dynamics, and energetics of the machine. In previous studies involving a kinematic analysis [1,6,7,8], the relationships between the tool speed, traverse speed, chipping depth, cutting tool spacing, and bar angle were introduced. A dynamic analysis deals with the forces acting on the machine and its cutting tools, whereas an energetic analysis deals with the specific energy, all related types of power required for the cutting task, and the mechanical losses due to drag and friction. It also considers the properties of the material being cut and the performance index of the machine. In several studies [1,7,8], parametric and sensitivity analyses were conducted based on analytic models for the design of the machine. However, in order to determine the best combination of parameters to thus provide the best performance, techniques by which to optimize the design parameters are required. Existing methods such as the trial-and-error approach are time and costly, and they may or may not provide such optimized values.
For this reason, this study focuses on a formulation of design optimization of a trenching machine operated under the sea of which machines require designs with weight and power minimized. Although there are many trenchers manufactured by different companies around the world, information about a design process which can be used to develop such machines is very limited owing to the proprietary rights held by the companies who make them. In this industrial sector, companies have gained a wealth of experience by designing and producing such machines during the gradual development and evolution of their successive generations.
Multi-objective optimization has been applied in engineering fields where optimal decisions must be made in the presence of two or more objectives, such as the power, which is the product of torque and velocity, and weight of a rotary machine. Multi-objective design optimization has been implemented in many engineering applications, such as airfoil shape optimization [9], engine design [10] and optimal controller design [11].
Genetic algorithms (GA) have been widely used over the last two decades to address this type of multi-criteria decision problem. The GA is non-deterministic stochastic search method that utilizes the theories of evolution and natural selection to solve a problem within a complex solution space [12]. A GA can be used to solve multi-objective optimization problems in which the objective functions and constraints are defined in terms of the decision variables. A GA has been utilized for the optimization of certain defined problems to obtain the values of design parameters from the output. A multi-objective genetic algorithm implements the condition of weak dominance, and this type has been used for constrained minimization problems. A GA when used during the design process of a structure is a simple and very effective means of quickly finding a reasonable solution to the given problem.
Thus, in this paper, a genetic algorithm was adopted from among these multi-objective optimization methods in order to realize an optimal design that minimizes the chain-running power as well as the weight of the trencher. A track-based heavy-duty underwater construction robot with the trencher is targeted to cut a trench with a length of 300 m, a width of 0.6 m and a depth of 2.5m within one hour on the seabed with a uniaxial compressive strength of around 20 MPa, which is the maximum value for a soft rock condition. The target specifications of the construction vehicle are listed in Table 1.

2. Materials and Methods

2.1. Analytic Model

A general diagram of the geometry and forces of a continuous chain trenching machine is shown in Figure 1. The trencher is carried by a tracked vehicle which moves at a transverse speed of U is mounted on a pivot point located at a height of h from the ground. The cutting tools on a flat plate welded to the chains move at the speed of ut around a bar which is tilted at a certain angle to cut a trench with a depth of d. The cutting configuration also excavates the cutting materials towards the ground surface. Based on this diagram, an analytical model was developed and explained in earlier work [1,6,7].

2.1.1. Chipping and Cutting Depth

Because each cutting tool moves tangentially at a chain speed of ut and considering a spacing between the tool cutters of S, the time interval ∆t between successive tool operations is then ∆t= S/ut. If the machine moves forward at a speed of U, the horizontal penetration of the cutter is ∆x = US/ut. By definition, the chipping depth is the cutter penetration normal to the face of the bar. Accordingly:
l = U u t S sin
where is the bar angle. The cutting depth can be determined based on Equation (2) and the operating bar angle at a certain cutting depth is determined by Equation (3):
d = ( L + R sin ) sin h
and:
= sin 1 ( L + L 2 + 4 R ( d + h ) 2 R )
where R is radius of the nose and L is the length of the cutter bar. There are several other kinematic parameters which are also important to consider, but are not covered in this paper, such as the conveyance criteria, inclination of the tool trajectory, the effective rake and relief angle, and the critical traverse tool spacing.

2.1.2. Forces and Moments

Cutting Force

The normal and tangential force of the chain ( F n , F t ) are equal to the sums of the normal and tangential forces ( f n , f t ) of the cutting tools attached to the cutting area, respectively. The coefficient of the shape tool cutter is determined using the equation K = f n / f t [1]. Here, 1/K is considered to be the sharpness factor because a larger f t , specifically a larger 1/K, is expected due to the greater sharpness with the same normal force. The normal force Fn creates frictional resistance μFn, where μ is the effective friction coefficient for sliding or rolling of the chain against the supporting bar. The total cutting force, F c , is the sum of the friction resistance μFn induced by the normal cutting force Fn and the direct tangential cutting force Ft:
F c = μ F n + F t + F r
Here, the friction resistance of the guides and rollers as well as the frictional resistance by rubbing the rough work face are denoted by F r .
Moreover, owing to the underwater operation, a variable to represent the additional hydrodynamic resistance against the water, Fw, is included in the total force:
F c = μ F n + F t + F r + F w
By assuming each tool as an independent bluff body exposed to an undisturbed flow, the hydrodynamic resistance can be calculated as:
F w = 0.5 C r A w ρ u t 2
where ρ is the density of sea water, Cr is the resistance coefficient and Aw is the area of the immersed surface.

Thrust and Normal Force

In order to traverse the machine during trenching, the force H parallel to and V normal to the traverse direction are required. In terms of the normal and tangential cutting force, the horizontal and normal force can be determined by:
H = F n sin + F t cos V = F n cos F t sin
and then:
H = F t ( K sin + cos ) V = F t ( K cos sin )
with K = f n / f t .

Cutting Moment

The cutting moment Mc to the horizontal tractive force and normal force acting at the center of the work surface of the chain can be determined by the following equation:
MC = HLCsinVLx
where L c = ( h + 0.5 d ) sin and L x = ( h + 0.5 d ) cot R sin .
The cutting moment expression can be expanded by inserting Equation (8), Lc and Lx into Equation (9), as follows:
M c = K F t R sin [ ( h + 0.5 d ) R cos + sin K ]

Gravity and Bouyancy

Both the gravity and buoyancy of the vehicle in the following equations should be considered during an underwater construction project:
W = m g   and
B u = ρ g V o
where m is the mass, g is the acceleration of gravity, and Vo is the volume of the tracked vehicle.

2.1.3. Measures of Performance

Chain Power

The total chain power at the sprocket PBT is described by Equation (13). The power supplied to the chain by the driving sprocket is distributed to overcome the mechanical resistance and hydrodynamic resistance. It also cuts the work material and transports or conveys the chips from the working surface:
P B T = ( μ F n + F t + F r + F w ) u t
The power due to hydrodynamic resistance can be determined by:
P w = 0.5 C r A w ρ u t 3
For water flow in very rough channels, Cr would not be likely to exceed 5 × 10⁻². By extracting the total power loss due to mechanical and hydrodynamic resistance, the net chain power, P B , which is purely used to cut the work material, can be determined by:
P B = P B T ( P r + P w )
that is:
P B = ( μ K + 1 ) F t u t
Generally, ( P r + P w ) is negligible as compared to P B for slow moving heavy-duty machines. Hence, P B P B T ; ( μ K + 1 ) F t F c .

Specific Energy

The specific energy, which is one of the performance measures, is defined as the power consumption divided by the volumetric cutting rate in terms of measurable entities, i.e., the total chain power PBT plus the thrust power PH:
E s = P B T + P H ν . = F c u t + U H U B d
where the volumetric cutting rate is:
ν . = U B d
and B is the bar width.
Thus, the total chain power can be rearranged as:
P B T = E s v ˙ P H = U ( E s B d H )
where P H is negligible as compared to P B T because U is generally much smaller than u t while H in Equation (7) and F c in Equation (5) are similar in terms of the order of magnitude. Thus, the specific energy can be determined as follows:
E s P B T ν ˙ = P B T U B d = u t U F c B d

Performance Index

The performance index provides a measure of the efficiency of the cutting process and is defined as:
Γ = E s σ c
As shown in Figure 2, the performance index of a typical trenching machine D is in the range of 0.1–0.25, in which a lower performance index indicates better efficiency of the trenching machine.

2.1.4. Traction Condition

A coefficient of traction, Cd, is defined as the drawbar pull divided by the weight of the vehicle; that is, Cd = Dp/W. On firm ground surfaces, Cd for a tracked vehicle is typically in the range 0.3–0.8 [1]. The effective weight of the vehicle during underwater trenching work becomes the weight with the vertical force and buoyancy, Bu, subtracted from it. The net traction (drawbar pull) of the carrier vehicle should then be at least equal to the horizontal force component H [1,8]:
D p = C d ( W B u V ) H
with:
W B u H C d + V
According to Equation (23), a smaller H is feasible with a vehicle for pulling a load during trenching work with a larger Cd. By combining Equation (8) with Equation (23), the weight expression becomes:
W F t [ ( K C d 1 ) sin + ( 1 C d + K ) cos ]
Here, W′ is the weight after the buoyancy is subtracted; this value is used as the actual weight in underwater operation when determining the traction condition.

2.2. Definition of Optimization Problem

2.2.1. Design Parameters

The basic operational parameter is the bar angle, which determines the cutting depth of the trencher. There are at least three parameters related to force that are important to take into consideration in the design of a trenching machine. These are the tractive horizontal force, the normal reaction force, and the cutting moment. The results of an examination of variations of the operational bar angle and the effects on these three parameters were reported in previous studies [1,7,8]. Based on these effects, the range of the bar angle will be determined.
Next, the design and operating parameters for the design of a trencher are listed in Table 2. Certain information about the machine, such as its weight, power, nose radius and chain speed, is sourced from an existing onshore trencher with a range similar to that used in the operating condition here. Among onshore commercial trencher machines, the Vermeer T655 and T855 operate within the targeted width, depth and compressive strength. Accordingly, these machines are selected. Between them, T855 is used for heavier work. The height of the pivot point is determined considering the track specification adopted in the vehicle and the space for thrusters and sensors, for instance.
From Equation (20) the total chain power can now be expressed by multiplying the specific energy by the volumetric cutting rate, as follows:
P B T E s v ˙
Equations (18) and (21) are inserted into Equation (25), after which:
P B T Γ σ c U B d
The underwater weight of the carriage vehicle can now be expanded by inserting Equation (16) and Equation (26) into Equation (24) as follows:
W U u t Γ σ c B d ( μ K + 1 ) [ ( K C d 1 ) sin + ( 1 C d + K ) cos ]
Because the power allocated to cut the trench is limited based on the available power source, this study focuses on analyzing variations in this power as affected by other design parameters. The angular speed of the driving sprocket by means of the tool speed (ut) is directly proportional to the cutting power and hence is of interest in this study as well. The speed becomes a function of U, l/S and from Equation (1).
As mentioned earlier, the total chain power equals the net power in Equation (16) according to:
P B T Γ σ c U B d = ( μ K + 1 ) F t u t

2.2.2. Objective Function and Constraints

The objectives of the design are to have the trencher utilizing minimum power consumption and at the minimum weight in water as well. The chain power is a function of the tool force (Ft) and the chain speed (ut), as shown in Equation (29):
min P B · W = min ( μ K + 1 ) F t u t · W
Minimizing the chain power can be done by minimizing both the chain speed and the tool force. The product of the chain speed and the tool force is a function of U and σc; specifically, smaller values of U and σc make the product smaller when Γ, B, and d are fixed based on Equation (26). Therefore, W′ is used to compose the objectives, and the product of ut and W′ becomes the new objective; this is denoted here as objective 1 instead of the product of the chain speed and the tool force. Subsequently, Ft becomes another objective, which is denoted here as objective 2. Thus, the multi-objective optimization problem with these two objectives can be defined as follows:
min P B · W / ( μ K + 1 ) = min   o b j e c t i v e   1 ( u t W ) · o b j e c t i v e   2 ( F t )
with:
o b j e c t i v e   1 = Γ σ c B d U ( μ K + 1 ) [ ( K C d 1 ) sin + ( 1 C d + K ) cos ]
o b j e c t i v e   2 = Γ σ c B d ( μ K + 1 ) ( l S sin )
Equation (31) is obtained from Equation (27), and Equation (32) is derived by inserting Equation (1) and Equation (16) into Equation (26). Equation (31) and Equation (32) are defined as the fitness functions in the genetic algorithm with the following five constraining parameters: the uniaxial compressive strength ( σ c ), coefficient of traction (Cd), bar length (L) and nose radius (R) depending on the range of bar angle, and the ratio of the chipping depth over the space (l/S). These constraints are regarded as optimization parameters, and the GA program is run to optimize both functions by finding the minimum values within the pre-defined constraints.

2.2.3. Adopted Genetic Algorithm and Its Criterion

A genetic algorithm is a method based on a natural selection process inspired by biological evolution. They are used to solve both constrained and unconstrained optimization problems. This type of algorithm modifies a population of individual solutions. Individuals are selected from the current population and are used as ‘parents’ to produce the ‘children’ of the next generation. Selection is done at each step by the algorithm. Over successive generations, the population evolves toward an optimal solution as shown in Figure 3.
The stopping criteria are based on the number of generations, the time limit, the fitness limit, the function tolerance (1E-6), or the constraint tolerance (1E-6) as listed in Table 3. By default, MATLAB uses three different criteria to determine when to stop the solver. The solver stops when any one of the stopping criteria is met.

3. Results and Discussion

3.1. GA Considering the Ranges of Rock and Traction Conditions

During trenching work, the rock and traction conditions can change. Therefore, σc corresponding to the rock condition and Cd corresponding to the traction condition are provided here, with corresponding ranges. The optimization parameters are then subject to a lower and upper bound, defining the maximum and minimum values of the five constraining parameters, as shown in Table 4.
Their ranges are determined by considering the following:
(1)
σc is less than or equal to 20 Mpa in a soft rock condition and the lower bound is given as −10 MPa relative to the upper bound of 20 Mpa.
(2)
Cd for a tracked vehicle adopts the typical range: 0.3–0.8.
(3)
It is reported in the literature [1,8] that H reaches its maximum during operation at a steep bar angle between 40 and 50 degrees. Thus, it is assumed in this study that the lower bound of the angle is 40 and that the upper bound is 50 degrees. The maximum operating bar angle of the Vermeer T855 is 53 degrees; thus, the provided range is assumed to be feasible for use in the field.
(4)
The range of R in Table 2 is used.
(5)
The range of L is determined by Equation (2) with the ranges of the bar angle and R as well as d and h as given in Table 2.
(6)
The range of l/S is determined by Equation (1) with the ranges of the bar angle and ut as well as U as given in Table 2.
The optimization results appear as pairs of the optimal solution in which minimum objective 1 (utW′) corresponding to objective 2 (Ft). After utW′ and Ft are determined, the minimum weight can be calculated by Equation (23) and ut then becomes the value of the objective 1 divided by the minimum weight. The optimization results with the constraints in Table 4, which were converged by function tolerance in Table 3, are given in Table 5.
First, it is found that the optimal σc is close to the lower bound and that the optimal Cd is close to its upper bound. It is apparent that a small σc is preferable to minimize the required power based on Equation (26) and that a large Cd is preferable to minimize the weight based on Equation (24). Thus, the obtained optimal values are predictable and are considered as the most favorable rock and traction conditions in the provided range. Next, the optimal design parameters, L and l/S are close to their low bounds but R is far from its low bound. Finally, through the optimization process, the required power and minimum weight become 125 kW and 5.10 tons, respectively, and both are much lower as compared to the corresponding ranges provided in Table 2. However, it should be noted that this optimization output is obtained under the most favorable rock and traction conditions.

3.2. Most Severe Condition with GA and Parametric Analysis

In order to obtain the required power and the minimum weight for the most severe condition, optimization must be conducted when σc is fixed at the upper bound and Cd is fixed at the lower bound, as shown in Table 4. When σc is fixed, the power is fixed according to Equation (28). In this case, the optimization results, which were also converged with the function tolerance, are listed in Table 6.
It is indicated in Table 6 that the optimal design parameters, L and l/S are close to their low bounds, but R is far from its low bound, similar to the previous case. Subsequently, the required power and minimum weight in the most severe case are 250 kW and 27.3 tons, respectively, and Table 2 indicates that these values are within the ranges of commercial machines. Therefore, the definition of the multi-objective problem in Equation (30) and the GA algorithm can provide a feasible design with the given constraints.
A simple parametric analysis with the design parameter L, R, and l/S of equally spaced values is conducted for comparison of GA results. First, three values are used for the three design parameters and the number is increased to five and nine. Even though the number is increased, the results are same. The results of parametric optimization are listed in Table 7.
It is indicated in Table 7 that the optimal design parameters from the parametric study, L, R and l/S are close to their low bounds because of only considering the minimization of the weight with the power fixed. When comparing with GA results, the difference ratios of the parameters except R are equal or less than 4.2%. However, due to our definition of the multi-objective problem considering the dynamic model from Equations (30)–(32), GA suggests larger R up to 81% as compared to the parametric study.

3.3. Consecutive Design Procedure, Prototyping and Demonstration

In order to obtain a final design, two consecutive procedures are required. The first is a chain-sprocket selection procedure with L and R in Table 6 used as reference values. The second is a cutting tool arrangement procedure in which l/S in Table 6 is used as a reference value. The details of the two procedures are out of the scope of this work and will be shown elsewhere. After the two procedures, the final specifications of the trencher can be determined. The prototype with the attached trencher is fabricated with a hydraulic motor capable of more than 250 kW of power for operation of the trencher and with the minimum underwater weight requirement met. A three-dimensional CAD image and an actual image are shown in Figure 4.
The prototype was successfully demonstrated in an onshore testbed and an offshore testbed at a depth of 100 m. Figure 5 shows the trenches made during the demonstration.
This study focused on establishing a design process of a trencher as the first attempt for the design of an underwater trencher in Korea. Multi-objective optimization using a genetic algorithm served as an important stage to realize the final design of the trencher. Due to a lack of critical information pertaining to the trencher with the targeted specifications, information about onshore commercial trenchers with similar specifications is used to determine the ranges of the design and the operating parameters for the GA run. Therefore, a feasible design can be obtained by the GA, which can then contribute to determining the specifications of the final prototype design.

4. Conclusions

This paper presents how multi-objective optimization by a genetic algorithm with an analytical model can be used to establish the optimal design of an underwater chain trenching machine. Given that launch and recovery procedures are mandatory for underwater operations, minimizing the chain-running power and the weight of the tracked vehicle with the trencher must be done for the proper design of the machine. For this reason, we chose the power, a product of the chain speed and tool force, and the weight as multiple objectives during the optimization process. Operating conditions such as the uniaxial compressive strength, and coefficient of traction as well as design parameters such as bar length (L), nose radius (R) and ratio of the chipping depth over the spacing (l/S) are selected and their ranges are determined based on specifications of commercial trenchers that meet certain performance requirements as well as previous results from a parametric analysis with an analytical model. A genetic algorithm (GA), a type of multi-objective optimization method, is chosen due to the complex solution space associated with these parameters. The definition of the optimization problem is then suggested by changing the combination of the chain speed, tool force, and weight when composing the two objectives.
In the first case, considering the ranges of the rock and traction conditions, the uniaxial compressive strength and coefficient of traction move to the corresponding lower and upper bounds, which can be considered as the most favorable conditions in the provided ranges, to minimize the power and the weight, respectively. It was also found that an optimal design from GA can be obtained with L and l/S close to their low bounds and R far from its low bound, with the power and weight then showing much smaller values as compared to those of commercial machines. In the next case considering the most severe rock and traction conditions, it was noted that an optimal solution arises similarly to the first case and that the two objectives are in the ranges of commercial machines. As compared with a parametric analysis, the GA suggests larger nose radius, which is accounted as considerable difference between the two methods. Therefore, the suggested optimization process using the GA algorithm with an analytic model can provide feasible design specifications close to those of commercial trenchers in soft rock and typical traction conditions.
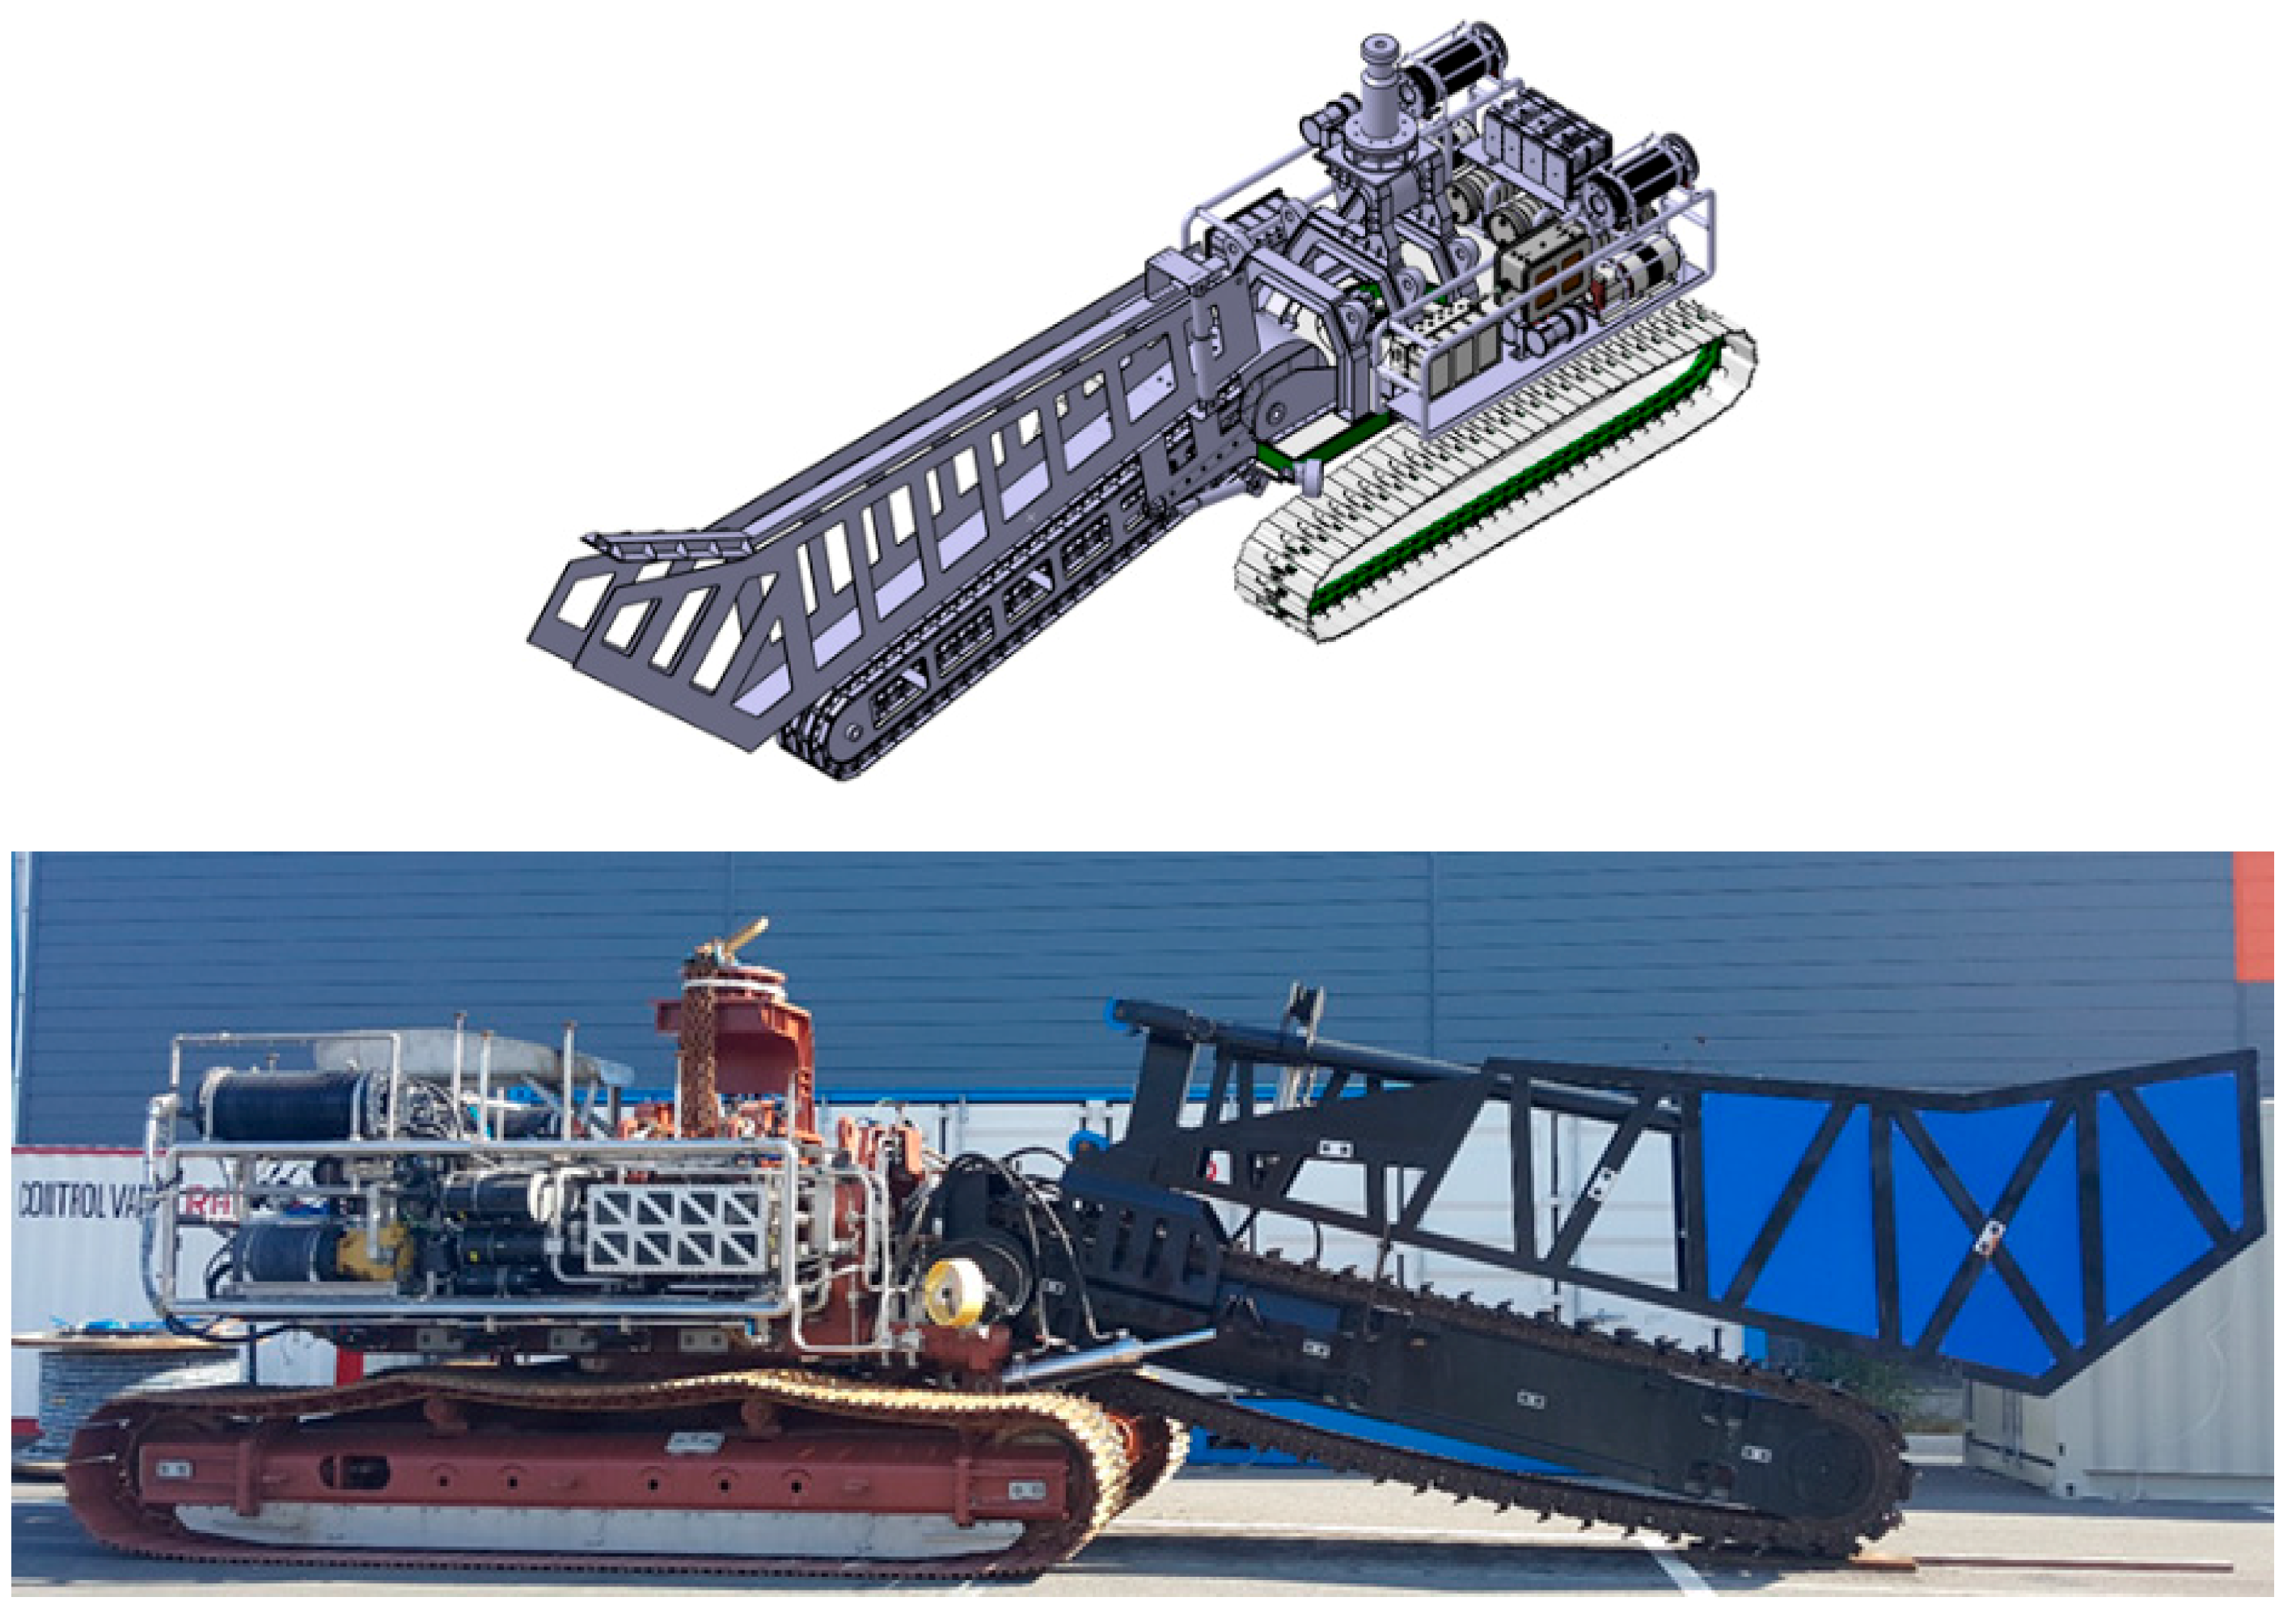
The optimal design by the GA was used to determine the specifications of the final design of a prototype, which was successfully demonstrated at onshore and offshore sites. Future work will focus on an enhancement of the design process by tuning the experimental data after the demonstration of the prototype.

Author Contributions

Methodology, J.K.; data curation, N.L.D.H.; writing—review and editing, J.H.K.; project administration, O.S.K.

Funding

This research was supported by the project entitled ‘Development of Track Based ROV Technology’ funded by the Ministry of Oceans and Fisheries (MOF), Korea (PJT200539), and was supported by “Human Resources Program in Energy Technology” of the Korea Institute of Energy Technology Evaluation and Planning (KETEP), granted financial resource from the Ministry of Trade, Industry & Energy (MOTIE), Republic of Korea. (No. 20184030202200).

Conflicts of Interest

The authors declare no conflict of interest.

References

  1. Vu, M.T.; Cho, H.S.; Kim, J.-Y.; Tran, N.-H. A study on an underwater tracked vehicle with a ladder trencher. Ocean Eng. 2016, 127, 90–102. [Google Scholar] [CrossRef]
  2. Mellor, M. Mechanics of Cutting and Boring—Part I Kinematics of Transverse Rotation Machines; CRREL Special Report 226; U.S. Army Cold Regions Research and Engineering Laboratory: Hanover, NH, USA, 1975. [Google Scholar]
  3. Mellor, M. Mechanics of Cutting and Boring—Part III Kinematics of Continuous Belt Machines; CRREL Special Report 76-17; U.S. Army Cold Regions Research and Engineering Laborator: Hanover, NH, USA, 1976. [Google Scholar]
  4. Mellor, M. Mechanics of Cutting and Boring—Part IV Dynamics and Energetics of Transverse Rotation Machines; CRREL Special Report 77-7; U.S. Army Cold Regions Research and Engineering Laboratory: Hanover, NH, USA, 1977. [Google Scholar]
  5. Mellor, M. Mechanics of Cutting and Boring—Part VIII Dynamics and Energetics of Continuous Belt Machines; CRREL Special Report 78-11; U.S. Army Cold Regions Research and Engineering Laboratory: Hanover, NH, USA, 1978. [Google Scholar]
  6. Sitorus, P.E.; Ko, J.H.; Kwon, O.S. Analytical design of chain trenching machine for underwater construction robot at UCRC-KIOST. In Proceedings of the Conference on Marine Robot Technology, Pohang, Korea, 28–29 April 2016. [Google Scholar]
  7. Sitorus, P.E.; Ko, J.H.; Kwon, O.S. Parameter study of chain trenching machines of underwater construction robots via analytic model. In Proceedings of the OCEANS 2016 MTS/IEEE Monterey, Monterey, CA, USA, 19–23 September 2016. [Google Scholar]
  8. Vu, M.T.; Cho, H.S.; Nguyen, N.D.; Kim, S.K. Analytical design of an underwater construction robot on the slope with an up-cutting mode operation of a cutter bar. Appl. Ocean Res. 2019, 86, 289–309. [Google Scholar] [CrossRef]
  9. Nguyen, H.A.; Van, I.Z.; Raghunath, S.; Abramson, D.; Kipouros, T.; Somasekharan, S. Multi-objective optimisation in scientific workflow. Procedia Comput. Sci. 2017, 108, 1443–1452. [Google Scholar] [CrossRef]
  10. Courteille, E.; Mortier, F.; Leotoing, L.; Ragneau, E. Multi-Objective Robust Design Optimization of an Engine Mounting System; SAE International: Warrendale, PA, USA, 2005. [Google Scholar]
  11. Panda, S. Multi-objective evolutionary algorithm for SSSC-based controller design. Electr. Power Syst. Res. 2009, 79, 937–944. [Google Scholar] [CrossRef]
  12. Sumida, B.H.; Houston, A.I.; McNamara, J.M.; Hamilton, W.D. Gentic algorithms and evolution. J. Theor. Biol. 1992, 147, 59–84. [Google Scholar] [CrossRef]
Figure 1. Geometry and force diagram of a chain trenching machine.
Jmse 07 00429 g001
Figure 2. Performance indexes of various types of machines as a function of the specific energy and uniaxial compressive strength (reproduced from [5]).
Jmse 07 00429 g002
Figure 3. Flow chart of a genetic algorithm.
Jmse 07 00429 g003
Figure 4. CAD image and actual image of the fabricated prototype.
Jmse 07 00429 g004
Figure 5. Trenches after onshore and offshore demonstrations.
Jmse 07 00429 g005
Table 1. Target Specifications of the Proposed Track-Based Seabed Heavy-Duty Construction Robot.
SpecificationsValue
Working water depth500 m
Laying depth (max.)2.5 m
Weight in air (max.)40 ton
Laying width (max.)0.6 m
Laying speed (max.)300 m/h
Uniaxial compressive strength (max.)20 MPa
Table 2. Parameters for the study of the design of the targeted trenching machine.
ParametersSym.UnitValue
Traverse speed (300 m/h)Um/s0.0833
Trench widthBm0.6
Trench depthdm2.5
Height of pivot pointhm1.57
Uniaxial compressive strength (max)σcMPa20
Coefficient of tractionCd-0.3–0.8
Nose radiusRm0.254–0.508
PowerPBkW186–261
Total weightWTon25–39
Chain speed u t m/s1.528–4.167
The coefficient of shape tool cutterK-1.0 *
Performance indexΓ-0.1 *
Ranges from the Vermeer T655 and T855 specifications. * Assumption of the best condition in terms of the tool sharpness and performance.
Table 3. Default values of the stopping criteria.
Stopping CriteriaDefault Value
Maximum number of generations200 × number of variables
Time limitInf
Fitness limit-Inf
Function tolerance1E-6
Constraint tolerance1E-6
Table 4. Ranges of rock and traction condition, and design parameters.
Boundsσc (MPa)CdR (m)L (m)l/S
Lower bound100.30.2545.210.0154
Upper bound200.80.5086.000.0350
Table 5. Results of GA optimization.
ParameterUnitValue
σcMPa10
Cd-0.8
Um/h300
utm/s3.91
Lm5.22
Rm0.508
l/S-0.155
FtkN29.0
PBkW125
Wton5.10
Table 6. Results of GA optimization in the most severe condition.
ParameterUnitValue
σcMPa20
Cd-0.3
Um/h300
utm/s3.95
Lm5.22
Rm0.459
l/S-0.0155
FtkN57.5
PBkW250
Wton27.3
Table 7. Results of parametric optimization in the most severe condition.
ParameterUnitValue (Difference Ratio %)
σcMPa20
Cd-0.3
Um/h300 (0)
utm/s4.08 (3.2)
Lm5.21 (0.2)
Rm0.254 (81)
l/S-0.0154 (0)
FtkN55.7 (3.2)
PBkW250 (0)
Wton26.2 (4.2)

