Article

Numerical Simulation of Flow Control around a Circular Cylinder by Installing a Wedge-Shaped Device Upstream

1
State Key Laboratory of Coastal and Offshore Engineering, Dalian University of Technology, Dalian 116024, China
2
National Center for International Research of Subsea Engineering Technology and Equipment, Marine Engineering College, Dalian Maritime University, Dalian 116026, China
3
State Key Laboratory of Structural Analysis for Industrial Equipment, School of Naval Architecture Engineering, Dalian University of Technology, Dalian 116024, China
4
School of Civil and Environmental Engineering, Nanyang Technological University, Singapore 639798, Singapore
*
Author to whom correspondence should be addressed.
J. Mar. Sci. Eng. 2019, 7(12), 422; https://doi.org/10.3390/jmse7120422
Submission received: 20 September 2019 / Revised: 29 October 2019 / Accepted: 5 November 2019 / Published: 20 November 2019
(This article belongs to the Special Issue Offshore and Subsea Structures)

Abstract

:
The effect of a triangular wedge upstream of a circular cylinder has been investigated, and the findings are presented herein. The triangular wedge is equilateral in plan form, and the Reynolds number based on the diameter of the main cylinder is approximately 200. Contours of vorticity clearly show that two entirely different wake patterns exist between the wedge and the main cylinder. There also exists a critical spacing ratio and side length ratio at which the wake flow pattern shifts from one within the cavity mode to one within the wake impingement mode. For a relatively small side length ratio of l w / D = 0.20 and 0.27, where the side length refers to the length of one side of the triangular wedge, the drag and lift coefficients decrease monotonically with the spacing ratio. There is a sudden jump of the drag and lift coefficients at larger side length ratios of l w / D = 0.33 and 0.40. This study shows that at a spacing ratio of L/D = 2.8 (where L is the distance between the vertex of the wedge and the center of the cylinder) and a wedge side length of l w / D = 0.40, the reduction of the amplitude of lift and mean drag coefficient on the main cylinder are 71.9% and 60.1%, respectively.

1. Introduction

Under certain circumstances, a Kármán vortex train is observed in the wake of flow past a bluff body. The lift and drag force acting on the bluff body exhibit periodic and alternating patterns. If the stress level in the bluff body is high, prolonged vibration in the flow field may lead to fatigue. Thus, flow control around a bluff body plays a significant role in mitigating fatigue damage and resonance. A review of the literature on flow control shows that there are active and passive flow control methodologies. An active control method typically controls flow through constant monitoring of the flow field and structure stress, and exerts external intervention as needed to control the vortex shedding from the main cylinder. Examples of active control method include acoustic excitation and jet blowing. Such methods are typically costly, complex, and inefficient. Passive control methods control the flow through deliberate selection of the cross-sectional shape of the structure or attaching add-on devices, thus modifying the flow field, and hence the vortex formation around the main cylinder. Examples of passive control include helical strakes (Korkischko and Meneghini, 2010) [1], control rod (Lu et al., 2014) [2], fairing (Lee and Allen, 2005) [3], roughness surfaces, and others (Zhou et al., 2015) [4,5,6].
In the engineering applications, cylinders are typically bundled into groups in which the main cylinder is surrounded by smaller cylinders (Lu et al., 2014 [2]; Silva-Ortega and Assi, 2017 [7]). These smaller pipes inevitably modify the flow field around the pipe bundle and in between the pipes and the main cylinder. One would realize that a deliberate configuration of smaller cylinders around the main cylinder may lead to passive but positive flow control. Investigation of a control rod in controlling flow has been reported, and the effects of the rod-to-cylinder diameter ratio and pitch distance have been demonstrated in Lesage and Gartshore (1987) [8]. The authors found that the fluctuating lift and drag forces of the main cylinder and control rod are greatly reduced in most flow cases. Sakamoto (1994) [9] reported that the mean drag force is decreased up to 50%, and the fluctuating lift force has been reduced by 85%. Tsutsui and Igarashi (1995, 1996) [10,11] found that for all the control rod diameters used in their tests, the drag decreased as the Reynolds number increased, and maximum drag reduction was observed at d/D = 0.25. Lee et al. (2004) [12] demonstrated that with the change of gap spacing between the smaller and main cylinder, the wake patterns transform from that of the cavity mode to that of the wake impingement mode. Characteristic flow quantities such as pressure and drag force were changed substantially as well.
Works on multiple control rods/cylinders have also been reported. Kuo et al. (2007) [13] investigated two small control cylinders placed at different radial distances from the main cylinder, and found that the flow does not separate from the rear surface of the main cylinder. The vortex shed from the control cylinders merged toward the wake centerline. As a result, the fluctuating lift and the form drag on the main cylinder were reduced significantly and monotonically in accordance with the Reynolds number (from 80 to 300). Lu et al. (2014) [2] identified four different flow regimes in accordance with the mechanisms of lift and drag reduction. The authors further found for the case with six identical smaller control rods that the lift fluctuation on the main cylinder could be suppressed significantly in some cases. Silva-Ortega and Assi (2017) [7] investigated the use of a polar array of two, four, and eight wake-control cylinders and discovered that certain configurations of control cylinders appeared to control the flow around the main cylinder, while others produced a galloping-like response. The best flow control result was observed when the main cylinder was surrounded by eight control rods. The peak amplitude of vibration was attenuated by 99% at the expense of a 10% increase in drag. A polar array of four control cylinders was found to be the most efficient configuration to minimize the mean drag. However, the system developed severe vibrations and a galloping-like response.
As we can see, the transverse drag forces are influenced by the flow separation and vortex trains at the lee of the cylinder. While the control rods serve to modify the flow fields and hence the lift and drag forces, one may postulate that there could be cases when the main cylinder may lie within the shadow of the wake streams generated by the control rod(s). In that case, the distance between the two wake streams would have to be larger than the diameter of the main cylinder, and the control rod(s) may be located at a certain optimum location upstream of the main cylinder. In this paper, the writers propose that one could consider a symmetrical aerofoil-shaped or wedge-shaped control rod upstream of a main cylinder such that the main cylinder could lie completely within the shadow zone of the wake field. Figure 1 illustrates the concept of a wedge-shaped control rod and the main cylinder. The controlling parameters are the width of the wedge and the distance of this wedge with respect to the diameter of the main cylinder, and the parameters of the flow simulation are shown in Table 1. Numerical simulations were carried out to demonstrate the feasibility of such a scheme, and also to establish the optimum size and location of the wedge at which the lift and drag force are at their minimum.
This paper is organized as follows. The computational domain and boundary conditions are presented in Section 2. The methodology employed in this work is described in Section 3, followed by the necessary numerical verifications and validations in Section 4. The numerical results are presented in Section 5. Finally, the findings of the present work are summarized in Section 6.

2. Computational Domain and Boundary Conditions

2.1. Computational Domain

A sketch of the computational domain is shown in Figure 1. The origin of the coordinate system was located at the center of the main cylinder. The incident flow boundary was located 10 D from the center of the cylinder, and the longitudinal length was 50 D, where D is the diameter of the main cylinder. In order to minimize the effect of blockage, the width of the computational domain was set to 20 D, which corresponded to an appropriate blockage ratio of 0.05 in accordance with Zhao et al. (2012) [14] and Navrose and Mittal (2013) [15]. An equilateral triangular wedge (side length l w ) was selected as the “control rod” and was placed upstream of the main cylinder. The vertex-to-center distance between the wedge and the main cylinder is defined as L (see Figure 1).
Hybrid meshes were employed for the discretization of the governing equations and to enhance the convergence of the present numerical simulations. Refined tri-meshes were carried out at selected critical flow zones such as the high-pressure zone in front of the cylinder, the vortex-shedding area in the lee of the cylinder, and the vortex separation point on both sides of the cylinder. Refined structured quadrilateral meshes were also used near the cylinder surfaces.

2.2. Boundary Conditions

At the incident flow boundary of the computational domain, Dirichlet boundary conditions u = U and v = 0 were specified. At the outflow boundary, a Neumann boundary condition u / x = 0 and v / x = 0 were assumed and the Poisson-type pressure equation p = 0 was adopted. The two lateral boundaries were defined as a moving wall; that is, the two lateral boundaries moved at the same speed as the flow, thus avoiding the influence of the boundary layer on the calculation of the flow around the cylinder. On the surface of the wedge and the main cylinder, no slip condition u = 0 and v = 0 were specified.

3. Governing Equations

In the numerical model, the governing equations for the unsteady and incompressible flow are the classical continuity equation and the Navier–Stokes equation:
· u = 0
u / t + ( u · ) u = 1 / ρ p + ν 2 u
where u is the velocity of the incident flow, p is the pressure, ρ is the fluid density, and ν is the kinematic viscosity of the fluid. The numerical model employed a finite volume discretization and a SIMPLE algorithm for the pressure–velocity correction. The SIMPLE algorithm, which is mainly used for solving the incompressible flow field, was proposed by Patankar and Spalding (1972) [16]. The main idea of the SIMPLE algorithm can be described as follows: (a) Solve the discretized momentum equations to obtain the velocity field according to the pressure field; (b) Solve the pressure correction equation established by the continuity equation to obtain the correction of the pressure field; (c) Reconstruction at interfaces to get a new correction of the velocity field with velocity from step (a) and pressure from step (b); (d) If the residuals are small enough, go to the next iteration and update t; otherwise, go to step (a) and update the iteration count. The convection term was approximated by using a central difference scheme of second order. The implicit first-order scheme was used to solve the transient formulation.

4. Validation of the Simulation Model

The number of grid points had a significant impact on the accuracy and speed of computation. When the total number of grid points reaches a certain value, its influence on the computational accuracy becomes rather limited. In order to exclude the effect of grid density on the computational accuracy, several comprehensive sets of grid systems were tested, as is shown in Table 2. Mesh 2 is found to be sufficient to obtain accuracy results for the present simulation.
A test case for a circular cylinder at Re = 200 was carried out to validate the numerical model in this study. Parameters such as the mean drag coefficient C D M ( C D M = t 1 t 2 C D ( t ) dt / Δ t , where Δ t = t 2 t 1 is the time step), the amplitude of lift coefficient C L A ( C L A = C L m a x C L m i n , where C L m a x and C L m i n denote the maximum and minimum value of the lift coefficient, respectively) and the Strouhal number S t ( S t = f s D / U , where f s is the vortex shedding frequency, D is the diameter of the main cylinder, and U is the velocity of the inflow) were compared with published numerical and experimental data. The result obtained and presented in Table 3 shows good agreement between the present test results and the published data.

5. Results and Discussions

5.1. Drag and Lift Coefficients

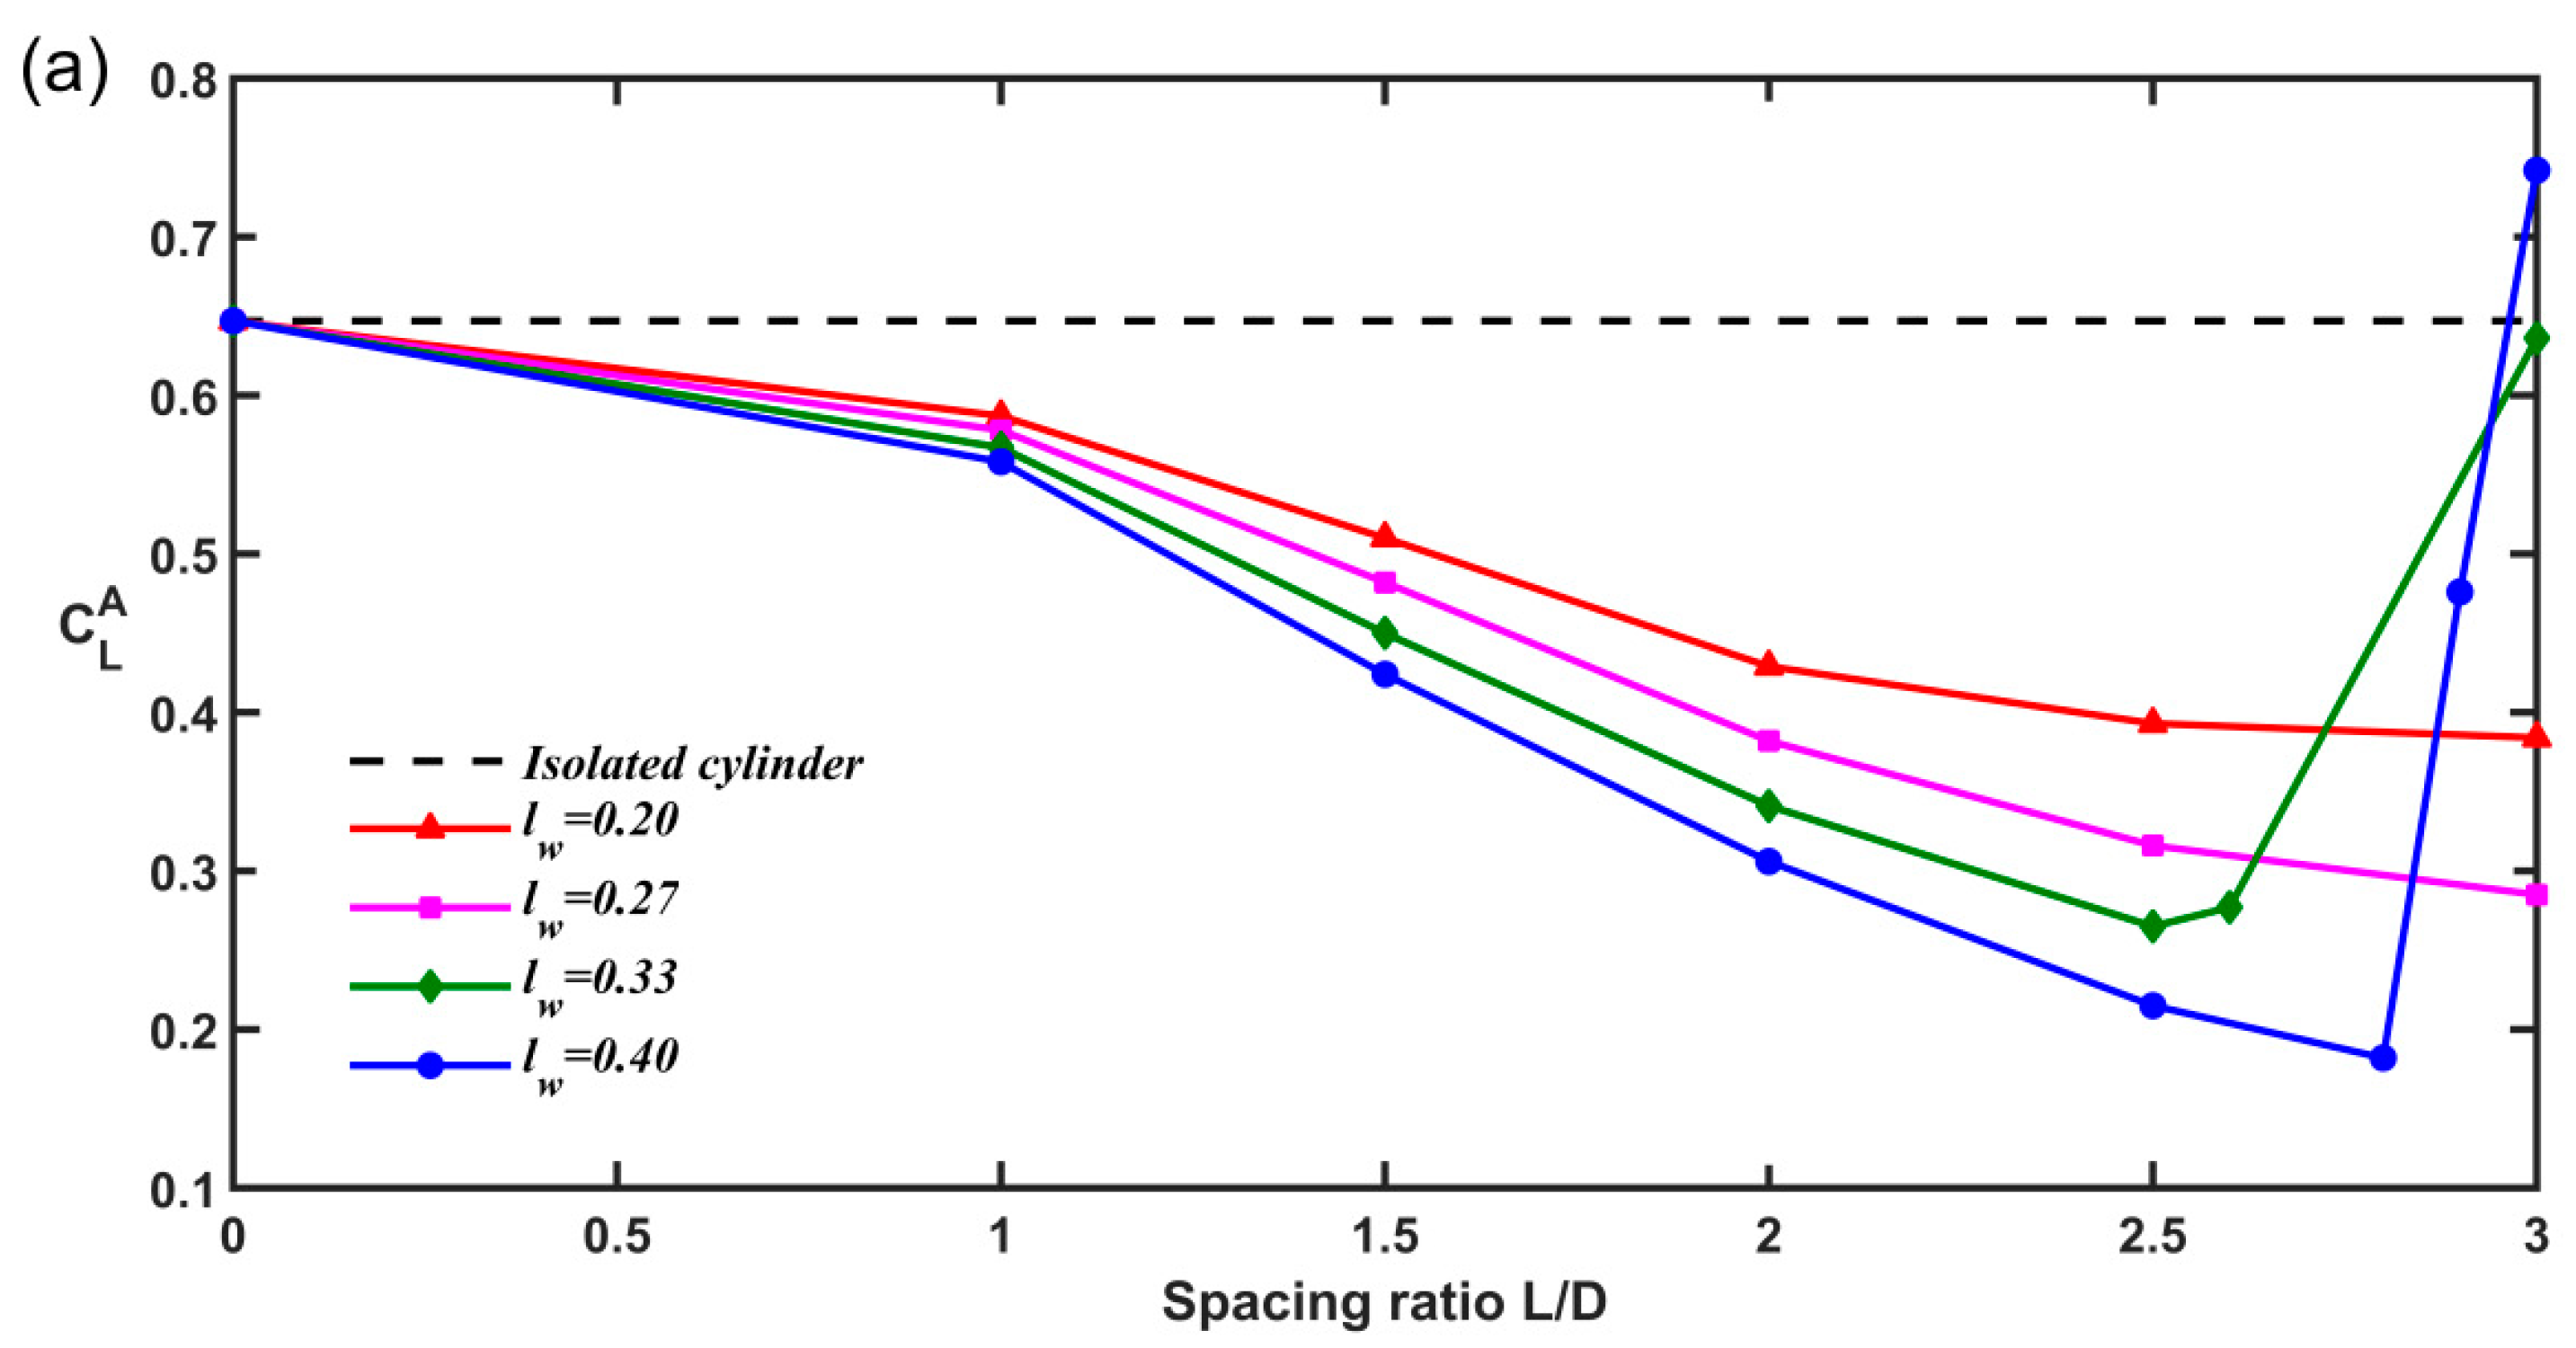
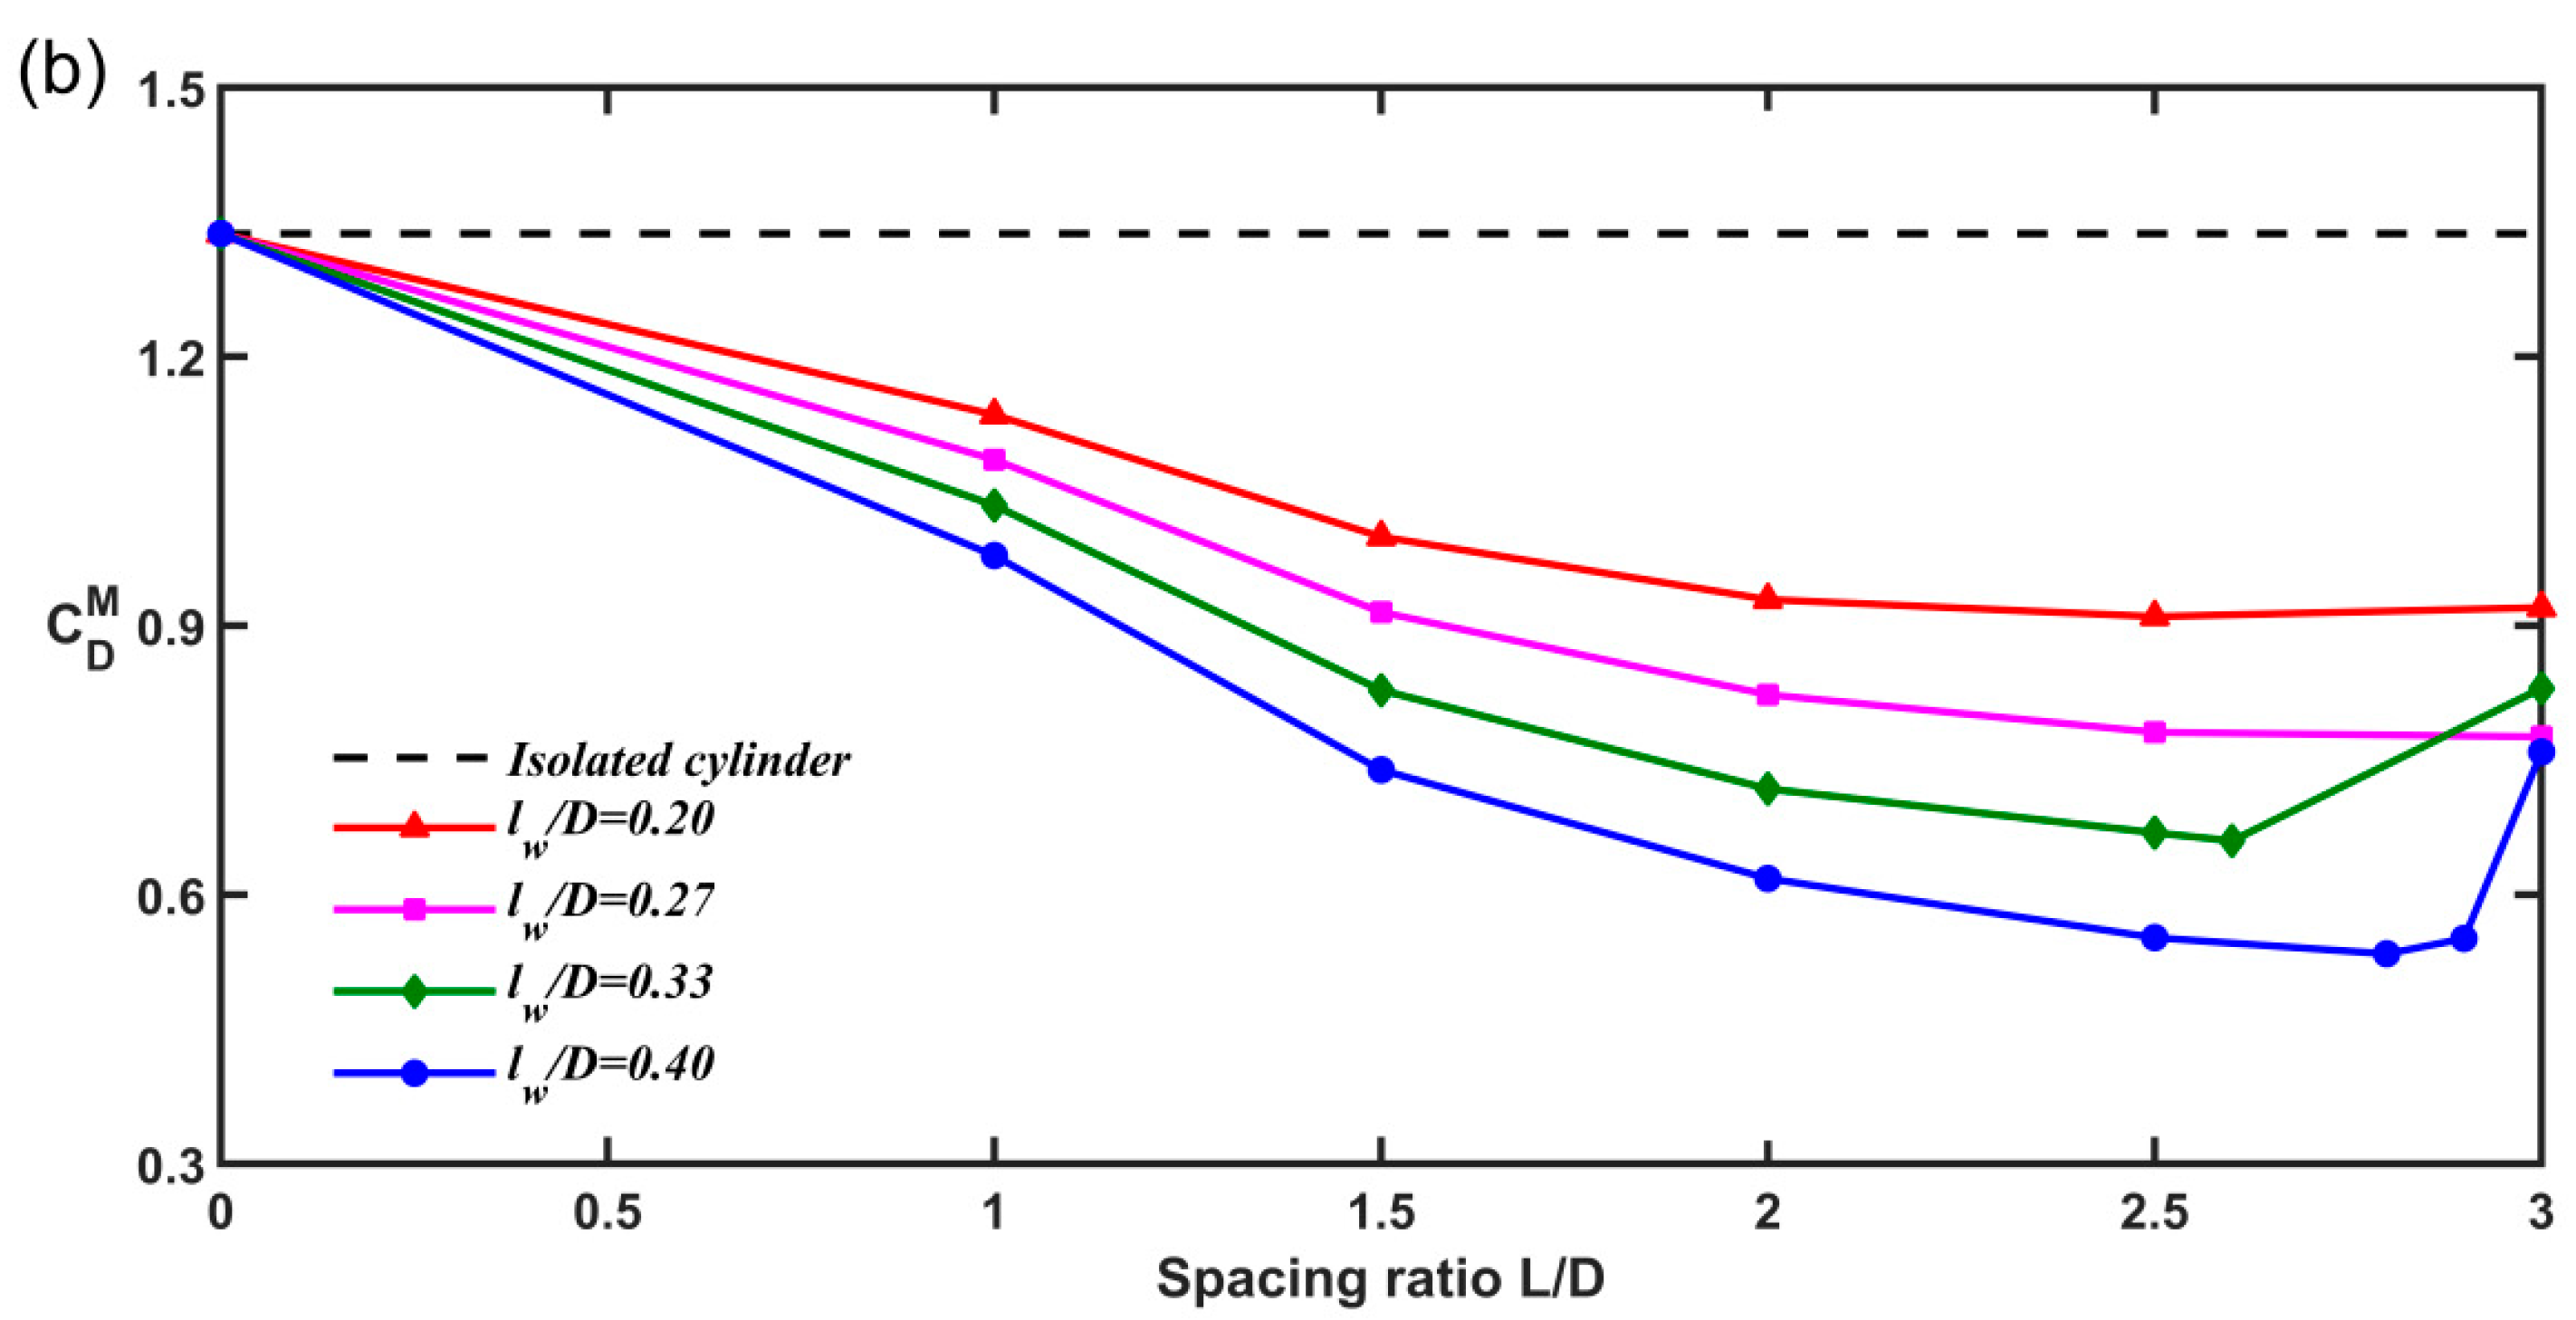
Figure 2 shows the amplitude of the lift and drag coefficient of the main cylinder at various combinations of the spacing ratio L/D and side length l w / D . It can be seen from Figure 2 that the values of C L A and C D M are generally reduced compared to those of a single cylinder. For a relatively small side length l w / D = 0.20 and 0.27, the lift on the main cylinder does not exhibit a change in the trend at the “critical” spacing ratio. The sudden change at a larger side length l w / D = 0.33 and 0.40 corresponded to the observed galloping-like response, and the value of C L A may even exceed that for a single cylinder. One can see the lowest lift coefficient or the largest reduction in lift (by approximately 71.9%) on the main cylinder when l w / D = 0.40 and L/D = 2.8. It is interesting to note in Figure 2b that all the C D M values fall below that for an isolated cylinder. A wedge with a side length of l w / D = 0.40 indicates strong drag reduction with the lowest mean drag for all L/D values ≤2.8. The largest drag reduction reaches 60.1% at l w / D = 0.40 and L/D = 2.8. The overall distribution of the mean drag force coefficient C D M with different spacing ratios is consistent with that of the lift coefficient C L A , as shown in Figure 2a.
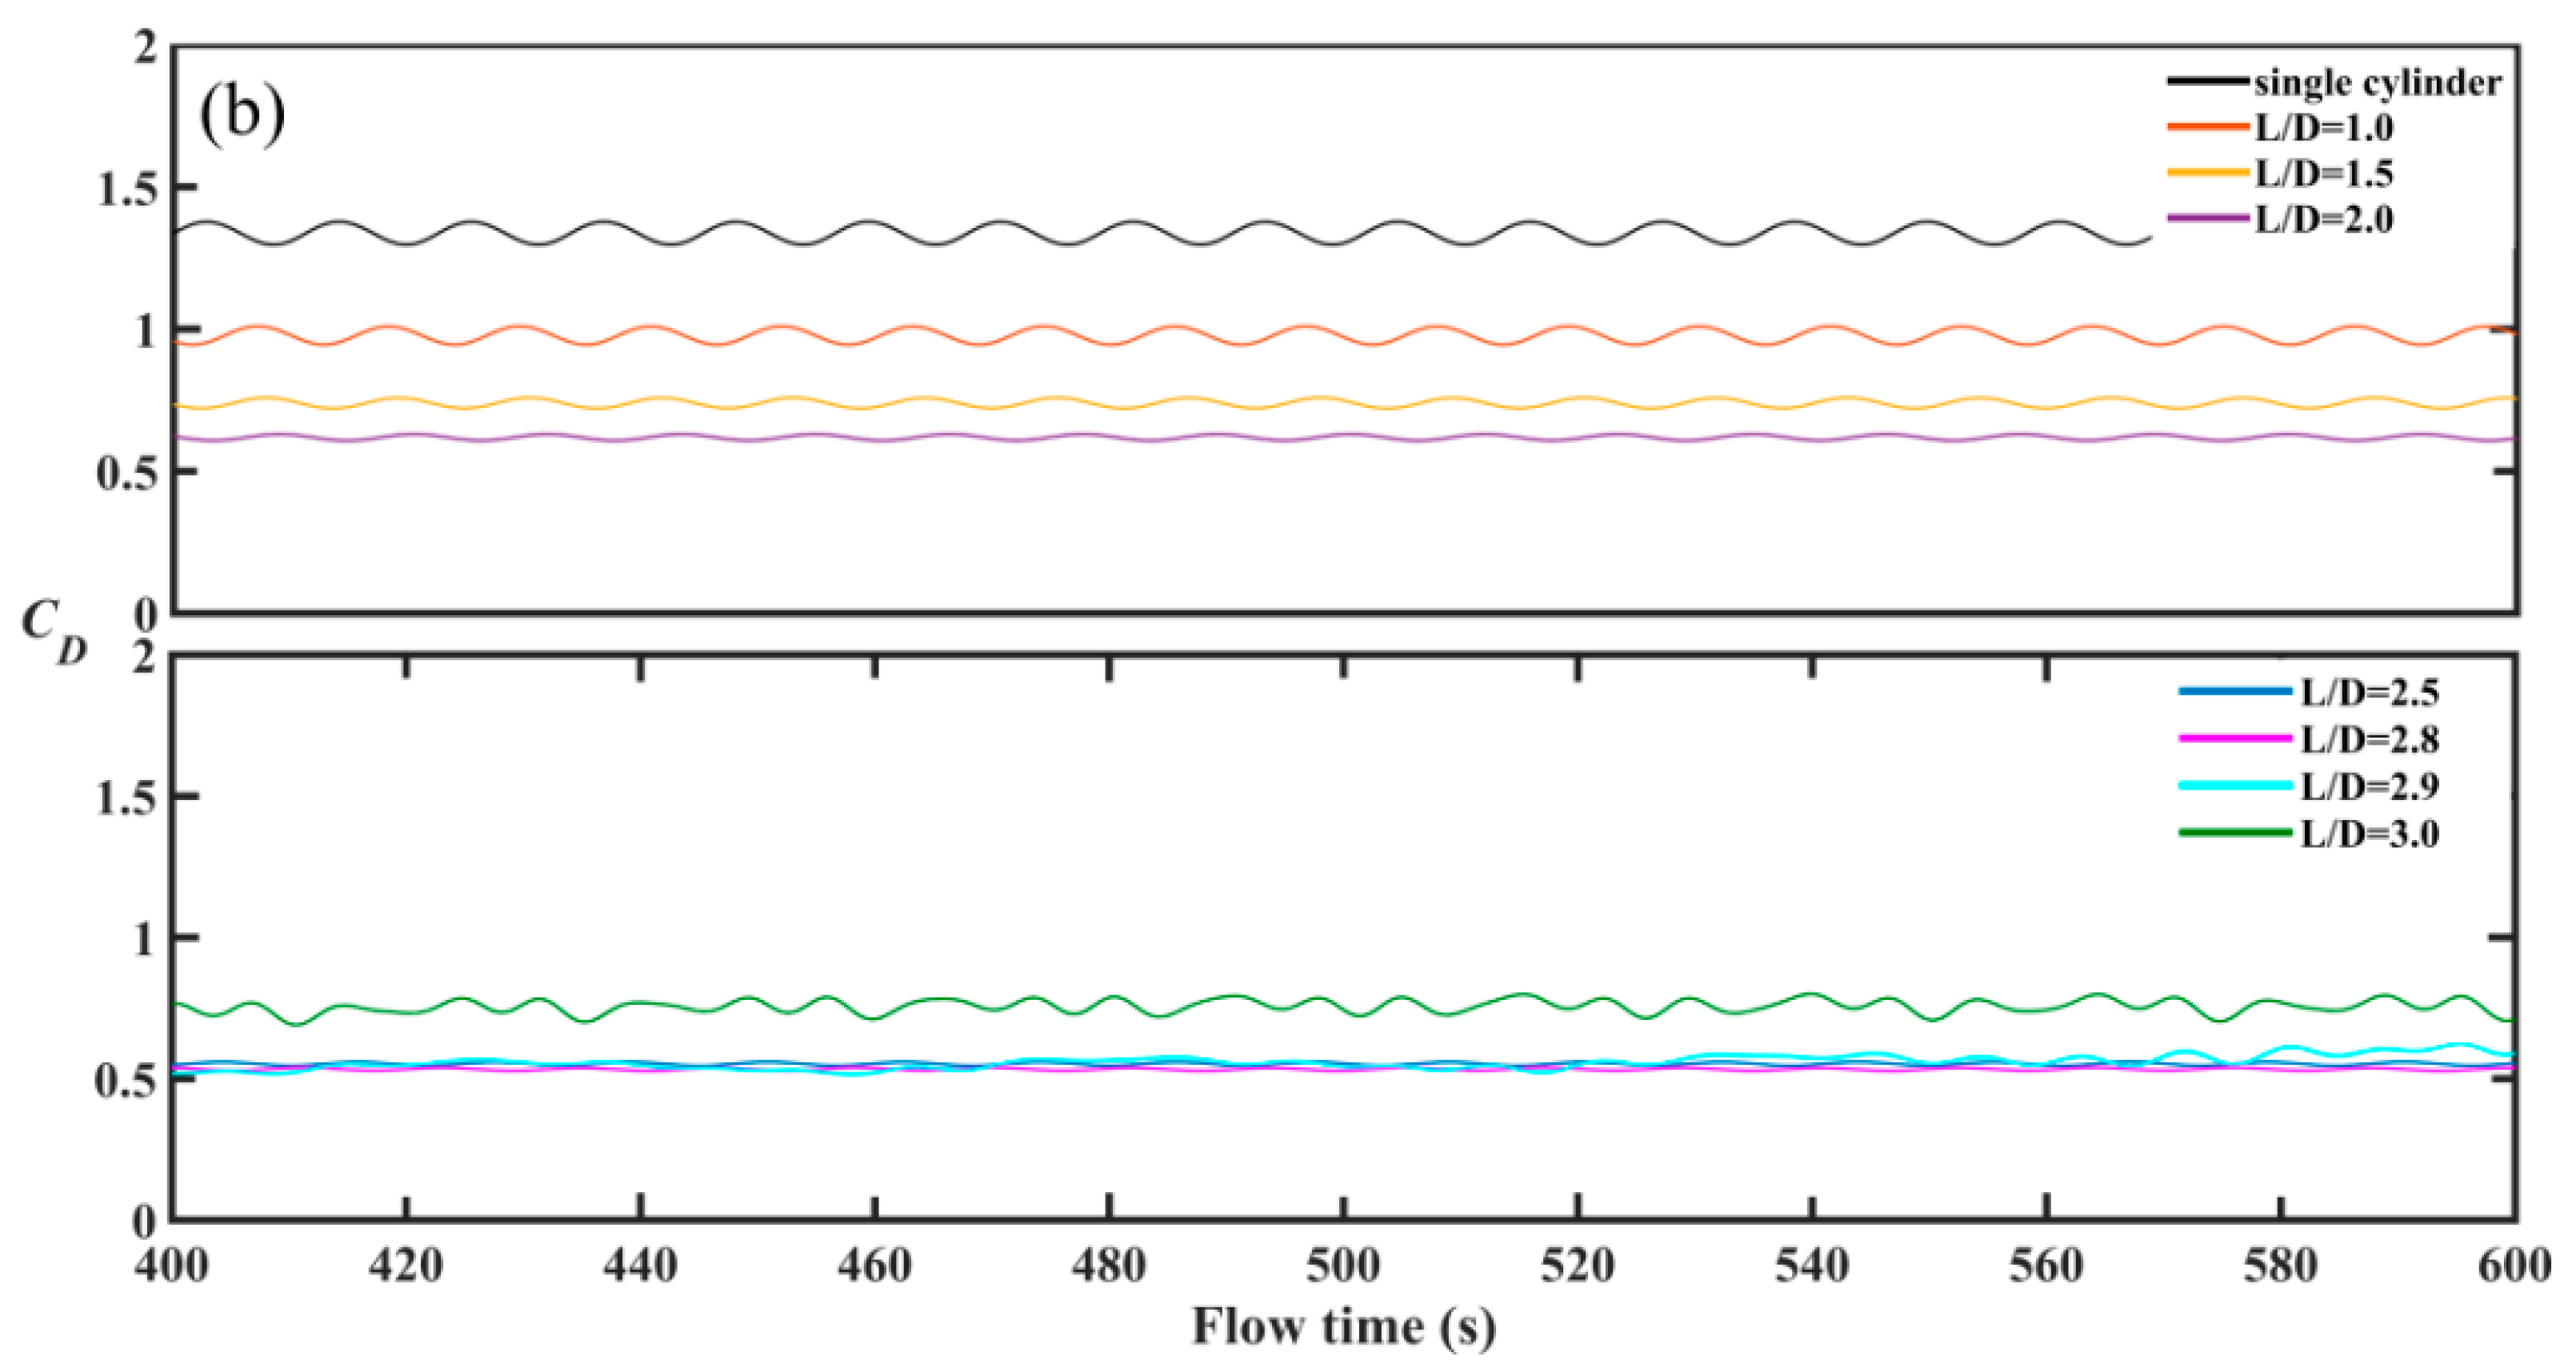
The typical time histories of the lift and drag coefficient with the spacing ratio of L/D at l w / D = 0.40 are presented in Figure 3. Figure 3 also includes the time history of the lift and drag coefficients for a single cylinder. Figure 3a,b depicts regular sinusoidal fluctuations of the lift and drag coefficient for L/D ≤ 2.8. When L/D > 2.8, the lift and drag coefficients show irregular oscillation, which is an indication of the wake impingement mode.

5.2. Identification of Wake Mode

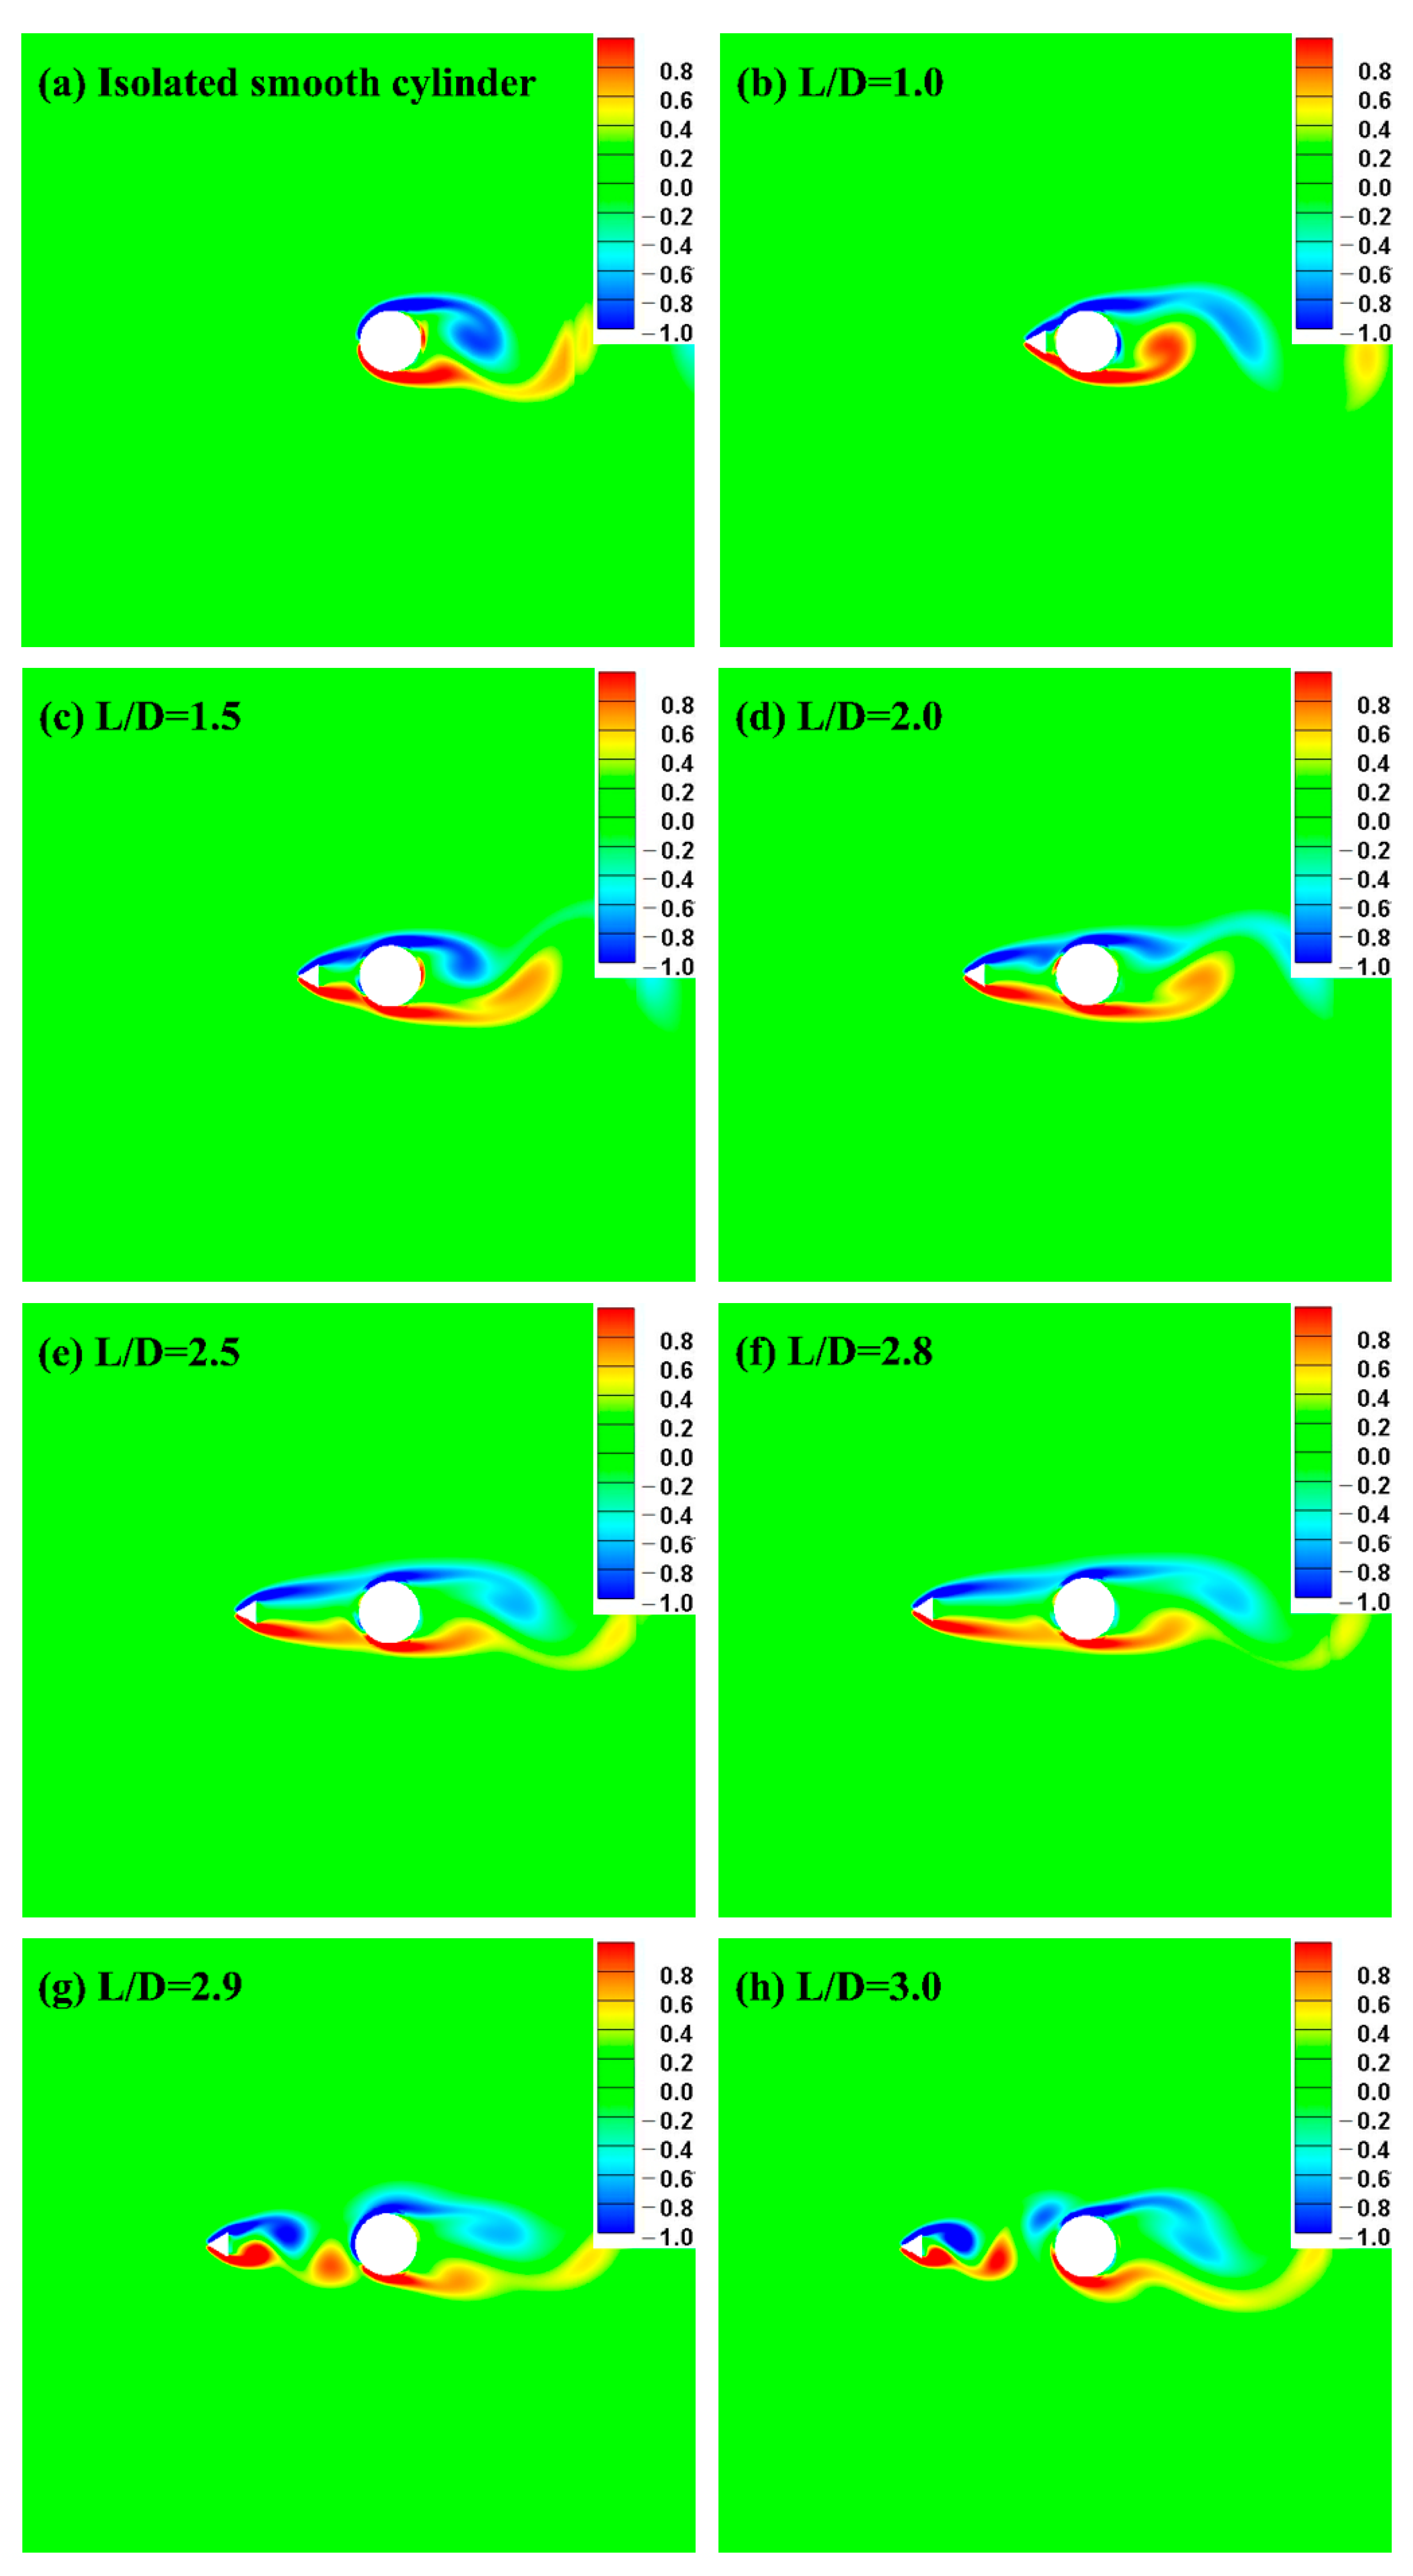
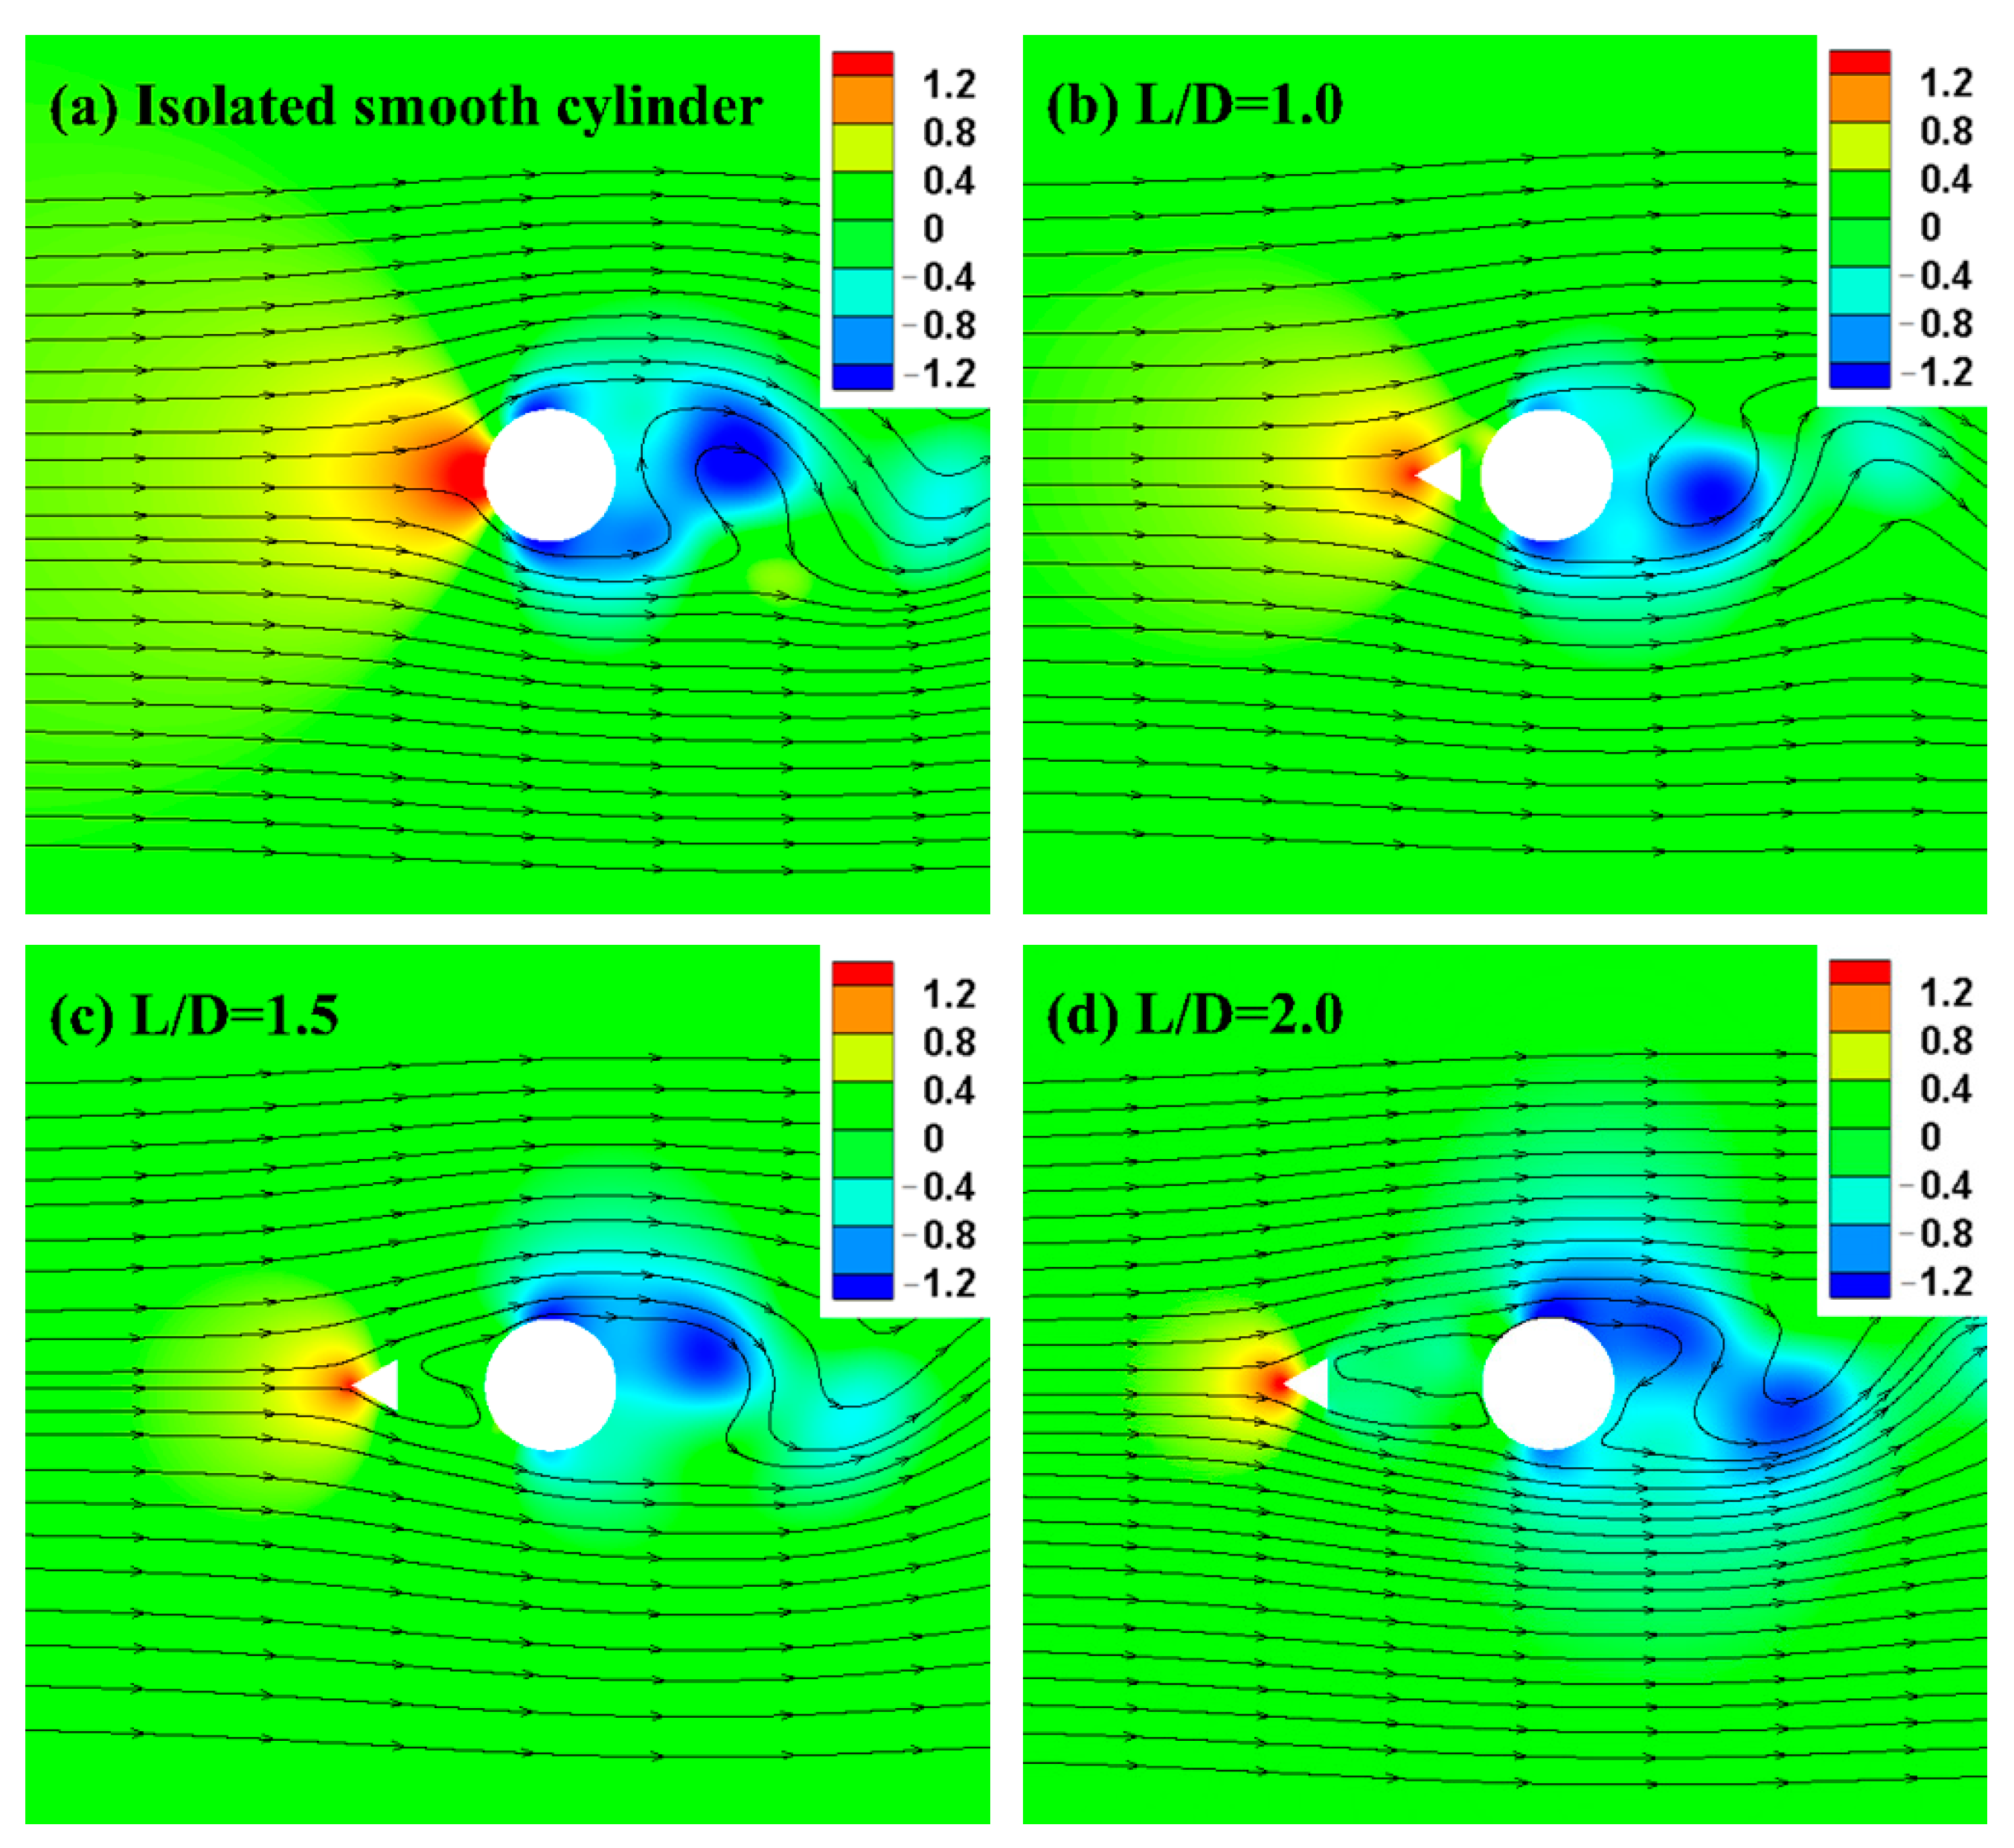
Figure 4 shows the typical wake flow patterns in the vicinity of the wedge and the main cylinder. Seven different spacing ratios, as represented by L/D, for a typical side length–diameter ratio of l w / D = 0.40 were presented. The vorticity contour of an isolated cylinder is also included for comparison. As is clearly depicted in the contours, two entirely different flow patterns between the wedge and the main cylinder are observed. Periodic vortex separation was not observed for L/D values ≤2.8. This is partly because the region between the wedge and the main cylinder was so small that the shear layer was not fully developed. Thus, the flow shed from the wedge reattaches to the main cylinder, and gives rise to the formation of a cavity between the wedge and the main cylinder. This kind of flow structure has been named as the cavity mode (Prasad and Williamson, 1997) [20]. With an increasing spacing ratio of L/D between the wedge and the main cylinder, the region between the wedge and the main cylinder becomes large enough for the flow shed from the wedge to develop. This kind of flow structure is named the wake impingement mode (Prasad and Williamson, 1997) [20]. In the wake impingement mode, distinct vortices are generated from the wedge and interact vigorously with the incident flow toward the main cylinder, breaking the regular patterns of the vortex shed from the main cylinder in the process. As a result, the speed of the flow at the surface of the main cylinder is larger than that in the cavity mode. One may then infer that there is a better drag reduction in the cavity mode than in the wake impingement mode. In addition, one may deduce from the vorticity contours the existence of a critical spacing ratio of L/D at which the wake flow patterns shift from the cavity mode to the wake impingement mode, as indicated by Lee et al. (2004). It is noted that for a relatively small side length l w / D = 0.20 and 0.27, no mode shift was observed for all the spacing ratios of L/D investigated, i.e., the flow shed from the wedge reattaches to the main cylinder, and no vortices were observed between the wedge and the main cylinder.

5.3. Pressure Field and the Flow Patterns

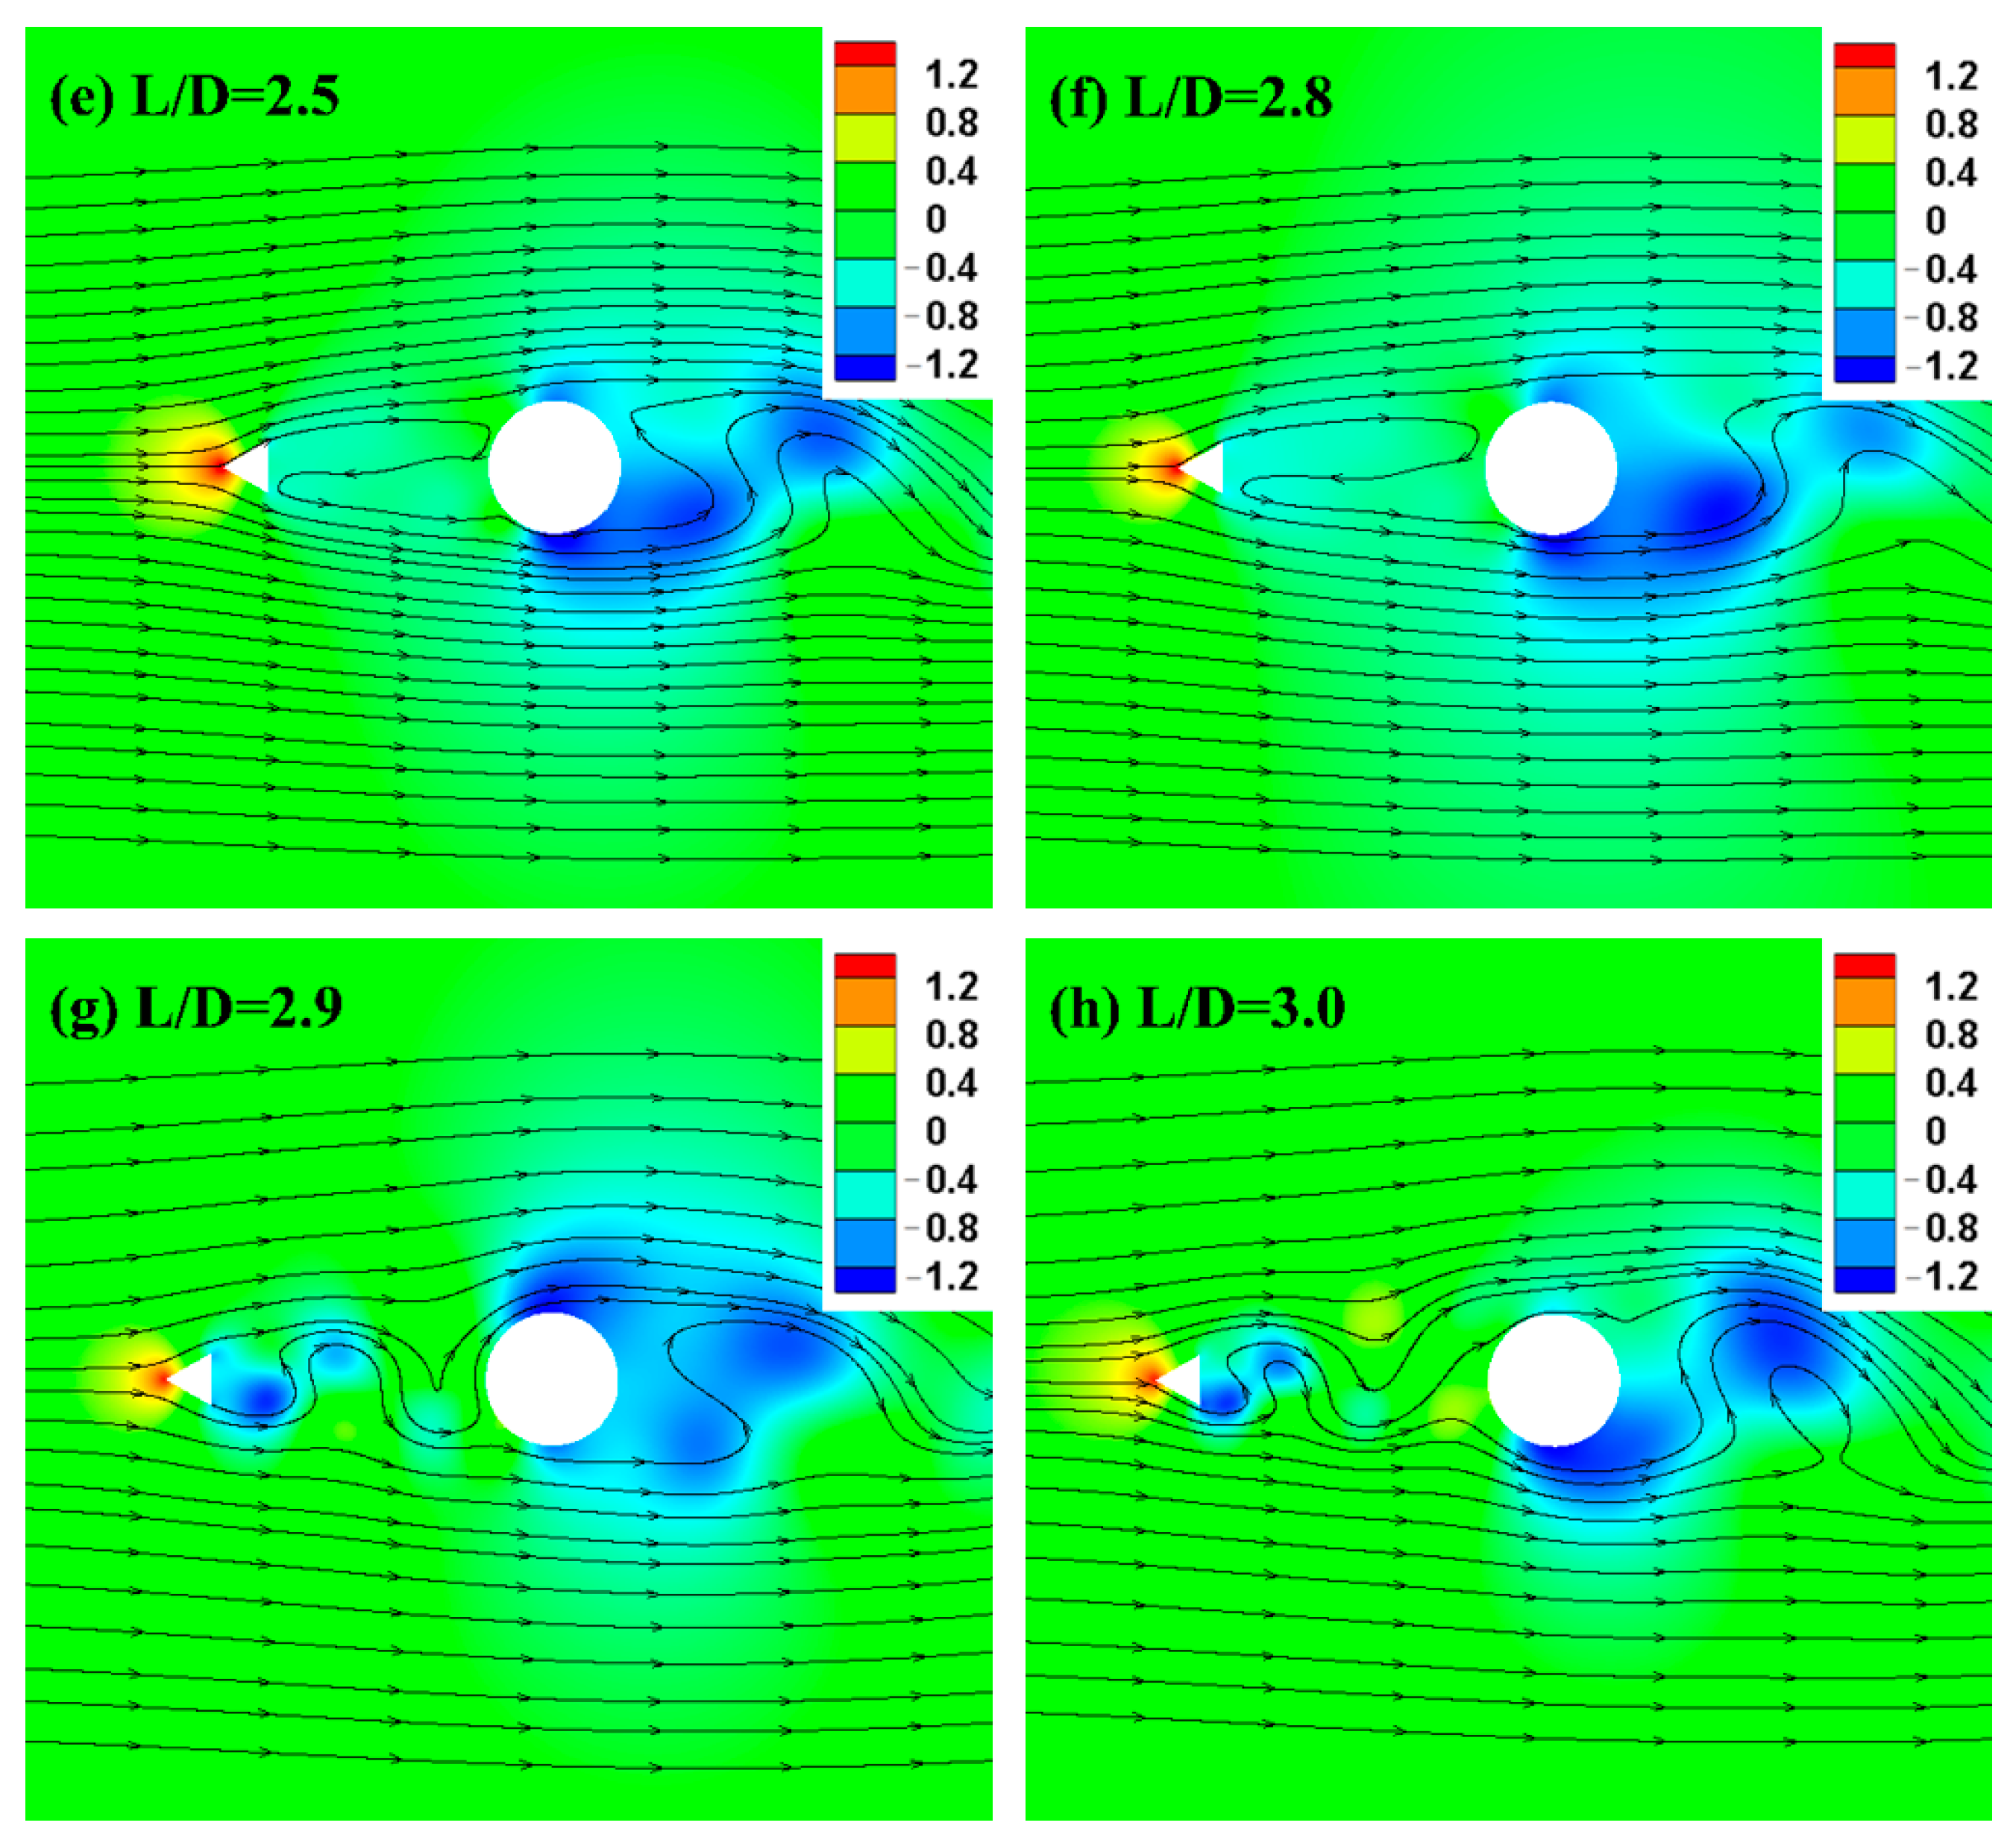
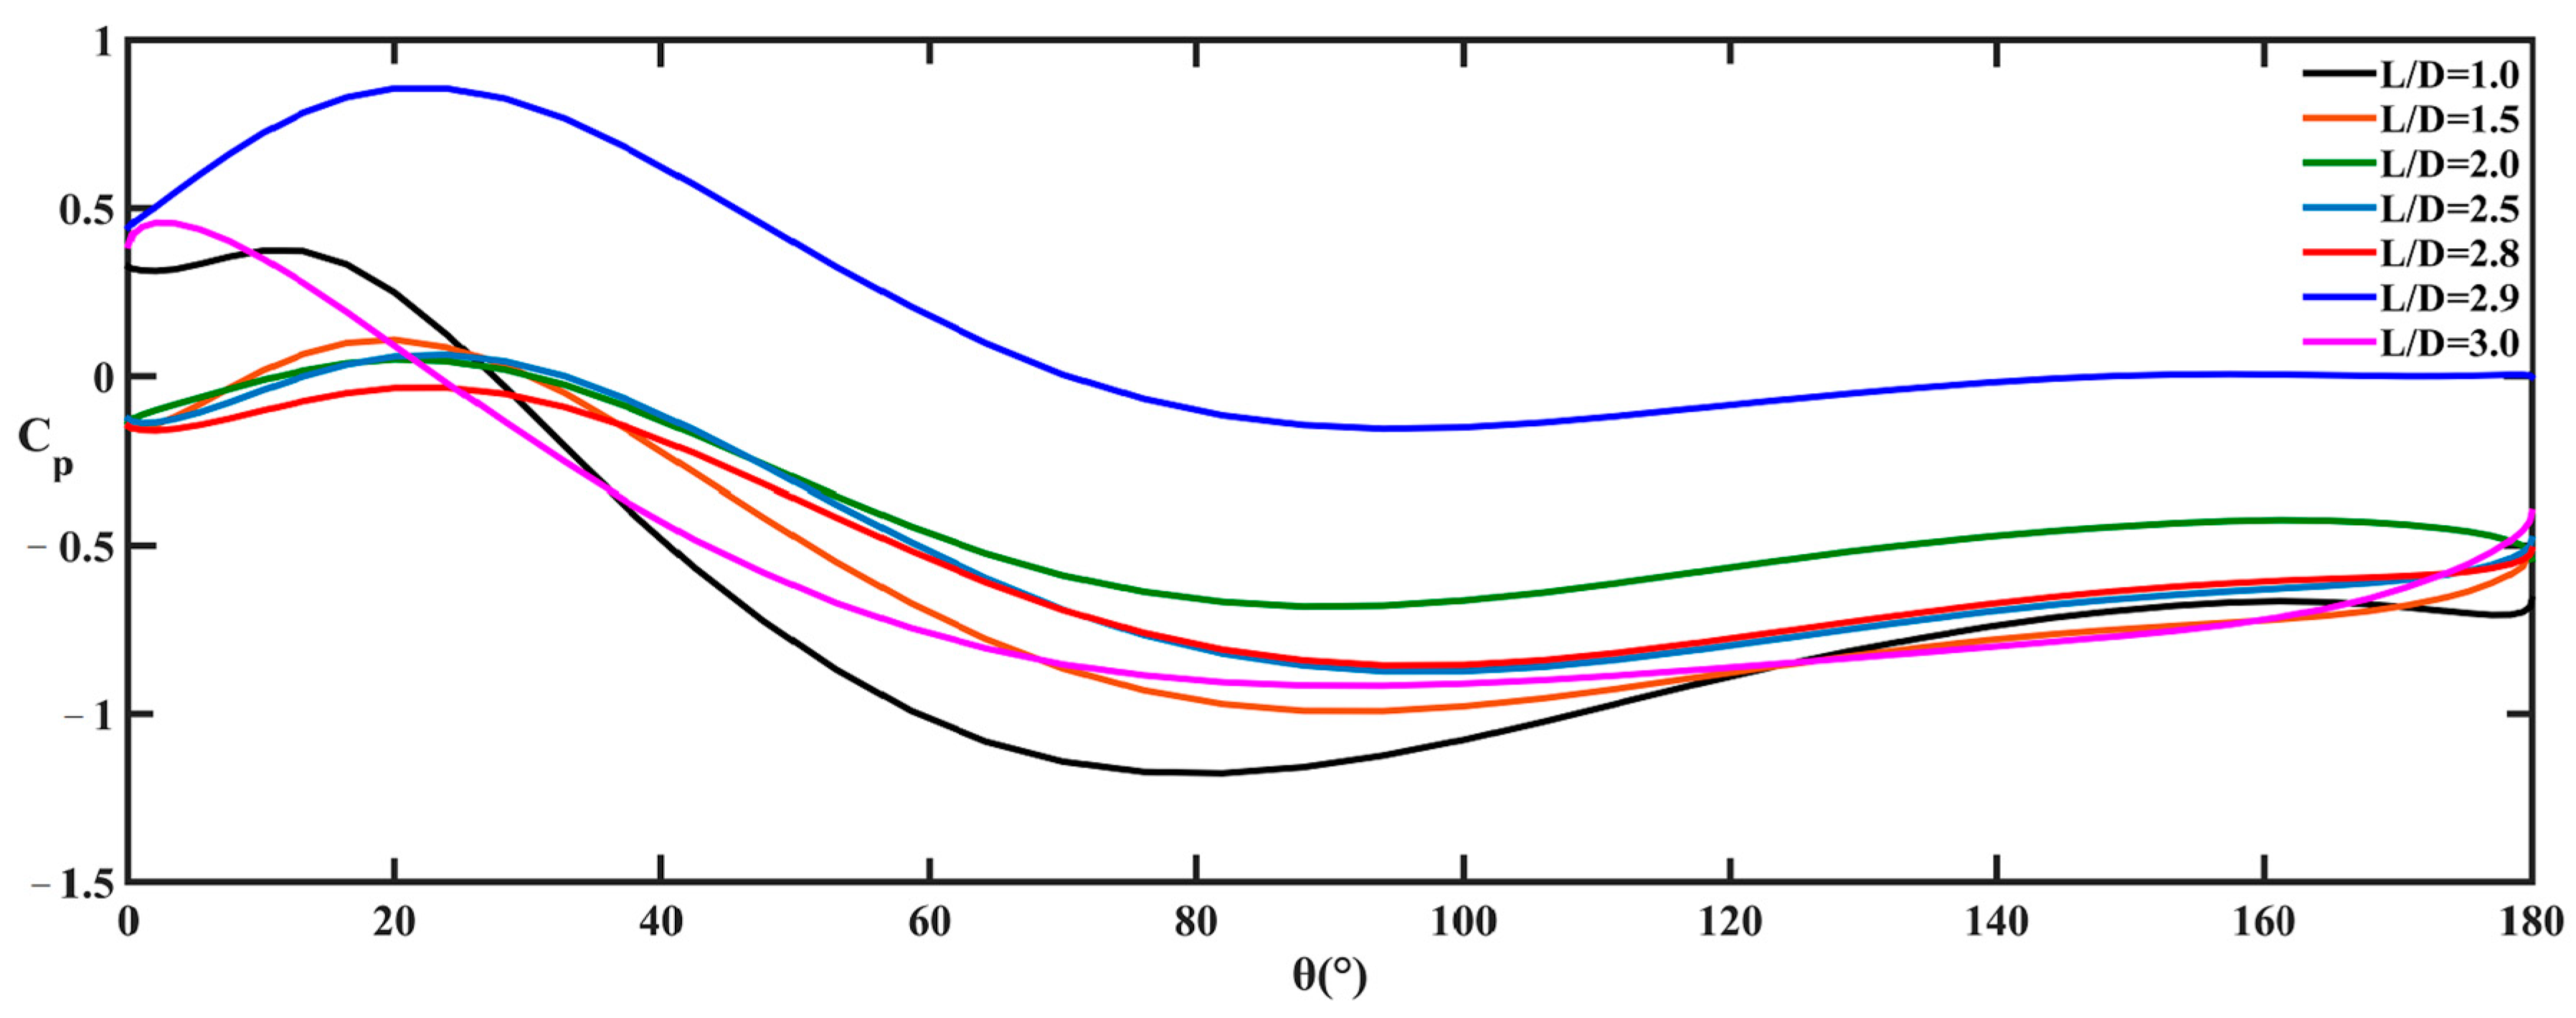
Figure 5 shows the contours of the pressure field and streamlines in the vicinity of the wedge and the main cylinder. Seven spacing ratios of L/D with a constant side length-diameter ratio l w / D = 0.40 were presented. The pressure field and streamline for an isolated cylinder at the same Reynolds number is also included for comparison. It can be seen that the pressure field in the vicinity of the main cylinder deviates from those without the wedge. The higher or lower pressure distributions at the left and right halves of the cylinder are immaterial as the flow is symmetrical about the flow longitudinal axis. The important feature to note is the magnitude of the pressure in front of and behind the cylinder, i.e., the pressure difference and the form drag. It can be observed that the pressure in front of and behind the main cylinder decreases dramatically and exhibits a similar magnitude for L/D ≤ 2.8. The lowest pressure is observed when the L/D ratio = 2.8. For the wake impingement mode, distinct vortices generate from the wedge and seriously interact with the oncoming flow of the main cylinder, leading to a larger flow velocity than that in the cavity mode. The flow velocity is relatively small in the cavity mode, which generates smaller hydrodynamic pressure. In addition, the pressure distribution on the surface of the main cylinder is related to the drag force acting on the cylinder. The induced drag force caused by the lift force and the friction was neglected, the drag force of the main cylinder consists of the pressure drag. Due to the existence of flow separation, the windward and leeward side of the main cylinder causes a larger difference in pressure distribution, giving rise to fair sized pressure drag, as shown in Figure 6. According to the pressure contours, the pressure distribution on the surface of the main cylinder is relatively even when the spacing ratio is L/D = 2.8, leading to the total pressure acting on the main cylinder reaching its smallest values in the flow direction. With the increase of the spacing ratio represented by L/D, the pressure in front of the main cylinder increases gradually. Furthermore, the pressure distribution on the surface of the main cylinder is relatively uneven, leading to the increase of drag force acting on the main cylinder.

6. Conclusion and Remarks

A set of numerical simulations on a circular cylinder with a wedge located upstream, and at low Reynolds numbers has been carried out in this study. Various spacing ratios represented by L/D between the wedge and the main cylinder have been evaluated systematically to establish the optimum location of the wedge upon which the lift and drag coefficients would be the lowest. The contours of vorticity obtained clearly show that two entirely different wake patterns exist and are dependent on the spacing ratio represented by L/D and the side length ratio represented by l w / D . There appears to be a critical spacing ratio at which the wake flow patterns shift from the cavity mode to the wake impingement mode. For all the combinations of side lengths ( l w / D 0.40 ) and spacing ratios (L/D ≤ 2.8), the values of the C L A and C D M are generally lower than those for an isolated single cylinder. The largest reduction of lift and the mean drag coefficient on the main cylinder are 71.9% and 60.1% at a spacing ratio of L/D = 2.8 and a side length of l w / D = 0.40 , respectively.

Author Contributions

Conceptualization, X.H. and J.W.; methodology, J.W. and B.Z.; validation, G.Z.; writing—review and editing, S.-K.T.

Funding

This research was funded by the LiaoNing Revitalization Talents Program, grant number XLYC1807190; the Liaoning Provincial Natural Science Foundation Guidance Project, grant number 20180550186; the Open Project Funding of State Key Laboratory of Coastal and Offshore Engineering, Dalian University of Technology, grant number LP1906; and the Fundamental Research Funds for the Central Universities.

Conflicts of Interest

The authors declare no conflict of interest.

Nomenclature

DDiameter of the main cylinder
l w Side length of the wedge
l w / D Dimensionless side length-diameter ratio
dDiameter of the control rod
d/DDimensionless diameter ratio
LDistance between the vertex of the wedge and the center of the cylinder
L/DSpacing ratio
ReReynolds number
U Velocity of the inflow
ν Kinematic viscosity of the fluid
ρ Fluid density
C D M Mean drag coefficient
C L A Amplitude of lift coefficient
S t Strouhal number
f s Vortex shedding frequency

References

  1. Korkischko, I.; Meneghini, J.R. Experimental investigation of flow-induced vibration on isolated and tandem circular cylinders fitted with strakes. J. Fluids Struct. 2010, 26, 611–625. [Google Scholar] [CrossRef]
  2. Lu, L.; Liu, M.M.; Teng, B.; Cui, Z.D.; Tang, G.Q.; Zhao, M.; Cheng, L. Numerical investigation of fluid flow past circular cylinder with multiple control rods at low Reynolds number. J. Fluids Struct. 2014, 48, 235–259. [Google Scholar] [CrossRef]
  3. Lee, L.; Allen, D.W. The Dynamic Stability of Short Fairings. In Proceeding of the Offshore Technology Conference, Houston, TX, USA, 19 April 2005; pp. 152–185. [Google Scholar]
  4. Zhou, B.; Wang, X.; Guo, W.; Gho, W.; Tan, S. Control of flow past a dimpled circular cylinder. Exp. Therm. Fluid Sci. 2015, 69, 19–26. [Google Scholar] [CrossRef]
  5. Zhou, B.; Wang, X.; Guo, W.; Gho, W.; Tan, S. Experimental study on flow past a circular cylinder with grooved surface. Ocean Eng. 2015, 109, 7–13. [Google Scholar] [CrossRef]
  6. Zhou, B.; Wang, X.; Gho, W.; Tan, S. Force and flow characteristics of a circular cylinder with uniform surface roughness at subcritical Reynolds number. Appl. Ocean Res. 2015, 49, 20–26. [Google Scholar] [CrossRef]
  7. Silva-Ortega, M.; Assi, G.R.S. Flow-induced vibration of a circular cylinder surrounded by two, four and eight wake-control cylinders. Exp. Therm. Fluid Sci. 2017, 85, 354–362. [Google Scholar] [CrossRef]
  8. Lesage, F.; Gartshore, I.S. A method of reducing drag and fluctuating side force on bluff bodies. J. Wind Eng. Ind. Aerodyn. 1987, 25, 229–245. [Google Scholar] [CrossRef]
  9. Sakamoto, H.; Haniu, H. Optimum suppression of fluid forces acting on a circular cylinder. J. Fluids Eng. 1994, 116, 221–227. [Google Scholar] [CrossRef]
  10. Tsutsui, T.; Igarashi, T. Drag reduction of a circular cylinder (2nd report, effect of Reynolds number). Trans. JSME 1995, 61, 2069–2075. (In Japanese) [Google Scholar] [CrossRef]
  11. Tsutsui, T.; Igarashi, T. Enhancement of heat transfer and reduction of drag of a circular cylinder. Trans. JSME 1996, 62, 1802–1809. (In Japanese) [Google Scholar] [CrossRef]
  12. Lee, S.J.; Lee, S.I.; Park, C.W. Reducing the drag on a circular cylinder by upstream installation of a small control rod. Fluid Dyn. Res. 2004, 34, 233–250. [Google Scholar] [CrossRef]
  13. Kuo, C.H.; Chiou, L.C.; Chen, C.C. Wake flow pattern modified by small control cylinders at low Reynolds number. J. Fluids Struct. 2007, 23, 938–956. [Google Scholar] [CrossRef]
  14. Zhao, M.; Tong, F.; Cheng, L. Numerical simulation of two-degree-of-freedom vortex-induced vibration of a circular cylinder between two lateral plane walls in steady currents. J. Fluids Eng. 2012, 134, 377–390. [Google Scholar] [CrossRef]
  15. Mittal, S. Free vibrations of a cylinder: 3-D computations at Re = 1000. J. Fluids Struct. 2013, 41, 109–118. [Google Scholar] [CrossRef]
  16. Patanker, S.V.; Spalding, B.D. A calculation procedure for heat, mass and momentum transfer in three-dimensional parabolic flows. Int. J. Heat Mass Transf. 1972, 15, 1787–1806. [Google Scholar] [CrossRef]
  17. Linnick, M.N.; Fasel, H.F. A high-order immersed interface method for simulating unsteady incompressible flows on irregular domains. J. Comput. Phys. 2005, 204, 157–192. [Google Scholar] [CrossRef]
  18. He, J.W.; Glowinski, R.; Metcalfe, R.; Nordlander, A.; Periaux, J. Active control and drag optimization for flow past a circular cylinder I: Oscillatory cylinder rotation. J. Comput. Phys. 2000, 163, 83–117. [Google Scholar] [CrossRef]
  19. Henderson, R.D. Details of the drag curve near the onset of vortex shedding. Phys. Fluids 1995, 7, 2102–2104. [Google Scholar] [CrossRef]
  20. Prasad, A.; Williamson, C.H.K. A method for the reduction of bluff body drag. J. Wind Eng. Ind. Aerodyn. 1997, 69–71, 155–167. [Google Scholar] [CrossRef]
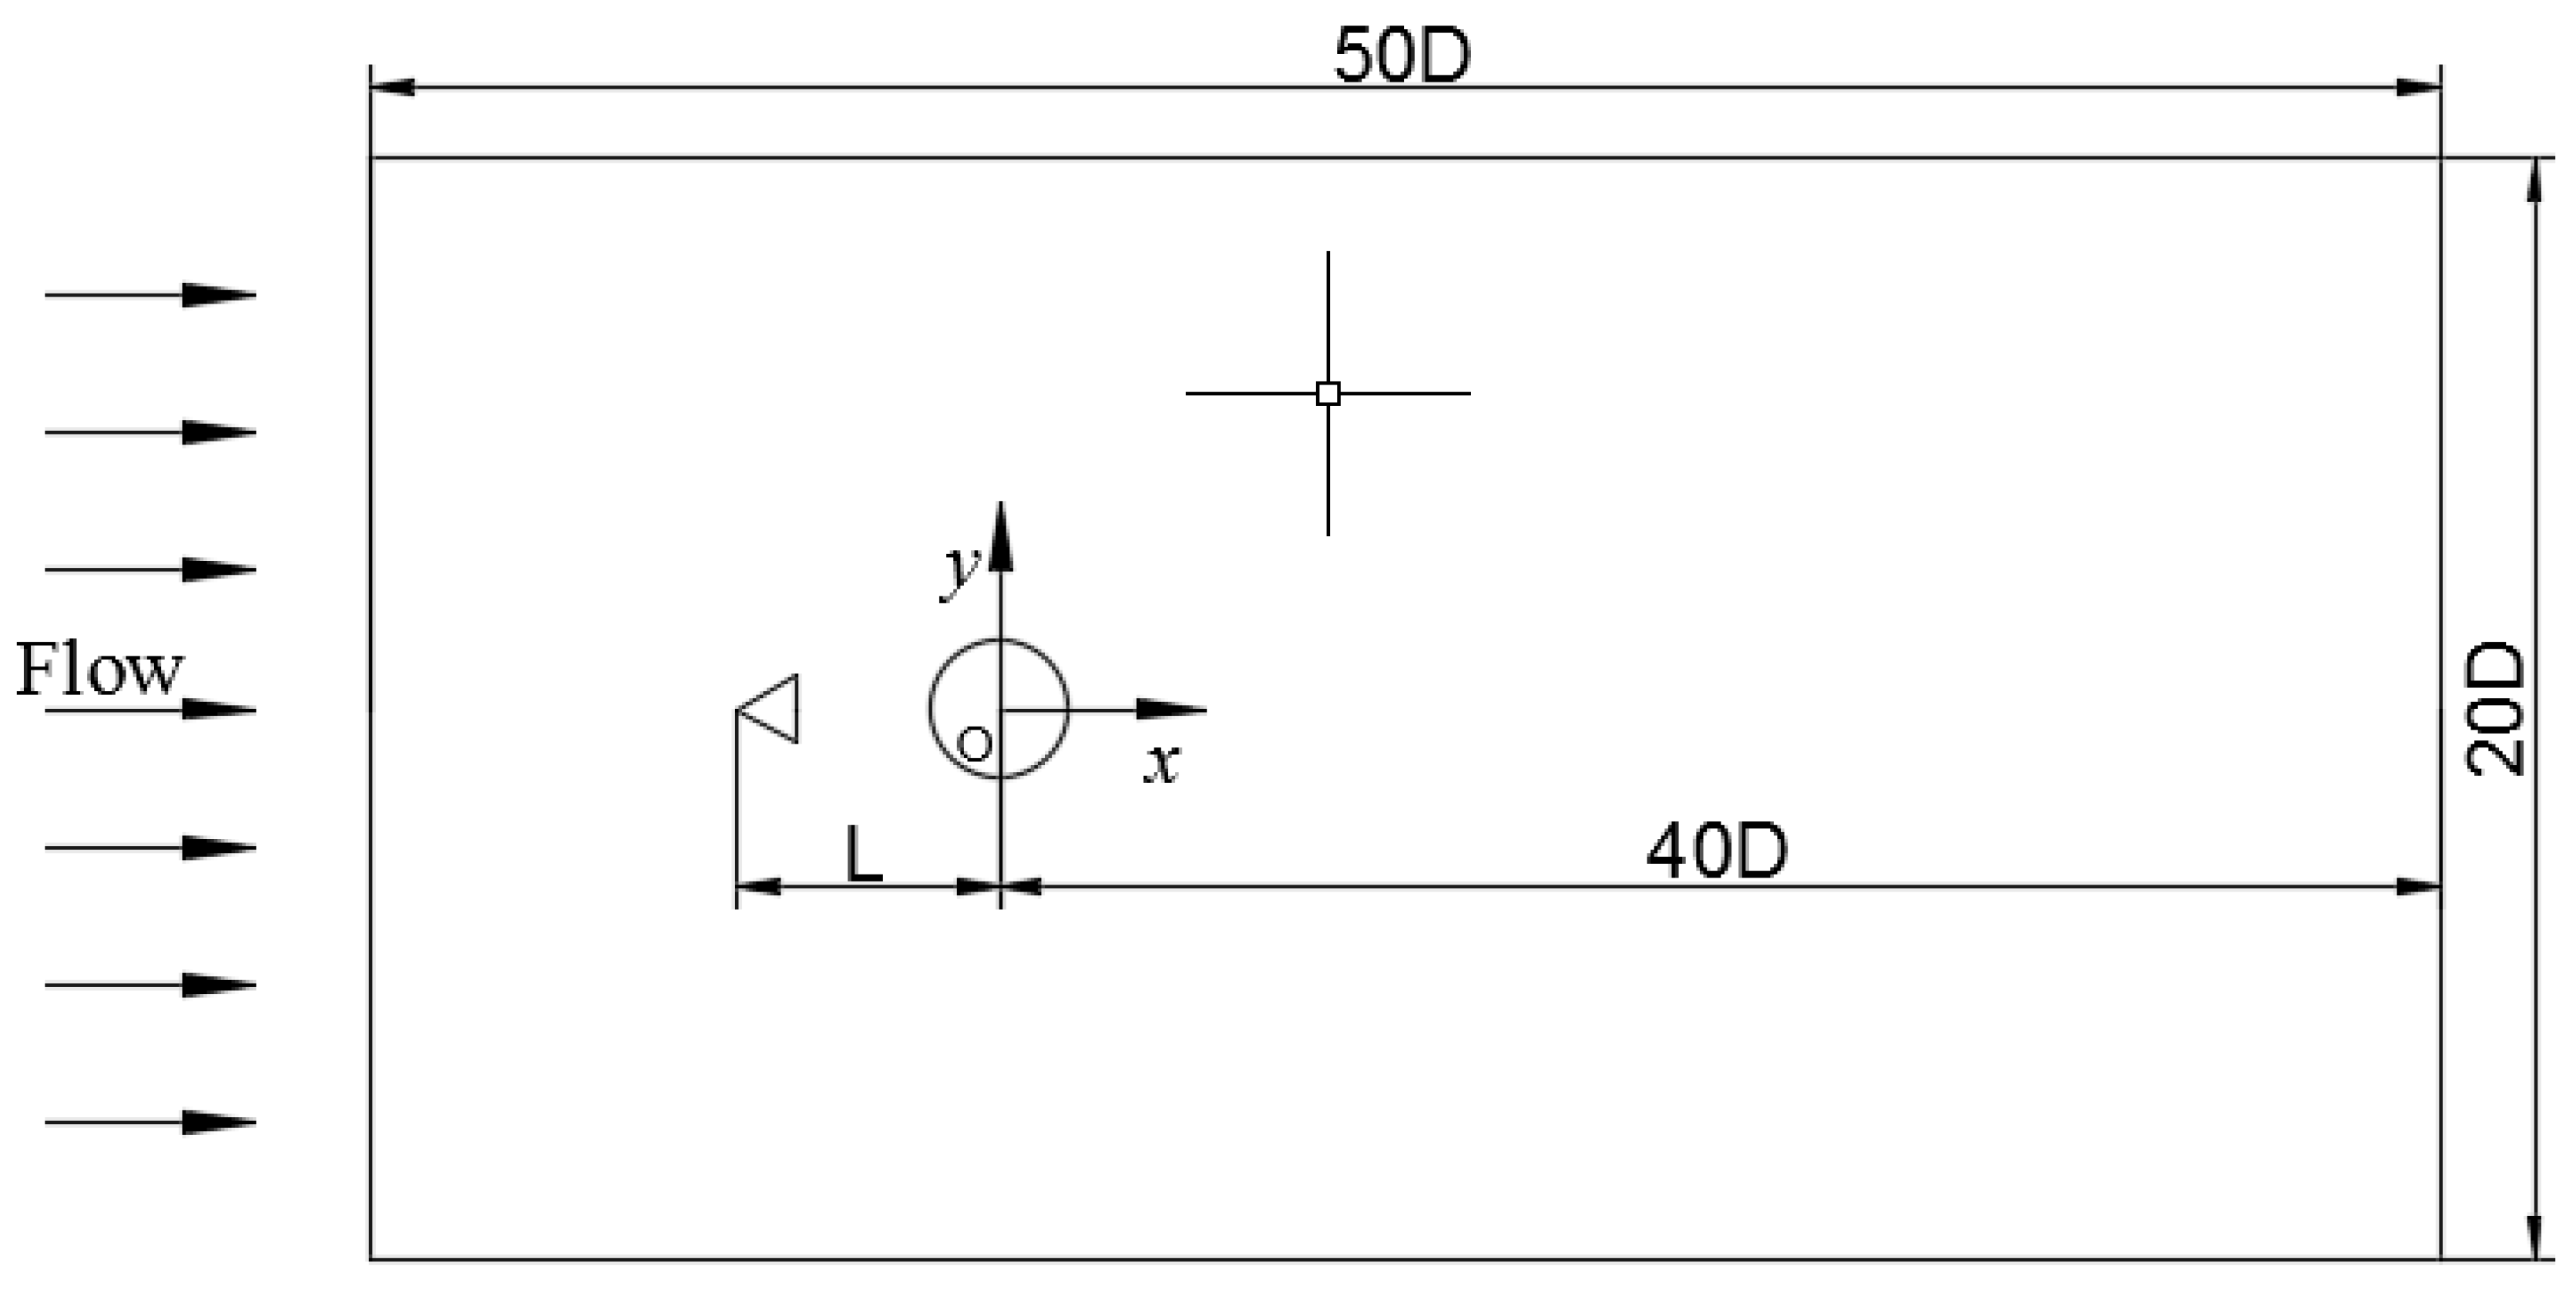
Figure 1. The computational domain and the positions of the wedge and the main cylinder.
Jmse 07 00422 g001
Figure 2. Variation of the force coefficient acting on the main cylinder with spacing ratio at different l w / D , (a) amplitude of lift coefficient; (b) mean drag coefficient.
Jmse 07 00422 g002aJmse 07 00422 g002b
Figure 3. The time series of the force coefficient acting on the main cylinder for different spacing ratios at l w / D = 0.40 , (a) lift coefficient; (b) drag coefficient.
Jmse 07 00422 g003aJmse 07 00422 g003b
Figure 4. Contours of vorticity for different spacing ratios of L/D at Re = 200, (a) isolated smooth cylinder; (b) L/D = 1.0; (c) L/D = 1.5; (d) L/D = 2.0; (e) L/D = 2.5; (f) L/D = 2.8; (g) L/D = 2.9; (h) L/D = 3.0.
Jmse 07 00422 g004
Figure 5. Contours of pressure field and streamline in the vicinity of the main cylinder for different spacing ratios, as represented by L/D, (a) isolated smooth cylinder; (b) L/D = 1.0; (c) L/D = 1.5; (d) L/D = 2.0; (e) L/D = 2.5; (f) L/D = 2.8; (g) L/D = 2.9; (h) L/D = 3.0.
Jmse 07 00422 g005aJmse 07 00422 g005b
Figure 6. Pressure coefficient at the surface of the cylinder.
Jmse 07 00422 g006
Table 1. Parameters of the flow control simulation at Re = 200. Re: Reynolds number.
L / D . 1.01.52.02.52.62.82.93.0
l w / D
0.20---
0.27---
0.33--
0.40
Annotation: √ denotes cases have been simulated; - denotes cases have not been simulated.
Table 2. Results for mesh independent validation.
MeshNode C D M C L A S t
Mesh1801.3350.6470.198
Mesh21201.3420.6530.198
Mesh31601.3450.6580.198
Table 3. Comparison of C D M , C L A , and S t for a circular cylinder (Re = 200).
Cases C D M C L A S t
Present work1.340.650.198
Lu et al. (2014) [2]1.340.690.196
Linnick and Fasel (2005) [17]1.34–1.370.70-
He et al. (2000) [18]1.36-0.198
Henderson (1995) [19]1.34-0.197