Article

Collapse Analysis of ERW Pipe Based on Roll-Forming and Sizing Simulations

1
Department of Civil and Environmental Engineering, Seoul National University, Seoul 08826, Korea
2
Institute of Construction and Environmental Engineering, Seoul National University, Seoul 08826, Korea
3
Steel Structure Research Group, POSCO, Incheon 21985, Korea
4
Civil and Environmental Engineering, FAMU-FSU College of Engineering, Tallahassee, FL 32310, USA
*
Author to whom correspondence should be addressed.
J. Mar. Sci. Eng. 2019, 7(11), 410; https://doi.org/10.3390/jmse7110410
Submission received: 14 October 2019 / Revised: 7 November 2019 / Accepted: 9 November 2019 / Published: 12 November 2019
(This article belongs to the Section Ocean Engineering)

Abstract

:
The demand for electric resistance welded (ERW) pipe for deep-water installation has increased, which necessitates a higher degree of accuracy in evaluating the strength of pipe in order to satisfy the design limit state, otherwise referred to as the collapse performance. Since ovality and residual stress governs the collapse performance, an accurate evaluation of these factors is needed. An analytical approach using a three-dimensional finite element method was proposed to simulate the roll-forming and sizing processes in manufacturing ERW pipe. To simulate significant plastic deformation during manufacturing, a nonlinear material model that included the Bauschinger effect was incorporated. The manufacturing of ERW pipe made of API 5L X70 steel was simulated and analyzed for collapse performance. Controlling the ovality of the pipe significantly decreased the amount of pressure that would cause a collapse, whereas the effect of residual stress was minor. These two factors could be improved via the use of a proper sizing ratio.

1. Introduction

As the energy industry continues to grow, engineers have applied electric resistance welded (ERW) pipe to oil and gas transport pipeline due to low cost and high performance. ERW pipe has traditionally been used for land pipelines rather than for offshore pipelines due to the potential weakness of welded seams [1]. As the welding technology has improved, however, recent studies have shown that ERW pipe is also applicable to deep-water pipelines [2,3].
Compared with other types of steel pipe, the merits of ERW pipe derive from the manufacturing process. The manufacturing process of ERW pipe can be divided into five steps, each with the potential to cause instances of large deformations: Uncoiling, leveling, roll-forming, welding, and sizing [4]. Uncoiling and leveling are the processes that are used to unfold and flatten rolled steel sheets from steel mills. Roll-forming is a process whereby a steel plate is rolled into a circular pipe shape, welding joins the two opposing edges to form a pipe, and sizing is the process of applying compression to the pipe following the welding to optimize the circular shape. These five steps are performed along one linear continuous process from the plate to when the pipe is cut into desired lengths, and these steps lead to ERW pipe with smaller deviations in diameter and thickness in the circumferential direction compared with other types of pipe such as UOE and spiral pipes. These manufacturing steps make ERW pipe more cost-effective because uniform thickness reduces the net weight, and relatively smaller deviations in diameter and uniform thickness increase the girth welding speed that is required either in the field or on a lay-barge [1].
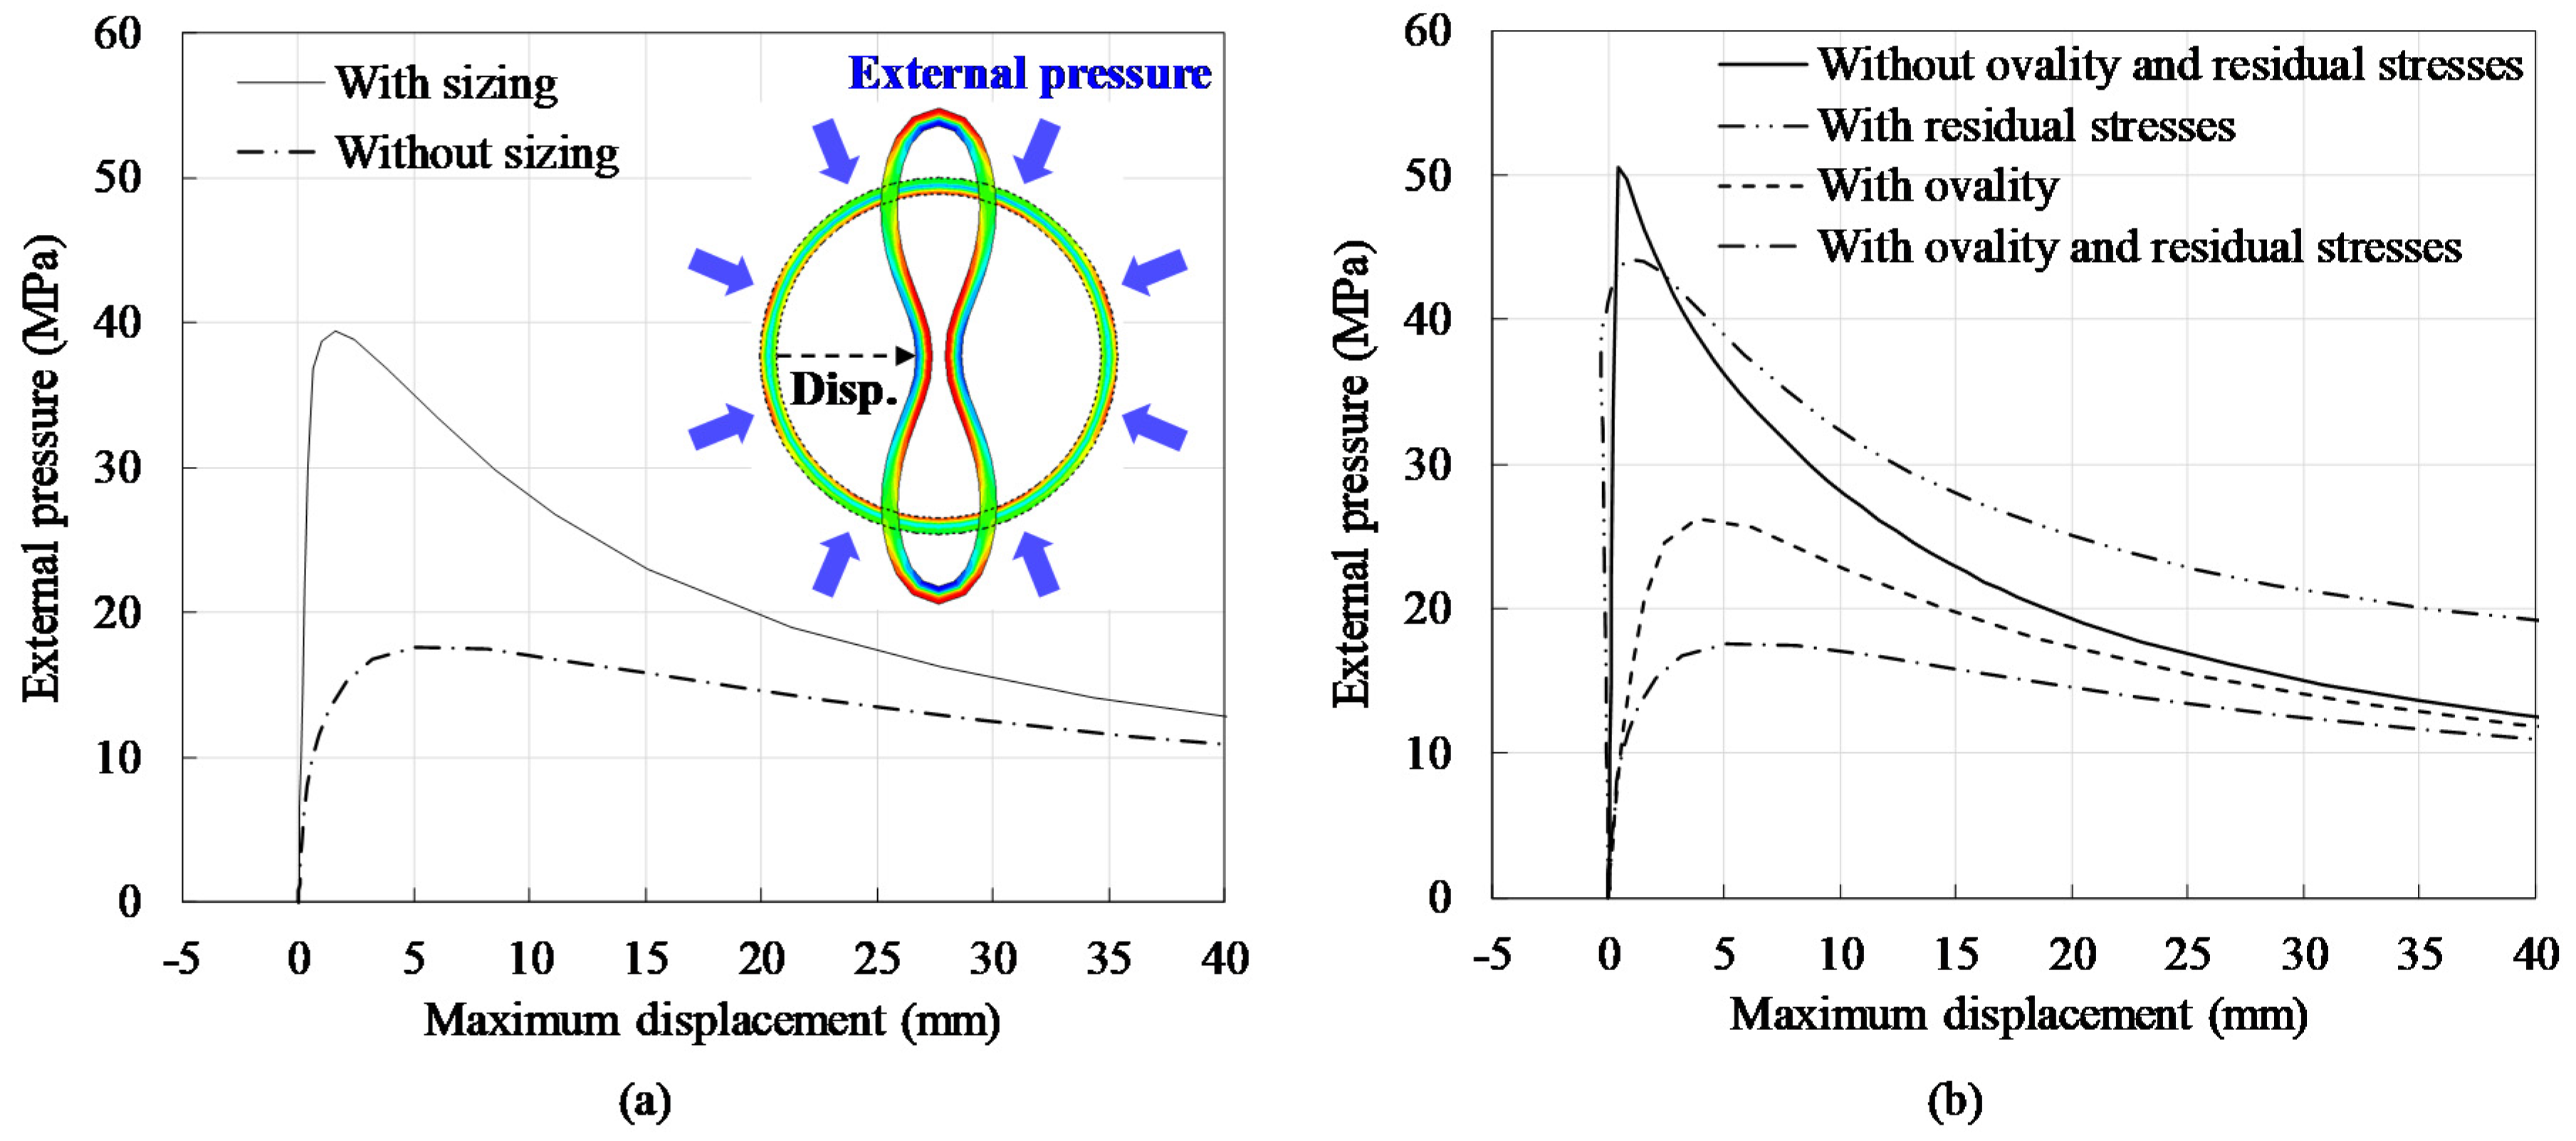
As the demand for ERW pipe increases, higher accuracy in evaluating strength is now required to satisfy the design limit state, and one of the main considerations for the design of deep-water pipelines is to ensure resistance to external pressure. The collapse performance of a pipe against external pressure could be affected by factors that include material and geometric properties, as well as residual stress [5,6].
During the manufacturing of ERW pipes, significant deformation could be caused by repetitive loading and unloading. Kyriakides and Corona [1] conducted finite element analysis and confirmed that the Bauschinger effect should be considered the elastic-perfectly plastic stress–strain relationship or else the collapse performance can be overestimated. They also confirmed that the collapse performance could be improved by promoting the out-of-roundness phenomenon in cross-sections. Bastola et al. [5] conducted finite element analysis and confirmed that residual stress could reduce the resistance to collapse pressure by as much as 20%, and that the residual stress along the circumferential direction of the pipe were more significant on collapse performance than those along the longitudinal direction.
Factors such as out-of-roundness and residual stress could be determined during manufacturing, particularly during the roll-forming and sizing steps. Since modification to the configurations and arrangements of the rolls is difficult to investigate, it is difficult to experimentally verify the influence of the manufacturing process on these factors. Thus, finite element analysis that can accurately simulate the manufacturing process is needed. The aforementioned studies [1,5,6], however, forcibly imposed such factors to their finite element model without simulating the manufacturing process, so that it is questionable whether the results can be considered realistic. Several studies [4,7,8] have investigated the effect of the manufacturing process on out-of-roundness or residual stress, but these studies did not simulate all steps in the manufacturing processes using a realistic material model. These over-simplified approaches are understandable because numerically simulating the manufacturing process demands complex analysis following excessive computational effort.
This study introduces a three-dimensional finite element analysis model that realistically reflects the manufacturing process of ERW pipes. Realistic configurations and arrangements of rolls were modeled, and roll-forming and sizing were simulated by considering the contact conditions between steel plates and rolls. The Bauschinger effect was also taken into account. Residual stress and out-of-roundness are the outcomes of the manufacturing process, and these were evaluated for the effect on collapse performance.

2. Material Model in Simulations

In order to more precisely evaluate collapse performance, the Bauschinger effect generated by the roll-forming process should be accurately simulated in a finite element model. In order to account for those properties, this study adopted the Modified Chaboche model proposed by Zou et al. [9].

2.1. Modified Chaboche Model

The Von mises yield function with kinematic and isotropic hardening is defined by Equation (1) [10].
f = σ χ η = 0
In Equation (1), σ is the stress and χ and η are the terms related to kinematic and isotropic hardening, respectively, indicating the translation and expansion of the yield surface. The stress, σ , is defined by Equation (2).
In Equation (2), χ k , is composed of three stress components. Equation (3) defines the backstress.
σ = k = 1 3 χ k ± η
χ k = ± C k γ k + ( χ k 0 C k γ k ) exp ( γ k | ε p ε p 0 | )
In Equation (3), C k and γ k are the material hardening terms, ε p is the plastic strain, χ k 0 and ε p 0 refer to χ k and ε p at the beginning of the roll-forming and sizing processes, respectively. The steel that underwent plastic deformation has no yield plateau according to the Bauschinger effect. Equation (4) shows that yield plateau is expressed by dividing the plastic section of the isotropic hardening term by the accumulative plastic strain.
η = { σ 0 + ( σ a σ 0 ) · ( 1 e x p ( b a p ) ) ,   p ε p l a ψ + Q · ( 1 e x p ( b p ) ) ,   p ε p l a
In Equation (4), Q , σ 0 , and ε p l a represent the saturated isotropic hardening stress, the initial yield strength, and the length of the yield plateau, respectively. σ a , b a , and ψ are the material parameters for simulating the yield plateau and p is the accumulative plastic strain.
Consideration of springback is essential when large deformation occurs, and the springback is affected not only by the Bauschinger effect but also by Young’s modulus [11]. Equation (5) shows the decrease in Young’s modulus according to accumulative plastic strain.
E ( p ) = E 0 ( E 0 E a ) [ 1 e x p ( ξ p ) ]
In Equation (5), E 0 and E a are the Young’s modulus of the plate and the reduced Young’s modulus at the infinitely large accumulated plastic strain, respectively. ξ is the material coefficient, and the Young’s modulus reduces E a from the initial E 0 according to the accumulative plastic strain during the roll-forming process.

2.2. Validation of the Material Model

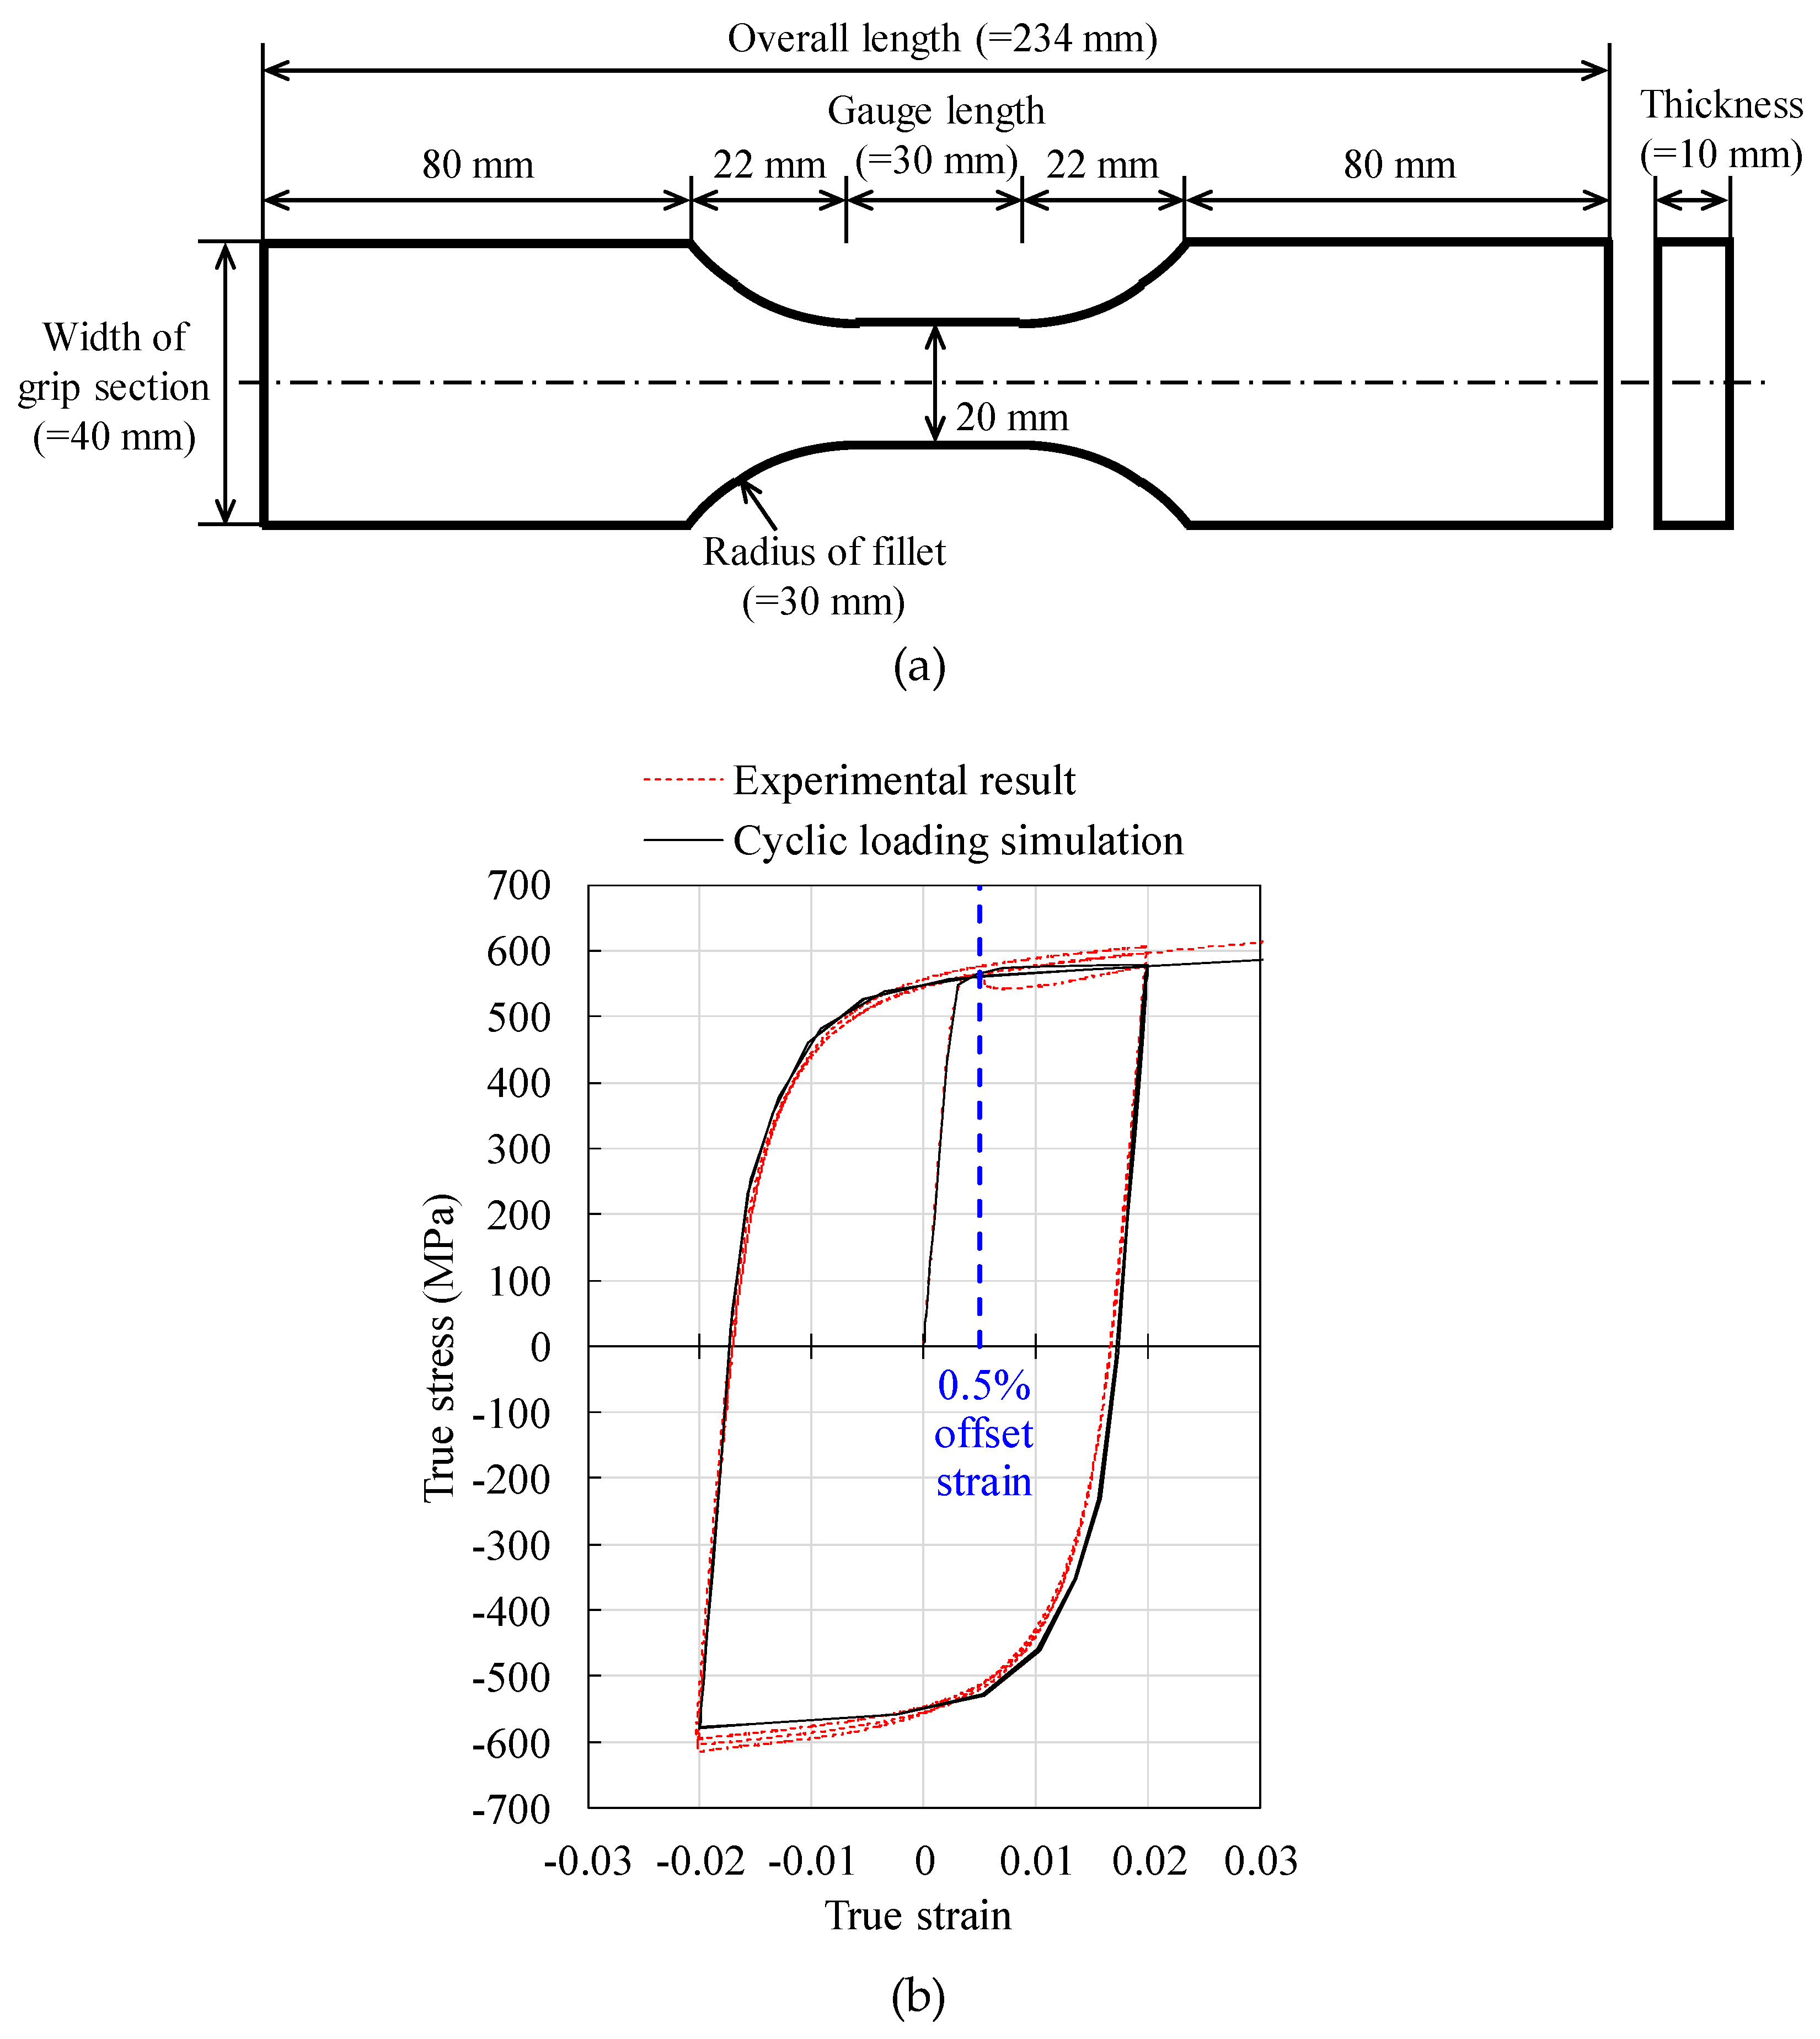
The investigated pipe was constructed of API 5L X70 steel. A dog bone specimen as shown in Figure 1a was taken from the actual steel sheet. A 2% tension-compression-tension cyclic loading test was carried out as shown in Figure 1b. The material coefficients of the Modified Chaboche model were calibrated to the test results using the least-square method combined with a genetic algorithm, as follows: E 0 = 216277.2   MPa , σ 0 = 539.6   MPa , ε p l a   =   0.00957 , E a   =   200000   MPa , ξ = 186.5 , Q = 184.5   MPa , σ a = 379.2   MPa , C 1 = 20535.2 , C 2 = 33855.9 , C 3 = 999.6 , γ 1 = 420.8 , γ 2 = 255.6 , γ 3 = 3.7 , b = 52.7 , and b a = 225.5 .
As shown in Figure 1b, the 2% tension–compression–tension cyclic loading was also simulated using the material coefficients, which was then compared with the experimental results. The experimental results showed a yield plateau after the first yield. After that, the yield plateau disappeared because of the Bauschinger effect, which indicated that the elastic region had shortened. This phenomenon was demonstrated well by the Modified Chaboche model during simulation.
The yield strength was obtained from estimates of a 0.5% offset strain, as suggested by the American Petroleum Institute [12] and is summarized in Table 1 along with the tensile strength. The experimental and simulated results showed slight differences in yield and tensile strengths, but the overall stress–strain relationships showed good agreement in cyclic loading tests, as shown in Figure 1.

3. Simulation of the Roll-Forming Process

3.1. Finite Element Modeling of the Roll-Forming Process

The steel plate was modeled with a shell element in the roll-forming analysis using the commercial finite element analysis software ABAQUS, version 2018 [13]. When the roll-forming process started, the width, the thickness, and the length of the steel plate measured 981.9 mm, 14.6 mm, and 3300.0 mm, respectively. The target geometries of the ERW pipe after the roll-forming were 322.6 mm in diameter and 14.7 mm in thickness based on the information provided by the manufacturer. As shown in Figure 2a, the roll-forming line consisted of 20 roller sets. Each roller set consisted of two rollers placed vertically or horizontally. The specific information of the rollers provided by the company is confidential.
The plate was modeled by a shell element that consisted of uniformly spaced 15 integration points in the thickness direction. The thickness of the steel plate was modeled at both longitudinal edges, as shown in Figure 2b to simulate the contact of two edges. That is, in the last roller set of the roll-forming process, both ends of the steel plate met, as shown in Figure 3a. It was assumed that both ends were not separated and had not slipped once they had made contact. As shown in Figure 2b, the center line was fixed for the transverse displacement, and the front edge was fixed in the longitudinal direction.
Apart from the actual roll-forming process, the roller sets were moved instead of moving the steel plate. All rollers were modeled with a rigid body. The contact condition of elastic slip was established between the steel plate and the rollers, so that penetration between the steel plate and the rollers was not allowed. The friction coefficient between the steel plate and the rollers was assumed to be 0.15 by considering the type of lubricants used and the moving speed and surface roughness of the rollers [14,15].

3.2. Shape Changes During Roll-Forming

Figure 3a shows the roll flower, which demonstrates the configuration of the plate cross-section as it passes each roller, at the mid-point of the pipe. Deformation of the plate began at the ends and gradually became circular to form a closed cross-section at the last roller set.
After the roll-forming, the cross-section of the pipe was not perfectly round. The out-of-roundness, conventionally called ovality, is defined by Equation (6).
O v a l i t y = O D m a x . O D m i n . O D a v g .
In Equation (6), ODmax., ODmin., and ODavg. are the maximum, minimum and average outer diameters, respectively. The outer diameters were measured using 20 outer radii at equal intervals of 18 degrees at the center-section. The ovality was 2.61%, which is within the range of practice.

3.3. Variations in the Circumferential Stress During Roll-Forming

Variations in the circumferential stress evaluated opposite and 90 degrees from the weldment of the center cross-section along the longitudinal direction of the pipe are shown in Figure 3b,c. At both measurement locations, the outermost and innermost layers were under tension and compression, respectively, and the stress was gradually stabilized as it passed through the rollers. Amplitudes of the circumferential stress of the outermost and innermost layers were larger than that of the neutral layer.
At first, circumferential stress was only reversed until passage through the second roller set compared with passage through the remaining roller sets, because the plate was reversely bent at the beginning of the roll-forming, as shown in Figure 3a. After that, the stress history showed repetitive fluctuations, but unlike the values at 90 degrees, abrupt changes in stress were observed at the opposite line of the weldment following passage through roller set no. 12. This was because the steel plate was not completely in contact with the surface of the lower roller, and reverse bending occurred momentarily in the empty space between the steel plate and the lower rollers. When passing roller set no. 20, the ends of the steel plate met, and the cross-section of the pipe was closed resulting in a large amount of compression along the circumferential direction at both measurement locations.
Residual stress after the roll-forming reached 87% of the yield strength, which was 564 MPa. Regardless of the evaluating position, tensile and compressive residual stress occurred in the outermost and innermost layers, respectively.

4. Simulation of the Sizing Process

4.1. Sizing Process

The sizing process was primarily aimed at improving the ovality after the welding and was conducted by compressing the pipe in a circumferential direction, which led to a reduction in the outer diameter. The reduction in the outer diameter during the sizing process is expressed by the sizing ratio, which is a manufacturing variable of ERW pipes, as defined in Equation (7). A sizing ratio of 0.3% to 1.2% is generally applied in practice.
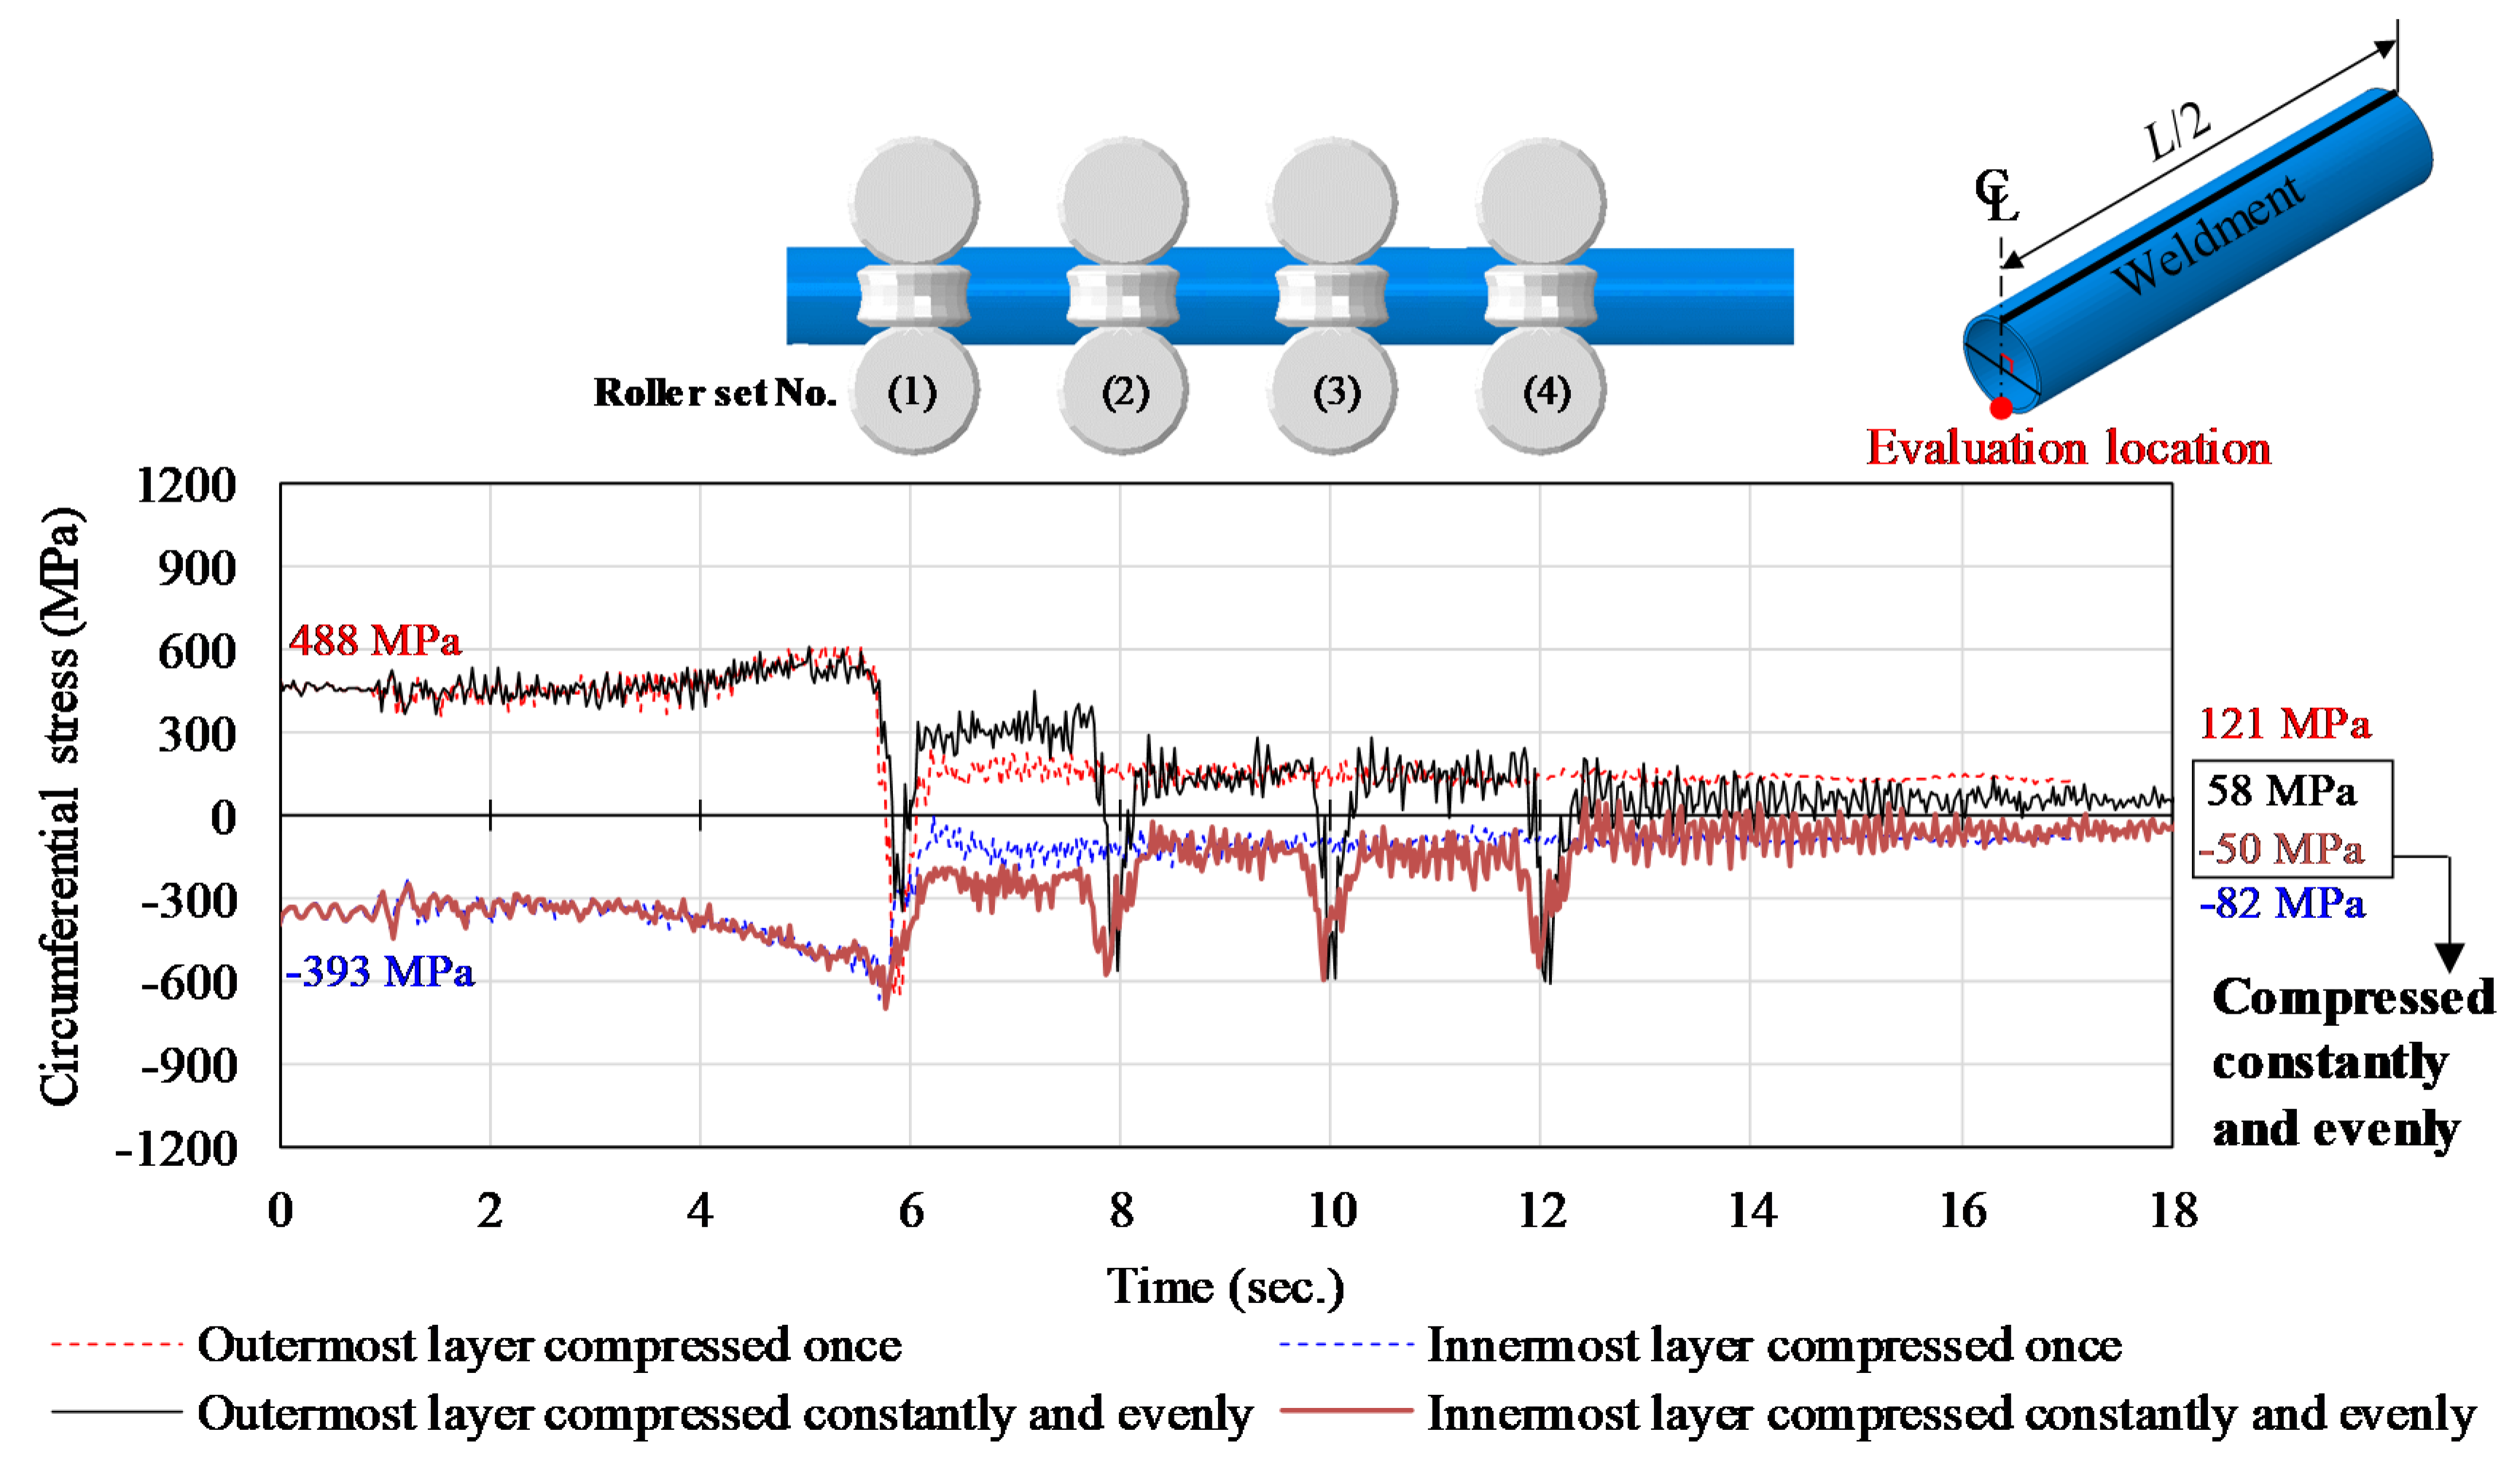
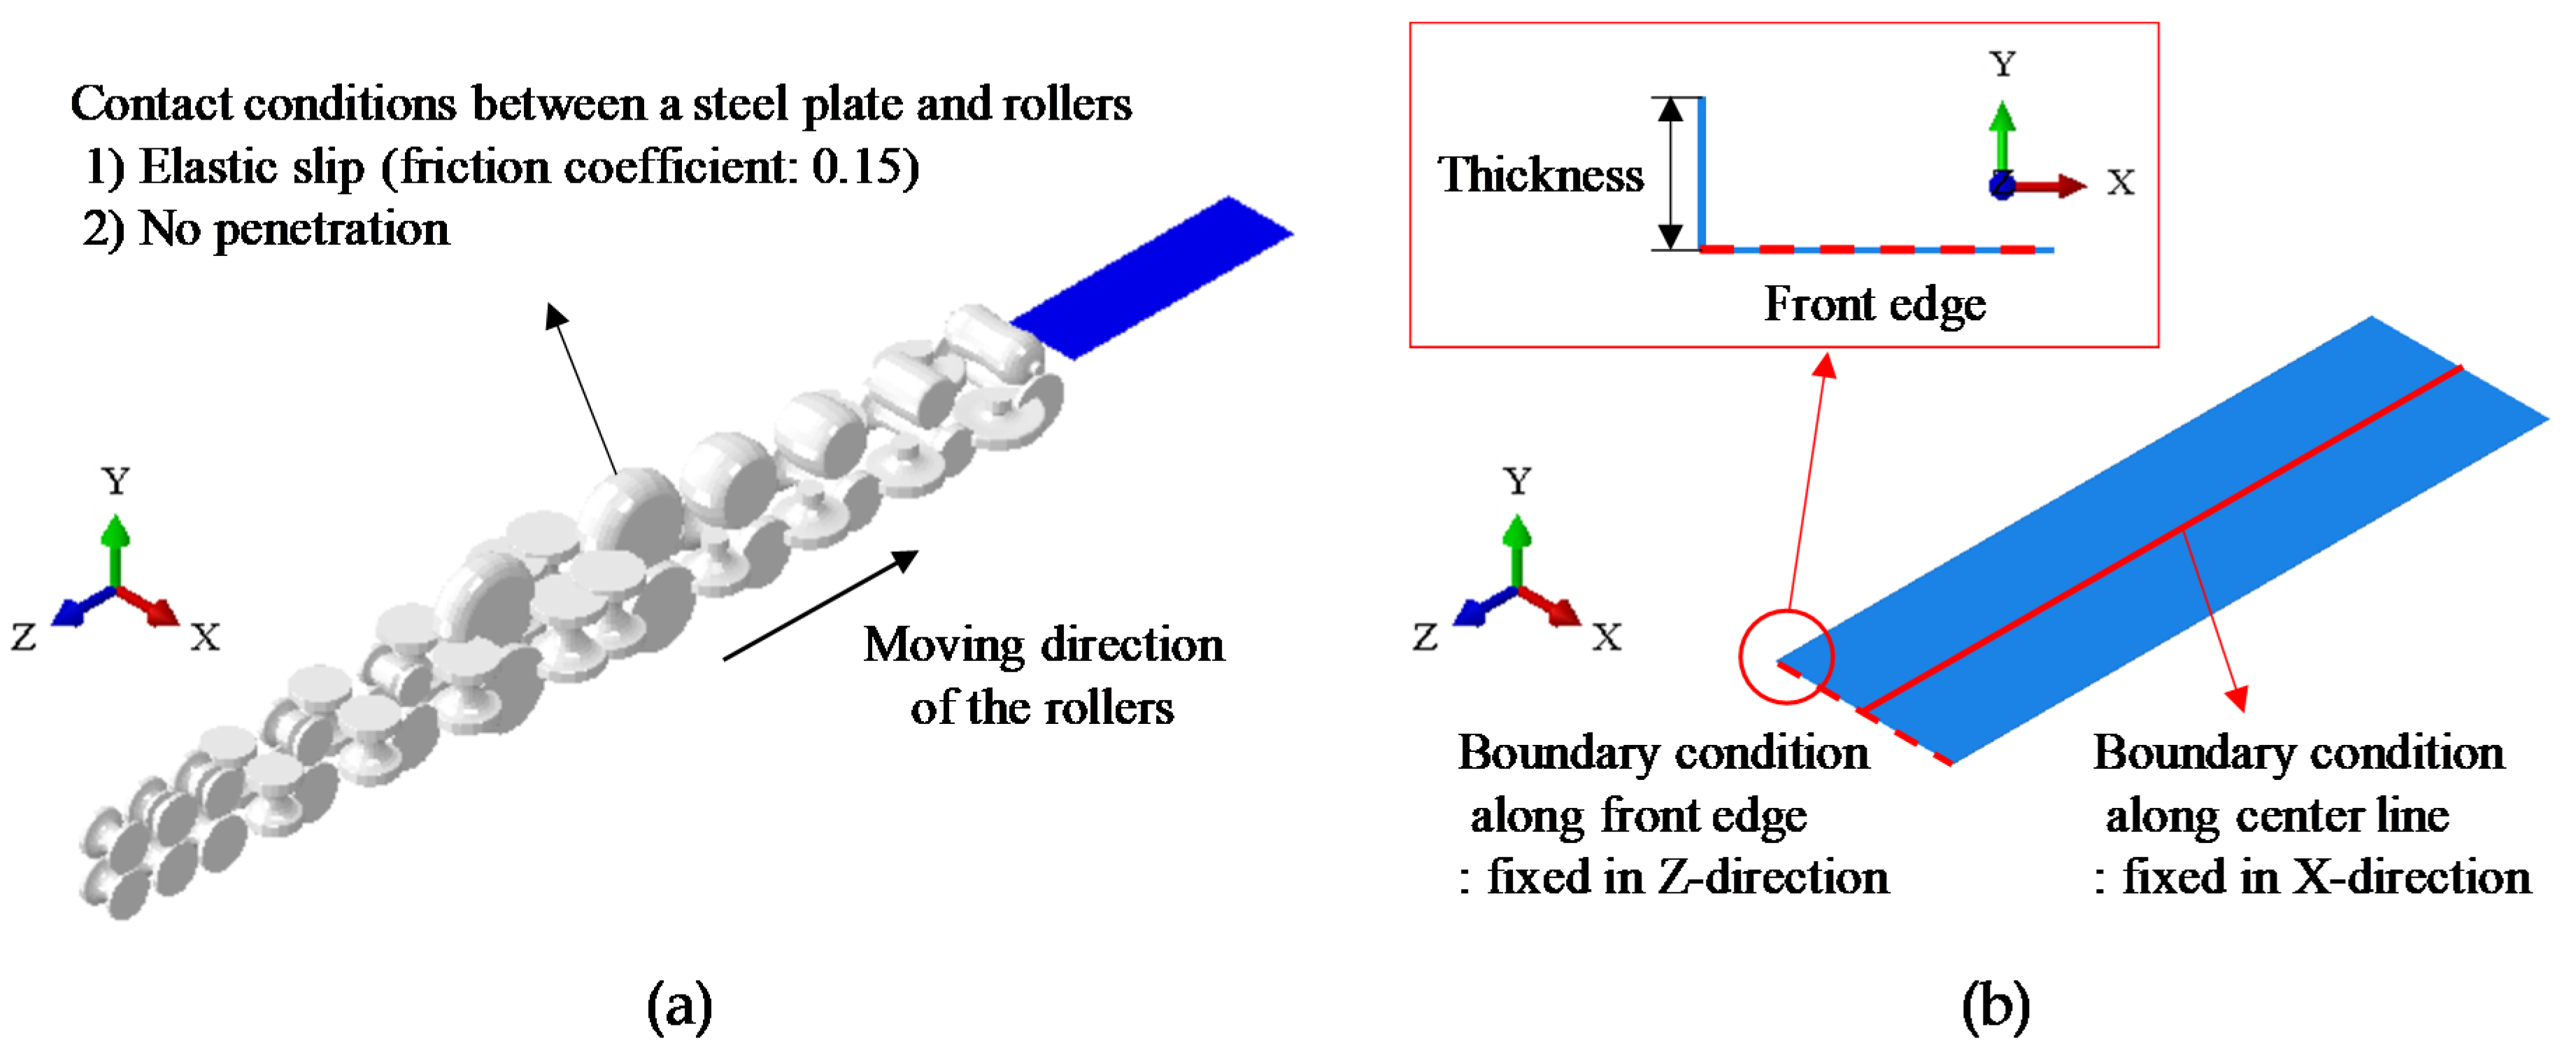
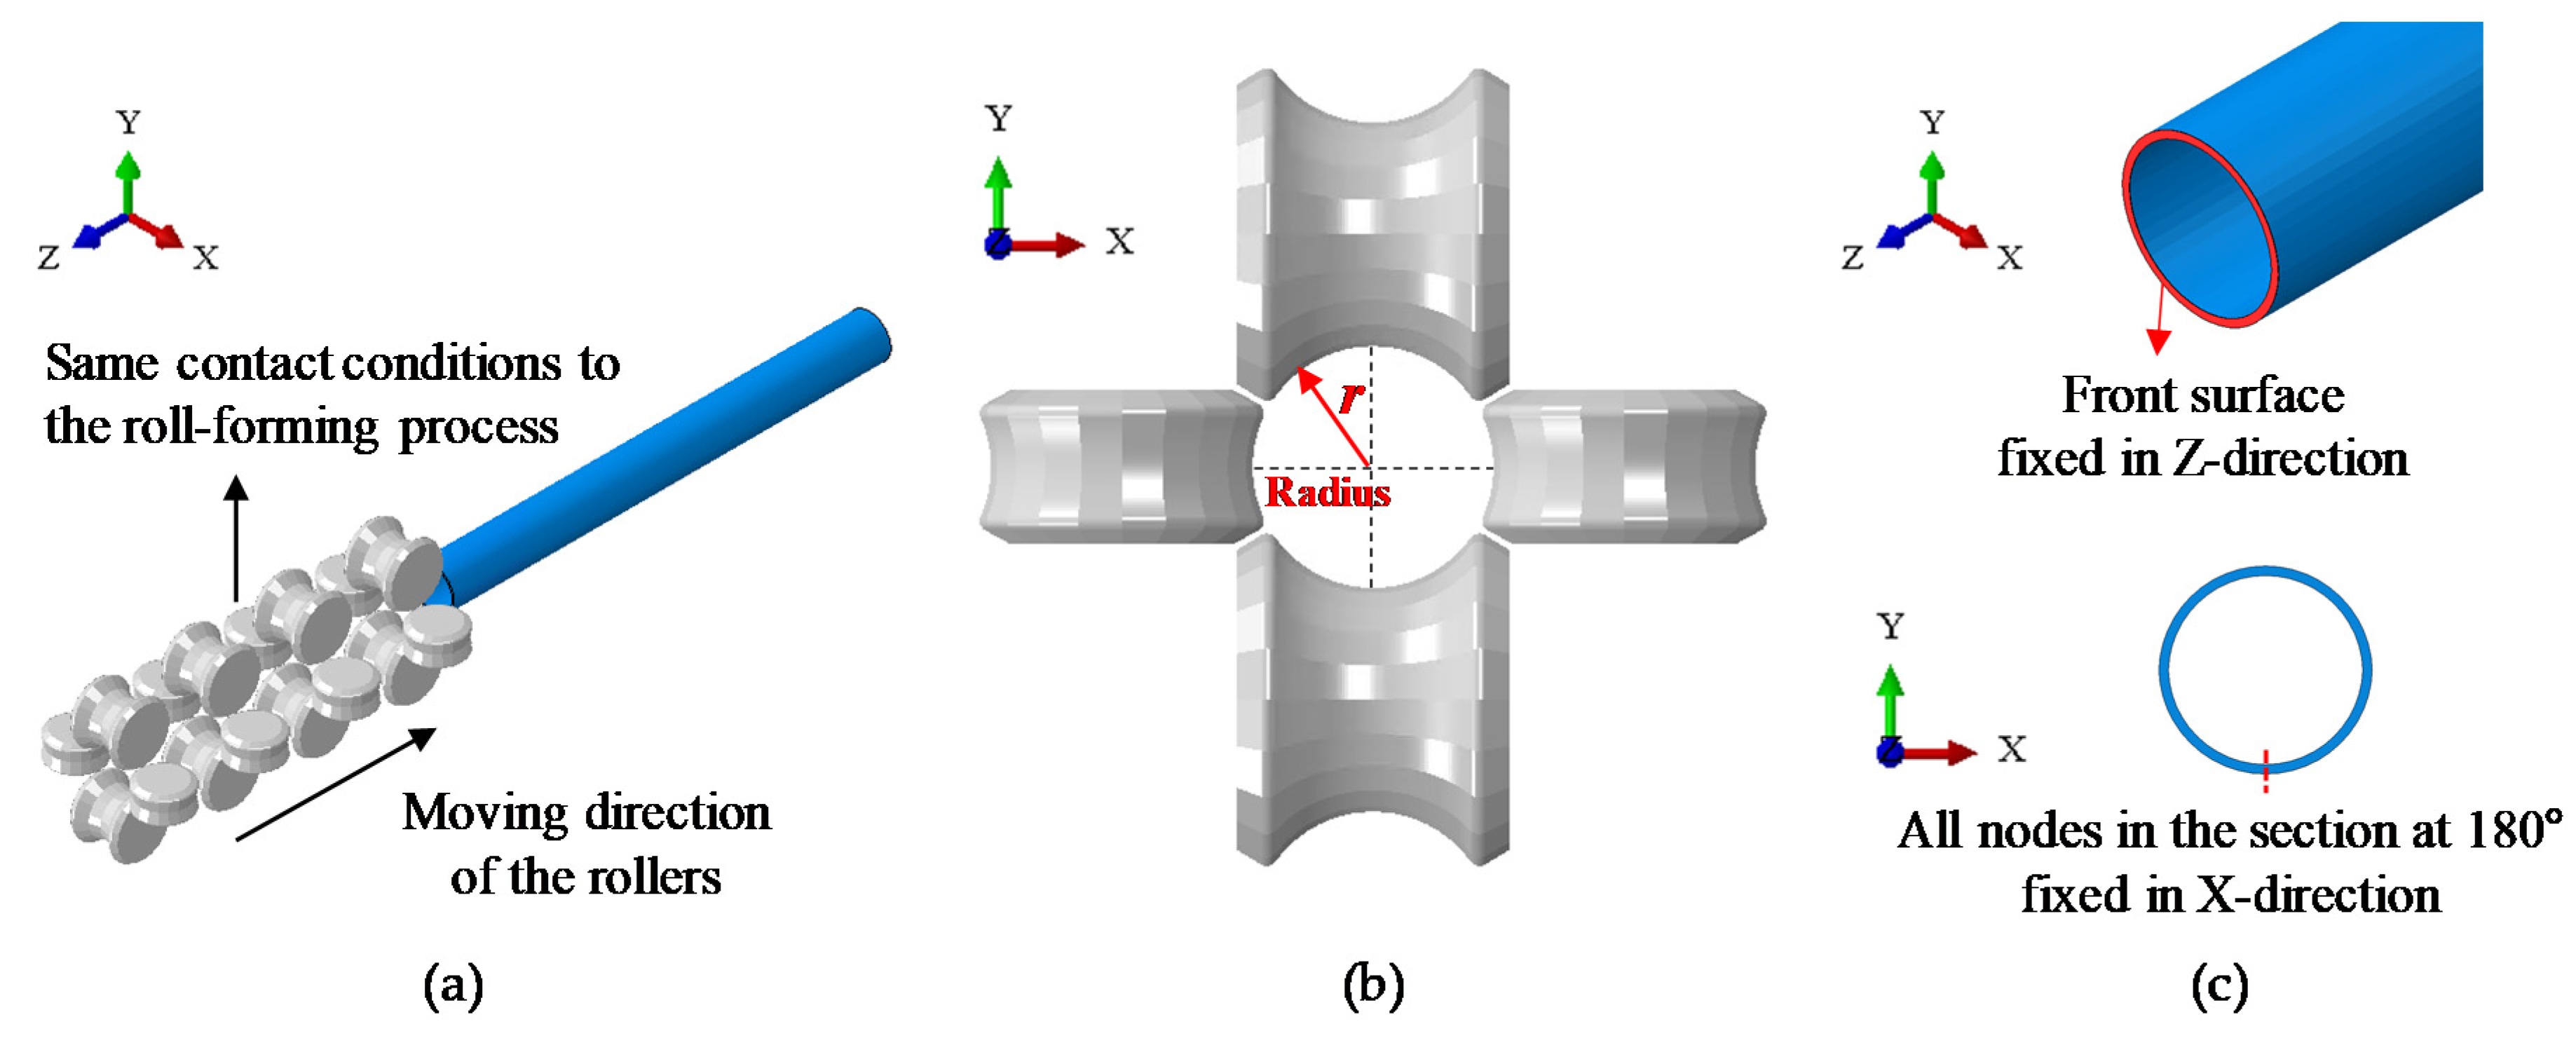
s i z i n g   r a t i o   =   O D b e f o r e   s i z i n g O D a f t e r   s i z i n g O D b e f o r e   s i z i n g
As shown in Figure 4a, the sizing line consisted of four roller sets. As shown in Figure 4b, one roller set consisted of four rollers and created a circular space of radius r through which the pipe could pass.

4.2. Finite Element Modeling of the Sizing Process

The pipe was modeled using a solid element that incorporated eight nodes with linear and reduced integration with an isoparametric formulation, which is referred to as C3D8R in ABAQUS. Seven layers of elements were applied through the thickness direction. The cross-section was composed of 48 elements in the circumferential direction per layer, and the pipe consisted of 156 elements in the longitudinal direction, which resulted in a total of 52,416 elements.
To maintain a continuity of the analysis between the roll-forming and the sizing, simulation of the sizing process was performed to reflect the roll-forming results. However, it was difficult to assign all residual stress obtained from the roll-forming process as initial values throughout the pipe during the sizing process. Since the magnitude of the residual stress along the opposite line of the weldment were greater than that along a line 90 degrees from weldment, the residual stress along the opposite line of the weldment after the roll-forming were assigned to the entire pipe in order to simulate the sizing process. In order to consider distribution of the residual stress in the thickness direction, among the 15 integration points of the shell element (i.e., 1st to 15th integration point from the outermost layer), the residual stress at seven uniformly spaced integration points (i.e., 2nd, 4th, 8th, 10th, 12th, and 14th integration points) were assigned to the seven layers of the solid element, respectively. In the same way, both accumulated plastic strain and kinematic hardening terms, which can simulate the Bauschinger effect accumulated during the roll-forming, were also taken into consideration as initial values for the sizing analysis.
The configuration of the pipe obtained at the end of the roll-forming process was imposed as the initial condition in further analysis. Instead of imposing the exact configuration of the pipe, the elliptical shape of the pipe’s cross-section was assumed to represent simple ovality. The maximum and minimum diameters of the center section after roll-forming were assigned as the lengths of the major and minor axes of the ellipse, respectively. The length of the pipe was 10 times longer than its diameter, as shown by roll-forming analysis. The rollers were moved instead of the pipe and the front surface and the bottom center line of the pipe were fixed in the z- and x- directions, respectively, as shown in Figure 4c. The same contact conditions of the roll-forming analysis were assigned between the pipe and the rollers.

4.3. Sizing Ratio

The target sizing ratio was simulated by adjusting the r of the rollers, as defined in Figure 4b. To achieve the target sizing ratio, two distinct procedures were considered for the application of compression. One procedure involved compressing the desired sizing ratio at the first roller set while the remaining three roller sets stabilized the pipe following compression. Another was to compress the pipe evenly over the four roller sets, which was more realistic. The target sizing ratio of the FE model was set to 0.5%, and trial-and-error revealed the r of the first roller set to be 159.6 mm, and that of the 2nd, 3rd, and 4th roller sets to be 160.3 mm. For constant and even compression, the r of the first roller set was set at 160.2 mm, which was gradually reduced by 0.13% for consecutive roller sets.

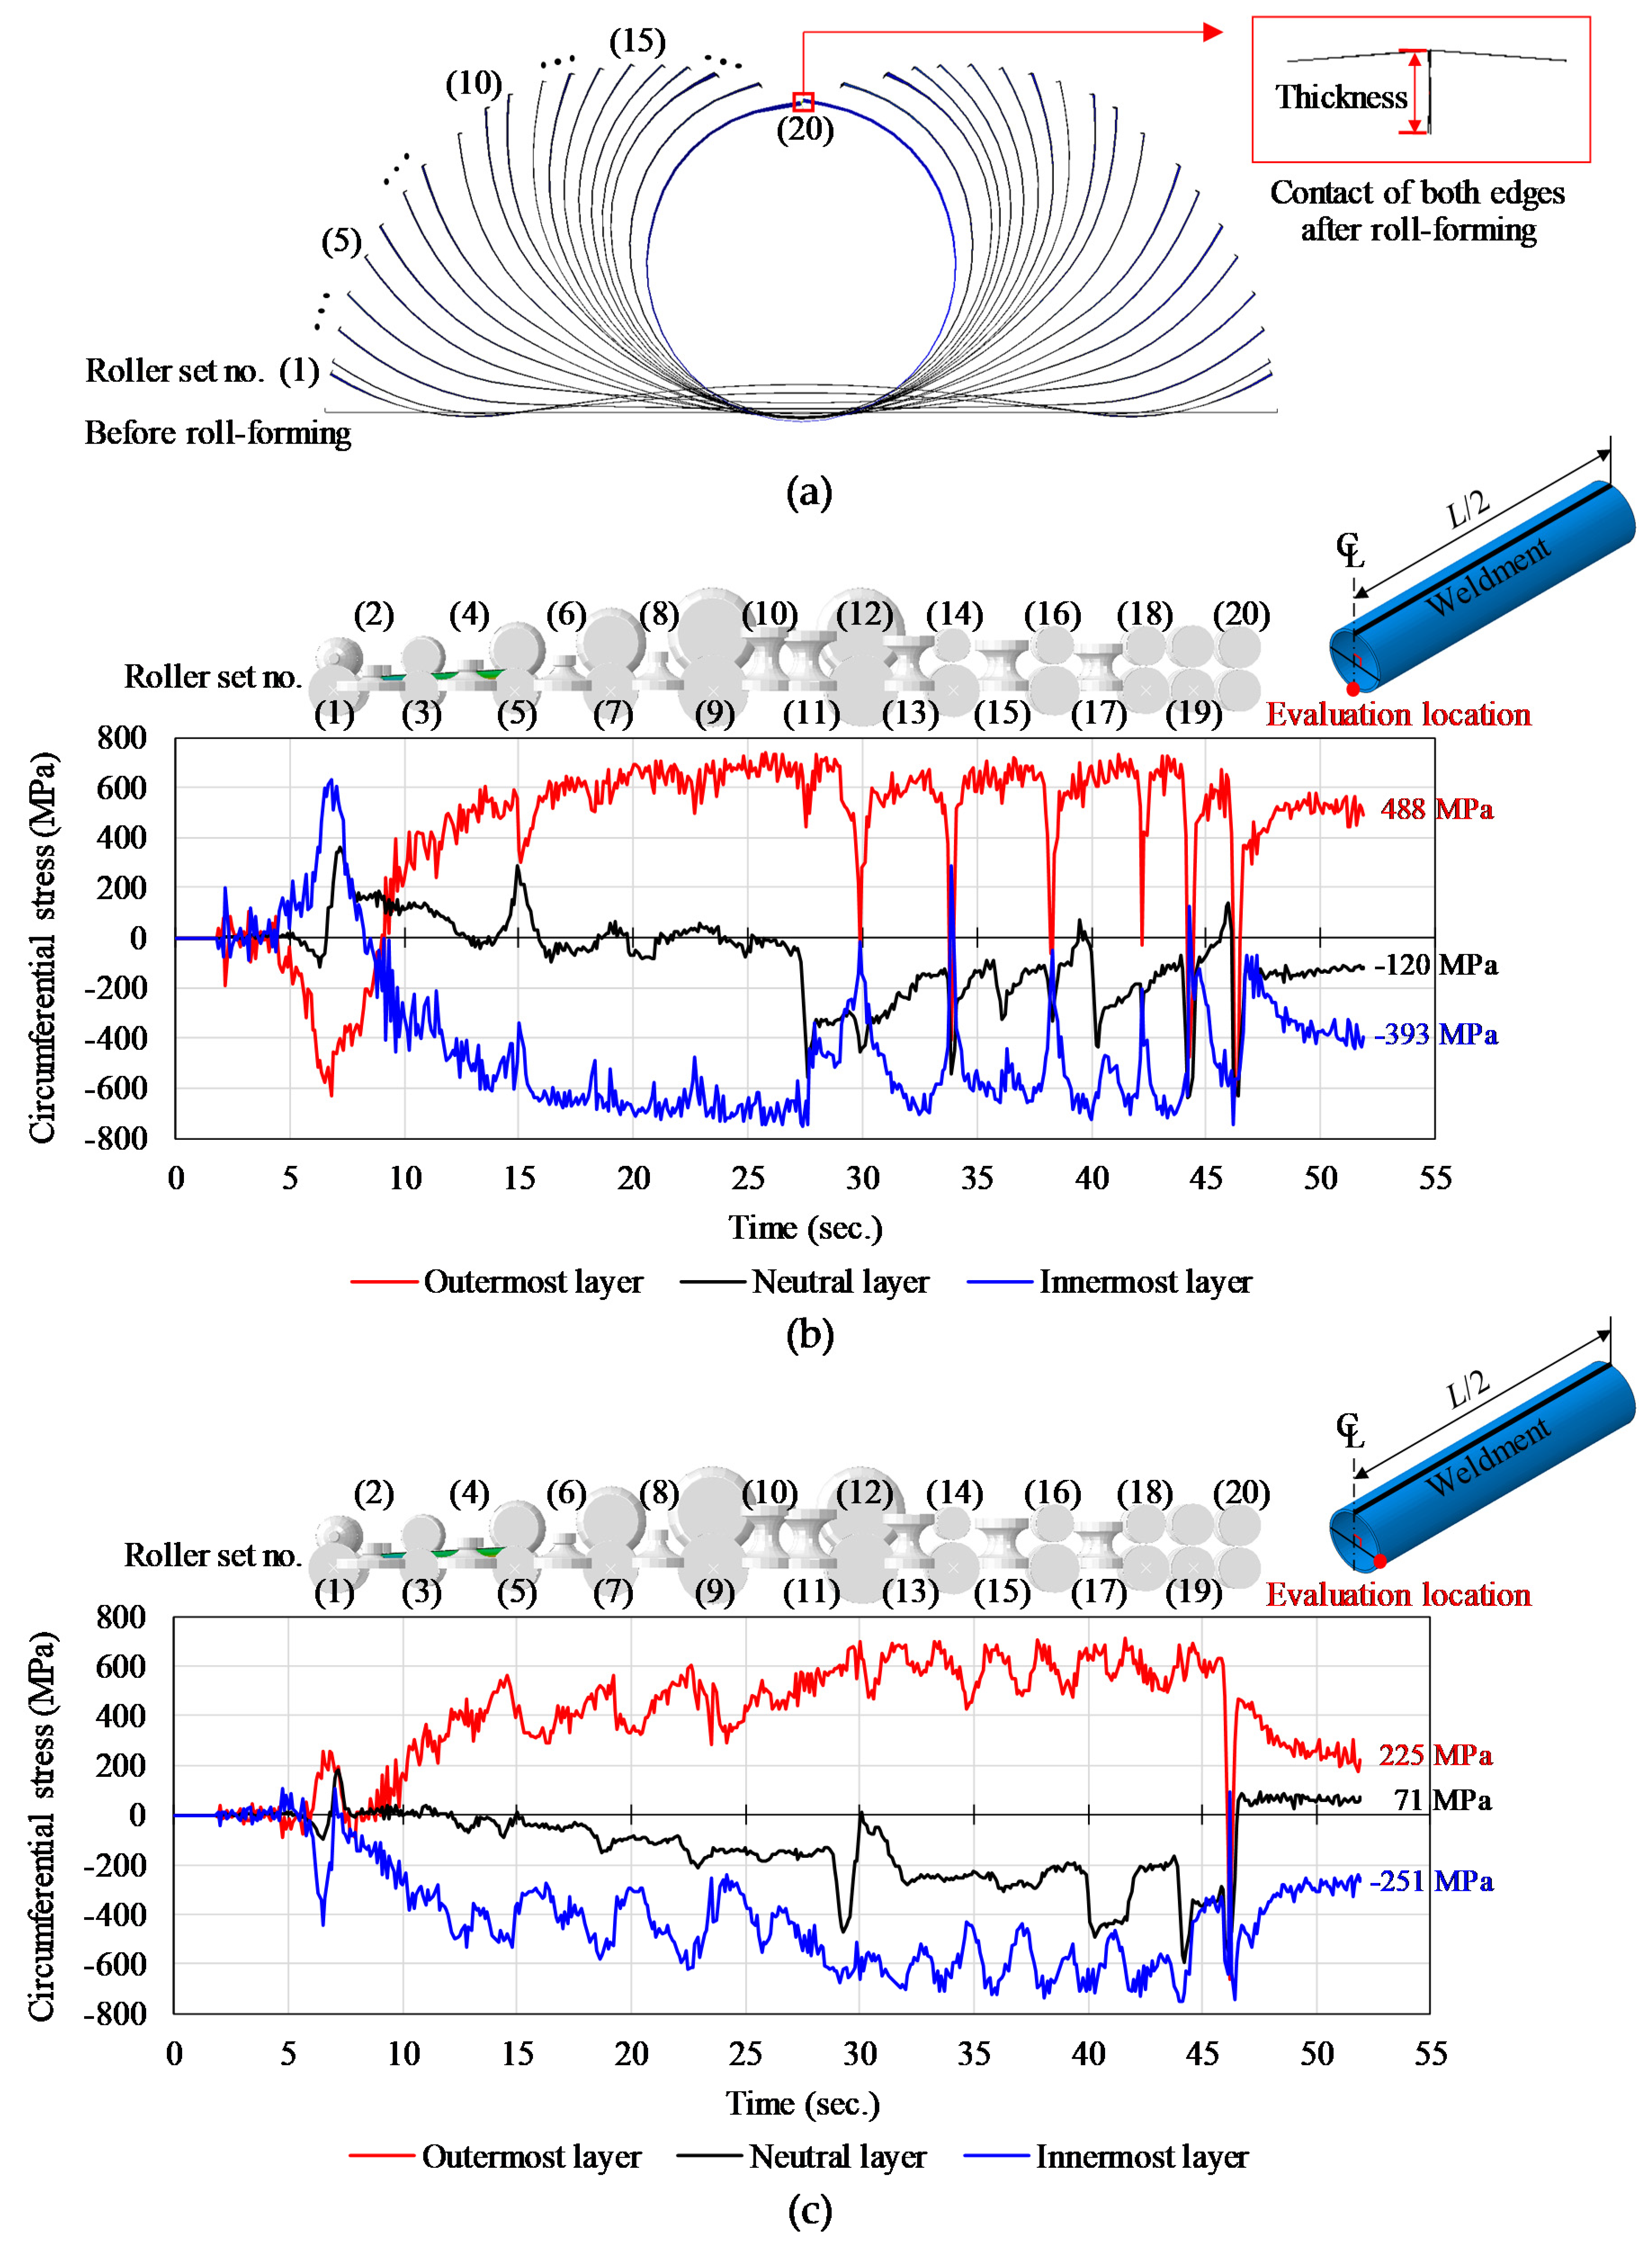
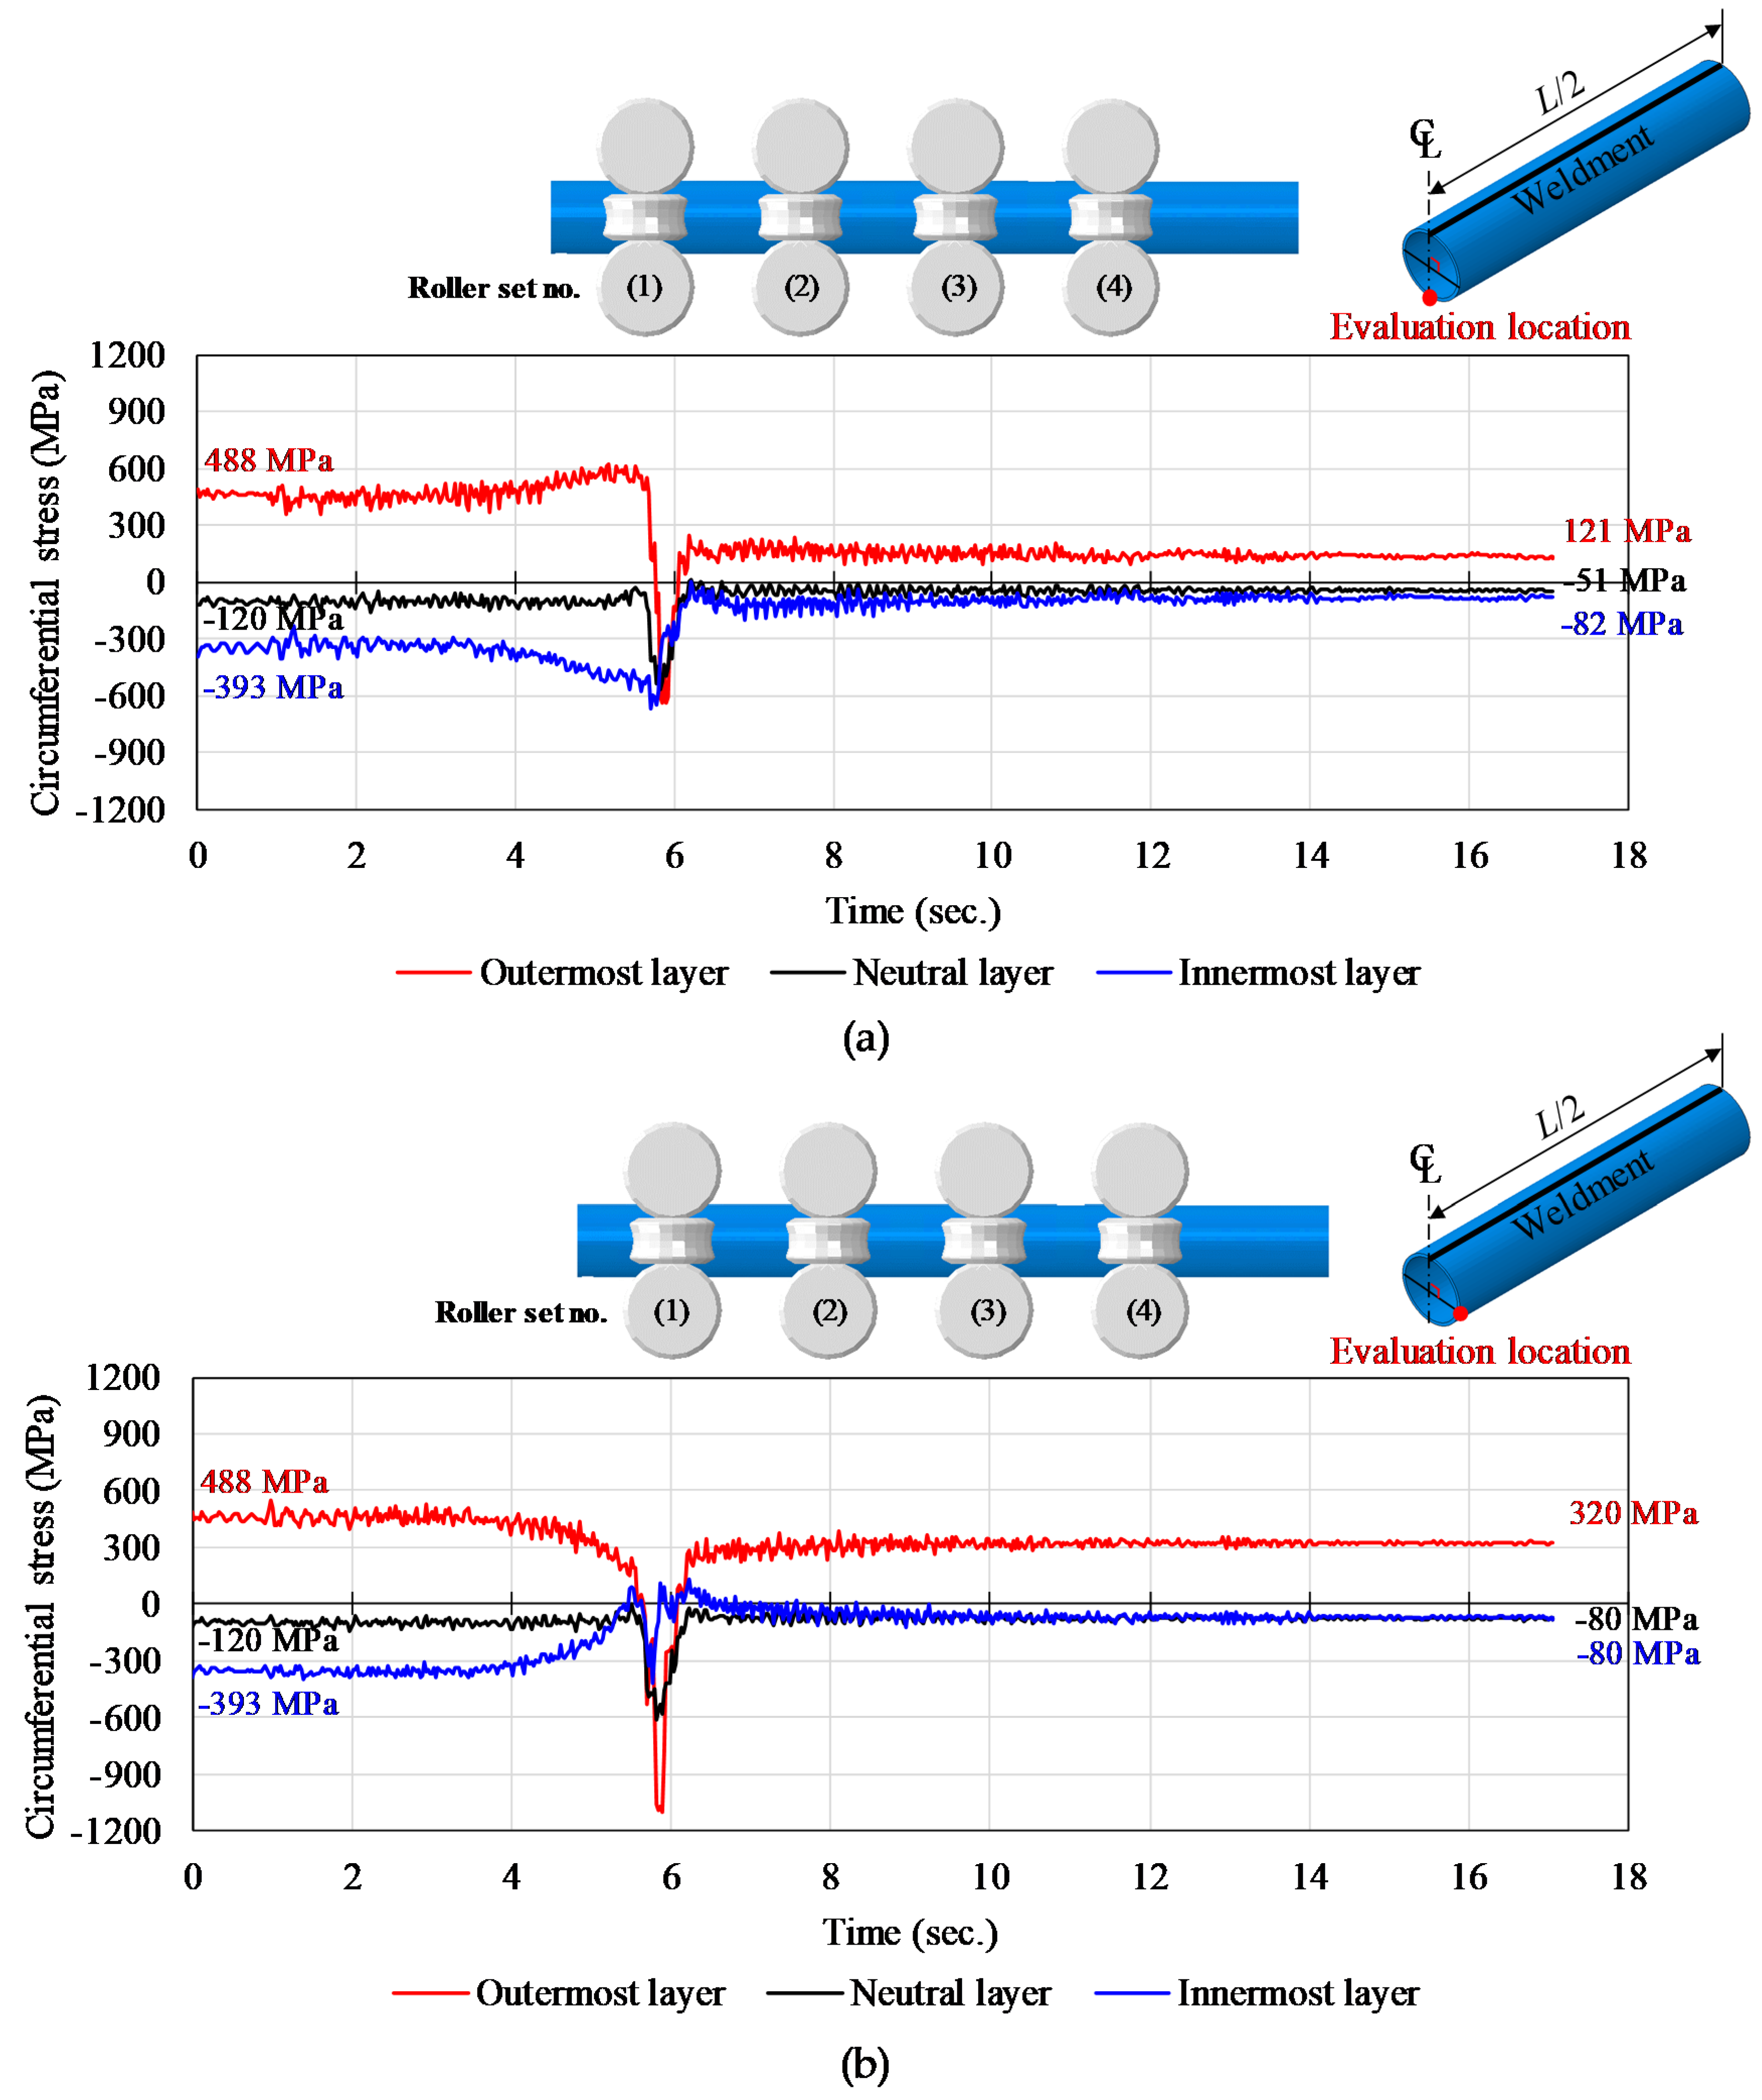
4.4. Variations of Circumferential Stress During Sizing

Figure 5 shows the variations of the circumferential stress during sizing when compression was applied to the first roller set. Before passing through the first roller set, the tensile and compressive stress gradually changed when the elliptical cross section of the pipe was changed into a circular shape. Compression was applied when the pipe passed through the first roller set. Due to the initial elliptical configuration of the pipe cross-section, the compression in the outermost layer at 90 degrees was greater than that of the layer at 180 degrees. After the compression, a springback resulted in stress relief at the outermost and innermost layers leading to stress reduction after the sizing process. It was not evident that the remaining three roller sets contributed to the change in circumferential stress. On the other hand, as shown in Figure 6, all roller sets contributed to reducing the circumferential stress when compression was applied constantly and evenly. Thus, the stress levels in the outermost and innermost layers were gradually reduced, which resulted in a smaller level of residual stress.

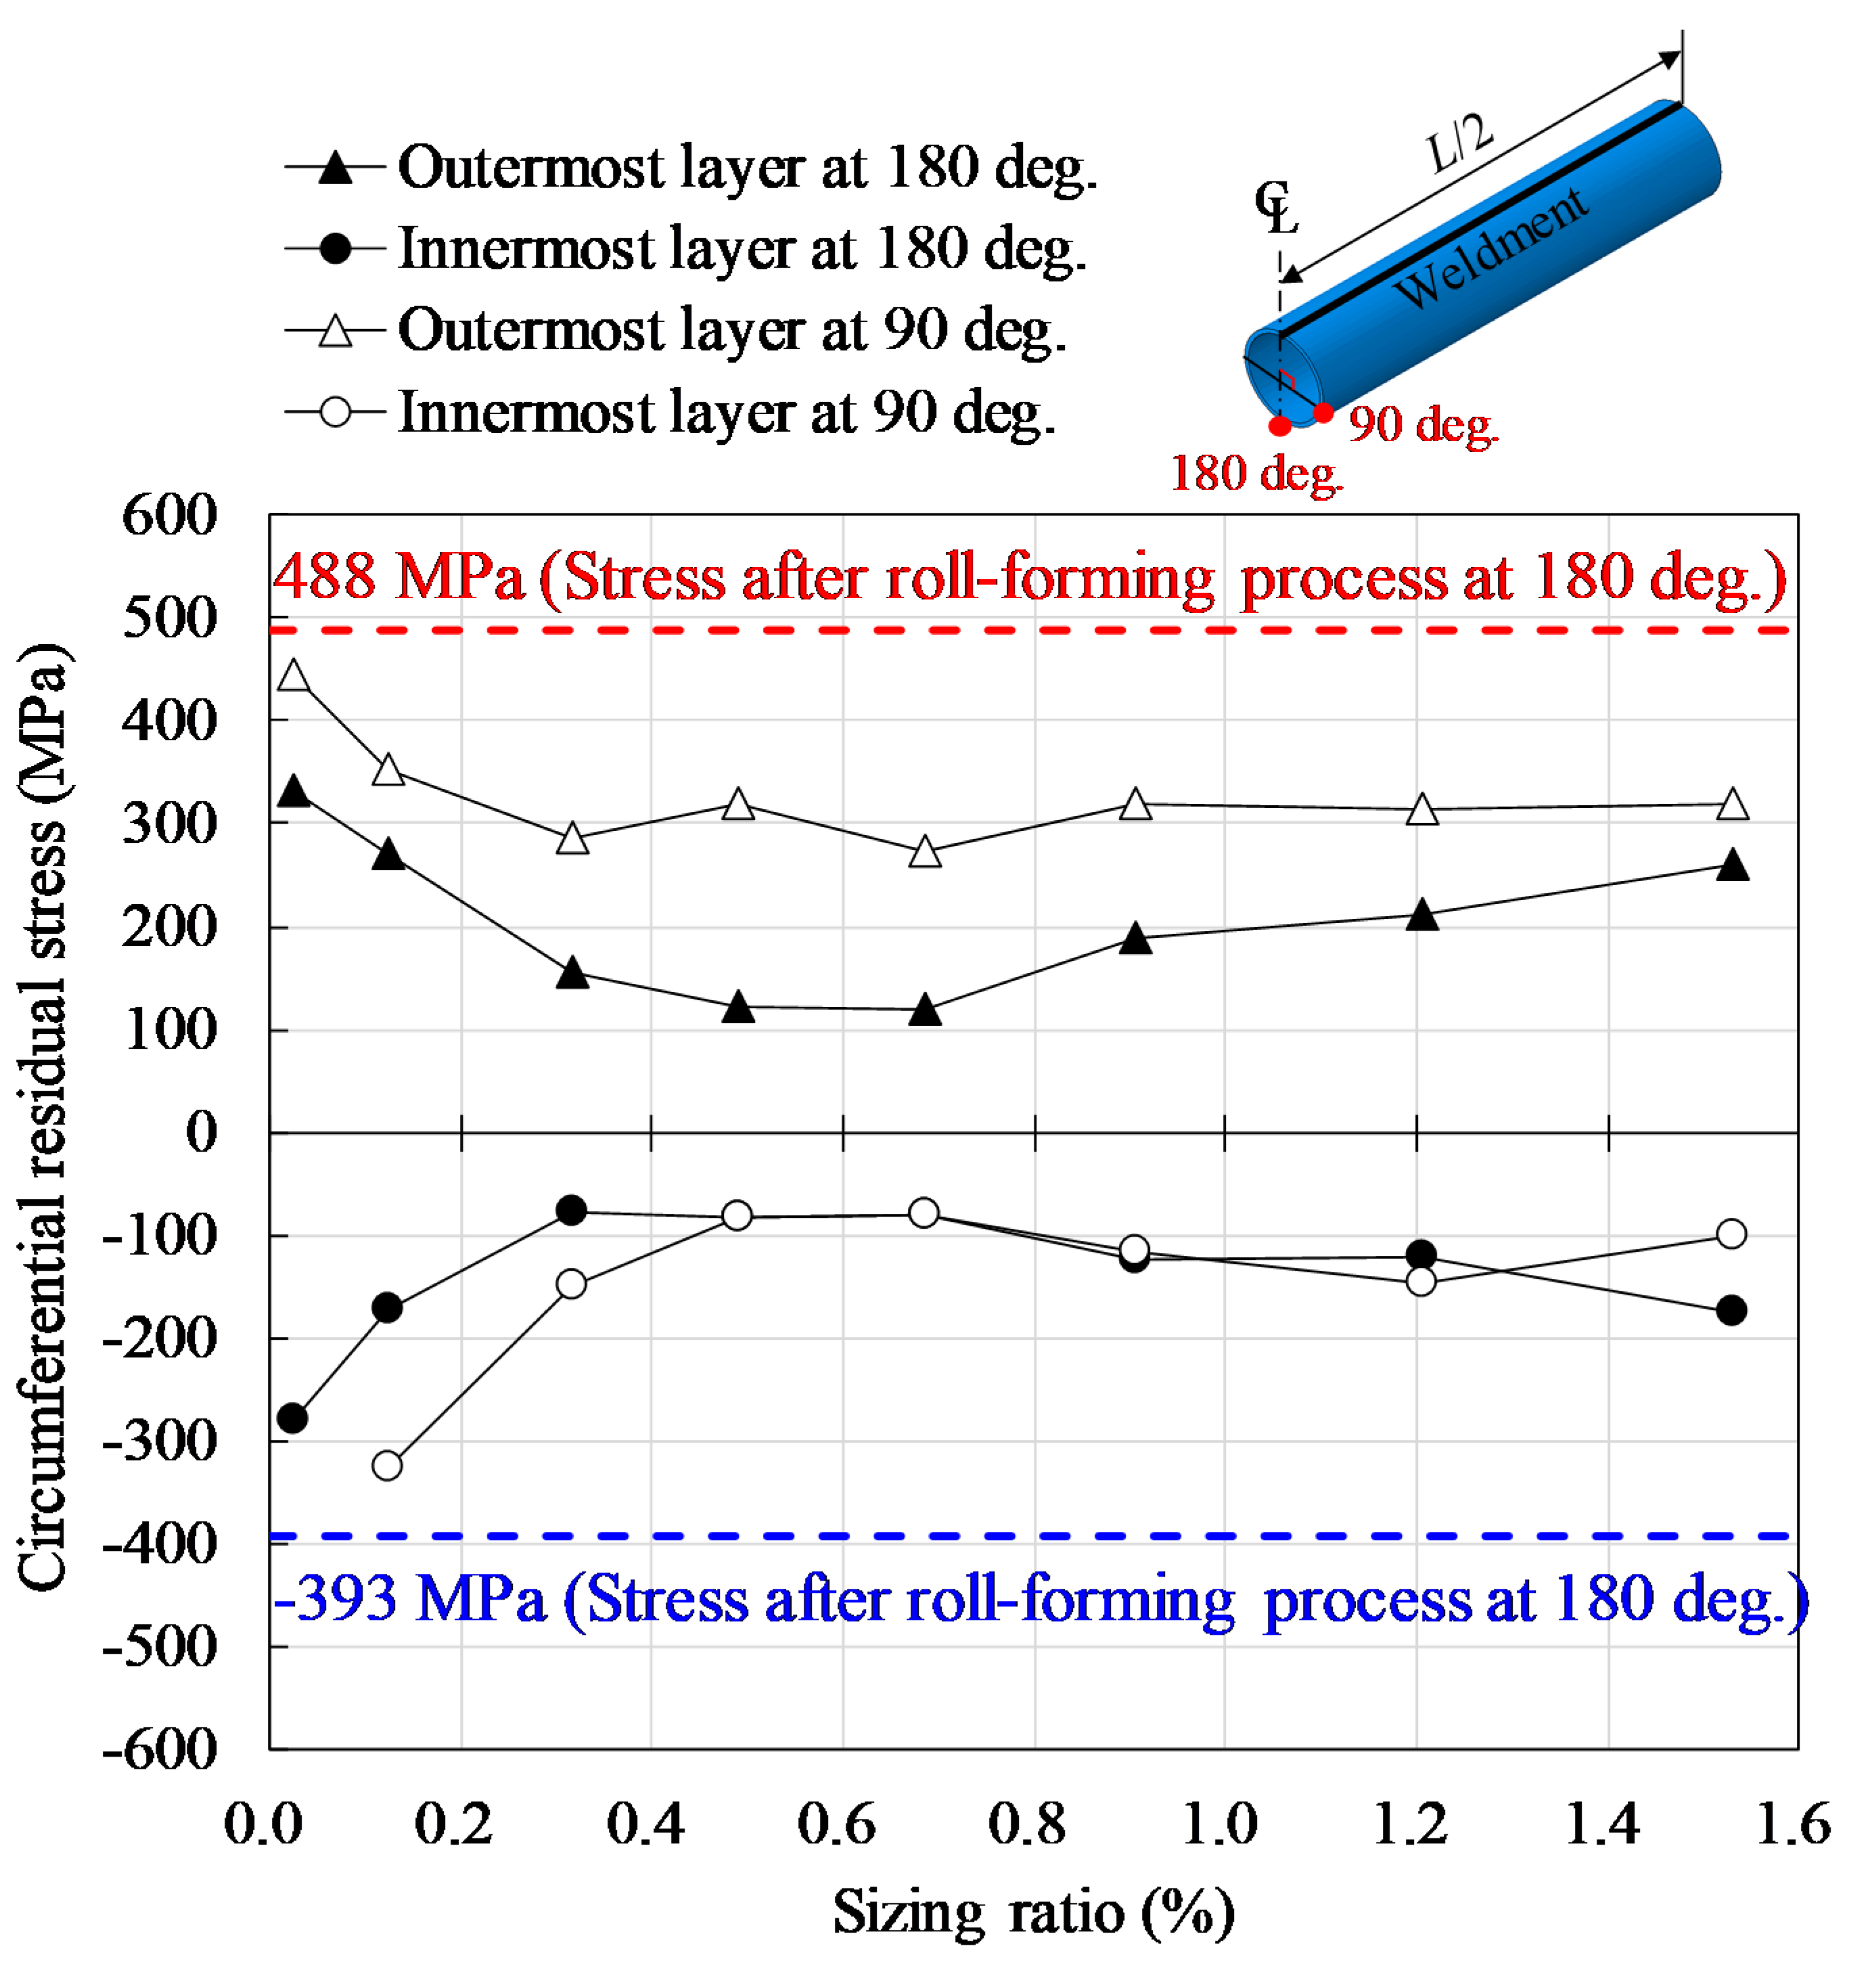
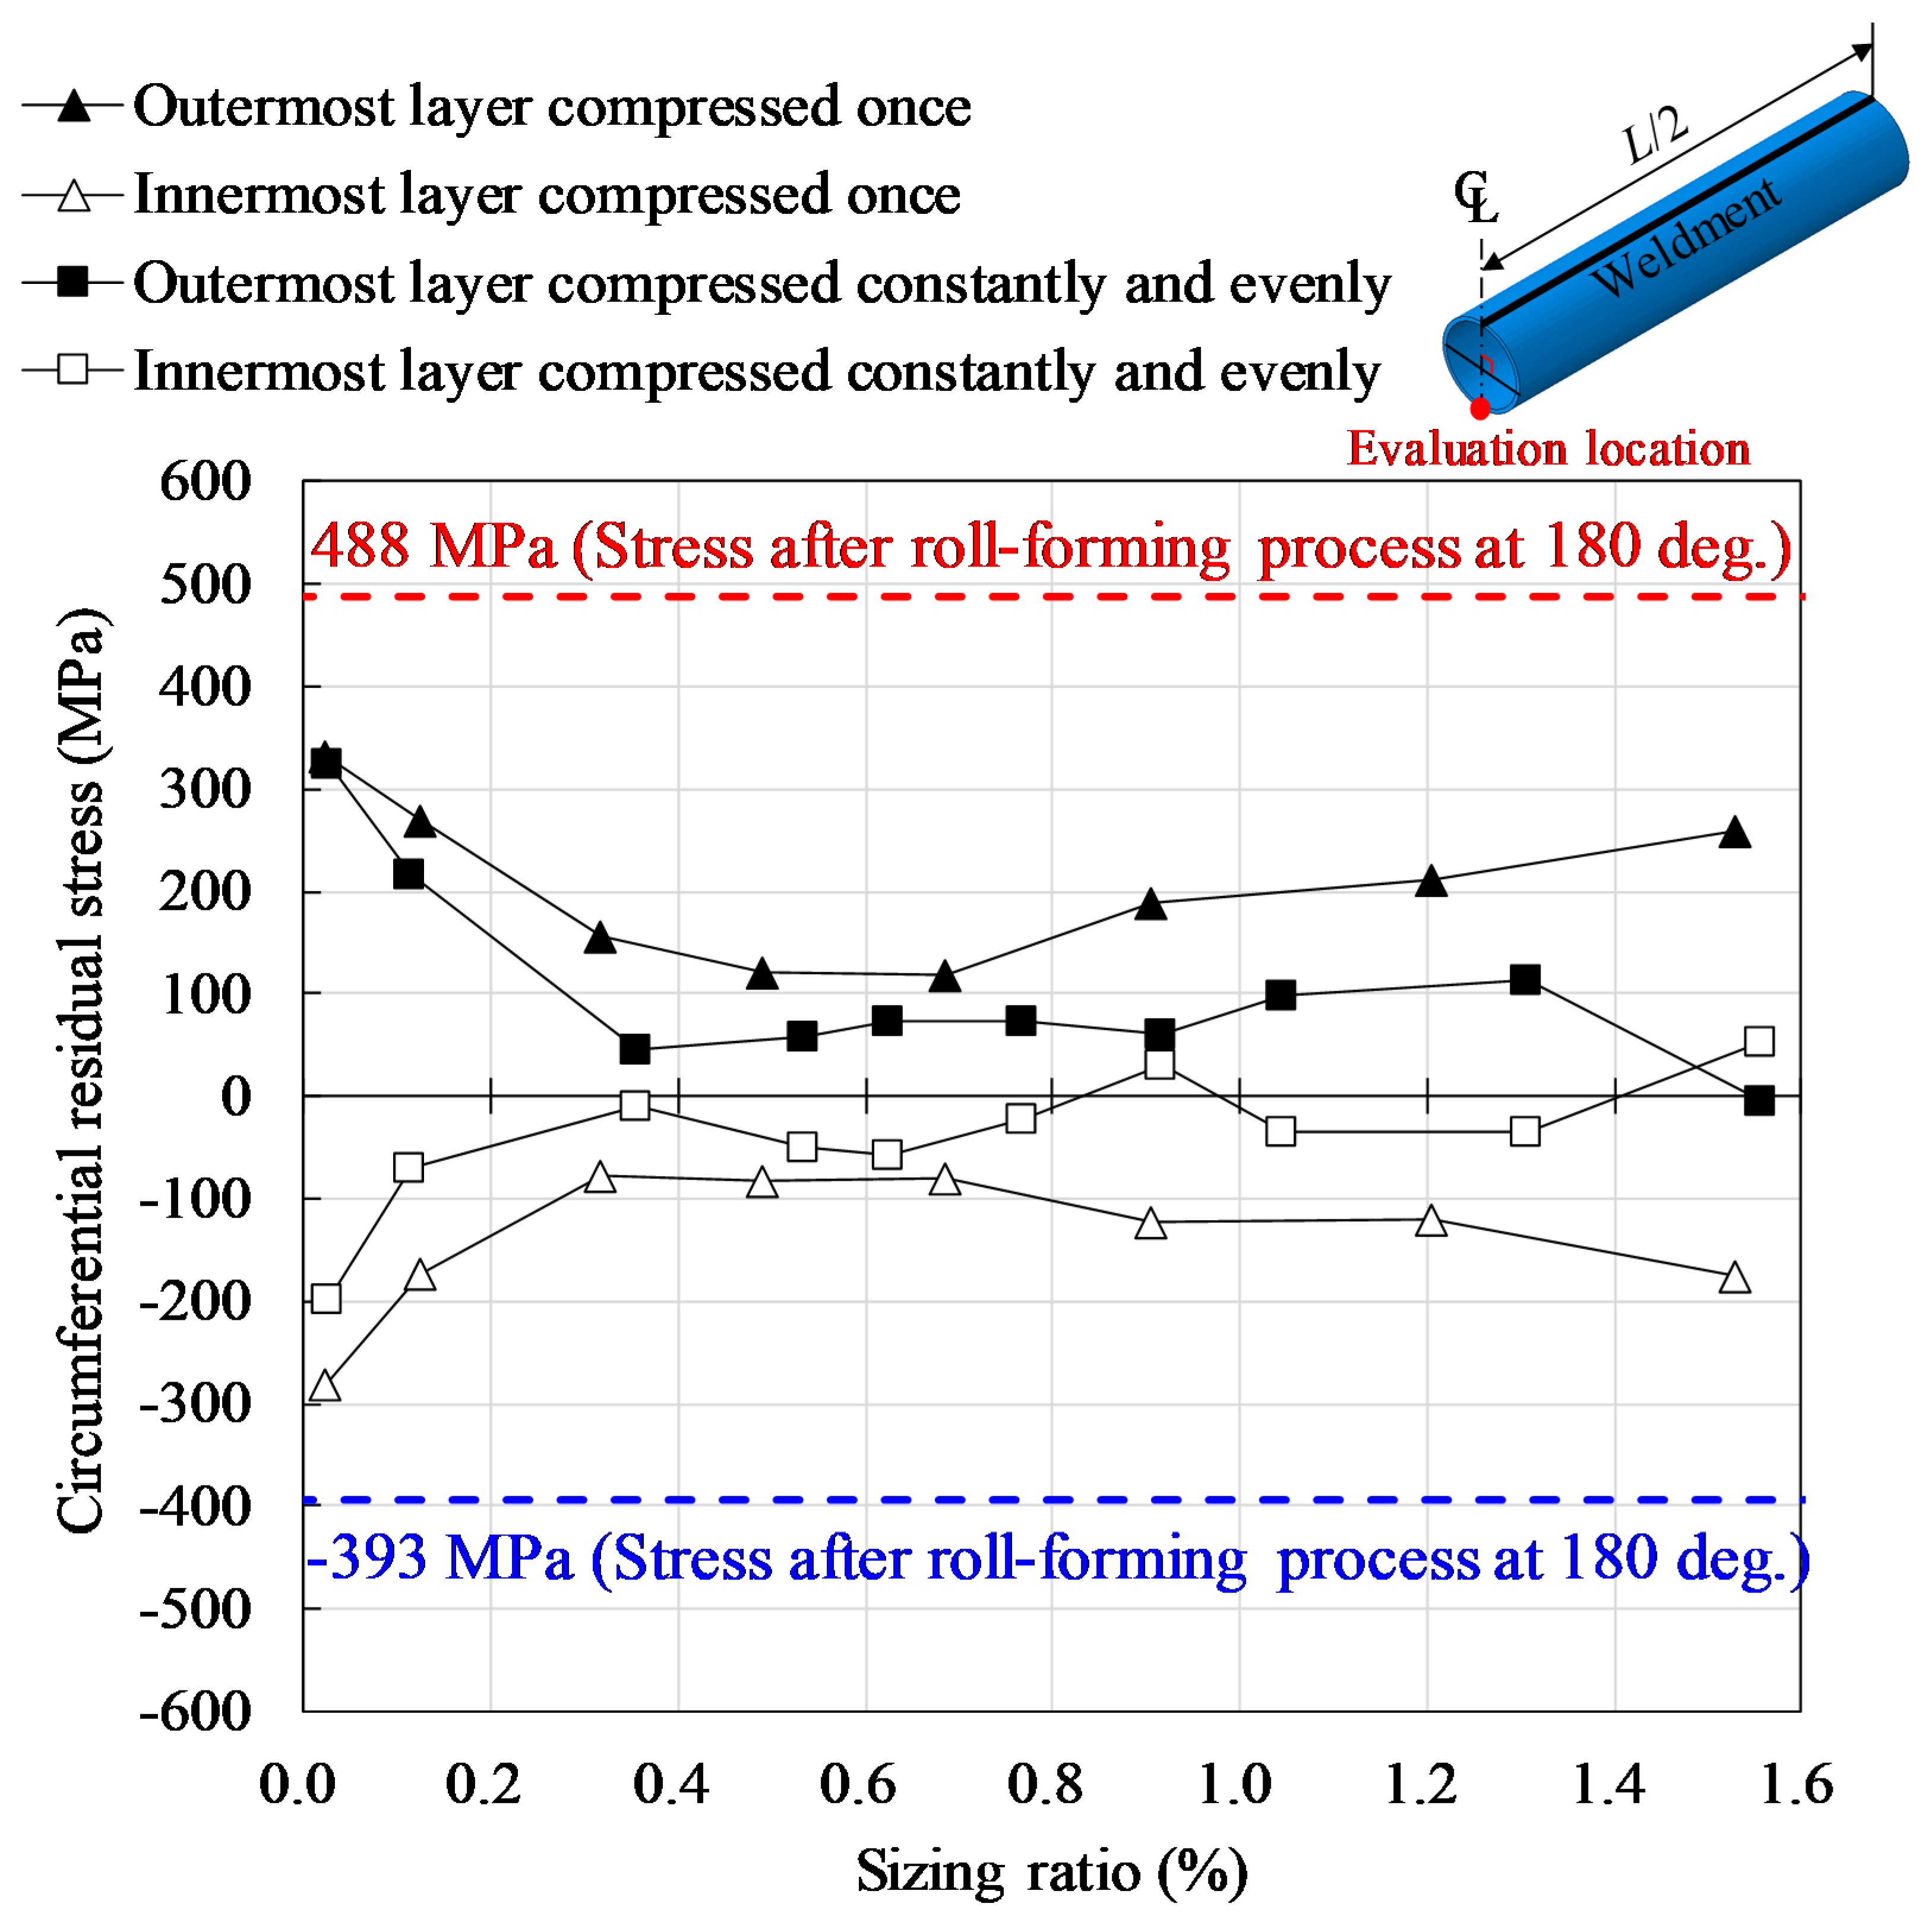
4.5. Dependency of Residual Stress on the Sizing Ratio

Since a large amount of compression was applied during sizing, the residual stress could have been affected by the sizing ratio. Parametric study was conducted for a practical range of sizing ratios in order to examine the effect that the sizing ratio exerted on the residual stress. Seven target sizing ratios were applied, as shown in Figure 7. The results clearly show that sizing reduced the residual stress. Residual stress in the outermost layer was smaller at the line opposite the weldment regardless of the sizing ratio. On the other hand, no significant difference was observed at the innermost layer between two measurement positions, when the sizing ratio was greater than 0.5%. Therefore, the effect of the sizing ratio was apparent at the opposite side of the weldment. Moreover, the reduction effect of the residual stress was different not only according to the sizing ratio but also according to the sizing methods, as shown in Figure 8. Regardless of the sizing ratio, the reduction in residual stress was more effective when compression was applied constantly and evenly. Residual stress was consistently less than 100 MPa and variations were insignificant when the sizing ratio was greater than approximately 0.3%.

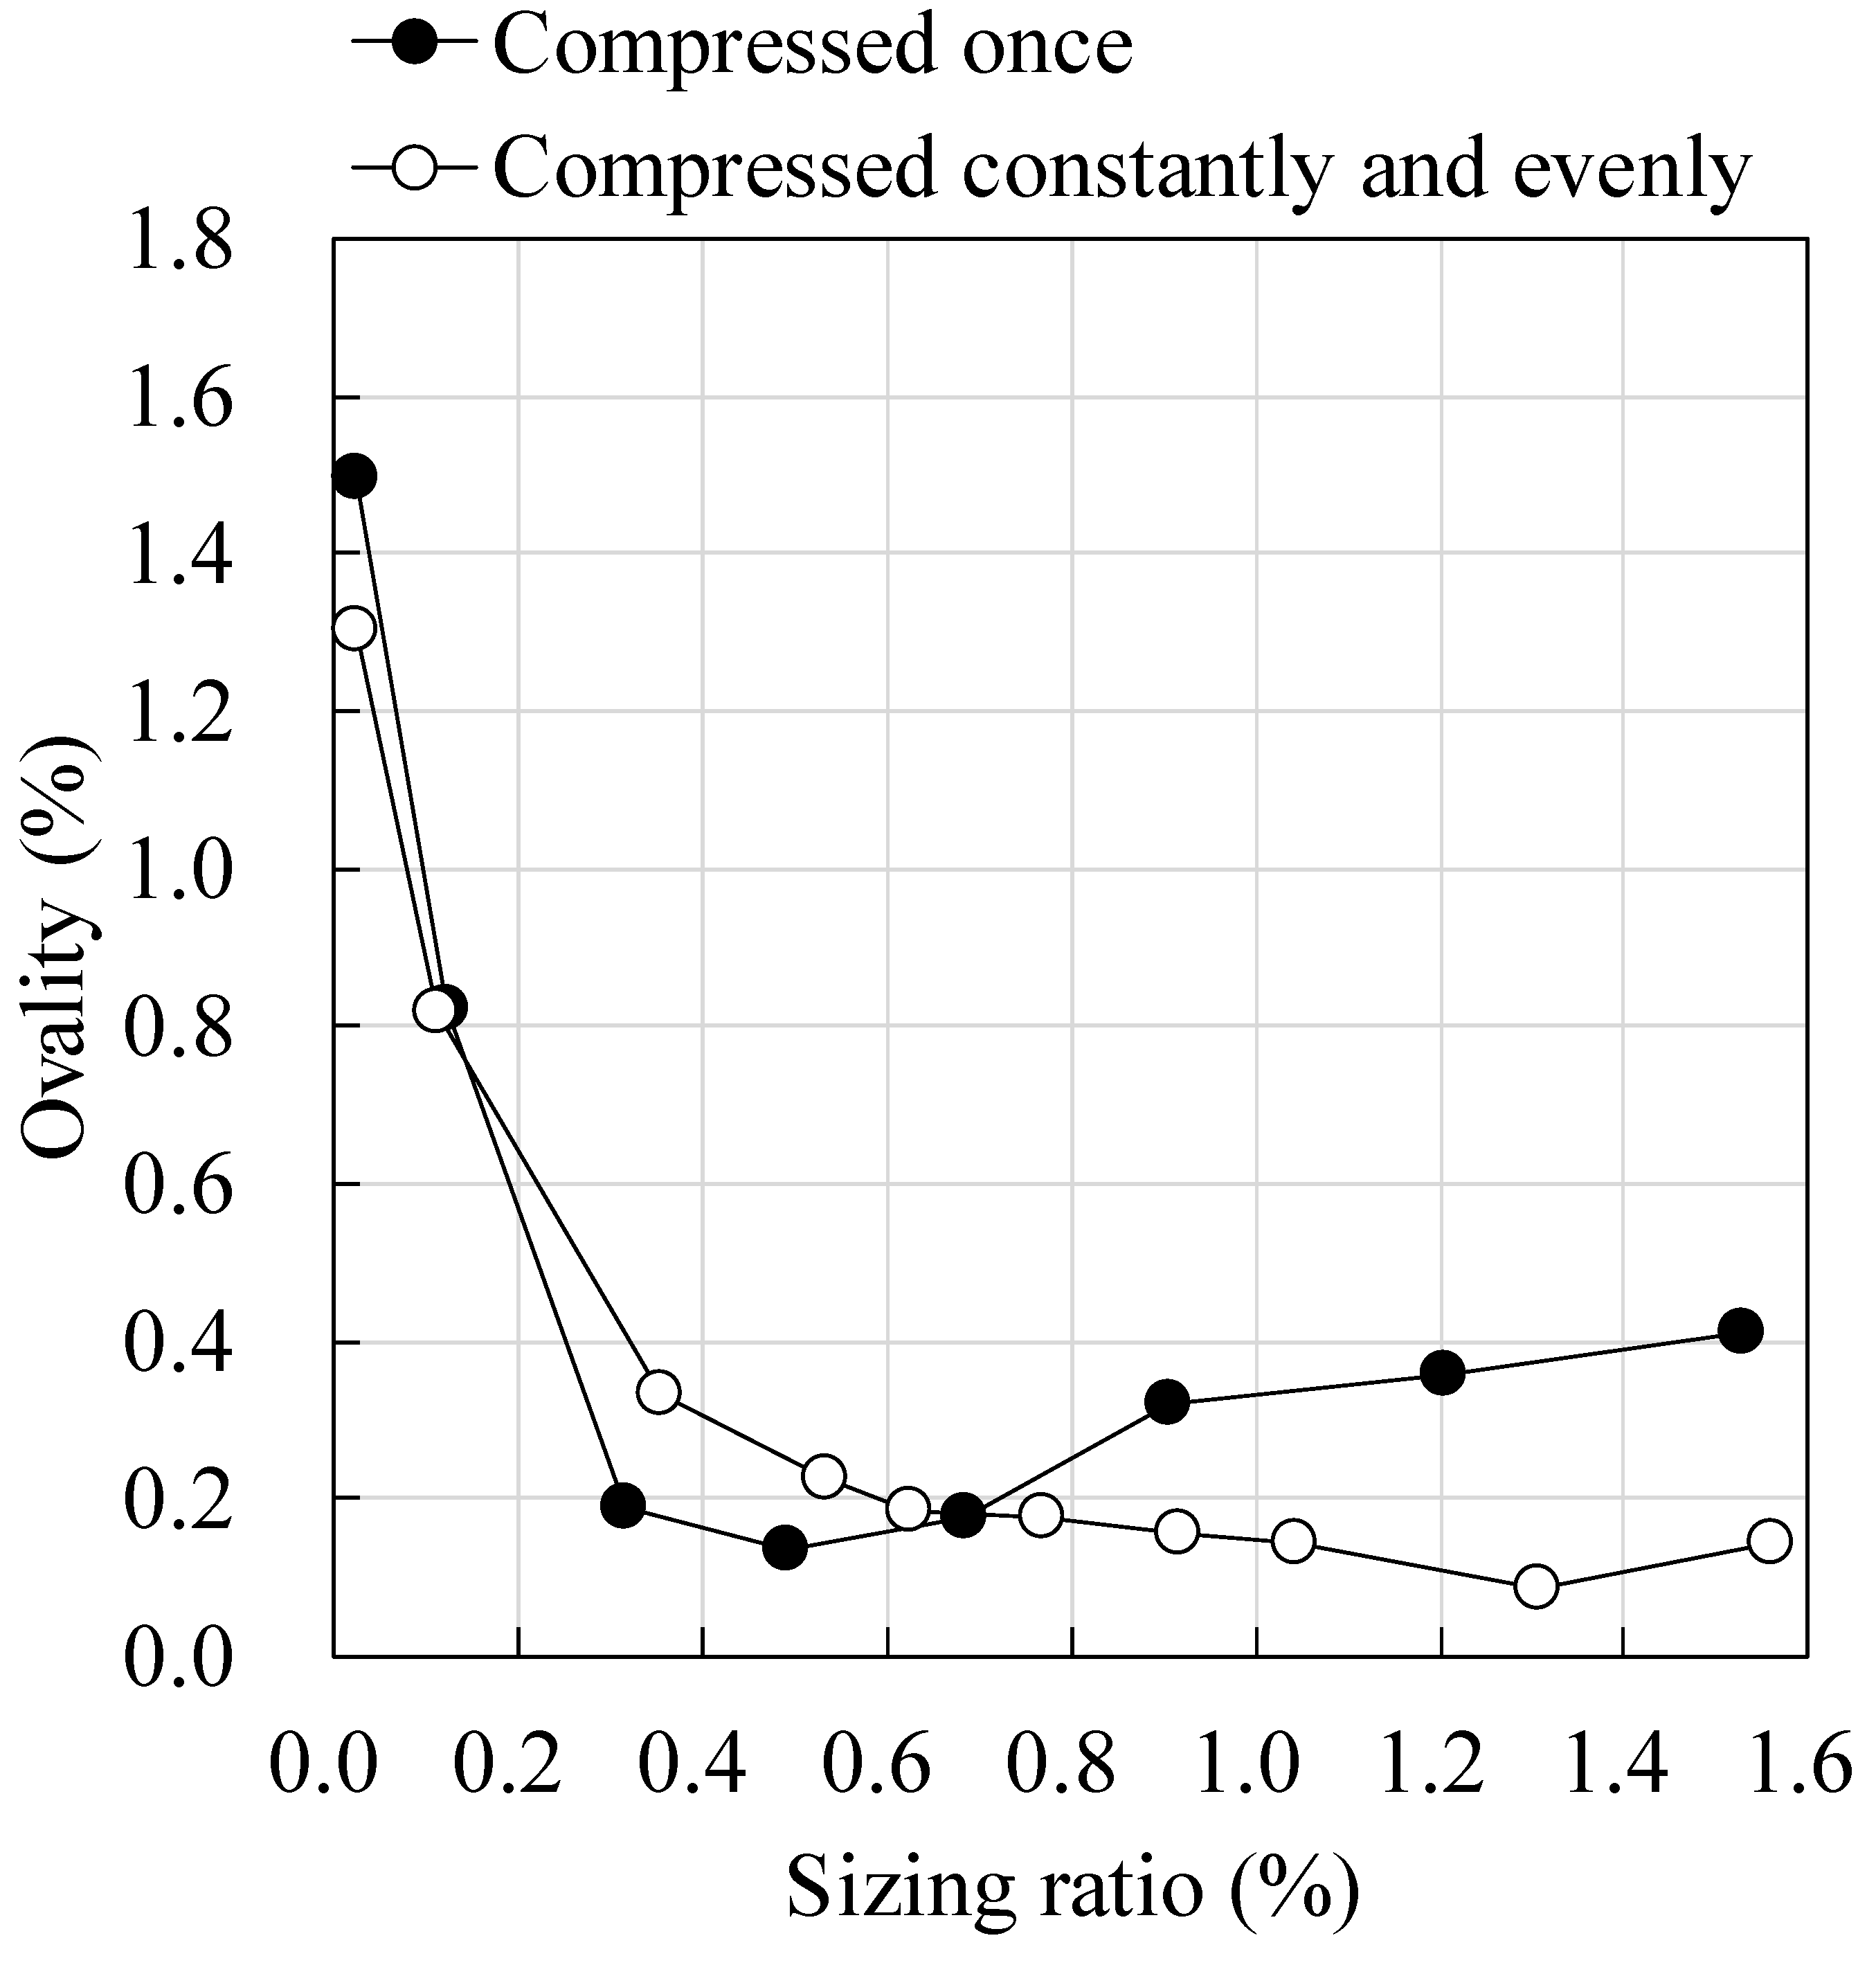
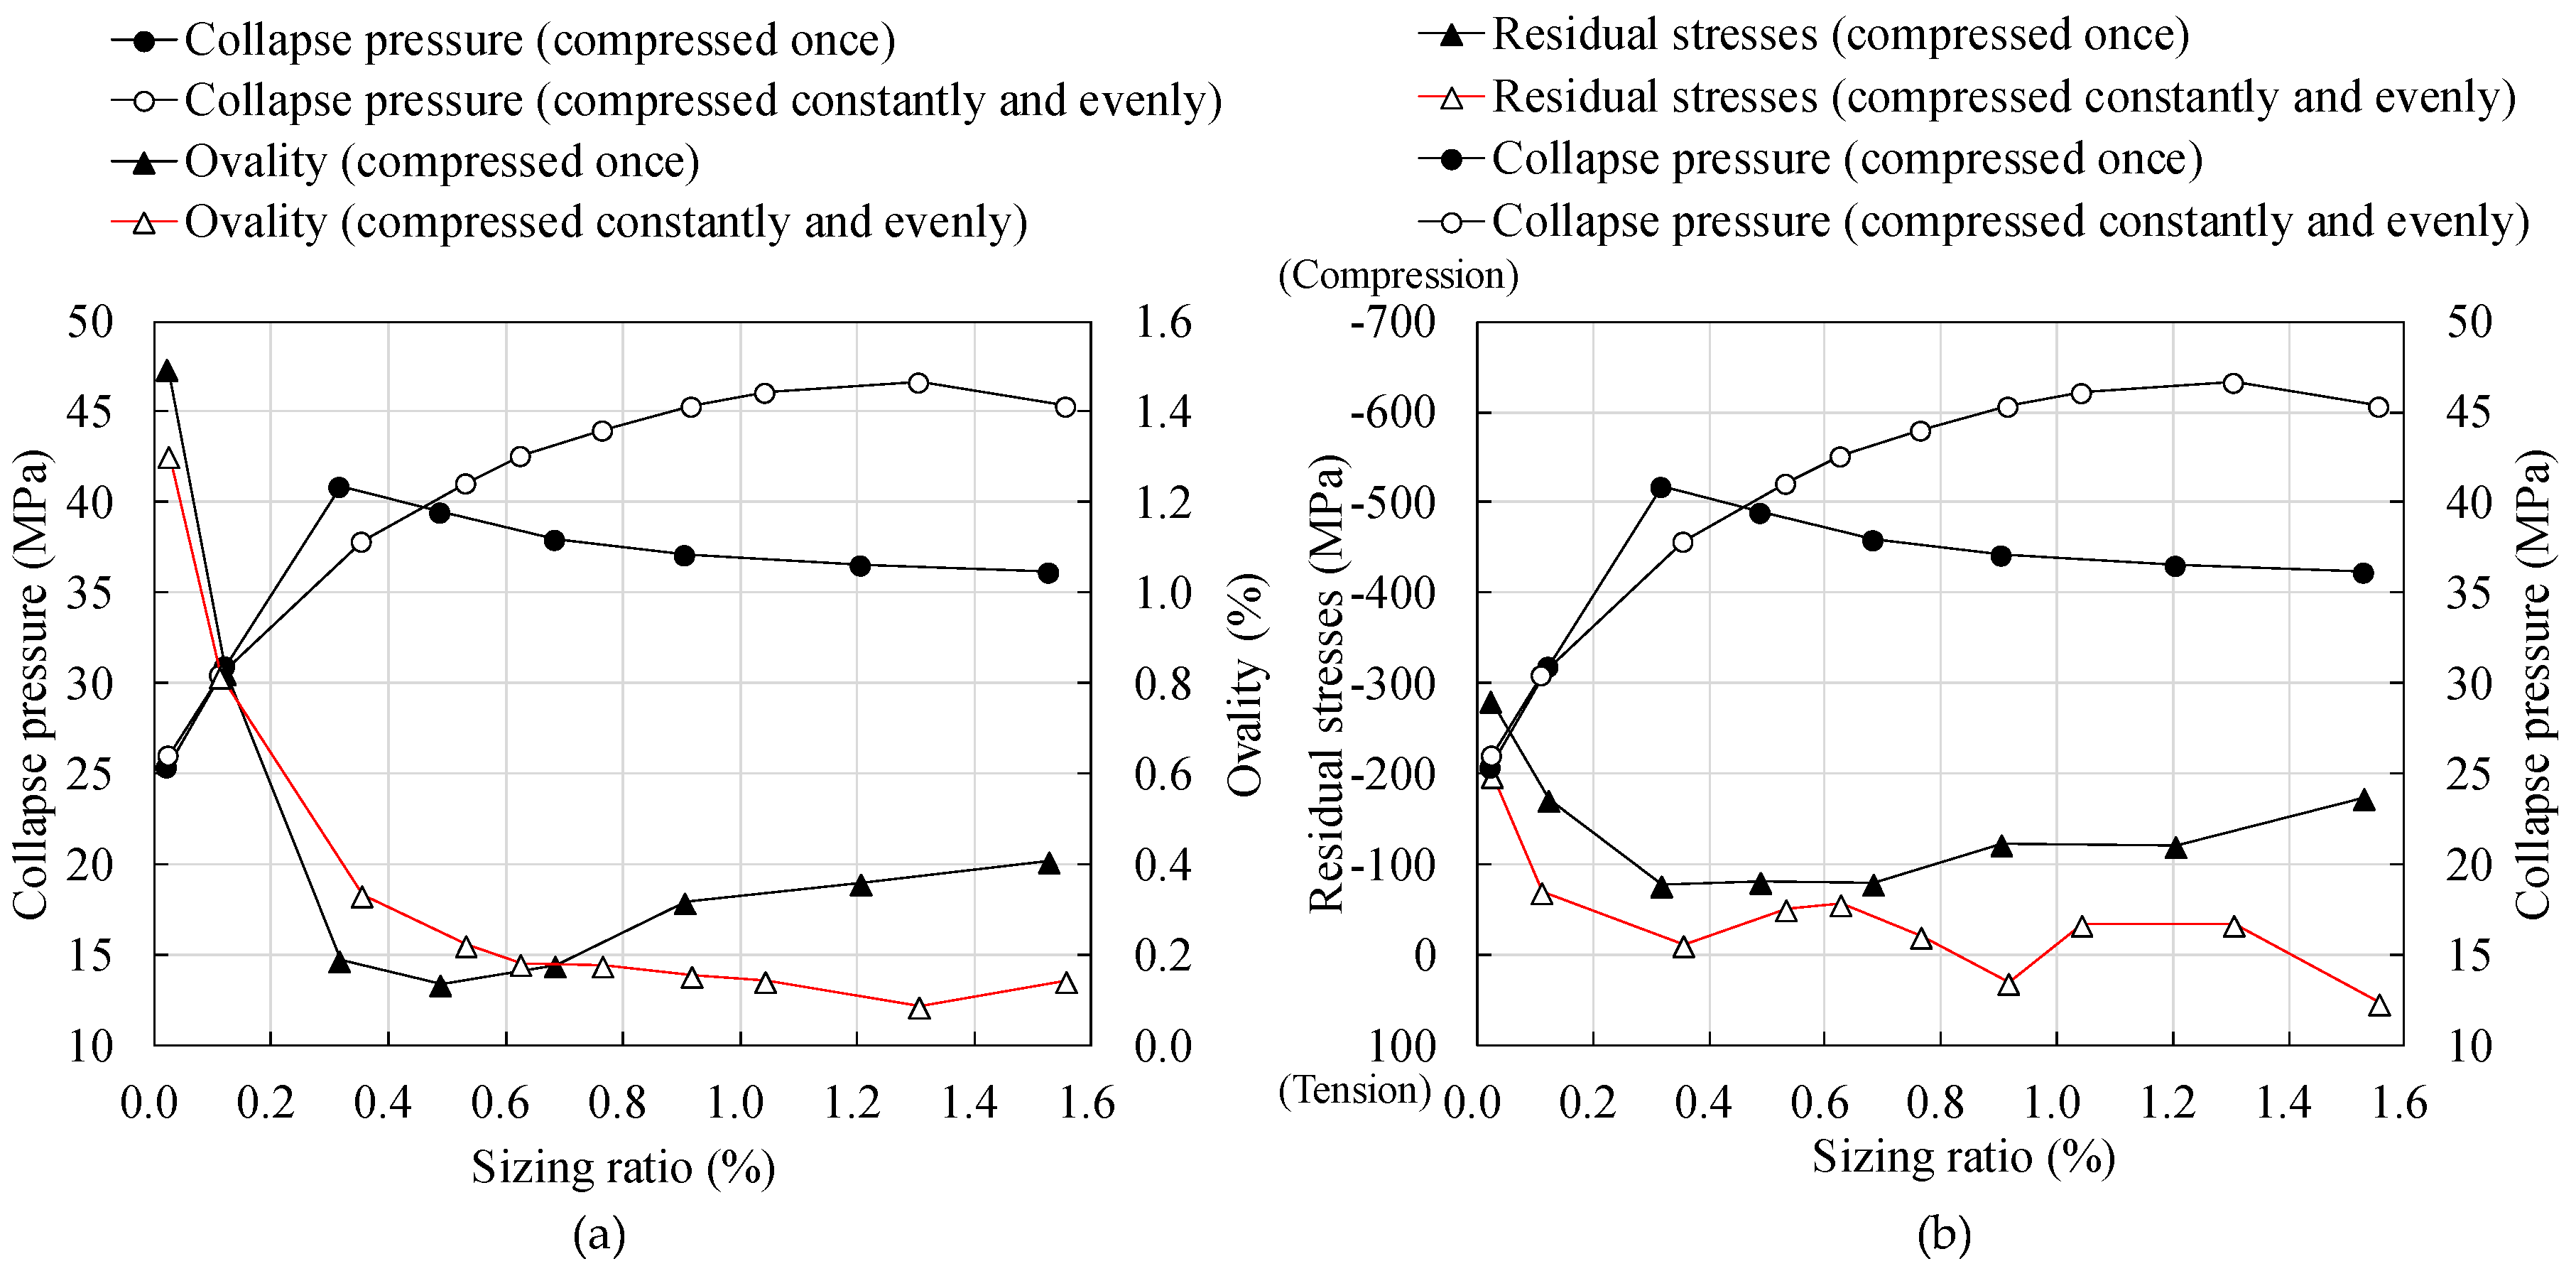
4.6. Dependency of Ovality on the Sizing Ratio

The effect of improving ovality through the sizing process was also different for the sizing ratio and sizing methods, as shown in Figure 9. When the pipe was compressed once, minimum ovality was obtained from a sizing ratio of 0.5%, and the ovality gradually increased as the sizing ratio increased. However, the ovality consistently decreased when the pipe was compressed constantly and evenly. In order to improve ovality, a single act of compression is better when the sizing ratio is less than 0.7%; otherwise, constant and even compression is better.

5. Evaluation of Collapse Pressure

As mentioned in the introduction, ovality and residual stress affect the collapse performance of pipe. In addition, ovality and residual stress varies according to the sizing process, which was discussed in a previous chapter. Also discussed was the dependency of the collapse pressure on ovality and residual stress.

5.1. Collapse Analysis Conditions

Collapse analysis was continued following the sizing analysis. For analysis, both ends of a section of pipe were fixed in all directions, and because the length of the pipe was 10 times longer than its diameter, the influence of the boundary conditions could be ignored in the center cross-section along the longitudinal direction of the pipe [5]. External pressure was applied uniformly to the outer surface of the pipe. An arc-length method [16] was then used to conduct nonlinear analysis in order to evaluate the maximum external pressure. The adopted mesh size of the pipe was validated by convergence analysis with respect to collapse pressure. Immediately after the sizing process, a deformed configuration and stress conditions were applied as initial conditions.

5.2. Enhanced Collapse Performance via the Sizing Process

The distribution of the circumferential stress and the deformed configuration of the center section are shown in Figure 10. As the external pressure became greater, the innermost layer was the first to yield and the progression continued to local buckling. Variations of the external pressure are plotted with respect to the maximum displacement at the hollow region, as shown in Figure 11. Local buckling occurred when the external pressure reached maximum, which was defined as the collapse pressure.
To examine the effectiveness of the sizing process, collapse pressures were evaluated before and after the sizing process, as shown in Figure 11a. The collapse pressure was improved more than double via sizing, which indicated an improvement in the collapse performance. The ovality and residual stress were imposed separately for collapse analysis in order to connect each contribution to an increase in collapse performance. The results in Figure 11b show that ovality significantly decreased the collapse pressure, and the collapse pressure was decreased even more when both ovality and residual stress were applied. On the other hand, the decrease in collapse pressure was minor when only residual stress was imposed. For improving the collapse pressure, an improvement in ovality was more effective than a reduction in the residual stress.

5.3. The Collapse Pressure Dependency on the Sizing Ratio

The collapse pressure was evaluated for both sizing ratios and the sizing methods, as shown in Figure 12. When the sizing ratio was small, the collapse pressure was relatively small because the ovality and residual stress were large. When the sizing ratio was increased, variations in the collapse pressure were somehow inversely proportional to the ovality, as shown in Figure 12a. This demonstrates that the collapse performance can be critically influenced by the ovality. Moreover, the greatest collapse performance was obtained at a specific sizing ratio when compression was applied once, but the collapse performance was gradually improved with increases in the sizing ratio when compression was applied constantly and evenly.
Since the local buckling was initiated from the innermost layer, as shown in Figure 10a, the collapse pressure dependency on the sizing ratio was investigated in terms of the circumferential residual stress on the innermost layer, as shown in Figure 12b. Although residual stress showed a certain effect on collapse pressure reduction, as shown in Figure 11b, there was no clear relationship between the collapse pressure and the residual stress depending on the sizing ratio when compression was applied constantly and evenly, because rather than the residual stress, it was the ovality that had a significant effect on the reduction of collapse pressure. When compressing constantly and evenly, the sizing method helped improve the collapse performance over a wide range of sizing ratios. Also, a larger sizing ratio created a greater difference in the collapse pressure when comparing sizing methods.

6. Conclusions

An analytical approach using the finite element method was proposed to simulate the roll-forming and sizing processes in manufacturing ERW pipe. To simulate significant plastic deformation during manufacturing, we incorporated a nonlinear material model that considered the Bauschinger effect. The manufacture of an ERW pipe made of API L5 X70 steel was simulated and analyzed for its collapse performance. The main conclusions of this study follow.
(1)
Sizing improves the ovality and reduces residual stress following roll-forming, and these effects depend on the sizing ratio and sizing methods. Compressing the pipe evenly and constantly through all sizing rollers is better for ovality improvement as the sizing ratio increases, but the ovality is sensitive to the sizing ratio for a single act of compression. Compressing the pipe evenly and constantly is more effective for reducing the residual stress compared with a single act of compression.
(2)
The sizing ratio and sizing methods have a significant effect on ovality and are major parameters for the control of collapse pressure improvement. The effect of ovality is greater on collapse pressure reduction than that of the residual stress, but collapse pressure varies with the changes in ovality, which depends on the sizing ratio. Compressing the pipe constantly and evenly during the sizing process helps improve the collapse pressure over a wide range of the sizing ratios.
(3)
The numerical model for simulating the roll-forming and sizing process of ERW pipe provides insight into the relationship between collapse performance and manufacturing parameters such as the sizing ratio. This study presents a platform for simulating the manufacturing process and predicting collapse pressure. Further study should focus on comparison and calibration of the numerical results via experimental validation.

Author Contributions

Conceptualization, S.-W.H., Y.C.P., S.J., and H.-K.K.; methodology, S.-W.H., S.-C.K., and S.J.; software, S.-W.H., Y.C.P., and S.-C.K.; validation, S.-W.H, Y.C.P., S.-C.K., and H.-K.K.; formal analysis, S.-W.H.; investigation, S.-W.H. and Y.C.P.; resources, S.-C.K.; writing—original draft preparation, S.-W.H.; writing—review and editing, Y.C.P. and H.-K.K.; supervision, H.-K.K.; project administration, S.-C.K. and H.-K.K.

Funding

This research was supported by grants (Project no. 2017R431) from the POSCO.

Acknowledgments

The fifth author was supported by the POSCO Chair Professor Program.

Conflicts of Interest

The authors declare no conflict of interest.

References

  1. Kyriakides, S.; Corona, E. Mechanics of Offshore Pipelines: Volume 1 Buckling and Collapse, 1st ed.; Elsevier: Amsterdam, The Netherlands, 2007; Volume 1. [Google Scholar]
  2. Nagata, Y.; Tsuru, E. Geometry and Collapse Pressure of HF-ERW Line Pipe Reel-laid in Deepwater. In Proceedings of the 26th International Ocean and Polar Engineering Conference, Rhodes, Greece, 26 June–2 July 2016. [Google Scholar]
  3. Tsuru, E.; Tomioka, K.; Shitamoto, H.; Ozaki, M.; Karjadi, E.; Boyd, H.; Demmink, H. Collapse Resistance of HF-ERW Line Pipe Installed in Deepwater by R-Lay. In Proceedings of the 25th International Ocean and Polar Engineering Conference, Kona, HI, USA, 21–26 June 2015. [Google Scholar]
  4. Nishimura, N.; Takeuchi, S.; Murakami, S.; Sanui, K. The Effect Manufacturing Processes on Residual Stress and Yield Stress of ERW Pipes. Kou Kouzou Rombunshuu 1997, 4, 53–62. [Google Scholar]
  5. Bastola, A.; Wang, J.; Mirzaee-Sisan, A.; Njuguna, J. Predicting hydrostatic collapse of pipes using finite element analysis. In Proceedings of the ASME 2014 33rd International Conference on Ocean, Offshore and Arctic Engineering, San Francisco, CA, USA, 8–13 June 2014. [Google Scholar]
  6. Fraldi, M.; Guarracino, F. Towards an accurate assessment of UOE pipes under external pressure: Effects of geometric imperfection and material inhomogeneity. Thin-Walled Struct. 2013, 63, 147–162. [Google Scholar] [CrossRef]
  7. Lee, J.M.; Kim, D.W.; Quagliato, L.; Kang, S.C.; Kim, N.S. Change of the yield stress in roll formed ERW pipes considering the Bauschinger effect. J. Mater. Process. Technol. 2017, 244, 304–313. [Google Scholar] [CrossRef]
  8. Yi, J.W. Optimal Design Procedure for Offshore Pipelines based on Computational Simulation of Pipe Forming Process. Ph.D. Thesis, Seoul National University, Seoul, Korea, 2017. [Google Scholar]
  9. Zou, T.; Li, D.; Wu, G.; Peng, Y. Design. Yield strength development from high strength steel plate to UOE pipe. Mater. Des. 2016, 89, 1107–1122. [Google Scholar] [CrossRef]
  10. Chaboche, J.L.; Rousselier, G. On the plastic and viscoplastic constitutive equations—Part I: Rules developed with internal variable concept. J. Press. Vessel Technol. 1983, 105, 153–158. [Google Scholar] [CrossRef]
  11. Yoshida, F.; Uemori, T.; Fujiwara, K. Elastic–plastic behavior of steel sheets under in-plane cyclic tension—compression at large strain. Int. J. Plast. 2002, 18, 633–659. [Google Scholar] [CrossRef]
  12. American Petroleum Institute. API 5L: Specification for Line Pipe; American Petroleum Institute: Washington, DC, USA, 2012. [Google Scholar]
  13. Dassault, S. ABAQUS, Version 2018; ABAQUS Inc.: Palo Alto, CA, USA, 2018. [Google Scholar]
  14. Berglund, J.; Brown, C.A.; Rosen, B.-G.; Bay, N. Milled die steel surface roughness correlation with steel sheet friction. CIRP Ann.-Manuf. Technol. 2010, 59, 577–580. [Google Scholar] [CrossRef]
  15. McConnell, C.; Lenard, J.G. Friction in cold rolling of a low carbon steel with lubricants. J. Mater. Process. Technol. 2000, 99, 86–93. [Google Scholar] [CrossRef]
  16. Xie, P.; Zhao, Y.; Yue, Q.; Palmer, A.C. Dynamic loading history and collapse analysis of the pipe during deepwater S-lay operation. Mar. Struct. 2015, 40, 183–192. [Google Scholar] [CrossRef]
Figure 1. Validation of the adopted material model for API 5L X70 steel: (a) geometry of the dog bone specimen; (b) results of the cyclic loading test and simulation.
Jmse 07 00410 g001
Figure 2. Simulation of the roll-forming process: (a) 3D view; (b) details of the steel plate.
Jmse 07 00410 g002
Figure 3. Results of roll-forming: (a) Roll flower; (b) variations in the circumferential stress measured at the opposite sides of a weldment in the center section; (c) variations in the circumferential stress measured at 90° of the weldment in the center section.
Jmse 07 00410 g003
Figure 4. Simulation of the sizing process: (a) 3D view; (b) shape of the sizing roller set; (c) boundary conditions.
Jmse 07 00410 g004
Figure 5. Variations in the circumferential stress at the center of the pipe in a longitudinal direction during the sizing: (a) At the opposite side of the weldment; (b) at 90° from the weldment.
Jmse 07 00410 g005
Figure 6. Variations in the circumferential stress during the sizing using different sizing methods.
Jmse 07 00410 g006
Figure 7. Circumferential residual stress with respect to the sizing ratio at different evaluation locations.
Jmse 07 00410 g007
Figure 8. Circumferential residual stress according to the sizing ratio with different sizing methods evaluated at a line opposite the weldment.
Jmse 07 00410 g008
Figure 9. Ovality according to the sizing ratio using different sizing methods.
Jmse 07 00410 g009
Figure 10. Simulation of the collapse of electric resistance welded (ERW) pipes: (a) 3D view after collapse occurs; (b) shape of a cross-section when collapse occurs.
Jmse 07 00410 g010
Figure 11. Collapse pressure for various conditions: (a) Effect of the sizing process; (b) reduction in collapse pressure due to ovality and residual stress after the roll-forming.
Jmse 07 00410 g011
Figure 12. Collapse pressure with respect to the sizing ratio: (a) Comparison with ovality; (b) comparison of circumferential residual stress of the innermost layer.
Jmse 07 00410 g012
Table 1. Yield and tensile strengths (MPa) by experiment and simulation for API 5L X70 steel.
Mechanical PropertyNominal ValueExperimentSimulation
Yield strength (Y)483 (min.)555564
Tensile strength (T)565 (min.)620652
Y/T ratio0.93 (max.)0.890.87

