CADDY Underwater Stereo-Vision Dataset for Human–Robot Interaction (HRI) in the Context of Diver Activities

 , , , , and
Abstract
1. Introduction
2. Sensor Setup
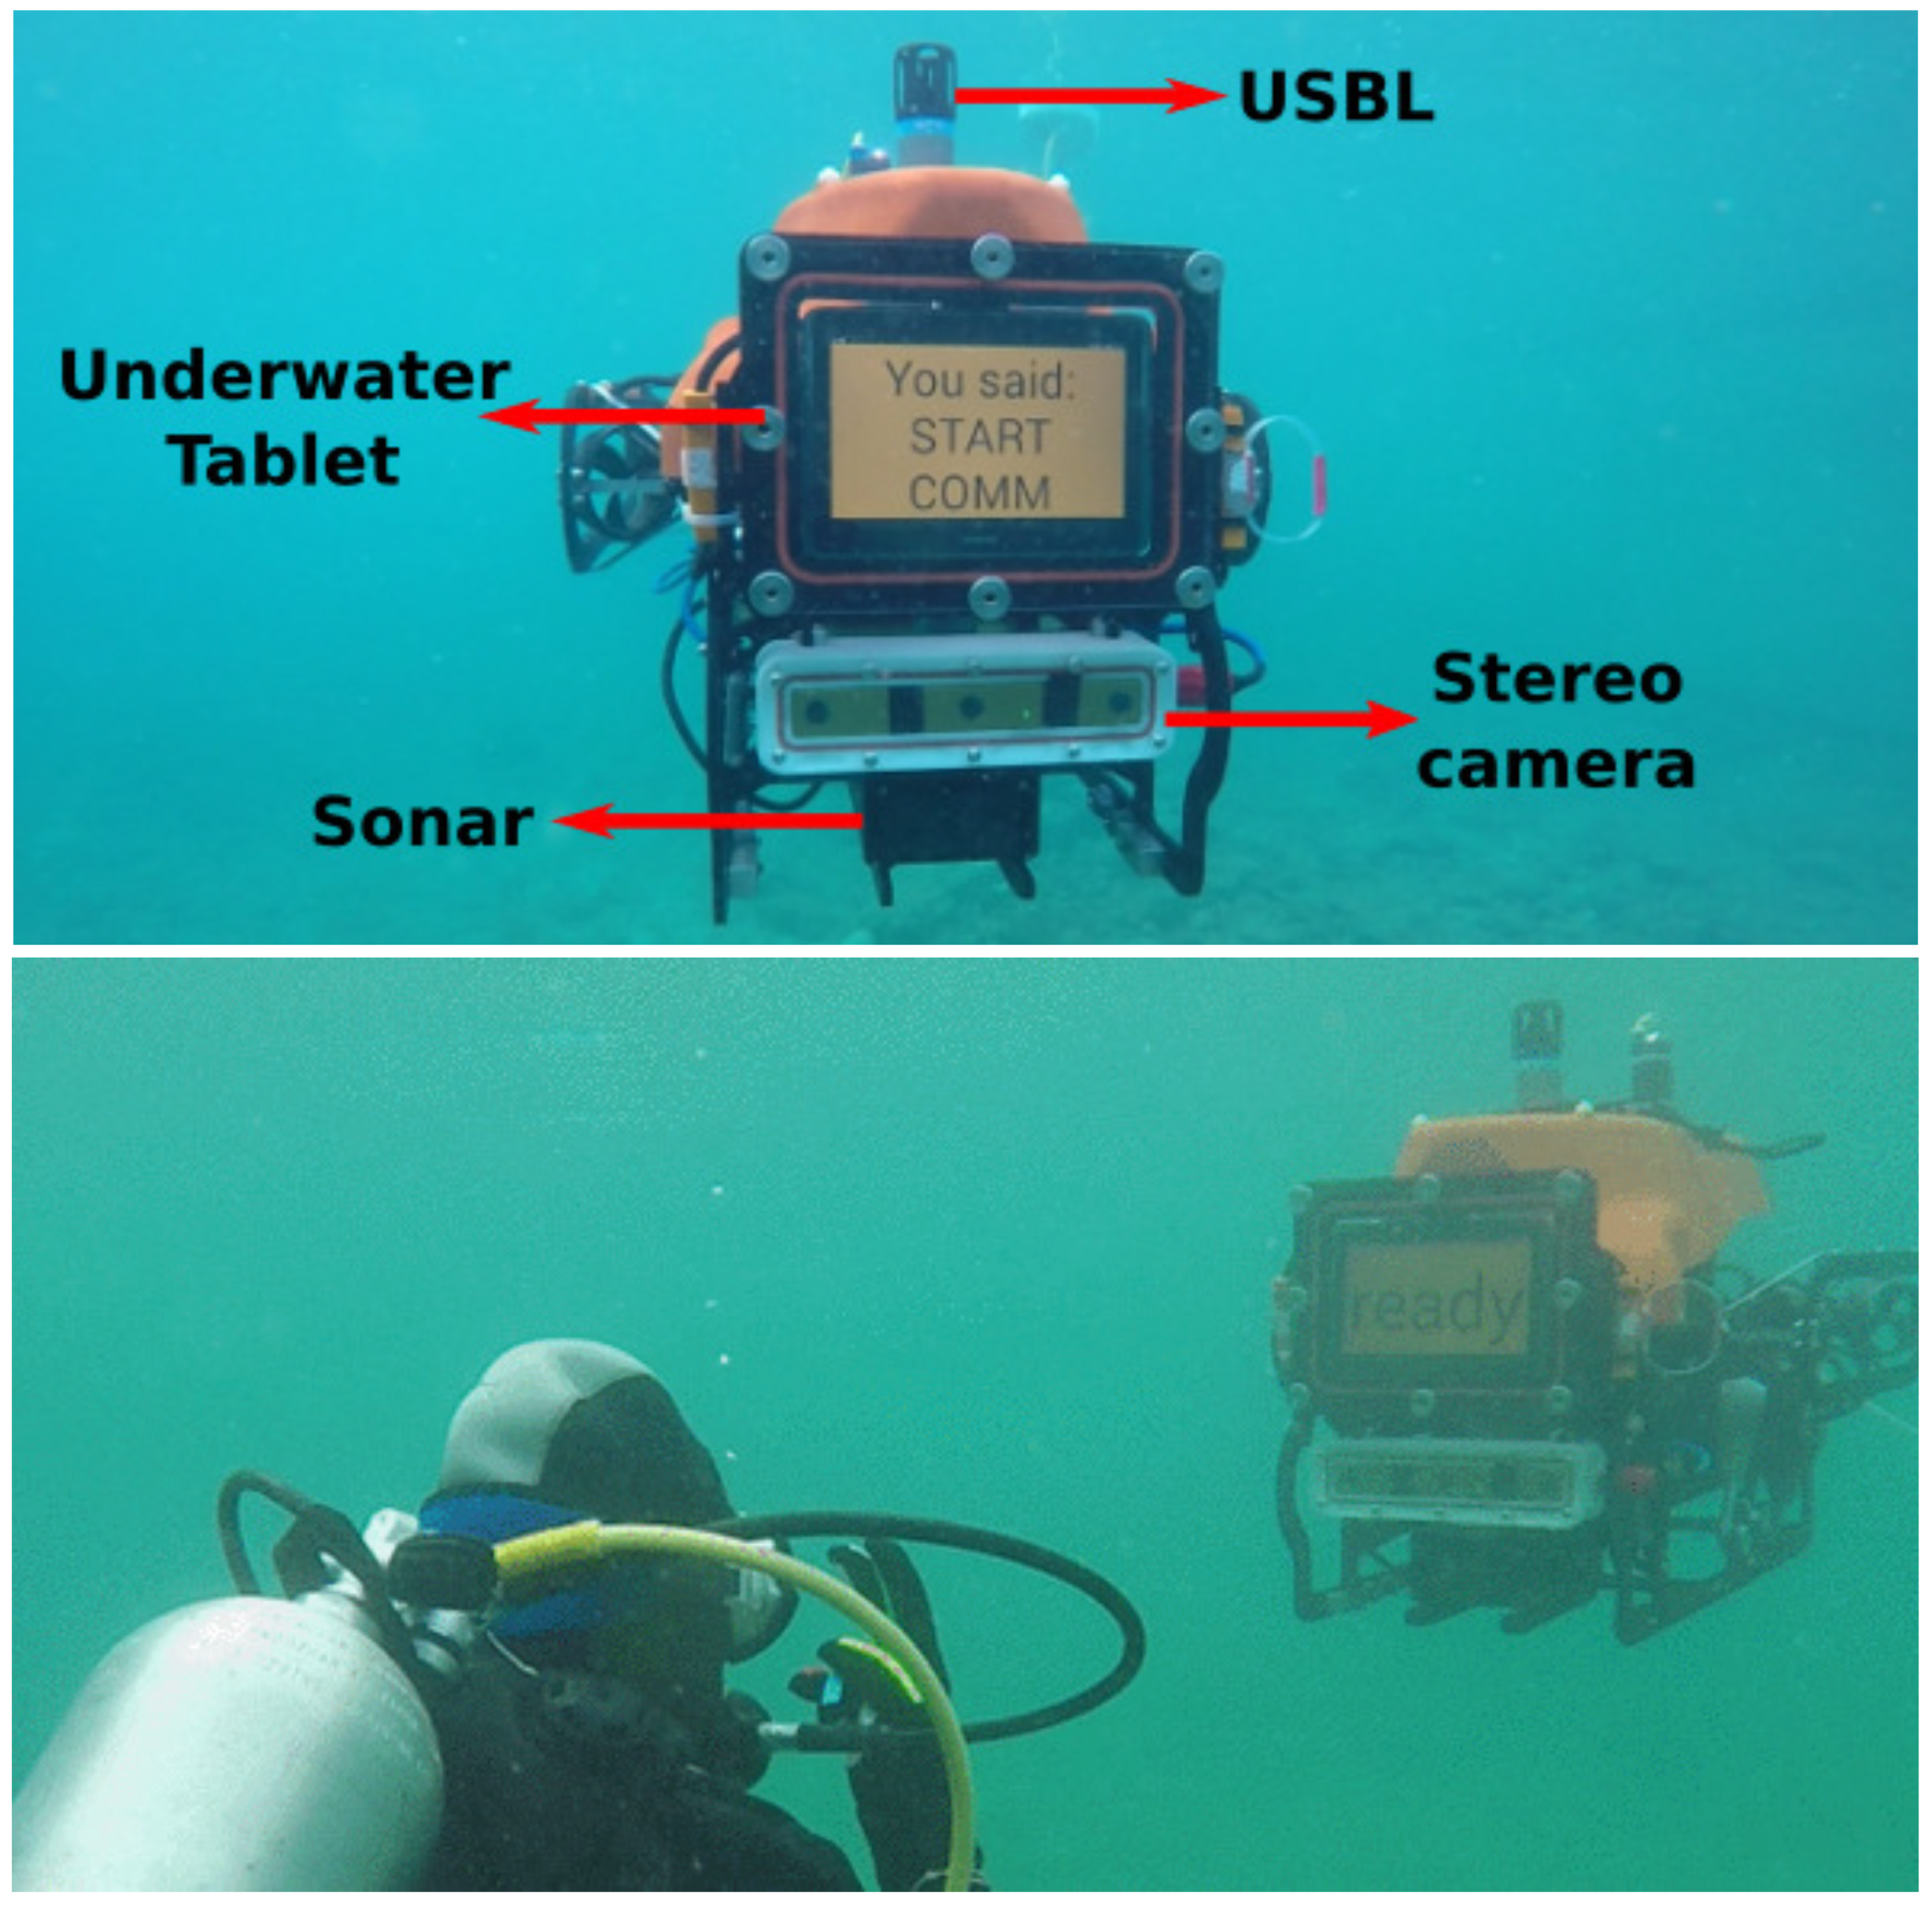
2.1. BUDDY AUV
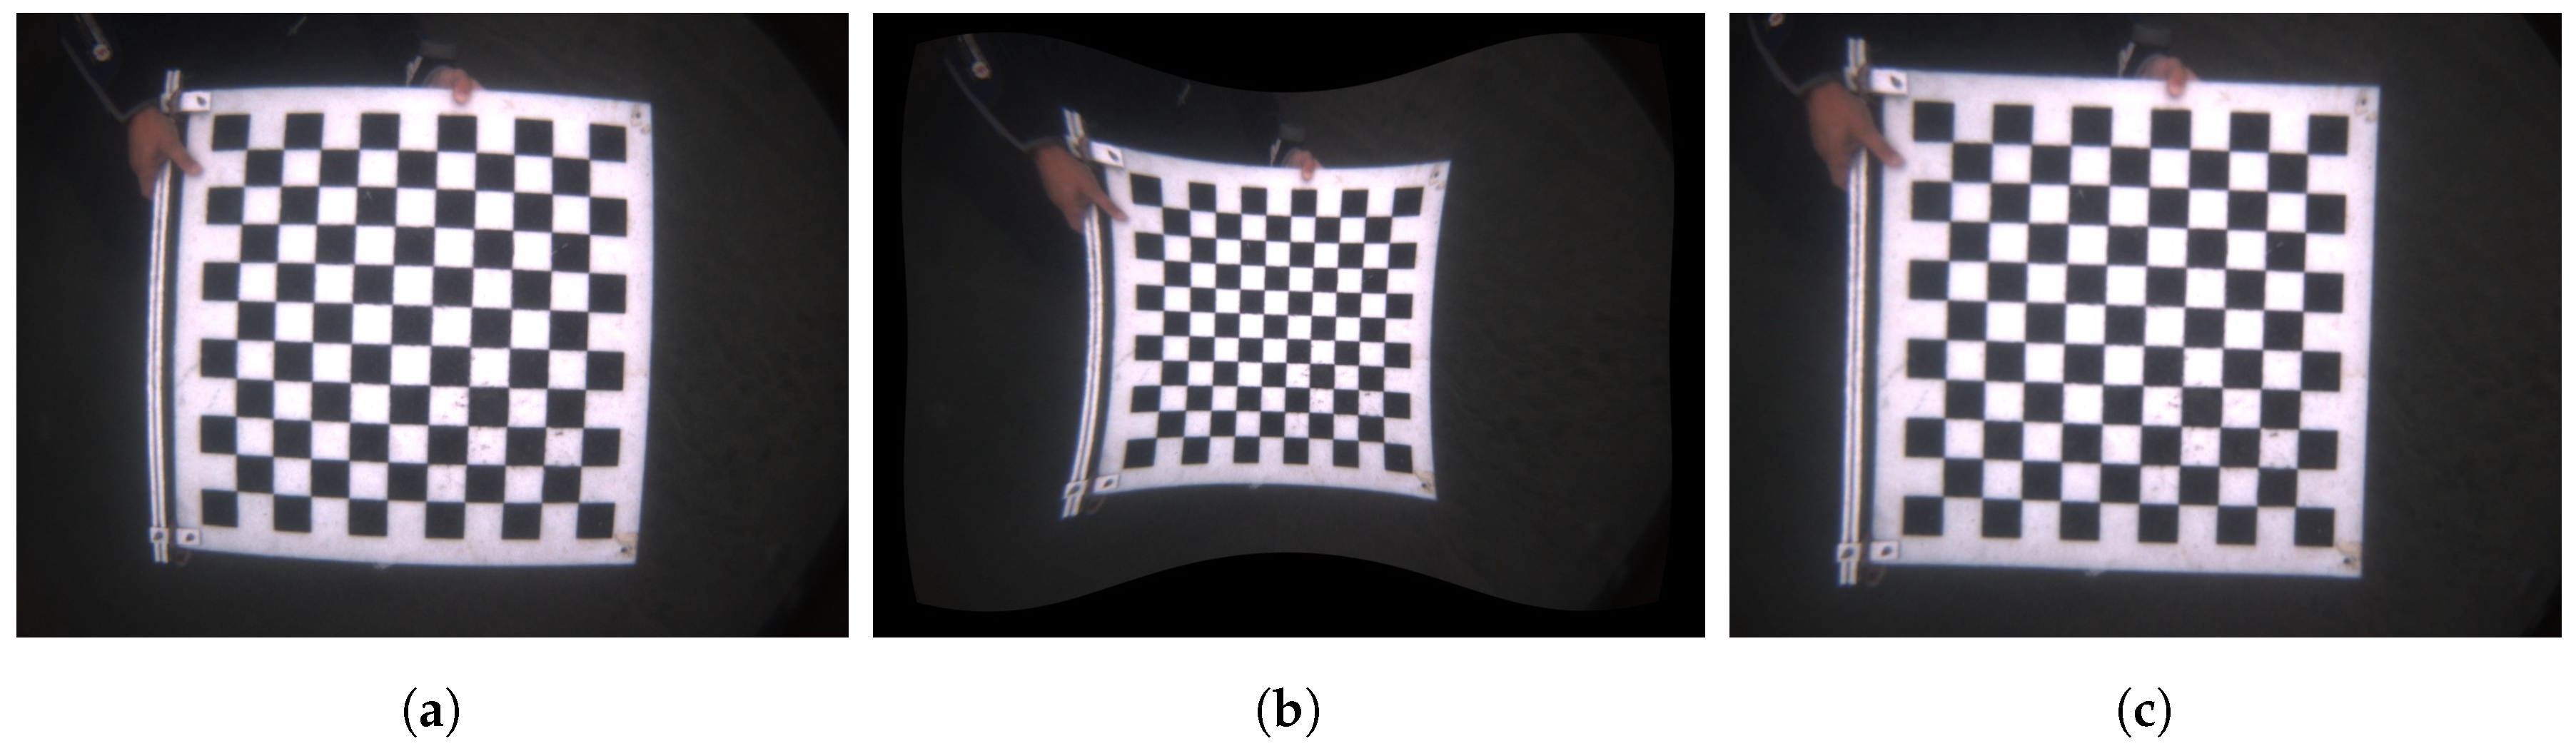
2.2. Stereo Camera and Underwater Image Rectification
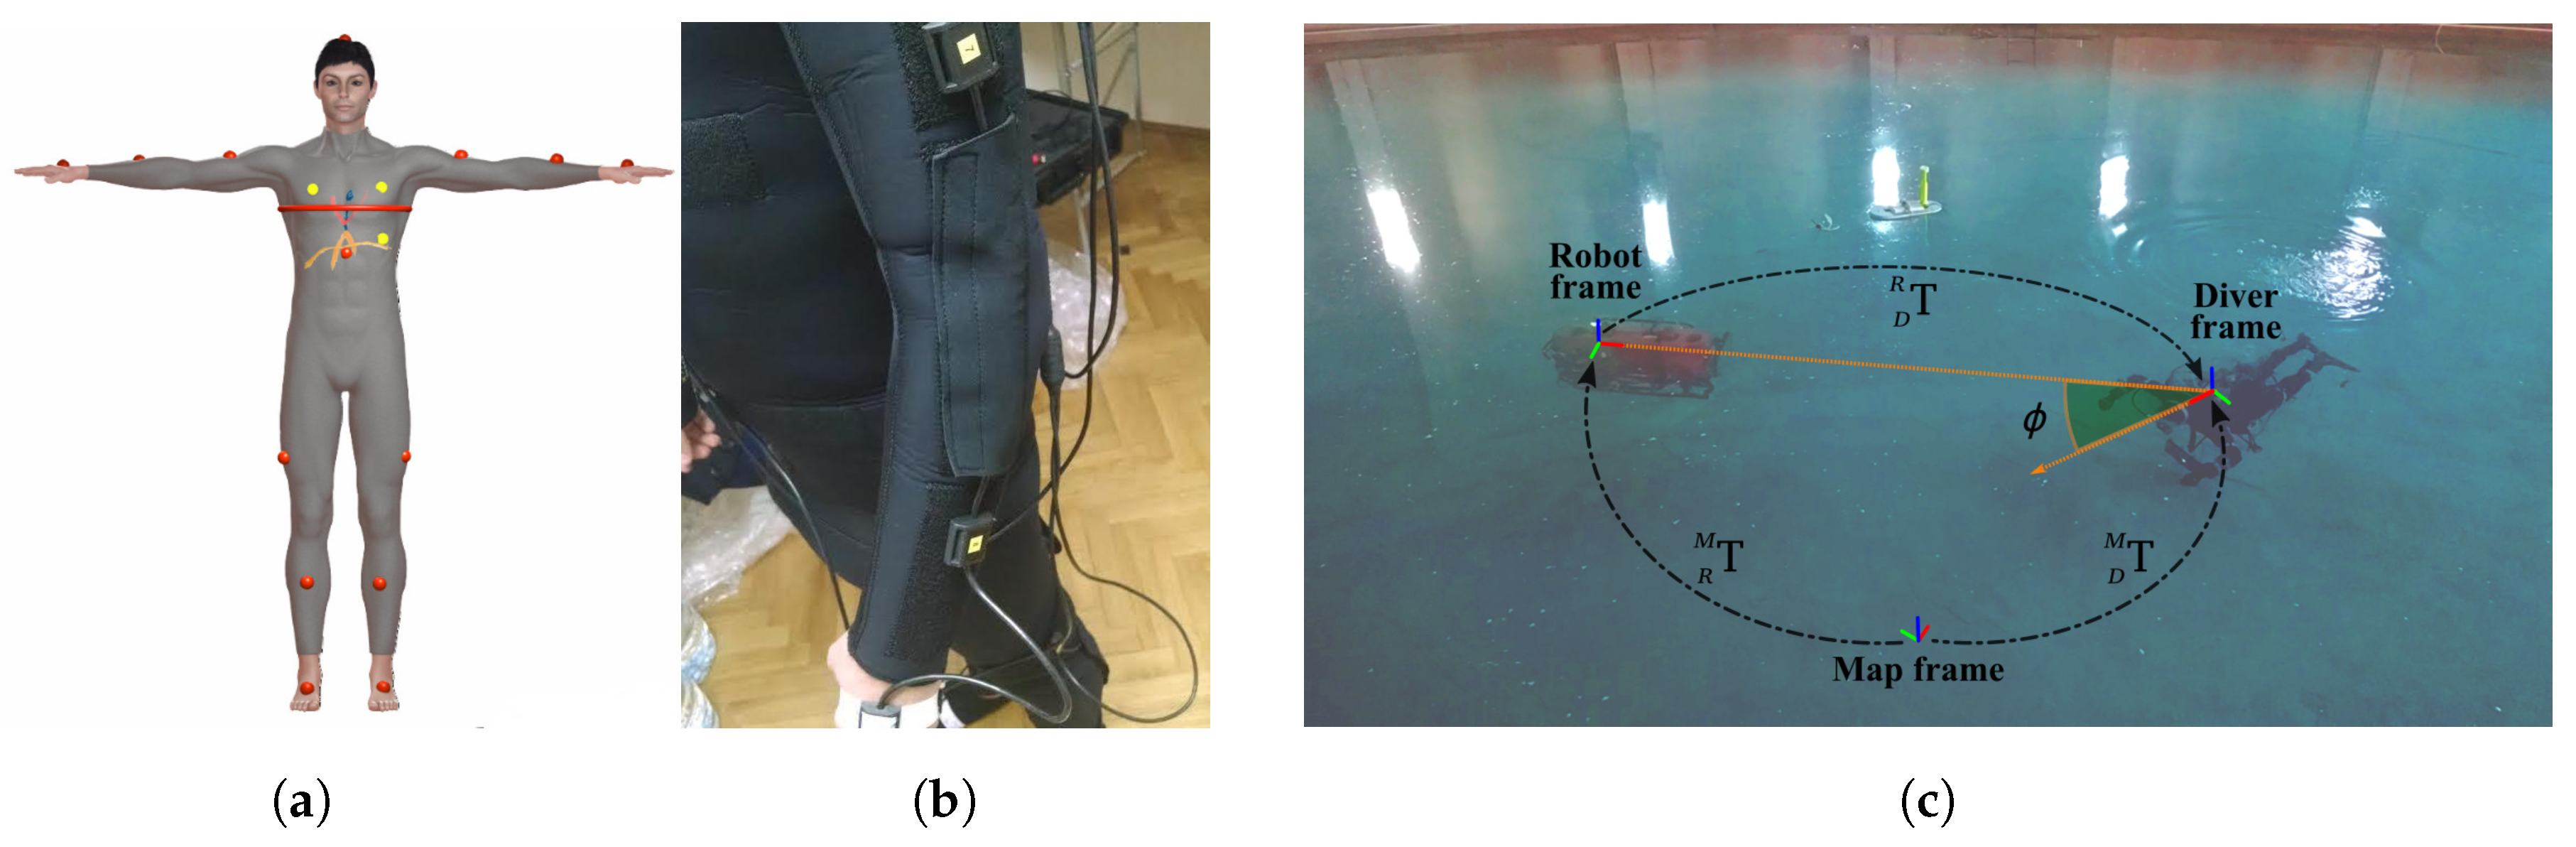
2.3. DiverNet
- Raw orientation is acquired based on the magnetometer data and the gravity distribution along each of the accelerometer axes.
- Filtered orientation is computed by fusing the raw orientation with the gyroscope data through a Madgwick–Mahony filter [19].
3. Dataset
3.1. Data Collection
3.2. Data Description
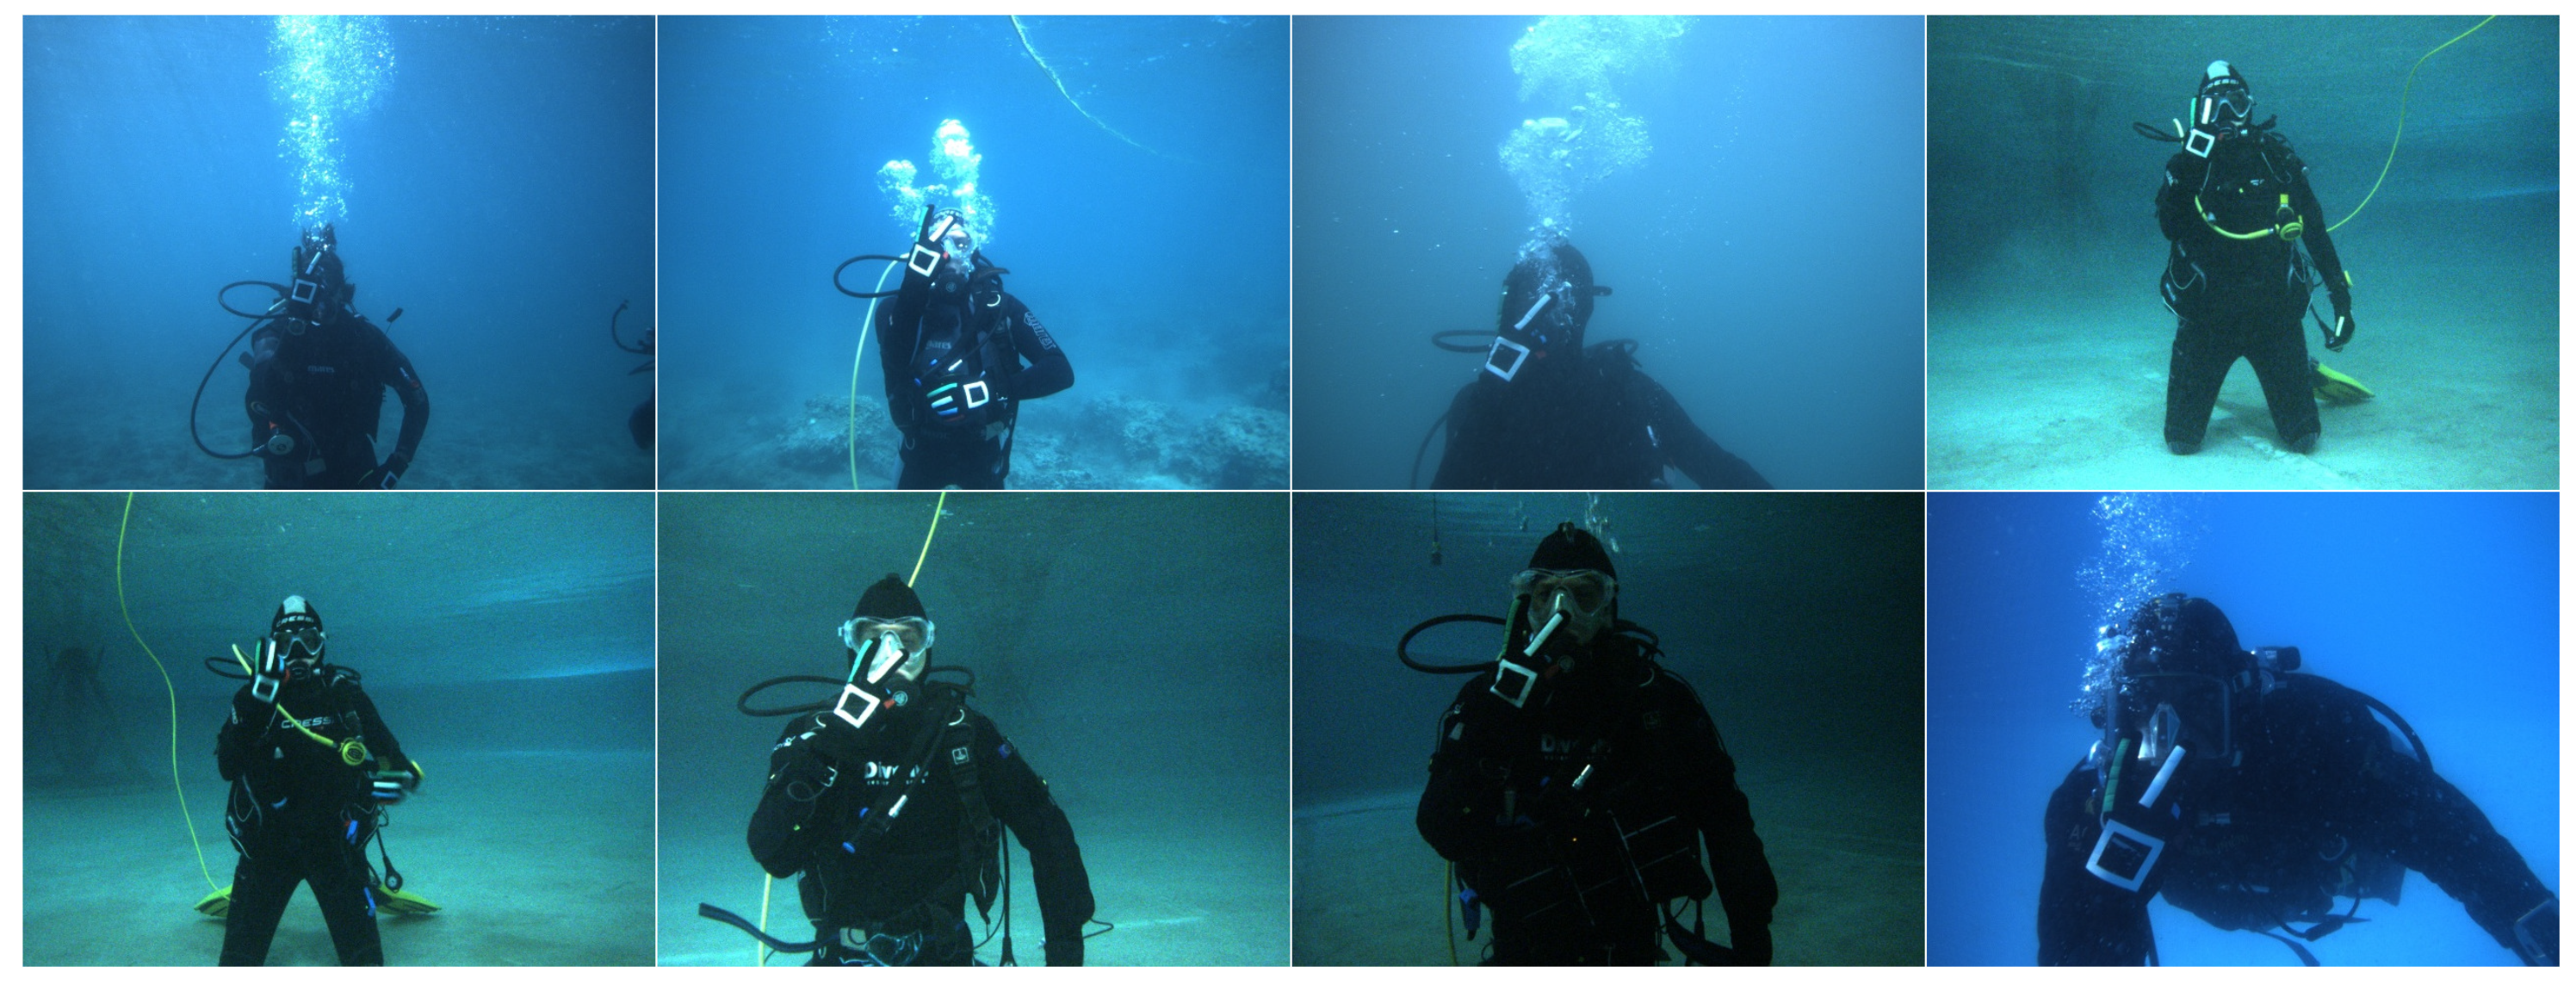
3.3. Underwater Gestures
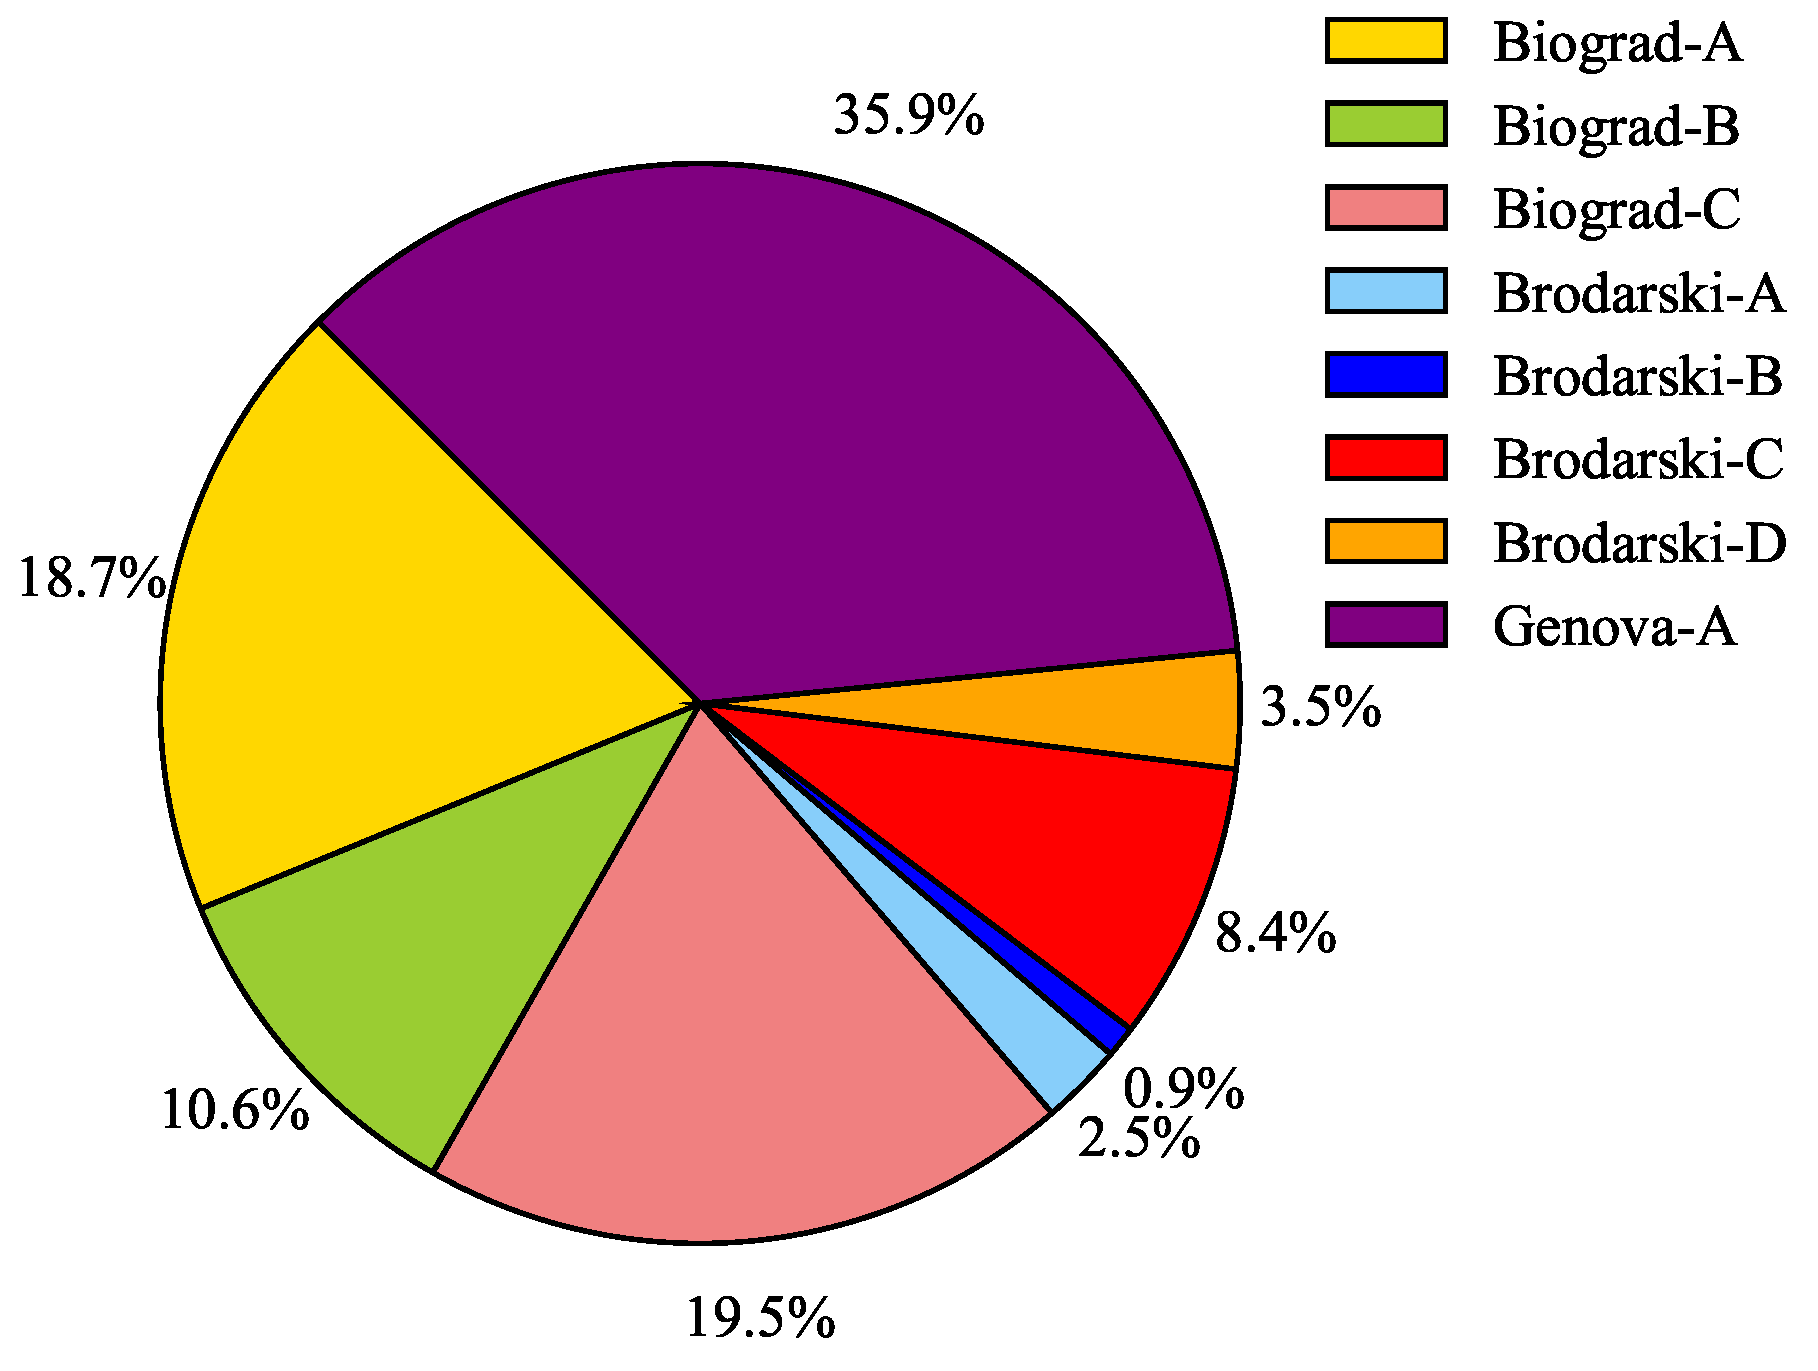
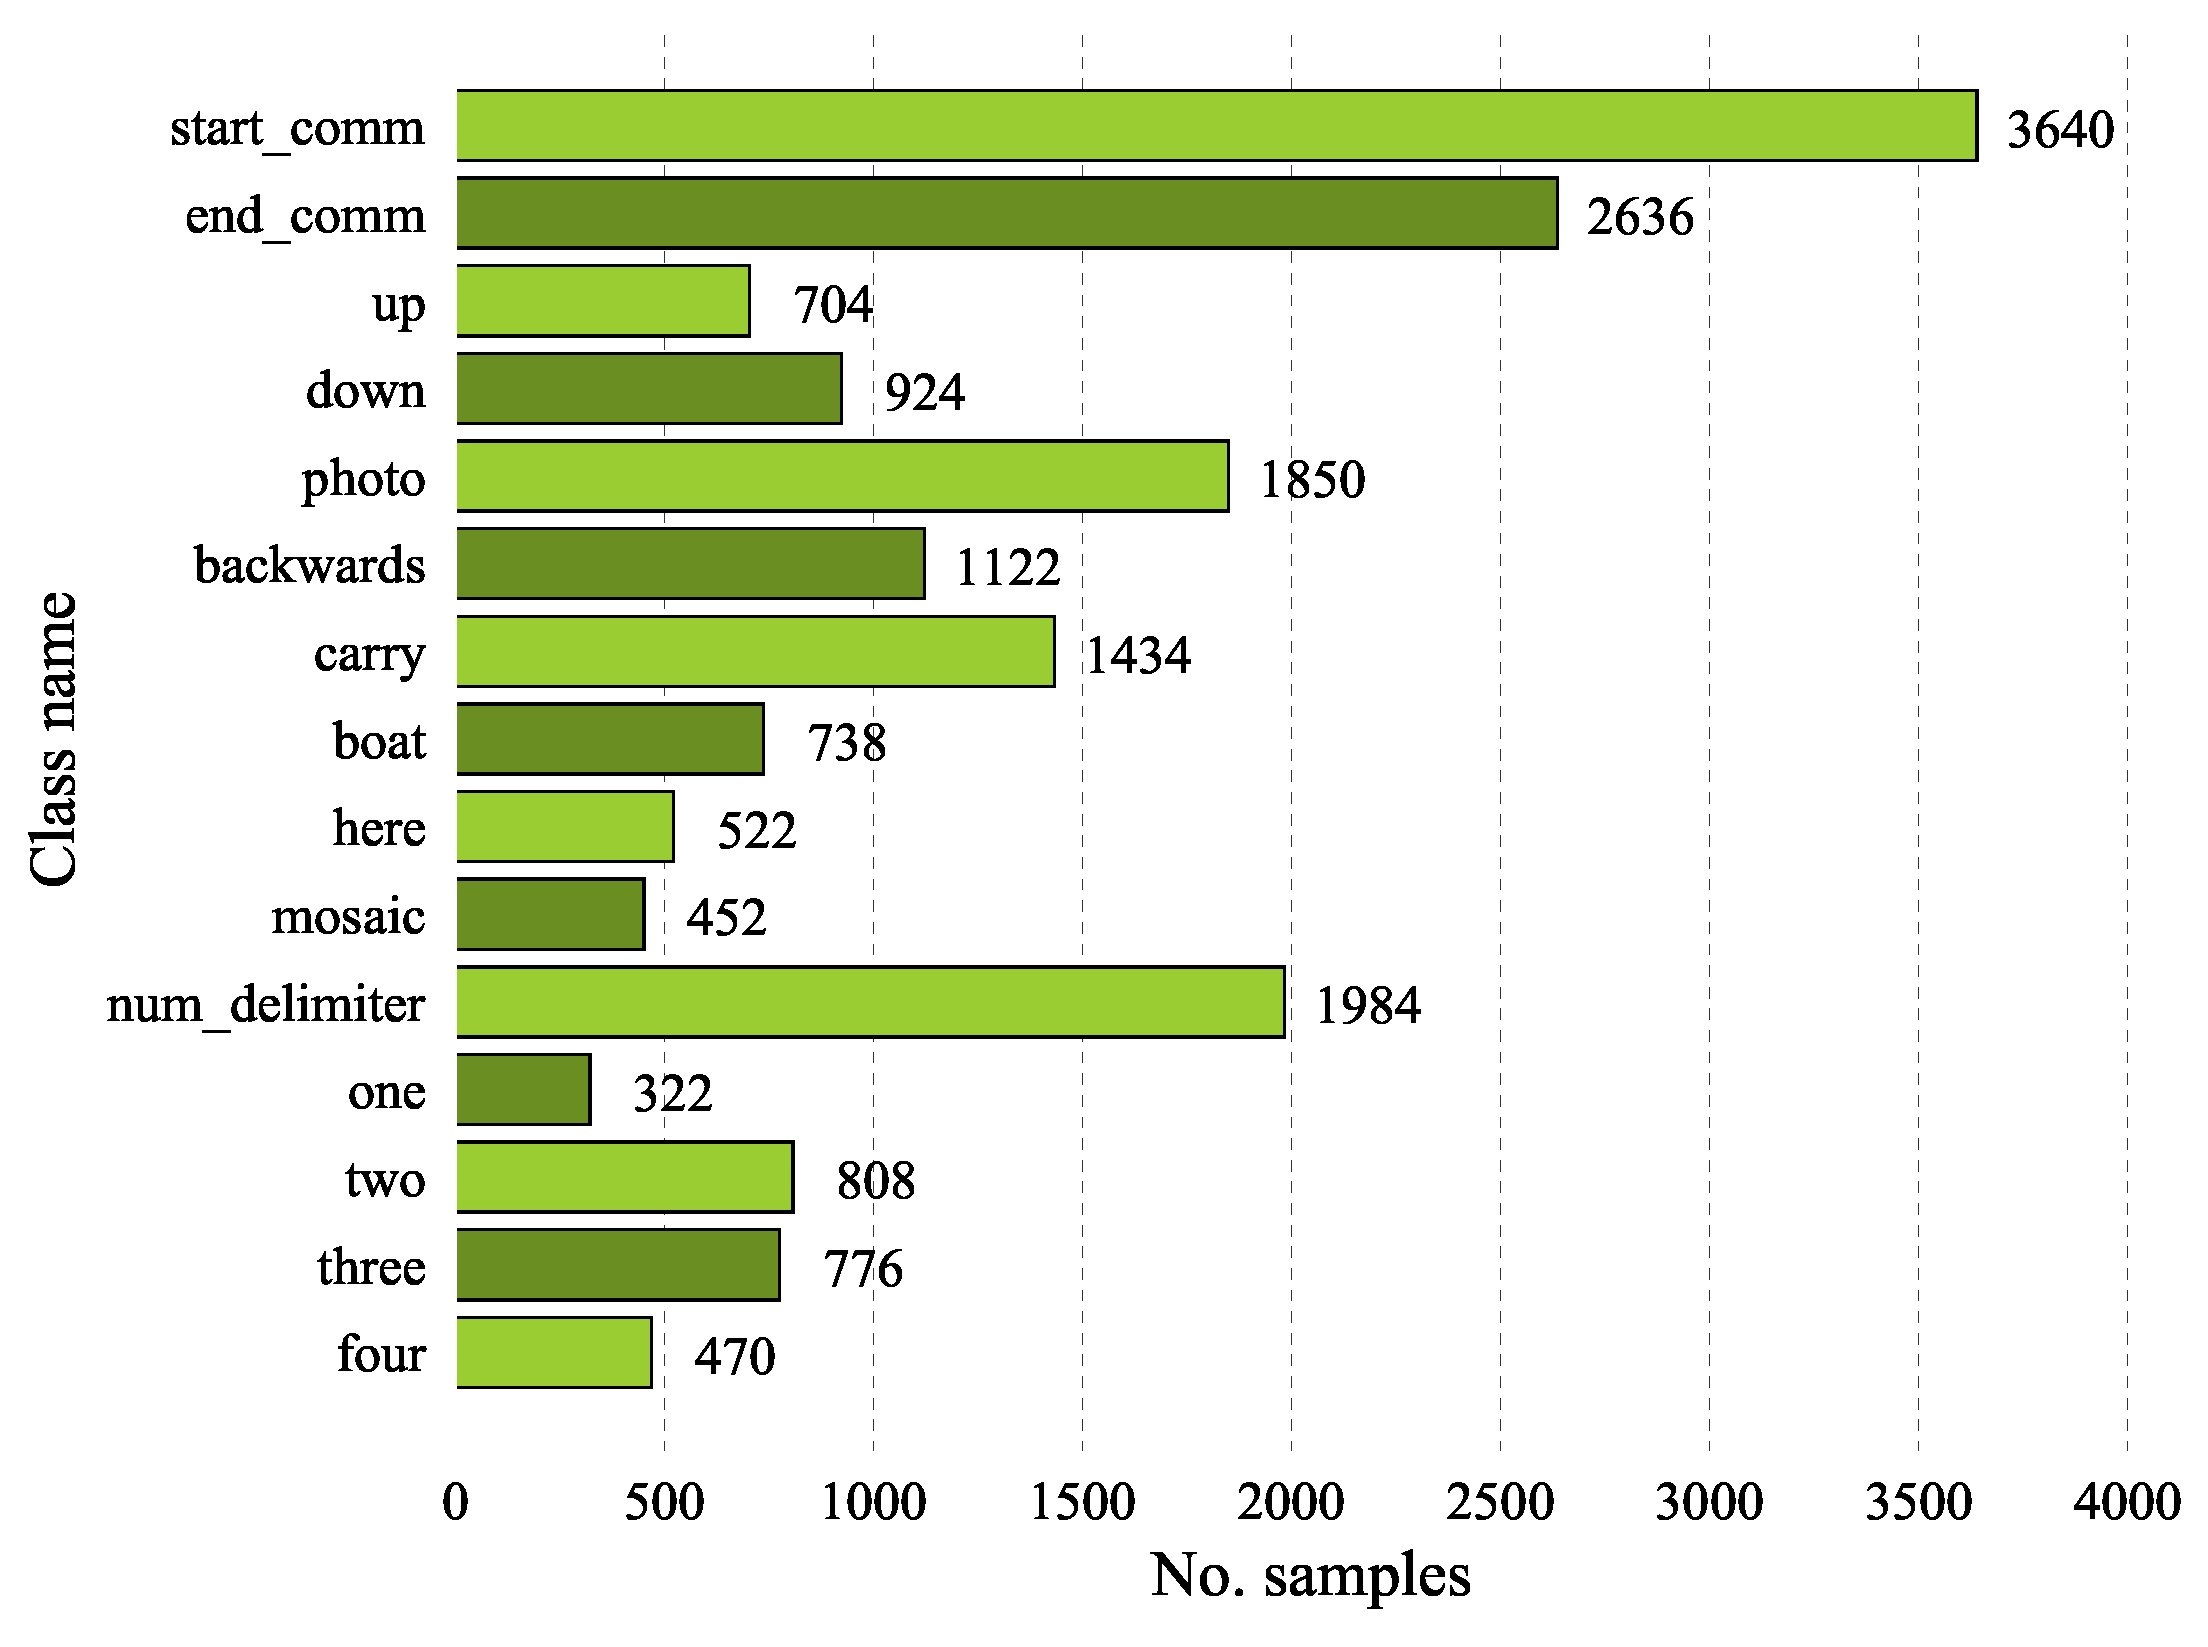
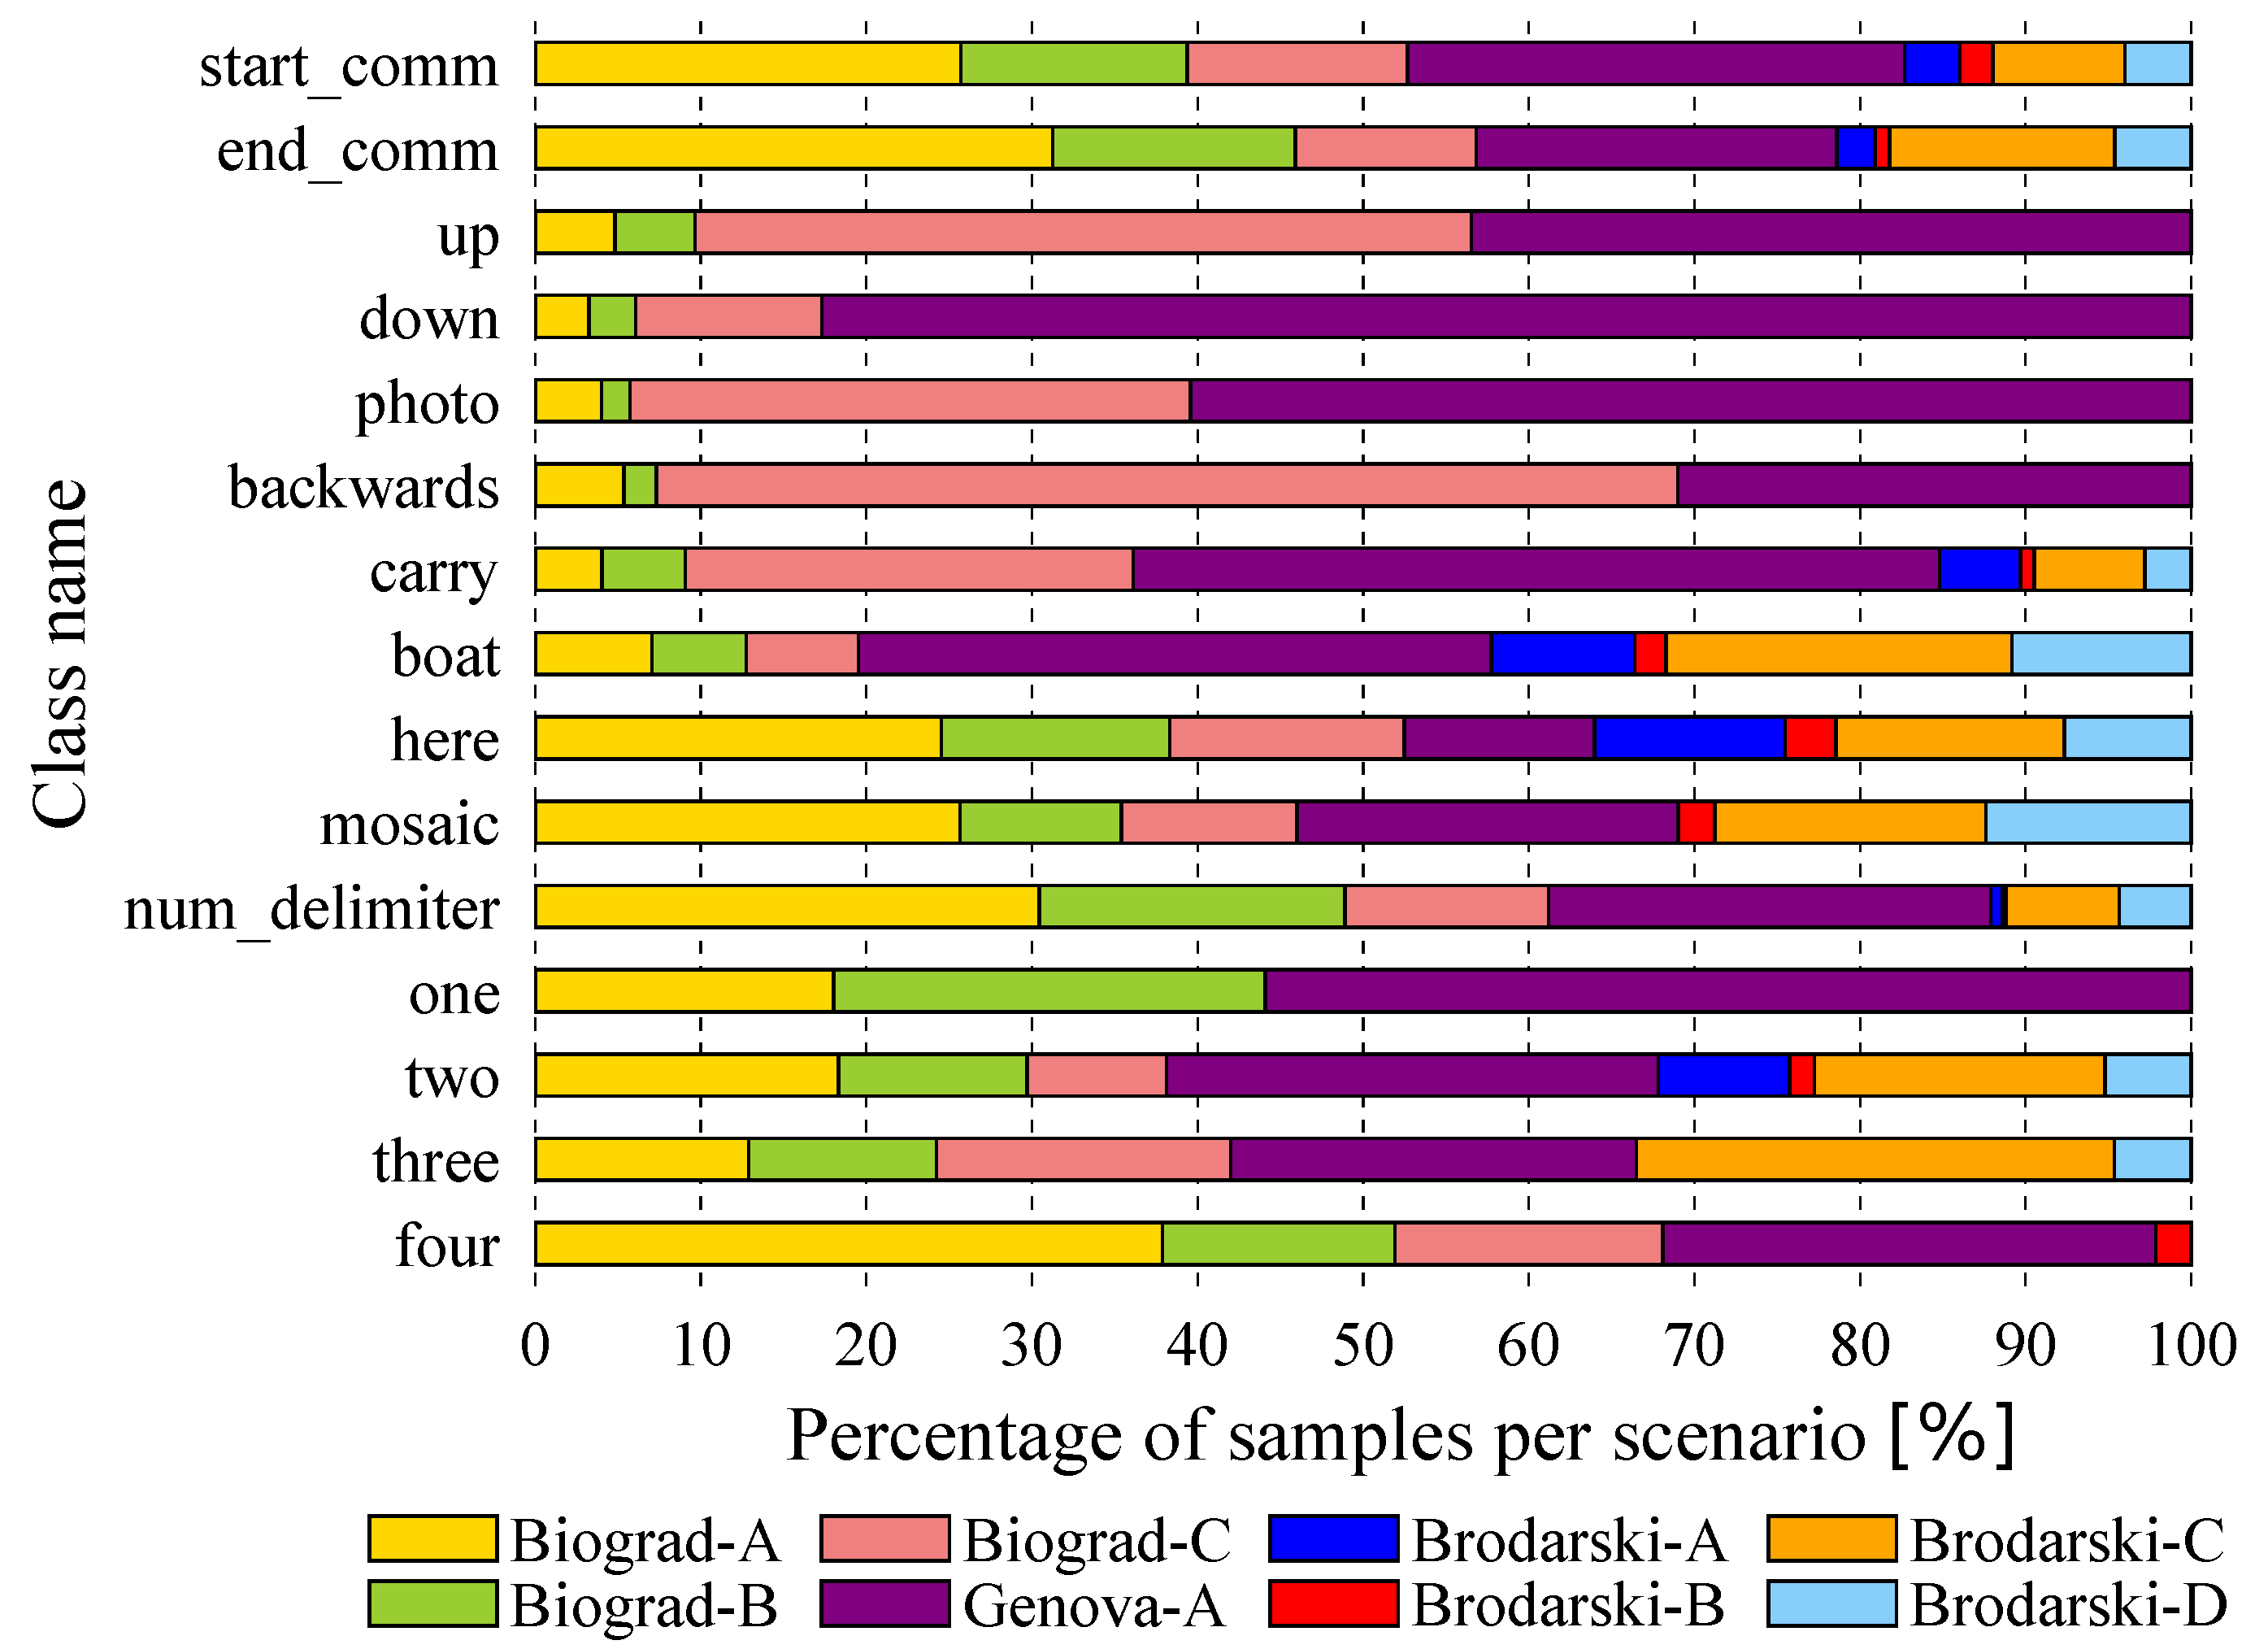
3.3.1. Data Distribution and Processing
- Test algorithms and/or image features robustness across different unseen settings.
- Investigate which environmental conditions have greater impact on classification methods.
- Balance the number of training samples used per scenario to achieve better performance, or
- Create specific training/test sets by associating data samples across different scenarios based on a particular criteria, e.g., recording location, image quality, distance to camera, etc.
- Find approaches that fuse 2D and 3D information from the stereo pairs to boost performance.
- Test not only object classification methods but also object detectors, i.e., locate the diver’s hand, and color constancy algorithms.
3.3.2. Data Parsing
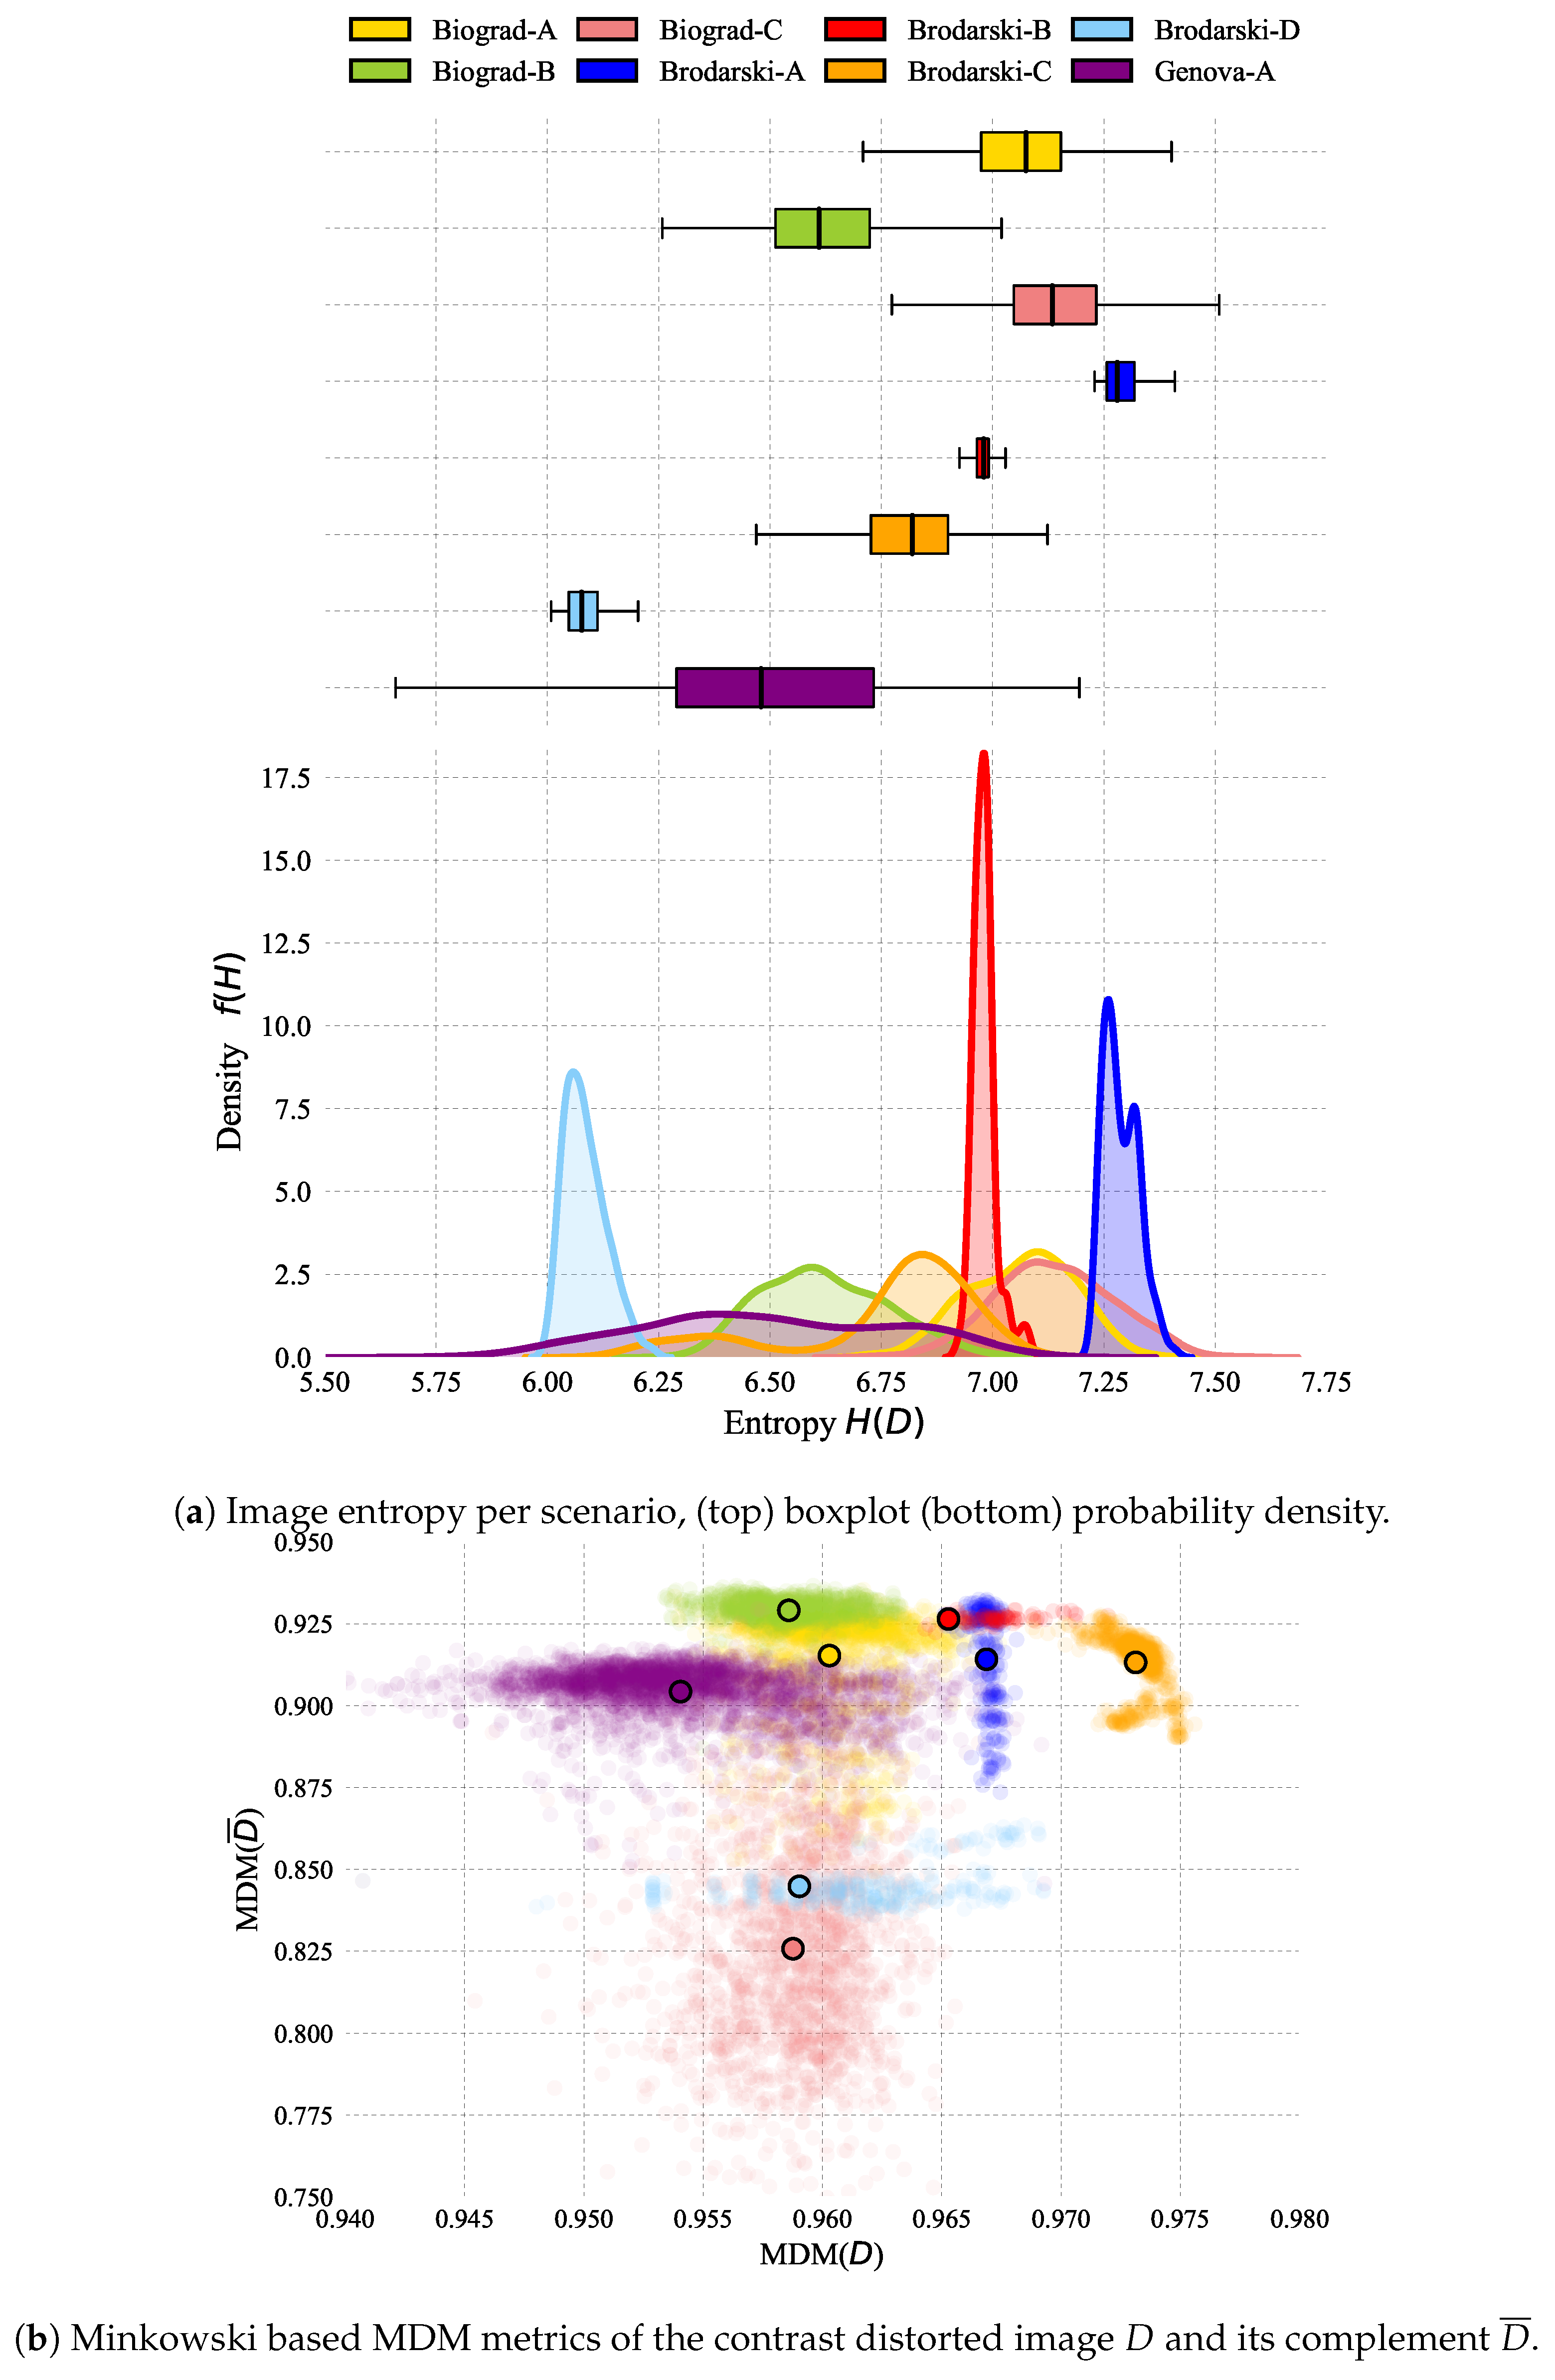
- Scenario: Name corresponding to a location that encompasses particular settings affecting the quality of the image according to Table 1.
- Stereo left/right: String to the path where the image is saved. The file basename also indicates the scenario from which it is taken, a sequence number and the stereo view it corresponds to, e.g., biograd-A_00123_left.jpg.
- Label name: String that identifies the gesture class.
- Label id: Integer that identifies the gesture class.
- Roi left/right: Arrays that describe the regions of interest in the left/right image, i.e., where the hand gesture is located. Each array element is separated by a comma. When two instances of the target object are present in the image, each array is separated by a semicolon (this is only true for the mosaic gesture).
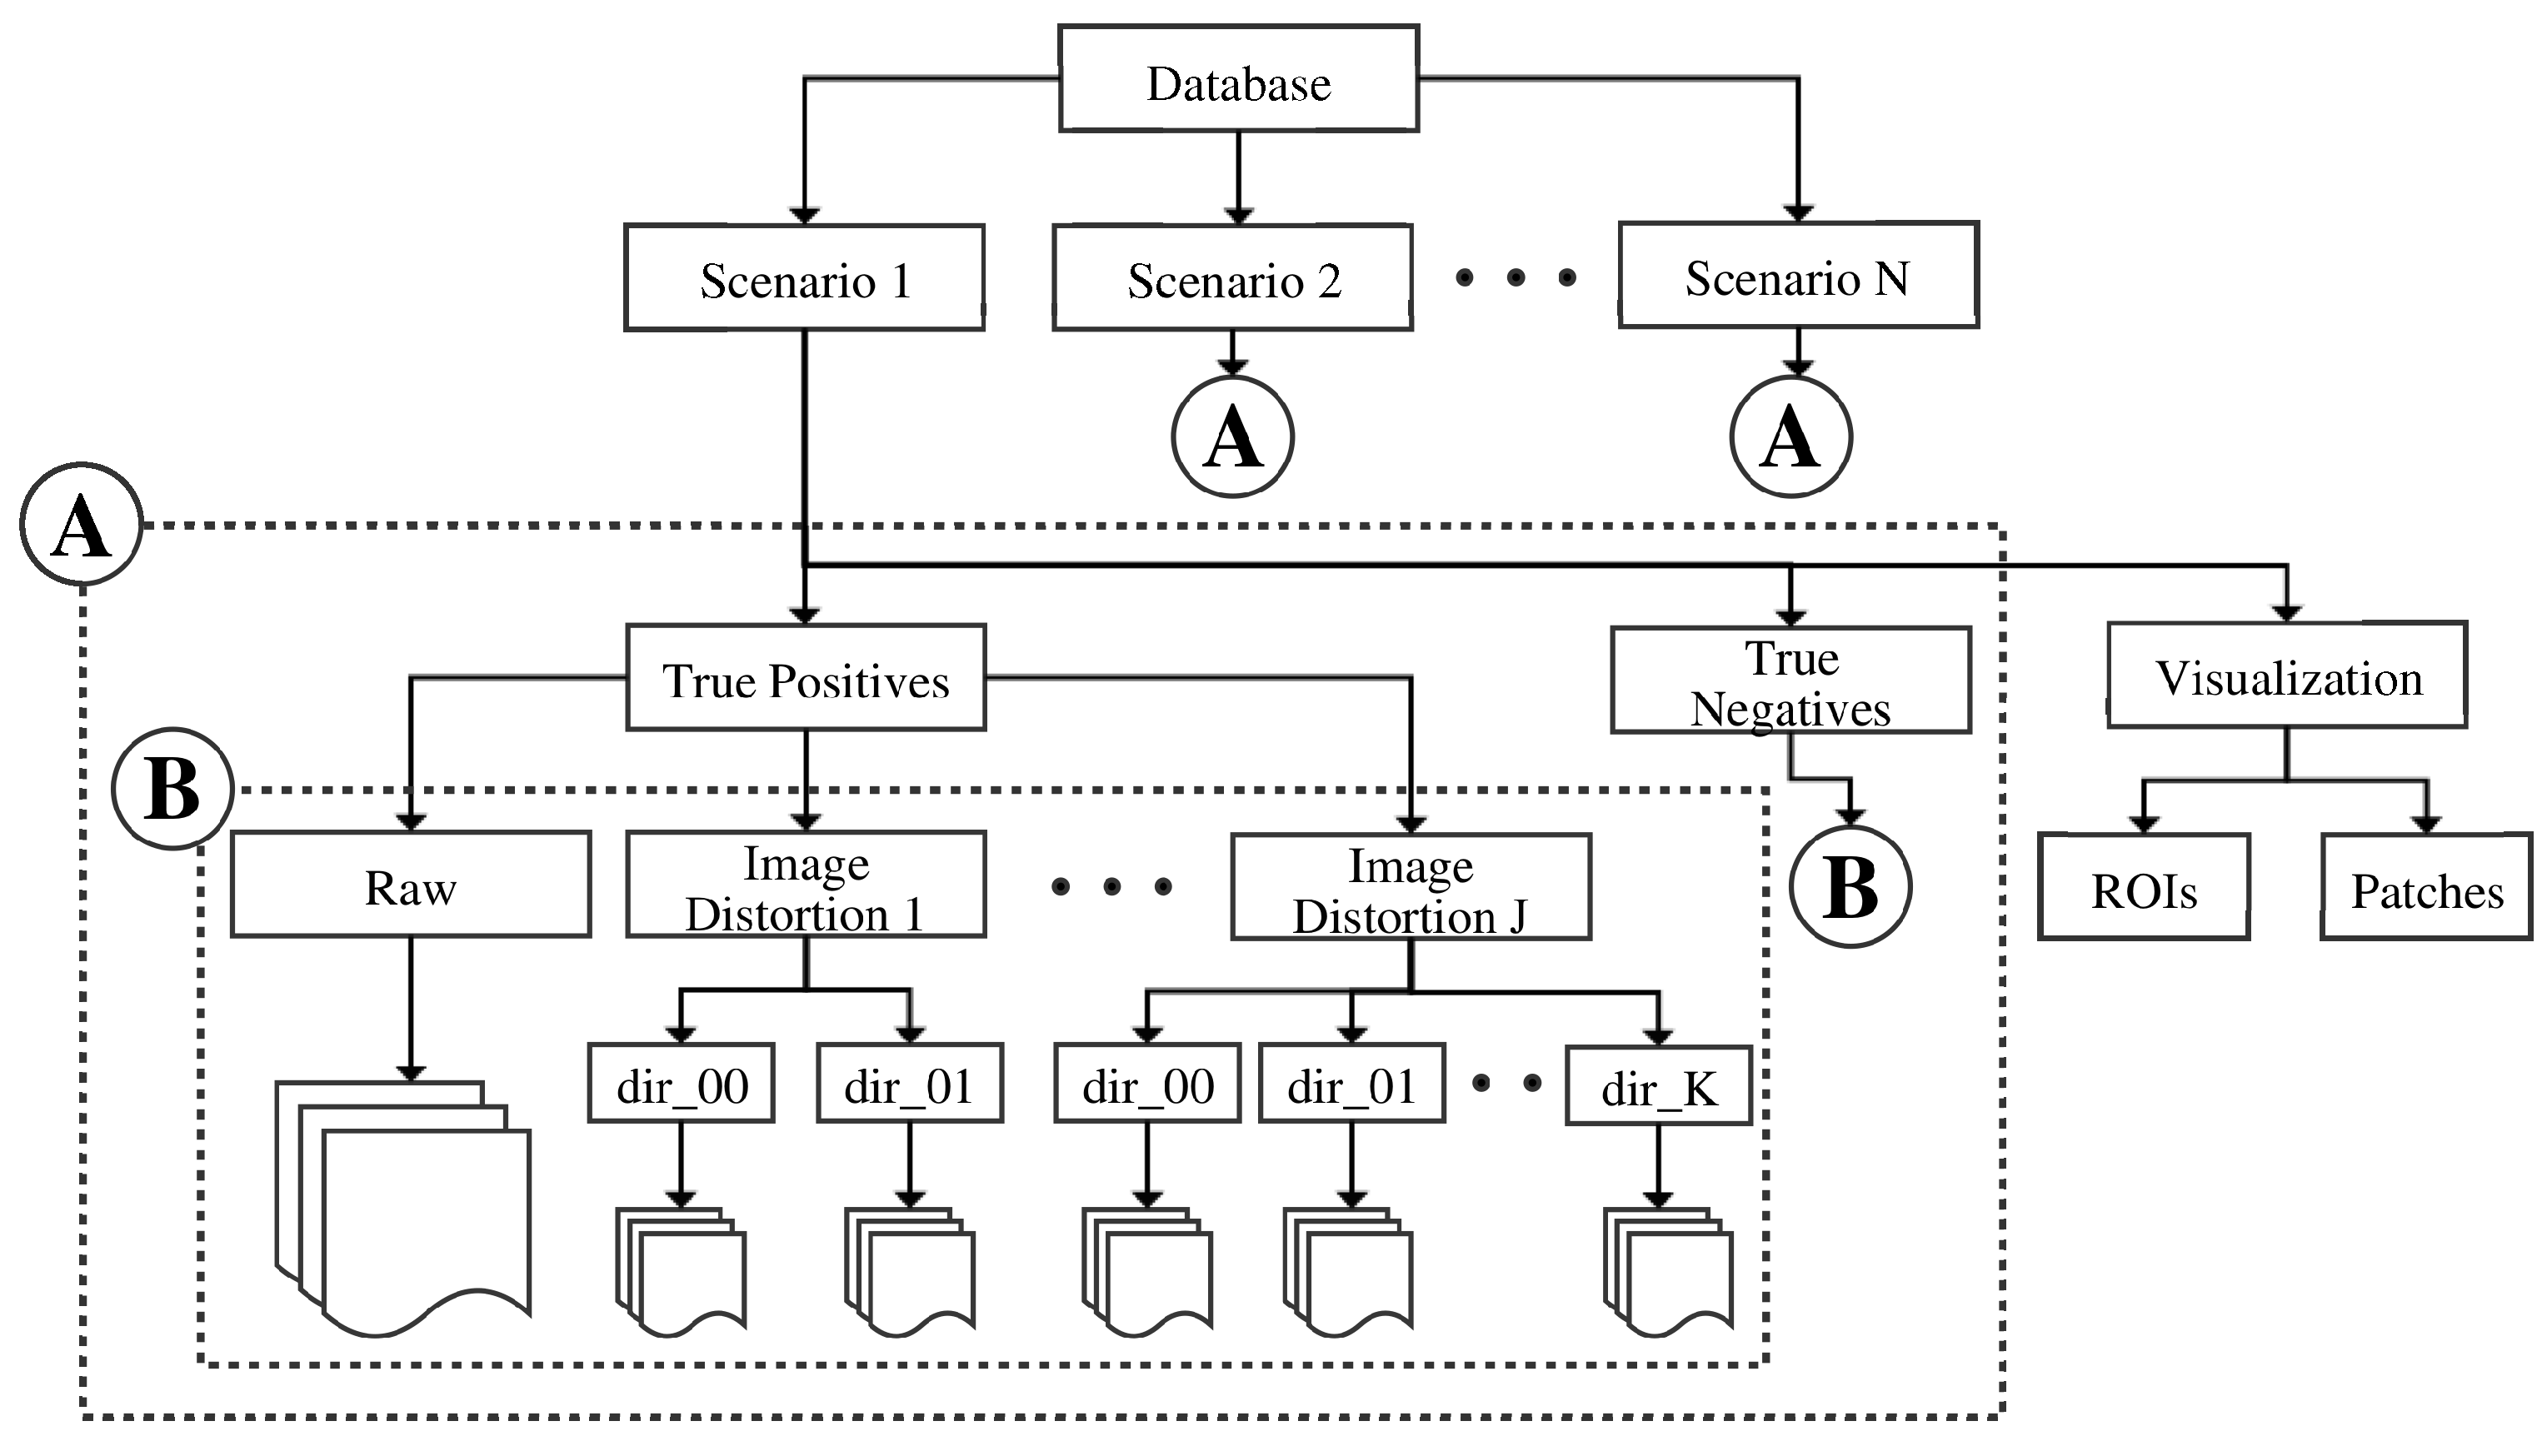
3.3.3. Database Directory and Provided Software
- Parse and visualization scripts to:
- Camera intrinsic calibration files
- Software tools to calibrate underwater cameras with flat-glass panels (CamOdCal+Pinax).
3.4. Diver Pose Estimation
3.4.1. Data Distribution and Processing
3.4.2. Data Parsing
- Scenario: Name corresponding to recording the location and specific settings as in Table 1.
- Sequence: Integer that identifies the sequence to which the stereo pair belongs. An image only belongs to a sequence if its from the same scenario and forms part of a set continuous in time.
- Stereo left/right: c.f. Table 3.
- Heading: Float number in degrees that indicates the diver heading.
3.4.3. Database Directory and Provided Software
- Extract stereo pairs sets given a scenario name, a sequence or a combination of both.
- Extract all stereo pairs associated with a range of heading values.
- Output a sequence as video file for visualization purposes.
4. Conclusions
Author Contributions
Funding
Acknowledgments
Conflicts of Interest
References
- Mis̆ković, N.; Pascoal, A.; Bibuli, M.; Caccia, M.; Neasham, J.A.; Birk, A.; Egi, M.; Grammer, K.; Marroni, A.; Vasilijevic, A.; et al. CADDY project, year 3: The final validation trials. In Proceedings of the OCEANS 2017, Aberdeen, UK, 19–22 June 2017. [Google Scholar]
- Chiarella, D.; Bibuli, M.; Bruzzone, G.; Caccia, M.; Ranieri, A.; Zereik, E.; Marconi, L.; Cutugno, P. Gesture-based language for diver–robot underwater interaction. In Proceedings of the OCEANS 2015, Genoa, Italy, 18–21 May 2015. [Google Scholar]
- Chiarella, D.; Bibuli, M.; Bruzzone, G.; Caccia, M.; Ranieri, A.; Zereik, E.; Marconi, L.; Cutugno, P. A Novel Gesture-Based Language for Underwater Human–Robot Interaction. J. Mar. Sci. Eng. 2018, 6, 91. [Google Scholar] [CrossRef]
- Goodfellow, G.M.; Neasham, J.A.; Rendulic, I.; Nad, D.; Miskovic, N. DiverNet—A network of inertial sensors for real time diver visualization. In Proceedings of the 2015 IEEE Sensors Applications Symposium (SAS), Zadar, Croatia, 13–15 April 2015. [Google Scholar]
- Garcia, R.; Gracias, N. Detection of interest points in turbid underwater images. In Proceedings of the OCEANS 2011 IEEE, Santander, Spain, 6–9 June 2011. [Google Scholar]
- Rizzini, D.L.; Kallasi, F.; Oleari, F.; Caselli, S. Investigation of Vision-Based Underwater Object Detection with Multiple Datasets. Int. J. Adv. Robot. Syst. 2015, 12, 77. [Google Scholar] [CrossRef]
- Islam, M.J.; Fulton, M.; Sattar, J. Towards a Generic Diver-Following Algorithm: Balancing Robustness and Efficiency in Deep Visual Detection. arXiv, 2018; arXiv:1809.06849. [Google Scholar]
- Islam, M.J.; Ho, M.; Sattar, J. Dynamic Reconfiguration of Mission Parameters in Underwater Human-Robot Collaboration. In Proceedings of the 2018 IEEE International Conference on Robotics and Automation (ICRA), Brisbane, QLD, Australia, 21–25 May 2018. [Google Scholar]
- Schettini, R.; Corchs, S. Underwater Image Processing: State of the Art of Restoration and Image Enhancement Methods. EURASIP J. Adv. Signal Process. 2010, 2010, 14. [Google Scholar] [CrossRef]
- Stilinovic, N.; Nad, D.; Miskovic, N. AUV for diver assistance and safety—Design and implementation. In Proceedings of the OCEANS 2015, Genoa, Italy, 18–21 May 2015. [Google Scholar]
- Odetti, A.; Bibuli, M.; Bruzzone, G.; Caccia, M.; Spirandelli, E.; Bruzzone, G. e-URoPe: a reconfgurable AUV/ROV for man-robot underwater cooperation. In Proceedings of the 2017 IFAC-PapersOnLine, Toulouse, France, 9–14 July 2017. [Google Scholar]
- Treibitz, T.; Schechner, Y.; Kunz, C.; Singh, H. Flat Refractive Geometry. IEEE Trans. Pattern Anal. Mach. Intell. 2012, 34, 51–65. [Google Scholar] [CrossRef] [PubMed]
- Łuczyński, T.; Pfingsthorn, M.; Birk, A. The Pinax-model for accurate and efficient refraction correction of underwater cameras in flat-pane housings. Ocean Eng. 2017, 133, 9–22. [Google Scholar] [CrossRef]
- Łuczyński, T.; Pfingsthorn, M.; Birk, A. Image Rectification with the Pinax Camera Model in Underwater Stereo Systems with Verged Cameras. In Proceedings of the OCEANS 2017, Anchorage, AK, USA, 18–21 September 2017. [Google Scholar]
- Heng, L.; Li, B.; Pollefeys, M. CamOdoCal: Automatic intrinsic and extrinsic calibration of a rig with multiple generic cameras and odometry. In Proceedings of the 2013 IEEE/RSJ International Conference on Intelligent Robots and Systems, Tokyo, Japan, 3–7 November 2013. [Google Scholar]
- Kannala, J.; Brandt, S.S. A generic camera model and calibration method for conventional, wide-angle, and fish-eye lenses. IEEE Trans. Pattern Anal. Mach. Intell. 2006, 28, 1335–1340. [Google Scholar] [CrossRef] [PubMed]
- Merkel, D. Docker: Lightweight Linux Containers for Consistent Development and Deployment. Linux J. 2014, 2014, 2. [Google Scholar]
- Jacobs University Bremen gGmbH. Underwater Camera Calibration (CamOdoCal+PinAx). Available online: https://github.com/jacobs-robotics/uw-calibration-pinax (accessed on 5 January 2019).
- Madgwick, S.O.H.; Harrison, A.J.L.; Vaidyanathan, R. Estimation of IMU and MARG orientation using a gradient descent algorithm. In Proceedings of the 2011 IEEE International Conference on Rehabilitation Robotics, Zurich, Switzerland, 29 June–1 July 2011. [Google Scholar]
- Nad, D.; Mandic, F.; Miskovic, N. Diver Tracking Using Path Stabilization—The Virtual Diver Experimental Results. IFAC-PapersOnLine 2016, 49, 214–219. [Google Scholar] [CrossRef]
- National Research Council of Italy and Jacobs University Bremen gGmbH. CADDY Underwater Stereo-Vision Dataset. Available online: http://caddy-underwater-datasets.ge.issia.cnr.it/ (accessed on 5 January 2019).
- Nafchi, H.Z.; Cheriet, M. Efficient No-Reference Quality Assessment and Classification Model for Contrast Distorted Images. IEEE Trans. Broadcast. 2018, 64, 518–523. [Google Scholar] [CrossRef]
- Gu, K.; Lin, W.; Zhai, G.; Yang, X.; Zhang, W.; Chen, C.W. No-Reference Quality Metric of Contrast-Distorted Images Based on Information Maximization. IEEE Trans. Cybern. 2017, 47, 4559–4565. [Google Scholar] [CrossRef] [PubMed]
- Fang, Y.; Ma, K.; Wang, Z.; Lin, W.; Fang, Z.; Zhai, G. No-Reference Quality Assessment of Contrast- Distorted Images Based on Natural Scene Statistics. IEEE Signal Process. Lett. 2015, 22, 838–842. [Google Scholar] [CrossRef]
- Gu, K.; Zhai, G.; Lin, W.; Liu, M. The Analysis of Image Contrast: From Quality Assessment to Automatic Enhancement. IEEE Trans. Cybern. 2016, 46, 284–297. [Google Scholar] [CrossRef] [PubMed]
- McGlamery, B.L. A Computer Model For Underwater Camera Systems. Proc. SPIE 1980, 208, 221–232. [Google Scholar] [CrossRef]
- Bonin-Font, F.; Burguera, A.; Oliver, G. Imaging systems for advanced underwater vehicles. J. Marit. Res. 2011, 8, 65–86. [Google Scholar]
- Ciurea, F.; Funt, B. A Large Image Database for Color Constancy Research. In Proceedings of the 11th Color Imaging Conference, Scottsdale, AZ, USA, 13 November 2003. [Google Scholar]
- Cheng, D.; Prasad, D.K.; Brown, M.S. Illuminant estimation for color constancy: why spatial-domain methods work and the role of the color distribution. J. Opt. Soc. Am. A 2014, 31, 1049–1058. [Google Scholar] [CrossRef] [PubMed]
- Cheng, D.; Price, B.; Cohen, S.; Brown, M.S. Beyond White: Ground Truth Colors for Color Constancy Correction. In Proceedings of the 2015 IEEE International Conference on Computer Vision (ICCV), Santiago, Chile, 7–13 December 2015. [Google Scholar]
- Chavez, A.G.; Mueller, C.A.; Birk, A.; Babic, A.; Miskovic, N. Stereo-vision based diver pose estimation using LSTM recurrent neural networks for AUV navigation guidance. In Proceedings of the OCEANS 2017, Aberdeen, UK, 19–22 June 2017. [Google Scholar]


| Location | Scenario | Type | Dynamics | Entropy | Recording Action | ||
|---|---|---|---|---|---|---|---|
| Biograd na Moru, Croatia | Biograd-A | Open sea | No current | ± 0.12 | ± 0.002 | ± 0.016 | Gestures |
| Biograd-B | Open sea | No current | ± 0.14 | ± 0.001 | ± 0.005 | Gestures, Diver pose | |
| Biograd-C | Open sea | Strong currents, diver non-static | ± 0.13 | ± 0.003 | ± 0.031 | Gestures | |
| Brodarski Institute, Croatia | Brodarski-A | Indoor pool | No current | ± 0.03 | ± 0.001 | ± 0.016 | Gestures, Diver pose |
| Brodarski-B | Indoor pool | No current | ± 0.02 | ± 0.014 | ± 0.001 | Gestures, Diver pose | |
| Brodarski-C | Indoor pool | No current | ± 0.21 | ± 0.001 | ± 0.009 | Gestures | |
| Brodarski-D | Indoor pool | No current | ± 0.04 | ± 0.017 | ± 0.006 | Gestures | |
| Genova Italy | Genova-A | Outdoor pool | Diver non-static | ± 0.28 | ± 0.005 | ± 0.008 | Gestures |
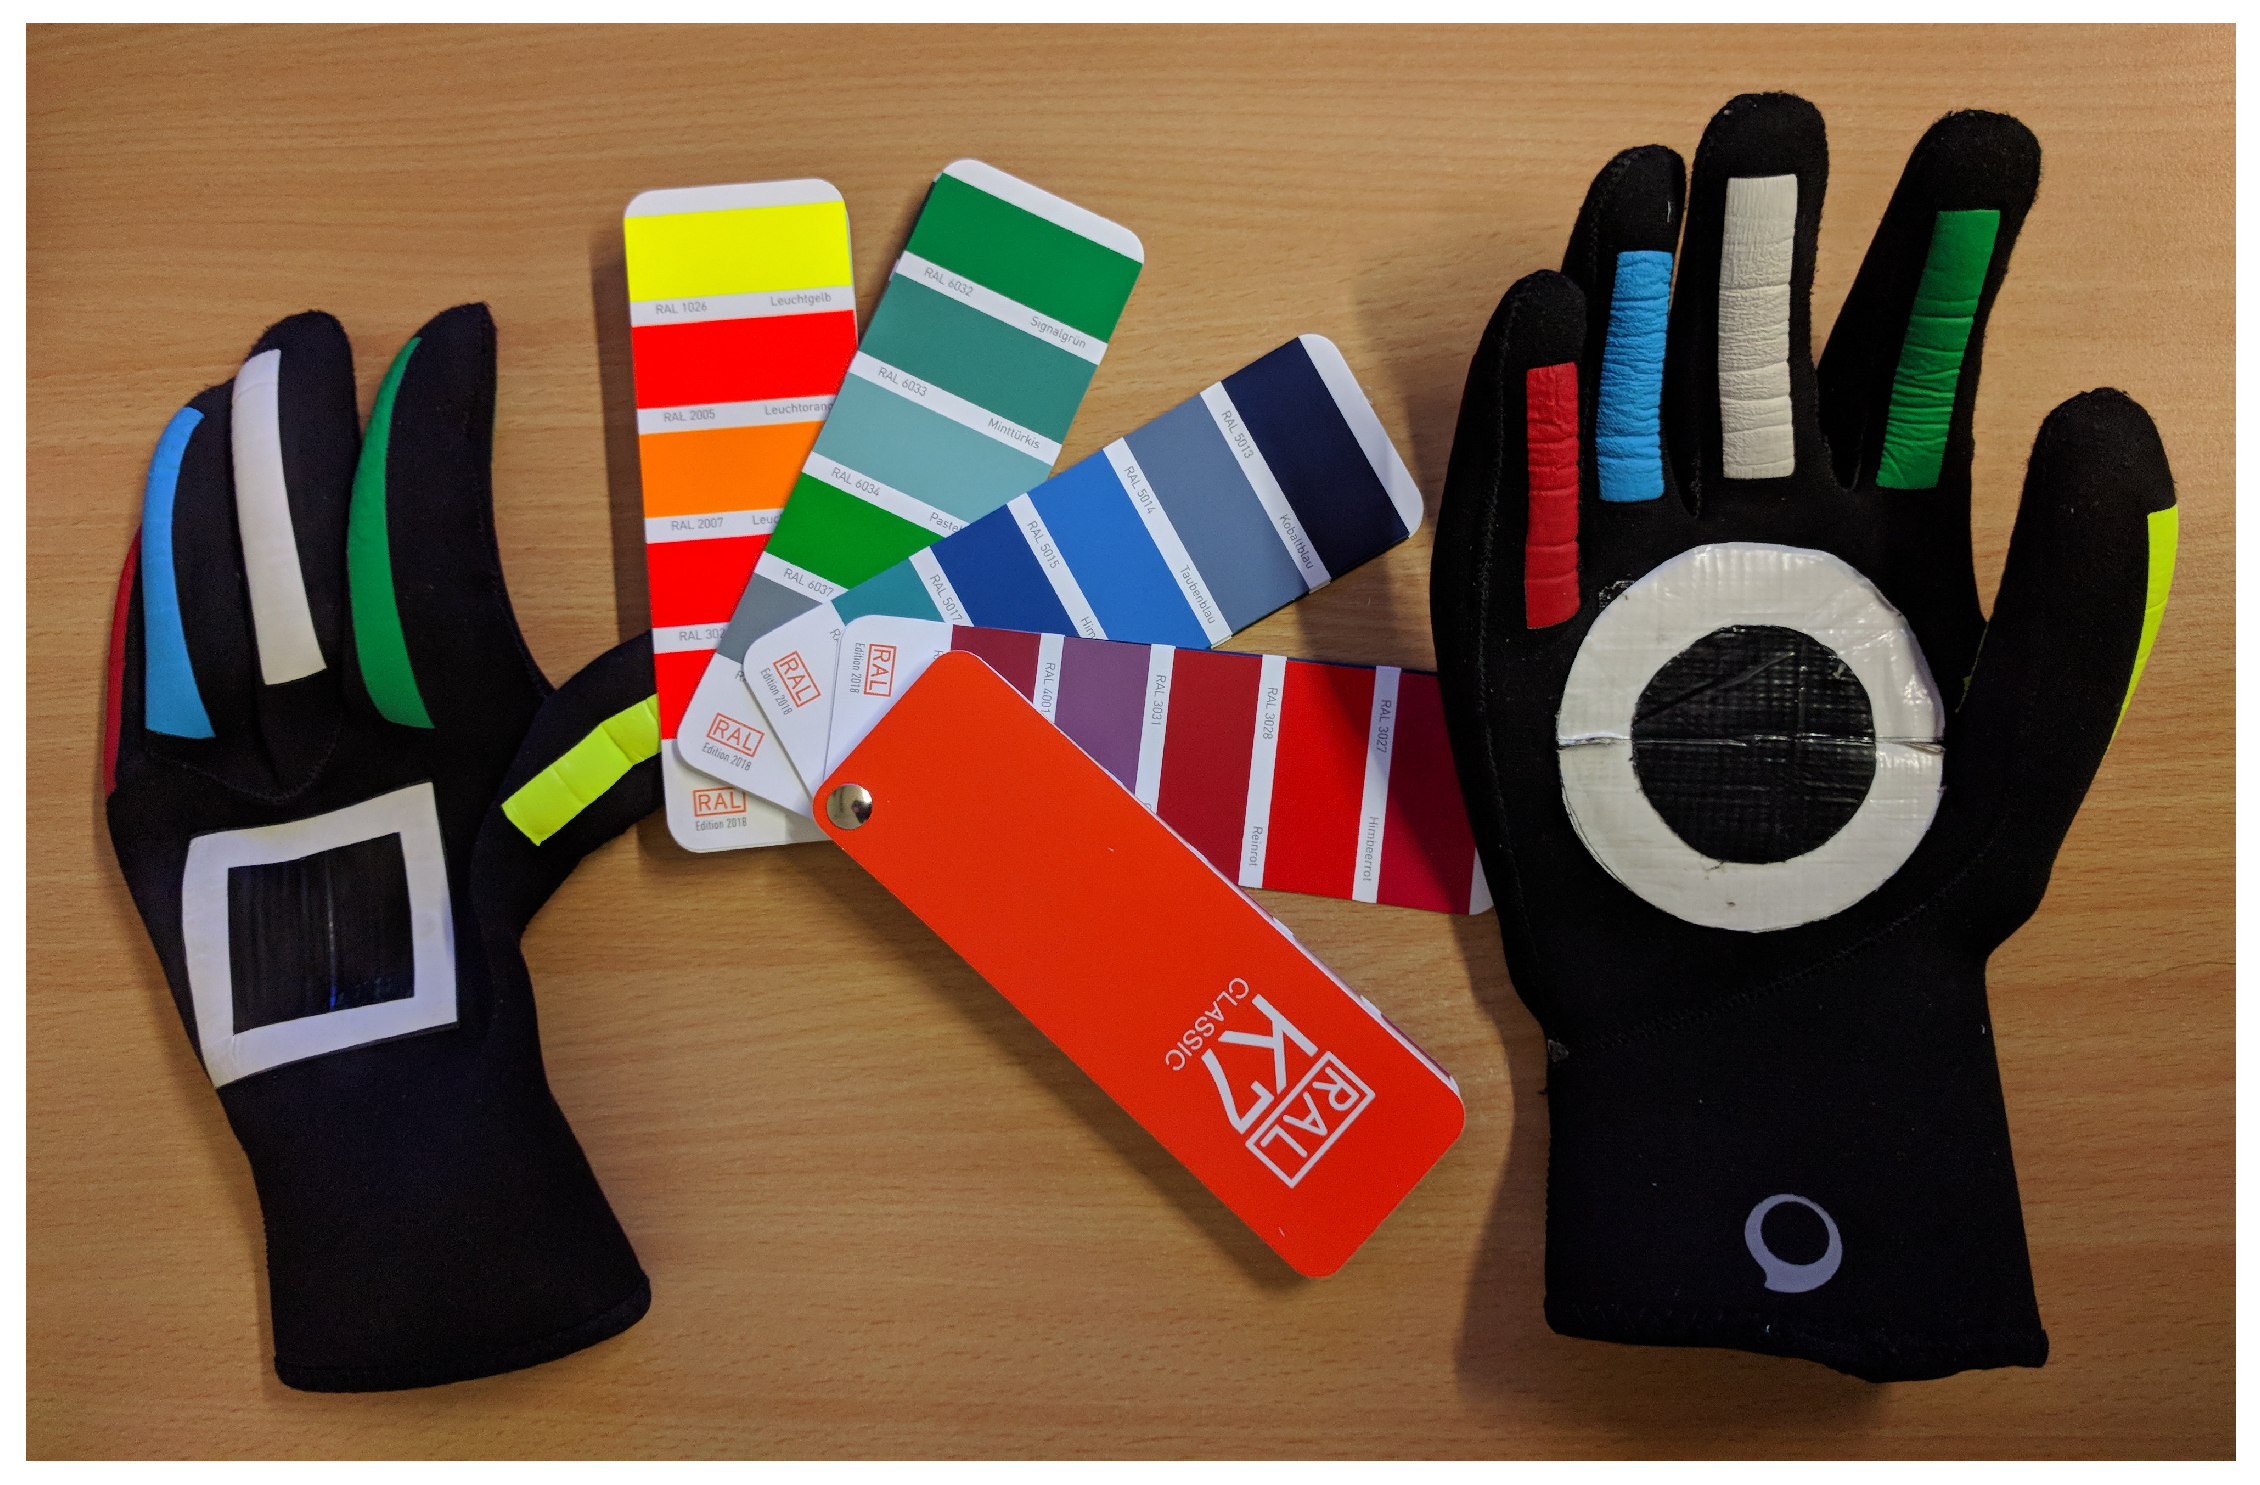
| Finger | HSV | RAL-K7 Value 1 | RAL-K7 Value 2 | ||
|---|---|---|---|---|---|
| Code | HSV | Code | HSV | ||
| Index | 142, 98, 43 | 6037 | 131, 99, 52 | 6033 | 175, 62, 49 |
| Middle | 47, 16, 67 | 9003 | 71, 8, 98 | 9010 | 53, 14, 105 |
| Ring | 203, 82, 71 | 5015 | 213, 81, 74 | 5017 | 219, 87, 53 |
| Little | 357, 91, 64 | 3028 | 358, 96, 76 | 3031 | 355, 86, 59 |
| Thumb | 72, 83, 78 | 1026 | 62, 99, 92 | 1016 | 49, 81, 88 |
| Scenario | Stereo Left | Stereo Right | Label Name | Label Id | Roi Left | Roi Right | |
|---|---|---|---|---|---|---|---|
| 0 | Recording scenario name | Filepath to stereo left image | Filepath to stereo right image | String class name | Integer class ID | Array: [top corner X, top corner Y, width, height] | Array: [top corner X, top corner Y, width, height] |
| 1 | biograd-A | biograd-A _00003_left.jpg | biograd-A _00003_right.jpg | boat | 7 | [231, 231, 62, 83] | [152, 231, 62, 83] |
| 2 | genova-A | genova-A _00012_left.jpg | genova-A _00003_right.jpg | true_neg | −1 | NaN | NaN |
| Synthetic | iqa_ mdm_entropy | iqa _ mdm_d | iqa_ mdm_dcomp | Distortion | Param 1 | Param 2 | |
|---|---|---|---|---|---|---|---|
| 0 | 0 | NaN | NaN | NaN | |||
| 1 | 1 | NaN | NaN | NaN | blur | 13 | NaN |
| 2 | 1 | NaN | NaN | NaN | low contrast | 0.6 | NaN |
| 3 | 1 | NaN | NaN | NaN | compression | jpeg | 65 |
| Scenario | Sequence | Stereo Left | Stereo Right | Heading | |
|---|---|---|---|---|---|
| 0 | Scenario Name | Integer ID | c.f. Table 3 | c.f. Table 3 | Float (deg) |
| 1 | Brodarski-B | 0 | c.f. Table 3 | c.f. Table 3 | 31.42 |
| 2 | Biograd-A | 3 | c.f. Table 3 | c.f. Table 3 | −74.51 |
© 2019 by the authors. Licensee MDPI, Basel, Switzerland. This article is an open access article distributed under the terms and conditions of the Creative Commons Attribution (CC BY) license (http://creativecommons.org/licenses/by/4.0/).
Share and Cite
Gomez Chavez, A.; Ranieri, A.; Chiarella, D.; Zereik, E.; Babić, A.; Birk, A. CADDY Underwater Stereo-Vision Dataset for Human–Robot Interaction (HRI) in the Context of Diver Activities. J. Mar. Sci. Eng. 2019, 7, 16. https://doi.org/10.3390/jmse7010016
Gomez Chavez A, Ranieri A, Chiarella D, Zereik E, Babić A, Birk A. CADDY Underwater Stereo-Vision Dataset for Human–Robot Interaction (HRI) in the Context of Diver Activities. Journal of Marine Science and Engineering. 2019; 7(1):16. https://doi.org/10.3390/jmse7010016
Chicago/Turabian StyleGomez Chavez, Arturo, Andrea Ranieri, Davide Chiarella, Enrica Zereik, Anja Babić, and Andreas Birk. 2019. "CADDY Underwater Stereo-Vision Dataset for Human–Robot Interaction (HRI) in the Context of Diver Activities" Journal of Marine Science and Engineering 7, no. 1: 16. https://doi.org/10.3390/jmse7010016
APA StyleGomez Chavez, A., Ranieri, A., Chiarella, D., Zereik, E., Babić, A., & Birk, A. (2019). CADDY Underwater Stereo-Vision Dataset for Human–Robot Interaction (HRI) in the Context of Diver Activities. Journal of Marine Science and Engineering, 7(1), 16. https://doi.org/10.3390/jmse7010016