Article

An Operational Marine Oil Spill Forecasting Tool for the Management of Emergencies in the Italian Seas

1
National Research Council—Institute for the Study of Anthropic impacts and Sustainability in Marine Environment, loc. Sa Mardini snc—Torregrande, 09170 Oristano, Italy
2
National Research Council—Institute of Marine Sciences, Arsenale Castello, 2737/F, 30122 Venezia, Italy
3
National Research Council—Institute for High Performance Computing and Networking, via Pietro Castellino 111, 80131 Napoli, Italy
*
Author to whom correspondence should be addressed.
J. Mar. Sci. Eng. 2019, 7(1), 1; https://doi.org/10.3390/jmse7010001
Submission received: 3 December 2018 / Revised: 13 December 2018 / Accepted: 15 December 2018 / Published: 20 December 2018
(This article belongs to the Special Issue Marine Oil Spills 2018)

Abstract

:
Oil extraction platforms are potential sources of oil spills. For this reason, an oil spill forecasting system was set up to support the management of emergencies from the oil fields in the Italian seas. The system provides ready-to-use products to the relevant response agencies and optimizes the anti-pollution resources by assessing hazards and risks related to this issue. The forecasting system covers seven working oil platforms in the Sicily Channel and middle/low Adriatic Sea. It is composed of a numerical chain involving nested ocean models from regional to coastal spatial scales and an oil spill model. The system provides two online services, one automatic and a second dedicated to possible real emergencies or exercises on risk preparedness and responding. The automatic service produces daily short-term simulations of hypothetical oil spill dispersion, transport, and weathering processes from each extraction platform. Products, i.e., risk maps, animations, and a properly called bulletin, are available on a dedicated web-portal. The hazard estimations are computed by performing geo-statistical analysis on the daily forecasts database. The second service is activated in near-real-time producing oil spill simulations for the following 48 h.

1. Introduction

The success of oil spill mitigation actions is closely dependent on the time necessary to detect the slick and predict its fate (i.e., slick displacement and dispersion), in order to permit governmental response agencies in planning and providing a specific and timely intervention at sea. The oil slick detection can be done in situ or by satellite, while its forecast is usually performed through more or less complex systems of numerical simulation with the application of empirical and semi-empirical algorithms, or the estimate of a surface water masses path starting from the intensity of winds [1,2,3,4,5,6]. The most advanced systems currently used incorporate both the weather–marine physical forcing and a Lagrangian module that reproduces trajectories, diffusion, and transformation processes of the oil slicks [7,8]. The knowledge of the marine and the weather components is essential to treat any kind of oil pollution, like that coming from maritime accidents with relative spillage of hydrocarbons, or chronic pollution as a continuous release from punctual or diffuse sources. Numerical models are strictly deterministic and based on “primitive equations” for the reproduction of water circulation with a good reliability [9,10]. This approach provides an essential basis for a realistic numerical simulation of the complex processes of transformation and transport of “active” tracers, subject to change as a function of space and time. Therefore, oil spill transport and weathering processes can be provided through the use of numerical models suitably coupled with hydrodynamic ones [7,11,12,13]. Such a structured system, composed by a three-dimensional hydrodynamic model plus transport simulation and processing of the oil slick, allows users to obtain a space and time evolution of a potential spillage, and then provides important information for the management of a possible emergency. This integrated modelling system permits obtaining maps of potential hazard estimations (i.e., net of the coastal vulnerability) of the stranding/concentration of hydrocarbons in a stretch of coast as well (e.g., References [3,14]).
The Italian seas are subject to oil spill emergencies because there exists hydrocarbons exploration, extraction, and transport within them. In particular, the Sicily Channel and the low/middle Adriatic Sea have seven working oil extraction sites that are potential sources of pollution through accidental oil spills.
Due to an increasing sensibility of the Italian public opinion on marine oil pollution, the Italian Ministry of the Environment and Protection of Land and Sea (MATTM) recently planned to provide an oil spill forecasting system for the Italian seas. Starting from the experience gained in previous national and international projects [15,16], the Italian Research Council (CNR) has developed a forecasting tool regarding the dispersion and transformation of oil at sea and for the estimation of the “riskiness” do to possible oil spillage in the Sicily Channel and in the medium–low Adriatic Sea (Figure 1a,b, respectively).
The purpose of the system is two-fold: (a) To provide the responsible authority with possible indications on the spatial/temporal evolution of oil spills at sea in near-real-time in case of emergency events or planned exercises. This is important for optimizing both the resources and the management of the emergency. (b) To determine hazard estimations, based on statistics of the simulated dispersions, of a hydrocarbon slick virtually issued (i.e., simulated) using individual platforms according to different weather and sea conditions from the forecasting system. Such a system wishes to answer to three of the four priorities of the Sendai Framework for Disaster Risk Reduction (2015–2030) [17], adopted by United Nations (UN) Member States in March 2015. These priorities are the first, the second, and the fourth based on oil spill risk assessment, preparedness, and response, but focusing on the management of oil spill events at sea. Specifically, the first priority is on understanding the disaster risk, the second on strengthening disaster risk governance to manage it, and the fourth on enhancing disaster preparedness for an effective response.
In this paper, we describe the forecasting numerical system realized in the framework of the ministerial project “SOS-Piattaforme e Impatti Offshore” and highlight the main features of the service realized at this stage via CNR. Section 2 presents the study area and the oil rigs covered by the system, followed by its components in Section 3. In Section 4 we describe their processes of validation and show resulting products, i.e., the daily bulletin and the hazard assessment. Finally, in Section 5, we give our conclusions and future perspectives.

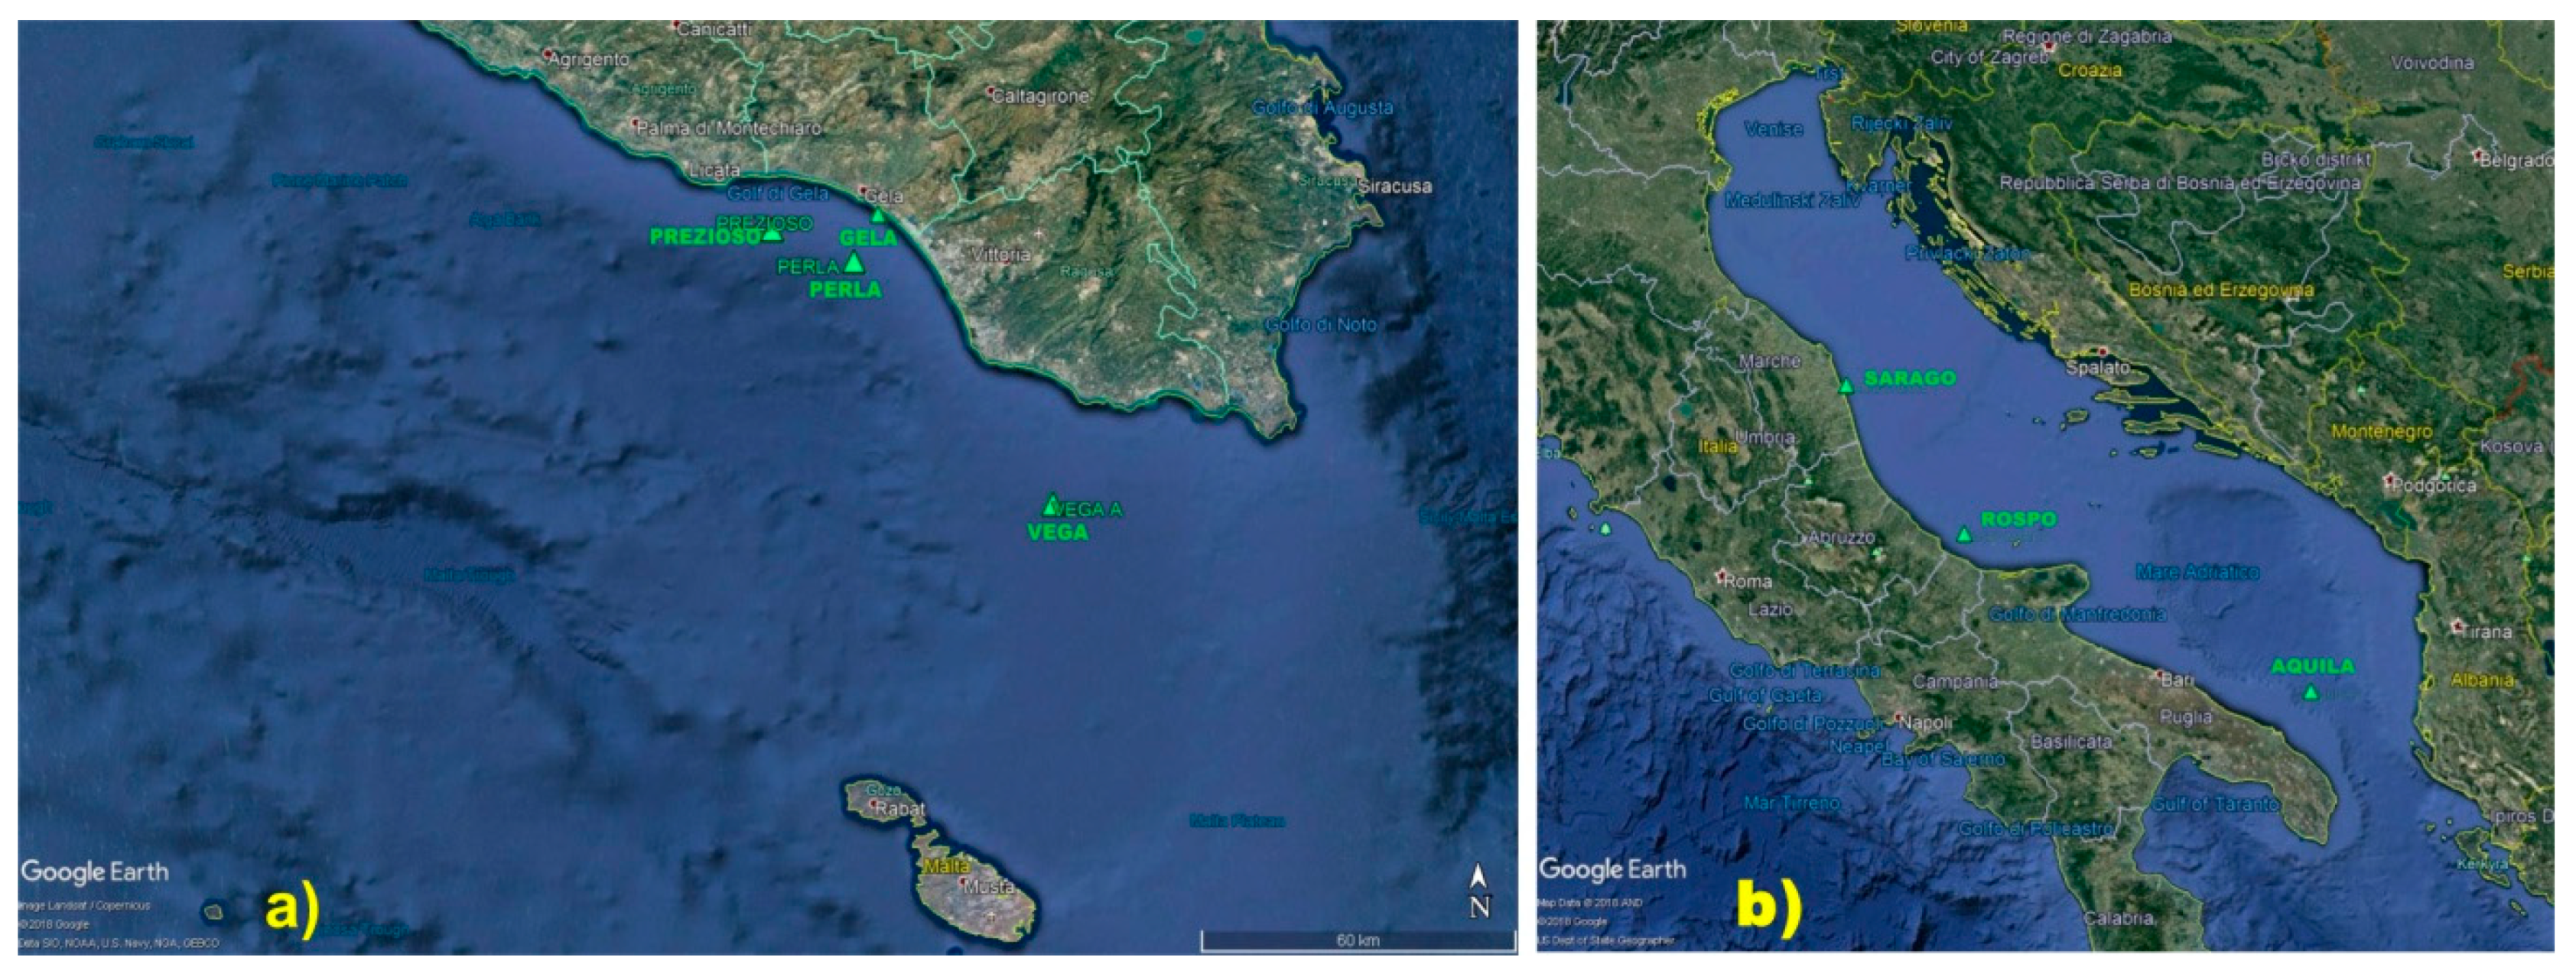
2. The Oil Fields in the Italian Seas

The oil spill model predicts the fate, i.e., transport and weathering processes, of possible slicks from seven different areas of oil extraction in the Italian seas (see Table 1).
In these areas we have a variety of extraction facilities, from a single to multiple wells, collecting at a single platform, to wider extraction fields populated by nearby but separated platforms. Once extracted, the oil is stored on FPSO or FSO (floating production storage and offloading) units or moved to the land by underwater pipelines when the platform is near the mainland.
This variety in configurations, described in Table 1, is taken into account in setting up the forecasting system. Therefore, multiple well configurations are simplified by considering a single well with a geographically averaged position, as the distance between platforms in multi-platform fields is comparable with the resolution of the coastal model’s grid.

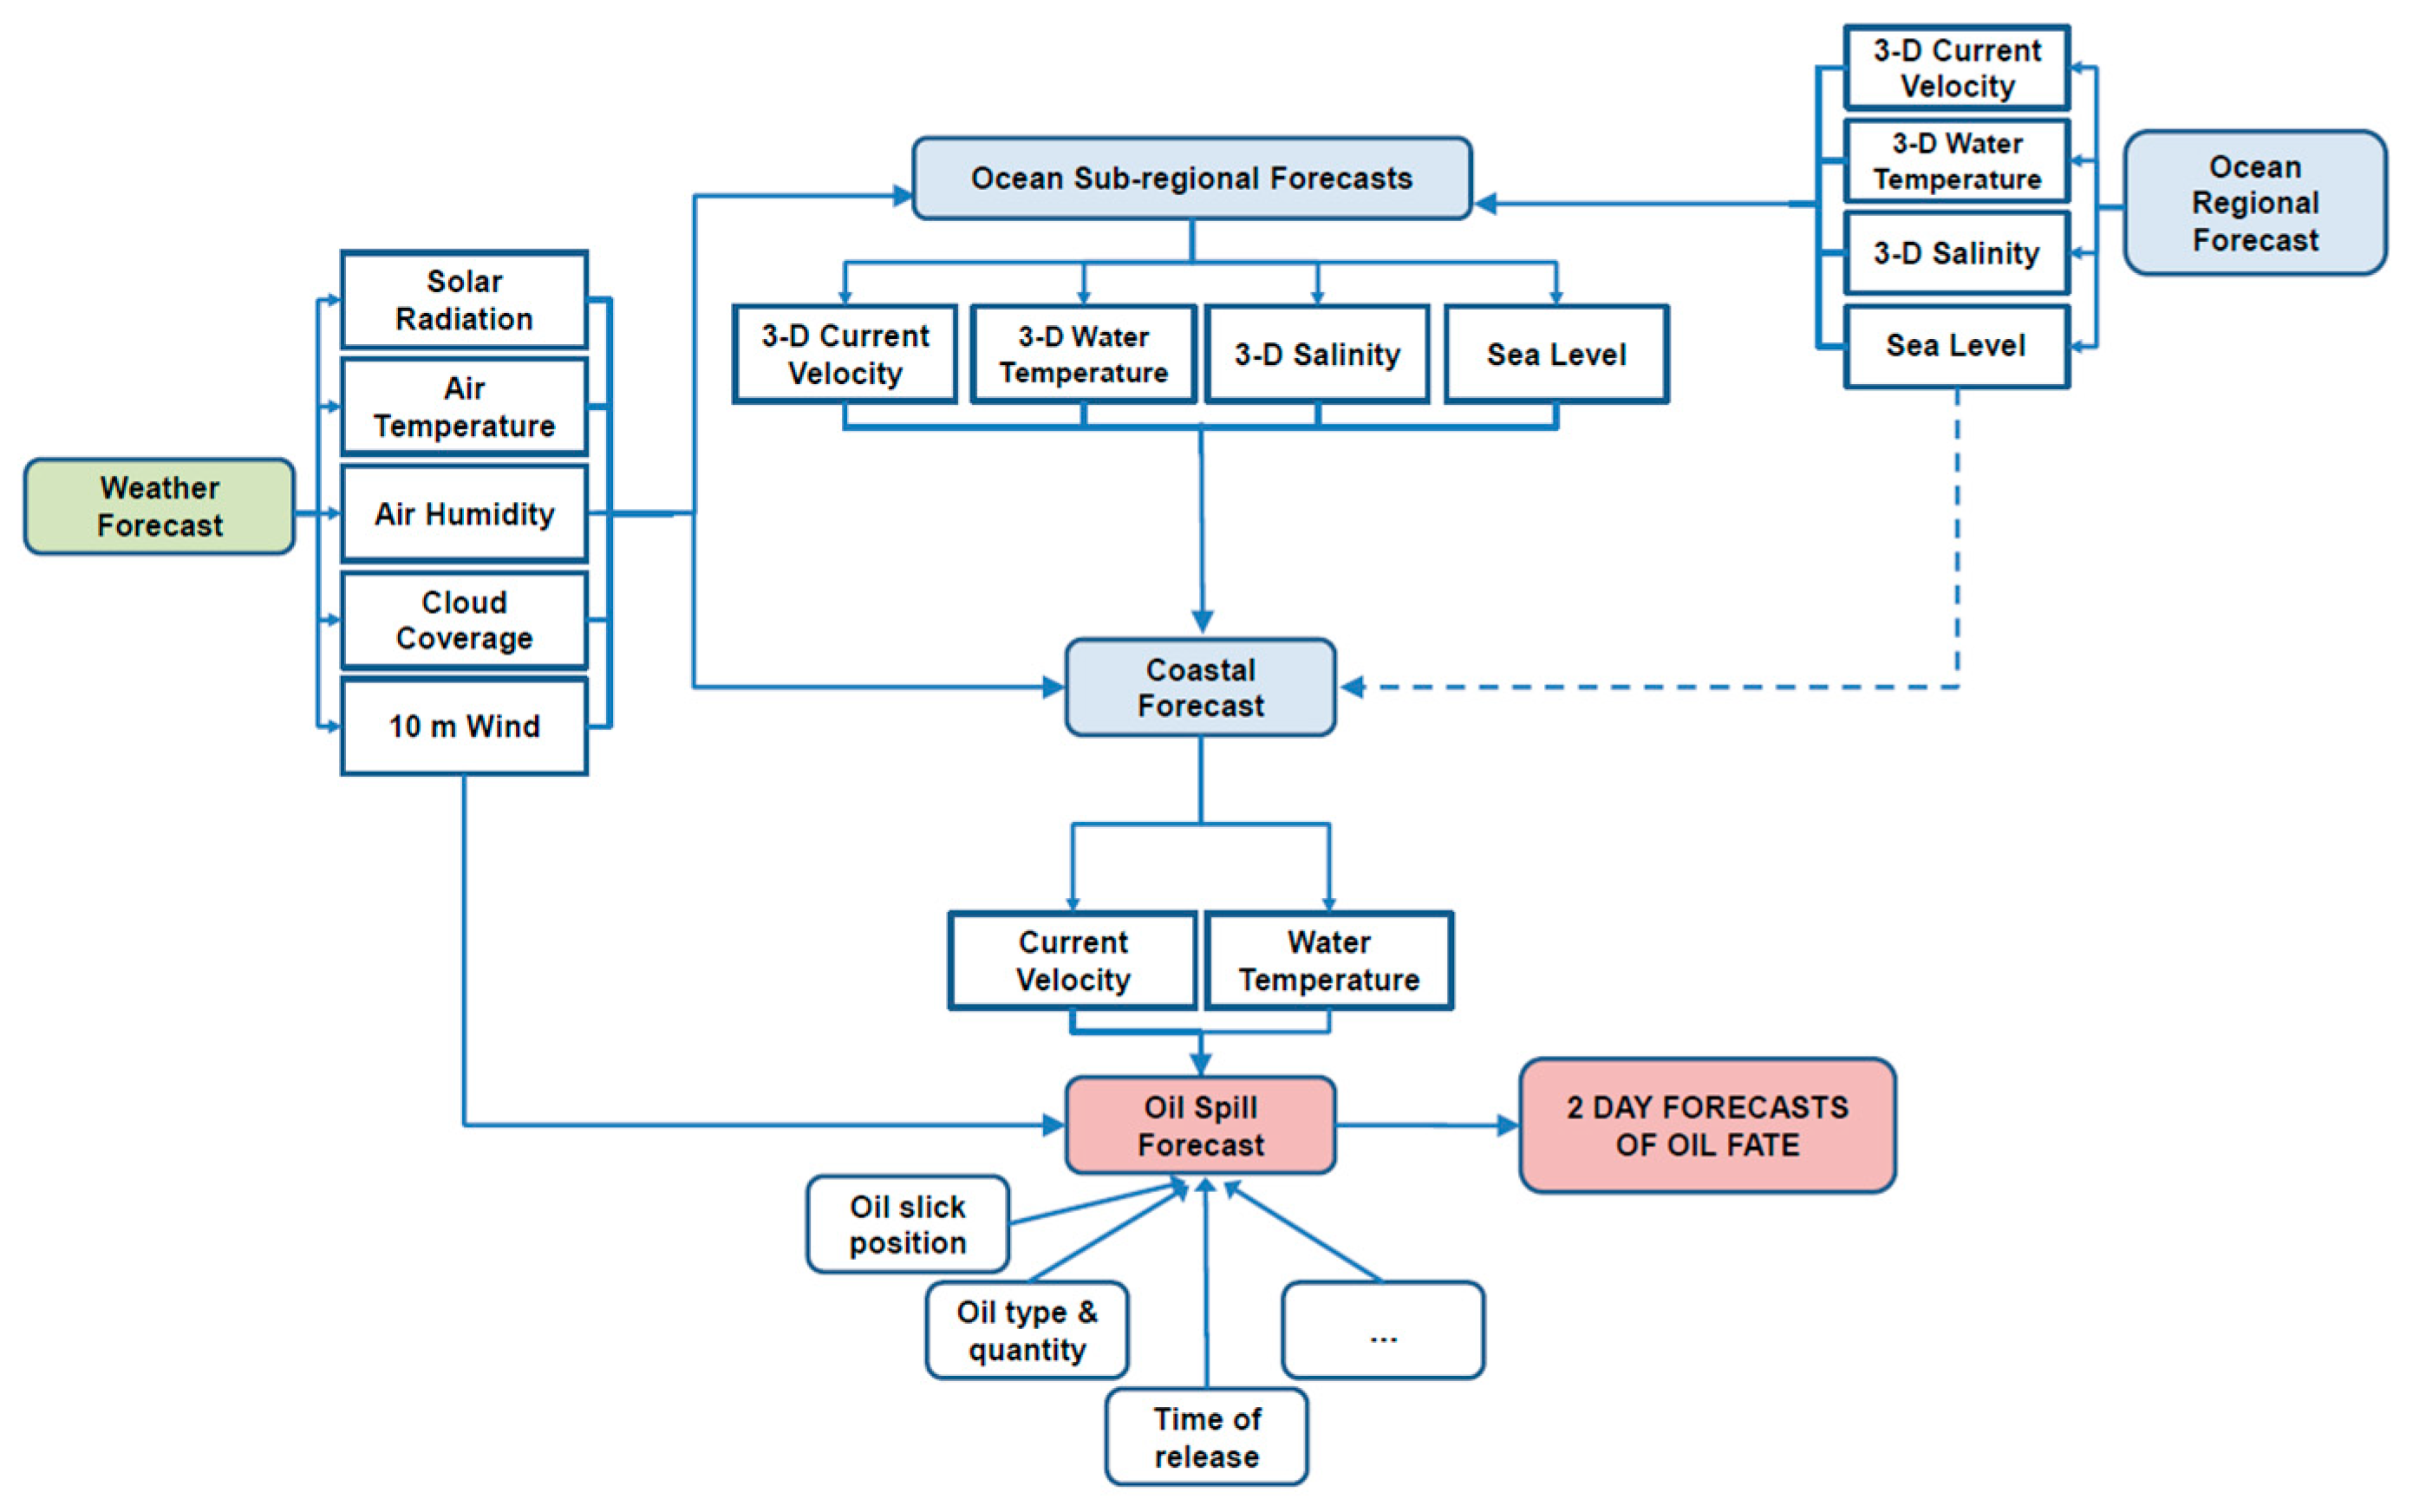
3. The Numerical System

The numerical system developed for the project “SOS-Piattaforme e Impatti Offshore” is based on what was experienced in past projects like Development of TEcnologies for Situational Sea Awareness (TESSA) [19,20], Mediterranean Decision Support System per la Marine Safety (MEDESS-4MS) [8] and SOS-Bonifacio [1,2,15]. It is composed by nested hydrodynamic numerical models at different spatial scales, from the regional to the coastal, through a methodology known as downscaling [21,22,23]. Daily forecasts from regional scale models are used by sub-regional numerical systems as initial, lateral boundary, and surface boundary conditions for the air–sea interface [24,25]. This repeats from the sub-regional to coastal models then increasing the resolution of the forecasts to a limited area [2,26]. The whole forecast system is presented in Figure 2 and is described in the following paragraphs.

3.1. The Oil Slick Model

In our system, the transport and weathering processes of an oil slick at sea are modelled using MEDSLIK-II, widely described in References [12,13]. This is a community model available for free at Reference [27]. MEDSLIK-II is a Lagrangian model that requires meteorological and marine conditions at the air–sea interface, as well as chemical and physical characteristics of the spilled oil to perform a simulation. It simulates the transport of an oil slick with its dispersion due to turbulent fluctuation components, parameterized with a random walk scheme. The transport of the slick in the marine environment is attributed to the advection field, while turbulent fluxes cause its dispersion. The general equation of the model takes into account the variation of the oil concentration in time and space, considering the weathering processes affecting the slick [7,20]. MEDSLIK-II is coupled with the ocean models using hourly oceanographic outputs of current speed and temperature and with the weather model for wind speed, all described in the following paragraphs.
We considered just the early stage weathering processes of evaporation, emulsification, dispersion in the water column, and adhesion to the coast. These processes take their effect in the fate of a typical crude oil for about a week (described in Reference [28]), the usual length of the most oil emergencies at sea. Every day, a simulation of the transport of a specific type (API 33.4) and quantity of oil (at a rate of 15 m3·h−1) were provided for each active oil platform or groups of Italian platforms.
The realized forecasting system is also used in delayed-mode to calculate statistics and builds hazard estimation maps related to each oil platform or group of platforms and support the eventual emergency containment strategies. In the case of an accident or planned exercise, numerical simulations of the scenario of dispersion and transformation of a real hydrocarbon slick are realized for the following 48 h from the simulation start. In order to perform the numerical simulation, several further inputs were requested like type of oil, areal position and time when the spill started, estimation of the amount of oil spilled, instantaneous or prolonged spill in time, and requested simulation duration.

3.2. The Hydrodynamic Models

The modelization of oil spill trajectories requires operational ocean models. Then, due to the different morphological and oceanographic characteristics of the two basins, different numerical approaches were applied.

3.2.1. The Sicily Channel

In order to describe the circulation in the Sicily Channel, including the processes at the basin scale that influence circulation from mesoscale to coastal [29], we used a sub-regional model called Tyrrhenian-Sicily Channel Sub-Regional Model (TSCRM). It is a free surface three-dimensional primitive equation. It is based on the Princeton ocean model [30] and was implemented between 9–16.50° E and 31.50–43° N with a horizontal resolution of about 2 km (1/48° of degree in latitude) on 30 sigma levels [10]. The initial and lateral conditions were obtained from a one-way asynchronous nesting of the forecasted hourly fields of temperature, salinity, and total velocity [25] from the regional Mediterranean Forecasting System (MFS) provided by the Copernicus Marine Service [31].
Solely for the very shallow Gela platform in the Gulf of Gela, the TSCRM was downscaled to very high resolution using the 3-D hydrodynamic Shallow water HYdrodynamic Finite Element Model (SHYFEM). SHYFEM resolves the system of the primitive equations, vertically integrated over each vertical layer, with Boussinesq approximation used horizontally and hydrostatics used vertically. For vertical diffusivity and viscosity, it used the general ocean turbulence model [32]. It was integrated with a module for the simulation of the transport processes and had a spatial resolution varying from 25 m in very coastal areas or shallow waters to few kilometers off-shore [2,33].
At the surface, both ocean models were forced by using the hourly atmospheric data from the weather limited area model SKIRON. Every day, they produce 3-D 5-day forecasts with an hourly resolution of the main oceanographic parameters as shown in Figure 2.
SKIRON is a numerical weather prediction model developed at the University of Athens [34]. It provides 5-day forecasts of atmospheric parameters at a high frequency (hourly fields) with a horizontal resolution of 10 km. The core of the system is based on the ETA/NCEP model that has been developed at the National Centre for Environmental Prediction of the National Oceanic and Atmospheric Administration (NCEP/NOAA). Initial and boundary conditions are taken from the coarse Global Forecast System model NCEP/GFS. The atmospheric parameters included hourly fields of: mean sea level pressure, air temperature at 2 m, wind speed, and direction at 10 m above sea level (s.l.), convective and accumulated precipitation, cloud cover, sensible and latent heat fluxes, incoming and outgoing shortwave and long-wave radiation fields, and evaporation. These parameters were used in both circulation models to force momentum, turbulent heat, and water fluxes calculated using appropriate bulk formulae [35].

3.2.2. The Adriatic Sea

In the Adriatic Sea, MFS’s outputs were used to nest the SHYFEM model to solve for the coastal scales. The numerical computation was performed on a spatial domain that represented the Adriatic basin by means of an unstructured grid. The use of elements of variable sizes was fully exploited to create a seamless transition between different spatial scales. The mesh resolution varied from 4 km in the open sea to 1 km in coastal waters, and up to 300 m around the oil platforms. The sea level and the current velocity boundary conditions at the Otranto Strait were obtained by summing the hourly tidal signal derived from the Finite Element Solution (FES2012) global tidal model [36] (available at Reference [37]), the daily water level, and the baroclinic velocity predicted using MFS. The total water levels were imposed to the boundary nodes, while the total current velocity were nudged using a relaxation time of 3600 s. Water temperature and salinity boundary conditions were computed using the oceanographic fields of MFS. Three-dimensional MFS fields of sea temperature and salinity were nudged during the simulation. Nudging data were given for all nodes of the grid. The value of the relaxation coefficient spatially varied over the model domain (as a function of the grid resolution) from 2 days in the open sea and increasing toward the coast, thus diminishing the restoration contribution.
For the river discharge, where available, daily updated values were derived from automatic hydrometric stations nearest to river mouths, through calibrated stage-discharge relationships (like Isonzo, Piave, Adige, Po, etc.). For the other rivers considered in this study, discharges were prescribed using mean climatological values [38]. Such model implementation resembled the one described in Reference [39].
The meteorological forcing was supplied by the hydrostatic Bologna limited area model (BOLAM), developed and implemented at CNR in Bologna with a daily operational chain [40,41]. The initial and boundary conditions for the BOLAM model were derived from the analyses (00 UTC) and forecasts of the GFS (NOAA/NCEP, Silver Spring, MD, USA) global model [42]. The BOLAM model is implemented over the Euro-Mediterranean region with a horizontal grid spacing of 8.3 km. Forecasts are daily provided at hourly resolution up to 3 days.
At the end of the whole chain, transport, diffusion, and transformation of an oil slick at sea were modelled by MEDSLIK-II.

4. Results

A daily bulletin and hazard estimations are valid and easy products of the system to provide updated information on potential risks at sea and coastal areas and optimize intervention in case of a spill from oil rigs. The quality of the above instruments has been assured through previous validations of the numerical system.

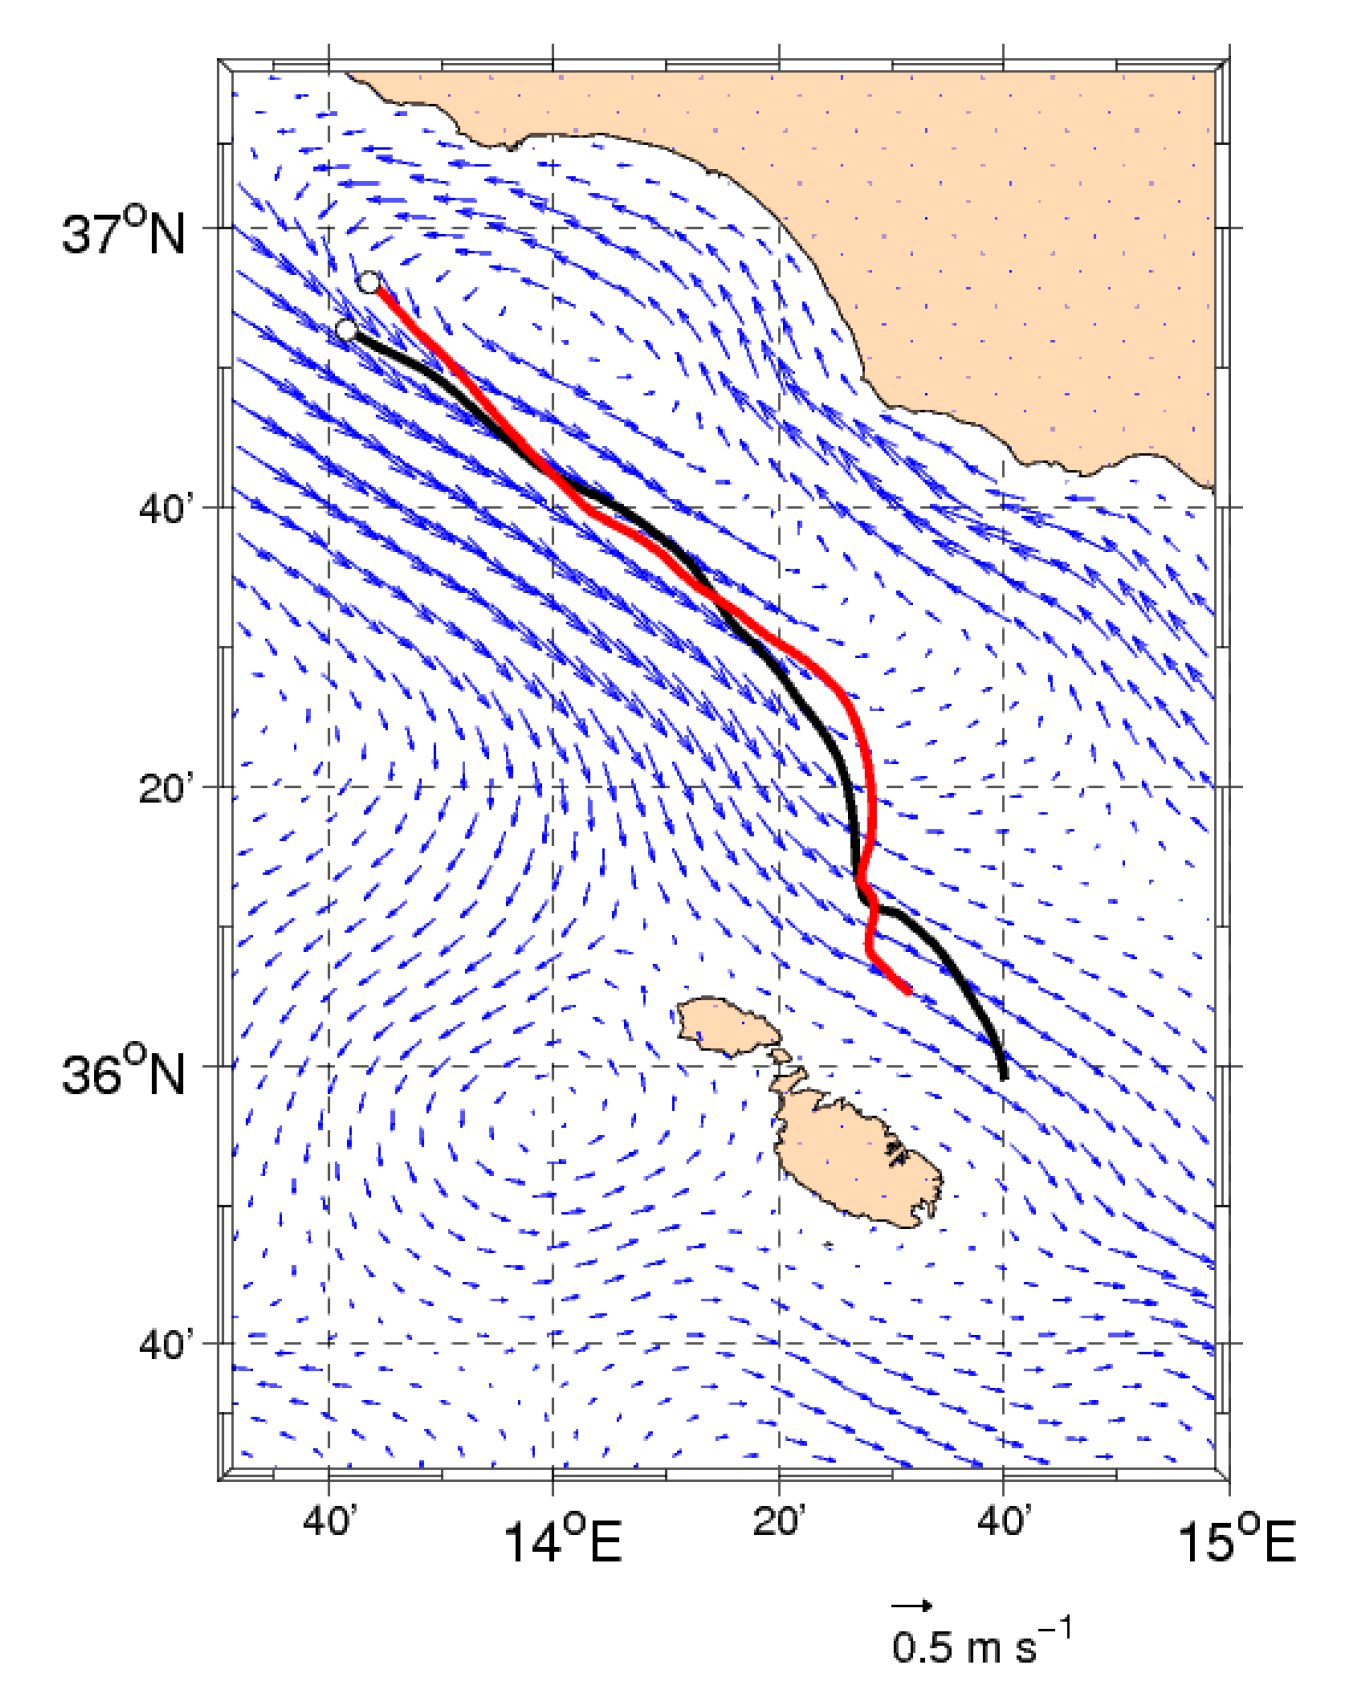
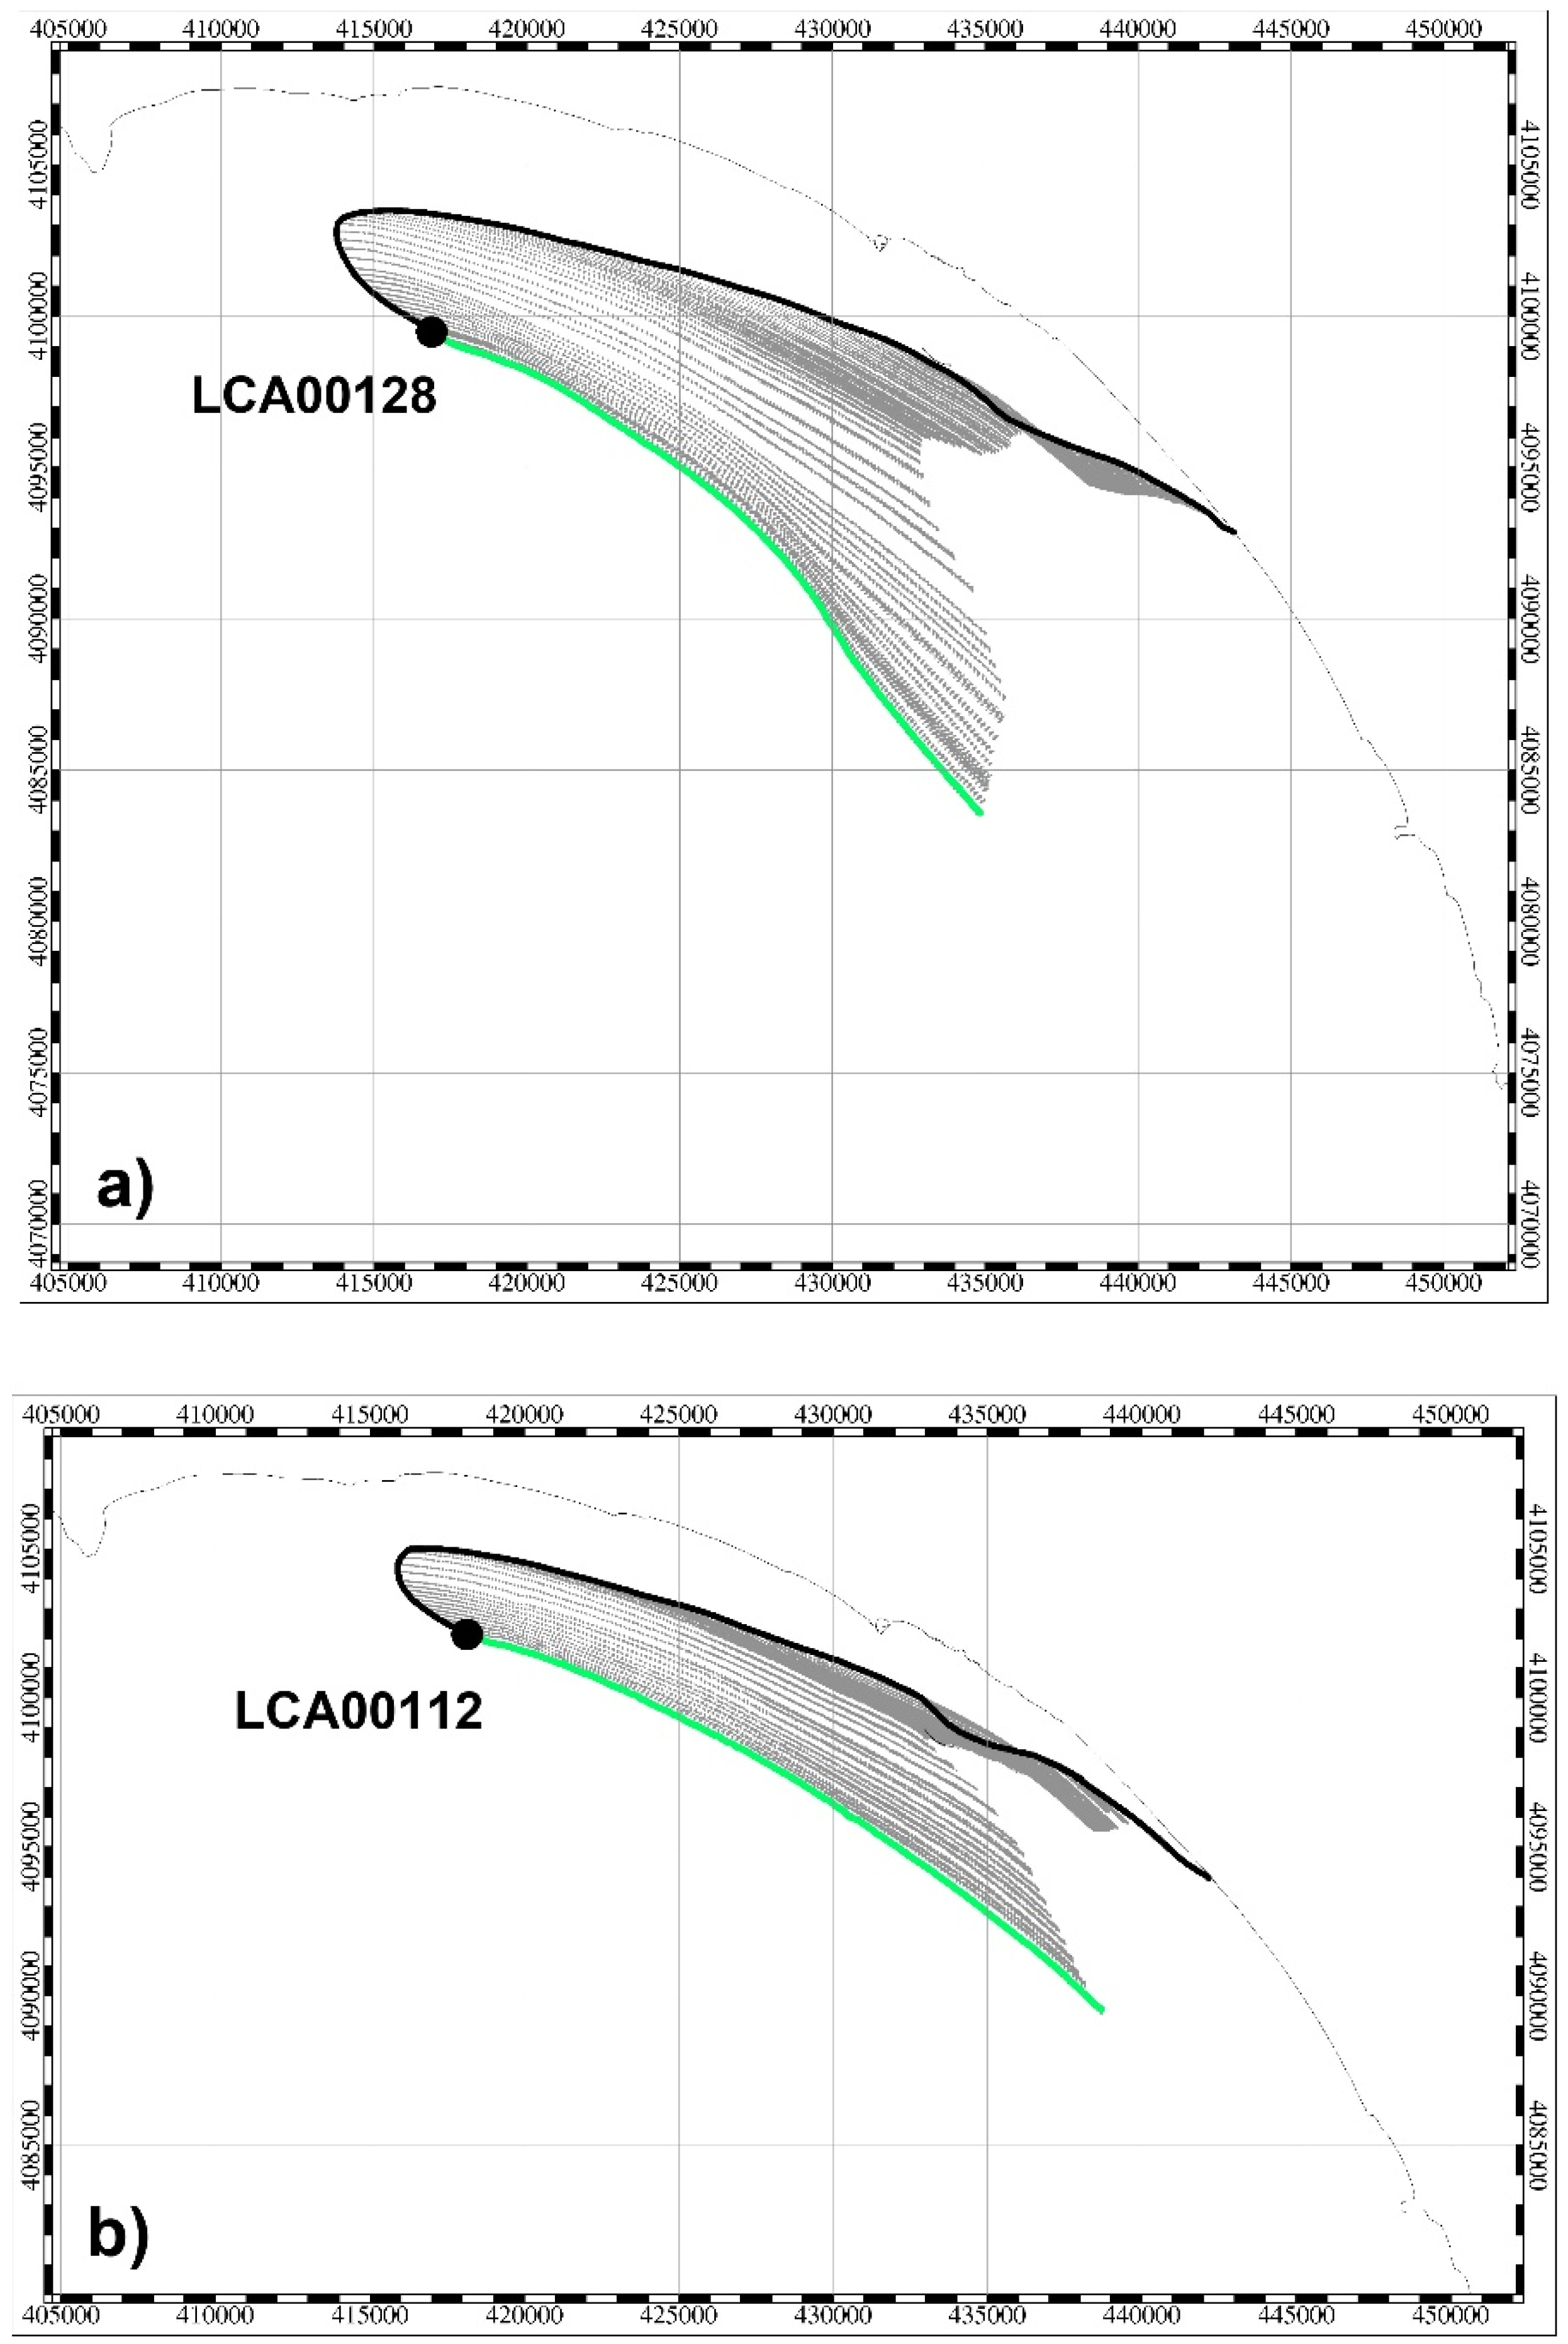
4.1. Numerical System Validation

The forecast current fields from the system for the Sicily Channel and the Adriatic Sea areas have been validated against trajectories of GPS-equipped surface drifters [43] with a small subsurface plastic drogue at a depth of 1 m. In order to obtain forecasts, a process of validation is fundamental to verify the reliability of the implemented integrated system (hydrodynamic data production and oil spill simulation). To carry out this process, several Lagrangian drifters were released in the areas of the platforms with their positions recorded at 10-min intervals for coastal drifters and at 1-h intervals for offshore satellite ones.
In order to evaluate the integrated system capability in reproducing drifters’ trajectories, we calculated the root mean square error (RMSE) of the separation distance between observed and simulated trajectories and the skill score [43]. This last parameter is dimensionless based on the cumulative Lagrangian separation distances normalized by the associated cumulative observed trajectory lengths. Its value can vary between 0 and 1, with 1 corresponding to a total overlap between the observed and simulated trajectories, while 0 corresponds to a difference between the path of the drifters and the simulated trajectories on the same path made by the drifters [10,13].
In Figure 3, the 72-h long trajectories of two drifters released in the Sicily Channel are shown. The surface drifters moved south-eastward, following the Atlantic Ionian Stream flow (AIS; [29,44]).
Their trajectories were numerically reproduced by re-initializing the TSCRM simulation every day with updated forecasting fields. Such daily re-initialization is necessary to avoid errors to excessively propagate in calculations that affect the final results. The idea of frequent re-initialization in trajectory simulation was proposed in Reference [43] and was actually used in the Deepwater Horizon oil spill trajectory forecast [45,46].
The simulated drifters’ trajectories produced low values of RMSE of less than 10 km (Figure 4a), and a skill score higher than 0.6 (Figure 4b), both in the first 10 h of simulation. Over this time, the RMSE increased exponentially and its average was about 25 km at 24 h. At the same time, the averaged skill score was 0.7. This decrease in efficiency was due to a difficulty in the reproduction of a correct surface current speed but directions were comparable. This deficiency was particularly true for drifters approaching the coast due to the low resolution of the model and/or to lower wind forcing. Stokes drift was demonstrated to be an important factor in bring the oil from the offshore areas to the beaches [47]. Furthermore, although the wave-induced transport was parameterized to simulate the effect of Stoke drift in all numerical experiments, the swell processes were not considered. This factor may be a source of uncertainty in the estimation of the drifters’ trajectories.
In the very shallow waters inside the Gulf of Gela, we implemented SHYFEM to solve such a limitation. For its validation, we used the data from two coastal drifters named LCA00128 and LCA00112, deployed on 29 October 2017, for about 30 h. The trajectories were reproduced by groups of particles released at each observed position along the drifters path. For both drifters there is a general correspondence between the simulated trajectories and the observed path (Figure 5).
The path of the simulated particles was both in terms of the distance traveled and the direction that was completely congruent with that followed by the two drifters. In the two experiments, an initial deviation of the path of the particles was observed with respect to the trajectory of the drifters during the first hours of simulation. Here they follow an northwestern (NW) direction, while the numerical particles are directed to the south-western (SW). For the remaining period of the simulation, the simulated and observed trajectories are quite similar.
Furthermore, in both experiments, for each trajectory the accuracy of the results obtained from a series of simulations was quantified. The dimensionless skill score and its average (AV3) obtained for the first 3 h of forecast were calculated at 1, 6, and 12 h of forecast. In Table 2, the skill score for the two drifters was generally low with values at 1 h varying between 0.7 and 0.5, at 6 h between 0.8 and 0.6, and finally at 12 h between 0.8 and 0.7. As far as AV3 was concerned, the most accurately simulated trajectory was the LCA00112 with an AV3 of 0.7.
The goodness of the results obtained in simulating the trajectory followed by the two drifters was largely due to the fact that the surface transport was mainly modulated by the wind action on the coastal area. The initial deviation between model results and observations was because the wind was initially of moderate intensity and therefore the transport was probably predominantly led by the large-scale circulation that was not well represented in these simulations.
For the Adriatic Sea, the model results were compared with the trajectories of a satellite global positioning system (GPS)-equipped drifter operating between 14 and 28 May 2018 (14 days, LCE00234-1), and again between 13 and 18 June 2018 (5 days, LCE00234-2) in the central basin. Drifter LCE00234-1 was equipped with a 50 cm long plastic drogue placed at a 20 m depth, thus providing the integral information of the currents in the upper 20 m of the water column. Conversely, during the second drifter release, the plastic drogue was placed at a 1 m depth.
Numerical particles were released every hour along the observed drifters’ trajectories in the first 20 m of the water column and at the surface in the two experiments, respectively. The particle-tracking model correctly reproduced the trajectories of the drifters, which moved southward along the coast with a mean speed of 15 cm s−1 and 50 cm s−1 for drifters LCE00234-1 and LCE00234-2, respectively (Figure 6).
The RMSE and skill score after 24 h of simulation were 5 and 15 km, and 0.57 and 0.67 for the two trajectories, respectively, in the two experiments (Figure 7). The drifter LCE00234-2 was particularly good because it moved along the coast with a high transit velocity (up to 1.2 m s−1) induced by strong southerly winds.
In conclusion, all three models showed good performances that, after 24 h, showed a skill score higher than 0.6 for coastal models and lower for the sub-regional model.

4.2. The Products

4.2.1. The Daily Bulletin

The realized system provides two different operational online services, one automatic and a second in case of emergencies.
The aim of the automatic service is to give a daily forecast of the trajectories of possible oil slicks close to each platform, assuming that the same polluting event repeats daily. It is provided every day at 08:00 UTC through the issue of a web bulletin for each of the seven active oil fields in the Sicily Channel (four fields) and in the Adriatic Sea (three fields) listed in Table 1. Each bulletin contains the scenario of a simulation through 3-hourly maps with the possible distribution of the density in kg m−2. The bulletin is valid for the following 48 h and downloadable from a website with restricted access. The type of oil is the API well number typical of the field, and the time length of the spill is 48 h. Information on transport and weathering processes of the slick are given during the entire simulation. It shows the percentage of oil on the coast along the water column, still on the surface, and evaporated through 3-hourly plots with fields of dispersion at sea and the stranding of the oil released from UTC+1 to UTC+48. The different daily sea conditions produce a mid/long-term numerical dataset to compute hazard and risk statistics.
The service for emergencies is active just in case of real (emergency) or hypothetical (exercise) dispersion in one or more of the seven active oil fields. A user-interface allows a dedicated operator to start any simulation in the areas of the rigs, inputting details about the spill such as coordinates, quantity, and the type of oil released, along with the date and hour of the spill. Also, a near-real-time bulletin is available in case of emergencies.

4.2.2. Hazard Assessment

The hazard estimation is part of the information provided by the system. The hazard assessment is an essential requisite for an attempt and accurate plan for intervention in case of emergencies. It provides probability estimations of the areas that are potentially mostly affected by eventual oil slicks due to spills occurring at the extraction platforms. For the calculation and implementation of hazard maps for each oil platform, we used the forecasting system described above.
The methodology adopted to assess hazard, and further to use hazard as basic informative layer to assess the coastal risk, will be described in a separate work currently in preparation. This system is based on long-term (1 year) statistics performed on forecast outputs. Such hazard maps depict the statistics of the beaching of a hydrocarbon slick after 48 h. The maps represent the statistical distribution of the release for the whole area that is potentially contaminated by hydrocarbons, both at sea and on the land if affected by simulated spills.
Two different geo-statistical descriptive quantities of this probability have been considered:
(a) hazard index or HI, calculated like oil concentration for a defined surface unit normalized at its maximum recorded concentration (at 99th percentile of the distribution of the calculated concentration frequency). It is dimensionless and defined between 0 and 1;
(b) occurrence probability index or PI, indicating the percentage of probability that a given cell is contaminated by an oil spill. Its highest values are recorded on the point of release. It is defined to be between 0 and 100.
The risk assessment can be performed by combining such indices with indicators of vulnerability of the coastal areas like i.e., protection level, shore types, submerged vegetation, beach use, granulometry, etc.
Hazard estimation, for both indexes, was done climatologically on 1-year long outputs and is shown in Figure 8. It will be also done on a seasonal basis with three seasons on the basis of the local circulation and hydrographical characteristics and defined for January–April (mixed conditions), May–August (stratified conditions), and September–December (mixing conditions).

5. Summary and Conclusions

In 2017, an oil spill forecasting system for the Italian seas was realized in case of oil spill emergencies on seven active oil extraction areas.
Through a numerical chain composed by nested ocean models, weather models, and Lagrangian models, the system was able to obtain a forecast of the fate of an oil spill for the following 48 h. The integrated system has undergone a positive validation process that has involved the use of drifters’ paths collected in the Sicily Channel and in the middle/low Adriatic Sea. It can be used both in operational automatic mode or in case of emergency.
In operational automatic mode, a daily bulletin is provided simulating a virtual oil spill from each of the seven oil platforms using forecasted sea conditions, and then provided a 48 h-scenario of a common quantity of oil at the sea surface. Furthermore, we innovatively adopted an advanced approach combining deterministic calculus with long-term and continuously updating statistics on the trajectories in a database and obtained two hazard indexes, called the hazard and the occurrence probability indexes. They were periodically revised for the areas surrounding platforms on the basis of the continuous updates of the database shaped by the forecast system outputs. These hazard indexes were combined with sensitivity layers to assess risk of the coast and intertidal zone.
In case of emergency, the system produces 48-h forecasts in near-real-time regarding the fate of an oil slick from each of the seven platforms. Currently, a web interface is available to allow an operator to initialize an oil spill scenario.

Author Contributions

All authors contributed to the building of this paper in its different aspects. Conceptualization: A.R. and R.S.; Methodology: A.R., L.F., C.F., G.O., C.T., and R.S.; Software: A.P.; Validation: A.C., C.F., R.S., and C.T.; Formal Analysis: C.F., A.O., G.Q., S.S., and C.T.; Data Acquisition and analysis: A.R., F.A., and A.S.; Writing—Original Draft Preparation: A.R., A.C., M.F.F., L.F., C.F., A.O., G.Q., S.S., C.T., G.U., and R.S.; Writing—Review and Editing: A.R., A.O., and S.R.

Funding

The work is supported by the project SOS Piattaforme e Impatti Offshore (Servizio Di Previsione Numerica Della Dispersione Di Idrocarburi Dalle Piattaforme Petrolifere Del Canale Di Sicilia E Medio/Basso Adriatico), funded by the Italian Ministry of the Environment and Protection of Land and Sea with Executive Agreement prot. m_amte.PNM.REGISTRO UFFICIALE.U.000939.17-01-2017 of 17.01.2017.

Acknowledgments

We thank the colleagues Monica Pinna and Filippo Angotzi for their essential administrative support in Oristano for the management of the project.

Conflicts of Interest

The authors declare no conflict of interest.

References

  1. Cucco, A.; Ribotti, A.; Olita, A.; Fazioli, L.; Sorgente, B.; Sinerchia, M.; Satta, A.; Perilli, A.; Borghini, M.; Schroeder, K.; et al. Support to oil spill emergencies in the Bonifacio Strait, western Mediterranean. Ocean Sci. 2012, 8, 443–454. [Google Scholar] [CrossRef] [Green Version]
  2. Cucco, A.; Sinerchia, M.; Ribotti, A.; Olita, A.; Fazioli, L.; Sorgente, B.; Perilli, A.; Borghini, M.; Schroeder, K.; Sorgente, R. A high resolution real time forecasting system for predicting the fate of oil spills in the Strait of Bonifacio (western Mediterranean). Mar. Pollut. Bull. 2012, 64, 1186–1200. [Google Scholar] [CrossRef]
  3. Olita, A.; Cucco, A.; Simeone, S.; Ribotti, A.; Fazioli, L.; Sorgente, B.; Sorgente, R. Oil spill hazard and risk assessment for the shorelines of a Mediterranean coastal archipelago. Ocean Coast. Manag. 2012, 57, 44–52. [Google Scholar] [CrossRef]
  4. Jones, C.E.; Dagestad, K.-F.; Breivik, Ø.; Holt, B.; Röhrs, J.; Christensen, K.H.; Espeseth, M.; Brekke, C.; Skrunes, S. Measurement and modeling of oil slick transport. J. Geophys. Res. Ocean 2016, 121, 7759–7775. [Google Scholar] [CrossRef]
  5. Alves Tiago, M.; Kokinou, E.; Zodiatis, G.; Lardner, R.; Panagiotakis, C.; Radhakrishnan, H. Modelling of oil spills in confined maritime basins: The case for early response in the Eastern Mediterranean Sea. Environ. Pollut. 2015, 206, 390–399. [Google Scholar] [CrossRef]
  6. Azevedo, A.; Fortunato, A.B.; Epifânio, B.; den Boer, S.; Oliveira, E.R.; Alves, F.L.; de Jesus, G.; Gomes, J.L.; Oliveira, A. An oil risk management system based on high-resolution hazard and vulnerability calculations. Ocean Coast Manag. 2017, 136, 1–18. [Google Scholar] [CrossRef]
  7. De Dominicis, M.; Bruciaferri, D.; Gerin, R.; Pinardi, N.; Poulain, P.M.; Garreau, P.; Zodiatis, G.; Perivoliotis, L.; Fazioli, L.; Sorgente, R.; et al. A multi-model assessment of the impact of currents, waves and wind in modelling surface drifters and oil spill. Top. Stud. Oceanogr. 2016, 133, 21–38. [Google Scholar] [CrossRef] [Green Version]
  8. Zodiatis, G.; De Dominicis, M.; Perivoliotis, L.; Radhakrishnan, H.; Georgoudis, E.; Sotillo, M.; Lardner, R.W.; Krokos, G.; Bruciaferri, D.; Clementi, E.; et al. The Mediterranean Decision Support System for Marine Safety dedicated to oil slicks predictions. Deep Sea Res. 2016, 133, 4–20. [Google Scholar] [CrossRef] [Green Version]
  9. Coppini, G.; De Dominicis, M.; Zodiatis, G.; Lardner, R.; Pinardi, N.; Santoleri, R.; Colella, S.; Bignami, F.; Hayes, D.R.; Soloviev, D.; et al. Hindcast of Oil Spill Pollution during the Lebanon Crisis, July–August 2006. Mar. Pollut. Bull. 2011, 62, 140–153. [Google Scholar] [CrossRef]
  10. Sorgente, R.; Tedesco, C.; Pessini, F.; De Dominicis, M.; Gerin, R.; Olita, A.; Fazioli, L.; Di Maio, A.; Ribotti, A. Forecast of drifter trajectories using a Rapid Environmental Assessment based on CTD observations. Top. Stud. Oceanogr. 2016, 133, 39–53. [Google Scholar] [CrossRef]
  11. De Dominicis, M.; Leuzzi, G.; Monti, P.; Pinardi, N.; Poulain, P.-M. Eddy diffusivity derived from drifter data for dispersion model applications. Ocean Dyn. 2012, 62, 1381–1398. [Google Scholar] [CrossRef] [Green Version]
  12. De Dominicis, M.; Pinardi, N.; Zodiatis, G.; Lardner, R. MEDSLIK-II, a Lagrangian marine surface oil spill model for short-term forecasting. Part 1: Theory. Geosci. Model Dev. 2013, 6, 1851–1869. [Google Scholar] [CrossRef]
  13. De Dominicis, M.; Pinardi, N.; Zodiatis, G.; Archetti, R. MEDSLIK-II, a Lagrangian marine surface oil spill model for short-term forecasting. Part 2: Numerical Simulations and Validations. Geosci. Model Dev. 2013, 6, 1871–1888. [Google Scholar] [CrossRef]
  14. Liubartseva, S.; De Dominicis, M.; Oddo, P.; Coppini, G.; Pinardi, N.; Greggio, N. Oil spill hazard from dispersal of oil along shipping lanes in the Southern Adriatic and Northern Ionian Seas. Mar. Pollut. Bull. 2015, 90, 259–272. [Google Scholar] [CrossRef]
  15. Ribotti, A.; Cucco, A.; Olita, A.; Sinerchia, M.; Fazioli, L.; Satta, A.; Borghini, M.; Schroeder, K.; Perilli, A.; Sorgente, B.; et al. An integrated operational system for the Coast Guard management of oil spill emergencies in the Strait of Bonifacio. In Proceedings of the Sixth International Conference on EuroGOOS, 4–6 October 2011. [Google Scholar]
  16. Zodiatis, G.; Kirkos, G. Projects on Oil Spill Response in the Mediterranean Sea. In Oil Pollution in the Mediterranean Sea: Part I—The International Context. Handb. Environ. Chem. 2017, 30. [Google Scholar] [CrossRef]
  17. United Nations Office for Disaster Risk Reduction (UNISDR). The Sendai Framework for Disaster Risk Reduction 2015–2030 Paper. Available online: http://www.unisdr.org/we/inform/publications/43291 (accessed on 30 November 2018).
  18. Italian Ministry of Economic Development. Offshore Exploitation Platforms List in the Italian Seas. Available online: http://unmig.sviluppoeconomico.gov.it/unmig/strutturemarine/elenco.asp (accessed on 30 November 2018).
  19. Coppini, G.; Marra, P.; Lecci, R.; Pinardi, N.; Cretì, S.; Scalas, M.; Tedesco, L.; D’Anca, A.; Fazioli, L.; Olita, A.; et al. SeaConditions: A web and mobile service for safer professional and recreational activities in the Mediterranean Sea. Nat. Hazards Earth Syst. Sci. 2017, 17, 533–547. [Google Scholar] [CrossRef]
  20. De Dominicis, M.; Falchetti, S.; Trotta, F.; Pinardi, N.; Giacomelli, L.; Napolitano, E.; Fazioli, L.; Sorgente, R.; Haley, P.F.J., Jr.; Lermusiaux, P.; et al. A relocatable ocean model in support of environmental emergencies—The Costa Concordia emergency case. Ocean Dyn. 2014, 64, 667–688. [Google Scholar] [CrossRef]
  21. Oddo, P.; Pinardi, N. Lateral Open Boundary Conditions for Nested Limited Area Models: Process selective approach. Ocean Model. 2008, 20, 134–156. [Google Scholar] [CrossRef]
  22. Sorgente, S.; Drago, A.F.; Ribotti, A. Seasonal variability in the Central Mediterranean Sea Circulation. Ann. Geophys. 2003, 20, 299–322. [Google Scholar] [CrossRef]
  23. Napolitano, E.; Iacono, R.; Sorgente, R.; Fazioli, L.; Olita, A.; Cucco, A.; Oddo, P.; Guarnieri, A. The regional forecasting systems of the Italian seas. J. Oper. Oceanogr. 2016, 9, s66–s76. [Google Scholar] [CrossRef]
  24. Gabersek, S.; Sorgente, R.; Natale, S.; Ribotti, A.; Olita, A.; Astraldi, M.; Borghini, M. The Sicily Channel Regional Model forecasting system: Initial boundary conditions sensitivity and case study evaluation. Ocean Sci. 2007, 3, 31–41. [Google Scholar] [CrossRef]
  25. Fazioli, L.; Olita, A.; Cucco, A.; Tedesco, C.; Ribotti, A.; Sorgente, R. Impact of different initialisation methods on the quality of sea forecasts for the Sicily Channel. J. Oper. Oceanogr. 2016, 9 (Suppl. 1), s119–s130. [Google Scholar] [CrossRef]
  26. Drago, A.F.; Sorgente, S.; Ribotti, A. A high resolution hydrodynamical 3D model of the Malta shelf area. Ann. Geophys. 2003, 20, 323–344. [Google Scholar] [CrossRef]
  27. The MEDSLIK-II Oil Spill Model Community. Available online: http://medslikii.bo.ingv.it (accessed on 30 November 2018).
  28. The International Tanker Owners Pollution Federation Limited (ITOPF). Available online: http://www.itopf.com (accessed on 30 November 2018).
  29. Sorgente, R.; Olita, A.; Oddo, P.; Fazioli, L.; Ribotti, A. Numerical simulation and decomposition of kinetic energies in the central Mediterranean: Insight on mesoscale circulation and energy conversion. In Special Issue, ECOOP (European Coastal-shelf sea Operational Observing and forecasting system Project). Ocean Sci. 2011, 7, 503–519. [Google Scholar] [CrossRef]
  30. Blumberg, A.F.; Mellor, G.L. A description of a three-dimensional coastal ocean circulation model. In Three-Dimensional Coastal Ocean Models, 2nd ed.; Heaps, N., Ed.; American Geophysical Union: Washington, DC, USA, 1987; Volume 4, pp. 1–39. [Google Scholar]
  31. The Copernicus Marine Environment Monitoring Service. Available online: http://marine.copernicus.eu (accessed on 30 November 2018).
  32. Burchard, H.; Petersen, O. Models of turbulence in the marine environment—A comparative study of two equation turbulence models. J. Mar. Syst. 1999, 21, 29–53. [Google Scholar] [CrossRef]
  33. Umgiesser, G.; Ferrarin, C.; Cucco, A.; De Pascalis, F.; Bellafiore, D.; Ghezzo, M.; Bajo, M. Comparative hydrodynamics of 10 Mediterranean lagoons by means of numerical modeling. J. Geophys. Res. Ocean 2014, 119, 2212–2226. [Google Scholar] [CrossRef] [Green Version]
  34. Kallos, G. The regional weather forecasting system SKIRON: An overview. In Proceedings of the Symposium on Regional Weather Prediction on Parallel Computer Environments, Athens, Greece, 15–17 October 1997; pp. 109–122. [Google Scholar]
  35. Fairall, C.W.; Bradley, E.F.; Rogers, D.P.; Edson, J.B.; Young, G.S. Bulk parameterization of air-sea fluxes for Tropical Ocean-Global Atmosphere Coupled-Ocean Atmosphere Response Experiment. J. Geophys. Res. 1996, 101, 3747–3764. [Google Scholar] [CrossRef] [Green Version]
  36. Carrere, L.; Lyard, F.; Cancet, M.; Guillot, A.; Roblou, L. FES2012: A new global tidal model taking advantage of nearly 20 years of altimetry. In Proceedings of the 20 Years of Progress in Radar Altimetry Symposium, Venice, Italy, 24–29 September 2013. [Google Scholar]
  37. The Satellite Altimetry Database of the AVISO+ Mission. Available online: http://www.aviso.altimetry.fr (accessed on 30 November 2018).
  38. Ludwig, W.; Dumont, E.; Maybeck, M.; Heussner, S. River discharges of water and nutrients to the Mediterranean and Black Sea: Major drivers for ecosystem changes during past and future decades? Prog. Oceanogr. 2009, 80, 199–217. [Google Scholar] [CrossRef]
  39. Ferrarin, C.; Davolio, S.; Bellafiore, D.; Ghezzo, M.; Maicu, F.; Mc Kiver, W.; Drofa, O.; Umgiesser, G.; Bajo, M.; De Pascalis, F.; et al. Cross-scale operational oceanography in the Adriatic Sea. J. Oper. Oceanogr. 2018. submitted for publication. [Google Scholar]
  40. Orlandi, E.; Fierli, F.; Davolio, S.; Buzzi, A.; Drofa, O. A nudging scheme to assimilate satellite brightness temperature in a meteorological model: Impact on representation of African mesoscale convective systems. Q. J. R. Meteorol. Soc. 2010, 136, 462–474. [Google Scholar] [CrossRef]
  41. Italian Research Council—Institute of Atmospheric Sciences and Climate (CNR-ISAC). Daily Numerical Weather Forecasts. Available online: http://www.isac.cnr.it/dinamica/projects/forecasts (accessed on 30 November 2018).
  42. NOAA/National Weather Service, National Centers for Environmental Prediction, Environmental Modeling Center. Available online: http://www.emc.ncep.noaa.gov/GFS (accessed on 30 November 2018).
  43. Liu, Y.; Weisberg, R. Evaluation of trajectory modeling in different dynamic region using normalized cumulative Lagrangian separation. J. Geophys. Res. Ocean 2011, 116, C09013. [Google Scholar] [CrossRef]
  44. Lermusiaux, P.F.J.; Robinson, A.R. Features of dominant mesoscale variability, circulation patterns and dynamics in the Strait of Sicily. Deep Sea Res. 2001, 48, 1953–1997. [Google Scholar] [CrossRef]
  45. Liu, Y.; Weisberg, R.H.; Hu, C.; Zheng, L. Tracking the Deepwater Horizon oil spill: A modeling perspective. Eos Trans. 2011, 92, 45–46. [Google Scholar] [CrossRef]
  46. Liu, Y.; Weisberg, R.H.; Hu, C.; Zheng, L. Trajectory forecast as a rapid response to the Deepwater Horizon oil spill, in Monitoring and Modeling the Deepwater Horizon Oil Spill: A Record-Breaking Enterprise. Geophys. Monogr. Ser. 2011, 195, 153–165. [Google Scholar] [CrossRef]
  47. Weisberg, R.H.; Zheng, L.; Liu, Y. On the movement of Deepwater Horizon Oil to northern Gulf beaches. Ocean Modell. 2017, 111, 81–97. [Google Scholar] [CrossRef]
Figure 1. Spatial distribution of the four active oil platforms (green triangles) in the Sicily Channel (a), and the three in the medium–low Adriatic Sea (b).
Jmse 07 00001 g001
Figure 2. The numerical forecasting chain for coastal circulation and oil dispersion at sea.
Jmse 07 00001 g002
Figure 3. The 72-h long trajectories of two drifters, the red and the black lines starting from the white circle at north to the south, overlapped to the TSCRM current field averaged for the day of the release (29 October 2017). Blue arrows indicate the surface current.
Jmse 07 00001 g003
Figure 4. (A) The blue lines are the RMSE of separation distances computed from the comparison between TSCRM and both drifters trajectories released on 29 October 2017. The red line is the averaged RMSE. (B) The blue lines are the skill score; the red line is the averaged trend.
Jmse 07 00001 g004
Figure 5. Trajectories simulated by the model for each release made on each position of the drifters LCA00128 (a) and LCA00112 (b) paths. In black is the trajectory of each drifter, and in green the path of the particles at their first release. In gray is the groups of particles released at each hourly position.
Jmse 07 00001 g005
Figure 6. Observed (black thick line) and mean simulated (yellow lines) trajectories for the drifters LCE00234-1 with a drogue at 20 m (a), and LCE00234-2 with a drogue at 1 m (b), below the sea surface. The green thick line represents the mean trajectory of the particles released at the beginning of simulations. The circles mark the oil platforms.
Jmse 07 00001 g006
Figure 7. RMSE of separation distance (top) and skill score (bottom) for the LCE00234-1 drifter with a drogue at 20 m and LCE00234-2 with a drogue at 1 m below the sea surface.
Jmse 07 00001 g007
Figure 8. The climatological annual calculation of (a) the hazard index (dimensionless) and (b) the occurrence probability index (percentage) related to the Perla platform.
Jmse 07 00001 g008
Table 1. The oil fields in the Italian seas covered by the forecasting system (data from the Italian Ministry for the Economic Development—MISE [18], updated on 31 December 2016).
AreaOil FieldPlatformsStoring FacilityWellsDistance from Land (Km)Depth (m)
Sicily ChannelPrezioso1Pipeline91245
Perla1Pipeline41370
Gela 11Pipeline11210
Vega A1FSO2020124
Central AdriaticSarago2Pipeline1 + 53–412
Rospo3FSO9 + 10 + 1219–2180
Southern AdriaticAquila2FPSO1 + 140–45820
Table 2. Skill score of the results of the numerical simulations performed in the two calibration tests (Test 1 and Test 2) calculated at the forecast intervals of 1, 6, and 12 h from the release and AV3 for each single trajectory (LCA00128 and LCA00112).
TEST 1
1 h6 h12 hAV3
LCA001280.60.60.70.6
LCA001120.70.80.80.7
TEST 2
LCA001280.40.50.70.4
LCA001120.40.70.70.5

